time to hedge? - constant contact
TRANSCRIPT

1
November 29, 2013
TIME TO HEDGE?
A hedge is an investment position intended to offset potential losses/gains that may be incurred by a companion investment. In
simple language, a hedge is used to reduce any substantial losses/gains suffered by an individual or an organization.
A hedge can be constructed from many types of financial instruments, including stocks, exchange-traded
funds, insurance, forward contracts, swaps, options, many types of over-the-counter and derivative products, and futures
contracts.
As human beings we hedge all of the time. Some hedges are not that expensive.
Even though I live in one of the sunniest cities in the world, I usually have a jacket ready, just in case.
When I go fishing, I take along my bottom fishing tackle just in case the surface fish do not bite.
When I go holiday shopping I keep the tags, just in case I have to take everything back.
Other hedges are quite expensive.
We can buy this insurance and that insurance for each and every move that we make on a trip. Our
luggage, trip cancelation, missing our flight, and our rental car-all can be hedged. Just click the
online button and it’s done, but it is not free.
When I buy a new laptop or piece of office equipment, I am always offered an extended warranty.
The scenario of the thing breaking on day 366 of a one year warranty always eats at me as I leave
the store. I am a hard sell. I rarely buy the extended plan.
I just know that somewhere someone is earning a commission off of me.
Some people always buy the warranty, while others almost never do.
I just hate buying a car. The inevitable hot lights will eventually come on before the keys are finally
handed over on your shiny new car.
Do you want to buy the lo-jack tracking device?
How about protection for that brand new paint?
Upholstery tears real easily, would you like insure it? Some folks are a hard-sell, while others are soft.

2
Engines almost always go out when the odometer hits 60,001. Then what are you going to do? Your
warranty is no good any more. I think that Ford puts a chip in there somewhere that guarantees it.
Tick, Tick, Tick………….
And of course life insurance is the ultimate hedge. The first life insurance salesman showed up at my
door when I was a newlywed.
Somehow, life insurance is just not a big priority at that stage of your life. Cheap, yes. But we don’t
even have a toaster yet.
Check this out. You can listen to Best Stocks Now Radio
Show while toasting your bread! Where do I get one?
This has been yet another bad year for the hedge fund industry. One of my clients sent me article
that listed the average hedge fund return of 6.2% year to date in 2013.
How could this be a bad year for hedge funds?

3
The market has had one of its best years ever?
It makes me wonder how the hedge funds will fare during a bad year in the market.
With the market up over 26% in 2013, how can the average hedge fund be up only 6.2%?
The biggest reason is that cost of hedging has been high this year.
Carrying a jacket around on warm evening is a real hassle. Plus, it is almost a guarantee that you are
going to leave it somewhere and have to go back and get it the next day.
A $200 vacation can become $300 real quick if you do too much hedging.
A cheap clock radio can go up in price exponentially with that Cadillac extended warranty that
guards against knocking it off the night table during a sleepless night.
Just like sticker shock is showing up on people’s faces when they learn what all of the bells and
whistles on their shiny, new healthcare plan costs.
A whole life insurance policy does not come cheap.
Neither does a big position in an underperforming asset. Here is where we stand year to date:
Asset 12/31/12 Fri. 11/29/13 2012 2013
Class Close Close Final YTD
S&P500 1426.19 1805.81 13.41% 26.62%
Forward PE ratio 16.49 18.58 2.09 12.67%
DJIA 13104.00 16086.41 7.06% 22.76%
NASD 3019.51 4059.89 15.66% 34.46%
S&P600 (Small) 476.57 656.85 14.82% 37.83%
S&P400 (Mid-Cap) 1020.43 1304.18 16.07% 27.81%
Total World Stock Index 49.42 58.50 16.07% 18.37%
Emg. Mkts (VWO) 44.53 41.48 16.54% -6.85%
Em Mkt Sm. Cap (DGS) 49.44 47.44 19.59% -4.05%
Europe (EFA) 56.86 66.24 14.80% 16.50%
China (FXI) 40.45 40.13 16.00% -0.79%
Latin America (ILF) 43.84 38.24 2.98% -12.77%
20 Yr.+ U.S Treas. (TLT) 121.18 104.37 2.98% -13.87%
7-10 Yr. U.S Treas. (IEF) 106.99 101.68 2.98% -4.96%
U.S. 10yr. Tr. 2.01% 2.74% -0.53% -36.32%
Spain 10yr. Bond 4.11% 4.15% 5.17% -0.97%
Oil 94.75 93.79 5.21% -1.01%
Gold 1692.00 1250.80 6.14% -26.08%

4
I have pointed out many times in the past year, the wide range of returns from the various asset
classes.
From small cap U.S. stocks which are up over 38% year to date, to gold which is down 26%, and of
course everything in between.
With just one month left to go in 2013, here is where a 50/50 bond/stock portfolio is year-to-date
Hmmm, very interesting. Plus 6.5%. Just about in line with the average hedge fund!
In 2012, the market was up 11.82%, but a 50/50 fund was up 5.88%.
But, in 2008 a 50/50 fund bought you a big chunk of protection!
2013
Begin Invest Gain/Loss Current Pct.
$50,000 TLT -$6,936 $43,064
$50,000 S&P 500 $13,468 $63,468
$100,000 $6,532 $106,532 6.53%
2012
Begin Invest YTD Gain/Loss Current Pct.
$50,000 TLT -0.06% -$29 $49,971
$50,000 S&P 500 11.82% $5,911 $55,911
$100,000 $5,882 $105,882 5.88%
2008
Begin Invest YTD Gain/Loss Current Pct.
$50,000 TLT 32.10% $16,050 $66,050
$50,000 S&P 500 -38.50% -$19,250 $30,750
$100,000 -$3,200 $96,800 -3.20%

5
With the stock market down 38.5% and the bond market up 32.1%, the net was just a 3.2% overall loss.
Of course you would have been up 32.1% had you been 100% in the bond market that year. But only
a 3.2% loss would have sure been more palatable than a 38.5% drubbing being 100% in stocks!
A 50/50 stock bond portfolio since January 1, 2008 is up a grand total of 6.37%
A 100% stock portfolio is up 22.9%.
A 100% bond portfolio is up 36.4%.
Being 100% invested in the BEST performing asset class each year since January 1, 2008 would be up
an astonishing 259%!!!
Modern Portfolio Theory (MPT)? Indeed!
I am not buying it.
As you can see if we can tilt our portfolios just a little bit towards the best performing asset class each
year, we are going to GREATLY improve our performance over time.
BACN™-Best Asset Classes NOW. Everybody loves bacon! Bacon sizzles!
I make no claims or guarantees, but I do everything that I can possible do to be in the best
performing asset classes vs. the worst ones.
In just a moment will look at the best asset classes now BACN™. But before we do, let’s check and
see how we finished the week.

6
The Nasdaq continues to sizzle like bacon, while there is nothing shiny about gold, and interest rates
continue to trend upwards.
This will ALL change at some point in the future, however. The first shall be last and the last shall be
first! We just don’t know when the shake-up is coming.
That is why we have to take it one day at a time, one stock at a time, one sector at a time, and one
stock at a time.
This completely flies in the face of asset allocation which takes it ONE YEAR AT A TIME!
Here is why the average hedge fund is only up 6.2% year to date.
Speaking of BEST ASSET CLASSES NOW (BACN™), with just one month left in 2013, where do we stand?
Let’s check the current ranking of the asset classes. I rank 45 different asset classes (including a lot of
stock and bond oriented ones) on a daily basis. I generally focus on the top 8-10. Here is how they
currently stack up:
Top 8 (3 wks. ago) Top 8 (2 wks. ago) Top 8 (This week)
Where do I currently stand on the stock vs. bond debate? With the TOP TEN asset classes being all
stock related, I still stand FIRM on a 100%/0% stock bond mix. I have kept you out of the bond bashing
that has taken place over the last 12 months!
Also notice that the 100% stock mix is still decidedly tilted in the small and mid-cap direction! This is
also very important information to build portfolios around. It ain’t over ‘til it’s over!

7
We next check Asset Classes 9-16 again this week to see if anything interesting is going on there.
(9-16)Three weeks ago (9-16) Last week (9-16) This week
The first bond related asset class shows up #12 in the emerging market income arena. I just don’t dip
down that low when it comes to modeling my portfolios. In between asset classes 16-37 is just a whole
bunch of MEDIOCRITY that would for certain show up in an MPT asset allocation portfolio that is
tended to once per year, or once per quarter if you are lucky.

8
Here are the CURRENT bottom eight ranked asset classes:
Bottom 8 two weeks ago Bottom 8 last week Bottom 8 this week
Being SHORT the market continues to thrash portfolios, while gold, cash, commodities, and interest
rate sensitive investments (bonds) should be avoided like the plague!
Let’s pause for a moment and look at the current technical picture of the stock markets. I always like
visual confirmation of my asset class rankings.
One-year chart of the S&P 500
The S&P 500 still looks fine to me. All-time highs this past week. To sell now would be a mere guess.
Guessing that the market has topped out over the last 5 years has been a losing prognostication.

9
Three-year chart of the S&P500
The primary trend of the market still points up. This is another term for BULL MARKET.
One-year chart of the NASDAQ:
The Nasdaq is now north of 4,000. It is also up 34.5% on the year. If you think that the Nasdaq has
topped out, then short it.

10
But don’t say that I did not WARN YOU!
One-year chart of the DJIA
The DJIA has broken out through resistance to new, all-time highs. How long can it go for? Nobody
knows the answer to that question. That is why we take it one day at a time. Let’s next look at the
leading indexes around the world.

11
BEST two weeks ago BEST last week BEST this week
Stocks, stocks and more stocks. The reverse VIX is also interesting.
Here are the current worst indexes around the world.
Worst Indexes 2 weeks ago Worst Indexes last week Worst Indexes this week
This inverse Vix and regular Vix relationship will be interesting to watch going forward. It could give
some important clues as to when this current bullish trend begins to change.

12
Now on to the sectors in the market. Best Asset Classes Now-BACN™. Best Sectors Now. Best Stocks
Now. I track sixty sectors on a daily basis. Here are the current leaders.
Top 8 three weeks ago Top 8 two weeks ago Top 8 this week
I know that I sound like a broken record, but pharmaceuticals and biotechs continue to lead the
market.
Let’s next check sector rankings 9-16 to see if anything interesting is going on there:
#9-16 (3 weeks ago) #9-16 (2 weeks ago) #9-16 (this week)
The BANKS are really starting to kick into gear again. I saw several breakouts in the banks this past
week! Here is just one good example.

13
Here are this week’s worst ranked sectors.
Bottom 8 Two Weeks Ago Bottom 8 Last Week Bottom 8 This Week

14
I have been showing you a lot of good charts. Here is what a bad one looks like.
Rising interest rates have taken their toll on the bond and real estate sector.
If you are 75 years old, you are supposed to have 75% of your assets in bonds. Right? Not according
to Bill Gunderson BEST ASSET CLASS NOW (BACN™) theory!
The four year, nine month old BULL MARKET is still intact. I am not a buy and holder. I am a market
timer. I have kept you in throughout this current bull. It will come to an end at some point, but I just
don’t see enough evidence yet. Therefore, I continue to keep the GREEN FLAG flying on the stock
market.
Please follow me on Twitter @BillGunderson throughout the week for any changes in my
current stance on the market or individual stocks. If you need a quick primer on how to use
Twitter, click here.
My tweets are also found on my BEST STOCKS NOW app every day, and on the homepage
of my website: http://www.pwstreet.com

15
Bill Gunderson’s Model Portfolio for Investors seeking Aggressive/Moderate Growth.
This is my most aggressive portfolio. It is designed for investors with long-term time horizons,
seeking maximum growth. This portfolio is made up mainly of small and mid-cap stocks with
superior growth potential. This portfolio is up 36.76% YTD after all expenses.
I added Allegiant Travel (ALGT) to this portfolio this past week. I did not sell anything. Cash
level is now 17.8%. Actual Portfolios may vary depending on start time and actual stock mix.
Gunderson Aggressive Gr. Model Portfolio * 36.76% YTD (After Fees)
As of 11/29/2013 (8:00am) 38.44% YTD (Before Fees)
* 11.99% 2012 (After Fees)
14.89% 2012 (Before Fees)
*(Net of all $7 trading fees and an annual mgt. fee of 2.0%-INTERNALLY AUDITED)
*Actual accounts managed by Gunderson Capital Mgt. may vary depending upon when accounts are
opened and actual stock mix.
Add Add Adj. Add Begin Current Current Current
Sym. Name Sector Date Price Price Shares Value Price Value G/L Allocation
1 AKRX Akorn Inc. Drug 30-Sep-13 $19.64 $19.64 295 $5,794 $26.00 $7,670 32.4% 4.66%
2 ACET Aceto Corp. Basic Mat. 22-Nov-13 $20.64 $20.64 260 $5,366 $21.44 $5,574 3.9% 3.39%
3 ALGT Allegiant Travel Transportation 27-Nov-13 $113.65 $113.65 50 $5,683 $113.65 $5,683 0.0% 3.46%
4 ANAC Anacor Pharm. Drug 15-Aug-13 $10.54 $10.54 477 $5,028 $13.81 $6,587 31.0% 4.01%
5 BCEI Bonanza Creek Energy Energy 19-Sep-13 $47.87 $47.87 115 $5,505 $45.53 $5,236 -4.9% 3.18%
6 CEMP Cempra Inc. Drug 26-Sep-13 $10.57 $10.57 515 $5,444 $12.95 $6,669 22.5% 4.06%
7 CFX Colfax Corp. Industrial 31-May-13 $49.90 $49.90 94 $4,691 $58.23 $5,474 16.7% 3.33%
8 DDD Three D Systems Technology 31-Oct-13 $62.71 $62.71 87 $5,456 $75.50 $6,569 20.4% 3.99%
9 DXCM Dexcom Inc. Drug 10-May-13 $19.85 $19.85 229 $4,546 $33.47 $7,665 68.6% 4.66%
10 ILMN Illumina Drug 26-Jun-13 $75.73 $75.73 62 $4,695 $97.67 $6,056 29.0% 3.68%
11 INCY Incyte Corp. Drug 18-Nov-13 $46.96 $46.96 115 $5,400 $47.15 $5,422 0.4% 3.30%
12 JAZZ Jazz Pharmaceuticals Drug 31-May-13 $69.00 $69.00 68 $4,692 $116.98 $7,955 69.5% 4.84%
13 NUS Nu Skin Enterprises Consumer 16-Aug-13 $87.28 $87.28 58 $5,062 $128.25 $7,439 46.9% 4.52%
14 OPEN Opentable Inc. Consumer 8-Nov-13 $77.23 $77.23 68 $5,252 $83.90 $5,705 8.6% 3.47%
15 P Pandora Media Media 21-Aug-13 $21.48 $21.48 238 $5,112 $28.59 $6,804 33.1% 4.14%
16 PCRX Pacira Pharmaceuticals Drug 22-Nov-13 $55.49 $55.49 97 $5,383 $55.28 $5,362 -0.4% 3.26%
17 PDLI P D L Biopharma Drug 22-Nov-13 $9.51 $9.51 570 $5,421 $9.75 $5,558 2.5% 3.38%
18 PCYC Pharmacyclics Inc. Drug 12-Jul-13 $107.00 $107.00 48 $5,136 $124.59 $5,980 16.4% 3.64%
19 TRIP TripAdvisor Leisure 31-Oct-13 $83.85 $83.85 67 $5,618 $88.41 $5,923 5.4% 3.60%
20 STLD Steel Dynamics Basic Mat. 8-Nov-13 $19.23 $19.23 275 $5,288 $18.09 $4,975 -5.9% 3.03%
21 YELP Yelp Inc Internet 15-Nov-13 $69.41 $69.41 80 $5,553 $60.89 $4,871 -12.3% 2.96%
22 WST West Pharm. Services Medical 10-Oct-13 $42.83 $42.83 120 $5,140 $50.13 $6,016 17.0% 3.66%
Curren Mkt. Value $135,192 82.2%
Current Cash $29,253 17.8%
Current Total Value $164,445 100.0%
Begin 2013 $120,246
2013 YTD G/L (After Fees) $44,200 36.76%
2013 Mgt. Fees (2.0%) annual $1,304
2013 Trading Costs ($7 each) $714
Total Costs $2,018 1.7%
2013 YTD G/L (Before Fees) 38.44%
Begin 2012 $107,371
End 2012 $120,246
2012 Gain $12,875
Pct. Gain (after all fees) 11.99%
16
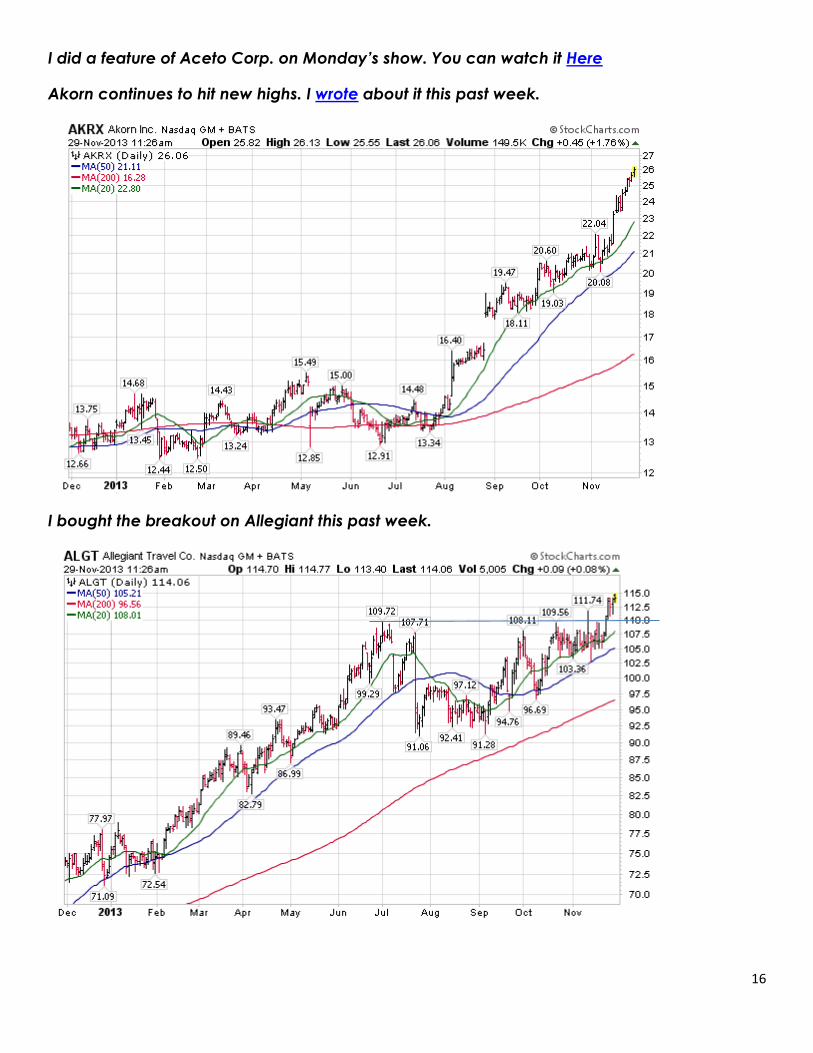
I did a feature of Aceto Corp. on Monday’s show. You can watch it Here
Akorn continues to hit new highs. I wrote about it this past week.
I bought the breakout on Allegiant this past week.

17
Energy stocks like Bonanza are barely hanging on. I do have an exit strategy just in case.
Yelp is another one that is barely hanging in there. I wish that they all could be winners.

18
West Pharmaceuticals is breaking out to new highs!

19
Gunderson Aggressive Growth Model Portfolio Sells 2013
Symbol Name Sector Bought Buy Price Shares Tot. Buy Sell Price Total Sell Pct. G/L Sell Date
1 ALXN Alexion Pharmaceutical Drug 22-Jun-12 $95.95 $95.95 51 $4,893 $97.18 $4,956 1.3% 18-Jan-13
2 ONXX Onyx Pharmaceuticals Drug 21-Sep-12 $85.04 $85.04 58 $4,932 $77.33 $4,485 -9.1% 18-Jan-13
3 ELLI Ellie Mae Real Est. 12-Oct-12 $26.40 $26.40 176 $4,646 $22.21 $3,909 -15.9% 25-Jan-13
4 AMT American Tower Telecom 26-Oct-12 $73.37 $73.37 57 $4,182 $76.87 $4,382 4.8% 8-Feb-13
5 SSYS Stratasys Technology 18-Jan-12 $87.03 $87.03 48 $4,177 $71.20 $3,418 -18.2% 15-Feb-13
6 REGN Regeneron Pharm. Drug 31-Aug-12 $145.96 $145.96 32 $4,671 $163.85 $5,243 12.3% 15-Feb-13
7 CHN China Fund International 28-Dec-12 $21.02 $21.02 190 $3,994 $21.81 $4,144 3.8% 8-Mar-13
8 DGS Emg. Mkt. Sm. Cap Index International 14-Dec-12 $47.92 $47.92 83 $3,977 $50.55 $4,196 5.5% 22-Mar-13
9 OCN Ocwen Financial Financial 17-Aug-12 $24.87 $24.87 192 $4,775 $34.99 $6,718 40.7% 22-Mar-13
10 RGR Sturm Ruger Leisure 8-Feb-13 $55.35 $55.35 76 $4,207 $52.62 $3,999 -4.9% 22-Mar-13
11 UTEK Ultratech Inc. Technology 18-Jan-13 $39.36 $39.36 106 $4,172 $39.60 $4,198 0.6% 22-Mar-13
12 TOL Toll Brothers Inc Building 25-Jan-13 $37.98 $37.98 111 $4,216 $34.24 $3,801 -9.8% 22-Mar-13
13 CRM Salesforce.com Software 14-Dec-12 $166.85 $166.85 24 $4,004 $165.42 $3,970 -0.9% 5-Apr-13
14 DHI D R Horton Building 22-Mar-13 $24.92 $24.92 160 $3,987 $23.08 $3,693 -7.4% 5-Apr-13
15 PCYC Pharmacyclics Inc. Drug 14-Aug-12 $59.50 $59.50 80 $4,760 $75.55 $6,044 27.0% 5-Apr-13
16 PIR Pier 1 Imports Consumer 19-Oct-12 $20.34 $20.34 234 $4,760 $21.83 $5,108 7.3% 5-Apr-13
17 TTC Toro Co. Building 20-Jul-12 $39.55 $39.55 120 $4,746 $45.43 $5,452 14.9% 5-Apr-13
18 XHB Homebuilders Index Building 26-Oct-12 $25.52 $25.52 165 $4,211 $28.91 $4,763 13.3% 5-Apr-13
19 ARII Ameriican Railcar Inds. Transportat ion 1-Feb-13 $39.82 $39.82 106 $4,221 $40.51 $4,294 1.7% 12-Apr-13
20 GWR Genesee & Wyoming Transportat ion 14-Dec-12 $73.90 $73.90 53 $3,917 $84.93 $4,501 14.9% 12-Apr-13
21 AZZ A Z Z Inc. Building 25-Jan-13 $43.62 $43.62 97 $4,231 $41.53 $4,028 -4.8% 19-Apr-13
22 LL Lumber Liquidators Building 12-Feb-13 $62.25 $62.25 69 $4,295 $67.21 $4,637 8.0% 19-Apr-13
23 TREX Trex Company Inc. Building 25-Jan-13 $42.78 $42.78 99 $4,235 $47.35 $4,688 10.7% 19-Apr-13
24 CTRX Catamaran Corp. Medical 9-Mar-12 $36.51 $36.51 82 $2,994 $51.54 $4,226 41.2% 10-May-13
25 CBG C B R E Group Real Est. 8-Feb-13 $24.08 $24.08 174 $4,190 $24.21 $4,213 0.5% 10-May-13
26 FCFS First Cash Financial Financial 29-Mar-13 $58.34 $58.34 70 $4,084 $54.07 $3,785 -7.3% 10-May-13
27 HHC Howard Hughes Corp. Real Est. 5-Oct-12 $73.60 $73.60 62 $4,563 $101.80 $6,312 38.3% 22-May-13
28 CTGX Computer Task Group Technology 22-Mar-13 $21.56 $21.56 185 $3,989 $22.10 $4,089 2.5% 24-May-13
29 BMRN Biomarin Pharm. Drug 14-Dec-12 $49.59 $49.59 80 $3,967 $62.70 $5,016 26.4% 31-May-13
30 PCH Potlatch Corp. Real Est. 5-Apr-13 $45.78 $45.78 94 $4,303 $46.92 $4,410 2.5% 29-May-13
31 BRS Bristow Group Energy 22-Mar-13 $63.32 $63.32 63 $3,989 $62.19 $3,918 -1.8% 3-Jun-13
32 GNC General Nutrit ion Consumer 3-May-13 $45.39 $45.39 99 $4,494 $43.33 $4,290 -4.5% 4-Jun-13
33 JBHT J B Hunt Trans Svcs Transportat ion 16-Nov-12 $59.30 $59.30 65 $3,855 $71.55 $4,651 20.7% 4-Jun-13
34 SBH Sally Beauty Consumer 12-Apr-12 $30.55 $30.55 124 $3,788 $29.58 $3,668 -3.2% 5-Jun-13
35 SGEN Seatt le Genetics Drug 15-Mar-13 $33.55 $33.55 133 $4,462 $33.53 $4,459 -0.1% 4-Jun-13
36 WSO Watsco Inc. Building 21-Dec-12 $75.54 $75.54 52 $3,928 $86.37 $4,491 14.3% 4-Jun-13
37 ABG Asbury Automotive Group Auto 26-Oct-12 $30.55 $30.55 157 $4,796 $40.12 $6,299 31.3% 12-Jun-13
38 AEGR Aegerion Pharmaceuticals Drug 10-May-13 $44.88 $44.88 101 $4,533 $69.49 $7,018 54.8% 13-Jun-13
39 LGF Lions Gate Entertainment Leisure 3-May-13 $25.92 $25.92 174 $4,510 $26.96 $4,691 4.0% 12-Jun-13
40 ONXX Onyx Pharm Drug 26-Apr-13 $94.69 $94.69 47 $4,450 $86.44 $4,063 -8.7% 12-Jun-13
41 REGN Regeneron Pharm. Drug 26-Apr-13 $216.60 $216.60 21 $4,549 $237.70 $4,992 9.7% 12-Jun-13
42 ALKS Alkermes Drug 12-Apr-13 $24.99 $24.99 177 $4,423 $27.64 $4,892 10.6% 20-Jun-13
43 BECN Beacon Roofing Building 31-May-13 $41.22 $41.22 113 $4,658 $38.96 $4,402 -5.5% 20-Jun-13
44 GILD Gilead Sciences Drug 16-Nov-12 $37.44 $37.44 102 $3,818 $49.94 $5,094 33.4% 20-Jun-13
45 IMGN Immunogen Inc. Drug 31-May-13 $18.70 $18.70 252 $4,712 $15.34 $3,866 -18.0% 20-Jun-13
46 PBH Prest ige Brands Consumer 11-Feb-13 $24.58 $24.58 175 $4,302 $28.39 $4,968 15.5% 20-Jun-13
47 CSGP Costar Group Real Est. 21-Dec-12 $87.23 $87.23 45 $3,925 $135.49 $6,097 55.3% 12-Jul-13
48 TMH Team Health Hldgs. Healthcare 22-Mar-13 $35.14 $35.14 111 $3,901 $39.14 $4,345 11.4% 22-Jul-13
49 TRS Trimas Corp. Diversified 26-Jun-13 $35.88 $35.88 130 $4,664 $35.01 $4,551 -2.4% 24-Jul-13
50 CSOD Cornerstone OnDemand Technology 14-Jun-13 $43.46 $43.46 107 $4,650 $43.00 $4,601 -1.1% 29-Jul-13
51 HHC Howard Hughes Inc. Real Est. 27-Jun-13 $113.03 $113.03 41 $4,634 $108.09 $4,432 -4.4% 29-Jul-13
52 MOH Molina Healthcare Healthcare 10-May-13 $36.72 $36.72 124 $4,553 $37.05 $4,594 0.9% 9-Aug-13
53 FURX Furiex Pharm. Drug 23-Jul-13 $46.10 $46.10 108 $4,979 $37.31 $4,029 -19.1% 15-Aug-13
54 TSCO Tractor Supply Consumer 5-Apr-13 $106.03 $106.03 41 $4,347 $117.24 $4,807 10.6% 15-Aug-13
55 NEOG Neogen Corp. Medical 5-Apr-13 $49.40 $49.40 87 $4,298 $53.29 $4,636 7.9% 20-Aug-13
56 DW Drew Industries Building 10-Jun-13 $39.53 $39.53 119 $4,704 $40.68 $4,841 2.9% 27-Aug-13
57 ISIS Isis Pharmaceuticals Drug 13-Jun-13 $23.51 $23.51 204 $4,796 $24.34 $4,965 3.5% 27-Aug-13
58 SNTS Santarus Inc. Drug 18-Jan-13 $12.51 $12.51 335 $4,191 $22.76 $7,625 81.9% 27-Aug-13
59 THO Thor Industries Building 14-Jun-13 $48.12 $48.12 97 $4,668 $50.46 $4,895 4.9% 27-Aug-13
60 EEV Ultrashort Emerging Markets Inverse 27-Aug-13 $26.94 $26.94 185 $4,984 $23.20 $4,292 -13.9% 6-Sep-13
61 NBIX Neurocrine Biosciences Drug 3-Sep-13 $15.73 $15.73 327 $5,144 $10.62 $3,473 -32.5% 13-Sep-13
62 TROV Trovagene Inc. Drug 31-Jul-13 $8.19 $8.19 630 $5,160 $7.15 $4,505 -12.7% 20-Sep-13
63 TSRX Trius Therapeutics Drug 15-Jul-13 $10.65 $10.65 482 $5,133 $13.63 $6,570 28.0% Bought Out 20-Sep-13
64 DORM Dorman Products Auto 14-Aug-13 $52.35 $52.35 96 $5,026 $49.85 $4,786 -4.8% 4-Oct-13
65 AFOP Alliance Fiber Optic Technology 28-Aug-13 $18.66 $18.66 270 $5,037 $17.72 $4,784 -5.0% 8-Oct-13
66 ALKS Alkermes Drug 29-Jul-13 $34.53 $34.53 150 $5,180 $30.26 $4,539 -12.4% 8-Oct-13
67 ALNY Alnylam Pharm Drug 24-May-13 $28.86 $28.86 165 $4,762 $57.11 $9,423 97.9% 8-Oct-13
68 ASGN On Assignment Misc. 22-Mar-13 $24.91 $24.91 160 $3,986 $34.37 $5,499 38.0% 18-Oct-13
69 BMRN Biomarin Pharm. Drug 9-Sep-13 $74.99 $74.99 72 $5,399 $65.42 $4,710 -12.8% 18-Oct-13
70 ACAD Acadia Pharm. Drug 15-Jul-13 $19.85 $19.85 250 $4,963 $21.70 $5,425 9.3% 23-Oct-13
71 SGMO Sangamo Biosciences Drug 2-Oct-13 $12.44 $12.44 470 $5,847 $10.33 $4,855 -17.0% 25-Oct-13
72 NPSP N P S Pharmaceuticals Drug 19-Apr-13 $12.87 $12.87 168 $2,162 $27.99 $4,702 117.5% SOLD HALF 21-Oct-13
73 USNA U SA N A Health Science Consumer 14-Jun-13 $74.15 $74.15 63 $4,671 $69.04 $4,350 -6.9% 31-Oct-13
74 NPSP N P S Pharmaceuticals Drug 19-Apr-13 $12.87 $12.87 169 $2,175 $27.23 $4,602 111.6% SOLD the REST 30-Oct-13
75 GPOR Gulfport Energy Energy 28-Aug-13 $59.39 $59.39 87 $5,167 $55.33 $4,814 -6.8% 7-Nov-13
76 OCN Ocwen Financial Financial 30-Jul-13 $47.57 $47.57 110 $5,233 $50.80 $5,588 6.8% 5-Nov-13
77 PCRX Pacira Pharm. Drug 14-Aug-13 $37.66 $37.66 138 $5,197 $46.95 $6,479 24.7% 7-Nov-13
78 RPTP Raptor Pharmaceutical Drug 10-Jul-13 $10.33 $10.33 500 $5,165 $13.08 $6,540 26.6% 7-Nov-13
79 EGHT Eight By Eight Technology 16-Jul-13 $8.98 $8.98 572 $5,137 $9.63 $5,508 7.2% 13-Nov-13
80 OPK Opko Health Medical 14-Oct-13 $10.55 $10.55 525 $5,539 $9.46 $4,967 -10.3% 19-Nov-13
81 ENSG Ensign Group Medical 12-Apr-12 $35.62 $35.62 124 $4,417 $42.36 $5,253 18.9% 18-Nov-13

20
Bill Gunderson’s Model Portfolio for Conservative Growth Investors:
This model is made up of mostly large and mid-cap companies that I consider suitable for
investors who have a conservative growth risk profile. Time horizon of at least 3-5 years would
be appropriate. Large cap stocks have underperformed small caps in 2013.
This portfolio is up 21.16% year-to-date. This net of an annual mgt. fee of 2.0% and all $7
trades. NO CHANGES THIS PAST WEEK. Cash level is still 0%. ACTUAL PORTFOLIOS MAY VARY
DEPENDING ON START TIME AND ACTUAL PORTFOLIO MIX.
Conservative Growth Model 21.16% *YTD After Fees
11/29/2013 (9:00am) 22.10% YTD Before Fees
12.52% *2012 After Fees
14.71% *2012 Before Fees
(Net of all $7 Trading Costs and a 2% annual mgt fee-Internally Audited)
Actual portfolios may vary depending on when account is opened and actual mix of stocks)
Add Add Adjusted Beginning Current Current
Date Symbol Name Sector Price Price Shares Value Price Value G/L Alloc.
1 15-Mar-13 ACT Actavis Drug $91.59 $91.59 51 $4,671 $163.78 $8,353 78.8% 5.15%
2 16-Aug-13 AAPL Apple Computer Drug $500.00 $500.00 10 $5,000 $553.19 $5,532 10.6% 3.41%
3 25-Jul-13 CELG Celgene Drug $143.18 $143.18 36 $5,154 $162.05 $5,834 13.2% 3.60%
4 9-Sep-13 DAL Delta Airlines Transport. $22.78 $22.78 221 $5,034 $28.96 $6,400 27.1% 3.94%
5 10-Jul-13 DLTR Dollar Tree Consumer $53.84 $53.84 94 $5,061 $55.83 $5,248 3.7% 3.23%
6 10-Jul-13 EOG E O G Resources Energy $143.25 $143.25 36 $5,157 $166.66 $6,000 16.3% 3.70%
7 16-Aug-13 FB Facebook Internet $37.08 $37.08 137 $5,080 $47.06 $6,447 26.9% 3.97%
8 25-Jul-13 GILD Gilead Sciences Drug $60.74 $60.74 84 $5,102 $75.11 $6,309 23.7% 3.89%
9 26-Jun-13 ILMN Illumina Drug $75.73 $75.73 64 $4,847 $97.49 $6,239 28.7% 3.85%
10 18-Nov-13 INCY Incyte Drug $46.96 $46.96 115 $5,400 $47.10 $5,417 0.3% 3.34%
11 14-Dec-12 MA Mastercard Financial $482.30 $482.30 9 $4,341 $763.10 $6,868 58.2% 4.23%
12 31-Jul-13 MEOH Methanex Energy $47.60 $47.60 109 $5,188 $61.81 $6,737 29.9% 4.15%
13 14-Nov-13 MHK Mohawk Industries Building $143.21 $143.21 35 $5,012 $140.63 $4,922 -1.8% 3.03%
14 10-Jul-13 NFLX Netfllix Leisure $242.15 $242.15 21 $5,085 $365.28 $7,671 50.8% 4.73%
15 8-Nov-13 NUE Nucor Basic Mat $54.52 $54.52 100 $5,452 $51.17 $5,117 -6.1% 3.15%
16 31-Oct-13 NXPI Nxp Semiconductors Technology $41.10 $41.10 133 $5,466 $42.34 $5,631 3.0% 3.47%
17 22-Mar-13 ODFL Old Dominion Freight Transport. $38.18 $38.18 105 $4,009 $51.67 $5,425 35.3% 3.34%
18 12-Jul-13 PCYC Pharmacyclics Inc. Drug $107.09 $107.09 47 $5,033 $124.82 $5,867 16.6% 3.62%
19 16-Sep-13 REGN Regeneron Pharm. Drug $297.43 $297.43 18 $5,354 $293.35 $5,280 -1.4% 3.25%
20 2-Oct-13 PCLN Priceline.com Leisure $1,065.54 $1,065.54 5 $5,328 $1,195.88 $5,979 12.2% 3.69%
21 14-Nov-13 PNR Pentair Ltd Industrial $69.63 $69.63 70 $4,874 $71.07 $4,975 2.1% 3.07%
22 24-Oct-13 PXD Pioneer Nat. Resources Energy $209.23 $209.23 26 $5,440 $179.25 $4,661 -14.3% 2.87%
23 5-Apr-13 TJX T J Maxx Co. Consumer $47.14 $47.14 97 $4,573 $63.31 $6,141 34.3% 3.78%
24 31-Oct-13 TRIP TripAdvisor Leisure $83.85 $83.85 65 $5,450 $88.35 $5,743 5.4% 3.54%
25 19-Apr-13 TSCO Tractor Supply Consumer $54.03 $54.03 86 $4,647 $73.43 $6,315 35.9% 3.89%
26 29-Jun-12 V Visa Finance $123.11 $123.11 38 $4,678 $204.47 $7,770 66.1% 4.79%
27 22-Mar-13 VRX Valeant Phar. Drug $74.04 $74.04 53 $3,924 $110.01 $5,831 48.6% 3.59%
Total Holdings $162,711 `
Total Cash -$454 -0.2%
Current Total Value $162,257
Begin 2013 $133,923
YTD Tot. Gain/Loss $28,334 100.0%
YTD Pct. Gain/Loss 21.16%
2013 Mgt. Fees $670
2013 Trading Costs ($7 each) $595
Total Costs $1,265
Adj. Gain/Loss $29,599
Adj. Pct. Gain/Loss 22.10%
Begin 2012 $119,023 `
2012 Gain/Loss $17,511
Pct. Gain/Loss 14.71%
Fees/Cost $2,611
Adj. Gain/Loss + $14,900
Pct. Gain/Loss 12.52%

21
I am working on an article for TheStreet.com about the Solar stocks. Am I a bull or a bear?
Here is my current take on one of the bellweather stocks in the sector. (FSLR)
Apple Computer (AAPL) had a fantastic breakout this past week. I continue to add to my
position. I told you that it would eventually find a bottom and turn around!
Another oil stock hanging on by the skin of its teeth.

22
Netflix is now up over 50% since my most recent buy.
I analyzed NXPI on Wednesday’s show. It is attempting a breakout.

23
I analyzed Old Dominion on Monday’s show. What a great stock!
And there is Priceline.com The stock of the decade!

24
Another energy stock giving me grief. I am holding a VERY short leash!
With all of this “peace” in the middle-east, oil prices continue to drop. No wonder the Saudi’s
are not too happy these days!

25
2013 Conservative Growth Model Portfolio Sells
Bought Bought Bought Sector Buy Price Shares Tot. Buy Sell Price Total Sell Pct. G/L Sell Date
1 25-May-12 BIIB Biogen Drug $131.75 $131.75 36 $4,743 $143.79 $5,176 9.1% SOLD 11-Jan-13
2 28-Sep-12 WPI Watson Pharmaceutical Drug $85.76 $85.76 63 $5,403 $83.71 $5,274 -2.4% SOLD 11-Jan-13
3 26-Oct-12 LPX Louisiana Pacific Building $15.54 $15.54 336 $5,221 $21.00 $7,056 35.1% SOLD 18-Jan-13
4 29-Jun-12 ALXN Alexion Pharm. Drug $98.71 $98.71 48 $4,738 $97.69 $4,689 -1.0% SOLD 25-Jan-13
5 26-Oct-12 TWC Time Warner Cable Media $99.52 $99.52 52 $5,175 $87.95 $4,573 -11.6% SOLD 1-Feb-13
6 11-Jan-13 E Eni Spa ads Oil & Gas $51.58 $51.58 89 $4,591 $46.52 $4,140 -9.8% SOLD 8-Feb-13
7 8-Jun-12 PETM Petsmart Consumer $66.24 $66.24 70 $4,637 $66.98 $4,689 1.1% SOLD 8-Feb-13
8 11-May-12 AMT American Tower Telecom $67.86 $67.86 70 $4,750 $74.63 $5,224 10.0% SOLD 15-Feb-13
9 23-Nov-12 HDB H D F C Bank Ltd. Banks $40.17 $40.17 109 $4,379 $38.70 $4,218 -3.7% SOLD 22-Feb-13
10 11-Jan-13 ILF Latin Amer. 40 Index International $45.09 $45.09 102 $4,599 $43.46 $4,433 -3.6% SOLD 22-Feb-13
11 28-Dec-12 FXI China 25 Index International $39.64 $39.64 112 $4,440 $40.19 $4,501 1.4% SOLD 22-Feb-13
12 27-Jul-12 REGN Regeneron Pharm. Drug $137.91 $137.91 34 $4,689 $159.92 $5,437 16.0% SOLD 22-Feb-13
13 1-Jun-12 PPG P P G Industries Basic Mat. $98.96 $98.96 48 $4,750 $136.26 $6,540 37.7% SOLD 8-Mar-13
14 30-Nov-12 EBAY Ebay Inc. Consumer $52.67 $52.67 85 $4,477 $51.05 $4,339 -3.1% SOLD 15-Mar-13
15 14-Dec-12 VWO Vanguard Emg. Mkt. ETFInternational $43.75 $43.75 100 $4,375 $43.29 $4,329 -1.1% SOLD 15-Mar-13
16 11-Jan-13 ASML A S M L Holding N.v. Technology $65.32 $65.32 70 $4,572 $68.16 $4,771 4.3% SOLD 22-Mar-13
17 11-May-12 NVO Novo Nordisk Drug $145.90 $145.90 32 $4,669 $162.22 $5,191 11.2% SOLD 22-Mar-13
18 8-Feb-13 TSM Taiwan Semiconductor Technology $18.45 $18.45 250 $4,613 $17.06 $4,265 -7.5% SOLD 22-Mar-13
19 22-Feb-13 KORS Michael Kors Hldgs. Consumer $59.15 $59.15 78 $4,614 $55.49 $4,328 -6.2% SOLD 22-Mar-13
20 31-Aug-12 CNI Canadian Natl. Railway Transport. $91.99 $91.99 52 $4,783 $100.30 $5,216 9.0% SOLD 5-Apr-13
21 26-Oct-12 XHB Homebuilders Index Building $25.52 $25.52 204 $5,206 $30.04 $6,128 17.7% SOLD 5-Apr-13
22 22-Feb-13 CAM Cameron Int l. Corp. Energy $63.08 $63.08 73 $4,605 $59.41 $4,337 -5.8% SOLD 19-Apr-13
23 25-Jan-13 DHI D R Horton Building $21.76 $21.76 215 $4,678 $21.63 $4,650 -0.6% SOLD 19-Apr-13
24 28-Dec-12 FAST Fastenal Building $46.88 $46.88 95 $4,454 $47.35 $4,498 1.0% SOLD 19-Apr-13
25 8-Feb-13 NBL Noble Energy Energy $115.36 $115.36 40 $4,614 $106.48 $4,259 -7.7% SOLD 19-Apr-13
26 15-Mar-13 PXD Pioneer Nat. Resources Energy $129.31 $129.31 36 $4,655 $110.72 $3,986 -14.4% SOLD 19-Apr-13
27 31-Aug-12 AMZN Amazon.com Consumer $248.92 $248.92 19 $4,729 $254.81 $4,841 2.4% SOLD 26-Apr-13
28 8-Feb-13 CBG C B R E Group Real Est. $24.08 $24.41 192 $4,623 $23.49 $4,510 -3.8% SOLD 24-May-13
29 14-Feb-13 CMCSA Comcast Corp. Media $40.49 $40.49 114 $4,616 $41.82 $4,767 3.3% SOLD 24-May-13
30 5-Oct-12 FMX Fomento Econ Mex International $95.18 $95.18 59 $5,616 $110.17 $6,500 15.7% SOLD 21-May-13
31 1-Feb-13 HNP Huaneng Pwr Int l Adr Ut ility $40.67 $40.67 115 $4,677 $43.01 $4,946 5.8% SOLD 21-May-13
32 1-Mar-13 LNKD Linked In Internet $170.46 $170.46 27 $4,602 $177.68 $4,797 4.2% SOLD 22-May-13
33 19-Apr-13 AMT American Tower Telecom $80.88 $80.88 58 $4,691 $78.97 $4,580 -2.4% SOLD 29-May-13
34 24-May-13 CELG Celgene Drug $122.58 $122.58 41 $5,026 $112.64 $4,618 -8.1% SOLD 5-Jun-13
35 17-Aug-12 HD Home Depot Consumer $57.10 $57.10 83 $4,739 $76.75 $6,370 34.4% SOLD 4-Jun-13
36 22-Mar-13 SHW Sherwin Williams Building $168.94 $168.94 23 $3,886 $183.26 $4,215 8.5% SOLD 4-Jun-13
37 21-Aug-12 UNP Union Pacific Transport. $125.19 $125.19 38 $4,757 $151.26 $5,748 20.8% SOLD 5-Jun-13
38 26-Apr-13 ONXX Onyx Pharm. Medical $95.88 $95.88 50 $4,794 $86.44 $4,322 -9.8% SOLD 12-Jun-13
39 15-Mar-13 CSX C S X Corp. Transport. $24.02 $24.02 193 $4,636 $23.88 $4,609 -0.6% SOLD 20-Jun-13
40 17-Aug-12 GILD Gilead Sciences Drug $28.21 $28.21 168 $4,739 $49.94 $8,390 77.0% SOLD 20-Jun-13
41 22-Mar-13 PBH Prest ige Brands Consumer $25.18 $25.18 158 $3,978 $28.39 $4,486 12.7% SOLD 20-Jun-13
42 5-Apr-13 REGN Regeneron Drug $185.41 $185.41 25 $4,635 $217.19 $5,430 17.1% SOLD 20-Jun-13
43 12-Apr-13 ALKS Alkermes Drug $24.99 $24.99 188 $4,698 $27.64 $5,196 10.6% SOLD 20-Jun-13
44 14-Feb-13 GWW W W Grainger Industrial $225.20 $225.20 21 $4,729 $249.67 $5,243 10.9% SOLD 20-Jun-13
45 17-Apr-13 AMP Ameriprise Financial Financial $81.69 $81.69 61 $4,983 $77.11 $4,704 -5.6% SOLD 24-Jun-13
46 22-Feb-13 BX Blackstone Group Financial $18.70 $18.70 247 $4,619 $19.40 $4,792 3.7% SOLD 24-Jun-13
47 22-Mar-13 CSGP Costar Group Real Est. $105.02 $105.02 38 $3,991 $133.28 $5,065 26.9% SOLD 12-Jul-13
48 22-Mar-13 STZ Constellat ion Brands Food/Bev. $46.67 $46.67 85 $3,967 $52.12 $4,430 11.7% SOLD 22-Jul-13
49 19-Jul-13 DRC Dresser-Rand Group Inc. Energy $66.55 $66.55 74 $4,925 $59.60 $4,410 -10.4% SOLD 29-Jul-13
50 26-Apr-13 FTI F M C Technologies Energy $56.74 $56.74 88 $4,993 $53.56 $4,713 -5.6% SOLD 29-Jul-13
51 26-Apr-13 CERN Cerner Medical $47.94 $47.94 100 $4,794 $46.12 $4,612 -3.8% SOLD 30-Aug-13
52 27-Aug-13 EEV Ultrashort Emg. Markets Inverse $26.94 $26.94 190 $5,119 $23.18 $4,404 -14.0% SOLD 6-Sep-13
53 22-Mar-13 AZO Autozone Auto $395.41 $395.41 10 $3,954 $413.45 $4,135 4.6% SOLD 16-Sep-13
54 11-Jul-13 RKT Rock Tenn Co Cl A Paper $107.00 $107.00 47 $5,029 $101.93 $4,791 -4.7% SOLD 3-Oct-13
55 26-Apr-13 COG Cabot Oil & Gas Energy $35.48 $35.48 140 $4,967 $36.09 $5,053 1.7% SOLD 2-Oct-13
56 16-Sep-13 ALKS Alkermes Plc Drug $35.34 $35.34 140 $4,948 $30.26 $4,236 -14.4% SOLD 8-Oct-13
57 9-Sep-13 BMRN Biomarin Pharm. Drug $74.99 $74.99 72 $5,399 $65.42 $4,710 -12.8% SOLD 18-Oct-13
58 26-Jun-13 WLP Wellpoint Healthcare Drug $81.57 $81.57 58 $4,731 $83.80 $4,860 2.7% SOLD 24-Oct-13
59 1-Jul-13 CNC Centene Healthcare $53.06 $53.06 100 $5,306 $60.51 $6,051 14.0% SOLD 24-Oct-13
60 17-Apr-13 OCN Ocwen Financial Financial $44.25 $44.25 113 $5,000 $50.80 $5,740 14.8% SOLD 5-Nov-13
61 11-Oct-13 RMD Resmed Inc. Medical $56.25 $56.25 95 $5,328 $50.90 $4,836 -9.5% SOLD 22-Nov-13

26
Bill Gunderson’s INCOME/GROWTH Model Portfolio
This portfolio is for investors seeking Income along with the possibility of Growth. This is a good
mix for retirees who are seeking a CD alternative-albeit with greater risk. This portfolio
currently has an average yield of 4.2%.
This portfolio is now up 19.80% YTD and 29.97% since its August 5, 2011 inception. This works
out to an annualized rate of 11.60%. Bonds anyone? This is another testament to the
importance of being in the right asset classes!
I added PKG this past week. Cash level in this portfolio is now 1.3%. ACTUAL PORTFOLIOS
MAY VARY depending on start time and actual stock mix.
` Income/Growth Model as of 11/29/13 19.80% *YTD (After Fees) Annualized 0.00%
As of 9:00am 20.51% (Before Fees)
Inception Date August 5, 2011 28.97% Since Inception
*(Net of trading costs and 2% annual mgt fee)-Internally audited.
Add Adj.Buy Beg. Current Current Curr.
Added Symbol Name Sector Price Price Shares Value Price Value G/L Alloc. Yield
1 5-Aug-13 AAPL Apple Computer Technology $468.55 $468.55 9.0 $4,217 $554.95 $4,995 18.4% 3.80% 2.5%
2 14-Dec-12 BME Blackrock Hlth. Science Tr. Medical $29.37 $27.81 122.0 $3,583 $34.14 $4,165 22.8% 3.17% 4.6%
3 8-Mar-13 BTO John Hancock Finl Opp Fd Medical $20.28 $20.28 198.0 $4,015 $23.30 $4,613 14.9% 3.51% 5.6%
4 22-Feb-13 BX Blackstone Group Income-Priv. Eq. $19.03 $19.03 210.0 $3,996 $28.64 $6,014 50.5% 4.58% 4.1%
5 21-Jun-13 CLCT Collector's Universe Misc. $15.83 $15.83 273.0 $4,322 $16.61 $4,535 4.9% 3.45% 8.9%
6 8-Jul-13 DEST Dest ination Maternity Consumer $27.38 $27.38 155.0 $4,244 $30.80 $4,774 12.5% 3.64% 2.4%
7 26-Jun-13 F Ford Motor Auto $15.25 $15.25 250.0 $3,813 $17.12 $4,280 12.3% 3.26% 2.4%
8 5-Apr-13 FUN Cedair Fair Leisure $40.40 $40.40 100.0 $4,040 $50.15 $5,015 24.1% 3.82% 5.7%
9 21-Jun-13 HCSG Healthcare Svcs. Group Healthcare $23.86 $23.86 165.0 $3,937 $29.12 $4,805 22.0% 3.66% 2.7%
10 4-Oct-13 HP Helmerich & Payne Energy $74.08 $74.08 57 $4,223 $77.53 $4,419 4.7% 3.37% 2.8%
11 16-Sep-13 HQH H & Q Healthcare Fund Healthcare $23.86 $23.86 180.0 $4,295 $25.95 $4,671 8.8% 3.56% 7.3%
12 13-Jun-13 JPM J P Morgan Bank $53.80 $53.80 76.0 $4,089 $57.54 $4,373 7.0% 3.33% 2.9%
13 5-Jul-13 KEY Keycorp Bank $11.81 $11.81 347.0 $4,089 $12.80 $4,442 8.4% 3.38% 1.9%
14 4-Nov-13 KKR K K R & Co. Finance $22.77 $22.77 185.0 $4,089 $23.73 $4,390 4.2% 3.34% 1.9%
15 21-Jun-13 KYN Kayne Anderson Mlp Invt. Energy $36.83 $36.83 105.0 $3,867 $37.19 $3,905 1.0% 2.97% 6.8%
16 27-Jun-13 MDP Meredith Corp. Media $48.11 $48.11 81.0 $3,897 $53.26 $4,314 10.7% 3.29% 3.4%
17 21-Oct-11 MMP Magellan Mid. Ptrs. Energy $31.51 $29.39 128 $4,033 $61.97 $7,932 110.9% 6.04% 3.8%
18 3-Oct-13 NM Navios Marit ime Transportat ion $7.48 $7.48 565 $4,226 $7.76 $4,384 3.7% 3.34% 3.2%
19 29-Nov-13 PKG Packaging Corp. of Amer. Consumer $61.66 $61.66 74 $4,563 $61.66 $4,563 0.0% 3.47% 3.2%
20 4-Oct-13 SDRL Seadrill Ltd. Energy $46.51 $46.51 91 $4,232 $42.85 $3,899 -7.9% 2.97% 7.9%
21 26-Apr-13 TAXI Medallion Financial Finance $14.34 $14.34 283.0 $4,058 $17.79 $5,035 24.1% 3.83% 6.0%
22 8-Jun-12 TCAP Triangle Capital Corp. Finance $21.39 $19.68 195.0 $4,171 $28.89 $5,634 46.8% 4.29% 7.4%
23 13-Aug-13 TIS Orchids Paper Products Consumer $27.90 $27.90 150.0 $4,185 $32.68 $4,902 17.1% 3.73% 5.0%
24 9-Mar-12 WES Western Gas Partners Energy $46.62 $44.76 97.0 $4,522 $63.68 $6,177 42.3% 4.70% 3.7%
25 31-May-12 WFC Wells Fargo Bank $41.20 $41.20 98.0 $4,038 $44.20 $4,332 7.3% 3.30% 2.9%
26 8-Jun-12 WHR Whirlpool Corp. Building $150.63 $150.53 30.0 $4,519 $153.18 $4,595 1.8% 3.50% 1.7%
27 27-Jun-13 WLP Wellpoint Inc. Healthcare $81.57 $81.57 48.0 $3,915 $93.09 $4,468 14.1% 3.40% 1.7%
AVG. YIELD 4.2%
Current Tot. Holdings $129,631 98.7%
Current Cash $1,678 1.3%
Current Total Value $131,309 100.0%
End 2012 $109,607
2013 YTD Gain $21,702
2013 YTD Pct. 19.80%
2013 YTD Mgt. Fees $548
2013 YTD Trading Costs $231
2013 Adj. Gain $22,481
2013 Adj. Pct. 20.51%
BEGIN 2012 $106,193
2012 Gain/Loss (Before Fees) $5,679
2012 Gain/Loss Pct. (Before Fees) 5.35%
Fees (since Inception) $548
G/L since inception $30,761
Adj. Pct. (After Fees) 28.97%

27
Notice that there are NO bonds or other interest-rate sensitive investments in my income
portfolio! I got out of them over one year ago. Here is why! Did your advisor get you out
bonds????
Blackstone Group continues to hit new highs and pay a good dividend.
Are we having FUN yet?

28
This dividend portfolio is a very eclectic mix of stocks!
It was raining hard in ‘Frisco, I needed one more fare to make my night…
29
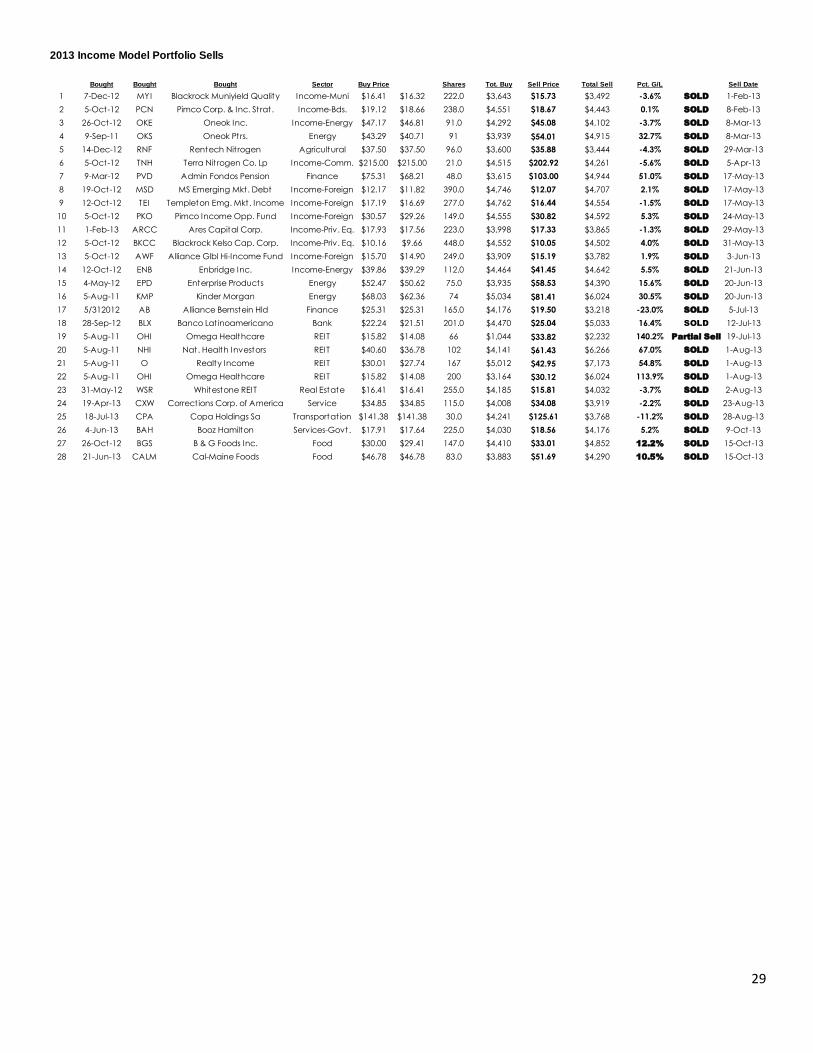
2013 Income Model Portfolio Sells
Bought Bought Bought Sector Buy Price Shares Tot. Buy Sell Price Total Sell Pct. G/L Sell Date
1 7-Dec-12 MYI Blackrock Muniyield Quality Income-Muni $16.41 $16.32 222.0 $3,643 $15.73 $3,492 -3.6% SOLD 1-Feb-13
2 5-Oct-12 PCN Pimco Corp. & Inc. Strat. Income-Bds. $19.12 $18.66 238.0 $4,551 $18.67 $4,443 0.1% SOLD 8-Feb-13
3 26-Oct-12 OKE Oneok Inc. Income-Energy $47.17 $46.81 91.0 $4,292 $45.08 $4,102 -3.7% SOLD 8-Mar-13
4 9-Sep-11 OKS Oneok Ptrs. Energy $43.29 $40.71 91 $3,939 $54.01 $4,915 32.7% SOLD 8-Mar-13
5 14-Dec-12 RNF Rentech Nitrogen Agricultural $37.50 $37.50 96.0 $3,600 $35.88 $3,444 -4.3% SOLD 29-Mar-13
6 5-Oct-12 TNH Terra Nitrogen Co. Lp Income-Comm. $215.00 $215.00 21.0 $4,515 $202.92 $4,261 -5.6% SOLD 5-Apr-13
7 9-Mar-12 PVD Admin Fondos Pension Finance $75.31 $68.21 48.0 $3,615 $103.00 $4,944 51.0% SOLD 17-May-13
8 19-Oct-12 MSD MS Emerging Mkt. Debt Income-Foreign $12.17 $11.82 390.0 $4,746 $12.07 $4,707 2.1% SOLD 17-May-13
9 12-Oct-12 TEI Templeton Emg. Mkt. Income Income-Foreign $17.19 $16.69 277.0 $4,762 $16.44 $4,554 -1.5% SOLD 17-May-13
10 5-Oct-12 PKO Pimco Income Opp. Fund Income-Foreign $30.57 $29.26 149.0 $4,555 $30.82 $4,592 5.3% SOLD 24-May-13
11 1-Feb-13 ARCC Ares Capital Corp. Income-Priv. Eq. $17.93 $17.56 223.0 $3,998 $17.33 $3,865 -1.3% SOLD 29-May-13
12 5-Oct-12 BKCC Blackrock Kelso Cap. Corp. Income-Priv. Eq. $10.16 $9.66 448.0 $4,552 $10.05 $4,502 4.0% SOLD 31-May-13
13 5-Oct-12 AWF Alliance Glbl Hi-Income Fund Income-Foreign $15.70 $14.90 249.0 $3,909 $15.19 $3,782 1.9% SOLD 3-Jun-13
14 12-Oct-12 ENB Enbridge Inc. Income-Energy $39.86 $39.29 112.0 $4,464 $41.45 $4,642 5.5% SOLD 21-Jun-13
15 4-May-12 EPD Enterprise Products Energy $52.47 $50.62 75.0 $3,935 $58.53 $4,390 15.6% SOLD 20-Jun-13
16 5-Aug-11 KMP Kinder Morgan Energy $68.03 $62.36 74 $5,034 $81.41 $6,024 30.5% SOLD 20-Jun-13
17 5/312012 AB Alliance Bernstein Hld Finance $25.31 $25.31 165.0 $4,176 $19.50 $3,218 -23.0% SOLD 5-Jul-13
18 28-Sep-12 BLX Banco Latinoamericano Bank $22.24 $21.51 201.0 $4,470 $25.04 $5,033 16.4% SOLD 12-Jul-13
19 5-Aug-11 OHI Omega Healthcare REIT $15.82 $14.08 66 $1,044 $33.82 $2,232 140.2% Partial Sell 19-Jul-13
20 5-Aug-11 NHI Nat. Health Investors REIT $40.60 $36.78 102 $4,141 $61.43 $6,266 67.0% SOLD 1-Aug-13
21 5-Aug-11 O Realty Income REIT $30.01 $27.74 167 $5,012 $42.95 $7,173 54.8% SOLD 1-Aug-13
22 5-Aug-11 OHI Omega Healthcare REIT $15.82 $14.08 200 $3,164 $30.12 $6,024 113.9% SOLD 1-Aug-13
23 31-May-12 WSR Whitestone REIT Real Estate $16.41 $16.41 255.0 $4,185 $15.81 $4,032 -3.7% SOLD 2-Aug-13
24 19-Apr-13 CXW Corrections Corp. of America Service $34.85 $34.85 115.0 $4,008 $34.08 $3,919 -2.2% SOLD 23-Aug-13
25 18-Jul-13 CPA Copa Holdings Sa Transportat ion $141.38 $141.38 30.0 $4,241 $125.61 $3,768 -11.2% SOLD 28-Aug-13
26 4-Jun-13 BAH Booz Hamilton Services-Govt. $17.91 $17.64 225.0 $4,030 $18.56 $4,176 5.2% SOLD 9-Oct-13
27 26-Oct-12 BGS B & G Foods Inc. Food $30.00 $29.41 147.0 $4,410 $33.01 $4,852 12.2% SOLD 15-Oct-13
28 21-Jun-13 CALM Cal-Maine Foods Food $46.78 $46.78 83.0 $3,883 $51.69 $4,290 10.5% SOLD 15-Oct-13

30
401-K Section (How is your 401k) portfolio doing?
Everyone has different choices to them in their 401-ks. The choices basically fall into several broad categories
however: Large Cap, Mid-Cap, Small-Cap, Govt. Bond, Corp. Bond, Inflation Protected Bond, International,
Emerging Market, and maybes sectors like technology, natural resources, etc.
I have added a number of mutual funds to my Best Stocks Now database that are representative of the various
categories of funds that are available in most 401k plans. I grade them on a daily basis.
If you have a wide selection of mutual funds in your plan, here is my current basic recommendation: This
portfolio is up 30.82% year-to-date (net of all fees and trading costs). No changes this past week. This portfolio is
currently FULLY INVESTED.
Bill Gunderson is a professional fee-based money manager. Gunderson Capital
Management manages hundreds of accounts all across the country. Minimum account size
is $100,000. Annual Mgt. fees are 2% on accounts under $250,000, 1.5%-1.75% on accounts
between $250k and $1 million, and 1% on accounts over $1 million. Call us for a portfolio
evaluation and more info. (855)611-BEST.
To view this past week’s show archives click here
` Mutual Fund Model Portfolio 30.82% (after fees)
11/28/2013 (Close) 31.92% (before fees)
(Net of all Trading Costs and a 2% annual mgt fee-Internally Audited)
Add Add Adjusted Beginning Current Current
Date Symbol Name Sector Price Price Shares Value Price Value G/L Recc. Alloc.
1 31-Dec-12 FBIOX Fidelity Biotech Drug $109.99 $109.99 34.09 $3,750 $178.71 $6,092 62.48% Buy 18.63%
2 13-Sep-13 BUFOX Buffalo Micro-cap Fund Micro-Cap $17.57 $17.57 240.00 $4,217 $19.45 $4,668 10.70% Buy 14.27%
3 31-Dec-12 FBMPX Fidelity Mult imedia Leisure $57.35 $57.35 65.39 $3,750 $79.43 $5,194 38.50% Hold 15.88%
4 15-Mar-13 FSESX Fidelity Selecty Energy Svc. Energy $75.83 $75.83 48.13 $3,650 $84.51 $4,067 11.45% Buy 12.44%
5 31-Dec-12 FSCRX Fidelity Sm. Cap Discovery Small-Cap $24.07 $24.07 207.73 $5,000 $32.09 $6,666 33.32% Buy 20.38%
6 8-Mar-13 FMCSX Fidelity Mid-Cap Stock Mid-Cap $32.78 $32.78 152.53 $5,000 $39.07 $5,959 19.19% Buy 18.22%
HOLDINGS $32,647 99.8%
CASH $58 0.2%
TOTAL ` $32,705 100.0%
Begin 2013 $25,000
Gain/Loss-After Fees $7,705
Pct. G/L (After Fees) ` 30.82%
Fees/Cost $275
Adj. Gain/Loss $7,980
Pct. Gain/Loss 31.92%
2013 Sells
Add Add Adjusted Beginning Current Current
Date Symbol Name Sector Price Price Shares Value Price Value G/L Sell Date
1 31-Dec-12 FHKCX Fidelity China Consumer $30.66 $30.66 81.54 $2,500 $31.77 $2,591 3.62% 8-Mar-13
2 31-Dec-12 FSEAX Fidelity Emg. Asia International $29.89 $29.89 83.64 $2,500 $30.57 $2,557 2.28% 8-Mar-13
4 31-Dec-12 FMKAX Fidelity Emg. Markets International $15.30 $15.30 245.10 $3,750 $14.90 $3,652 -2.61% 15-Mar-13
5 31-Dec-12 FSHOX Fidelity Housing/Const. Building $48.76 $48.76 76.91 $3,750 $54.64 $4,202 12.06% 5-Jul-13
6 5-Jul-12 FSRBX Fidelity Regional Bank Fund Mid-Cap $23.74 $23.74 180.00 $4,273 $24.00 $4,320 1.10% 12-Sep-13
31
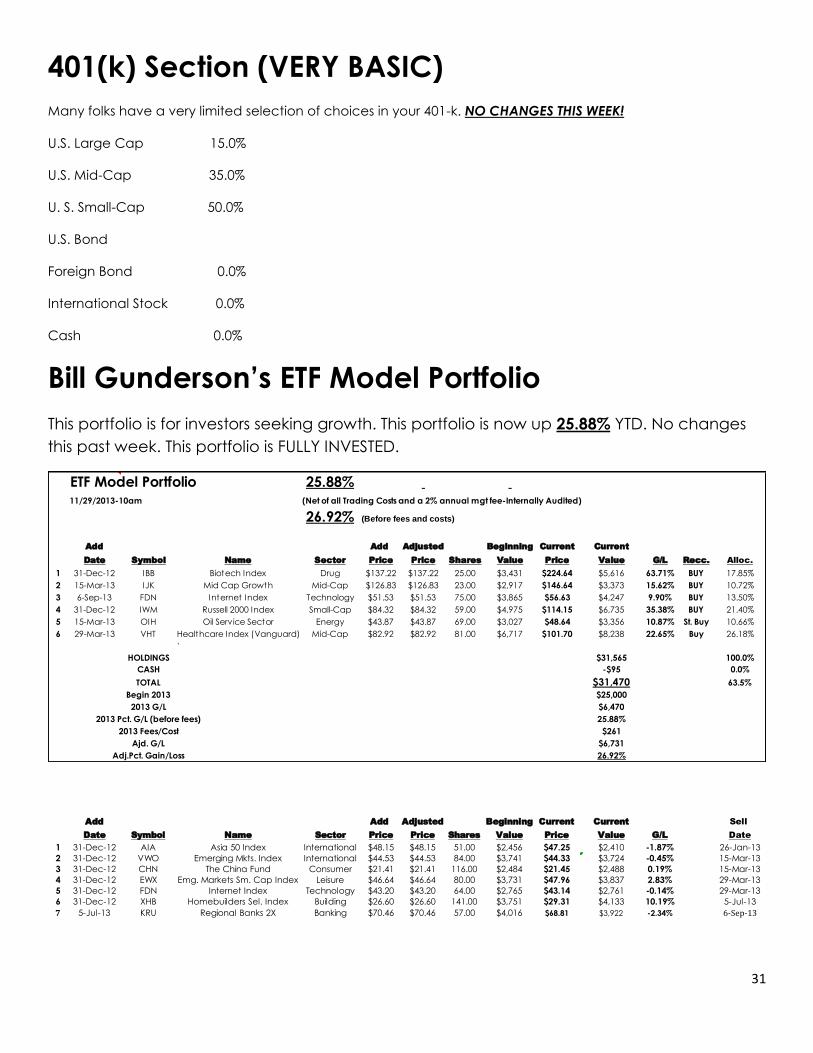
401(k) Section (VERY BASIC)
Many folks have a very limited selection of choices in your 401-k. NO CHANGES THIS WEEK!
U.S. Large Cap 15.0%
U.S. Mid-Cap 35.0%
U. S. Small-Cap 50.0%
U.S. Bond
Foreign Bond 0.0%
International Stock 0.0%
Cash 0.0%
Bill Gunderson’s ETF Model Portfolio
This portfolio is for investors seeking growth. This portfolio is now up 25.88% YTD. No changes
this past week. This portfolio is FULLY INVESTED.
ETF Model Portfolio 25.88%
11/29/2013-10am (Net of all Trading Costs and a 2% annual mgt fee-Internally Audited)
26.92% (Before fees and costs)
Add Add Adjusted Beginning Current Current
Date Symbol Name Sector Price Price Shares Value Price Value G/L Recc. Alloc.
1 31-Dec-12 IBB Biotech Index Drug $137.22 $137.22 25.00 $3,431 $224.64 $5,616 63.71% BUY 17.85%
2 15-Mar-13 IJK Mid Cap Growth Mid-Cap $126.83 $126.83 23.00 $2,917 $146.64 $3,373 15.62% BUY 10.72%
3 6-Sep-13 FDN Internet Index Technology $51.53 $51.53 75.00 $3,865 $56.63 $4,247 9.90% BUY 13.50%
4 31-Dec-12 IWM Russell 2000 Index Small-Cap $84.32 $84.32 59.00 $4,975 $114.15 $6,735 35.38% BUY 21.40%
5 15-Mar-13 OIH Oil Service Sector Energy $43.87 $43.87 69.00 $3,027 $48.64 $3,356 10.87% St. Buy 10.66%
6 29-Mar-13 VHT Healthcare Index (Vanguard) Mid-Cap $82.92 $82.92 81.00 $6,717 $101.70 $8,238 22.65% Buy 26.18%
`
HOLDINGS $31,565 100.0%
CASH -$95 0.0%
TOTAL $31,470 63.5%
Begin 2013 $25,000
2013 G/L $6,470
2013 Pct. G/L (before fees) 25.88%
2013 Fees/Cost $261
Ajd. G/L $6,731
Adj.Pct. Gain/Loss 26.92%
Add Add Adjusted Beginning Current Current Sell
Date Symbol Name Sector Price Price Shares Value Price Value G/L Date
1 31-Dec-12 AIA Asia 50 Index International $48.15 $48.15 51.00 $2,456 $47.25 $2,410 -1.87% 26-Jan-13
2 31-Dec-12 VWO Emerging Mkts. Index International $44.53 $44.53 84.00 $3,741 $44.33 $3,724 -0.45% 15-Mar-13
3 31-Dec-12 CHN The China Fund Consumer $21.41 $21.41 116.00 $2,484 $21.45 $2,488 0.19% 15-Mar-13
4 31-Dec-12 EWX Emg. Markets Sm. Cap Index Leisure $46.64 $46.64 80.00 $3,731 $47.96 $3,837 2.83% 29-Mar-13
5 31-Dec-12 FDN Internet Index Technology $43.20 $43.20 64.00 $2,765 $43.14 $2,761 -0.14% 29-Mar-13
6 31-Dec-12 XHB Homebuilders Sel. Index Building $26.60 $26.60 141.00 $3,751 $29.31 $4,133 10.19% 5-Jul-13
7 5-Jul-13 KRU Regional Banks 2X Banking $70.46 $70.46 57.00 $4,016 $68.81 $3,922 -2.34% 6-Sep-13

32
COMING IN 2014. BILL GUNDERSON LEVERAGED MODEL PORTFOLIO
Will it be BIB, UWM, RETL, DDM, QLD, SAA, TNA, ERX,
KRU, SSO, SPXL, or inverse leveraged etf’s?
ALSO COMING IN 2014. MELISSA’S COLLEGE FUND.

33
Bill Gunderson’s Weekly Top 300 List
This is just an appetizer, here is the main course:

34
Bill Gunderson's One Six Three Two Six One Two One
Best Stocks Now Year Ago Mos. Ago Mos. Ago Mos. Ago Wks. Ago Mo. Ago Wks. Ago Wk. Ago Yest. Current
Top 300 as of 11/29/2013 Rank Rank Rank Rank Rank Rank Rank Rank Rank Rank
A+ BBSI Barrett Business Svcs 1 5 48 24 87 13 8 7 1 1
A+ ALK Alaska Air Group Inc 7 212 81 51 49 104 3 3 9 2
A+ INCY Incyte Corp 195 7 2 3 25 78 55 6 3 3
A+ NUS Nu Skin Enterprises, Inc 582 1 6 13 1 3 1 4 2 4
A+ ILMN Illumina Inc 3 89 151 249 20 8 2 11 18 5
A+ BIIB Biogen Idec Inc 132 243 29 93 43 39 48 30 85 6
A+ SLXP Salix Pharmaceuticals Ltd 120 127 382 145 208 254 156 20 5 7
A+ DAL Delta Air Lines 2597 186 86 7 110 132 5 1 4 8
A+ PRGO Perrigo Co 699 429 318 380 575 149 53 26 7 9
A+ CMN Cantel Medical 43 95 23 1 3 4 22 40 50 10
A+ ANIK Anika Therapeutics Inc 1572 19 65 45 92 88 38 45 72 11
A+ WST West Pharmaceutical Svcs 593 59 189 154 10 12 43 29 23 12
A+ FIZZ National Beverage Corp 1504 1062 1274 1187 1043 895 149 168 53 13
A+ ACHC Acadia Healthcare 0 25 45 35 192 50 9 19 40 14
A+ GILD Gilead Sciences Inc 45 115 35 75 19 35 15 10 10 15
A+ ISIS ISIS Pharmaceuticals Inc 2862 501 74 102 390 529 238 435 21 16
A+ PRIM Primoris Services Corp 1267 500 541 614 708 1104 744 13 11 17
A+ SPLK Splunk 0 298 9 30 199 161 198 69 12 18
A ACET Aceto Corp 179 90 500 267 361 319 167 35 43 19
A DXCM Dexcom 1043 48 83 116 31 115 23 43 28 20
A CRVL Corvel Corp 1286 84 91 41 12 101 111 107 16 21
A ACT Actavis Inc. 117 56 103 114 86 70 13 41 27 22
A RMTI Rockwell Med Tech Inc 2627 1546 549 44 76 98 124 32 19 23
A MNRO Monro Muffler Brake Inc 626 641 872 708 559 246 183 152 49 24
A HIMX HiMax 3058 935 574 577 1743 1694 368 457 100 25
A FIX Comfort Systems USA 1958 823 1352 1157 650 478 10 17 15 26
A BCOR Bluecora 524 269 465 559 595 908 39 36 20 27
A DDD Three D Systems Inc. 169 1894 1259 2080 1635 21 44 166 8 28
A MWIV M W I Veterinary Supply 65 22 278 232 108 207 290 286 334 29
A CP Canadian Pacific Railway 51 334 250 193 59 33 14 9 22 30
A MEOH Methanex Corp 303 166 72 52 173 245 374 57 29 31
A TSCO Tractor Supply Co 160 192 164 46 1044 18 26 22 14 32
A PSMT PriceSmart Inc 144 369 153 182 58 150 184 5 24 33
A AKRX Akorn Inc. 109 57 4 10 27 47 28 129 13 34
A BWLD Buffalo Wild Wings Inc 934 612 241 187 29 188 4 21 6 35
A VFC VF Corp 249 351 350 539 209 170 114 34 25 36
A URI United Rentals Inc 113 211 228 71 50 83 41 99 46 37
A KERX Keryx Biopharmaceuticals 1976 341 277 272 212 228 86 108 33 38
A FELE Franklin Electric Co 570 147 330 302 724 1046 473 337 371 39
A CIR CIRCOR Intl Inc 2463 1040 1539 1177 978 429 71 54 38 40
A PCLN Priceline.com Inc 24 26 73 20 61 71 109 14 17 41
A TYL Tyler Technologies Inc 81 233 259 33 85 5 16 28 26 42
A LNG Cheniere Energy Inc 0 388 11 17 21 10 33 38 31 43
A OPEN Open Table 2672 6 222 773 191 1523 30 82 131 44
A PRFT Perficient Inc 1180 411 702 542 560 2062 764 228 47 45
A HEES H & E Equip. Svcs. 0 1092 714 901 2250 551 20 16 32 46
A TRIP Tripadvisor 0 871 1200 1194 346 121 190 44 57 47
A ELN Elan Corp PLC 2675 432 707 584 416 295 129 100 90 49
A CELG Celgene Corp 154 40 15 25 28 276 201 220 60 50

35
Bill Gunderson's One Six Three Two Six One Two One
Best Stocks Now Year Ago Mos. Ago Mos. Ago Mos. Ago Wks. Ago Mo. Ago Wks. Ago Wk. Ago Yest. Current
Top 300 as of 11/29/2013 Rank Rank Rank Rank Rank Rank Rank Rank Rank Rank
A GPT Gogo Inc. 0 0 0 1990 1800 711 1056 36 51
A SHLO Shiloh Ind Inc 1218 2670 1941 1868 1568 505 745 886 37 52
A CRR Carbo Ceramics Inc 452 602 378 374 228 354 58 46 93 53
A PAM Pampa Energia Sa Adr 2999 892 7 81 18 1294 1877 2312 39 54
A MINI Mobile Mini Inc 544 830 422 298 409 312 144 136 87 56
A AOS Smith AO Corp 15 82 37 42 14 14 27 39 41 57
A PKD Parker Drilling Co 2214 2710 2762 2514 1697 1703 990 72 42 58
A THRM Amerigon Inc 1546 657 309 301 355 148 65 56 44 59
A LII Lennox Internarional Inc 148 267 75 68 139 138 40 23 62 60
A ICON Iconix Brand Group Inc 1833 485 1138 1322 1672 561 64 64 35 61
A CSII Cardiovascular Systems 0 448 1772 1565 81 59 84 106 45 62
A ADS Alliance Data Systems Corp 288 100 110 96 37 54 52 79 81 63
A SFUN Soufun Hldgs. 0 781 1226 1917 2194 1602 1496 786 48 64
A TWC Time Warner Cable Inc 329 1542 1231 2206 1825 1214 1528 1653 63 65
A ENDP Endo Pharm Hldgs Inc 1675 1463 986 1221 1205 1889 618 91 92 66
A BIPIX Profunds Biotech Ultra 86 320 36 76 63 157 212 109 70 67
A RGR Sturm, Ruger & Co. Inc 4 124 51 65 206 80 272 61 59 68
A RLI RLI Corp 418 893 676 855 495 110 173 89 111 69
A NFLX Netflix, Inc 236 64 19 54 11 40 25 36 61 70
A P Pandora Media Inc. 2331 163 38 98 109 106 31 569 52 71
A JACK Jack in the Box Inc 1506 786 2199 1844 1845 2281 474 376 127 72
A NEOG Neogen Corp 46 354 182 89 5 6 18 31 55 73
A PZZA Papa John's International Inc 664 143 348 425 437 58 123 73 56 74
A DAVE Famous Dave's of America Inc 2167 507 670 600 758 612 92 135 67 75
A STN Stantec Inc. 0 0 0 0 0 0 0 51 58 78
A TPL Texas Pacific Land Trust 254 83 1144 656 114 94 174 154 78 79
A ODC Oil-Dri Corp America 869 522 804 530 741 689 794 80 74 80
A WAB Wabtec Corp 344 138 63 15 47 60 96 47 82 81
A WWW Wolverine World Wide Inc 369 148 252 285 306 281 215 226 83 82
A RFIL R F Industries 2851 1116 376 369 95 74 125 130 64 83
A TA TravelCenters America 3112 1814 1280 1454 1597 1505 1184 1140 34 84
A HALO Halozyme Ther. 0 0 0 0 168 195 192 167 66 86
A AIRM Air Methods Corp 217 160 296 196 215 183 159 102 129 87
A BX Blackstone Group 2236 621 166 253 93 32 219 121 68 88
A LECO Lincoln Electric Holdings 272 558 466 437 44 31 24 48 75 89
A ALKS Alkermes Inc 255 187 78 377 362 129 217 63 108 90
A ANDE Andersons Inc 870 141 174 144 290 282 232 316 314 91
A CEMP Avis Budget Group 0 1948 485 62 52 1280 1090 434 158 92
A XTXI Crosstex Energy Inc 2581 1804 830 831 79 42 82 105 102 93
A DYAX Dyax 671 645 666 147 210 82 180 237 113 95
A BMY Bristol-Myers Squibb Co 1702 1524 639 486 485 297 98 117 104 96
A ABC Amerisourcebergen Corp 257 205 109 150 68 67 57 60 73 97
A WTS Watts Water Tech 433 117 111 140 262 193 143 134 112 98
A VASC Vascular Solutions Inc 95 307 403 439 115 144 150 68 115 99
A ODFL Old Dominion Freight Lines 49 81 52 53 133 229 236 157 99 100

36
Bill Gunderson's One Six Three Two Six One Two One
Best Stocks Now Year Ago Mos. Ago Mos. Ago Mos. Ago Wks. Ago Mo. Ago Wks. Ago Wk. Ago Yest. Current
Top 300 as of 11/29/2013 Rank Rank Rank Rank Rank Rank Rank Rank Rank Rank
A UCC Consumer Services Index 2X 713 714 125 172 123 131 206 112 117 101
A DW Drew Ind Inc 308 104 379 119 105 90 47 52 109 102
A IBB Biotech Index 358 254 53 101 196 467 386 216 107 103
A GNE Genie Energy 0 519 1914 1786 1314 420 291 215 104
A GENT Gentium 0 475 737 260 270 12 18 79 105
A ACQ.TOAutocandada 0 0 0 0 53 103 271 447 376 106
A LTS Ladenburg Thalmann 0 0 0 0 1030 642 370 219 80 107
A GMK Gruma SA de CV Adr 2049 586 551 537 488 440 95 174 91 108
A MA Mastercard 97 96 160 184 46 52 139 111 110 109
A ALGT Allegiant Travel 429 218 495 414 179 373 221 178 193 110
A JAZZ Jazz Pharmaceuticals plc 106 11 41 162 67 136 116 27 54 111
A MKTX Marketaxess Hldg. 0 0 0 0 0 0 0 155 101 112
A SNHY Sun Hydraulics 0 550 536 521 451 547 646 714 77 113
A IEX IDEX Corp 235 197 113 104 73 68 59 55 122 114
A JKS Jinksolar Hldg. 2113 72 82 80 106 346 132 175 94 115
A TREX Trex Company Inc 10 556 505 229 397 56 72 128 71 116
A ATRO Astronics Corp 2086 47 25 72 78 84 74 93 84 117
A CERN Cerner Corp 12 278 139 88 4 26 42 49 95 118
A MOG-A Moog Inc. 2055 1407 471 508 498 847 377 373 185 119
A BIB Biotech Sector 2x 1128 358 84 84 342 2414 767 251 140 120
A PCRX Pacira Pharmaceuticals 1131 77 10 16 101 261 550 326 96 121
A SLCA U S Silica Hldgs. 0 854 657 1027 124 142 62 315 118 122
A DUST Goldminers 3X Inverse 3212 1269 1296 3290 2962 3169 1762 97 123
A RNET Altisource Asst. Mgt. 0 0 333 668 664 806 1115 592 144 124
A HQH Heartland Payment Systems 0 145 372 455 516 521 218 125 125
A TRMB Trimble Navigation Ltd 21 1117 226 183 473 134 127 70 124 126
A FRM Furmanite Corp. 3172 1124 1689 1523 1250 1363 365 394 360 127
A AMZN Amazon.com Inc 143 234 267 297 236 44 56 77 154 128
A TASR Taser Intl Inc 825 355 516 490 726 29 50 58 98 129
A YHOO Yahoo! Inc 1749 948 1142 295 298 404 486 184 123 130
A AFSI Amtrust Fin. Svcs. 56 58 171 90 309 396 130 206 130 131
A SM S M Energy Co 1297 894 824 557 472 422 730 754 51 133
A EFN.TOElement Financial Co. 725 195 579 2342 1087 1243 425 105 134
A UDOW DJIA 3X 0 2490 244 1691 802 535 570 270 149 135
A UPRO S & P 500 3X 0 1304 133 337 218 272 285 191 204 136
A CBST Cubist Pharmaceuticals 468 27 148 136 187 407 472 687 408 137
A UNTD United Online Inc 2054 1692 2600 2773 2530 734 951 1174 114 138
A SAVE Spirit Airlines 1612 2860 1803 1846 1518 1108 1449 1548 116 139
A PSIX Power Solutions 0 0 0 0 0 143 63 75 30 141
A EXAM Examworks 0 0 0 0 0 0 1373 977 120 142
A CBM Cambrex Corp 2728 1475 2511 1647 1558 919 302 308 250 143
A DXPE DXP Enterprises Inc 92 108 197 206 177 250 49 94 86 144
A RENT Rentrak Corp 304 1140 569 489 561 443 545 67 139 145
A UHAL Amerco 57 356 402 428 410 398 525 230 134 146
A SNAK Inventure Foods Inc. 0 1026 927 797 801 820 1196 1158 69 147
A VNET Twenty One Vianet 1238 758 1398 1286 1777 1337 1404 1636 344 149
A WINA Winmark Corp 239 165 154 454 466 530 428 485 146 150

37
A SFG StanCorp Financial Grp 1093 884 2046 1573 1370 1321 1232 1217 180 151
A ACIW A C I Worldwide 192 195 273 100 185 348 244 363 424 152
A OTEX Open Text Corp 394 617 600 662 623 451 330 190 157 153
A NXPI N X P Semiconductors 295 103 336 874 149 51 54 90 128 154
A DQ Dago New Energy Corp. 0 1128 232 237 253 209 177 232 132 155
A IEP Icahn Ent. 0 0 0 138 177 178 234 119 156
A CFX Colfax 1482 62 93 188 213 393 303 110 328 157
A YY YY Inc. 0 0 0 0 0 0 0 0 163 158
A SWFT Swift Transportation 0 193 373 85 219 230 321 459 76 159
A HBI Hanes Brands 1181 18 54 134 325 343 179 172 133 160
A NNI Nelnet Inc 60 274 511 209 65 48 60 138 188 161
A MPWR Monolithic Power Systems 852 418 667 783 761 197 250 126 206 162
A DIS Walt Disney Co 867 1657 538 465 270 253 398 339 400 163
A FUL Fuller HB Co 403 891 418 87 64 91 87 98 126 164
A SGMO Sangamo Biosciences Inc 2809 116 529 108 1289 2811 2777 1307 219 165
A UXI Industrials Sector 2X 1910 853 234 220 147 182 231 148 136 166
A DGI Digitalglobe Inc 679 1860 1875 3065 3373 2372 463 173 186 167
A HGR Hanger Orthopedic Grp 265 574 563 375 528 280 347 358 361 168
A PII Polaris Industries Inc 111 73 31 99 134 140 172 208 159 169
A SBUX Starbucks Corp 115 69 120 152 62 73 100 76 161 170
A TAXI Medallion Financial Corp 449 258 283 286 400 410 417 268 162 171
A KRU Banking Sector 2x 2381 299 1266 794 429 721 380 404 244 172
A KKD Krispy Kreme Doughnuts Inc 508 118 560 291 156 192 199 179 247 173
A EPAY Bottomline Technologies 1890 344 827 505 157 116 249 236 190 174
A CCOI Cogent Communications Group 1717 628 1322 1273 901 864 351 467 364 175
A RES RPC Inc 719 470 419 326 38 24 36 66 121 176
A BWS Brown Shoe 833 634 983 1108 1360 1367 758 428 353 177
A MDCO Medicines Co 2415 945 987 759 190 337 289 119 167 178
A RRGB Red Robin Gourmet Burgers 538 305 381 141 169 225 46 53 143 179
A CCIX Coleman Cable 2513 2633 2305 1809 2114 979 283 159 201 180
A ABTL Autobytel 0 1379 545 434 217 256 369 233 274 182
A GNC G N C Holdings 859 43 107 92 241 61 104 78 249 183
A AEIS Advanced Energy Inds 2348 2438 2805 2197 1762 1595 781 608 486 184
A BABY Natus Medical Inc 1396 2196 2858 2998 1428 1186 479 757 208 185
A PCCC PC Connection Inc 2588 1022 975 613 642 102 103 221 168 186
A WETF WisdomTree Investments 1023 1424 1452 869 845 672 766 973 176 187
A PNR Pentair Ltd 1318 201 339 279 364 352 224 120 202 188
A DWRE Demandware Inc. 0 121 243 287 265 367 101 131 148 189
A TQQQ DJIA 3X 0 184 134 95 82 99 146 132 150 190
A UBNT Ubiguiti Networks 1237 712 1258 1125 1304 1196 1402 140 151 191
A NLSN Nielsen Hldgs. 1524 817 595 731 503 96 83 65 103 192
A CTSH Cognizant Tech Sol Cl A 800 353 155 112 120 46 68 116 177 193
A EAT Brinker International Inc 968 1079 2072 2192 1058 921 260 249 196 194
A HXL Hexcel Corp 746 1098 889 810 652 523 117 142 179 195
A KSU Kansas City Southern 443 408 223 292 16 22 34 15 156 196
A PDLI P D L Biopharma 908 1866 1492 2518 2185 1999 1812 209 200 197
A SYNT Syntel Inc 205 383 585 543 658 691 799 1104 297 198
A SKX Skechers USA Inc Cl A 2263 632 1183 1600 1887 1485 921 1057 216 199
A ATHN Athenahealth 1263 569 204 167 6 2 7 8 189 200

38
A DRTX Durata Therapeutics 0 888 1402 768 622 75 2 567 201
A TEN Tenneco Automotive Inc 518 224 268 122 225 204 227 323 147 203
A VRX Valeant Pharmaceuticals Intl 108 2 76 9 8 41 208 362 262 204
A AFFX Affymetrix Inc 3155 1338 1900 1634 784 446 413 488 381 205
A BEAV BE Aerospace Inc 346 161 104 115 131 141 141 151 160 206
A MFRI MFRI Inc 3096 2286 2256 2503 2139 1891 2425 2354 142 207
A ONVO Organonovo Hldgs 0 0 0 0 0 0 0 0 164 208
A- LKQ LKQ Corp 50 35 28 8 13 137 209 103 218 209
A- MCK McKesson Corp 565 768 774 685 396 86 137 115 184 210
A- CBI Chicago Bridge & Iron Co 1031 466 196 165 69 79 106 196 155 211
A- ECL Ecolab Inc 415 450 312 402 205 227 107 118 197 212
A- HVT Haverty Furniture Inc 391 1042 1378 905 1609 922 348 276 194 213
A- WHR Whirlpool Corp 191 276 272 180 547 405 214 183 165 214
A- CMCSAComcast Corp Cl A 138 457 190 215 132 179 235 197 166 215
A- ANAC Anacor Pharm. 431 46 494 55 77 53 305 158 169 216
A- SPR Spirit Aerosystems Hldgs 2696 3052 2873 2726 2448 1718 1478 1345 170 217
A- LOPE Grand Canyon Educaton 0 0 0 0 0 300 306 292 267 218
A- HTHT China Lodging Group 1783 713 2038 2214 1851 1410 128 472 421 219
A- LORL Loral Space 22 151 94 241 345 77 253 199 253 220
A- BA Boeing Co 1426 478 167 191 160 123 112 137 195 221
A- MEG Media General Inc Cl A 3134 1810 1600 979 259 266 322 690 173 222
A- YINN China 3X 0 0 0 0 0 0 0 305 232 223
A- HAR Harman Intl Ind 2611 670 2334 1235 1080 731 223 275 198 224
A- NKE Nike Inc Cl B 312 483 564 469 406 126 118 169 174 225
A- STZ Constellation Brands A 1206 435 147 194 84 92 181 322 137 226
A- TJX TJX Co Inc 153 136 247 225 214 112 152 189 175 227
A- NM Navios 2530 371 246 103 527 169 213 139 141 228
A- ENSG Ensign Group 743 190 136 168 249 257 175 469 213 229
A- ARII American Railcar 475 200 305 210 162 198 81 160 233 230
A- SVA Sinovac Biotech 2797 273 144 113 310 760 394 514 203 231
A- CMG Chipotle Mexican Grill 347 1162 409 312 41 43 37 71 178 232
A- BR Broadridge Financial Solutions 1687 726 1361 963 238 239 160 186 217 233
A- SHPG Shire Pharmaceuticals Grp PLC 1152 579 611 746 508 454 703 828 210 234
A- GLL Gold Buillion Inverse 2X 3047 3404 1943 1982 3405 3297 2197 2390 182 235
A- FN Fabrinet 0 0 1028 1443 2239 186 114 235 236
A- ORBC 0 0 386 1281 1208 1028 830 979 245 259 237
A- EVK Ever-Glory Intl. 0 0 0 124 203 190 1407 866 153 238
A- CVS CVS Corp 936 1589 740 1110 649 420 240 213 240 239
A- LCC US Airways Group Inc 152 931 245 309 125 180 147 185 183 240
A- XTEX Crosstex Energy Lp 0 2458 1814 1174 233 167 239 187 220 241
A- AYI Acuity Brands Inc 485 202 199 86 40 109 94 88 268 242
A- MANH Manhattan Assoc Inc 979 270 525 506 23 16 51 162 187 243
A- ALNY Alnylam Pharmaceuticals 2182 21 30 14 311 653 1107 1255 345 246
A- UAL United Continental Hldgs. 1733 2829 1704 2478 3297 2164 2344 1606 145 248
A- BMRN BioMarin Pharmaceutical 14 259 8 31 556 867 1295 281 264 249
A- FBDIX Franklin Biotech Discovery 708 174 18 61 334 679 1041 495 336 251

39
Bill Gunderson is a professional fee-based money manager. Gunderson Capital
Management manages hundreds of accounts all across the country. Minimum account size
is $100,000. Annual Mgt. fees are 2% on accounts under $250,000, 1.5%-1.75% on accounts
between $250k and $1 million, and 1% on accounts over $1 million. Call us for a portfolio
evaluation and more info. (855)611-BEST.
A- GOOG Google 1228 1734 1727 2357 1460 1116 315 285 333 252
A- MHK Mohawk Ind Inc 878 328 582 411 529 310 361 250 227 253
A- TTC Toro Co 40 167 295 70 89 65 91 225 228 254
A- ALGN Align Tech Inc 767 111 70 177 55 75 73 81 229 255
A- SES.TOSecure Energy Services 2004 1238 1127 965 757 696 948 954 199 256
A- FEIC FEI Co 158 156 100 97 229 205 182 283 230 257
A- TRIB Tri-S Security Corp 700 183 209 59 83 117 188 211 214 258
A- FBIOX Fidelity Biotech 264 210 33 50 175 549 895 497 276 260
A- LOCK 0 0 0 0 1026 2633 1113 61 290 273 262
A- PKG Packaging Corp of America 862 120 173 143 135 63 99 143 287 263
A- FCFS First Cash Financial Services 25 220 200 203 66 105 108 170 269 264
A- RGEN Repligen Corp 256 805 1252 726 2585 1609 937 229 209 265
A- ULTI Ultimate Software 185 12 49 138 164 120 89 62 238 266
A- AMP Ameriprise Financial Inc 1137 126 179 222 128 165 165 240 212 267
A- HLF Herbalife 1329 476 603 752 2243 3105 810 399 332 268
A- LO Lorillard Inc 444 1704 1300 1450 905 688 110 123 356 269
A- OPK Opko Health 0 0 117 4 2 9 32 627 243 270
A- FLT Fleetcor Technologies 58 561 177 218 442 362 189 271 252 271
A- HNH Handy & Harman Ltd. 1409 239 264 341 337 1112 268 329 256 273
A- CLDX Celldex Therapeutics 2104 237 143 109 1075 1335 917 964 299 276
A- RUTH Ruths Hospitality Group 175 1031 2429 1805 1716 1660 1577 446 207 277
A- SAIA Saia Inc. 896 473 363 412 399 277 282 442 221 278
A- DDM DJIA 2X Proshares 2092 1672 426 1351 612 471 433 314 270 279
A- FBT Biotech Index-First Trust 221 442 67 273 403 837 497 203 385 281
A- VRTS Virtus Investment Ptrs. 1022 741 1437 1446 492 176 255 349 272 282
A- INSY Insys Ther. 0 0 0 0 1149 984 696 352 211 283
A- KKR K K & R Co. 0 0 0 0 0 178 102 95 275 284
A- PCYC Pharmacyclics Inc 490 8 3 6 35 414 376 287 358 285
A- LUV Southwest Airlines Co 2633 2193 1691 1507 1926 1622 372 341 261 287
A- CGNX Cognex Corp 1126 134 141 129 388 163 280 364 294 288
A- SSYS Stratasys Inc. 338 45 270 385 142 114 298 164 343 289
A- OILT Oiltanking Ptnrs. 711 564 532 548 847 507 971 50 192 290
A- IHE Pharmaceutical Index 1024 490 404 445 571 697 801 242 330 291
A- UYG Financial Sector 2X 2127 1989 933 1396 910 1134 972 668 477 292
A- ROIA Radio One Inc 3023 1055 837 370 242 224 334 426 265 293
A- TPLM Triangle Petroleum 1690 1518 1308 968 733 1143 1183 1353 225 294
A- SXL Sunoco Logistic Parnters 85 172 425 406 371 45 80 144 236 296
A- ECPG Encore Capital 243 63 224 2 9 28 69 397 308 297
A- IGTE IGate Corp 786 536 780 631 611 491 228 346 295 298
A- TIS Orchids Paper Products 0 132 343 324 234 139 226 304 302 299
A- MHFI McGraw Hill Fin. 0 0 0 1180 981 1120 1212 332 322 300

40
Click HERE to find out how we deploy cash once your account is opened
My Best Stocks Now Radio Hour is heard on the Salem Broadcast Network every weekday.
Check your local affiliate for schedule.
You can listen live to the show on the internet through the station’s websites:
`
Seattle Dallas/Ft.Worth Twin Cities San Francisco Honolulu
Coming Soon! Coming Soon!
Atlanta Tune-In App BSN App Houston Miami
In additon to this we will also download the shows to the radio archives on my website
http://pwstreet.com and send them to iTunes. There is no excuse to not keep up on your
investments!
DON’T BE THIS TYPE OF INVESTOR!!!!!!

41
Bill Gunderson is also columnist for The Street.com, MarketWatch.com, Townhall Finance,
and SeekingAlpha.com.
You can see my recent articles for the TheStreet by clicking here
To see my recent articles for MarketWatch click here
Watch for Bill Gunderson on:

42
Here are snippets on all of the stocks I have talked about on my radio show, and articles that I have written
over the last few months. They are in alphabetical order.
http://pwstreet.com/good-bad-stocks/
To order my book, Best Stocks Now, click the link below:
http://pwstreet.com/book/
To set up and appointment with me, click the link below:
http://pwstreet.com/contact-us/
Come visit me some time!
Subscriptions to this weekly newsletter are $195 per year or $60 per quarter. To subscribe call us at
(855)611-BEST or visit our website at http://pwstreet.com. You can also mail a check to Gunderson
Capital Mgt. 101 W.Broadway #1975 San Diego, CA 92101
THIS REPORT PROVIDES GENERAL INFORMATION AND IS NOT AN OFFER TO BUY OR SELL ANY SECURITY. IT IS THE SOLE OPINION OF THE WRITER, BILL GUNDERSON. BILL GUNDERSON IS PRESIDENT
OF GUNDERSON CAPITAL MANAGEMENT INC. LOCATED AT 101 W. Broadway #1975, San Diego, CALIFORNIA PHONE NO. (855)611-BEST. BILL
GUNDERSON EDITS THE WEEKLY NEWSLETTER. INFORMATION IN THIS NEWSLETTER COMES FROM INDEPENDENT SOURCES BELIEVED TO BE RELIABLE, BUT ACCURACY IS NOT GUARANTEED.
BILL GUNDERSON OR GUNDERSON CAPITAL MGT. INC. HAS NOT VERIFIED THE ACCURACY OF THE INFORMATION PUBLISHED BY THE INDEPENDENT SOURCES. SELECTIONS IN THIS NEWSLETTER ARE
THE SOLE OPINIONS OF BILL GUNDERSON AND ARE SUBJECT TO RISKS AND UNCERTAINTIES BEYOND THE CONTROL OF BILL GUNDERSON AND GUNDERSON CAPITAL MGT. INC. SUCH RISKS AND UN-
CERTAINTIES INCLUDE NATIONAL, INTERNATIONAL, ECONOMIC CONDITIONS AND FLUCTUATIONS; ECONOMIC CONDITIONS OF SPECIFIC SECTORS AND GROUPS AND COMPANIES; MANAGEMENT
CAPABILITIES OF COMPANIES SELECTED. SELECTIONS IN THIS NEWSLETTER MAY NOT YIELD PROFITABLE RESULTS AND MAY ACTUALLY RESULT IN A LOSS OF INVESTMENT CAPITAL. AS AN INVEST-
MENT ADVISOR, BILL GUNDERSON, OR CLIENTS OF GUNDERSON CAPITAL MGT. INC. MAY PURCHASE AND SELL SECURITIES IDENTIFIED EITHER IN THEIR OWN ACCOUNTS OR ACCOUNTS THAT THEY
MANAGE. THEY MAY ALSO BUY OR SELL SECURITIES MENTIONED WITHOUT NOTICE TO NEWSLETTER SUBSCRIBERS. IF YOU HAVE ANY QUESTONS, YOU CAN CONTACT BILL GUNDERSON AT (855)611-BEST