title : 2 a major locus controls a genital shape ... · title : a major locus controls a genital...
TRANSCRIPT

Title :
A major locus controls a genital shape difference involved in reproductive isolation
between Drosophila yakuba and D. santomea
Authors:
Alexandre E. Peluffo*, Isabelle Nuez*, Vincent Debat§, Rosina Savisaar*,1, David L. Stern†
and Virginie Orgogozo*
Affiliations:
*-UMR7592, Institut Jacques Monod, CNRS-Université Paris Diderot/Sorbonne Paris Cité,
75013, Paris, France
§-UMR CNRS/MNHN/UPMC/EPHE 7205, “Institut de Systématique, Evolution et
Biodiversité”, Muséum National d’Histoire Naturelle, 75005 Paris, France.
†-Janelia Research Campus, Howard Hughes Medical Institute, Ashburn, VA 20147,
United States
1-Present address: Department of Biology and Biochemistry, University of Bath, Bath BA2
7AY, United Kingdom.
1
1
2
3
4
5
6
7
8
9
10
11
12
13
14
15
16
17
G3: Genes|Genomes|Genetics Early Online, published on October 28, 2015 as doi:10.1534/g3.115.023481
© The Author(s) 2013. Published by the Genetics Society of America.

Running title:
Major locus for genitalia shape evolution
Key words:
Genitalia, QTL, Drosophila, Shape, Lock-and-Key
Corresponding authors:
Alexandre E. Peluffo
Email: [email protected]
Tel: +33 (0)1 57 27 80 72
Address: UMR7592, Institut Jacques Monod, CNRS-Université Paris Diderot/Sorbonne
Paris Cité, 15 Rue Hélène Brion, 75013, Paris, France
Virginie Orgogozo
Email: [email protected]
Tel: + (33) 1 57 27 80 43
Address: UMR7592, Institut Jacques Monod, CNRS-Université Paris Diderot/Sorbonne
Paris Cité, 15 Rue Hélène Brion, 75013, Paris, France
2
18
19
20
21
22
23
24
25
26
27
28
29
30
31
32
33
34
35

Abstract
Rapid evolution of genitalia shape, a widespread phenomenon in animals with internal
fertilization, offers the opportunity to dissect the genetic architecture of morphological
evolution linked to sexual selection and speciation. Most quantitative trait loci (QTL)
mapping studies of genitalia divergence have focused on D. melanogaster and its three
most closely related species, D. simulans, D. mauritiana, and D. sechellia, and have
suggested that the genetic basis of genitalia evolution involves many loci. We report the
first genetic study of male genitalia evolution between D. yakuba and D. santomea, two
species of the D. melanogaster species subgroup. We focus on male ventral branches, which
harm females during interspecific copulation. Using landmark based geometric
morphometrics, we characterized shape variation in parental species, F1 hybrids and
backcross progeny and show that the main axis of shape variation within the backcross
population matches the interspecific variation between parental species. For genotyping,
we developed a new molecular method to perform multiplexed shotgun genotyping
(MSG), which allowed us to prepare genomic DNA libraries from 365 backcross
individuals in a few days using little DNA. We detected only three QTL, one of which
spans 2.7 Mb and exhibits a highly significant effect on shape variation which can be
linked to the harmfulness of the ventral branches. We conclude that the genetic
architecture of genitalia morphology divergence may not always be as complex as
suggested by previous studies.
3
36
37
38
39
40
41
42
43
44
45
46
47
48
49
50
51
52
53
54
55

Introduction
Male genitalia evolve faster than other organs in animals with internal fertilization
(Eberhard 1985, 2010a). Most explanations of this rapid evolution have involved sexual
selection (Arnqvist 1998, Hosken and Stockley 2004). According to the cryptic female
choice (CFC) hypothesis, male genitalia are thought to evolve to increase the male's
chances of being chosen by females. The sexual antagonist coevolution (SAC) hypothesis
predicts that male genitalia evolve to prevent females from mating with other males. Other
hypotheses not involving sexual selection have been proposed, such as the “lock-and-key”
hypothesis (Dufour 1844, Masly 2012), where male genitalia evolve towards high match
with female genitalia of their own species and high divergence with female genitalia of
other species. Diversified genitalia may play an essential role in speciation, whether acting
at the onset of the lineage splitting process or after speciation to reinforce gene flow
barriers between species (Coyne and Orr 2004, Eberhard 2010a, Masly 2012).
Genitalia provide a unique opportunity to understand the evolution of body shape
in relation to selection and speciation, a key challenge for modern biology (Frankino et al.
2009, Klingenberg 2010). To better understand how genitalia diversify it is important to
characterize their genetic architecture. Surprisingly, few studies have examined the genetic
basis of animal genitalia evolution. Crosses in lab-controlled environments have revealed
significant levels of heritability for genital traits of water striders (Preziosi and Roff 1998),
dung beetle (Simmons and Garcia-Gonzalez 2011) and rainbow fish (Evans et al 2013).
Using genetic markers, quantitative trait loci (QTL) responsible for genitalia evolution
have been identified in only two taxa to our knowledge, carabid beetles and Drosophila
flies. One of the first quantitative trait loci mapping studies focused on the difference in
the male posterior lobe shape between the closely related species D. simulans and D.
4
56
57
58
59
60
61
62
63
64
65
66
67
68
69
70
71
72
73
74
75
76
77
78
79

mauritiana (Liu et al. 1996). Using Fourier contour analysis and 18 genetic markers, the
authors found 9 loci, each spanning approximately 20 cM, whose effects were additive.
With larger sample sizes and twice as many markers, Zeng et al. (2000) confirmed that the
genetic architecture of posterior lobe shape was polygenic, involving at least 19 loci, and
that the effect of each locus was mainly additive, with low epistasis. All but one locus were
associated with phenotypic changes in the same direction (D. simulans alleles associated
with lobe size increase), suggesting that this interspecific difference in shape did not
evolve through genetic drift but through directional selection (Orr 1998). Following in the
footsteps of these landmarks papers, other genitalia QTL mapping analyses examined
different genitalia traits: anal plate size and clasper size between D. simulans and D.
mauritiana (True et al. 1997), multiple genitalia traits between D. simulans and D. sechellia
(MacDonald and Goldstein 1999),genitalia lobe shape variation within D. melanogaster
populations (McNeil et al. 2011, Takahara and Takahashi 2015) and distiphallus shape and
size in distinct lines of D. montana (Schäfer et al. 2011). Recently, in a QTL mapping study
between D. mauritiana and D. simulans, Tanaka et al. (2015) found three loci for male
clasper bristle number and three loci for male clasper size; epistatic interactions were
found for male clasper bristle number, but not for male clasper size. Altogether, these
studies found that the genetic architecture of genitalia shape evolution involves multiple
loci displaying little epistasis (Orr 2001).
In contrast, a recent QTL analysis between two closely related species of carabid
beetles reported that only a few loci determine the difference in length, width and weight
of the male copulatory piece (Sasabe et al. 2010). Because all the other QTL studies of
animal genitalia have focused on the four species of the D. melanogaster complex (D.
melanogaster, D. simulans, D. sechellia and D. mauritiana), besides the study of Schäfer et al.
5
80
81
82
83
84
85
86
87
88
89
90
91
92
93
94
95
96
97
98
99
100
101
102
103

(2011) on D. montana, the results that genitalia architecture is controlled by many additive
loci may not be a general rule. Moreover, the studies performed on the D. melanogaster
complex have mainly focused on posterior lobe shape even though its link with
reproductive isolation and adaptive evolution continues to be debated. A recent study has
suggested that although the lobe itself is important for mating, its shape variation within
and across species does not appear to be linked to reproductive isolation or sexual
selection (LeVasseur-Viens et al. 2015).
Here, we perform the first QTL mapping of genitalia divergence between D. yakuba
and D. santomea, and we focus on a trait that has been linked to reproductive success, the
shape of the ventral branches. The yakuba complex (D. teissieri, D. yakuba and D. santomea)
is closely related to the well studied melanogaster complex (David et al. 2007). D. yakuba and
D. santomea can be crossed to generate fertile F1 females, and several studies have
performed genetic analysis of phenotypic differences between these species (Coyne et al.
2004, Rebeiz et al. 2009, Cande et. al. 2012). D. yakuba is found on the African continent,
while D. santomea is endemic to the island of Saõ Tomé (Lachaise et al. 2000, David et al.
2007). Their evolutionary divergence is estimated to have occurred 0.5 million years ago
through the migration of ancestral D. yakuba to the island of Saõ Tomé (Llopart et al.
2005a). Current Saõ Tomé populations of D. yakuba are thought to have been reintroduced
very recently on the island and are found in the low, drier and inhabited lands whereas D.
santomea lives in the misty forest of the high-lands (Lachaise et al. 2000). Both species can
be found at mid altitudes and hybrids have been collected (Lachaise et al. 2000, Llopart et
al. 2005a, Llopart 2005b). Multiple reproductive isolating mechanisms have been identified
between the two species: genetic incompatibilities (Coyne et al. 2004, Moehring et al. 2006),
ecological niche divergence (Matute et al. 2009), and behavioral and physiological
6
104
105
106
107
108
109
110
111
112
113
114
115
116
117
118
119
120
121
122
123
124
125
126
127

differences (Matute 2010, Cande et al. 2012).
One of the reproductive isolating mechanisms between D. yakuba and D. santomea
involves a difference in ventral branches shape in the male genitalia and is the most
conspicuous difference in genitalia morphology between males of the two species
(Lachaise et al. 2000). In D. yakuba, spiny ventral branches located above the aedaegus (i. e.
the insect phallus, see Figure 1A, C) insert inside female protective pouches during
mating. In D. santomea, the male spines (Figure 1B) and female pouches are absent
(Kamimura and Mitsumoto 2012a, Kamimura 2012, Yassin and Orgogozo 2013). These
structures play important roles during mating. For example, Kamimura and Mitsumoto
(2012a) observed that D. santomea females mated with D. yakuba males possessed
significantly more wounded pouches than unmated females or females that had mated
with conspecific D. santomea males. Moreover, the wounds were found bilaterally, strongly
suggesting that the damage was caused by the pair of spines on D. yakuba male genitalia. It
is not yet known if the spines and pouches play a role in intraspecific sexual selection.
Recent QTL mapping studies have greatly benefited from the development of next-
generation sequencing technologies. One such technique, Multiplexed Shotgun
Genotyping (MSG) is a rapid and low cost method for genotyping hundreds of individuals
at multiple genomic loci using as little as 10 ng of DNA (Andolfatto et al. 2011) compared
to 1 µg for the Restriction-site Associated DNA (RAD) approach of Baird et al. (2008) and
100 ng for double digest RAD (Peterson et al. 2012). MSG infers, through a Hidden Markov
Model, ancestry of chromosomal regions using DNA sequences distributed randomly
throughout the genome in each individual. In contrast, RAD relies on the sequencing of
the same sites in all individuals. We report in this paper a new protocol that allows
preparation of MSG libraries in approximately one-third the time of the original protocol.
7
128
129
130
131
132
133
134
135
136
137
138
139
140
141
142
143
144
145
146
147
148
149
150
151

Here we characterized the genetic basis of the shape divergence in male ventral
branches between D. yakuba and D. santomea using F1 hybrids and QTL mapping in a
backcross population. We used landmark-based geometric morphometrics to measure the
shape of the ventral branches. We identified three loci, accounting for 29%, 14% and 9% of
the main shape difference between species.
8
152
153
154
155
156

Materials and Methods
Fly stocks
The D. yakuba yellow[1] line #14021-0261.05 was obtained from the San Diego Species Stock
Center. The D. santomea SYN2005 strain was made by mixing six isofemale lines collected
by Jerry A. Coyne in the zone of sympatry with D. yakuba in January 2005 (Matute et al.
2009). To confirm that these strains produce genitalia with ventral branches typical of each
species, we collected D. santomea and D. yakuba females from São Tomé Island in February
2015 and observed that the first or second generation male progeny from these females
had genitalia that were qualitatively similar to the strains used for genetic mapping. All
flies were cultured on standard cornmeal-agar medium at 25°C in uncrowded conditions.
Parental strains and crosses
D. yakuba yellow[1] and D. santomea SYN2005 males that were less than three days old were
collected for genitalia dissection after being reared for at least two generations at 25°C in
uncrowded conditions. D. yakuba yellow[1] virgin females were crossed en masse to D.
santomea SYN2005 males to generate F1 hybrids. F1 hybrid females were subsequently
mated to D. santomea SYN2005 males to generate backcross males used in QTL mapping.
Individual flies were frozen at -80°C for a week to a year before dissection.
Phenotyping
To optimize mounting and obtain reliable landmark configurations, male genitalia were
dissected in 1x PBS and positioned wet on the glass slide and slightly air-dried so that they
could stick to the slide before adding DMHF (Dimethyl Hydantoin Formaldehyde)
9
157
158
159
160
161
162
163
164
165
166
167
168
169
170
171
172
173
174
175
176
177
178
179
180

mounting medium (available at Entomopraxis) and a cover slip. We then kept only those
dissections where the entire internal genitalia was mounted and where the plane of the
ventral branches was parallel to the slide. Pictures centered on the ventral branches were
taken at 400x magnification with an Olympus IX83 research inverted microscope or a Zeiss
Axio Observer.Z1 inverted microscope.
Morphometric analyses
For each male, landmarks were manually positioned on the pictures of the ventral
branches (Figures 1B'-F') using the software tpsDIG2 version 2.1 (Rohlf 2006) and
compiled in a .tps file as a set of five x,y coordinates (forming one configuration). With the
full set of configurations (File S1) we performed a full generalized Procrustes analysis
(GPA) using the function “procGPA” of the R package “shapes” (version 1.1-9) written by
I. L. Dryden and available on the CRAN (http://cran.r-project.org). This function
performs an optimized superimposition of the configurations using translation, rotation
and scaling and then a principal component analysis on the Procrustes tangent space
coordinates (Dryden and Mardia 1998). The generalized Procrustes analysis was carried
out on the backcross progeny dataset only (n = 365) or on the full dataset (n = 507)
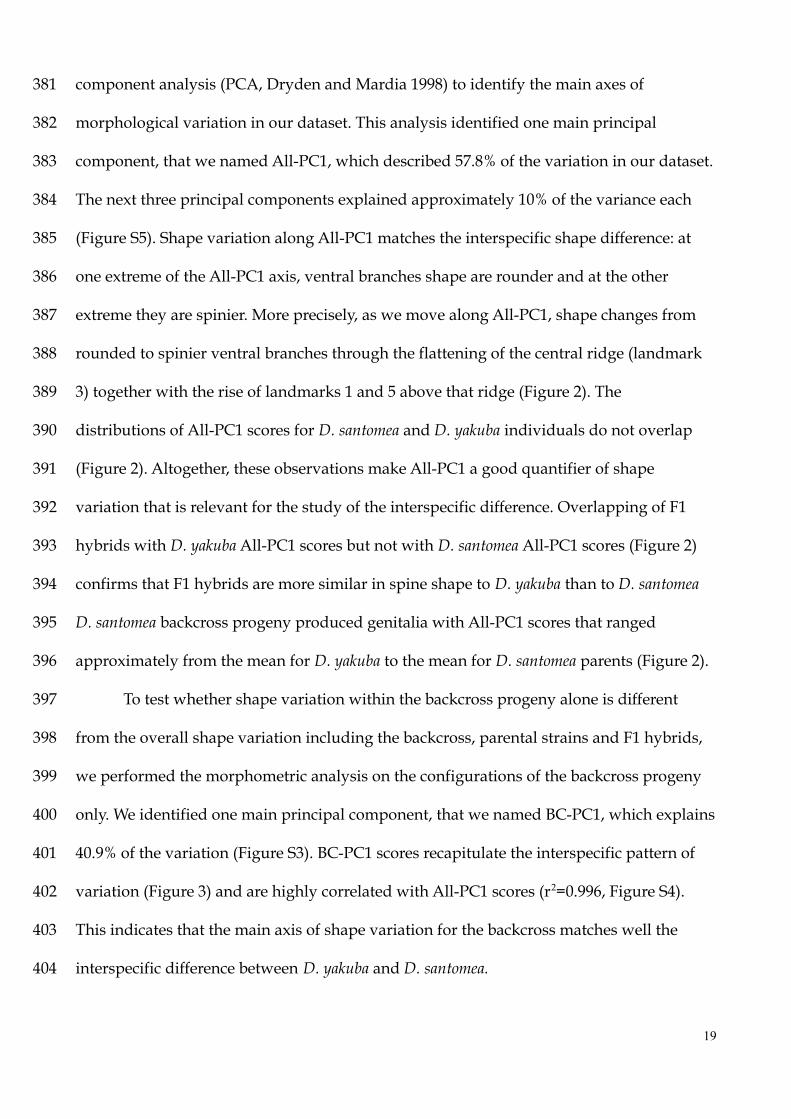
comprising parents (n = 48 D. santomea, 46 D. yakuba), F1 hybrids (n = 48) and BC progeny
(n = 365). Resulting files are available as supplementary data (Files S2-4). Spine thrust -
that is how much spines are elevated above the middle of the ventral branches - is
computed as the maximum of the y coordinate for landmarks 1 and 5 minus the y
coordinate of landmark 3, when the x-axis is defined as the axis passing by landmarks 2
and 4 and oriented from 2 to 4, and with the y axis defined so that (x,y) is an oriented
orthonormal basis (Figure S1, File S5).
10
181
182
183
184
185
186
187
188
189
190
191
192
193
194
195
196
197
198
199
200
201
202
203
204

Measurement precision
Repeatability of landmark configuration acquisition (i.e. measurement error) was assessed
as follows: genitalia of 22 dissected D. santomea SYN2005 individuals were mounted on
slides five times and photographed. Landmark acquisition was performed on the five
distinct images for each individual. All configurations (File S6) were superimposed using a
generalized Procrustes analysis (as detailed above). The resulting tangent coordinates
(Figure S2) of the 22 individuals x 5 sessions were analyzed using the procD.lm function
from the R “geomorph” package version 2.1.2 (Adams and Otarola-Castillo 2013). Briefly,
this function performs a Procrustes ANOVA (Goodall 1991, Klingenberg and McIntyre
1998) over the coordinates from each configuration and quantifies the amount of variation
attributable to the individual and the session factors in the following linear model: tangent
coordinates ~ individual + session.
Genotyping
After removal of the genitalia, the body of each male was placed in a 1.5 ml Eppendorf
tube and crushed with a manual pestle in 180 uL of Qiagen Tissue Lysis buffer. DNA was
extracted using a Qiagen Dneasy® Blood & Tissue extraction kit (cat# 69506). After
extraction, DNA was kept at -80°C before proceeding with genotyping. For genotyping we
used a new protocol (Figure S3, File S7) to prepare Multiplexed Shotgun Genotyping
(MSG) libraries. The original method described in Andolfatto et al. (2011) for making MSG
libraries involves fragmentation of genomic DNA with restriction enzymes and ligation of
linkers containing inline indexes to each sample. This method is reliable, but involves
many steps and takes several days to generate a library. Our new method, called Whole
11
205
206
207
208
209
210
211
212
213
214
215
216
217
218
219
220
221
222
223
224
225
226
227
228

Genome Amplification using Manta Polymerase with Degenerate Primers (WMD), allows
preparation of libraries from many low mass DNA samples quickly and with fewer steps.
In the first step, a nicking endonuclease is used to generate single-stranded nicks in the
DNA template (Figure S3). These nicks generate 3’ termini that are suitable substrates for
DNA polymerases possessing strong processivity and strand displacement activity, such as
Bst polymerase (large fragment), phi29 polymerase, or Sequenase 2.0 (Joneja et al. 2011).
We use the Bst polymerase (large fragment) provided by Enzymatics called Manta
polymerase. In an isothermal reaction, the single-stranded DNA generated by the strand-
displacement activity of Manta polymerase serves as a template for oligonucleotides
containing, from 5’ to 3’: an adaptor sequence, an index of variable length, and a 3’ 12 bp
partially degenerate sequence (Figure S3a). This primer contains a 5’ 18-atom hexa-
ethyleneglycol spacer to prevent self-priming (Brukner et al. 2005). The 3’ partially
degenerate sequences serve as new primers for the Manta polymerase. Since multiple
oligonucleotides can prime the same strand of DNA, polymerization events located 5’ will
displace primed sequences located 3’. These freed single-stranded fragments then serve as
templates for additional primers. DNA synthesis from these primers ultimately generates
fragments containing primer sequences at both ends, which provide the templates for
library preparation with later PCR steps using the adaptor sequences as priming sites
(Figure S3b). In the second step of WMD-MSG, samples with different indexes introduced
during the initial step are pooled and subjected to polymerase chain reaction with
oligonucleotides containing, from 5’ to 3’: a sequence compatible with the adaptors for one
of several DNA next-generation sequencing platforms, a second DNA index, and a
sequence complementary to the adaptors introduced in the first step (Figure S3c). This
dual indexing protocol can provide extremely high levels of multiplexing. Sometimes,
12
229
230
231
232
233
234
235
236
237
238
239
240
241
242
243
244
245
246
247
248
249
250
251
252

WMD-MSG leads to unacceptably high dropout of samples when very large numbers of
samples (>500) are processed in a single library. Future optimization of the WMD-MSG
protocol may allow improved normalization of read counts among samples, although the
current performance of the protocol was sufficient for our study of 384 individuals. A
detailed protocol for WMD-MSG is provided as Supplementary Material.
The WMD-MSG library was sequenced on an Illumina HiSeq 2500 and the fastq
sequence file was analyzed directly with the MSG software, which has been updated to
parse fastq files that contain WMD-MSG barcodes (github.com/JaneliaSciComp/msg). In
total, 189,819,468 reads were collected for 384 individuals, among which 365 had reliable
phenotypic data. The two species parental genomes used in MSG were prepared by
reducing the level of intraspecific polymorphism by applying the script
DisambiguateGenomes.py (github.com/dstern/DisambiguateGenomes) sequentially to
genomes updated with whole genome sequencing Illumina reads from three strains of D.
yakuba and three strains of D. santomea. The D. yakuba reference genome which we updated
is dyak-all-chromome-r1.3 available from FTP at Flybase (strain Tai18E2). For D. yakuba,
we used reads from D. yakuba Ivory Coast (San Diego Species Stock Center #14021-0261.00,
data from Cande et al. 2012), D. yakuba yellow[1] (San Diego Species Stock Center #14021-
0261.05, sequenced by BGI, this study) and D. yakuba white[1] (San Diego Species Stock
Center #14021-0261.02). For D. santomea, we used reads from D. santomea STO-LAGO1482
(collected by Daniel Lachaise in 2001 on São Tomé island at altitude 1482), D. santomea
STO.4 (San Diego Species Stock Center #14021- 0271.00, data from Cande et al. 2012) and
D. santomea SYN2005 (sequenced by BGI, this study). The resultant posterior probabilities
of ancestry (“soft genotypes”) were thinned to informative markers using the script
pull_thin_tsv.py (https://github.com/dstern/pull_thin, Files S8-9). Markers were
13
253
254
255
256
257
258
259
260
261
262
263
264
265
266
267
268
269
270
271
272
273
274
275
276

considered informative when the conditional probability of being homozygous differed by
more than 0.05 from their neighboring markers.
QTL Mapping
QTL mapping was performed using R/qtl (Broman et al. 2003, Broman and Sen 2009, File
S10) package version 1.32-10. Briefly, the principle of QTL mapping is to correlate
segregating genetic markers with trait values in order to identify chromosome regions that
significantly affect the phenotype of interest, here the shape of the ventral branches, when
substituting a D. santomea allele for a D. yakuba allele. Posterior genotype probabilities,
estimated directly by the Hidden Markov Model implemented in MSG, were imported
into R-qtl as a “cross” object using the R function read.cross.msg
(https://github.com/dstern/read_cross_msg). In our D. santomea backcross population
we did not find significant departure from the expected distribution of 50% of D. santomea
alleles and 50% D. yakuba alleles at each marker position. For all traits (BC-PC1, All-PC1,
centroid size, spine thrust, see Results and Discussion for details), we performed genome
scans with a single QTL model (“scanone”) using the Haley-Knott regression method
(Haley and Knott 1992), which performs well with datasets having high genotype
completion (Broman and Sen 2009). We determined genome-wide statistical significance
using 10,000 permutations (Churchill and Doerge 1994). Two QTL peaks above the 1%
significance threshold were detected. Both QTL were incorporated into a multiple QTL
model using the “fitql” function and we tested for possible interactions between loci. To
refine the position of the QTL in the multiple-QTL model, we used the function “refineqtl”,
which uses an iterative algorithm to scan neighboring sites for higher LOD (logarithm of
odds) score values, taking into account the already found loci (Broman and Sen 2009).
14
277
278
279
280
281
282
283
284
285
286
287
288
289
290
291
292
293
294
295
296
297
298
299
300

Having obtained a first refined model with two QTL, we used the function “addqtl” in
order to detect additional QTL. A third QTL was thus found and introduced in a new
multiple model, refined and fitted to account for interactions. Based on the full three QTL
model, we did not find any significant additional QTL with the function “addqtl”: the
highest LOD score for a fourth QTL reached only 2.35. We computed the LOD score of the
full three-QTL-model, the percentage of variance explained by genetic variation at each
locus, and estimated effects of each locus (Broman and Sen 2009). The 2-LOD intervals
were calculated using the “lodint” function with parameter drop of 2. QTL effects are
defined as the effect caused by the replacement of a D. santomea allele by a D. yakuba allele.
These effects are given either as absolute values, that is the increase in BC-PC1 values, or
as a percentage of the parental species difference, that is as a percentage of the species
difference for X-linked QTL and as a percentage of half of the species difference for
autosomal QTL (as in MacDonald and Goldstein 1999). To calculate the relative effect, the
BC-PC1 absolute effect value was converted into an All-PC1 effect value using the
following linear model: All-PC1 effect = 1.143 * BC-PC1 effect – 0.62 (formula of the
correlation slope between BC-PC1 and All-PC1, Figure S4) and the parental difference was
calculated as the difference in means of All-PC1.
Data availability
All reagents and strains are available on request. Supplementary files, including genotypic
and phenotypic data are available for download in the G3 journal supporting information
section associated to this article. File S1 contains the x,y coordinates of the landmark
configurations of all individuals (D. santomea, D. yakuba, F1 hybrids and D. santomea
backcross progeny). Files S2, S3, S4 and S5 contain the All-PC1 scores, BC-PC1 scores,
15
301
302
303
304
305
306
307
308
309
310
311
312
313
314
315
316
317
318
319
320
321
322
323
324

centroid size and “spine thrust” measures used for QTL mapping. File S6 contains the x,y
coordinates of the landmark configurations of the 22 D. santomea individuals assessed for
measurement precision. The WMD-MSG detailed protocol including primer sequences is
available as a PDF in file S7. File S8 contains ancestry estimates for the D. santomea
backcross after application of the Hidden Markov Model. File S9 contains ancestry
estimates for the D. santomea backcross after application of the Hidden Markov Model and
thinning to include only neighboring markers whose conditional probability differed by at
least 0.05. The QTL mapping script is provided in .R format in file S10.
16
325
326
327
328
329
330
331
332

Results and Discussion
The most conspicuous difference in genital morphology that has been reported between D.
yakuba and D. santomea is the shape of the ventral branches that cover the aedeagus
(Kamimura and Mitsumoto 2012a, Kamimura 2012, Yassin and Orgogozo 2013). We
examined ventral branches shape in two lines, D. yakuba yellow[1] and D. santomea
SYN2005. As previously described for other strains (Kamimura and Mitsumoto 2012a,
Kamimura 2012, Yassin and Orgogozo 2013), we found spiny ventral branches in D. yakuba
and no such spines in D. santomea males (Figures 1A-C). To identify the genetic loci
underlying this genital difference, we developed a method to measure the shape of the
ventral branches in a quantitative manner and used it for QTL mapping in a D. santomea
backcross population.
A reliable quantitative measure for ventral branches shape
Previous genetics studies of genitalia shape have quantified shape variation using elliptic
Fourier analysis, which relies on organ outlines (Kuhl and Giardina 1982, Ferson et al.
1985) and decomposes contours into a series of harmonics that can be described by their
coefficients, the Fourier coefficients. In our case, the point at which the ventral branches
emerge from the aedeagus was difficult to locate reliably, making it impractical to define
the ventral branch contour and to use outline-based methods of shape decomposition,
such as elliptic Fourier analysis. Therefore, we used a geometric morphometric approach
based on landmarks. On the ventral branches we found only five landmarks that were
unambiguously comparable between males; these corresponded to ventral branch contour
discontinuities at the distal end of the genital structure. We used these five landmarks to
quantify precisely and accurately the shape of the ventral branches (Figure 1). These
17
333
334
335
336
337
338
339
340
341
342
343
344
345
346
347
348
349
350
351
352
353
354
355
356

landmarks, although not documenting the shape of the ventral branches at their base,
where they emerge from the aedeagus, allowed us to describe and quantify the shape of
the distal end of the ventral branches, and especially the relative length and width of the
spines in order to identify the main axes of shape variation in our QTL mapping
population.
For each individual we manually positioned a series of five landmarks, forming
one configuration (Figures 1B'-F'). We then tested whether landmark acquisition and
therefore shape characterization was robust to the mounting and acquisition process. Five
sessions of mounting and unmounting of internal genitalia followed by landmark
acquisition for the same 22 D. santomea individuals showed no effect of the session on the
landmark configuration (F = 3.38, P > 0.05, Procrustes-ANOVA) and yielded very similar
configurations (Figure S2). We concluded that our quantitative measure of ventral
branches shape is reproducible and appropriate for QTL mapping.
The main axis of variation in the backcross matches the interspecific difference.
We crossed D. yakuba females with D. santomea males to generate F1 hybrid males. In these
hybrids the spine shapes were qualitatively more similar to D. yakuba than to D. santomea
(Figures 1B-D), suggesting that D. yakuba alleles display stronger dominance for spine
shape. Therefore, we decided to perform a QTL mapping on a D. santomea backcross
population, rather than on a D. yakuba backcross population or on a combination of both
backcrosses. We analyzed individual landmark configurations from D. santomea parents,
D. yakuba parents, F1 hybrids and backcross progeny altogether by performing a
Procrustes superimposition (Gower 1975, Rohlf and Slice 1990).
From the superimposition of all configurations, we performed a principal
18
357
358
359
360
361
362
363
364
365
366
367
368
369
370
371
372
373
374
375
376
377
378
379
380
component analysis (PCA, Dryden and Mardia 1998) to identify the main axes of
morphological variation in our dataset. This analysis identified one main principal
component, that we named All-PC1, which described 57.8% of the variation in our dataset.
The next three principal components explained approximately 10% of the variance each
(Figure S5). Shape variation along All-PC1 matches the interspecific shape difference: at
one extreme of the All-PC1 axis, ventral branches shape are rounder and at the other
extreme they are spinier. More precisely, as we move along All-PC1, shape changes from
rounded to spinier ventral branches through the flattening of the central ridge (landmark
3) together with the rise of landmarks 1 and 5 above that ridge (Figure 2). The
distributions of All-PC1 scores for D. santomea and D. yakuba individuals do not overlap
(Figure 2). Altogether, these observations make All-PC1 a good quantifier of shape
variation that is relevant for the study of the interspecific difference. Overlapping of F1
hybrids with D. yakuba All-PC1 scores but not with D. santomea All-PC1 scores (Figure 2)
confirms that F1 hybrids are more similar in spine shape to D. yakuba than to D. santomea
D. santomea backcross progeny produced genitalia with All-PC1 scores that ranged
approximately from the mean for D. yakuba to the mean for D. santomea parents (Figure 2).
To test whether shape variation within the backcross progeny alone is different
from the overall shape variation including the backcross, parental strains and F1 hybrids,
we performed the morphometric analysis on the configurations of the backcross progeny
only. We identified one main principal component, that we named BC-PC1, which explains
40.9% of the variation (Figure S3). BC-PC1 scores recapitulate the interspecific pattern of
variation (Figure 3) and are highly correlated with All-PC1 scores (r2=0.996, Figure S4).
This indicates that the main axis of shape variation for the backcross matches well the
interspecific difference between D. yakuba and D. santomea.
19
381
382
383
384
385
386
387
388
389
390
391
392
393
394
395
396
397
398
399
400
401
402
403
404

In most morphometric QTL studies, phenotypic variation is distributed amongst
multiple principal components, suggesting that individual QTL would have mainly small
effect and alter the phenotype in directions that do no necessarily match the shape
variation between parental strains. In our study we identified a major principal
component that explains a relatively large part of the shape variation in our QTL mapping
population, which is rare in genitalia evolution QTL studies (Liu et al. 1996, McNeil et al.
2011, Takahara and Takahashi 2015).
In conclusion, we found one major principal component, BC-PC1, which explains
most of the shape variation in the backcross progeny and which corresponds to the
interspecific spine shape difference between D. yakuba and D. santomea.
A new method for genotyping a high number of markers rapidly and efficiently
High throughput sequencing libraries were prepared from single flies and low
concentration DNA, with little hands-on time in less than one day, using an improved
method of Multiplexed Shotgun Genotyping (MSG), which we report here. This new
procedure, Whole genome amplification using Manta polymerase with Degenerate
Primers (WMD-MSG), relies on the strength of the previously published MSG genotyping
technique (Andolfatto et al. 2011) and introduces a fast and efficient library preparation
protocol which relies on a nicking enzyme followed by amplification with a strand
displacement activity polymerase (Figure S3). The two-step library preparation protocol
uses two sets of barcodes, allowing high multiplexing with a small number of primers. In a
matter of a few days, we genotyped 384 backcross progeny individuals and obtained a
total of 511 234 markers genome-wide, including 4499 informative markers.
One narrow locus on chromosome 3L explains interspecific shape variation
20
405
406
407
408
409
410
411
412
413
414
415
416
417
418
419
420
421
422
423
424
425
426
427
428
429

An initial genome scan for ventral branch shape (BC-PC1) yielded two significant QTL,
one on chromosome X and one on chromosome 3 (Figure 4). To check for additional QTL,
we built a multiple QTL model with these two QTL and scanned for additional QTL taking
these two QTL into account (see Material and Methods). Having found an additional QTL
on chromosome 2, we built a refined multiple-QTL model and checked for epistatic
interactions between these three QTL (Broman and Sen 2009). This three-QTL model gave
a LOD score of 25.5 and explained 28% of the variance in our backcross population (Table
1). A search for a fourth QTL did not detect any other significant QTL. Our analysis did not
reveal any epistatic interactions between the three loci. In summary, QTL mapping of BC-
PC1 in the backcross progeny revealed three QTL: one narrow LOD peak on chromosome
3L with a maximum LOD score of 17.0, another locus on chromosome 2L (LOD = 4.9) and
a wider region on chromosome X (LOD = 6.14) (Table 1). The LOD scores for all three
peaks exceeded a statistical significance threshold of P < 0.01. QTL mapping of All-PC1
yielded the same three QTLs (Figure S6).
The shape difference that we have mapped could be linked to a difference in ventral
branches size. For example, individuals with a D. yakuba-like spiny shape could have
bigger ventral branches than individuals with a D. santomea-like rounded shape. In this
case, the species difference would mainly reflect a difference in organ size rather than
shape. In our study, we find that centroid size of ventral branches configurations is not
correlated to BC-PC1 (r2 = 0.06, Figure S7) and does not map to any QTL (Figure S8). This
suggests that the QTL we identified with BC-PC1 and All-PC1 are QTL of shape and not
size.
Based on 2-LOD intervals, the major QTL on chromosome 3 corresponds to a small
region of 2.67 Mb with an estimated number of 338 genes in the D. yakuba genome This
21
430
431
432
433
434
435
436
437
438
439
440
441
442
443
444
445
446
447
448
449
450
451
452
453

major QTL has the strongest effect on the variation in shape in the backcross population.
Indeed, we find that the mean BC-PC1 score of heterozygous individuals is increased by
8.88 (28.6% of the mean parental species difference), compared to homozygous individuals
from the mapping population, implying that substitution of one D. santomea allele for a D.
yakuba allele, at this locus, increases the BC-PC1 score by a third of the species difference in
shape quantified by our morphometric analysis (Figure 5, Table 1). The QTL on
chromosome X covers s to a region of 10 Mb including more than 1000 genes and the QTL
on chromosome 2 covers 3.15 Mb with a predicted number of 445 genes in the D. yakuba
genome (Table 1). Both of these QTL have smaller phenotypic effects (8.6% and 13.5% of
the parental species difference, respectively) than the major QTL on chromosome 3.
A simple measure of spine length that relates to the lock-and-key mechanism leads to
the same QTL
As pointed out in a previous study of male genitalia in D. melanogaster (McNeil et al. 2011),
principal components are specific to a given dataset since they describe the axes of
variation of that particular dataset and therefore it can be hard to relate principal
components to familiar shapes. Visual inspection of landmark configurations along BC-
PC1 axes (Figure 3) suggested that BC-PC1 quantifies how much the spines are elevated
above the middle prominence of the ventral branches. We derived a simple measure, that
we called “spine thrust”, which captures the maximum spine length relative to the middle
prominence (see Material and Methods, Figure S1). We found that spine thrust is highly
correlated to BC-PC1 (Figure S9), but not to centroid size (Figure S10). QTL mapping for
“spine thrust” yielded the same QTLs as BC-PC1 (Figure 4). “Spine thrust” may relate to
how harmful the ventral branches are for the D. santomea female (Kamimura 2012). Indeed,
22
454
455
456
457
458
459
460
461
462
463
464
465
466
467
468
469
470
471
472
473
474
475
476
477

if spines do not extend beyond the middle prominence of the structure, they should not
damage the female. In constrast, higher “spine thrust” is expected to be associated with
deeper wounds.
We found that all three QTL effects act in the same direction, that is spine thrust (as
well as BC-PC1 and All-PC1) increases when a D. santomea allele is substituted by a D.
yakuba allele at both loci (Table 1), an argument in support of directional selection for spine
thrust divergence (Orr 1998). Since spine shape has changed dramatically between species
of the yakuba complex, it is currently impossible to infer with certainty the direction of the
evolutionary changes between D. yakuba and D. santomea. The most closely related species,
D. teissieri, has spines that are finer and longer than those of D. yakuba (Yassin and
Orgogozo 2013, Kamimura and Mitsumoto 2012a, Kamimura and Mitsumoto 2012b) and
other species of the D. melanogaster subgroup are devoid of spines and ventral branches
(Yassin and Orgogozo 2013). Under one scenario, supported by biogeographic data
(Lachaise et al. 2000), the ancestor of both D. yakuba and D. santomea might have had
ventral branches that looked like D. yakuba, and spines may have been lost in the D.
santomea lineage. Alternatively, the ancestor of both D. yakuba and D. santomea might have
had D. santomea-like ventral branches and spines may have evolved in the D. yakuba
lineage. The identification of the precise nucleotide changes involved in the ventral
branches shape difference between D. yakuba and D. santomea could help to shed further
light on the direction of the evolutionary changes.
Evolution of ventral branches involves at least one locus of relatively large effect
In a previous QTL study of genital shape in Drosophila, Zeng et al. (2000) identified 19 loci
involved in posterior lobe shape evolution between D. simulans and D. mauritiana and the
23
478
479
480
481
482
483
484
485
486
487
488
489
490
491
492
493
494
495
496
497
498
499
500
501
largest effect QTL was only 12.4% of the phenotypic difference between the F1 and the
backcrossed parental species. By comparison, our QTL study of ventral branches shape
identified three QTL whose effects are relatively large: 28.6%, 13.5% and 8.6% of the
parental difference (Table 1). This genetic architecture was found with three independent
phenotypic measures (All-PC1, BC-PC1 and “spine thrust”). As highlighted by Cornforth
and Long (2003) and by Mackay et al. (2009), fine mapping may reveal multiple linked loci
of small effects. The three QTL we identified may each contain several genes that are
involved in the difference in ventral branches shape between D. santomea and D. yakuba.
While our results remain to be confirmed by finer mapping with introgression lines, they
are currently supported by the high LOD score of our major QTL and by the relatively
large number of genotyped individuals in our mapping population.
Our results suggest that the genetic architecture of genitalia morphology divergence
may not always be as complex as was discovered for posterior lobe shape. While most
work on Drosophila genital evolution had been focused on the posterior lobe, studies of
genital trait, and especially those with better understood roles in copulation, will provide a
more global view of genitalia evolution.
24
502
503
504
505
506
507
508
509
510
511
512
513
514
515
516
517

Table 1. Multiple QTL model for BC-PC1.
Number of QTL in model 3
LOD of model 25.5
Variance explained 28 %
QTL locations chrX:15,971,231 chr2:2,115,180 chr3:8,387,508
Effect sizes:Absolute Relative to species difference
5.548.6%
4.4813.5%
8.8828.6%
LOD Drop one1 6.7 4.9 17.0
2-LOD interval chrX:9,749,735..19,881,209
chr2:583,024..3,736,003
chr3:6,415,420..9,089,467
Interval physical size 10.13 Mb 3.15 Mb 2.67 Mb
Number of predicted genes2 1137 445 338
1-Reduction in the LOD score of the full model when this QTL was removed.2 Number of predicted genes from the annotation of the D. yakuba (R1.04) genome
25
518
67


Acknowledgment
We thank François Graner and Nicolas Navarro for help with the analyses and helpful
comments during preparation of the manuscript. We also thank Raphaël Cornette for help
with landmark acquisition, Juliette Royer for help with dissections, Greg Pinero of Janelia
Scientific Computing for updating the MSG software to handle WMD-MSG barcodes, and
Serge Picard of Janelia Molecular Biology Core Facility for help troubleshooting and
sequencing the WMD-MSG libraries. We also thank two anonymous reviewers for their
helpful comments. The research leading to this paper has received funding from the
European Research Council under the European Community’s Seventh Framework
Program (FP7/2007-2013 Grant Agreement no. 337579) and from the “Who Am I?”
Laboratory of Excellence (ANR-11-LABX-0071) funded by the French government through
its “Investments for the Future” Program operated by the French National Research
Agency (ANR) under grant no. ANR-11-IDEX-0005-02.
26
519
520
521
522
523
524
525
526
527
528
529
530
531

Bibliography
Adams, D. C., and E. Otárola-Castillo, 2013 geomorph: an R package for the collection and
analysis of geometric morphometric shape data. Methods in Ecology and Evolution 4: 393-
399.
Andolfatto, P., D. Davison, D. Erezyilmaz, T. T. Hu, J. Mast et al., 2011 Multiplexed shotgun
genotyping for rapid and efficient genetic mapping. Genome Res 21: 610-617.
Arnqvist, G., 1998 Comparative evidence for the evolution of genitalia by sexual selection.
Nature 393: 784-786.
Baird, N. A., P. D. Etter, T. S. Atwood, M. C. Currey, A. L. Shiver et al., 2008 Rapid SNP
discovery and genetic mapping using sequenced RAD markers. PLoS One 3: e3376.
Broman, K. W., H. Wu, Sen, and G. A. Churchill, 2003 R/qtl: QTL mapping in experimental
crosses. Bioinformatics 19: 889-890.
Broman, K. W., and S. Sen, 2009 A Guide to QTL Mapping with R/qtl. Springer, New York,
NY.
Brukner, I., B. Paquin, M. Belouchi, D. Labuda, and M. Krajinovic, 2005 Self-Priming Arrest
by Modified Random Oligonucleotides Facilitates the Quality Control of Whole Genome
Amplification. Analytical Biochemistry 339: 345–7.
Cande, J., P. Andolfatto, B. Prud'homme, D. L. Stern, and N. Gompel, 2012 Evolution of
multiple additive loci caused divergence between Drosophila yakuba and D. santomea in
wing rowing during male courtship. PLoS One 7: e43888.
Churchill, G. A., and R. W. Doerge, 1994 Empirical threshold values for quantitative trait
mapping. Genetics 138: 963-971.
Cornforth, T. W., and A. D. Long, 2003 Inferences regarding the numbers and locations of
QTLs under multiple-QTL models using interval mapping and composite interval
27
532
533
534
535
536
537
538
539
540
541
542
543
544
545
546
547
548
549
550
551
552
553
554
555

mapping. Genetical Research 82: 139-149.
Coyne, J. A., and H. A. Orr, 2004 Speciation. Sinauer Associates, Sunderland, MA.
Coyne, J. A., S. Elwyn, S. Y. Kim, and N. A. Llopart, 2004 Genetic studies of two sister
species in the Drosophila melanogaster subgroup, D. yakuba and D. santomea. Genetical
Research 84: 11-26.
David, J. R., F. Lemeunier, L. Tsacas, and A. Yassin, 2007 The historical discovery of the
nine species in the Drosophila melanogaster species subgroup. Genetics 177: 1969-1973.
Dryden, I. L., and K. V. Mardia, 1998 Statistical shape analysis. Wiley, Chichester.
Dufour, D. L., 1844 Anatomie générale des diptères, pp. 244-264 in Annales des Sciences
Naturelles.
Eberhard, W. G., 2010a Rapid divergent evolution of genitalia, pp. 40-78 in The Evolution of
Primary Sexual Characters in Animals, edited by J. Leonard and A. Córdoba. Oxford
University Press, Oxford.
Eberhard, W. G., 2010b Evolution of genitalia: theories, evidence, and new directions.
Genetica 138: 5-18.
Elshire, R. J., J. C. Glaubitz, Q. Sun, J. A. Poland, K. Kawamoto et al., 2011 A robust, simple
genotyping-by-sequencing (GBS) approach for high diversity species. PLoS One 6: e19379.
Evans, J. P., E. van Lieshout, and C. Gasparini, 2013 Quantitative genetic insights into the
coevolutionary dynamics of male and female genitalia. Proc R Soc B 280: 20130749.
Ferson, S., F. J. Rohlf, and R. K. Koehn, 1985 Measuring shape variation of two-
dimensional outlines. Systematic Zoology 59-68.
Frankino, W. A., D. J. Emlen, and A. W. Shingleton, 2009 Experimental approaches to
studying the evolution of animal form, pp. 419-478 in Experimental evolution: concepts,
methods, and applications of selection experiments, edited by T. Garland and M. R. Rose.
28
556
557
558
559
560
561
562
563
564
565
566
567
568
569
570
571
572
573
574
575
576
577
578
579

Oxford University Press, Oxford.
Goodall, C., 1991 Procrustes methods in the statistical analysis of shape. Journal of the
Royal Statistical Society. Series B (Methodological) 285-339.
Gower, J. C., 1975 Generalized procrustes analysis. Psychometrika 40: 33-51.
Haley, C. S., and S. A. Knott, 1992 A simple regression method for mapping quantitative
trait loci in line crosses using flanking markers. Heredity 69: 315-324.
Hosken, D. J., and P. Stockley, 2004 Sexual selection and genital evolution. Trends Ecol
Evol 19: 87-93.
Huang, X., Q. Feng, Q. Qian, Q. Zhao, L. Wang et al., 2009 High-throughput genotyping by
whole-genome resequencing. Genome Res 19: 1068-1076.
Joneja, A., and X. Huang, 2011 Linear nicking endonuclease-mediated strand-displacement
DNA amplification. Anal Biochem 414: 58-69.
Kamimura, Y., 2012 Correlated evolutionary changes in Drosophila female genitalia reduce
the possible infection risk caused by male copulatory wounding. Behavioral Ecology and
Sociobiology 66: 1107-1114.
Kamimura, Y., and H. Mitsumoto, 2012a Lock-and-key structural isolation between sibling
Drosophila species. Entomological Science 15: 197-201.
Kamimura, Y., and H. Mitsumoto, 2012b Genital coupling and copulatory wounding in
Drosophila teissieri (Diptera: Drosophilidae). Canadian Journal of Zoology 90: 1437-1440.
Klingenberg, C. P., 2010 Evolution and development of shape: integrating quantitative
approaches. Nat Rev Genet 11: 623-635.
Klingenberg, C. P., and G. S. McIntyre, 1998 Geometric Morphometrics of Developmental
Instability: Analyzing Patterns of Fluctuating Asymmetry with Procrustes Methods.
Evolution 52: 1363.
29
580
581
582
583
584
585
586
587
588
589
590
591
592
593
594
595
596
597
598
599
600
601
602
603

Kuhl, F. P., and C. R. Giardina, 1982 Elliptic Fourier features of a closed contour. Computer
graphics and image processing 18: 236-258.
Lachaise, D., M. Harry, M. Solignac, F. Lemeunier, V. Bénassi et al., 2000 Evolutionary
novelties in islands: Drosophila santomea, a new melanogaster sister species from São Tomé.
Proc Biol Sci 267: 1487-1495.
LeVasseur-Viens, H., M. Polak, and A. J. Moehring, 2015 No evidence for external genital
morphology affecting cryptic female choice and reproductive isolation in Drosophila.
Evolution 69: 1797-1807.
Liu, J., J. M. Mercer, L. F. Stam, G. C. Gibson, Z.-B. Zheng et al., 1996 Genetic analysis of a
morphological shape difference in the male genitalia of Drosophila simulans and D.
mauritiana. Genetics 142: 1129-1145.
Llopart, A., D. Lachaise, and J. A. Coyne, 2005a An anomalous hybrid zone in Drosophila.
Evolution 59: 2602-2607.
Llopart, A., D. Lachaise, and J. A. Coyne, 2005b Multilocus analysis of introgression
between two sympatric sister species of Drosophila: Drosophila yakuba and D. santomea.
Genetics 171: 197-210.
Macdonald, S. J., and D. B. Goldstein, 1999 A quantitative genetic analysis of male sexual
traits distinguishing the sibling species Drosophila simulans and D. sechellia. Genetics 153:
1683-1699.
Mackay, T. F., E. A. Stone, and J. F. Ayroles, 2009 The genetics of quantitative traits:
challenges and prospects. Nat Rev Genet 10: 565-577.
Masly, J. P., 2012 170 Years of "Lock-and-Key": Genital Morphology and Reproductive
Isolation. Int J Evol Biol 2012: 247352.
Masly, J. P., J. E. Dalton, S. Srivastava, L. Chen, and M. N. Arbeitman, 2011 The genetic
30
604
605
606
607
608
609
610
611
612
613
614
615
616
617
618
619
620
621
622
623
624
625
626
627

basis of rapidly evolving male genital morphology in Drosophila. Genetics 189: 357-374.
Matute, D. R., 2010 Reinforcement of gametic isolation in Drosophila. PLoS Biol 8: e1000341.
Matute, D. R., C. J. Novak, and J. A. Coyne, 2009 Temperature-based extrinsic reproductive
isolation in two species of Drosophila. Evolution 63: 595-612.
McNeil, C. L., C. L. Bain, and S. J. Macdonald, 2011 Multiple quantitative trait loci
influence the shape of a male-specific genital structure in Drosophila melanogaster. G3 1:
343-351.
Moehring, A. J., A. Llopart, S. Elwyn, J. A. Coyne, and T. F. Mackay, 2006 The genetic basis
of postzygotic reproductive isolation between Drosophila santomea and D. yakuba due to
hybrid male sterility. Genetics 173: 225-233.
Orr, H. A., 1998 Testing natural selection vs. genetic drift in phenotypic evolution using
quantitative trait locus data. Genetics 149: 2099-2104.
Orr, H. A., 2001 The genetics of species differences. Trends Ecol Evol 16: 343-350.
Peterson, B. K., J. N. Weber, E. H. Kay, H. S. Fisher, and H. E. Hoekstra, 2012 Double digest
RADseq: an inexpensive method for de novo SNP discovery and genotyping in model and
non-model species. PLoS One 7: e37135.
Preziosi, R. F., and D. A. Roff, 1998 Evidence of genetic isolation between sexually
monomorphic and sexually dimorphic traits in the water strider Aquarius remigis.
Heredity 81: 92-99.
Rebeiz, M., M. Ramos-Womack, S. Jeong, P. Andolfatto, et al., 2009 Evolution of the tan
Locus Contributed to Pigment Loss in Drosophila santomea: A Response to Matute et al.
Cell 139: 1189-1196.
Rohlf, F. J., 2006 tpsDig, version 2.10. Department of Ecology and Evolution, State
University of New York, Stony Brook. http://life.bio.sunysb.edu/morph/.
31
628
629
630
631
632
633
634
635
636
637
638
639
640
641
642
643
644
645
646
647
648
649
650
651

Rohlf, F. J., and D. Slice, 1990 Extensions of the Procrustes method for the optimal
superimposition of landmarks. Syst Biol 39: 40-59.
Sasabe, M., Y. Takami, and T. Sota, 2010 QTL for the species-specific male and female
genital morphologies in Ohomopterus ground beetles. Mol Ecol 19: 5231-5239.
Schäfer, M. A., J. Routtu, J. Vieira, A. Hoikkala, M. G. Ritchie et al., 2011 Multiple
quantitative trait loci influence intra-specific variation in genital morphology between
phylogenetically distinct lines of Drosophila montana. J Evol Biol 24: 1879-1886.
Schumer, M., R. Cui, G. G. Rosenthal, and P. Andolfatto, 2015 simMSG: an experimental
design tool for high-throughput genotyping of hybrids. Molecular Ecology Resources
Simmons, L. W., and F. Garcia-Gonzalez, 2011 Experimental coevolution of male and
female genital morphology. Nat Commun 2: 374.
Takahara, B., and K. H. Takahashi, 2015 Genome-Wide Association Study on Male Genital
Shape and Size in Drosophila melanogaster. PLoS One 10: e0132846.
Tanaka, K. M., C. Hopfen, M. R. Herbert, C. Schlötterer, D. L. Stern et al., 2015 Genetic
Architecture and Functional Characterization of Genes Underlying the Rapid
Diversification of Male External Genitalia Between Drosophila simulans and Drosophila
mauritiana. Genetics 200: 357-359.
True, J. R., J. Liu, L. F. Stam, Z.-B. Zeng, and C. C. Laurie, 1997 Quantitative genetic
analysis of divergence in male secondary sexual traits between Drosophila simulans and
Drosophila mauritiana. Evolution 816-832.
Xie, W., Q. Feng, H. Yu, X. Huang, Q. Zhao et al., 2010 Parent-independent genotyping for
constructing an ultrahigh-density linkage map based on population sequencing.
Proceedings of the National Academy of Sciences 107: 10578-10583.
Yassin, A., and V. Orgogozo, 2013 Coevolution between male and female genitalia in the
32
652
653
654
655
656
657
658
659
660
661
662
663
664
665
666
667
668
669
670
671
672
673
674
675

Drosophila melanogaster species subgroup. PLoS One 8: e57158.
Zeng, Z.-B., J. Liu, L. F. Stam, C.-H. Kao, J. M. Mercer et al., 2000 Genetic architecture of a
morphological shape difference between two Drosophila species. Genetics 154: 299-310.
33
676
677
678