title: depositionand retention of plutonium in the …
TRANSCRIPT
“ ~-UR -81-1175
*
WRJ
TITLE: DEPOSITION AND RETENTION OF PLUTONIUM IN THE UNITED STATESGENERAL POPULATION
AUTHOR(S): James F. McInroy, Howard A. Boyd and Bernard C. Eutsler
SUBMllTED TO: To be published in Proceedings of Workshop on Measure-ments and Interpretation of Actinide Accu~ulation byMan, Snowbird UT, Ott 15-17, 1979
r._—I, IwIAIMIH—---———
1L ——..—J....——-...-_.-.——.--
By maptanm of thm ●tIcle, thr publ,dmr wcogmms Ilm! tlw
US Gov@rnrnent morns ● noncxclutw, roynl!v fr~~ hmrnw
to pubhsh or reproducw Ih@ publmhml fo!m of thti conlnlm
tmn. or 10 ●now Otheri to do m. for U,S, Gowvmwwl Iwr
laloi
The Los AIDrrros Screnuhc Laboialorv IC!IIIIWI! !Im tlw PIAI
hstwr whnhfy thm WIICIW m work Imfortnml uruh.r IIW ●IIk
PWMDof the US Oaparlmn! of E twrqv
Lsi!lli’%LOS ALAMOS SCIENTIFIC LABORATORYPoot Off Ice Box le63 Los Alamos, New Mexico 67545An Af’firmdve ActIon/Equal OpporhJnttYEm@uyer
UNITCD 8TATC~—
Deposition and Retention of Plutonium in theUnited States General Population
J. F. McInroyH. A. BoydB. C. Eutsler
Epidemiology GroupHealth Division
Los Alamos National LaboratoryUniversity of California
Los Alamos, New Mexico 87545

ABSTRACT
Since 1959, a Los Alamos National Laboratory study has
analyzed over 5000 tissues from 1100 individuals of the
nonoccupationally exposed general p~pulation for fallout
plutonium. These data have been useful in determining the
tissue distributions and the annual baseline levels of
environmentral plutonium in the United States population. The
effects of age, sex, date of death, cause of death and
geographic location of residence on the observed plutonium
deposition have been evaluated. Because of the difference in
biological turnover times of plutonium in the various organs of
the body and the changing concentrations of plutonium in the
atmosphere, the plutonium concentration ratios between tissues
have changed as a functicn of time. However. our data indicate
that over th(; past 10 years, the highest concentrations in the
gel~eral population are found in the tracheobronchial lymph
nodes and the liver and the lowest concentrations are ir. the
spleen, gonads and kidney. The median bo!iy burdens of
Dlutonium in the U.S. population are estimated to have reached
12 pCi during the 1960’s and have declined to about 2 pCi in
1977, Large errors jn estimated skeletal burdens of plutonium
may exist because of small specimen sumple sizes and a lack of
knowledge concerning the relat~ve distribution of plutonium
among the various bones of the human body.
-2-
INTRODUCTION
The Los Alamos National Laboratory has collected human
autopsy specimens over the past twenty years (1959-1979) to
determine their plutonium content. Tissues and organs from the
U.S. general population, exposed primarily to fallout plutonium
resulting from the atmospheric testing of nuclear weapons, have
been radiochemically analyzed. The tissues collected at the
beginning of the program were lung, tracheobrcnchial lymph
nodes, liver, kidney and bone (usually a rib or vertebral
wedge) . Whole orgai~s were requested but, typically, one lung
and half of the liver were all that were received. Beginning
in 1973, we added the gonads, spleen and thyroid to the list of
requested Grgans. The samples are obtained through the
cooperative efforts of pathologists located throughout the
U, ‘ted States. At present, we have collected specimens fi-om 26
states, with most of the samples coming from Colorado, Georgia,
Illinois, New Mexico, New York, Per lsylvania and Washington.
The major thrllst of this study is to measure actual human
exposure (depositions) to plutonium resulting from
environmental sources before a major expansion of the nuclear
industry occors. This information has bran usr.ful in
establishing the current annual baseli,le levels of plutonium in
the tissues of the general population becau~s of worldwide or
regional environmental fallout from radiooctlve contamination
-3-
and will aid in the identification of the uptake and distribu-
tion patterns of ~lutonium in the human body.
The following is a report to this workshop of work still in
progress and is not intended to represent our final analysis
and interpretation of the data we are continuing to collect.
METHODS.—
The tissue specimens requested are identified and weighed
by the pathologist at the time of the autopsy. Each sample is
individually packaged in pre-labeled plastic bags and frozen.
The sets of tissues from each autopsy case are packed in Dry
Ice and sent to our laboratory by air freight. Upon receipt,
the specimens ars thawed, reweighed, grossly dissected to
remove extraneous tissue if present, and analyzed for plutonium.
We request, for each autopsy case, information concerning
the cause of death, date of death, age, sex, race, weight, and
the residential and occupational histories. The residential
and occupational data are not always readily available to the
pathologist; therefore the data we receive are not as c{mplete
as we would like it to be.
The detailed analytical methods used for the analyses of
plutonium in human autopsy specimens are described elsewhurc in
this publication (BoN1). In
solution containing242 I-W is
specimens are dry ashed in a
summary, a known amount of trticr
udded to each tissue. ‘rh e
furnacu for four days with grtidual
increase of the temperature from 150°to 5LI(.)”C. The ash is
alternately wet and dry ashecl until all visible carbonuccous
material is destroyed. All siimples are subsequently treated by
adding a mixture of LiN03 -NaN03 to the residue and
continuing the wet and dry ashing until the sample will
dissolve completely in 7.8M HN03. An aliquot of the HN03
tissue solution is adjusted to the appropriate pH, the
plutonium isolated by anion exchange and electrodeposited onto
“’sinless steel plar.chets. The activity is assayed by alpha
spectrometer, counting the alpha activity on the planchet with
a 300-mm2 silicon surface-barrier detector for 50000 sec and
correcting the measured 239-240 Pu activity by the averagg
background of the detector and the fraction of the tracer
solution recovered. In our spectrographic analyses, we are
unable to distinguish between the 5.15 MeV alpha of the 23%1
and the 5.16 MeV alpha of 240PU . Therefore, all results we
report as 239 Pu are actually the sum of any 239Pu and
240 Pu present.
The count datu from each detactor are stored in the mezlory
of a multichannel analyzer, transfered to a magnetic tape, and
read into the computer for evaluation by a cumFuter code that
propagates the errors in each measurement, The final result
and the associated error of each measurement, along with the
appropriate information on the case number, tissue type,
fraction analyzed, and the fraction of the tracer recovered are
entered into a general purpose data base management system
which operates on a CDC 6600 computer. This enables the rapid
retrieval of all data in a form determined by the investigator
for various statistical analyses.
RESULTS AND DISCUSSION
The results to date of our analyses for
tissues of the U.S. general population have
239 Pu in the
recently been
published in-toto (Mc79). Tissue concentrations from 1100
persons in 7 geographic regions throughout the U.S. were
reported. Preliminary attempts to summarize the data in the
above repert involved the estimation of median tissue
concentrations from log-normal plots of individual tissue data
collected since the beginning of the study. We now realize
that the plutonium tissue concentrations change with time (see
discussion under Time Trends) and that annual median tissue
concentrations are necessary for making regional comparisons.
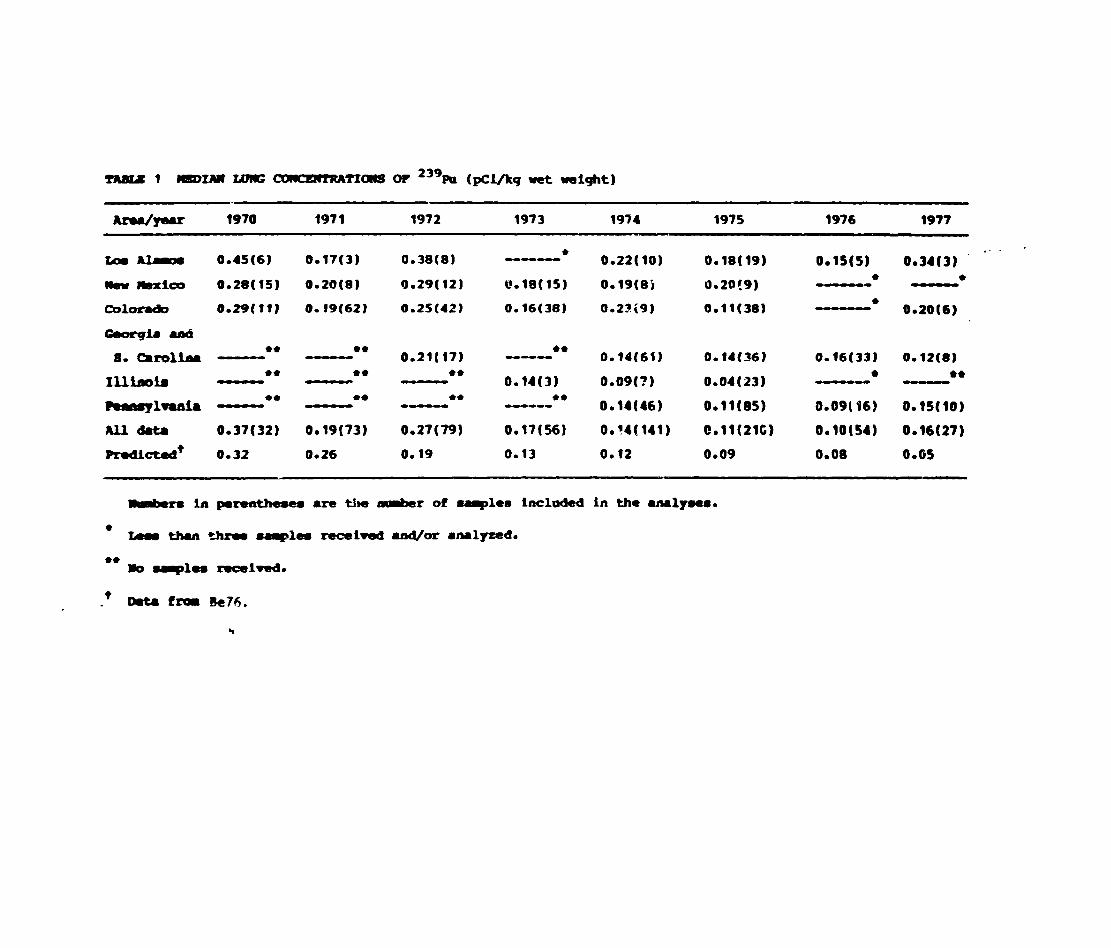
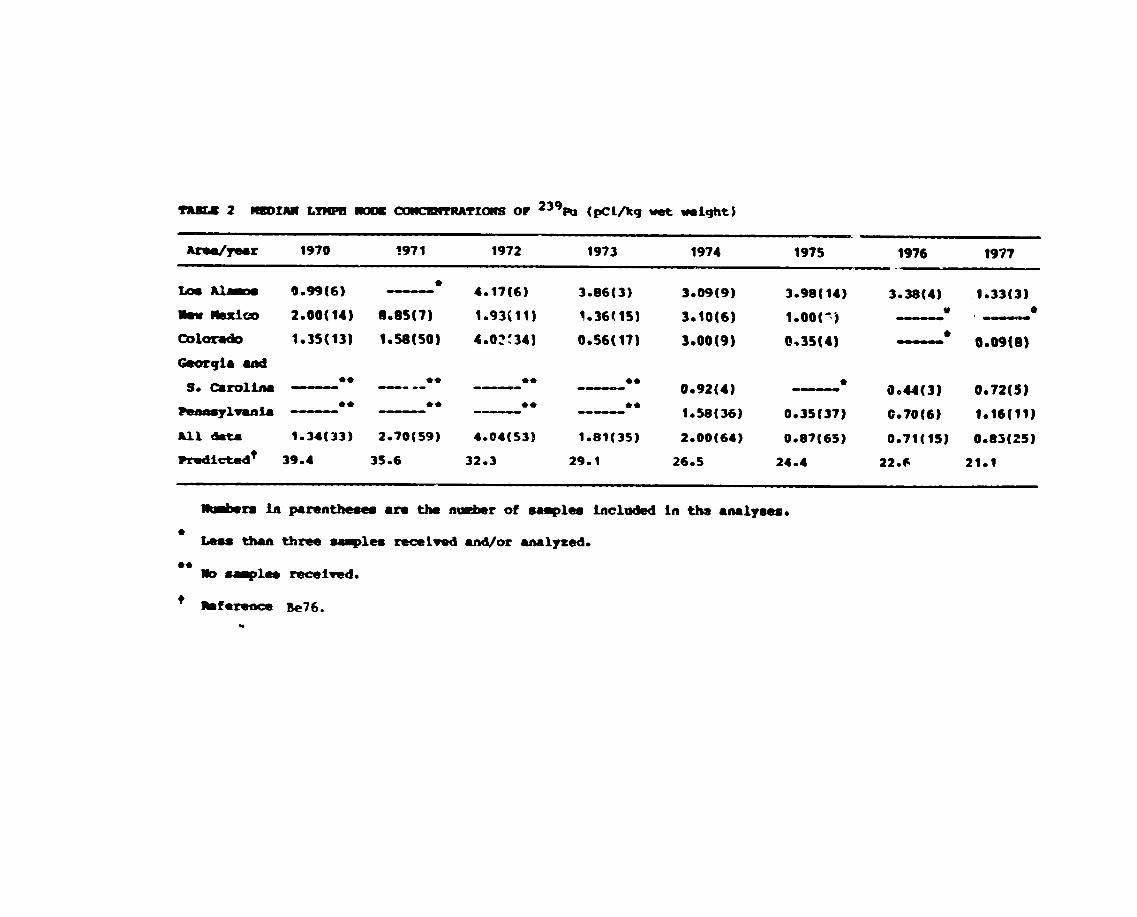
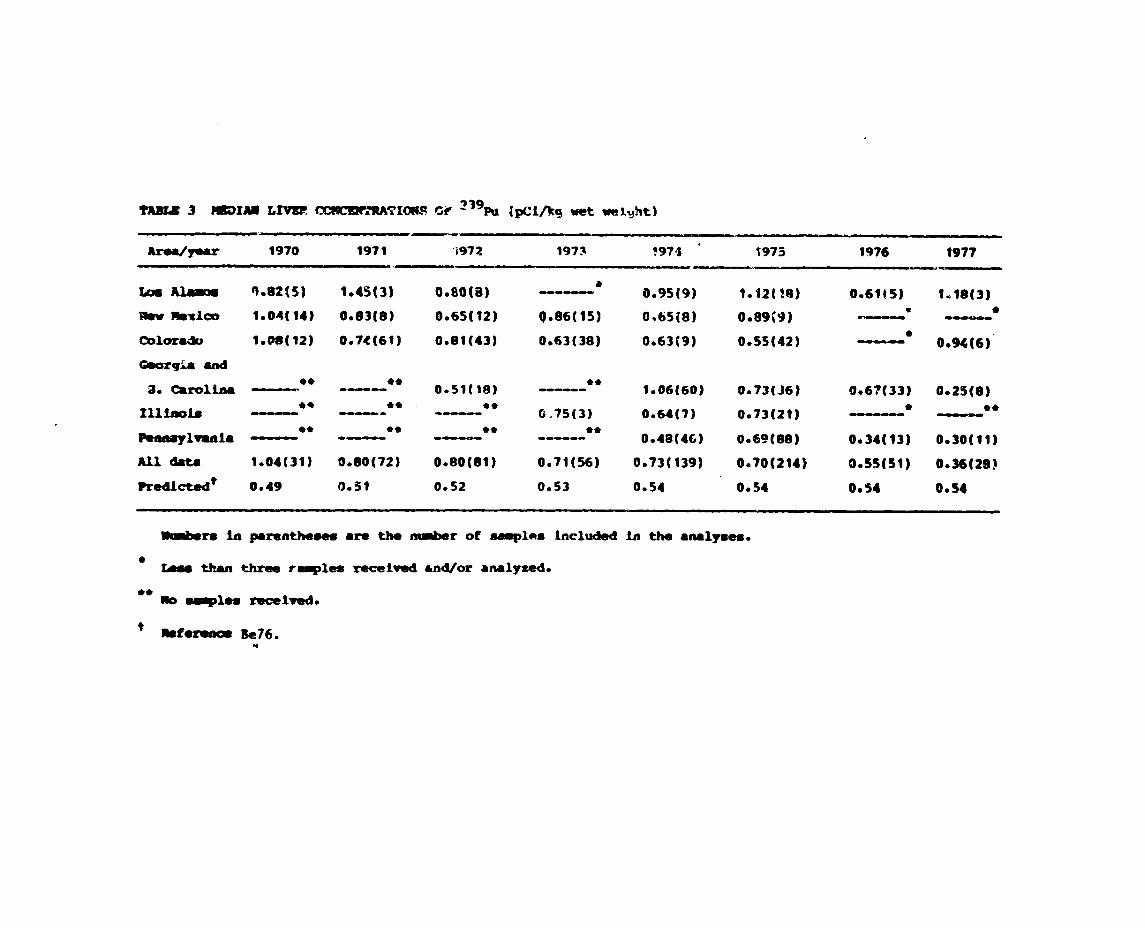
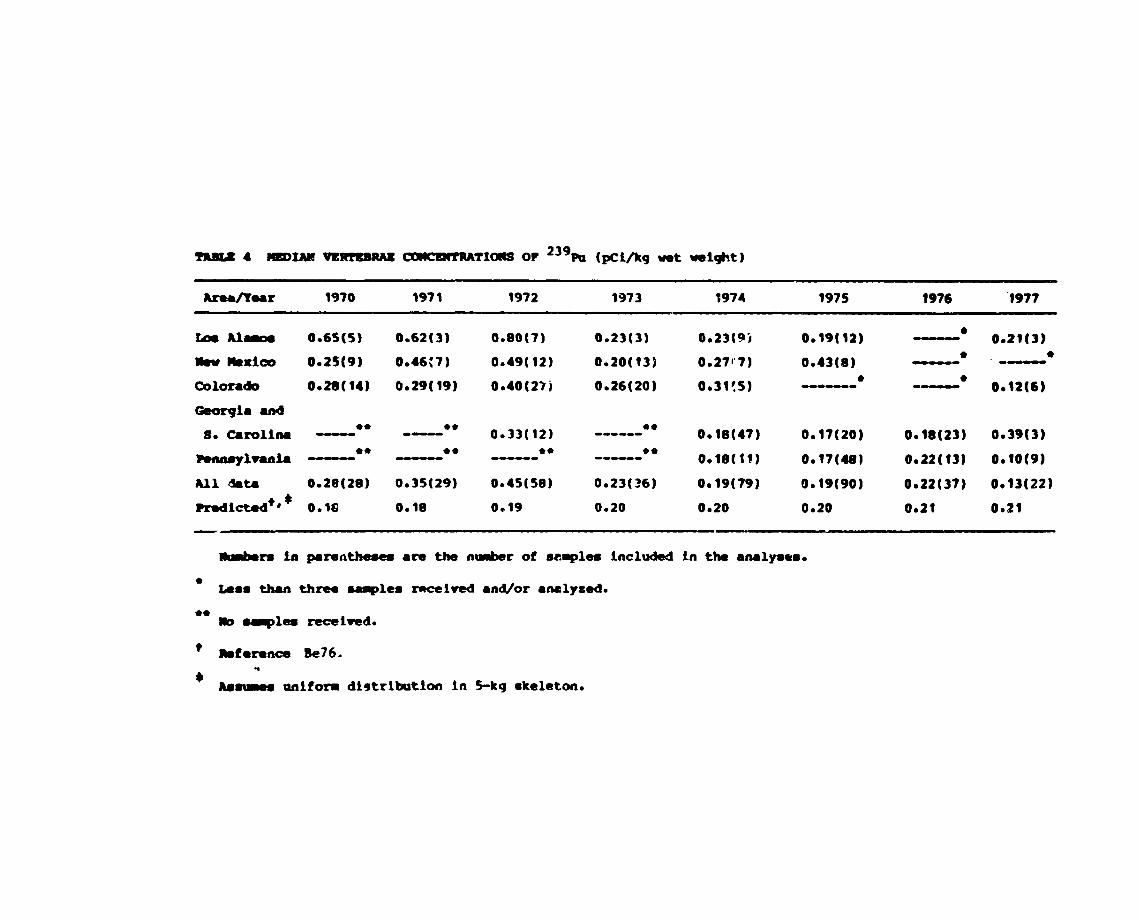
Tables 1-4 show the regional median tissue concentrations of
239 Pu in lung, tracheobronchial lymph nodes, liver and
vertebrae (vertebral bcdies) for the years 1970-77. The annual
❑ed~.an concentrations of all available data for each tissue
type are indicated as “All Data.” For comparison, the annual
concentrations in each tissue predicted by Bennett [Be76),
using the measured and inferred concentrations of fallout
plutonium in the New York City area and the ICRIJ Tdsk Group
Lung Model to estimate plutonium deposition in the lung and
transfer to othtr body organs, are also shown.
The agreement in magnitude between the predicted tissue
concentrations and the observed values is reasonable for lung
and liver data, with 75-95t of the values within a factor of
two of the predicted value. The lymph node and vertebrae,
-6-
however, vary significantly from the model. The observed lymph
node concentrations are all an order of magnitude or more lower
in concentration than the predicted values. This suggests that
the ❑odel parameters for transfer of plutonium into and from
the pulmonary lymphatic system may be grossly in error or that
the analytical process is not ❑easuring the plutonium in this
tissue accurately because of the small mass of the sample.
Measurements of tracheobronchial lymph node concentrations of
fallout plutoniui,~ in New York City autopsy cases have been made
recently by other investigators (Fi79). Lymph node specimens
were pooled to increase the mass being analyzed. Their results
confirm a much lower concentration than that predicted by the
ICRP model.
The bone concentrations appear to be in close agreement
with Bennett’s skeletal values. However, our concentrations
are based on wet weights of the bone and any marrow present,
while the reported concentrations are calculated on the basis
of a S-kg mineral bone skeleton. In ext~apolating to whole
skeleton burdens, our data are higher by a factor of two and
also suggest a shorter residence time than that used by ICRP.
We are currently fitting the model to our data with the
expectation that better estimates of the model parameters will
result in a compartmental model able to predict more accurately
the distribution and retention of inhaled fallout plutonium in
the human body,
Fax et al. have examined the data we have collected to
identify p~ssible regional differences and time and age trends
in plutonium tissue concentrations (F079). They have also
-7-
tested each of our autopsy cases to determine possible bias in
the data and to identify outliers in our analyses. They have
reported the following conclusions:
Sample Selection
Autopsies do not, in general, represent a random sampling
of all deaths. Tramatic deaths, unattended deaths, and deaths
from unknown or medically interesting causes are more likely to
result in an autopsy. To verify that the cause of death in our
autopsy population was not biasing the amount OF plutonium
found in the tissues, the medical information provided by the
pathologist and the results of our tissue analyses for
plutonium were tested using a chi-square test of independence
to measure the association between the cause of death and
plutonium concentration in tissues. The lung and liver were
selected as the tissues containing the largest amounts of
plutonium and, because of their mass, the tissues in which we
have the most confidence in the measured values. Chi-square
values of 32.S and 36.4 with 28 degrees of freedom, indicate no
detectable association and, thus, no cause for concern about
bias in our data because of autopsy selection.
Outliers
In every large set of data, one finds outliers
(observations that do not appear to be consistent with the bulk
of the data). These may result from possible errors in
analysis, transcription of informiltion, from contamination of
the sample, small sample sizes, etc. The concentrations of
plutonium for the general population are near background and
even a slight contamination may have a significant effect on
-a-

the values measured. Certain =- emitting nuclides may
239PUinterfere with the accurate determination of . These
may be present in the chemical reagents used, including the
tracer added to each sample, on the stainless steel planchets
or on the electrodeposition apparatus from an earlier
processing of a sample with high activity. The amount of
contaminant analyzed with the autopsy specimen may have been
equal to the activity in the sample, thus causing the current
analysis to give erroneously high results. Other contributors
to outliers are the analysis of small aliquots, small tissue
samples and improperly prepared samples with undissolved solids
that interfere with the measurement process. Finally, there is
the possibility that, despite all efforts to identify the
history of all samples, some occupationally exposed cases may
have been included in the general population data.
Using the Grubbs’ statistic as a test for single outliers
and the Tietjen - Moore test (Ti72) as a test for multiple
outliers, 139 high results out of 4373 observations, or 3.2t of
the data, were declared outliers. These specimens are being
reanalyzed where samples are still available. If no sample
remains, the outliers are removed from the data base or are
identified as being a questionable result.
Age Trends
The age at death of the persons included in our study is an
uncontrolled variable and may not be typical of the population
at large. The age distributions for all cases collected since
the beginning of the program are shown in Fig. 1. Although the
distributions resemble each other generally, the New York City
-9-
data are a clear exception: the individuals from that
population are much younger than those from other areas. This
may be because the New York City samples were largely from
traumatic deaths, which are more frequent in younger males.
If age has an effect on the deposition and retention of
plutonium, it is important to identify such trends and to
adjust for them before making geographical comparisons.
Excluding the New York City data, separate regression analyses
indicated no dependence between the age at death and
geographical location of residence. In order to test for age
related trends on the deposition of plutonium in tissues with
the autopsy tissue data presently available, four very short
segments of time [1968-69; 1970-71; 1972-73; 1974-75) were
selected, as periods when the trends would be nearly constant.
For the liver and lung tissue data (over all ages and locales),
the plutonium concentration versus age at death was fitted to a
linear relationship by least squares for each of the four short
time periods. Another line was fitted to the data (for each
tissue separately) over the whole time period, (1968-75).
Tests of whether the slope of the line was significantly
different from zero were made. For the liver, the slopes for
each time period are consistently different from zero, but a
single line for the whole time period fits as well as svparate
lines for each time period. This indicates that the slopes for
different time periods are very similar. It was conclude~ that
the linear relationship, Cl = 0.91356 + 0.01682 x (age),
where Cl is the liver concentration Of ‘39pu in dpm per kg
-1o-
tissue, best represents the effect of age on liver
concentration. Over an 80 year lifetime, an increase of about
1 pCi could be expected in the liver. From age 40 to age 80,
the increase would be about 0.6 pCi in the liver due to age
alone.
For lung tissue, the evidence of age related trends on the
deposition of plutonium was not convincing.
For kidney, tracheobronchial iymph nodes, rib and male
gonadal tissue, there was no detectable effect of age for any
of the time periods.
For vertebrae, the slope of the regression line relating
concentration ~s age at death was significantly different from
zero for the 1974-75 data and the 1968-75 data. Significantly,
perhaps, the slopes for this tissue are negative (or near
zero), supporting the hypothesis that the skeleton is beiti~
remodeled with age and the plutonium is being transferred from
the skeleton to the liver.
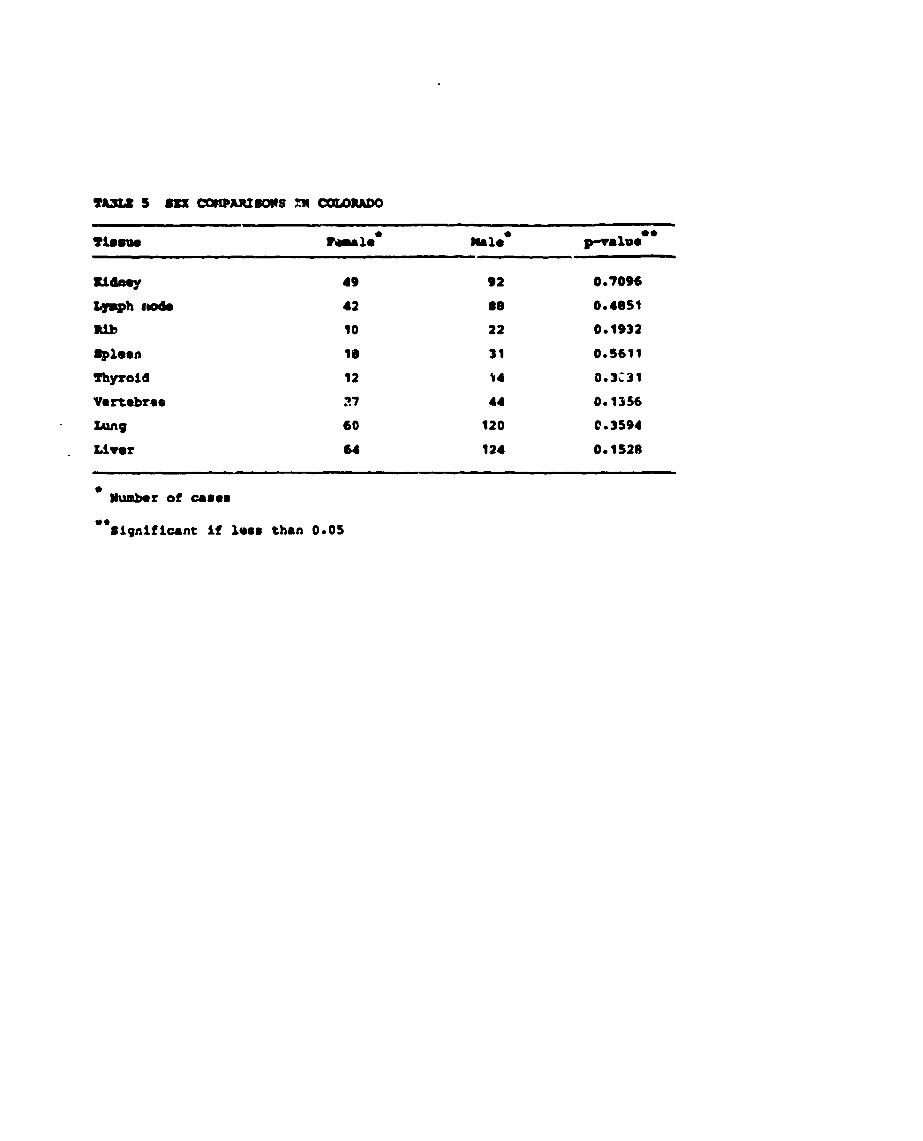
Sex Differences
There are roughly twice as many males in the study as
females. TO test the hypothesis of sex differences, the
Colorado 1970-77 date, adjusted for age trends, was examined
using the Mann - Whitne~r test. S~e Table 5. The results show
that there are no significant differences in the concentration
of plutonium in the tissues shown clue to sex. Gonadal tissues
were not compared because of the obvious anatomical differences
between the testes and ovaries.
-11-
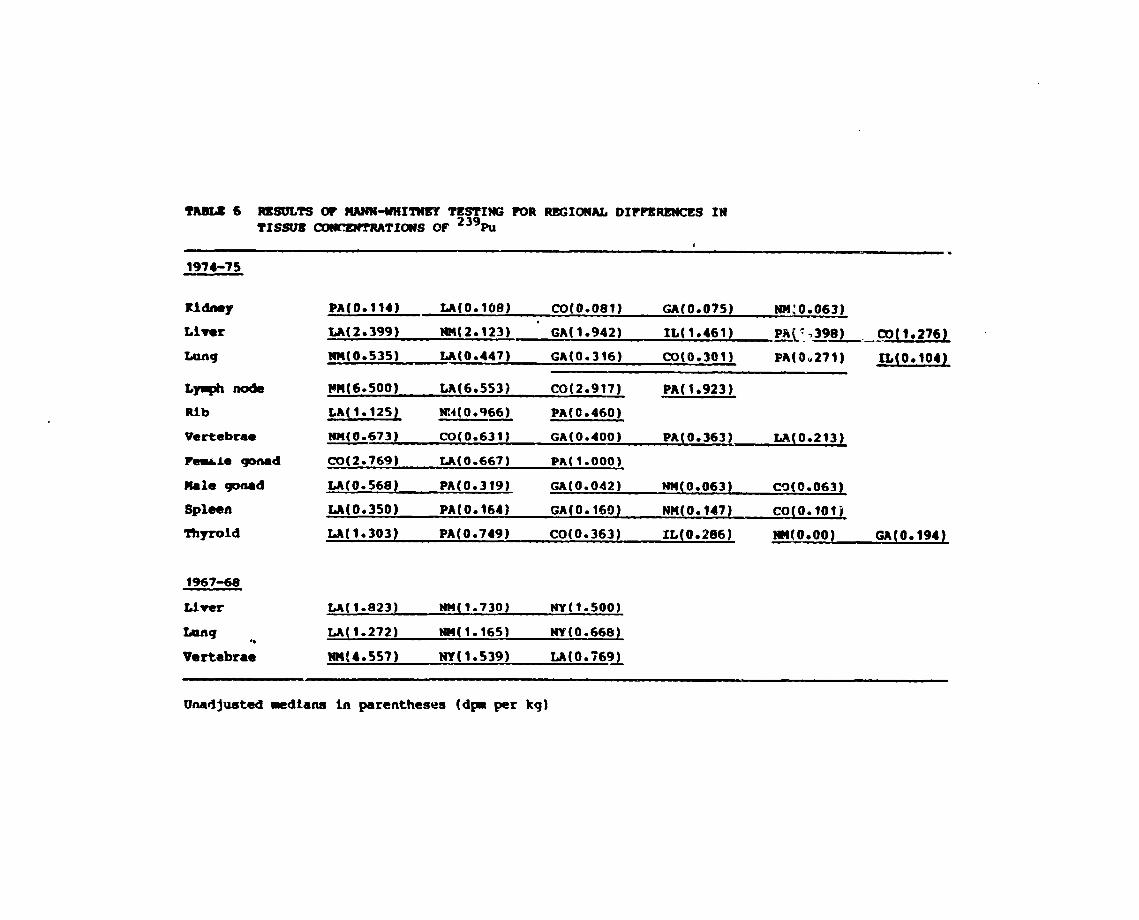
Geographical Differences
To compare the levels of plutonium concentrations in the
populations of various geographic areas within the U. S., we
attempted to eliminate the dependence of age at death and year
of death by considering very short segments of time (i.e., year
of death was 1.967-68 and 1974-75) and subtracting out the age
trends found during those time periods. Almost all of the
subjects in the sample were born before 1945 an., therefore
had nearly equal exposure times to fallout plutonium,,
Use of the W-test for normality (Sh75) indicated that there
was no evidence that the concentrations of plutonium in any of
the tissue types studied were normally distributed. Because cf
this, nonparametric testi--g procedures reconlmended by Lin and
Haseman (Li73) and Coriover (C071) were used to test for
geographical differences in plutonium concentrations in
tissues. These Procedures utilize a Kruskal - Wallls test of
the significance of among-region differences at the 0.05 level,
and if this test indicated overall significance, Mann - Wnitney
tests were performed for all pairwise comparisons of the
geographic regions (at the 0.0S level). If the Kruskal -
Wallis test was not significant, then all pairwise comparisons
were declared not significant. Table 6 summarizes the results
of the above testing. For each tissue, those regions
underlined with the same line do not differ from each other in
their concentrations of plutonium in the indicated tissue.
Median concentrations (dpm per kg) are given in parentheses.
However, even wh.re statistical differences are itldicated, tile
differences !n the medians are quite small, often on the order
of 1 d:]m per kg tissue.
Time Trends in Tissue Concentration
Direct measurements of plutonium concentrations in the air
were not made routinely in this country until the late 1960’s.
Plutonium concentrations in the air before that time were
estimated from 90 Sr concentrations in air and the known
23gPu/gcSr ratios (Be76). Annual averages of plutonium air
concentrations indicate that the levels of plutonium in the
stratosphere began rising sharply about 1961, reached a peak
about 1963, and then decreased steadily with a half-time of
about 10 months to the present levels of about 2 kCi (Ha79).
China and France have added to the atmospheric inventory of
plutonium with their continuation of above ground testing of
nuclear weapons
As a result, some time trends in the data are to be
expected. Bennett (Be76), using the International Commission
on Radiological Protection (ICRP) Task Group on Lung Dynamics
model (IC72) and the calculated plutonium intake (using the New
York City air concentration dat~ from 1954 to 1976’, estimated
the plutonium burdens in lung, liver, lymph node, kidney and
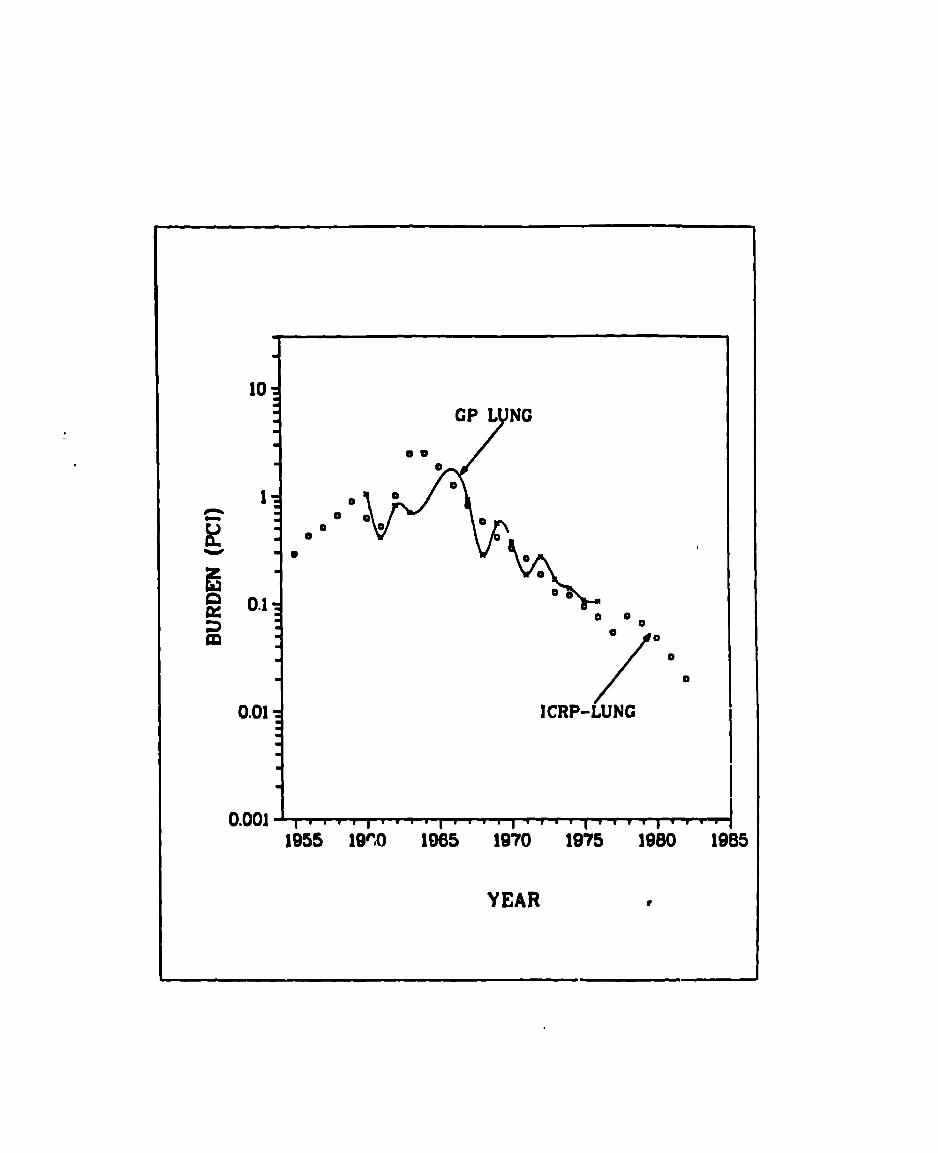
skeleton (Fig. 2). Figures 3 and 4 show our preliminary
estimates of the median liver and lung burdens for the U.S.
general population superimposed on the ICl+P predicted values.
The autopsy data appear to agree with the ICRP model quite well
in magnitude a;id in the shape of the curves, thus lending
support to the theoretical model. These data may prove useful
in refining the par~m’>ters used in the model to give a more
realistic fit to the data.
-A3-
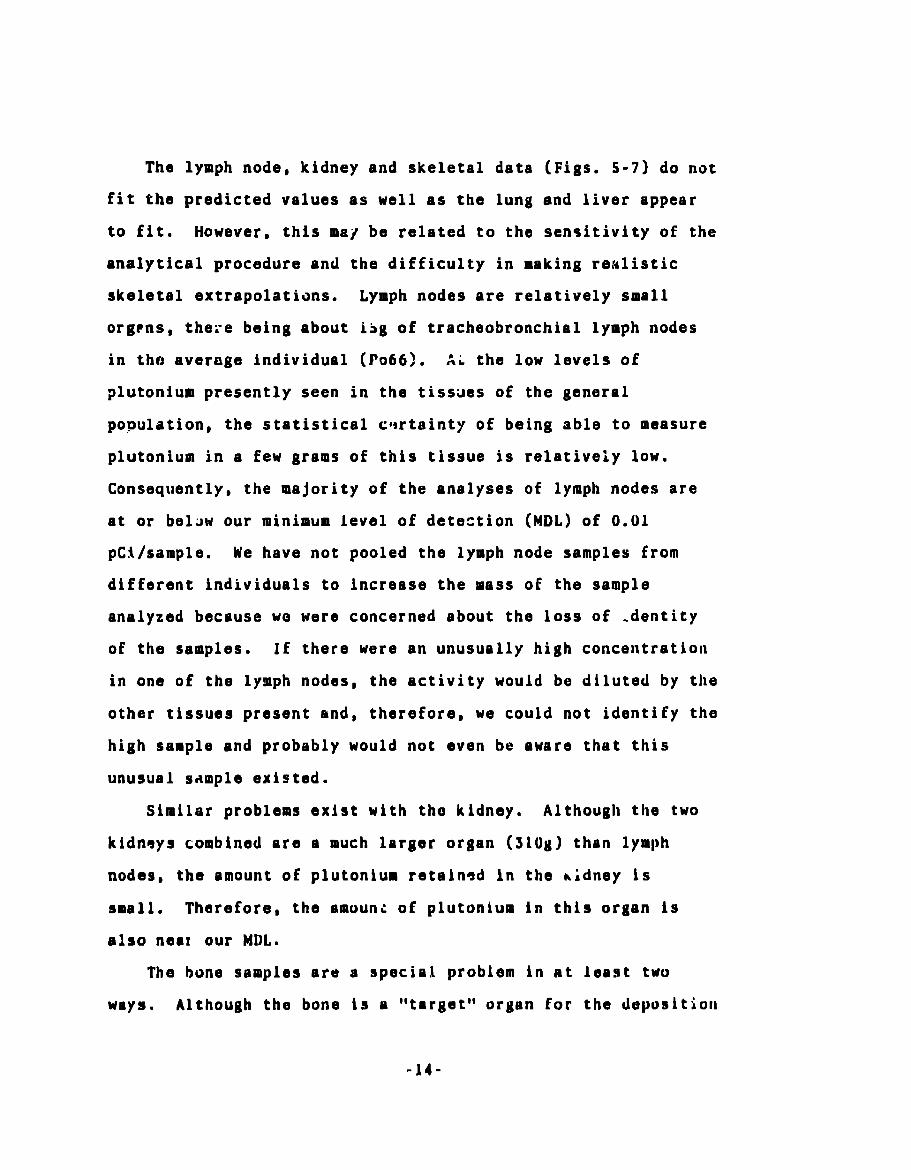
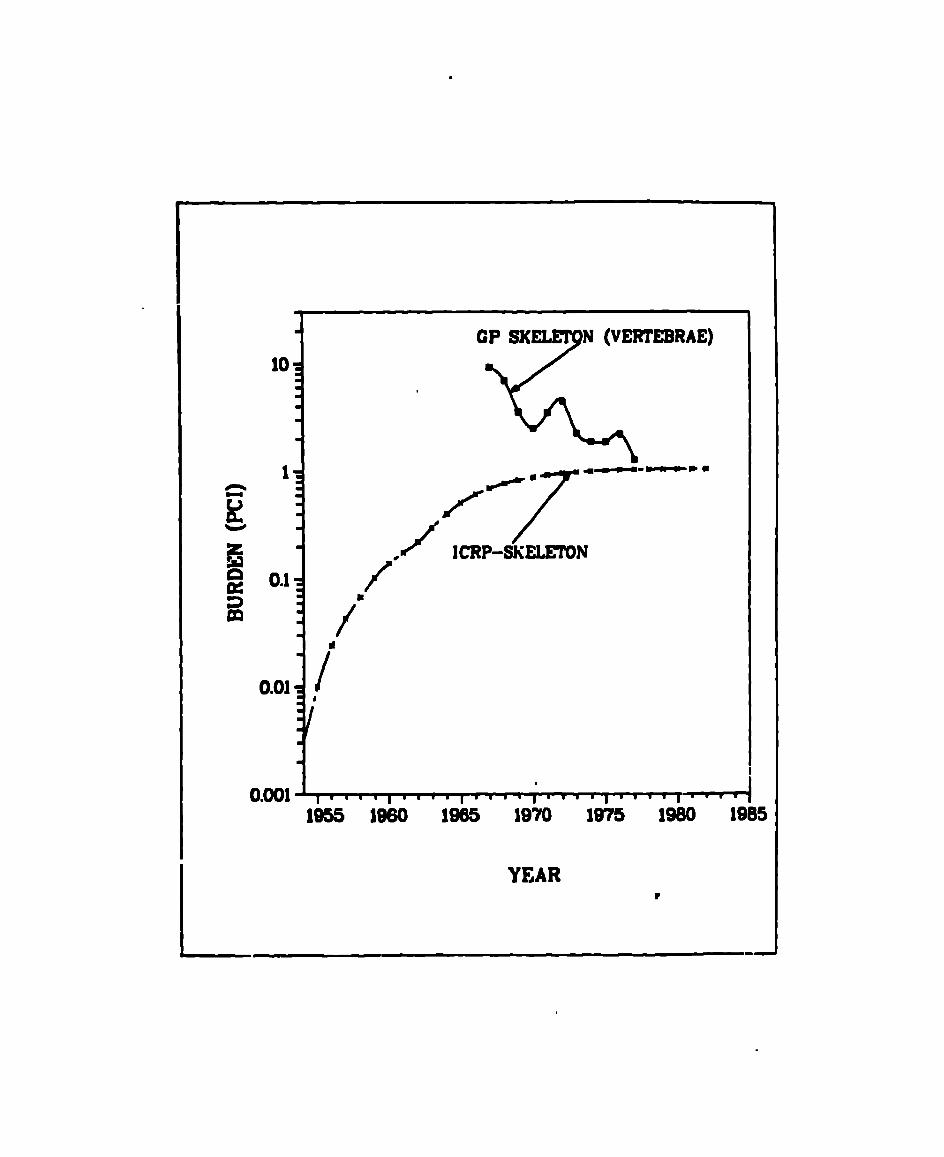
The lymph node, kidney and skeletal data (Figs. 5-7) do not
fit the predicted values as well as the lung and liver appear
to fit. However, this may be related to the sensitivity of the
analytical procedure and the difficulty in making ref~listic
skeletal extrapolations. Lymph nodes are relatively small
org~ns, there being about ibg of tracheobronchial lymph nodes
in tho average individual (P066). AL the low levels of
plutonium presently seen in the tissues of the general
population, the statistical c~~rtainty of being able to measure
plutonium in a few grams of this tissue is relatively low.
Consequently, the majority of the analyses of lymph nodes are
at or bel~w our minimum level of detection (MDL] of 0.01
pCi/sample. We have not pooled the lymph node samples from
different individuals to increase the mass of the sample
analyzed because we were concerned about the loss of -dentity
of the samples. If there were an unusually high concentration
in one of the lymph nodes, the activity would be diluted by the
other tissues present and, therefore, we could not identify the
high sample and probably would not even be aware thut this
unusual sample existed.
Similar problems exist with tho kidney. Although the two
kidnqys combined are a much larger organ (310g) than lymph
nodes, the amount of plutonium retained in the ~idney is
small. Therefore, the amount of plutonium in this organ is
also near our MDL.
The bone samples are a special problem in nt least two
ways. Although the bone is a “turget” organ for the deposition
-14-
of plutonium with about half of tha systemic plutonium burden
residing in the skeleton (IC59), the total amount of Plutonium
in the skeleton of the general population is low while the mass
of the skeleton is high (about 14% .If the body weight). This
results in very low concentrations of plutonium in the bones
with the measurements generally very close tc our MDL. Also
compounding this problem, plutonium deposits on bone surfaces,
resulting in higher concentration in t.rabecular bone than in
the dense mineral [cortical) bone. Plutonium, then, is
notuniformily distribute throughout the skeleton, thus making
the extrapolation of the skeletal burden from an anatomical
specimen of bone (usually 30-200g of rib, sternum or vertebral
body, all largely trabecular bones) very inaccurate. We are
just now beginning to make the measurements on whole human
skeletons, obtained from occupationally exposed individuals,
that will give us some knowledge of the distribution of
plutonium in the entire skeleton and allow the extrapolations
of skeletal burdens from a single bono measurement.
Summary and Conclusions
‘l’issues from 1100 nonoccupationally exposod individuals in
the United Stute% have been anulyzcd for their 239PU
content. These data have been useful in determining the tis%ue
distributions of plutonium and to illustrtite the changing
baselino levels of environmental plutonium in tho U.S.
population. Time trends in the retention of pluton!um in the
individual tissues were confirmed and raluted to the changing
ntmosphoric inventory of ftillout plutonium and tho biological
.
turnover times for this element. The causes of death were
examined for the general population auto~>sy cases and it was
concluded thnt there was no bias in the sample with respect to
plutonium concentrations in the tissues. Outliers in the data
were identified and removed before estimates of central
tendency were made.
Small changes in the deposition and reten.tiol. of plutonium
in the liver and skeleton were identified, suggesti,~g
thatremodeling of the bone mineral with age may mobilize
plutonium deposited there for eventual deposition in the liver.
There were no significant differences in the concentration
of plutonium in the tissues due to sex.
The data were examined for geographic differences, using
short segments of time to eliminate any influence of the year
of deatn, and subtracting out the age trend found in these time
periods. For the years i967-68, no geographic difference~ in
lung, liver or vertebral concentrations of239
Pu were found.
Individuals dying in 1974-1975 (the sources for the bulk of our
data) had no regional differences in239
Pu concentrations in
the vertebrae, kidney, spleen and female gonads. Small
regional differences were identifiable in all other tissues.
The measurement of plutonium distribution in whole
skeletons is needed to give the information necessary for the
extrapolation of skeletal burdens from the small bone specimens
readily uvailable during an autopsy.
-16-
Be76
B051
co’/l
Fi79
F079
REFERENCES
Bennett, B. G. 1976. Transuranic element pathways to man, Symposium
on Transuranium Nuclides in the Environment, IAEA Symposium
sTI/PuB/410.
Boyd, H. A., Eutsler, B. C. and McInroy, J. F. 1979. Determination of
americium and plutonium in autopsy tissue: methods and problems.
(This workshop)
Conover, W. J. 1971. Practical Nonparametric Statistics, New York:
John Wiley and Sons, Inc.
Fisenne, 1. M. 1979. Determination of Pu-239, 240 tissue concentra-
tions in non-occupationally exposed residents of New York City.
Institute of Environmental Medicine, New York University Medical
Center, New York, N. Y. (doctoral thesis).
Fox, T., Tietjen, G. L. and McInroy, J. F. 1979 “Statistical analysis
of a Los Alamos Scientific Laboratory study of plutonium in U.S.
autopsy tissue”. Health Phys. Q pp 877-892
ICRP59 International Commission on Radiological Protection, 19S9, ICRP
Publication 2 (Oxford: Pergamon Press).
ICRP72 International Commission on Radiological Protection (ICRP), 1972. The
Li73
Ha79
metabolism of compounds of plutonium and other actinides, ICRP
Publication 19 (Oxford: Pergamon Press)
Lin, F. A. and Haseman, J. K. 1973, An evaluation of some nonparametric
multiple comparison procedures by Monte Carlo methods”, Communications
in Statistics - Simulation and Computation. B 7 (hlo. 2), 117-128.
Harley, J. H. 1979, Plutonium in the environment - a review.
Annual Meeting of the Radiation Research Society of Japan,
Osaka, Japan.
●
..
JIC79 McInroy, J. F., Campbell, E. E., Moss, W. D., Tietjen, G. L., Eutsler,
B. C., and Boyd, H. A. 1979. Plutonium in autopsy tissue: a review
and updating of data reported in LA-4875. Health Phys. 37 pp 1-136—
P066 Pochin, E. E., 1966. The mass of the tracheobronchial lymph glands.
Health Phys. 12 563—
Sh75 Shapiro, S. S. and Wilk, M. B. 1975, An analysis of variance test for
normality (complete samples), Biometrika. 52,591-611.
Ti72 Tietjen, G. L. and Moore, R. H., 1972 Some Grubbs-type statistics for
the detection of several outliers, Technometrics. 14,583-597.
-1o.
?AlYr41 nmwLcnG~TIatsoP 239Ra (pcl/kg Uet Ueight)
Wv 1970 1971 1972 1973 1974 1975 1976 9977
●
0.34(3) ““●.—
0.45(6)
0.28(15)
o.29(tfl
0.17(3)
0.20(9)
0.19(621
0.38(8)
0.29(12)
0.25(42)
0.22(10)
0.19(6j
0.23{9)
0.18(19)
0.20!9)
0.11(38)
0.15(5)&
U.18(15)
0.16(38) 0.20(6)
● ☛ 4*——0.21(17)
● *—
0.t4(6f)
0.09(?)
0.14(46)
0.14[141)
0.12
0.t4(36)
0.04(23)
0.11(85)
C.11(21C)
0.09
0.16(33)6
o.t2(8)● *● ☛
�● ☛
� 0.14(3)● *-----● ☛ ● ☛
✍� 0.09($61
0.10(54)
0.08
0.15(10)
0.37(32) 0.19(73)
0.26
0.27(79) 0.17(56) 0.16(27)
0.19 0.130.32
RdJere in pematheeu are the ~r of e89ples incloded in the enely8es0
●
bee t?mn ●W ~le!, ~ivud Md/or ●nalyzed.
●*m ~la ~iw?d.
.* m f- *76.
h
~2 -2AWL-m mmlm?RATlaQs or %kl (pCl/kg - Wightl
Wy’eu 1970 ~971 1972 1973 1974 1975 1976 1977
nm~●
0.99(6) — 4.17(6) 3.86(3) 3.09(9)
k tiw 2.00($4) a.e5(7) 1.93(11) 1.36(15) 3.10(6)
alm 1.35(43) 1.58(50) 4.0?<34) 0.56(17) 3.00(9)
-gia sad● * **
s. Carolina —●* ● *.-. .. .— -— 0.92(4)
● * ● *?elmasylmia — —- — .-m
● * ● *1.58(36)
All m 1.34(33) 2.70(59) 4.04(s3] 1.81(35) 2.00{64)
?r!9dicted* 39*4 35.6 32.3 29.1 26.5
3.9s(14)
1.00(:j
0.35(4)
●✍✍�
0.35(37)
0.87(65)
24.4
3.38(4)
0.44(3)
G070(6)
0.71(15)
22.6
1033(3)e.—
0.09(8)
0.72(S)
1016(11)
0.83(25)
21.1
Nrmbem in p8retWhe8e9 ●re the mmhm of ~le9 included in tha ●nalyses.
●
- than three qle8 received ud/or 8nalyzed.
●*- -lee recelwed.
t hfereoce Be76.*
Ww *97Q 1971 ‘1972 1973 !974 ‘ %973 1976 1977
r410 Alama
- mxka
C1310r8&
Gmorqti ad
a. aroliln
Ill-b
?mDaSylwaeia
ALld8ta
?redlcted’
5*a2{5]
1.04(14)
1.08(12)
● ☛
● ☛
● ☛�
1.04(31)
0.49
1.45(3)
0.s3(8)
0.74(61)
● ☛✎� �
● ☛�✎
● ☛✎�
0.80(72)
0.59
0.80(3)
0.65(12)
o.el(43)
0-51($8)● *.—● ☛
✍�
0.80(81)
0m52
Q-86(15)
0.63(38)
● ☛�✍
G.75(3)● *---—
0.71(56)
0.53
0.95(9)
0.65{8)
0.63(9)
1.06(60)
0-64(7)
0.48(46)
0073(139)
0.54
l*f2{?t3)
0.89(9)
0.55{42)
0073(J6)
0073(21)
0-69(66)
0070(214)
0.54
0.61459●—●-—
0.6?(33)*-—
0034(13)
0.s5(51)
0054
1.18(3)●
0.94(6)”
0.25(8)● *
0.30(11)
0.36(28]
0.54
●
● ☛
▼
~la la pmranthese8 ● re the maber of qles included in tha ●naly8euo
Mu tkan thre9 r~la received uWor ●nalyzed.
m n@es ~lved.
wf8rwna Be76.v
TA8U 4 _2AM VCRT8DRAB~?I_ 0? 239Rl (pci/k9 wet wclight)
Area/Yew 1970 1971 1972 1973 1974 9975 1976 “V977
k m.1~ 0.6S(5) 0.62(3) 0.80(7) 0.23(3) 0.23(9j
k Mexico 0.25(9) 0.46:7) 0.49( 12) 0.20(13] 0.27f’7)
colora& 0.28(14) 0.29(19) 0.40(27j 0.26(20) 0.31!5)
Georgia end● * ● *
so C8rollne — -—● *
0.33(12) ------ 0.16(47)● * ● * ● *
~~- — — -—- --—-● *
0.18(11)
All kta 0.28(28) 0.35(29) 0.45(58) 0.23(36) 0.19(79)
?mdicted+** o*l&! 0.18 0.19 0.20 0.20
0.19(12)
0.43(8)●-.—-
0.17(20)
0.17(48!
0.19(90)
0020
●
●�✍✍
●✎�
0.18(231
0.22(f3)
0.22(37)
0021
0.21(3)●.—
0.12(6)
0039(3)
0.10(9)
0s13(22)
0021
-m in prentheeee ● re the n-r of semplee included in tRe melyseso
●
Less then three samples received ●Wor ●clyzed.
t Ibfarence Be76.
*“&mmee uniform dlgtrlbution In 5-kg skeleton.
m3LE s 8X2 CminR2sacs m cmaMDo
mdaey 49 92 0.7096
Lymph 8* 42 08 0.4051
10 22 0.1932
6plean la 31 0.5611
Thyroid 12 %4 0.3i31
Vertebrae 37 44 0.1356
XAI19 60 120 C.3594
Liver 64 124 0.1528
●
Uumber of cases
**Signlflcant if less than 0.05
?ASLS 6 =SUL= - MANN-UNIIWEf T;~ING POR RSGI~AL DIWIHWNCCS INTISSUS CONCENTMTImS OF W
#.
1974-75
Kidney
Liver
Lun9
Lyqh node
Rib
Vertebrae
Pmle gmad
Mele md
spleen
‘l%yrdd
Liver
Lung
Vertebra;
PA(O0114) LA(o.los) CO(O.081) GA(O.075) NU:O.063)
LA(2.399) NH(2.123) “ GA(l.942) IL(l.461) ~’>~9~ CO(l.276~
NM(O.535) LA(O.447) GA(O.316) CO(O0301) PA(OU271) IL(OO1O4)
l@H(60500) LA(6.553) C0(2.917) PA(l.923)
LA(10125) ?Z4(0.966) PA(O0460)——
NM(O.673) CO(O.631) GA(O.400) PA(O.363] LA(O.213}
c!o(2.769) LA(O.667) PA(l.000)
LA(O.568) PA(O.319) GA(O.042) NM(O.063) CO(O.063)
LA(O*350) PA(O.1641 GA(O.160) NU(O.147) CO(O.1OI5
LA(I0303) PA(O.749) CO(O.363) IL(o.2E16)
LA(l.EJ231 NM(l.730) NY(l.500)
LA(l.272) NU(l.165) NYIO.668)
NMt4.557) NY(10539) LA(O.769)_
NPMoooo) GA(O.194)
Unadjusted mediana in parentheses (d- per kg)

Figure 1 A- diatrlbutlona of geoq~phlcal groupm. ~0 dot- r.pra--nttha 10th, 50th, afld 90th porccntiles. l%. ●nd point- of thorectangles ● ra ●t ths 25th and 75th Perccntilas OO that OMy?.nclude tha middl@ 50* Of *Q ~th.
Figura 2 Inh+latlon intakm ●nd computed burden of fallout 239,240m in
ma: 5:- the ICM mdol (Be76).
Figure 3 ~’.S. genmral population Md.iaJI liver burdens.
Figure 4 U.S. ganeral population mdlan l“mg burdanm.
?igur9 5 Us. general population madian trachaobronchlal lymph nodeburdmfim.
Figure 6 U.S. ~naral population mdian kidney burdens.
Figure 7 U.S. genaral population wdlan skeletal burdens.

AGE5020
LOS ALAMOS
NEW MEXICO
30 40 60 70 80 901W
COLORADO ●t A
●
NEW YORK ~
PENNSYLVANIA
GEORGIA ● 1 1 9
ILLINOIS ● r‘ —-4
.w -
The dots represent ihe NRh, 5(lh, and !Hlh p?rcentil~ !Pf e, q~~~i”::.,4the rectanglesare ii the Z5thand7Sthpercentilessotha[ they ir.:lule
. the middle XHd thedda.
(n= 227)
(n= 35)(n= 2 69)
(n= 132]
(n= 45)

1’ I I I 1 I I I I 1“1 I I I I I I 111’ 1111”1●
INHALATION INTAKEm
10 r i“ =EW YORK DATA 9,1 -m
-mm m
m /
IIm
● ,
u
m
m 1’COMPUTED BURDENS -
a m
w 0n I Fa3 m
mmD m
gm*
aId
-1- m
●
mz m a
m wm mm m
0.011955 1960 1965 1970 1975 1980 1985
9
YEAR

10
1
0.1
l@5!5 1960 Itis lwo lm leeo lms
YEAR ?
.
10
1
I
o0
00
●
0101
0.001
000
0 bo
\
o0
00
0000
/
o
0
0
ICRP-LUNG
1955 lWO 1055 1970 1975 1980 1905
YEAR

.
.
1
0.1
0.01
●
●
✼
●
GP LYMPH NODE
YEAR r
1

m
.
GP K{DNEY
lCRP-KIDNEY\
YEAR
.
101 ‘KmmR’E)
ICRP-SWLETON
.
1955 1960 1065 mrn 1075 1980 1905
YEARrL .-