title family support and loneliness among older persons in ... · sor tho ng, [email protected] ,...
TRANSCRIPT
Title Family Support and Loneliness among Older Persons in Multi-ethnic
Malaysia
Authors Jane Kimm Lii Teh*, [email protected] , +6012-3760776
Nai Peng Tey, [email protected] , +603-7967 3667
Sor Tho Ng, [email protected] , +603-7967 3684
Affiliation Population Studies Unit,
Faculty of Economics and Administration,
University of Malaya,
50603, Kuala Lumpur, Malaysia.
*Address correspondence to Jane K. L. Teh

Abstract
This study investigates factors affecting older persons’ state of loneliness in multi-ethnic
Malaysia using data from the 2004 Malaysian Population and Family Survey, the first
nationally representative sample in Malaysia. The study sample was extracted to include
Malays, Chinese, Indians and other Indigenous groups aged 60 and above, and who had
children (n = 1791). Cross-tabulations and ordinal logistic regression methods were used in
the analysis. Among the ethnic groups, older Malays were more likely than their Chinese and
Indian counterparts to experience loneliness. Loneliness was found to be associated with age,
marital status, education level, sources of income, health status and physical limitations.
Among older people, feelings of loneliness were inversely related with co-residence with
adult children and participation in religious activities. Socio-demographic changes have
eroded the traditional family support system for the elderly, while social security remains
inadequate. This study shows the important role of family in alleviating loneliness among
older people. Hence the need to promote and facilitate co-residence, as well as participation
in religious activities, and a healthy lifestyle as a priority strategy in line with the objectives
of the National Policy for the Older People.
Keywords
Loneliness, family, adult children, support, ethnic group
Introduction
Loneliness is prevalent among older persons [1-3]. Loneliness is a state of mind as “people
can live rather solitary lives and not feel lonely, or they can have many social relationships
and still feel lonely” [4]. Loneliness has also been described as the distress due to the
inconsistency between ideal and perceived relationships [5], which, in turn has a great impact
on health and the quality of life [6]. Persistent loneliness and being very lonely are
detrimental to the well-being of an individual. Loneliness is found to be a precursor to
psychological disorders, mental health problems, depression and even suicide [2, 3, 5, 7-12].
Studies found that socio-demographic factors such as age and marital status influence
loneliness [7, 13, 14]. Older persons with low educational attainment and income, and the
unemployed, are likely to feel lonely as compared to those with higher education and income,
and who are working [4, 13, 15, 16]. Loneliness is also strongly associated with poor health.
Loneliness increases with reduced cognitive function [14], reduced social activities and
higher physical limitations [15, 17]. Older persons with chronic stress [4], chronic diseases
[18], and visual impairments [19] are also more likely to feel lonely as compared to those
who do not have these conditions.
Social networks are of great importance in determining the quality of life and well-being of
older persons [15, 20]. Apart from their spouse, adult children provide the most important
support and social contact in old age. Adult children’s more frequent contact, care and
affection may lessen the feelings of loneliness among older persons [21-23]. Friends and
neighbours may also provide emotional support and assistance in tasks such as transportation

and the running of errands [24]. Older persons who are close with family members and have
many friends are psychologically well-adjusted than those without these networks [25].
Nevertheless, higher levels of support may not always have positive outcomes [20]. An
earlier study found that the prevalence of loneliness is more common in areas where living
alone is rare, and where there is strong integration within a community [26].
This study examines factors affecting loneliness, with emphasis on the influence of family
and community engagement in ameliorating the feelings of loneliness among older persons in
multi-ethnic and multicultural Malaysia. Specifically, this study aims to examine the
correlates of loneliness in terms of i) socio-demographic and socioeconomic characteristics,
ii) health and physical condition, iii) various forms of support from adult children, and iv)
community engagement through religious and leisure activities.
This study relies on the convoy model of social relations to examine the influence of formal
and informal support networks on an older person’s emotional state, in particular the feelings
of loneliness. This model describes how social support systems function throughout the life
course and provides a framework of how people manage and maintain personal social
network structures through life [27]. These structures also change in response to different
situations as people pass through their life cycles [28]. Others have further added that social
networks of older persons are conditioned by the social and cultural norms engrained in the
societies they belong to [29].
Malaysia is a South-east Asian nation and constitutes of two regions (Peninsular Malaysia
and East Malaysia) separated by the South China Sea. The Malays, Chinese and Indians are
the main ethnic groups in Peninsular Malaysia, whereas Indigenous people are concentrated
in East Malaysia. Malaysian citizens consist of around 55% Malays, 24% Chinese, 7%
Indians, 13% Indigenous people and 1% of other ethnicity. These ethnic groups have diverse
backgrounds, cultures and religion. Islam is the national religion and around 61% of the
Malaysian population are Muslims [30]. All Malays are Muslims, around 76% of the Chinese
are Buddhists and 9% are Christians, around 85% of the Indians are Hindus and 8% are
Christians. About half of the Indigenous people are Christians and 36% are Muslims [30].
The Government has always maintained that it is the duty of children to provide care and
support for their aging parents [31, 32]. Traditionally, it has been the norm and cultural
practice of all ethnic groups for children to repay their parents (balas jasa) [33]. However,
Malaysia has undergone rapid demographic transition, with continuing decline in fertility and
increasing life expectancy over several decades. Since independence from British rule in
1957, the total fertility rate has declined from 6.1 per woman to 2.1 in 2010 [34, 35]. The
fertility rate among the Malays and other Indigenous groups remains considerably above
replacement level (at around 2.8 children per woman) while that of the Chinese and Indians
has gone below replacement level since 2010. During this period, life expectancy for males
has increased from 55.8 years to 71.9 years, while that of the females has increased from 58.2
years to 76.6 years. The increasing number of older persons with diminishing family size will
put more stress on traditional family support systems.

Financial support is a common form of support for older parents. Previous findings in
Malaysia revealed that older Malaysians, especially those living in rural areas largely depend
on financial support from their children [36, 37]. Co-residence between older parents and
adult children is a traditional form of support, as practised in many parts of Asia [38, 39].
This living arrangement ensures companionship, and financial and emotional support for
older parents, besides sharing the cost of living and domestic chores [38, 40].
Method
Data and Sample
Data for this study are taken from the nationally representative Malaysian Population and
Family Survey (MPFS-4), conducted in 2004 by the National Population and Family
Development Board (LPPKN) of Malaysia, with technical assistance from the Department of
Statistics Malaysia. The MPFS-4 sample was selected using a stratified multistage sampling
design and the main survey was fielded between July 2004 and September 2004. The Kish
method was used in the selection of senior citizens (aged 50 and above) within the selected
household. The Malaysian Population and Family Survey had been conducted every 10 years
since 1974. MPFS–4, the latest in the series, was the first which covered Peninsular Malaysia
as well as Sabah and Sarawak in East Malaysia. The survey had an overall response rate of
about 80% of the senior sample [41-43].
We merged the three separate senior samples (Peninsular Malaysia, Sabah and Sarawak) into
one main data file. Then, we filtered to include only Malaysian citizens aged 60 and above,

and those who had children (96%). The few non-Malaysian and those with no children were
excluded from the analysis because our main objective was to examine the role of family
support on loneliness among older Malaysians.
Measures
Loneliness, the dependent variable is an ordered variable (1= not lonely, 2 = sometimes
lonely, 3 = always lonely). Respondents were asked if they have ever felt lonely.
Respondents who gave an affirmative response were subsequently asked how often they felt
lonely – sometimes or always. The background and demographic variables included
respondent’s age (60-69, 70-79, 80s+), sex (male, female), ethnicity (Malay, Chinese, Indian,
Indigenous), marital status (currently married, widowed-divorced-separated) and place of
residence (urban, rural). The socioeconomic variables for this study included educational
level (no schooling, primary, secondary and above), work status (still working, stopped
working) and number of sources of income (none, 1-2 sources, 3+ sources). The sources of
income included (1) inheritance (house, company, land, etc.), (2) savings in the Employees
Provident Fund, (3) pension, (4) rewards/remunerations, (5) savings in bank, (6) savings in
‘tabung haji’ (Malaysian hajj pilgrims fund board), (7) share investments, and (8) insurance.
Respondents were asked if they were suffering from any of the following illnesses: (1) high
blood pressure, (2) diabetes, (3) heart disease, (4) arthritis, and (5) asthma. They were also
asked if they had physical limitations in carrying out the following daily activities: (1) self-
feeding, (2) bathing, (3) getting dressed, (4) going to toilet, (5) exercising, (6) daily
housework, (7) attend religious gatherings, and (8) grocery shopping. The number of health
and physical limitations were recoded into categorical variables: number of illnesses (none, 1
illness, 2+ illnesses), and number of physical limitations (none, 1-2 limitations, 3+
limitations).
Besides co-residence with adult children, family support included four common types of
support from adult children on a monthly basis: financial support, help with paying of bills,
provision of food/other necessities, and help with housework. These different forms of family
support were recoded into dichotomous variables (Yes, No). Community participation in
religious and leisure activities (sports/ neighborhood watch/ Non-governmental
organizations’ (NGO) activities) was also recoded into dichotomous variables.
Analysis
We began by describing the socio-demographic and socioeconomic characteristics, health
and disability and co-residence status of the total sample, and separately for males and
females. Cross-tabulations were run to examine the bivariate associations between the level
of loneliness with socio-demographic variables, family support and community participation.
This was followed by ordinal logistic regression using the proportional odds model to assess
the relationship between levels of loneliness and factors of socio-demographic and SES,
health and physical condition, family support and community participation [44]. The ordinal
logistic regression was repeated for older Malays, Chinese and Indigenous persons. The
analysis was not conducted for older Indians due to the small number of respondents (n = 77).
Data were analyzed using SPSS for Windows version 19, and weighted according to the
ethnic distribution of the population based on the 2010 population census [30].

Results
Table 1 shows the distribution of respondents by socio-demographic characteristics and other
study variables. The respondents were aged between 60 and 97 years, with a mean of 68
years and standard deviation of 6 years. Almost two-thirds (64%) were in their 60s. There
were more females than males in the sample (1081 versus 710). The respondents consisted of
45% Malays, 25% Chinese, 4% Indians and 26% Indigenous people. Majority of respondents
were currently married and slightly more respondents were from rural areas. Slightly more
than half had no formal schooling, whereas around a tenth studied above the primary level. A
quarter of them were still working and three-quarters had at least 1 source of income. 27% of
the respondents were not suffering from any of the 5 diseases, and around two-thirds did not
have any physical limitations in performing daily activities. About 63% were co-residing
with adult children.
There were rather significant differences between the male and female respondents in terms
of marital, SES and health status. Close to four-fifths of male respondents were currently
married, as compared to around two-fifths of females. Around two-thirds of male respondents
had attended formal schooling compared to around one-third of females. The proportion who
was still working was considerably higher among the males as compared to the females (39%
versus 16%). The males were also more likely than the females to have at least one source of
income (82% versus 71%). Older females were more likely than older males to have poor
health and disability. About three quarters of the females had at least one of the five diseases
and 36% had at least one physical limitation, whereas the corresponding figures for the males
were 68% and 27% respectively.
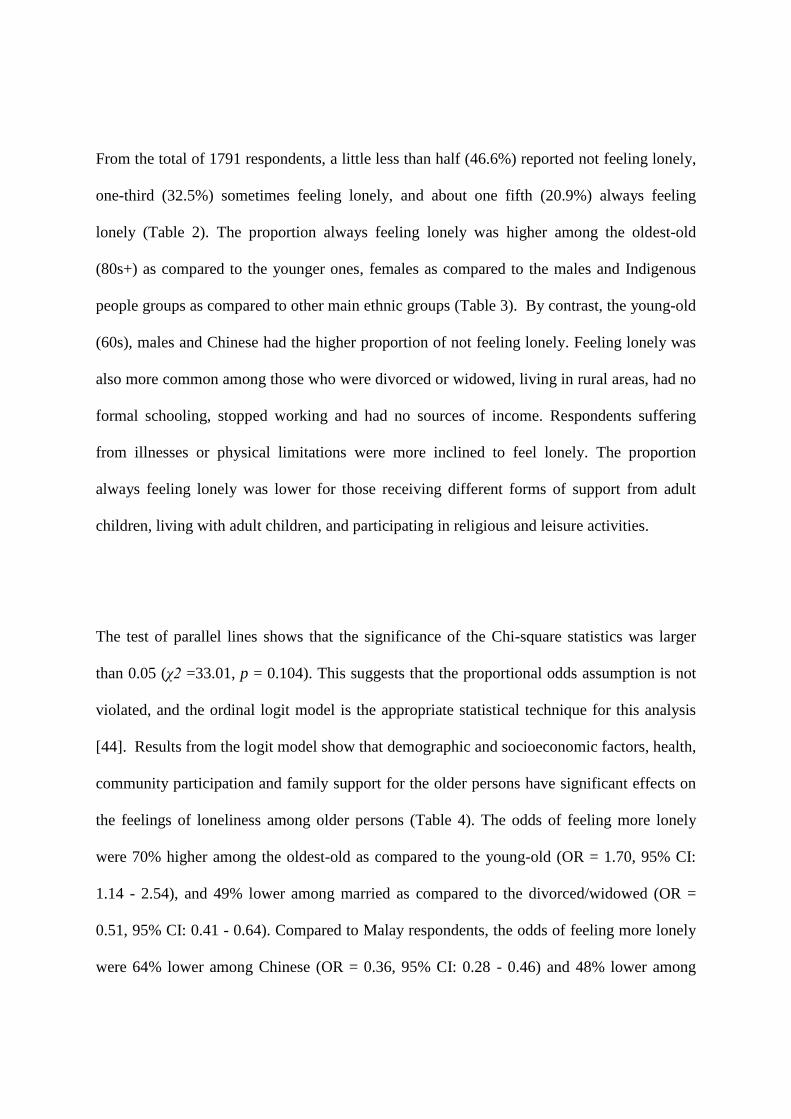
From the total of 1791 respondents, a little less than half (46.6%) reported not feeling lonely,
one-third (32.5%) sometimes feeling lonely, and about one fifth (20.9%) always feeling
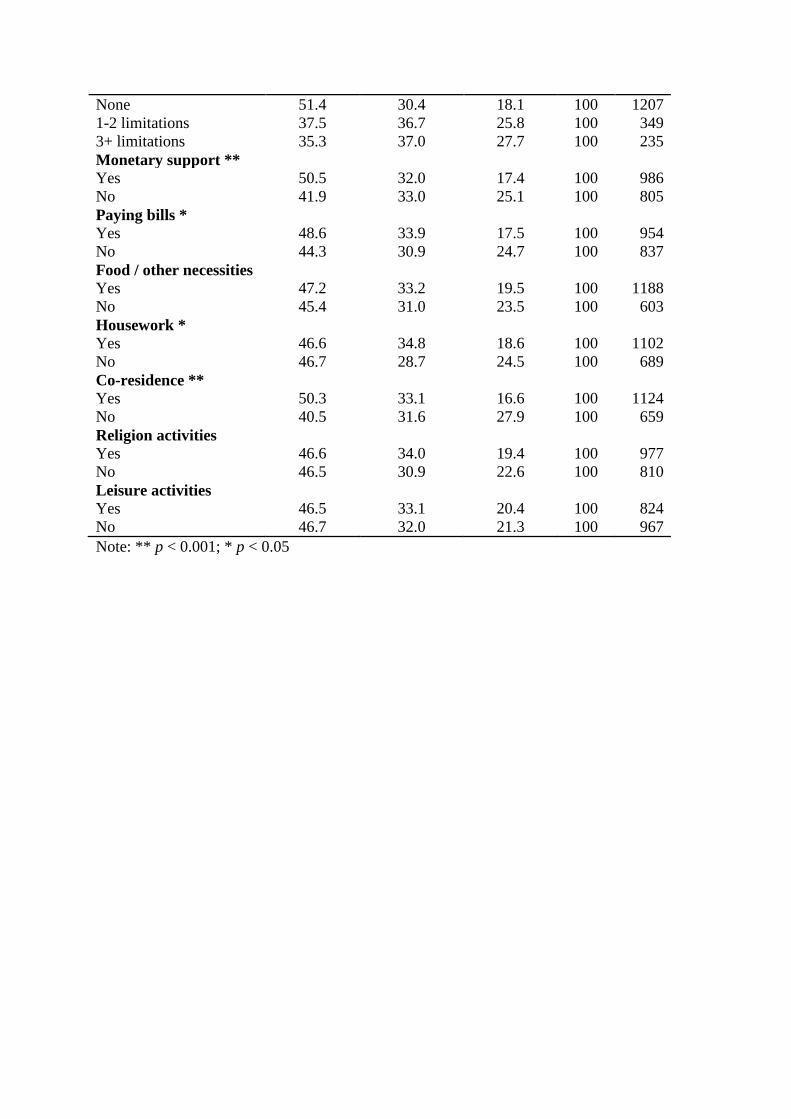
lonely (Table 2). The proportion always feeling lonely was higher among the oldest-old
(80s+) as compared to the younger ones, females as compared to the males and Indigenous
people groups as compared to other main ethnic groups (Table 3). By contrast, the young-old
(60s), males and Chinese had the higher proportion of not feeling lonely. Feeling lonely was
also more common among those who were divorced or widowed, living in rural areas, had no
formal schooling, stopped working and had no sources of income. Respondents suffering
from illnesses or physical limitations were more inclined to feel lonely. The proportion
always feeling lonely was lower for those receiving different forms of support from adult
children, living with adult children, and participating in religious and leisure activities.
The test of parallel lines shows that the significance of the Chi-square statistics was larger
than 0.05 (χ2 =33.01, p = 0.104). This suggests that the proportional odds assumption is not
violated, and the ordinal logit model is the appropriate statistical technique for this analysis
[44]. Results from the logit model show that demographic and socioeconomic factors, health,
community participation and family support for the older persons have significant effects on
the feelings of loneliness among older persons (Table 4). The odds of feeling more lonely
were 70% higher among the oldest-old as compared to the young-old (OR = 1.70, 95% CI:
1.14 - 2.54), and 49% lower among married as compared to the divorced/widowed (OR =
0.51, 95% CI: 0.41 - 0.64). Compared to Malay respondents, the odds of feeling more lonely
were 64% lower among Chinese (OR = 0.36, 95% CI: 0.28 - 0.46) and 48% lower among

Indian respondents (OR = 0.52, 95% CI: 0.34 - 0.77), but there was no significant difference
between the Indigenous groups and the Malays.
The odds of feeling more lonely among those with 1-2 and 3 or more sources of income were
29% and 43% lower as compared to those with no source of income (OR = 0.71, 95% CI:
0.56-0.89 and OR = 0.57, 95% CI: 0.43–0.77). Compared to those with no health problems,
the odds of feeling more lonely were 47% and 65% higher among those suffering from 1 or 2,
and 3 or more chronic illnesses (OR = 1.47, 95% CI: 1.15-1.87; and OR = 1.65, 95% CI:
1.30-2.10). In terms of family support, the odds of feeling more lonely were 21% lower
among respondents who received monthly monetary support (OR = 0.79, 95% CI: 0.64 -
0.98) and 33% lower among respondents who lived with children (OR = 0.67, 95% CI: 0.53 -
0.84), as compared to those who did not. In terms of community engagement, the odds of
feeling more lonely were 23% lower among those who engaged in religious activities (OR =
0.77, 95% CI: 0.62 - 0.96) as compared to those who did not, but participation in leisure
activities had no significant effect on the levels of loneliness.
Results from the logit model for each ethnic group (Table 5) show that age had no significant
effect on the levels of loneliness, although it was significant in the overall model. Being
married was significantly associated with less loneliness among older Malays (OR = 0.67,
95% CI: 0.49 - 0.92), Chinese (OR = 0.31, 95% CI: 0.19 - 0.51) and Indigenous persons (OR
= 0.48, 95% CI: 0.32 - 0.72). Educational level was not significant in the overall model, but it
was found to be significant among Malays (OR = 0.70, 95% CI: 0.52 - 0.94 and OR = 0.51,
95% CI: 0.28 - 0.93), and Indigenous persons (OR = 0.21, 95% CI: 0.05 - 0.93). The odds of

feeling more lonely were lower among those with formal education. Although sources of
income had a significant effect on the levels of loneliness in the overall model, it was a
significant factor only among older Malays (OR = 0.64, 95% CI: 0.46 - 0.90 and OR = 0.56,
95% CI: 0.38 - 0.85) and Chinese (OR = 0.53, 95% CI: 0.32 - 0.89 and OR = 0.43, 95% CI:
0.21 - 0.88). Suffering from chronic illnesses was associated with higher levels of loneliness
among older Malays (OR = 1.63, 95% CI: 1.15 - 2.29 and OR = 1.72, 95% CI: 1.23 - 2.41),
older Chinese (OR = 1.99, 95% CI: 1.16 - 3.41) and older Indigenous persons (OR = 1.76,
95% CI: 1.07 - 2.92). Suffering from physical limitations was not significant in the overall
model, but it was significant among the Indigenous groups (OR = 1.73, 95% CI: 1.09 - 2.75).
When it came to family support, monetary support was not significant for all ethnic groups,
but help with housework had a significant effect on the levels of loneliness among older
Chinese. The odds of feeling more lonely were 42% lower among older Chinese who
received help in housework (OR = 0.58, 95% CI: 0.34 - 0.99). Although co-residence with
adult children was highly significant in the overall model, it was not as significant among
older Malays. The odds of feeling more lonely were 41% lower among the Chinese (OR =
0.59, 95% CI: 0.35 - 1.00) and 43% lower among Indigenous groups (OR = 0.57, 95% CI:
0.35 - 0.92) who were living with adult children. Participation in religious activities was only
significant among older Malays, where the odds of feeling more lonely were 31% lower (OR
= 0.69, 95% CI: 0.50 - 0.94).
Discussion
The 2004 MPFS showed that every other older Malaysian experienced loneliness, and one in
five was always lonely. The oldest-old were most susceptible to loneliness, because many
were widowed and had few surviving friends. The high proportion of older people feeling

lonely warrants attention from policy makers, families, community members, and
researchers, as loneliness can lead to depression, psycho-social and health problems. More
research for a better understanding of factors that contribute to feelings of loneliness is
needed to inform policy and programs to safeguard the well-being of older people.
Older women were more likely than older men to feel lonely as the former were much more
likely than the latter to be widowed, and the absence of a spouse contributed to feelings of
loneliness. It is important to note that an increasing number of older people will be without a
spouse as Malaysia is witnessing a trend towards non-marriage and a rise in divorce [45]. In
2010, among those aged 75 and over, 42,111 out of 201,654 men or 21% were widowed,
compared to 144,194 out of 245,410 women or 59% [30]. Because widowhood is
significantly associated with loneliness, controlling for marital status would have reduced the
gender differential in loneliness. Likewise, controlling for SES and health status would have
also reduced this gender differential.
Among the ethnic groups, the Indigenous groups were most likely to report being lonely,
followed by the Malays, whereas the Chinese were least likely to do so. Part of the ethnic
differentials could be due to place of residence as rural residents were more likely to feel
lonely compared to their urban counterparts. Data from the 2010 Population Census show
that only 45% of the Indigenous groups and 67% of the Malays lived in urban areas as
compared to about 90% of the Chinese and Indians [30]. However, the logit model shows that
even after adjusting for place of residence and other socio-demographic variables, the odds of
feeling lonely remained significantly higher among the Indigenous groups and the Malays.

Hence, differences in culture and outlook in life across the various ethnic groups have a
strong bearing in feelings of loneliness.
The ethnic differential in loneliness in Malaysia is akin to the difference in loneliness among
elders from Mediterranean and non-Mediterranean countries. Older persons in the
Mediterranean (Spain, France, Italy, Greece and Israel) tend to have larger families and more
children in the household compared to their non-Mediterranean counterparts (Sweden,
Denmark, the Netherlands, Germany, Belgium, Switzerland and Austria), yet they had
indicated a greater sense of loneliness [20]. Loneliness can be described as the
discontentment which results from the inconsistency between ideal and perceived
relationships [5]. Van Tilburg and colleagues [46] suggested that feelings of loneliness tend
to be more prevalent in communal societies where there are higher expectations for social
contact. It is likely that Malay and Indigenous elders, whose social networks are rather
similar to that of Mediterranean elders, have higher expectations for social contact or support
compared to the Chinese and Indians. The above argument may also apply to differentials in
the feelings of loneliness between older people in the urban and rural areas, and across
educational groups.
Among SES indicators, higher education attainment and more sources of income were
associated with less loneliness. However, the effects were not consistent across ethnic groups.
Interestingly, the effects of higher education attainment led to less loneliness among older
Malays and Indigenous persons, whereas more sources of income was associated with less
loneliness among older Malays and Chinese. It may be hypothesized that work engagement

would contribute to reduced loneliness of older persons as they would be interacting with co-
workers. However, the present study shows that employment status has little effect on the
state of loneliness. An inspection of the data shows that half of the older persons who were
still working were engaged in traditional sectors such as agriculture and fisheries. A cross
tabulation (not shown here) shows significant association between sector of employment and
levels of loneliness (χ2 (2, n = 424) = 28.134, p = 0.000). Older persons working in
traditional sectors were more likely to feel lonely (sometimes lonely - 33.2%, always lonely -
23.2%) as compared to those working in formal sectors (sometimes lonely – 22.5%, always
lonely - 9.4%). This implies that working past the age of 60 may not necessarily result in
reduced loneliness. With the fundamental shift of the economy from the informal to the
formal sector, and with the increase in retirement age to 60 years effective 2013, more and
more older people will be engaged in the formal sector. Thus, this will contribute to reduced
loneliness among those who continue to work, as they will be interacting with others in the
work place.
Data from the 2004 MPFS showed that about 63% of older Malaysians lived with their adult
children, and this did not change much from the 67% reported in the 1988 Malaysian Family
Life Survey II [38]. Co-residence with adult children may be due to economic factors such as
high housing cost, and it is also encouraged by the Malaysian government through the
institution of social policies such as tax incentives. Co-residence with adult children provides
companionship for older people, and provides a platform for the continuation of support from
adult children. This type of assistance would enable interaction and contact with children,
which would indirectly lead to emotional support resulting in less loneliness [21-23]. Co-
residence with adult children has also been found to have positive effects on the life

satisfaction of older Malaysians [47]. The benefits of this living arrangement on alleviating
loneliness among older persons are evidently seen among Chinese and Indigenous groups.
Conversely, monetary support from children can positively improve an older person’s SES.
This support may lead to reduced loneliness, as past research has shown that low SES is a
risk factor for loneliness [15]. Interestingly, a sizable proportion of older people living
together with their children and receiving monetary support reported being lonely. This
indicates that some older people felt neglected by co-residing children who were busy with
work, fetching their own children to schools or other social engagements. It could also mean
that adult children had not been able to meet the needs of companionship of their parents, at
times due to mismatch of intergenerational expectations.
Family support in the form of monetary transfers from adult children to parents is commonly
practiced in Malaysia, often as a form of repayment for parental investments in the former’s
education [48]. Heavy reliance on children for financial resources is also due to limited
availability of pensions and public social security schemes in Malaysia. An earlier study has
shown that majority of older persons in rural areas are not working and had no pension [37].
The 2004 MPFS showed that a small proportion (12%) of older persons had pensions, and
around 22% had savings in the Employees Provident Fund (EPF) [41-43]. The Civil Service
Pension Scheme only covers workers in public sectors, whereas the EPF is a mandatory
defined-contribution plan for working Malaysians and their employers. As of 2009, the EPF
covers about half of labour force population, whereas the civil service pension schemes
covers around 11% [49].

The community and NGOs can also play a role in providing care and support for older people
by having intergenerational activities that are appropriate for the urban-rural and socio-
cultural settings. Establishing community centers or day-care centers for older persons to go
to while children are at work will also encourage co-residence between older parents and
children. Besides lessening the burden of care-giving on the part of children, it can also
improve the well-being through companionship and support for the older persons.
Universities and colleges may include visitations of older people as part of the community
services program for their students. In implementing programs and strategies to improve the
well-being of the older people under the National Policy for Older People, it behoves the
Ministry of Women, Family and Community Development and other agencies, including
NGOs to implement programs and strategies to strengthen intergenerational relationships
among family members and community support for older people.
Our analysis shows that older people who engaged in religious activities were less likely to
experience more loneliness. Though, this effect was significantly apparent among older
Malays. This finding corroborates with previous research showing that religiosity has a
positive association with subjective well-being among Muslims [50, 51]. Leisure activities,
however, were not associated with loneliness. A likely reason for this may be due to reverse
causation. It is possible that the feelings of loneliness may generate a defensive form of
thinking, which can make it harder for one to engage in social activities [52]. Lonely people
are more inclined to experience anxiety, pessimism, and fearful of negative evaluation than
people who are not lonely. Moreover, older persons at advanced ages with dwindling circle of
friends, may find it difficult to start new relationships [53].

Our findings corroborate with findings of past studies on the association between chronic
diseases and loneliness [18]. Cardiovascular diseases, chronic respiratory diseases and
diabetes are among the top four non-communicable diseases which have resulted in the
highest number of deaths, especially in low and middle-income countries [54]. People
suffering from chronic diseases often have disabilities which restrict their mobility and deter
them from forging relationships, which in turn result in loneliness [15, 17]. Unhealthy
lifestyle habits such as poor diet, inadequate amount of physical activity, excessive use of
alcohol and tobacco use are known to increase the risk of suffering from chronic diseases [54,
55]. Thus, health intervention programs will not only encourage healthy diet and lifestyles,
but will also improve the emotional state and well-being of older persons.
This study has several limitations. The ethnic distribution from the 2004 MPFS deviated
somewhat from the population. According to the latest national census, the ethnic distribution
of Malaysian population aged 60 and above comprised of 48% Malays, 36% Chinese, 7%
Indians and 9% Indigenous people [30]. The wide deviation of the ethnic distribution of the
sample from the national population was due to the separate sample selection in Sabah and
Sarawak to produce sufficient sample sizes for the two East Malaysian states [41, 42]. We
have addressed this sampling issue by introducing the appropriate weight to the data. Apart
from the ethnic variable, the sample was rather representative of the older population in terms
of place of residence, educational level and marital status [56]. The wide gender disparity in
socioeconomic characteristics such as marital status, employment and educational level
corroborates with findings from past studies. These studies show significantly lower literacy
rates, labour force participation rates and income among older females and their dependence
on financial assistance from adult children, as compared to older males [57, 58].

Another limitation of this study is that findings based on data from a survey conducted ten
years ago may not reflect the current situation, as Malaysia has undergone a decade of rapid
socioeconomic changes. Moreover, insufficient cases in the Indian sample did not allow for
an examination of the levels of loneliness among older Indians. The use of cross-sectional
data does not allow a deeper analysis of the changes in the psychosocial behaviour among
older Malaysians. However, we stress that the focus of this study is on the effects of family
support and social participation on feelings of loneliness within the multi-ethnic and
multicultural context, which has not been studied before. We are of the view that factors
affecting loneliness would not have changed substantially in the short run despite the social
changes that have taken place. Moreover, this study will provide a useful baseline for a
comparative analysis in the future, with the release of the 2014 Malaysian Population and
Family Survey data in the near future.
Conclusion
Our findings reaffirm the important role of the family in alleviating the feelings of loneliness
among the elderly. Adult children, especially those who live together, provide physical,
financial and emotional support to their parents. The government has always held that it is the
responsibility of the families to take care of their elders. However, family support for the
elderly and co-residence may be eroding due to socio-demographic changes such as the trend
towards delayed and non-marriage, shrinking family size, out-migration of the children,
increased female labour force participation and living in condominium [30, 43, 56]. Hence,

appropriate programmes and strategies will have to be put in place to strengthen the family
institution in the care of the elderly.
Acknowledgements
We are grateful to the National Population and Family Development Board of Malaysia for
granting us permission to use the 2004 Malaysian Population and Family Survey data.
Declaration of Conflicting Interests
The authors declared no potential conflicts of interest with respect to the research, authorship
and/or publication of this article.
Funding
The authors received no financial support for the research and/or authorship of this article.
References
1. De Jong Gierveld, J. and T. Van Tilburg, A 6-Item scale for overall, emotional, and
social loneliness: Confirmatory tests on survey data. Research on Aging, 2006. 28(5):
p. 582-598.
2. Koropeckyj-Cox, T., Loneliness and depression in middle and old age: Are the
childless more vulnerable? Journals of Gerontology Series B: Psychological Sciences
and Social Sciences, 1998. 53B(6): p. S303-S312.
3. VanderWeele, T.J., L.C. Hawkley, and J.T. Cacioppo, On the reciprocal association
between loneliness and subjective well-being. American Journal of Epidemiology,
2012. 176(9): p. 777-784.

4. Hawkley, L.C., et al., From social structural factors to perceptions of relationship
quality and loneliness: The Chicago Health, Aging, and Social Relations Study.
Journals of Gerontology Series B: Psychological Sciences and Social Sciences, 2008.
63(6): p. S375-S384.
5. Peplau, L.A. and D. Perlman, eds. Loneliness: A sourcebook of current theory,
research and therapy. Wiley series on personality processes. 1982, John Wiley &
Sons: New York.
6. Karnick, P.M., Feeling lonely: Theoretical perspectives. Nursing Science Quarterly,
2005. 18(1): p. 7-12.
7. Fees, B.S., P. Martin, and L.W. Poon, A model of loneliness in older adults. Journals
of Gerontology Series B: Psychological Sciences and Social Sciences, 1999. 54B(4):
p. P231-P239.
8. Park, N.S., et al., The mediating role of loneliness in the relation between social
engagement and depressive symptoms among older Korean Americans: Do men and
women differ? Journals of Gerontology Series B: Psychological Sciences and Social
Sciences, 2012.
9. Pitkala, K.H., et al., Effects of psychosocial group rehabilitation on health, use of
health care services, and mortality of older persons suffering from loneliness: A
randomized, controlled trial. Journals of Gerontology Series A: Biological Sciences
and Medical Sciences, 2009. 64A(7): p. 792-800.
10. Alpass, F.M. and S. Neville, Loneliness, health and depression in older males. Aging
& Mental Health, 2003. 7(3): p. 212.
11. Hauge, S. and M. Kirkevold, Variations in older persons’ descriptions of the burden
of loneliness. Scandinavian Journal of Caring Sciences, 2012. 26(3): p. 553-560.
12. Jaremka, L.M., et al., Loneliness predicts pain, depression, and fatigue:
Understanding the role of immune dysregulation. Psychoneuroendocrinology, 2013.
38(8): p. 1310-1317.
13. Creecy, R.F., W.E. Berg, and R. Wright, Loneliness among the elderly: A causal
approach. Journal of Gerontology, 1985. 40(4): p. 487-493.
14. Holmén, K., et al., Loneliness among elderly people living in Stockholm: A population
study. Journal of Advanced Nursing, 1992. 17(1): p. 43-51.
15. Pinquart, M. and S. Sorensen, Influences on loneliness in older adults: A meta-
analysis. Basic and Applied Social Psychology, 2001. 23(4): p. 245-266.
16. Lauder, W., S. Sharkey, and K. Mummery, A community survey of loneliness. Journal
of Advanced Nursing, 2004. 46(1): p. 88-94.
17. Aartsen, M. and M. Jylhä, Onset of loneliness in older adults: Results of a 28 year
prospective study. European Journal of Ageing, 2011. 8(1): p. 31-38.
18. Penninx, B.W.J.H., et al., Social network, social support, and loneliness in older
persons with different chronic diseases. Journal of Aging and Health, 1999. 11(2): p.
151-168.
19. Verstraten, P.F.J., et al., Loneliness, adaptation to vision impairment, social support
and depression among visually impaired elderly. International Congress Series, 2005.
1282(0): p. 317-321.
20. Litwin, H., Social networks and well-being: A comparison of older people in
Mediterranean and non-Mediterranean countries. Journals of Gerontology Series B:
Psychological Sciences and Social Sciences, 2009. 65B(5): p. 599-608.
21. Long, M.V. and P. Martin, Personality, relationship closeness, and loneliness of
oldest old adults and their children. Journals of Gerontology Series B: Psychological
Sciences and Social Sciences, 2000. 55(5): p. P311-P319.

22. Blake, J., Is zero preferred? American attitudes toward childlessness in the 1970s.
Journal of Marriage and Family, 1979. 41(2): p. 245-257.
23. De Jong Gierveld, J., et al., Quality of marriages in later life and emotional and social
loneliness. Journals of Gerontology Series B: Psychological Sciences and Social
Sciences, 2009. 64B(4): p. 497-506.
24. Dykstra, P.A., Loneliness among the never and formerly married: The importance of
supportive friendships and a desire for independence. Journals of Gerontology Series
B: Psychological Sciences and Social Sciences, 1995. 50B: p. S321-S329.
25. Adams, R.G. and R. Blieszner, Aging Well With Family And Friends. American
Behavioral Scientist, 1995. 39(2): p. 209-224.
26. Jylhä, M. and J. Jokela, Individual experiences as cultural – a cross-cultural study on
loneliness among the elderly. Ageing & Society, 1990. 10(3): p. 295-315.
27. Kahn, R. and T. Antonucci, Convoys over the life course: Attachment, roles and
social support., in Lifespan development and behaviour, P. Baltes and O. Brim,
Editors. 1980, Academic Press: New York. p. 253-86.
28. Antonucci, T.C. and H. Akiyama, Social networks in adult life and a preliminary
examination of the Convoy Model. Journal of Gerontology, 1987. 42(5): p. 519-527.
29. Berkman, L.F., et al., From social integration to health: Durkheim in the new
millenium. Social Science & Medicine, 2000. 51: p. 843-857.
30. Department of Statistics Malaysia, Population distribution and basic demographic
characteristics, 2010. 2011: Putrajaya.
31. Caraher, K., Malaysia: Approaches to income security in old age. Social Policy and
Society, 2003. 2(4): p. 295-304.
32. Chan , A., Aging in Southeast and East Asia: Issues and policy directions. Journal of
Cross-Cultural Gerontology, 2005. 20(4): p. 269-284.
33. Yaacob, M.F., Formal old age financial security schemes in Malaysia, in Social
welfare East and West: Britain and Malaysia, J. Doling and R. Omar, Editors. 2000,
Aldershot: Ashgate. p. 71-79.
34. Department of Statistics Malaysia, Malaysia @ a Glance 2010-2013. 2014: Putrajaya.
35. Zarinah, M. and Department of Statistics Malaysia, Demographic transition in
Malaysia: The changing roles of women, in 15th Conference of Commonwealth
Statisticians. 2011: New Delhi, India.
36. Tengku Aizan, H. and M. Jariah, Financial well being of older Malaysians, in
International Seminar on Social Security Organised by The Employees Provident
Fund. 2010: Kuala Lumpur.
37. Shahar, S., J. Earland, and S. Abd Rahman, Social and health profiles of rural elderly
Malays. Singapore Med J, 2001. 42(5): p. 208-13.
38. DaVanzo, J. and A. Chan, Living arrangements of older Malaysians: Who coresides
with their adult children? Demography, 1994. 31(1): p. 95-113.
39. Jones, G.W., Challenges of ageing in East and Southeast Asia: Living arrangements
of older persons, social security trends and retirement options, in The impact of
ageing: A common challenge for Europe and Asia, G. Sinigoj, et al., Editors. 2007,
LIT Verlag: Berlin.
40. Attias-Donfut, C., Cultural and economic transfers between generations. The
Gerontologist, 2000. 40(3): p. 270-272.
41. National Population and Family Development Board Malaysia, Laporan kajian
penduduk dan keluarga Malaysia: Sabah [Malaysian population and family survey
report: Sabah]. 2004: Kuala Lumpur.

42. National Population and Family Development Board Malaysia, Laporan kajian
penduduk dan keluarga Malaysia: Sarawak [Malaysian population and family survey
report: Sarawak]. 2004: Kuala Lumpur.
43. National Population and Family Development Board Malaysia, Laporan kajian
penduduk dan keluarga Malaysia: Semenanjung Malaysia [Malaysian population and
family survey report: Peninsular Malaysia] 2004: Kuala Lumpur.
44. Liao, T.F., Interpreting Probability Models: Logit, Probit, and Other Generalized
Linear Models Quantitative Applications in the Social Sciences 1994, Thousand
Oaks, CA: Sage Publications
45. Tey, N.P., Trends in delayed and non-marriage in Peninsular Malaysia. Asian
Population Studies, 2007. 3(3): p. 243-261.
46. Van Tilburg, T., et al., Social integration and loneliness: A comparative study among
older adults in the Netherlands and Tuscany, Italy. Journal of Social and Personal
Relationships, 1998. 15(6): p. 740-754.
47. Hadi, K., et al., Living arrangement and life satisfaction in older Malaysians: The
mediating role of social support function. PLoS ONE, 2012. 7(8).
48. Lillard, L.A. and R.J. Willis, Motives for intergenerational transfers: Evidence from
Malaysia. Demography, 1997. 34(1): p. 115-134.
49. Asher, M.G. and A.S. Bali, Malaysia, in Pension systems in East and Southeast Asia:
Promoting fairness and sustainability, D. Park, Editor. 2012, Asian Development
Bank: Mandaluyong, Philippines.
50. Achour, M., et al., Measuring religiosity and its effects on personal well-being: A
case study of Muslim female academicians in Malaysia. J Relig Health, 2014. 27: p.
27.
51. Tiliouine, H., R.A. Cummins, and M. Davern, Islamic religiosity, subjective well-
being, and health. Mental Health, Religion & Culture, 2008. 12(1): p. 55-74.
52. Cacioppo, J.T. and L.C. Hawkley, People thinking about people: The vicious cycle of
being a social outcast in one's own mind, in The social outcast: Ostracism, social
exclusion, rejection, and bullying, K.D. Williams, J.P. Forgas, and W.v. Hippel,
Editors. 2005, Psychology Press: New York. p. 91-108.
53. Singh, A. and N. Misra, Loneliness, depression and sociability in old age. Ind
Psychiatry J, 2009. 18(1): p. 51-5.
54. World Health Organization, Global status report on noncommunicable diseases 2010.
2011: Geneva
55. Centers for Disease Control and Prevention. Chronic diseases: The power to prevent,
the call to control. 2009; Available from:
http://www.cdc.gov/chronicdisease/resources/publications/AAG/chronic.htm.
56. Department of Statistics Malaysia, Population distribution and basic demographic
characteristics, 2000. 2001: Putrajaya.
57. Tengku Aizan, H., M. Jariah, and S.T. Chai, Socioecnomic status of older
Malaysians: A gender comparison. Malaysian Journal of Family Studies, 2004. 1(1):
p. 54-69.
58. Tey, N.P. and H. Tengku Aizan, Gender differentials in work and income among
older Malaysians, in Gender and Ageing. In press, Institute of Southeast Asian
Studies: Singapore. p. 266-286.
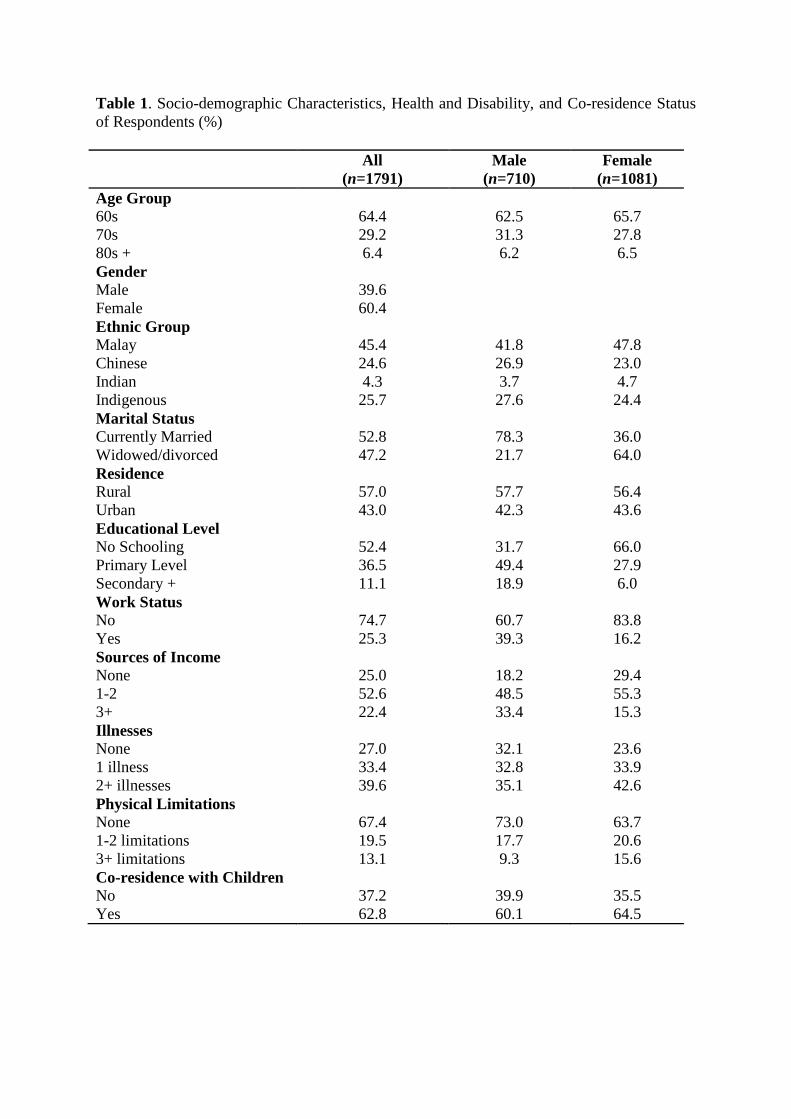
Table 1. Socio-demographic Characteristics, Health and Disability, and Co-residence Status
of Respondents (%)
All
(n=1791)
Male
(n=710)
Female
(n=1081)
Age Group
60s 64.4 62.5 65.7
70s 29.2 31.3 27.8
80s + 6.4 6.2 6.5
Gender
Male 39.6
Female 60.4
Ethnic Group
Malay 45.4 41.8 47.8
Chinese 24.6 26.9 23.0
Indian 4.3 3.7 4.7
Indigenous 25.7 27.6 24.4
Marital Status
Currently Married 52.8 78.3 36.0
Widowed/divorced 47.2 21.7 64.0
Residence
Rural 57.0 57.7 56.4
Urban 43.0 42.3 43.6
Educational Level
No Schooling 52.4 31.7 66.0
Primary Level 36.5 49.4 27.9
Secondary + 11.1 18.9 6.0
Work Status
No 74.7 60.7 83.8
Yes 25.3 39.3 16.2
Sources of Income
None 25.0 18.2 29.4
1-2 52.6 48.5 55.3
3+ 22.4 33.4 15.3
Illnesses
None 27.0 32.1 23.6
1 illness 33.4 32.8 33.9
2+ illnesses 39.6 35.1 42.6
Physical Limitations
None 67.4 73.0 63.7
1-2 limitations 19.5 17.7 20.6
3+ limitations 13.1 9.3 15.6
Co-residence with Children
No 37.2 39.9 35.5
Yes 62.8 60.1 64.5

Table 2. Percentage and Frequency Distribution of Respondents by Levels of Loneliness.
Loneliness n Per cent
Total 1791 100.0
Not lonely 835 46.6
Sometimes lonely 582 32.5
Always lonely 374 20.9
Table 3. Percentage Distribution of Respondents by Levels of Loneliness, According to
Selected Socio-demographic and Socioeconomic Characteristics, Health and Physical
condition, Various Forms of Family Support and Community Engagement (n = 1791).
Variables/ categories Not lonely Sometimes
lonely
Always
lonely
Total n
Age Group **
60s 49.5 31.5 19.1 100 1154
70s 44.2 33.5 22.4 100 523
80s+ 28.9 38.6 32.5 100 114
Sex **
Male 54.6 28.9 16.5 100 710
Female 41.4 34.9 23.8 100 1081
Ethnic group **
Malay 41.2 37.3 21.5 100 814
Chinese 68.0 23.4 8.6 100 440
Indian 57.1 24.7 18.2 100 77
Indigenous 34.1 33.9 32.0 100 460
Marital status **
Currently married 54.7 30.6 14.7 100 945
Widowed/divorced 37.6 34.6 27.8 100 846
Residence **
Urban 56.8 28.9 14.3 100 771
Rural 38.9 35.2 25.9 100 1020
Education level **
No schooling 38.1 34.1 27.8 100 939
Primary level 52.5 33.4 14.1 100 653
Secondary + 67.3 22.1 10.6 100 199
Work status
Still working 49.3 30.6 20.0 100 454
Not working 45.7 33.1 21.2 100 1337
Sources of income **
None 37.6 35.6 26.8 100 447
1-2 sources 47.1 32.2 20.7 100 942
3+ sources 55.5 29.9 14.7 100 402
Illnesses **
None 55.3 29.6 15.1 100 483
1 illness 44.4 31.7 23.9 100 599
2+ illnesses 42.6 35.1 22.3 100 709
Physical limitations **
None 51.4 30.4 18.1 100 1207
1-2 limitations 37.5 36.7 25.8 100 349
3+ limitations 35.3 37.0 27.7 100 235
Monetary support **
Yes 50.5 32.0 17.4 100 986
No 41.9 33.0 25.1 100 805
Paying bills *
Yes 48.6 33.9 17.5 100 954
No 44.3 30.9 24.7 100 837
Food / other necessities
Yes 47.2 33.2 19.5 100 1188
No 45.4 31.0 23.5 100 603
Housework *
Yes 46.6 34.8 18.6 100 1102
No 46.7 28.7 24.5 100 689
Co-residence **
Yes 50.3 33.1 16.6 100 1124
No 40.5 31.6 27.9 100 659
Religion activities
Yes 46.6 34.0 19.4 100 977
No 46.5 30.9 22.6 100 810
Leisure activities
Yes 46.5 33.1 20.4 100 824
No 46.7 32.0 21.3 100 967
Note: ** p < 0.001; * p < 0.05

Table 4. Results of Ordinal Logistic Regression on Higher levels of Loneliness (n = 1791).
Attributes OR 95% CI
Age group (ref: 60s)
70s 0.99 (0.79 - 1.24)
80s+ 1.70 (1.14 - 2.54)
Male 0.95 (0.75 - 1.20)
Ethnicity (ref: Malay)
Indigenous 1.25 (0.90 - 1.73)
Chinese 0.36 (0.28 - 0.46)
Indian 0.52 (0.34 - 0.77)
Married 0.51 (0.41 - 0.64)
Urban 0.81 (0.65 - 1.00)
Edu level (ref: No Schooling)
Primary level 0.83 (0.67 - 1.04)
Secondary + 0.81 (0.57 - 1.17)
Still working 0.99 (0.78 - 1.27)
Income sources (ref: None)
1 – 2 sources 0.71 (0.56 – 0.89)
3+ sources 0.57 (0.43 – 0.77)
Illnesses (ref: None)
1 illness 1.47 (1.15 – 1.87)
2+ illnesses 1.65 (1.30 – 2.10)
Physical limitations (ref: None)
1 – 2 limitations 1.16 (0.90 - 1.49)
3+ limitations 1.13 (0.84 - 1.52)
Monetary 0.79 (0.64 - 0.98)
Payment of bills 0.99 (0.78 - 1.25)
Food/necessities 0.85 (0.66 - 1.11)
Housework 0.95 (0.74 - 1.21)
Co-residence 0.67 (0.53 - 0.84)
Religious activities 0.77 (0.62 - 0.96)
Leisure activities 1.00 (0.81 - 1.24)
Chi-square a 33.010
p – value a 0.104
df a 24
Note: Odds ratio in bold indicate significance at 0.05
a. Test of parallel lines

Table 5. Results of Ordinal Logistic Regression for Ethnic Groups.
OR ( 95% CI )
Attributes Malay Chinese Indigenous
(n = 814) (n = 440) (n=460)
Age group (ref: 60s)
70s 0.84 (0.60-1.17) 1.10 (0.66-1.84) 1.01 (0.66-1.56)
80s+ 1.69 (0.92-3.09) 1.53 (0.67-3.52) 1.31 (0.62-2.78)
Male 0.78 (0.55-1.11) 1.25 (0.74-2.11) 0.76 (0.50-1.18)
Married 0.67 (0.49-0.92) 0.31 (0.19-0.51) 0.48 (0.32-0.72)
Urban 0.83 (0.62-1.10) 0.81 (0.47-1.39) 0.78 (0.47-1.29)
Edu level (ref: No Schooling)
Primary level 0.70 (0.52-0.94) 1.02 (0.61-1.72) 0.86 (0.48-1.53)
Secondary + 0.51 (0.28-0.93) 1.17 (0.58-2.34) 0.21 (0.05-0.93)
Still working 1.14 (0.80-1.63) 0.64 (0.35-1.14) 1.01 (0.66-1.55)
Income sources (ref: None)
1 – 2 sources 0.64 (0.46-0.90) 0.53 (0.32-0.89) 0.99 (0.66-1.47)
3+ sources 0.56 (0.38-0.85) 0.43 (0.21-0.88) 0.91 (0.49-1.71)
Illnesses (ref: None)
1 illness 1.63 (1.15-2.29) 1.12 (0.65-1.94) 1.76 (1.07-2.92)
2+ illnesses 1.72 (1.23-2.41) 1.99 (1.16-3.41) 1.05 (0.63-1.73)
Physical limit. (ref: None)
1 – 2 limitations 1.23 (0.87-1.74) 1.25 (0.65-2.38) 1.73 (1.09-2.75)
3+ limitations 1.26 (0.84-1.89) 1.39 (0.66-2.93) 1.31 (0.68-2.53)
Monetary 0.78 (0.58-1.06) 0.79 (0.48-1.30) 0.98 (0.62-1.53)
Payment of bills 0.87 (0.61-1.23) 1.16 (0.66-2.05) 0.65 (0.41-1.02)
Food/necessities 0.98 (0.67-1.44) 0.72 (0.40-1.30) 0.77 (0.44-1.34)
Housework 1.22 (0.85-1.76) 0.58 (0.34-0.99) 0.96 (0.56-1.62)
Co-residence 0.73 (0.53-1.01) 0.59 (0.35-1.00)+ 0.57 (0.35-0.92)
Religious activities 0.69 (0.50-0.94) 0.92 (0.57-1.49) 1.05 (0.71-1.55)
Leisure activities 1.08 (0.81-1.45) 1.06 (0.64-1.77) 1.02 (0.69-1.51)
Chi-square a 32.244 9.461 20.948
p – value a 0.550 0.985 0.462
df a 21 21 21
Note: Odds ratio in bold indicate significance at 0.05
a. Test of parallel lines
+. Marginal significance