title stata.com intro — introduction to bayesian … — introduction to bayesian analysis ......
TRANSCRIPT

Title stata.com
intro — Introduction to Bayesian analysis
Description Remarks and examples References Also see
DescriptionThis entry provides a software-free introduction to Bayesian analysis. See [BAYES] bayes for an
overview of the software for performing Bayesian analysis and for an overview example.
Remarks and examples stata.com
Remarks are presented under the following headings:
What is Bayesian analysis?Bayesian versus frequentist analysis, or why Bayesian analysis?How to do Bayesian analysisAdvantages and disadvantages of Bayesian analysisBrief background and literature reviewBayesian statistics
Posterior distributionSelecting priorsPoint and interval estimationComparing Bayesian modelsPosterior prediction
Bayesian computationMarkov chain Monte Carlo methods
Metropolis–Hastings algorithmAdaptive random-walk Metropolis–HastingsBlocking of parametersMetropolis–Hastings with Gibbs updatesConvergence diagnostics of MCMC
Summary
The first five sections provide a general introduction to Bayesian analysis. The remaining sectionsprovide a more technical discussion of the concepts of Bayesian analysis.
What is Bayesian analysis?
Bayesian analysis is a statistical analysis that answers research questions about unknown parametersof statistical models by using probability statements. Bayesian analysis rests on the assumption that allmodel parameters are random quantities and thus can incorporate prior knowledge. This assumptionis in sharp contrast with the more traditional, also called frequentist, statistical inference where allparameters are considered unknown but fixed quantities. Bayesian analysis follows a simple ruleof probability, the Bayes rule, which provides a formalism for combining prior information withevidence from the data at hand. The Bayes rule is used to form the so called posterior distribution ofmodel parameters. The posterior distribution results from updating the prior knowledge about modelparameters with evidence from the observed data. Bayesian analysis uses the posterior distribution toform various summaries for the model parameters including point estimates such as posterior means,medians, percentiles, and interval estimates such as credible intervals. Moreover, all statistical testsabout model parameters can be expressed as probability statements based on the estimated posteriordistribution.
1

2 intro — Introduction to Bayesian analysis
As a quick introduction to Bayesian analysis, we use an example, described in Hoff (2009, 3),of estimating the prevalence of a rare infectious disease in a small city. A small random sample of20 subjects from the city will be checked for infection. The parameter of interest θ ∈ [0, 1] is thefraction of infected individuals in the city. Outcome y records the number of infected individuals inthe sample. A reasonable sampling model for y is a binomial model: y|θ ∼ Binomial(20, θ). Basedon the studies from other comparable cities, the infection rate ranged between 0.05 and 0.20, withan average prevalence of 0.10. To use this information, we must conduct Bayesian analysis. Thisinformation can be incorporated into a Bayesian model with a prior distribution for θ, which assignsa large probability between 0.05 and 0.20, with the expected value of θ close to 0.10. One potentialprior that satisfies this condition is a Beta(2, 20) prior with the expected value of 2/(2 + 20) = 0.09.So, let’s assume this prior for the infection rate θ, that is, θ ∼ Beta(2, 20). We sample individualsand observe none who have an infection, that is, y = 0. This value is not that uncommon for a smallsample and a rare disease. For example, for a true rate θ = 0.05, the probability of observing 0infections in a sample of 20 individuals is about 36% according to the binomial distribution. So, ourBayesian model can be defined as follows:
y|θ ∼ Binomial(20, θ)
θ ∼ Beta(2, 20)
For this Bayesian model, we can actually compute the posterior distribution of θ|y, which isθ|y ∼ Beta(2 + 0, 20 + 20− 0) = Beta(2, 40). The prior and posterior distributions of θ are depictedbelow.
05
10
15
0 .2 .4 .6 .8 1Proportion infected in the population, θ
p(θ) p(θ|y)
Prior and posterior distributions of θ
The posterior density (shown in red) is more peaked and shifted to the left compared with the priordistribution (shown in blue). The posterior distribution combined the prior information about θ with
intro — Introduction to Bayesian analysis 3
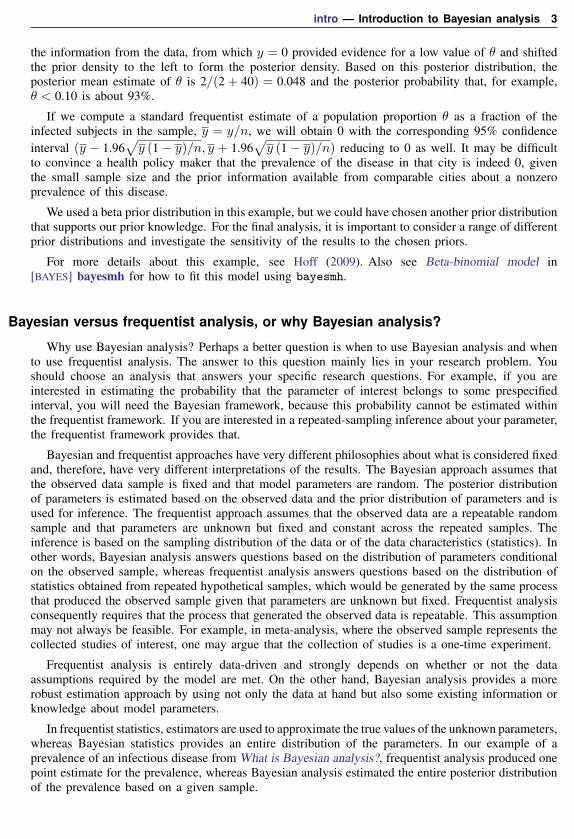
the information from the data, from which y = 0 provided evidence for a low value of θ and shiftedthe prior density to the left to form the posterior density. Based on this posterior distribution, theposterior mean estimate of θ is 2/(2 + 40) = 0.048 and the posterior probability that, for example,θ < 0.10 is about 93%.
If we compute a standard frequentist estimate of a population proportion θ as a fraction of theinfected subjects in the sample, y = y/n, we will obtain 0 with the corresponding 95% confidenceinterval (y − 1.96
√y (1− y)/n, y + 1.96
√y (1− y)/n) reducing to 0 as well. It may be difficult
to convince a health policy maker that the prevalence of the disease in that city is indeed 0, giventhe small sample size and the prior information available from comparable cities about a nonzeroprevalence of this disease.
We used a beta prior distribution in this example, but we could have chosen another prior distributionthat supports our prior knowledge. For the final analysis, it is important to consider a range of differentprior distributions and investigate the sensitivity of the results to the chosen priors.
For more details about this example, see Hoff (2009). Also see Beta-binomial model in[BAYES] bayesmh for how to fit this model using bayesmh.
Bayesian versus frequentist analysis, or why Bayesian analysis?
Why use Bayesian analysis? Perhaps a better question is when to use Bayesian analysis and whento use frequentist analysis. The answer to this question mainly lies in your research problem. Youshould choose an analysis that answers your specific research questions. For example, if you areinterested in estimating the probability that the parameter of interest belongs to some prespecifiedinterval, you will need the Bayesian framework, because this probability cannot be estimated withinthe frequentist framework. If you are interested in a repeated-sampling inference about your parameter,the frequentist framework provides that.
Bayesian and frequentist approaches have very different philosophies about what is considered fixedand, therefore, have very different interpretations of the results. The Bayesian approach assumes thatthe observed data sample is fixed and that model parameters are random. The posterior distributionof parameters is estimated based on the observed data and the prior distribution of parameters and isused for inference. The frequentist approach assumes that the observed data are a repeatable randomsample and that parameters are unknown but fixed and constant across the repeated samples. Theinference is based on the sampling distribution of the data or of the data characteristics (statistics). Inother words, Bayesian analysis answers questions based on the distribution of parameters conditionalon the observed sample, whereas frequentist analysis answers questions based on the distribution ofstatistics obtained from repeated hypothetical samples, which would be generated by the same processthat produced the observed sample given that parameters are unknown but fixed. Frequentist analysisconsequently requires that the process that generated the observed data is repeatable. This assumptionmay not always be feasible. For example, in meta-analysis, where the observed sample represents thecollected studies of interest, one may argue that the collection of studies is a one-time experiment.
Frequentist analysis is entirely data-driven and strongly depends on whether or not the dataassumptions required by the model are met. On the other hand, Bayesian analysis provides a morerobust estimation approach by using not only the data at hand but also some existing information orknowledge about model parameters.
In frequentist statistics, estimators are used to approximate the true values of the unknown parameters,whereas Bayesian statistics provides an entire distribution of the parameters. In our example of aprevalence of an infectious disease from What is Bayesian analysis?, frequentist analysis produced onepoint estimate for the prevalence, whereas Bayesian analysis estimated the entire posterior distributionof the prevalence based on a given sample.

4 intro — Introduction to Bayesian analysis
Frequentist inference is based on the sampling distributions of estimators of parameters and providesparameter point estimates and their standard errors as well as confidence intervals. The exact samplingdistributions are rarely known and are often approximated by a large-sample normal distribution.Bayesian inference is based on the posterior distribution of the parameters and provides summaries ofthis distribution including posterior means and their MCMC standard errors (MCSE) as well as credibleintervals. Although exact posterior distributions are known only in a number of cases, general posteriordistributions can be estimated via, for example, Markov chain Monte Carlo (MCMC) sampling withoutany large-sample approximation.
Frequentist confidence intervals do not have straightforward probabilistic interpretations as doBayesian credible intervals. For example, the interpretation of a 95% confidence interval is that ifwe repeat the same experiment many times and compute confidence intervals for each experiment,then 95% of those intervals will contain the true value of the parameter. For any given confidenceinterval, the probability that the true value is in that interval is either zero or one, and we do notknow which. We may only infer that any given confidence interval provides a plausible range for thetrue value of the parameter. A 95% Bayesian credible interval, on the other hand, provides a rangefor a parameter such that the probability that the parameter lies in that range is 95%.
Frequentist hypothesis testing is based on a deterministic decision using a prespecified significancelevel of whether to accept or reject the null hypothesis based on the observed data, assuming thatthe null hypothesis is actually true. The decision is based on a p-value computed from the observeddata. The interpretation of the p-value is that if we repeat the same experiment and use the sametesting procedure many times, then given our null hypothesis is true, we will observe the result (teststatistic) as extreme or more extreme than the one observed in the sample (100× p-value)% of thetimes. The p-value cannot be interpreted as a probability of the null hypothesis, which is a commonmisinterpretation. In fact, it answers the question of how likely are our data given that the nullhypothesis is true, and not how likely is the null hypothesis given our data. The latter question canbe answered by Bayesian hypothesis testing, where we can compute the probability of any hypothesisof interest.
How to do Bayesian analysis
Bayesian analysis starts with the specification of a posterior model. The posterior model describesthe probability distribution of all model parameters conditional on the observed data and some priorknowledge. The posterior distribution has two components: a likelihood, which includes informationabout model parameters based on the observed data, and a prior, which includes prior information(before observing the data) about model parameters. The likelihood and prior models are combinedusing the Bayes rule to produce the posterior distribution:
Posterior ∝ Likelihood× Prior
If the posterior distribution can be derived in a closed form, we may proceed directly to theinference stage of Bayesian analysis. Unfortunately, except for some special models, the posteriordistribution is rarely available explicitly and needs to be estimated via simulations. MCMC samplingcan be used to simulate potentially very complex posterior models with an arbitrary level of precision.MCMC methods for simulating Bayesian models are often demanding in terms of specifying an efficientsampling algorithm and verifying the convergence of the algorithm to the desired posterior distribution.
Inference is the next step of Bayesian analysis. If MCMC sampling is used for approximating theposterior distribution, the convergence of MCMC must be established before proceeding to inference.Point and interval estimators are either derived from the theoretical posterior distribution or estimatedfrom a sample simulated from the posterior distribution. Many Bayesian estimators, such as posterior

intro — Introduction to Bayesian analysis 5
mean and posterior standard deviation, involve integration. If the integration cannot be performedanalytically to obtain a closed-form solution, sampling techniques such as Monte Carlo integrationand MCMC and numerical integration are commonly used.
Bayesian hypothesis testing can take two forms, which we refer to as interval-hypothesis testingand model-hypothesis testing. In an interval-hypothesis testing, the probability that a parameter ora set of parameters belongs to a particular interval or intervals is computed. In model hypothesistesting, the probability of a Bayesian model of interest given the observed data is computed.
Model comparison is another common step of Bayesian analysis. The Bayesian framework providesa systematic and consistent approach to model comparison using the notion of posterior odds andrelated to them Bayes factors. See [BAYES] bayesstats ic for details.
Finally, prediction of some future unobserved data may also be of interest in Bayesian analysis.The prediction of a new data point is performed conditional on the observed data using the so-calledposterior predictive distribution, which involves integrating out all parameters from the model withrespect to their posterior distribution. Again, Monte Carlo integration is often the only feasible optionfor obtaining predictions. Prediction can also be helpful in estimating the goodness of fit of a model.
Advantages and disadvantages of Bayesian analysis
Bayesian analysis is a powerful analytical tool for statistical modeling, interpretation of results,and prediction of data. It can be used when there are no standard frequentist methods available orthe existing frequentist methods fail. However, one should be aware of both the advantages anddisadvantages of Bayesian analysis before applying it to a specific problem.
The universality of the Bayesian approach is probably its main methodological advantage to thetraditional frequentist approach. Bayesian inference is based on a single rule of probability, the Bayesrule, which is applied to all parametric models. This makes the Bayesian approach universal andgreatly facilitates its application and interpretation. The frequentist approach, however, relies on avariety of estimation methods designed for specific statistical problems and models. Often, inferentialmethods designed for one class of problems cannot be applied to another class of models.
In Bayesian analysis, we can use previous information, either belief or experimental evidence, ina data model to acquire more balanced results for a particular problem. For example, incorporatingprior information can mitigate the effect of a small sample size. Importantly, the use of the priorevidence is achieved in a theoretically sound and principled way.
By using the knowledge of the entire posterior distribution of model parameters, Bayesian inferenceis far more comprehensive and flexible than the traditional inference.
Bayesian inference is exact, in the sense that estimation and prediction are based on the posteriordistribution. The latter is either known analytically or can be estimated numerically with an arbitraryprecision. In contrast, many frequentist estimation procedures such as maximum likelihood rely onthe assumption of asymptotic normality for inference.
Bayesian inference provides a straightforward and more intuitive interpretation of the results interms of probabilities. For example, credible intervals are interpreted as intervals to which parametersbelong with a certain probability, unlike the less straightforward repeated-sampling interpretation ofthe confidence intervals.
Bayesian models satisfy the likelihood principle (Berger and Wolpert 1988) that the information ina sample is fully represented by the likelihood function. This principle requires that if the likelihoodfunction of one model is proportional to the likelihood function of another model, then inferencesfrom the two models should give the same results. Some researchers argue that frequentist methodsthat depend on the experimental design may violate the likelihood principle.

6 intro — Introduction to Bayesian analysis
Finally, as we briefly mentioned earlier, the estimation precision in Bayesian analysis is not limitedby the sample size—Bayesian simulation methods may provide an arbitrary degree of precision.
Despite the conceptual and methodological advantages of the Bayesian approach, its application inpractice is still considered controversial sometimes. There are two main reasons for this—the presumedsubjectivity in specifying prior information and the computational challenges in implementing Bayesianmethods. Along with the objectivity that comes from the data, the Bayesian approach uses potentiallysubjective prior distribution. That is, different individuals may specify different prior distributions.Proponents of frequentist statistics argue that for this reason, Bayesian methods lack objectivity andshould be avoided. Indeed, there are settings such as clinical trial cases when the researchers want tominimize a potential bias coming from preexisting beliefs and achieve more objective conclusions.Even in such cases, however, a balanced and reliable Bayesian approach is possible. The trend inusing noninformative priors in Bayesian models is an attempt to address the issue of subjectivity. Onthe other hand, some Bayesian proponents argue that the classical methods of statistical inferencehave built-in subjectivity such as a choice for a sampling procedure, whereas the subjectivity is madeexplicit in Bayesian analysis.
Building a reliable Bayesian model requires extensive experience from the researchers, which leadsto the second difficulty in Bayesian analysis—setting up a Bayesian model and performing analysisis a demanding and involving task. This is true, however, to an extent for any statistical modelingprocedure.
Lastly, one of the main disadvantages of Bayesian analysis is the computational cost. As a rule,Bayesian analysis involves intractable integrals that can only be computed using intensive numericalmethods. Most of these methods such as MCMC are stochastic by nature and do not comply withthe natural expectation from a user of obtaining deterministic results. Using simulation methods doesnot compromise the discussed advantages of Bayesian approach, but unquestionably adds to thecomplexity of its application in practice.
For more discussion about advantages and disadvantages of Bayesian analysis, see, for example,Thompson (2012), Bernardo and Smith (2000), and Berger and Wolpert (1988).
Brief background and literature review
The principles of Bayesian analysis date back to the work of Thomas Bayes, who was a Presbyterianminister in Tunbridge Wells and Pierre Laplace, a French mathematician, astronomer, and physicist inthe 18th century. Bayesian analysis started as a simple intuitive rule, named after Bayes, for updatingbeliefs on account of some evidence. For the next 200 years, however, Bayes’s rule was just anobscure idea. Along with the rapid development of the standard or frequentist statistics in 20th century,Bayesian methodology was also developing, although with less attention and at a slower pace. Oneof the obstacles for the progress of Bayesian ideas has been the lasting opinion among mainstreamstatisticians of it being subjective. Another more-tangible problem for adopting Bayesian models inpractice has been the lack of adequate computational resources. Nowadays, Bayesian statistics iswidely accepted by researchers and practitioners as a valuable and feasible alternative.
Bayesian analysis proliferates in diverse areas including industry and government, but its applicationin sciences and engineering is particularly visible. Bayesian statistical inference is used in econometrics(Poirier [1995]; Chernozhukov and Hong [2003]; Kim, Shephard, and Chib [1998], Zellner [1997]);education (Johnson 1997); epidemiology (Greenland 1998); engineering (Godsill and Rayner 1998);genetics (Iversen, Parmigiani, and Berry 1999); social sciences (Pollard 1986); hydrology (Parentet al. 1998); quality management (Rios Insua 1990); atmospheric sciences (Berliner et al. 1999); andlaw (DeGroot, Fienberg, and Kadane 1986), to name a few.

intro — Introduction to Bayesian analysis 7
The subject of general statistics has been greatly influenced by the development of Bayesianideas. Bayesian methodologies are now present in biostatistics (Carlin and Louis [2000]; Berry andStangl [1996]); generalized linear models (Dey, Ghosh, and Mallick 2000); hierarchical modeling(Hobert 2000); statistical design (Chaloner and Verdinelli 1995); classification and discrimination (Neal[1996]; Neal [1999]); graphical models (Pearl 1998); nonparametric estimation (Muller and Vidakovic[1999]; Dey, Muller, and Sinha [1998]); survival analysis (Barlow, Clarotti, and Spizzichino 1993);sequential analysis (Carlin, Kadane, and Gelfand 1998); predictive inference (Aitchison and Dun-smore 1975); spatial statistics (Wolpert and Ickstadt [1998]; Besag and Higdon [1999]); testing andmodel selection (Kass and Raftery [1995]; Berger and Pericchi [1996]; Berger [2006]); and timeseries (Pole, West, and Harrison [1994]; West and Harrison [1997]).
Recent advances in computing allowed practitioners to perform Bayesian analysis using simulations.The simulation tools came from outside the statistics field—Metropolis et al. (1953) developed what isnow known as a random-walk Metropolis algorithm to solve problems in statistical physics. Anotherlandmark discovery was the Gibbs sampling algorithm (Geman and Geman 1984), initially usedin image processing, which showed that exact sampling from a complex and otherwise intractableprobability distribution is possible. These ideas were the seeds that led to the development of Markovchain Monte Carlo (MCMC)—a class of iterative simulation methods proved to be indispensabletools for Bayesian computations. Starting from the early 1990s, MCMC-based techniques slowlyemerged in the mainstream statistical practice. More powerful and specialized methods appeared,such as perfect sampling (Propp and Wilson 1996), reversible-jump MCMC (Green 1995) for traversingvariable dimension state spaces, and particle systems (Gordon, Salmond, and Smith 1993). Consequentwidespread application of MCMC was imminent (Berger 2000) and influenced various specialized fields.For example, Gelman and Rubin (1992) investigated MCMC for the purpose of exploring posteriordistributions; Geweke (1999) surveyed simulation methods for Bayesian inference in econometrics;Kim, Shephard, and Chib (1998) used MCMC simulations to fit stochastic volatility models; Carlin,Kadane, and Gelfand (1998) implemented Monte Carlo methods for identifying optimal strategies inclinical trials; Chib and Greenberg (1995) provided Bayesian formulation of a number of importanteconometrics models; and Chernozhukov and Hong (2003) reviewed some econometrics modelsinvolving Laplace-type estimators from an MCMC perspective. For more comprehensive exposition ofMCMC, see, for example, Robert and Casella (2004); Tanner (1996); Gamerman and Lopes (2006);Chen, Shao, and Ibrahim (2000); and Brooks et al. (2011).
Bayesian statistics
Posterior distribution
To formulate the principles of Bayesian statistics, we start with a simple case when one is concernedwith the interaction of two random variables, A and B. Let p(·) denote either a probability massfunction or a density, depending on whether the variables are discrete or continuous. The rule ofconditional probability,
p(A|B) =p(A,B)
p(B)
can be used to derive the so-called Bayes’s rule:
p(B|A) =p(A|B)p(B)
p(A)(1)
This rule also holds in the more general case when A and B are random vectors.

8 intro — Introduction to Bayesian analysis
In a typical statistical problem, we have a data vector y, which is assumed to be a sample from aprobability model with an unknown parameter vector θ. We represent this model using the likelihoodfunction L(θ;y) = f(y; θ) =
∏ni=1 f(yi|θ), where f(yi|θ) denotes the probability density function
of yi given θ. We want to infer some properties of θ based on the data y. In Bayesian statistics,model parameters θ is a random vector. We assume that θ has a probability distribution p(θ) = π(θ),which is referred to as a prior distribution. Because both y and θ are random, we can apply Bayes’srule (1) to derive the posterior distribution of θ given data y,
p(θ|y) =p(y|θ)p(θ)
p(y)=f(y; θ)π(θ)
m(y)(2)
where m(y) ≡ p(y), known as the marginal distribution of y, is defined by
m(y) =
∫f(y; θ)π(θ)dθ (3)
The marginal distribution m(y) in (3) does not depend on the parameter of interest θ, and wecan, therefore, reduce (2) to
p(θ|y) ∝ L(θ;y)π(θ) (4)
Equation (4) is fundamental in Bayesian analysis and states that the posterior distribution of modelparameters is proportional to their likelihood and prior probability distributions. We will often use(4) in the computationally more-convenient log-scale form
ln{p(θ|y)} = l(θ;y) + ln{π(θ)} − c (5)
where l(·; ·) denotes the log likelihood of the model. Depending on the analytical procedure involvingthe log-posterior ln{p(θ|y)}, the actual value of the constant c = ln{m(y)} may or may not berelevant. For valid statistical analysis, however, we will always assume that c is finite.
Selecting priors
In Bayesian analysis, we seek a balance between prior information in a form of expert knowledgeor belief and evidence from data at hand. Achieving the right balance is one of the difficulties inBayesian modeling and inference. In general, we should not allow the prior information to overwhelmthe evidence from the data, especially when we have a large data sample. A famous theoreticalresult, the Bernstein–von Mises theorem, states that in large data samples, the posterior distribution isindependent of the prior distribution and, therefore, Bayesian and likelihood-based inferences shouldyield essentially the same results. On the other hand, we need a strong enough prior to support weakevidence that usually comes from insufficient data. It is always good practice to perform sensitivityanalysis to check the dependence of the results on the choice of a prior.
The flexibility of choosing the prior freely is one of the main controversial issues associated withBayesian analysis and the reason why some practitioners view the latter as subjective. It is also thereason why the Bayesian practice, especially in the early days, was dominated by noninformative priors.Noninformative priors, also called flat or vague priors, assign equal probabilities to all possible statesof the parameter space with the aim of rectifying the subjectivity problem. One of the disadvantagesof flat priors is that they are often improper; that is, they do not specify a legitimate probabilitydistribution. For example, a uniform prior for a continuous parameter over an unbounded domain does

intro — Introduction to Bayesian analysis 9
not integrate to a finite number. However, this is not necessarily a problem because the correspondingposterior distribution may still be proper. Although Bayesian inference based on improper priors ispossible, this is equivalent to discarding the terms log π(θ) and c in (5), which nullifies the benefitof Bayesian analysis because it reduces the latter to an inference based only on the likelihood.This is why there is a strong objection to the practice of noninformative priors. In recent years, anincreasing number of researchers have advocated the use of sound informative priors, for example,Thompson (2014). For example, using informative priors is mandatory in areas such as genetics,where prior distributions have a physical basis and reflect scientific knowledge.
Another convenient preference for priors is to use conjugate priors. Their choice is desirable fromtechnical and computational standpoints but may not necessarily provide a realistic representation ofthe model parameters. Because of the limited arsenal of conjugate priors, an inclination to overusethem severely limits the flexibility of Bayesian modeling.
Point and interval estimation
In Bayesian statistics, inference about parameters θ is based on the posterior distribution p(θ|y) andvarious ways of summarizing this distribution. Point and interval estimates can be used to summarizethis distribution.
Commonly used point estimators are the posterior mean,
E(θ|y) =
∫θp(θ|y)dθ
and the posterior median, q0.5(θ), which is the 0.5 quantile of the posterior; that is,
P{θ ≤ q0.5(θ)} = 0.5
Another point estimator is the posterior mode, which is the value of θ that maximizes p(θ|y).
Interval estimation is performed by constructing so-called credible intervals (CRIs). CRIs arespecial cases of credible regions. Let 1 − α ∈ (0, 1) be some predefined credible level. Then, an{(1− α)× 100}% credible set R of θ is such that
Pr(θ ∈ R|y) =
∫R
p(θ|y)dθ = 1− α
We consider two types of CRIs. The first one is based on quantiles. The second one is the highestposterior density (HPD) interval.
An {(1 − α) × 100}% quantile-based, or also known as an equal-tailed CRI, is defined as(qα/2, q1−α/2), where qa denotes the ath quantile of the posterior distribution. A commonly reportedequal-tailed CRI is (q0.025, q0.975).
HPD interval is defined as an {(1− α)× 100}% CRI of the shortest width. As its name implies,this interval corresponds to the region of the posterior density with the highest concentration. For aunimodal posterior distribution, HPD is unique, but for a multimodal distribution it may not be unique.Computational approaches for calculating HPD are described in Chen and Shao (1999) and Eberlyand Casella (2003).

10 intro — Introduction to Bayesian analysis
Comparing Bayesian models
Model comparison is another important aspect of Bayesian statistics. We are often interested incomparing two or more plausible models for our data.
Let’s assume that we have models Mj parameterized by vectors θj , j = 1, . . . , r. We may havevarying degree of belief in each of these models given by prior probabilities p(Mj), such that∑rj=1 p(Mj) = 1. By applying Bayes’s rule, we find the posterior model probabilities
p(Mj |y) =p(y|Mj)p(Mj)
p(y)
where p(y|Mj) = mj(y) is the marginal likelihood of Mj with respect to y. Because of the difficultyin calculating p(y), it is a common practice to compare two models, say, Mj and Mk, using theposterior odds ratio
POjk =p(Mj |y)
p(Mk|y)=p(y|Mj)p(Mj)
p(y|Mk)p(Mk)
If all models are equally plausible, that is, p(Mj) = 1/r, the posterior odds ratio reduces to theso-called Bayes factors (BF) (Jeffreys 1935),
BFjk =p(y|Mj)
p(y|Mk)=mj(y)
mk(y)
which are simply ratios of marginal likelihoods.
Jeffreys (1961) recommended an interpretation of BFjk based on half-units of the log scale. Thefollowing table provides some rules of thumb:
log10(BFjk) BFjk Evidence against Mk
0 to 1/2 1 to 3.2 Bare mention1/2 to 1 3.2 to 10 Substantial1 to 2 10 to 100 Strong>2 >100 Decisive
The Schwarz criterion BIC (Schwarz 1978) is an approximation of BF in case of arbitrary butproper priors. Kass and Raftery (1995) and Berger (2006) provide a detailed exposition of Bayesfactors, their calculation, and their role in model building and testing.
Posterior prediction
Prediction is another essential part of statistical analysis. In Bayesian statistics, prediction isperformed using the posterior distribution. The probability of observing some future data y∗ giventhe observed one can be obtained by the marginalization of
p(y∗|y) =
∫p(y∗|y, θ)p(θ|y)dθ
which, assuming that y∗ is independent of y, can be simplified to

intro — Introduction to Bayesian analysis 11
p(y∗|y) =
∫p(y∗|θ)p(θ|y)dθ (6)
Equation (6) is called a posterior predictive distribution and is used for Bayesian prediction.
Bayesian computation
An unavoidable difficulty in performing Bayesian analysis is the need to compute integrals suchas those expressing marginal distributions and posterior moments. The integrals involved in Bayesianinference are of the form E{g(θ)} =
∫g(θ)p(θ|y)dθ for some function g(·) of the random vector
θ. With the exception of a few cases for which analytical integration is possible, the integration isperformed via simulations.
Given a sample from the posterior distribution, we can use Monte Carlo integration to approximatethe integrals. Let θ1, θ2, . . . , θT be an independent sample from p(θ|y).
The original integral of interest E{g(θ)} can be approximated by
g =1
T
T∑t=1
g(θt)
Moreover, if g is a scalar function, under some mild conditions, the central limit theorem holds
g ≈ N[E{g(θ)}, σ2/T
]where σ2 = Cov{g(θi)} can be approximated by the sample variance
∑Tt=1{g(θt)− g}2/T . If the
sample is not independent, then g still approximates E{g(θ)} but the variance σ2 is given by
σ2 = Var{g(θt)}+ 2
∞∑k=1
Cov{g(θt), g(θt+k)} (7)
and needs to be approximated. Moreover, the conditions needed for the central limit theorem to holdinvolve the convergence rate of the chain and can be difficult to check in practice (Tierney 1994).
The Monte Carlo integration method solves the problem of Bayesian computation of computing aposterior distribution by sampling from that posterior distribution. The latter has been an importantproblem in computational statistics and a focus of intense research. Rejection sampling techniquesserve as basic tools for generating samples from a general probability distribution (von Neumann 1951).They are based on the idea that samples from the target distribution can be obtained from another,easy-to-sample distribution according to some acceptance–rejection rule for the samples from thisdistribution. It was soon recognized, however, that the acceptance–rejection methods did not scalewell with the increase of dimensions, a problem known as the “curse of dimensionality”, essentiallyreducing the acceptance probability to zero. An alternative solution was to use the Markov chains togenerate sequences of correlated sample points from the domain of the target distribution and keepinga reasonable rate of acceptance. It was not long before Markov chain Monte Carlo methods wereaccepted as effective tools for approximate sampling from general posterior distributions (Tanner andWong 1987).

12 intro — Introduction to Bayesian analysis
Markov chain Monte Carlo methodsEvery MCMC method is designed to generate values from a transition kernel such that the draws
from that kernel converge to a prespecified target distribution. It simulates a Markov chain with thetarget distribution as the stationary or equilibrium distribution of the chain. By definition, a Markovchain is any sequence of values or states from the domain of the target distribution, such that eachvalue depends on its immediate predecessor only. For a well-designed MCMC, the longer the chain, thecloser the samples to the stationary distribution. MCMC methods differ substantially in their simulationefficiency and computational complexity.
The Metropolis algorithm proposed in Metropolis and Ulam (1949) and Metropolis et al. (1953)appears to be the earliest version of MCMC. The algorithm generates a sequence of states, eachobtained from the previous one, according to a Gaussian proposal distribution centered at that state.Hastings (1970) described a more-general version of the algorithm, now known as a Metropolis–Hastings (MH) algorithm, which allows any distribution to be used as a proposal distribution. Belowwe review the general MH algorithm and some of its special cases.
Metropolis–Hastings algorithm
Here we present the MH algorithm for sampling from a posterior distribution in a general formulation.It requires the specification of a proposal probability distribution q(·) and a starting state θ0 withinthe domain of the posterior, that is, p(θ0|y) > 0. The algorithm generates a Markov chain {θt}T−1t=0such that at each step t 1) a proposal state θ∗ is generated conditional on the current state, and 2) θ∗is accepted or rejected according to the suitably defined acceptance probability.
For t = 1, . . . , T − 1:
1. Generate a proposal state: θ∗ ∼ q(·|θt−1).
2. Calculate the acceptance probability α(θ∗|θt−1) = min{r(θ∗|θt−1), 1}, where
r(θ∗|θt−1) =p(θ∗|y)q(θt−1|θ∗)p(θt−1|y)q(θ∗|θt−1)
3. Draw u ∼ Uniform(0, 1).
4. Set θt = θ∗ if u < α(θ∗|θt−1), and θt = θt−1 otherwise.
We refer to the iteration steps 1 through 4 as an MH update. By design, any Markov chain simulatedusing this MH algorithm is guaranteed to have p(θ|y) as its stationary distribution.
Two important criteria measuring the efficiency of MCMC are the acceptance rate of the chain andthe degree of autocorrelation in the generated sample. When the acceptance rate is close to 0, thenmost of the proposals are rejected, which means that the chain failed to explore regions of appreciableposterior probability. The other extreme is when the acceptance probability is close to 1, in whichcase the chain stays in a small region and fails to explore the whole posterior domain. An efficientMCMC has an acceptance rate that is neither too small nor too large and also has small autocorrelation.Gelman, Gilks, and Roberts (1997) showed that in the case of a multivariate posterior and proposaldistributions, an acceptance rate of 0.234 is asymptotically optimal and, in the case of a univariateposterior, the optimal value is 0.45.
A special case of MH employs a Metropolis update with q(·) being a symmetric distribution. Then,the acceptance ratio reduces to a ratio of posterior probabilities,
r(θ∗|θt−1) =p(θ∗|y)
p(θt−1|y)

intro — Introduction to Bayesian analysis 13
The symmetric Gaussian distribution is a common choice for a proposal distribution q(·), and this isthe one used in the original Metropolis algorithm.
Another important MCMC method that can be viewed as a special case of MH is Gibbs sampling(Gelfand et al. 1990), where the updates are the full conditional distributions of each parametergiven the rest of the parameters. Gibbs updates are always accepted. If θ = (θ1, . . . , θd) and, forj = 1 . . . , d, qj is the conditional distribution of θj given the rest θ{−j}, then the Gibbs algorithmis the following. For t = 1, . . . , T − 1 and for j = 1, . . . , d: θjt ∼ qj(·|θ
{−j}t−1 ). This step is referred
to as a Gibbs update.
All MCMC methods share some limitations and potential problems. First, any simulated chain isinfluenced by its starting values, especially for short MCMC runs. It is required that the starting pointhas a positive posterior probability, but even when this condition is satisfied, if we start somewherein a remote tail of the target distribution, it may take many iterations to reach a region of appreciableprobability. Second, because there is no obvious stopping criterion, it is not easy to decide for how longto run the MCMC algorithm to achieve convergence to the target distribution. Third, the observationsin MCMC samples are strongly dependent and this must be taken into account in any subsequentstatistical inference. For example, the errors associated with the Monte Carlo integration should becalculated according to (7), which accounts for autocorrelation.
Adaptive random-walk Metropolis–Hastings
The choice of a proposal distribution q(·) in the MH algorithm is crucial for the mixing propertiesof the resulting Markov chain. The problem of determining an optimal proposal for a particular targetposterior distribution is difficult and is still being researched actively. All proposed solutions are basedon some form of an adaptation of the proposal distribution as the Markov chain progresses, which iscarefully designed to preserve the ergodicity of the chain, that is, its tendency to converge to the targetdistribution. These methods are known as adaptive MCMC methods (Haario, Saksman, and Tamminen[2001]; Giordani and Kohn [2010]; and Roberts and Rosenthal [2009]).
The majority of adaptive MCMC methods are random-walk MH algorithms with updates of theform: θ∗ = θt−1 + Zt, where Zt follows some symmetric distribution. Specifically, we consider aGaussian random-walk MH algorithm with Zt ∼ N(0, ρ2Σ), where ρ is a scalar controlling the scaleof random jumps for generating updates and Σ is a d-dimensional covariance matrix. One of the firstimportant results regarding adaptation is from Gelman, Gilks, and Roberts (1997), where the authorsderive the optimal scaling factor ρ = 2.38/
√d and note that the optimal Σ is the true covariance
matrix of the target distribution.
Haario, Saksman, and Tamminen (2001) proposes Σ to be estimated by the empirical covariancematrix plus a small diagonal matrix ε× Id to prevent zero covariance matrices. Alternatively, Robertsand Rosenthal (2009) proposed a mixture of the two covariance matrices,
Σt = βΣ + (1− β)Σ0
for some fixed covariance matrix Σ0 and β ∈ [0, 1].
Because the proposal distribution of an adaptive MH algorithm changes at each step, the ergodicityof the chain is not necessarily preserved. However, under certain assumptions about the adaptationprocedure, the ergodicity does hold; see Roberts and Rosenthal (2007), Andrieu and Moulines (2006),Atchade and Rosenthal (2005), and Giordani and Kohn (2010) for details.

14 intro — Introduction to Bayesian analysis
Blocking of parameters
In the original MH algorithm, the update steps of generating proposals and applying the acceptance–rejection rule are performed for all model parameters simultaneously. For high-dimensional models,this may result in a poor mixing—the Markov chain may stay in the tails of the posterior distribution forlong periods of time and traverse the posterior domain very slowly. Suboptimal mixing is manifestedby either very high or very low acceptance rates. Adaptive MH algorithms are also prone to thisproblem, especially when model parameters have very different scales. An effective solution to thisproblem is called blocking—model parameters are separated into two or more subsets or blocks andMH updates are applied to each block separately in the order that the blocks are specified.
Let’s separate a vector of parameters into B blocks: θ = {θ1, . . . , θB}. The version of theGaussian random-walk MH algorithm with blocking is as follows.
Let T0 be the number of burn-in iterations, T be the number of MCMC samples, and ρ2bΣb,
b = 1, . . . , B, be block-specific proposal covariance matrices. Let θ0 be the starting point within thedomain of the posterior, that is, p(θ0|y) > 0.
1. At iteration t, let θt = θt−1.
2. For a block of parameters θbt :
2.1. Let θ∗ = θt. Generate a proposal for the bth block: θb∗ = θbt−1 + ε, where ε ∼ N(0, ρ2bΣb).
2.2. Calculate the acceptance ratio,
r(θ∗|θt) =p(θ∗|y)
p(θt|y)
where θ∗ = (θ1t , θ2t , . . . , θ
b−1t , θb∗, θ
b+1t , . . . , θBt ).
2.3. Draw u ∼ Uniform(0, 1).
2.4. Let θbt = θb∗ if u < min{r(θ∗|θt), 1}.3. Repeat step 2 for b = 1, . . . , B.
4. Repeat steps 1 through 3 for t = 1, . . . , T + T0 − 1.
5. The final sequence is {θt}T+T0−1t=T0
.
Blocking may not always improve efficiency. For example, separating all parameters in individualblocks (the so-called one-at-a-time update regime) can lead to slow mixing when some parameters arehighly correlated. A Markov chain may explore the posterior domain very slowly if highly correlatedparameters are updated independently. There are no theoretical results about optimal blocking, soyou will need to use your judgment when determining the best set of blocks for your model. Asa rule, parameters that are expected to be highly correlated are specified in one block. This willgenerally improve mixing of the chain unless the proposal correlation matrix does not capture theactual correlation structure of the block. For example, if there are two parameters in the block thathave very different scales, adaptive MH algorithms that use the identity matrix for the initial proposalcovariance may take a long time to approximate the optimal proposal correlation matrix. The usershould, therefore, consider not only the probabilistic relationship between the parameters in the model,but also their scales to determine an optimal set of blocks.

intro — Introduction to Bayesian analysis 15
Metropolis–Hastings with Gibbs updates
The original Gibbs sampler updates each model parameter one at a time according to its fullconditional distribution. We have already noted that Gibbs is a special case of the MH algorithm.Some of the advantages of Gibbs sampling include its high efficiency, because all proposals areautomatically accepted, and that it does not require any additional tuning for proposal distributionsin MH algorithms. Unfortunately, for most posterior distributions in practice, the full conditionals areeither not available or are very difficult to sample from. It may be the case, however, that for somemodel parameters or groups of parameters, the full conditionals are available and are easy to generatesamples from. This is done in a hybrid MH algorithm, which implements Gibbs updates for onlysome blocks of parameters. A hybrid MH algorithm combines Gaussian random-walk updates withGibbs updates to improve the mixing of the chain.
The MH algorithm with blocking allows different samplers to be used for updating different blocks.If there is a group of model parameters with a conjugate prior (or semiconjugate prior), we can placethis group of parameters in a separate block and use Gibbs sampling for it. This can greatly improvethe overall sampling efficiency of the algorithm.
For example, suppose that the data are normally distributed with a known mean µ and that wespecify an inverse-gamma prior for σ2 with shape α and scale β, which are some fixed constants.
y ∼ N(µ, σ2), σ2 ∼ InvGamma(α, β)
The full conditional distribution for σ2 in this case is also an inverse-gamma distribution, but withdifferent shape and scale parameters,
σ2 ∼ InvGamma
{α = α+
n
2, β = β +
1
2
n∑i=1
(yi − µ)2
}
where n is the data sample size. So, an inverse-gamma prior for the variance is a conjugate prior inthis model. We can thus place σ2 in a separate block and set up a Gibbs sampling for it using theabove full conditional distribution.
See Methods and formulas in [BAYES] bayesmh for details.
Convergence diagnostics of MCMC
Checking convergence of MCMC is an essential step in any MCMC simulation. Bayesian inferencebased on an MCMC sample is valid only if the Markov chain has converged and the sample isdrawn from the desired posterior distribution. It is important that we verify the convergence for allmodel parameters and not only for a subset of parameters of interest. One difficulty with assessingconvergence of MCMC is that there is no single conclusive convergence criterion. The diagnostic usuallyinvolves checking for several necessary (but not necessarily sufficient) conditions for convergence. Ingeneral, the more aspects of the MCMC sample you inspect, the more reliable your results are.
The most extensive review of the methods for assessing convergence is Cowles and Carlin (1996).Other discussions about monitoring convergence can be found in Gelman et al. (2014) and Brookset al. (2011).
There are at least two general approaches for detecting convergence issues. The first one is toinspect the mixing and time trends within the chains of individual parameters. The second one is toexamine the mixing and time trends of multiple chains for each parameter. The lack of convergencein a Markov chain can be especially difficult to detect in a case of pseudoconvergence, which often

16 intro — Introduction to Bayesian analysis
occurs with multimodal posterior distributions. Pseudoconvergence occurs when the chain appears tohave converged but it actually explored only a portion of the domain of a posterior distribution. Tocheck for pseudoconvergence, Gelman and Rubin (1992) recommend running multiple chains fromdifferent starting states and comparing them.
Trace plots are the most accessible convergence diagnostics and are easy to inspect visually. Thetrace plot of a parameter plots the simulated values for this parameter versus the iteration number.The trace plot of a well-mixing parameter should traverse the posterior domain rapidly and shouldhave nearly constant mean and variance.
In the next figure, we show examples of trace plots for four parameters: var1, var2, var3,and var4. The first two parameters, var1 and var2, have well-mixing chains, and the other twohave poorly mixing chains. The chain for the parameter var1 has a moderate acceptance rate, about35%, and efficiency between 10% and 20%. This is a typical result for a Gaussian random-walk MHalgorithm that has achieved convergence. The trace plot of var2 in the top right panel shows almostperfect mixing—this is a typical example of Gibbs sampling with an acceptance rate close to 1 andefficiency above 95%. Although both chains traverse their marginal posterior domains, the right onedoes it more rapidly. On the downside, more efficient MCMC algorithms such as Gibbs sampling areusually associated with a higher computational cost.
68
10
12
14
16
0 1000 2000 3000 4000 5000
Iteration number
Trace of var1
51
01
52
0
0 1000 2000 3000 4000 5000
Iteration number
Trace of var2
02
46
81
0
0 1000 2000 3000 4000 5000
Iteration number
Trace of var3
51
01
52
02
5
0 1000 2000 3000 4000 5000
Iteration number
Trace of var4
The bottom two trace plots illustrate cases of bad mixing and a lack of convergence. On the left, thechain for var3 exhibits high acceptance rate but poor coverage of the posterior domain manifestedby random drifting in isolated regions. This chain was produced by a Gaussian random-walk MHalgorithm with a proposal distribution with a very small variance. On the right, the chain for theparameter var4 has a very low acceptance rate, below 3%, because the used proposal distributionhad a very large variance. In both cases, the chains do not converge; the simulation results do notrepresent the posterior distribution and should thus be discarded.

intro — Introduction to Bayesian analysis 17
As we stated before, samples simulated using MCMC methods are correlated. The smaller thecorrelation, the more efficient the sampling process. Most of the MH algorithms typically generatehighly correlated draws, whereas the Gibbs algorithm typically generates less-correlated draws.Below we show autocorrelation plots for the same four parameters using the same MCMC samples.The autocorrelation of var1, the one that comes from a well-mixing MH chain, becomes negligiblefairly quickly, after about 10 lags. On the other hand, the autocorrelation of var2 simulated usingGibbs sampling is essentially negligible for all positive lags. In the case of a poor mixing becauseof a small proposal variance (parameter var3), we observe very high positive correlation for at least100 lags. The autocorrelation of var4 is high but is lower than that of var3.
0.00
0.20
0.40
0.60
0.80
0 20 40 60 80 100Lag
Autocorrelation of var1
−0.04−0.02
0.000.020.04
0 20 40 60 80 100Lag
Autocorrelation of var2
−0.50
0.00
0.50
1.00
0 20 40 60 80 100Lag
Autocorrelation of var3
−0.50
0.00
0.50
1.00
0 20 40 60 80 100Lag
Autocorrelation of var4
Yu and Mykland (1998) proposed a graphical procedure for assessing the convergence of individualparameters based on cumulative sums, also known as a cusum plot. By definition, any cusum plotstarts at 0 and ends at 0. Cusum plots are useful for detecting drifts in the chain. For a chain withouttrend, the cusum plot should cross the x axis. For example, early drifts may indicate dependence onstarting values. If we detect an early drift, we should discard an initial part of the chain and runit longer. Below, we show the trace plot of a poorly mixing parameter tau and its correspondingcusum plot on the right. There is an apparent positive drift for approximately the first half of thechain followed by the drift in the negative direction. As a result, the cusum plot has a distinctivemountain-like shape and never crosses the x axis.

18 intro — Introduction to Bayesian analysis
.1.2
.3.4
.5.6
0 2000 4000 6000 8000 10000
Iteration
Trace of tau
050
100
150
200
250
0 2000 4000 6000 8000 10000
Iteration
Cusum of tau
Cusum plots can be also used for assessing how fast the chain is mixing. The slower the mixingof the chain, the smoother the cusum plots. Conversely, the faster the mixing of the chain, the morejagged the cusum plots. Below, we demonstrate the cusum plots for the four variables consideredpreviously. We can clearly see the contrast between the jagged lines of the fast mixing parametersvar1 and var2 and the very smooth cusum line of the poorly mixing parameter var3.
−1
00
−5
00
50
10
01
50
0 1000 2000 3000 4000 5000
Iteration number
Cusum of var1
−1
00
−5
00
50
0 1000 2000 3000 4000 5000
Iteration number
Cusum of var2
−2
50
0−
20
00
−1
50
0−
10
00
−5
00
0
0 1000 2000 3000 4000 5000
Iteration number
Cusum of var3
−2
00
0−
15
00
−1
00
0−
50
00
0 1000 2000 3000 4000 5000
Iteration number
Cusum of var4
Besides graphical convergence diagnostics, there are some formal convergence tests (Geweke[1992]; Gelman and Rubin [1992]; Heidelberger and Welch [1983]; Raftery and Lewis [1992];Zellner and Min [1995]).

intro — Introduction to Bayesian analysis 19
Summary
Bayesian analysis is a statistical procedure that answers research questions by expressing uncertaintyabout unknown parameters using probabilities. Bayesian inference is based on the posterior distributionof model parameters conditional on the observed data. The posterior distribution is composed of alikelihood distribution of the data and the prior distribution of the model parameters. The likelihoodmodel is specified in the same way it is specified with any standard likelihood-based analysis. Theprior distribution is constructed based on the prior (before observing the data) scientific knowledgeand results from previous studies. Sensitivity analysis is typically performed to evaluate the influenceof different competing priors on the results.
Many posterior distributions do not have a closed form and must be simulated using MCMC methodssuch as MH methods or the Gibbs method or sometimes their combination. The convergence of MCMCmust be verified before any inference can be made.
Marginal posterior distributions of the parameters are used for inference. These are summarizedusing point estimators such as posterior mean and median and interval estimators such as equal-tailed credible intervals and highest posterior density intervals. Credible intervals have an intuitiveinterpretation as fixed ranges to which a parameter is known to belong with a prespecified probability.Hypothesis testing provides a way to assign an actual probability to any hypothesis of interest. Anumber of criteria are available for comparing models of interest. Predictions are also available basedon the posterior predictive distribution.
Bayesian analysis provides many advantages over the standard frequentist analysis, such as an abilityto incorporate prior information in the analysis, higher robustness to sparse data, more-comprehensiveinference based on the knowledge of the entire posterior distribution, and more intuitive and directinterpretations of results by using probability statements about parameters.
� �Thomas Bayes (1701(?)–1761) was a Presbyterian minister with an interest in calculus, geometry,and probability theory. He was born in Hertfordshire, England. The son of a Nonconformistminister, Bayes was banned from English universities and so studied at Edinburgh Universitybefore becoming a clergyman himself. Only two works are attributed to Bayes during his lifetime,both published anonymously. He was admitted to the Royal Society in 1742 and never publishedthereafter.
The paper that gives us “Bayes’s Theorem” was published posthumously by Richard Price.The theorem has become an important concept for frequentist and Bayesian statisticians alike.However, the paper indicates that Bayes considered the theorem as relatively unimportant. Hismain interest appears to have been that probabilities were not fixed but instead followed somedistribution. The notion, now foundational to Bayesian statistics, was largely ignored at the time.
Whether Bayes’s theorem is appropriately named is the subject of much debate. Price acknowl-edged that he had written the paper based on information he found in Bayes’s notebook, yethe never said how much he added beyond the introduction. Some scholars have also questionedwhether Bayes’s notes represent original work or are the result of correspondence with othermathematicians of the time.� �

20 intro — Introduction to Bayesian analysis� �Andrey Markov (1856–1922) was a Russian mathematician who made many contributions tomathematics and statistics. He was born in Ryazan, Russia. In primary school, he was knownas a poor student in all areas except mathematics. Markov attended St. Petersburg University,where he studied under Pafnuty Chebyshev and later joined the physicomathematical faculty. Hewas a member of the Russian Academy of the Sciences.
Markov’s first interest was in calculus. He did not start his work in probability theory until1883 when Chebyshev left the university and Markov took over his teaching duties. A large andinfluential body of work followed, including applications of the weak law of large numbers andwhat are now known as Markov processes and Markov chains. His work on processes and chainswould later influence the development of a variety of disciplines such as biology, chemistry,economics, physics, and statistics.
Known in the Russian press as the “militant academician” for his frequent written protests aboutthe czarist government’s interference in academic affairs, Markov spent much of his adult lifeat odds with Russian authorities. In 1908, he resigned from his teaching position in responseto a government requirement that professors report on students’ efforts to organize protests inthe wake of the student riots earlier that year. He did not resume his university teaching dutiesuntil 1917, after the Russian Revolution. His trouble with Russian authorities also extended tothe Russian Orthodox Church. In 1912, he was excommunicated at his own request in protestover the Church’s excommunication of Leo Tolstoy.� �
ReferencesAitchison, J., and I. R. Dunsmore. 1975. Statistical Prediction Analysis. Cambridge: Cambridge University Press.
Andrieu, C., and E. Moulines. 2006. On the ergodicity properties of some adaptive MCMC algorithms. Annals ofApplied Probability 16: 1462–1505.
Atchade, Y. F., and J. S. Rosenthal. 2005. On adaptive Markov chain Monte Carlo algorithms. Bernoulli 11: 815–828.
Barlow, R. E., C. A. Clarotti, and F. Spizzichino, ed. 1993. Reliability and Decision Making. Cambridge: Chapman& Hall.
Berger, J. O. 2000. Bayesian analysis: A look at today and thoughts of tomorrow. Journal of the American StatisticalAssociation 95: 1269–1276.
. 2006. “Bayes factors.” In Encyclopedia of Statistical Sciences, edited by Kotz, S., C. B. Read, N. Balakrishnan,and B. Vidakovic. Wiley. http://onlinelibrary.wiley.com/doi/10.1002/0471667196.ess0985.pub2/abstract.
Berger, J. O., and L. R. Pericchi. 1996. The intrinsic Bayes factor for model selection and prediction. Journal of theAmerican Statistical Association 91: 109–122.
Berger, J. O., and R. L. Wolpert. 1988. The Likelihood Principle: A Review, Generalizations, and Statistical Implications.Hayward, CA: Institute of Mathematical Statistics.
Berliner, L. M., J. A. Royle, C. K. Wikle, and R. F. Milliff. 1999. Bayesian methods in atmospheric sciences. InVol. 6 of Bayesian Statistics: Proceedings of the Sixth Valencia International Meeting, ed. J. M. Bernardo, J. O.Berger, A. P. Dawid, and A. F. M. Smith, 83–100. Oxford: Oxford University Press.
Bernardo, J. M., and A. F. M. Smith. 2000. Bayesian Theory. Chichester, UK: Wiley.
Berry, D. A., and D. K. Stangl, ed. 1996. Bayesian Biostatistics. New York: Dekker.
Besag, J., and D. Higdon. 1999. Bayesian analysis for agricultural field experiments. Journal of the Royal StatisticalSociety, Series B 61: 691–746.
Brooks, S., A. Gelman, G. L. Jones, and X.-L. Meng, ed. 2011. Handbook of Markov Chain Monte Carlo. BocaRaton, FL: Chapman & Hall/CRC.
Carlin, B. P., J. B. Kadane, and A. E. Gelfand. 1998. Approaches for optimal sequential decision analysis in clinicaltrials. Biometrics 54: 964–975.

intro — Introduction to Bayesian analysis 21
Carlin, B. P., and T. A. Louis. 2000. Bayes and Empirical Bayes Methods for Data Analysis. 2nd ed. Boca Raton,FL: Chapman & Hall/CRC.
Chaloner, K., and I. Verdinelli. 1995. Bayesian experimental design: A review. Statistical Science 10: 273–304.
Chen, M.-H., and Q.-M. Shao. 1999. Monte Carlo estimation of Bayesian credible and HPD intervals. Journal ofComputational and Graphical Statistics 8: 69–92.
Chen, M.-H., Q.-M. Shao, and J. G. Ibrahim. 2000. Monte Carlo Methods in Bayesian Computation. New York:Springer.
Chernozhukov, V., and H. Hong. 2003. An MCMC approach to classical estimation. Journal of Econometrics 115:293–346.
Chib, S., and E. Greenberg. 1995. Understanding the Metropolis–Hastings algorithm. American Statistician 49:327–335.
Cowles, M. K., and B. P. Carlin. 1996. Markov chain Monte Carlo convergence diagnostic: A comparative review.Journal of the American Statistical Association 91: 883–904.
DeGroot, M. H., S. E. Fienberg, and J. B. Kadane. 1986. Statistics and the Law. New York: Wiley.
Dey, D. D., P. Muller, and D. Sinha, ed. 1998. Practical Nonparametric and Semiparametric Bayesian Statistics. NewYork: Springer.
Dey, D. K., S. K. Ghosh, and B. K. Mallick. 2000. Generalized Linear Models: A Bayesian Perspective. New York:Dekker.
Eberly, L. E., and G. Casella. 2003. Estimating Bayesian credible intervals. Journal of Statistical Planning andInference 112: 115–132.
Gamerman, D., and H. F. Lopes. 2006. Markov Chain Monte Carlo: Stochastic Simulation for Bayesian Inference.2nd ed. Boca Raton, FL: Chapman & Hall/CRC.
Gelfand, A. E., S. E. Hills, A. Racine-Poon, and A. F. M. Smith. 1990. Illustration of Bayesian inference in normaldata models using Gibbs sampling. Journal of the American Statistical Association 85: 972–985.
Gelman, A., J. B. Carlin, H. S. Stern, D. B. Dunson, A. Vehtari, and D. B. Rubin. 2014. Bayesian Data Analysis.3rd ed. Boca Raton, FL: Chapman & Hall/CRC.
Gelman, A., W. R. Gilks, and G. O. Roberts. 1997. Weak convergence and optimal scaling of random walk Metropolisalgorithms. Annals of Applied Probability 7: 110–120.
Gelman, A., and D. B. Rubin. 1992. Inference from iterative simulation using multiple sequences. Statistical Science7: 457–472.
Geman, S., and D. Geman. 1984. Stochastic relaxation, Gibbs distributions, and the Bayesian restoration of images.IEEE Transactions on Pattern Analysis and Machine Intelligence 6: 721–741.
Geweke, J. 1992. Evaluating the accuracy of sampling-based approaches to the calculation of posterior moments. InVol. 4 of Bayesian Statistics: Proceedings of the Fourth Valencia International Meeting, April 15–20, 1991, ed.J. M. Bernardo, J. O. Berger, A. P. Dawid, and A. F. M. Smith, 169–193. Oxford: Clarendon Press.
. 1999. Using simulation methods for Bayesian econometric models: Inference, development, and communication.Econometric Reviews 18: 1–73.
Giordani, P., and R. J. Kohn. 2010. Adaptive independent Metropolis–Hastings by fast estimation of mixtures ofnormals. Journal of Computational and Graphical Statistics 19: 243–259.
Godsill, S. J., and P. J. W. Rayner. 1998. Digital Audio Restoration. Berlin: Springer.
Gordon, N. J., D. J. Salmond, and A. F. M. Smith. 1993. novel approach to nonlinear/non-Gaussian Bayesian stateestimation. IEE Proceedings on Radar and Signal Processing 140: 107–113.
Green, P. J. 1995. Reversible jump Markov chain Monte Carlo computation and Bayesian model determination.Biometrika 82: 711–732.
Greenland, S. 1998. Probability logic and probabilistic induction. Epidemiology 9: 322–332.
Haario, H., E. Saksman, and J. Tamminen. 2001. An adaptive Metropolis algorithm. Bernoulli 7: 223–242.
Hastings, W. K. 1970. Monte Carlo sampling methods using Markov chains and their applications. Biometrika 57:97–109.
Heidelberger, P., and P. D. Welch. 1983. Simulation run length control in the presence of an initial transient. OperationsResearch 31: 1109–1144.

22 intro — Introduction to Bayesian analysis
Hobert, J. P. 2000. Hierarchical models: A current computational perspective. Journal of the American StatisticalAssociation 95: 1312–1316.
Hoff, P. D. 2009. A First Course in Bayesian Statistical Methods. New York: Springer.
Iversen, E., Jr, G. Parmigiani, and D. A. Berry. 1999. Validating Bayesian Prediction Models: a Case Study in GeneticSusceptibility to Breast Cancer. In Case Studies in Bayesian Statistics, ed. J. M. Bernardo, J. O. Berger, A. P.Dawid, and A. F. M. Smith, vol. IV, 321–338. New York: Springer.
Jeffreys, H. 1935. Some tests of significance, treated by the theory of probability. Mathematical Proceedings of theCambridge Philosophical Society 31: 203–222.
. 1961. Theory of Probability. 3rd ed. Oxford: Oxford University Press.
Johnson, V. E. 1997. An alternative to traditional GPA for evaluating student performance. Statistical Science 12:251–269.
Kass, R. E., and A. E. Raftery. 1995. Bayes factors. Journal of the American Statistical Association 90: 773–795.
Kim, S., N. Shephard, and S. Chib. 1998. Stochastic volatility: Likelihood inference and comparison with ARCHmodels. The Reviews of Economic Studies 65: 361–393.
Metropolis, N., A. W. Rosenbluth, M. N. Rosenbluth, A. H. Teller, and E. Teller. 1953. Equation of state calculationsby fast computing machines. Journal of Chemical Physics 21: 1087–1092.
Metropolis, N., and S. Ulam. 1949. The Monte Carlo method. Journal of the American Statistical Association 44:335–341.
Muller, P., and B. Vidakovic, ed. 1999. Bayesian Inference in Wavelet-Based Models. New York: Springer.
Neal, R. M. 1996. Bayesian Learning for Neural Networks. New York: Springer.
. 1999. Regression and classification using gaussian process priors. In Vol. 6 of Bayesian Statistics: Proceedingsof the Sixth Valencia International Meeting, ed. J. M. Bernardo, J. O. Berger, A. P. Dawid, and A. F. M. Smith,475–501. Oxford: Oxford University Press.
Parent, E., P. Hubert, B. Bobee, and J. Miquel. 1998. Statistical and Bayesian Methods in Hydrological Sciences.Paris: UNESCO Press.
Pearl, J. 1998. Probabilistic Reasoning in Intelligent Systems: Networks of Plausible Inference. San Francisco, CA:Morgan Kaufmann.
Poirier, D. J. 1995. Intermediate Statistics and Econometrics: A Comparative Approach. Cambridge, MA: MIT Press.
Pole, A., M. West, and J. Harrison. 1994. Applied Bayesian Forecasting and Time Series Analysis. Boca Raton, FL:Chapman and Hall.
Pollard, W. E. 1986. Bayesian Statistics for Evaluation Research: An Introduction. Newbury Park, CA: Sage.
Propp, J. G., and D. B. Wilson. 1996. Exact sampling with coupled Markov chains and applications to statisticalmechanics. Random Structures and Algorithms 9: 223–252.
Raftery, A. E., and S. M. Lewis. 1992. How many iterations in the Gibbs sampler? In Vol. 4 of Bayesian Statistics:Proceedings of the Fourth Valencia International Meeting, April 15–20, 1991, ed. J. M. Bernardo, J. O. Berger,A. P. Dawid, and A. F. M. Smith, 763–773. Oxford: Clarendon Press.
Rios Insua, D. 1990. Sensitivity Analysis in Multi-Objective Decision Making. New York: Springer.
Robert, C. P., and G. Casella. 2004. Monte Carlo Statistical Methods. 2nd ed. New York: Springer.
Roberts, G. O., and J. S. Rosenthal. 2007. Coupling and ergodicity of adaptive Markov chain Monte Carlo algorithms.Journal of Applied Probability 44: 458–475.
. 2009. Examples of adaptive MCMC. Journal of Computational and Graphical Statistics 18: 349–367.
Schwarz, G. 1978. Estimating the dimension of a model. Annals of Statistics 6: 461–464.
Tanner, M. A. 1996. Tools for Statistical Inference: Methods for the Exploration of Posterior Distributions andLikelihood Functions. 3rd ed. New York: Springer.
Tanner, M. A., and W. H. Wong. 1987. The calculation of posterior distributions by data augmentation (with discussion).Journal of the American Statistical Association 82: 528–550.
Thompson, J. 2014. Bayesian Analysis with Stata. College Station, TX: Stata Press.
Thompson, S. K. 2012. Sampling. 3rd ed. Hoboken, NJ: Wiley.

intro — Introduction to Bayesian analysis 23
Tierney, L. 1994. Markov chains for exploring posterior distributions. Annals of Statistics 22: 1701–1728.
von Neumann, J. 1951. Various techniques used in connection with random digits. Monte Carlo methods. Journal ofResearch of the National Bureau of Standards 12: 36–38.
West, M., and J. Harrison. 1997. Bayesian Forecasting and Dynamic Models. 2nd ed. New York: Springer.
Wolpert, R. L., and K. Ickstadt. 1998. Poisson/gamma random field models for spatial statistics. Biometrika 85:251–267.
Yu, B., and P. Mykland. 1998. Looking at Markov samplers through cusum path plots: A simple diagnostic idea.Statistics and Computing 8: 275–286.
Zellner, A. 1997. Bayesian Analysis in Econometrics and Statistics: The Zellner View and Papers. Northampton, MA:Edward Elgar.
Zellner, A., and C.-K. Min. 1995. Gibbs sampler convergence criteria. Journal of the American Statistical Association90: 921–927.
Also see[BAYES] bayes — Introduction to commands for Bayesian analysis
[BAYES] Glossary