title: strong genetic structure among coral populations
TRANSCRIPT

Title: Strong genetic structure among coral populations within a conservation priority region, the 1
Bird's Head Seascape (Papua and West Papua, Indonesia) 2
3
Authors: Craig John Starger1,2,3,4
; Paul Henry Barber4; Mark van Nydeck Erdmann
5; Abdul 4
Hamid A. Toha6; Andrew Charles Baker
7,8 5
6
Authors’ addresses: 7
8
1. Science & Technology Policy Fellowships, Center of Science, Policy & Society 9
Programs, American Association for the Advancement of Science, 1200 New York 10
Avenue NW, Washington DC, 22205 USA. 11
2. Department of Ecology, Evolution and Environmental Biology, Columbia University, 12
New York, NY, USA 13
3. Sackler Institute for Comparative Genomics, American Museum of Natural History, New 14
York, NY, USA. 15
4. Department of Ecology and Evolutionary Biology, University of California Los Angeles, 16
Los Angeles, California, USA. 17
5. Conservation International, Indonesia Marine Program, Renon, Bali, Indonesia. 18
6. Faculty of Animal Sciences, Fisheries and Marine Science, State University of Papua, 19
Manokwari, West Papua, Indonesia. 20
7. Rosenstiel School of Marine and Atmospheric Science, University of Miami, Miami, 21
Florida, USA 22
8. Marine Conservation Program, Wildlife Conservation Society, Bronx, New York, USA 23
PeerJ PrePrints | https://peerj.com/preprints/25v1/ | v1 received: 31 May 2013, published: 31 May 2013, doi: 10.7287/peerj.preprints.25v1
PrePrin
ts

Abstract: Marine Protected Areas (MPAs) are widely considered to be one of the best strategies 24
available for protecting biodiversity and ecosystem processes in marine environments, 25
particularly in developing, tropical nations. While data on connectivity and genetic structure of 26
marine populations are critical to designing appropriately sized and spaced networks of MPAs, 27
such data are rarely available. Here we present an assessment of genetic structure in reef-28
building corals from Papua and West Papua, Indonesia, among the most biologically diverse and 29
least disturbed coral reef regions in the world, and the focus of the multi-institutional Bird's Head 30
Seascape initiative to design and implement a functional network of MPAs. Microsatellite 31
variation was assessed within and among populations of Pocillopora damicornis (Linnaeus, 32
1758) and Seriatopora hystrix (Dana 1846) (family: Pocilloporidae) from three regions, each 33
currently under a different conservation regime: Teluk Cenderawasih, Raja Ampat, and 34
southwest Papua. Analyses of molecular variance, assignment tests, and genetical bandwidth 35
mapping revealed significant local-scale structure in both species, and a lack of regional filters to 36
gene flow. Overall, P. damicornis populations were less structured (FST = 0.139, p < 0.00001) 37
than those of S. hystrix (FST = 0.357, p < 0.00001). In order to maintain connectivity within and 38
among regions, coral reef conservation on the local scale is needed. These data have been 39
directly applied to the design of a MPA network in the Bird’s Head Seascape. 40
41
42
43
44
45
46
PeerJ PrePrints | https://peerj.com/preprints/25v1/ | v1 received: 31 May 2013, published: 31 May 2013, doi: 10.7287/peerj.preprints.25v1
PrePrin
ts

Introduction 47
48
Comprising only a small fraction of the surface of the Earth’s oceans, coral reefs are the world’s 49
most biologically diverse marine ecosystems (Connell 1978, Reaka-Kudla 1997). Despite the 50
ecological and economic importance of coral reefs, they are rapidly declining worldwide due to 51
human influence (Hoegh-Guldberg et al. 2007). Within the past few decades, 19% of the world’s 52
coral reefs have been destroyed and 15% are now at risk of imminent collapse in the next 10 to 53
20 years (Wilkinson 2008), with rates of decline that exceed those of tropical rain forests (Bruno 54
and Selig 2007). Two thirds of the Caribbean and over 85% of Southeast Asian coral reefs are 55
considered under threat (Burke et al. 2012) 56
57
58
Most troubling in these declines is the dramatic reduction in the abundance of reef-building 59
corals (order: Scleractinia) threatening the very foundation of coral reef ecosystems. For 60
example, the Coral Triangle (a region comprised of the Philippines, Malaysia, Indonesia, Papua 61
New Guinea, the Solomon Islands, Brunei Darussalam, and Timor-Leste) has the highest 62
proportion of ‘Vulnerable’ and ‘Near Threatened’ coral species based on IUCN Red List Criteria 63
(Carpenter et al. 2008). Anthropogenic loss of corals and the degradation of coral reef 64
environments are severely impacting the long term stability of coral communities (Adams and 65
Ebersole 2010, Hughes et al. 2010) creating an urgent need for coral-focused conservation, 66
especially within the Coral Triangle (Burke et al. 2012) 67
68
PeerJ PrePrints | https://peerj.com/preprints/25v1/ | v1 received: 31 May 2013, published: 31 May 2013, doi: 10.7287/peerj.preprints.25v1
PrePrin
ts

Marine protected areas (MPAs) are considered one of the best methods for protecting species 69
diversity and ecosystem processes and functions. Despite their demonstrated effectiveness 70
(Levitan and McGovern 2005), only 2% of the world’s coral reefs are within MPAs with 71
adequate conditions for the conservation of biodiversity (Mora et al. 2006). Given that this 72
amount is far less than the recommended 20-30% (Mora et al. 2006), the recent and projected 73
growth of MPAs in the coming years increases the need for sound marine conservation science. 74
While understanding connectivity has been identified as critical to developing long-term 75
conservation strategies for marine ecosystems (Botsford et al. 2001, Cowen et al. 2006, Crowder 76
et al. 2000, Palumbi 2003), it remains among the most crucial gaps in scientific knowledge 77
necessary for marine conservation (Sale et al. 2005). In addition, genetic diversity has rarely 78
been incorporated in international biodiversity conservation policy (Laikre 2010). 79
80
Coral reefs in the provinces of Papua and West Papua, Indonesia, (Figure 1) collectively referred 81
to as the ‘Bird’s Head Seascape’ (BHS), are among the most diverse and pristine in the world 82
(Allen 2008) and rank as the Indonesian government's number one priority region for marine 83
biodiversity conservation development (Huffard et al. 2012a). This region is also the focus of the 84
multi-institutional Bird’s Head Seascape initiative, comprised of NGOs and universities working 85
with local governments to design and implement an ecosystem-based management plan that has 86
as its centerpiece a network of MPAs that span the entire Bird’s Head Seascape (Mangubhai et 87
al. 2012). Therefore, understanding patterns of genetic connectivity among populations of coral 88
reef animals within this region has been an ongoing research priority for the past seven years. 89
Results from genetic studies, including this one, have been fed directly into MPA network 90
PeerJ PrePrints | https://peerj.com/preprints/25v1/ | v1 received: 31 May 2013, published: 31 May 2013, doi: 10.7287/peerj.preprints.25v1
PrePrin
ts
planning and design in the Bird's Head Seascape even before many of these studies were 91
formally published (Huffard et al. 2012b). 92
93
Here we present fine scale spatial genetic patterns in Pocillopora damicornis (Linnaeus, 1758) 94
and Seriatopora hystrix (Dana 1846), two scleractinian coral species that represent opposite ends 95
of the genetic connectivity spectrum. We use analytical methods specifically designed for low 96
and uneven sample sizes (necessary for investigators focusing on rare and threatened species) to 97
test for limits to connectivity among the coral reefs of the Bird’s Head Seascape, a region 98
designated a top conservation priority within the Coral Triangle, and to test the hypothesis that 99
populations of P. damicornis will be more open with lower levels of genetic structure, while S. 100
hystrix will exhibit higher genetic structure, resulting from more limited dispersal (Starger et al. 101
2010). We also hypothesize that these populations have undergone recent declines given the 102
threatened nature of many Indonesian coral reefs. Our results improve our understanding of 103
genetic structure of coral populations in remote and understudied areas while providing useful 104
data for managers currently developing conservation strategies for the globally significant Bird’s 105
Head Seascape. 106
107
Recent reports from Australia, Kenya and the Eastern Pacific have revealed previously unknown 108
genetic diversity within P. damicornis and S. hystrix and some have suggested that this genetic 109
variation may represent cryptic species (e.g. Souter 2010, Pinzón and LaJeunesse 2011, Schmidt-110
Roach et al. 2012, Pinzón et al. 2013). Despite these findings, most of the evidence for cryptic 111
coral species presented in these publications is derived a limited number of molecular loci and no 112
quantitative morphology resulting in poorly supported phylogenetic reconstructions and no clear 113
PeerJ PrePrints | https://peerj.com/preprints/25v1/ | v1 received: 31 May 2013, published: 31 May 2013, doi: 10.7287/peerj.preprints.25v1
PrePrin
ts
delimitations of cryptic species. In addition, studies rarely incorporate known sister taxa in a 114
phylogenetic context except for Souter (2010), who tested East African P. damicornis against 115
congeners from Hawai’i and the Tropical Eastern Pacific, and Bongaerts et al. (2010), whose 116
analysis of S. hystrix and S. caliendrum recovered S. hystrix as a monophyletic clade with 117
marginal evidence of reproductive isolation among depth-distributed types. Furthermore, some 118
of these recent methods, such as the use of symbiosis ecology to delineate coral species (Pinzón 119
and LaJeunesse 2011), are already being invalidated (Cunning et al. 2013). Clearly not enough 120
data currently exist to reject the null hypothesis that the original species designations are still 121
valid and that our population genetic study and others (e.g. Ayre and Hughes 2004, Starger et al. 122
2010, Combosch and Vollmer 2011, Nir et al. 2011, Paz-Garcia et al. 2012) also remain valid. 123
124
Methods 125
126
Species identification and site selection 127
128
Coral samples were identified in the field using the species identification criteria and key of 129
Veron (2000). Samples included in the present study (Table 1) were collected from three remote 130
and relatively undisturbed regions within the Bird’s Head Seascape that are currently under 131
different conservation management plans and that also represents distinct ’coral ecoregions’ 132
based on coral species composition (Veron et al. 2009): Raja Ampat, Teluk Cenderawasih, and 133
Southwestern Papua (Figure 1). The coral reefs of Raja Ampat lay off the western most tip of the 134
island of New Guinea and are at the center of the Bird’s Head Seascape. Human threats are 135
minimal but increasing, and include destructive and unsustainable fishing (Varkeya et al. 2010) 136
PeerJ PrePrints | https://peerj.com/preprints/25v1/ | v1 received: 31 May 2013, published: 31 May 2013, doi: 10.7287/peerj.preprints.25v1
PrePrin
ts

and terrigenous pollution from logging and coastal development (McKenna et al 2002, Burke et 137
al. 2012, Mangubhai et al. 2012). 138
139
There are currently 12 actively managed MPAs in the BHS ranging in size from 5000 to 140
1,453,500 ha and covering a total area of 3,594,702 ha (see Figure 1 and Table 2 in Mangubhai 141
et al. 2012). A network of seven marine protected areas was first designated in Raja Ampat in 142
May, 2007 and expanded in 2009 to cover a total of 1,125,940 ha, approximately 50% of Raja 143
Ampat’s shallow reef areas, with MPAs ranging in size from 53,100 ha to 343,200 ha and the 144
spacing between MPAs ranging from 20-100 km (Mangubhai et al. 2012). To the east of Raja 145
Ampat is Teluk Cenderawasih, wherein lies the Taman Nasional Teluk Cenderawasih (TNTC, or 146
Cenderawasih Bay National Park), an MPA covering 1,453,500 ha and approximately 30% of 147
the reefs of Teluk Cenderawasih (Figure 1). To the Southwest, the Kaimana MPA covers all of 148
Kaimana’s jurisdictional waters (597,747 ha) (Mangubhai et al. 2012). 149
150
Located along the New Guinea Coastal Current that flows westward toward Raja Ampat (Morey 151
et al. 1999, Nof 1995), Teluk Cenderawasih may serve as a larval source for Raja Ampat. 152
Alternatively, connectivity may be restricted due to the relatively sheltered nature of the bay, 153
(DeBoer et al. 2008, Crandall et al. 2008, Wallace et al. 2011, Allen and Erdman 2012) limiting 154
water and larval movement to outside populations. Although the reefs of Lemon, Adoki and Owi 155
islands are technically not in Teluk Cenderawasih, they do lie within the ‘Cenderawasih Bay’ 156
coral ecoregion (Veron et al. 2009) and are therefore pooled with reefs within the bay for our 157
analysis. On the southern coast of the Bird’s Head Seascape lie Fakfak and Kaimana. Recent 158
surveys in this region by Conservation International revealed a diverse and highly endemic fauna 159
PeerJ PrePrints | https://peerj.com/preprints/25v1/ | v1 received: 31 May 2013, published: 31 May 2013, doi: 10.7287/peerj.preprints.25v1
PrePrin
ts
(Allen 2008), and both the local and national governments are now committed to developing new 160
MPAs in the region to protect this diversity (Huffard et al. 2012b). 161
162
Genetic analysis 163
164
A subset of previously published allele frequency data from Starger et al. (2010) was used to test 165
new hypotheses for the Bird’s Head Seascape using new analytical methods. Briefly, Starger et 166
al. (2010) analyzed specimens from across Indonesia, including the Bird’s Head Seascape, as 167
possible source populations for the recovery of coral genetic diversity in the Sunda Strait 168
following the 1883 eruption of the volcano Krakatau. For the present study, we used truncated 169
allele frequency data files from Starger et al. (2010) to focus only on the populations of the 170
Bird’s Head Seascape to address entirely different research questions. We subsequently 171
employed new analysis methods to estimate connectivity and genetic diversity of these 172
populations to inform an ongoing conservation initiative in the region that aims to promote a 173
network of marine protected areas based on scientific data. 174
175
In order to test the hypothesis that significant genetic variation exists among sample locations, 176
data from the Bird’s Head Seascape (Table 1) were analyzed for each species with AMOVA 177
(Excoffier et al. 1992) as implemented in Arlequin 3.5.1.2 (Excoffier and Lischer 2010) 178
assuming no regional genetic structure among sample locations. Hierarchical AMOVA was then 179
performed to test the significance of the three coral ecoregions (Veron et al 2009): Raja Ampat, 180
Teluk Cenderawasih, and Southwestern Papua. The significance of this structure was tested with 181
20,000 random permutations using both the infinite alleles model (IAM, represented by F 182
PeerJ PrePrints | https://peerj.com/preprints/25v1/ | v1 received: 31 May 2013, published: 31 May 2013, doi: 10.7287/peerj.preprints.25v1
PrePrin
ts

statistics, (Weir and Cockerham 1984)) and the distance-based, stepwise mutation model of 183
microsatellite evolution (SMM, represented by R statistics, (Slatkin 1995)). Only those 184
populations with ten or greater unique genotypes were considered in AMOVA calculations. 185
186
To examine genetic structure without a priori assumptions of population membership, we 187
employed spatial and non-spatial Bayesian assignment methods implemented in BAPS 5.3 188
(Corander et al. 2008, Corander and Marttinen 2006) as described by Starger et al. (2010). 189
Genetic structure and admixture were also assessed using the individual-based assignment test 190
implemented in the program Structure 2.2.2 (Hubisz et al. 2009, Falush et al. 2003, Pritchard et 191
al. 2000) using the admixture model with no prior information on population origin. All 192
individuals were considered in this analysis. The assignment method was performed using 193
300,000 iterations, the first 100,000 of which were discarded as burn-in. K values from 2 to 15 194
were tested. The Delta K method of Evanno et al. (2005) was implemented to determine the most 195
likely K value. 196
197
In order to assess population decline in these coral species, a critical component of conservation 198
planning, we tested for recent population bottlenecks using a method developed by Garza and 199
Williamson (2001). This approach calculates M, the ratio of the total number of alleles to the 200
range in allele sizes, and is a good estimate of recent population decline that is commonly used to 201
inform conservation decision making. 202
203
Finally, in order to identify putative barriers to dispersal, we applied a 'genetical bandwidth 204
mapping' approach, which is based on 'wombling' (Womble 1951) and implemented in the 205
PeerJ PrePrints | https://peerj.com/preprints/25v1/ | v1 received: 31 May 2013, published: 31 May 2013, doi: 10.7287/peerj.preprints.25v1
PrePrin
ts

program GenbMap (Cercueil et al. 2007). Genetical bandwidth mapping identifies spatial 206
discontinuities in allele frequencies that may represent barriers to dispersal. Unlike model-based 207
approaches, genetical bandwidth mapping is nonparametric and does not assume a particular 208
measure of genetic distance. This method is particularly relevant to studies where fine scale 209
structure is stronger than regional structure, which can occur in low dispersal species, and for 210
studies with low and irregular sample sizes (Cercueil et al. 2007) which is appropriate in this 211
case. GenbMap was run with a resolution of 300 x 300 pixels, 200 iterations, and p=0.05. Since 212
GPS coordinates were only taken at each locality, each individual coral's GPS coordinates were 213
randomly perturbed by 10 m following the example of Cercueil et al. (2007). Statistical 214
significance of the resulting 'genetical regions' was tested using AMOVA. 215
216
Results 217
218
Allelic variation in microsatellites 219
220
For P. damicornis, 169 individuals (Table 1) were genotyped and analyzed at nine microsatellite 221
loci. The number of alleles per locus ranged from seven at locus Pd3-005 to 20 at locus PV2 222
(mean: 11.67). Five multilocus genotypes were observed in more than one individual however 223
only two of these were observed in more than two individuals. In total, nine clonal individuals 224
were removed from the analysis. For S. hystrix, 191 individuals (Table 1) were genotyped and 225
analyzed at seven microsatellite loci. The number of alleles per locus ranged from three at locus 226
Sh3-003 to 19 at locus Sh2-006 (mean: 10.57). Six multilocus genotypes were observed in more 227
than one individual however only one of these was observed in more than two individuals. In 228
PeerJ PrePrints | https://peerj.com/preprints/25v1/ | v1 received: 31 May 2013, published: 31 May 2013, doi: 10.7287/peerj.preprints.25v1
PrePrin
ts
total, six clonal individuals were removed from the analysis. The unique number of genotypes 229
(Ng) and M values for each study location are presented in Tables 2 and 3. Statistics on 230
heterozygosity and Hardy-Weinberg equilibrium are available in Starger et al. (2010). 231
232
Population genetic structure 233
234
AMOVA analysis with no a priori assumptions indicated strong structure in both species with 235
FST = 0.139 (RST = 0.130) for P. damicornis and FST = 0.357 (RST = 0.246) for S. hystrix (p < 236
0.00001 for all values) with 16-17% and 30-37% respectively of the variation due to differences 237
among localities (Tables 4 and 5). Results from the hierarchical AMOVA (Tables 4 and 5) 238
indicate that genetic structure does not result from differentiation among the three biogeographic 239
regions (Figure 1). In P. damicornis both the infinite alleles model and stepwise mutation model 240
indicate that regional genetic breaks explain none of the observed genetic variation. Regional 241
structure is weak but significant in S. hystrix when based on the infinite alleles model (FCT = 242
0.068, p=0.03), explaining 6.84% of the variation, but not significant when based on the stepwise 243
mutation model (RCT = 0.043, p = 0.18). Instead, variation among populations within regions 244
explained the majority of variation in both species: 86.84% of the variation in P. damicornis with 245
FST = 0.132 (p < 0.00001) and 63.02% of the variation in S. hystrix, with FST = 0.370 (p < 246
0.00001). Similar results were achieved using the SMM (Tables 4 and 5). 247
248
M values (Tables 2 and 3) are generally lower for P. damicornis. Results from the non-spatial 249
assignments test implemented in BAPS identified five genetic clusters from 12 P. damicornis 250
localities, two of which were excluded due to low sample size (Table 2, Figure 2), and ten 251
PeerJ PrePrints | https://peerj.com/preprints/25v1/ | v1 received: 31 May 2013, published: 31 May 2013, doi: 10.7287/peerj.preprints.25v1
PrePrin
ts

genetic clusters in 11 S. hystrix populations (Table 3, Figure 3). Clusters containing multiple 252
populations were generally but not always comprised of geographically proximal localities. For 253
example, P. damicornis Cluster 1 includes four sites in Raja Ampat, however Cluster 2 consists 254
of sites from Raja Ampat and Teluk Cenderawasih, suggesting genetic connectivity between 255
these ecoregions. For S. hystrix, Cluster 1 contained adjacent sites Kri Island and Alyui in Raja 256
Ampat. Spatial clustering results were identical to the non-spatial clustering for both species, 257
with the exception of P. damicornis in which Kri Island, was assigned to Cluster 1 in the spatial 258
analysis and clustered alone in the non-spatial analysis (not shown). Furthermore, log(likelihood) 259
was higher in the non-spatial analysis compared to the spatial analysis for P. damicornis (-260
3,701.47 versus 3,718.95) and S. hystrix (-2,892.18 versus 2,916.11), indicating close agreement 261
between spatial and non-spatial methods. While AMOVA results based on BAPS partitions 262
indicate significant variation among groups explaining 6% and 28% of the variation among 263
regions of P. damicornis and S. hystrix respectively, the majority of the variation was still 264
observed within localities (Tables 4 and 5). 265
266
When using the individual-based analysis implemented in Structure 2.2.2, the ‘correct’ number 267
of clusters that fit our data was not clear. Delta K indicated K=2 as the most likely value for P. 268
damicornis and K=12 for S. hystrix, but in both species likelihood increased asymptotically as K 269
values increased towards and then beyond the number of sampled localities (not shown). Results 270
for K=2 for each species indicate mixing of clusters between Raja Ampat and Teluk 271
Cenderawasih, while Kaimana and Fakfak contained mostly one cluster (Figure 2). As a 272
heuristic, we also present K=6 for P. damicornis and K=11 for S. hystrix as indicated by BAPS 273
as the most likely number of clusters (Table 2, Figure 2). Results of these analyses show a strong 274
PeerJ PrePrints | https://peerj.com/preprints/25v1/ | v1 received: 31 May 2013, published: 31 May 2013, doi: 10.7287/peerj.preprints.25v1
PrePrin
ts
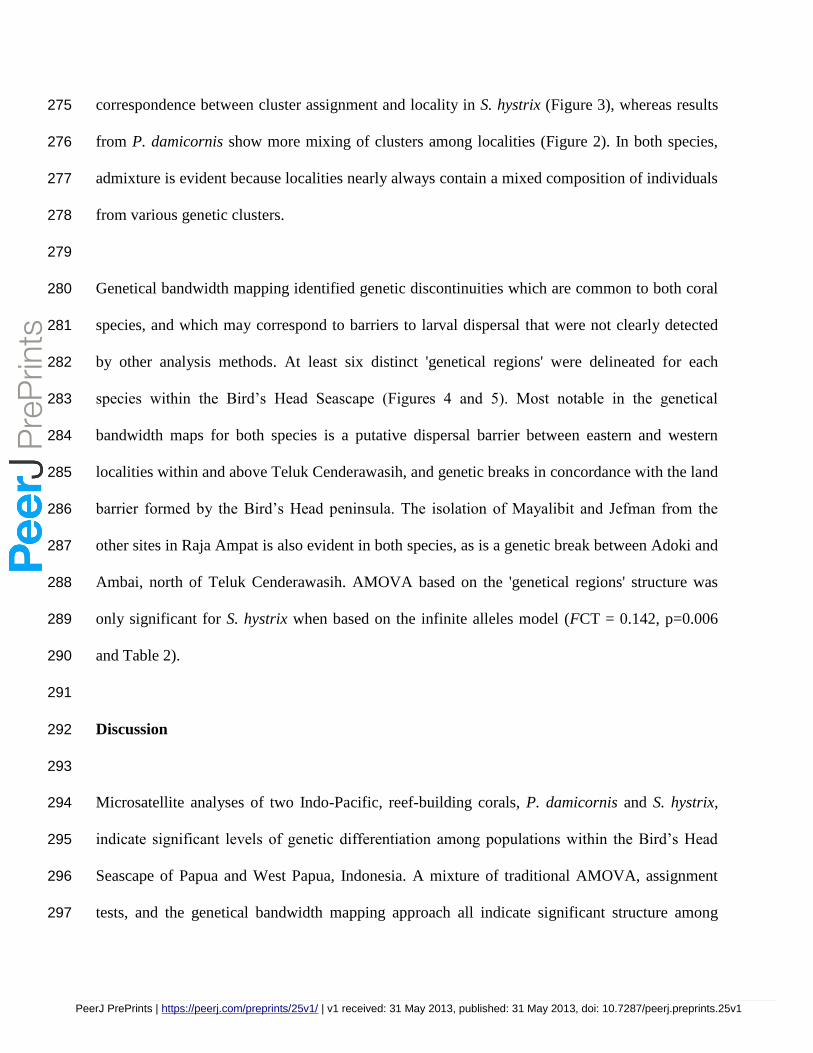
correspondence between cluster assignment and locality in S. hystrix (Figure 3), whereas results 275
from P. damicornis show more mixing of clusters among localities (Figure 2). In both species, 276
admixture is evident because localities nearly always contain a mixed composition of individuals 277
from various genetic clusters. 278
279
Genetical bandwidth mapping identified genetic discontinuities which are common to both coral 280
species, and which may correspond to barriers to larval dispersal that were not clearly detected 281
by other analysis methods. At least six distinct 'genetical regions' were delineated for each 282
species within the Bird’s Head Seascape (Figures 4 and 5). Most notable in the genetical 283
bandwidth maps for both species is a putative dispersal barrier between eastern and western 284
localities within and above Teluk Cenderawasih, and genetic breaks in concordance with the land 285
barrier formed by the Bird’s Head peninsula. The isolation of Mayalibit and Jefman from the 286
other sites in Raja Ampat is also evident in both species, as is a genetic break between Adoki and 287
Ambai, north of Teluk Cenderawasih. AMOVA based on the 'genetical regions' structure was 288
only significant for S. hystrix when based on the infinite alleles model (FCT = 0.142, p=0.006 289
and Table 2). 290
291
Discussion 292
293
Microsatellite analyses of two Indo-Pacific, reef-building corals, P. damicornis and S. hystrix, 294
indicate significant levels of genetic differentiation among populations within the Bird’s Head 295
Seascape of Papua and West Papua, Indonesia. A mixture of traditional AMOVA, assignment 296
tests, and the genetical bandwidth mapping approach all indicate significant structure among 297
PeerJ PrePrints | https://peerj.com/preprints/25v1/ | v1 received: 31 May 2013, published: 31 May 2013, doi: 10.7287/peerj.preprints.25v1
PrePrin
ts

localities within West Papua, suggesting limits to connectivity among these coral populations. 298
Sample sizes were not large enough for traditional estimates of gene flow (Nm) however, as 299
predicted, genetic structure was higher in S. hystrix (FST = 0.360, p < 0.001) than in P. 300
damicornis (FST = 0.139, p < 0.001) suggesting more limited dispersal in the former, a result 301
consistent with previous comparative research from Eastern Australia (Ayre and Hughes 2000, 302
2004) and across all of Indonesia (Starger et al. 2010). 303
304
Strong, significant genetic structure indicates substantial limits to genetic and demographic 305
connectivity (Hedgecock et al. 2007) among coral populations of West Papua. However, while 306
the data clearly indicate structure across the Bird’s Head Seascape in both species, this structure 307
is not clearly explained by geography or the delineated coral ecoregions of Veron et al. (2009). 308
AMOVA and assignment tests could not differentiate among Teluk Cenderawasih, Raja Ampat, 309
and Southwestern Papua, but instead revealed fine scale patterns of genetic structure within 310
Teluk Cenderawasih and within Raja Ampat. AMOVA results indicate significant levels of 311
variation among localities within these regions, explaining 15.99% of the overall variation for P. 312
damicornis and 30.14% for S. hystrix, with almost all the remaining genetic variation contained 313
within localities (Table 2). Similar results were obtained by the Bayesian assignment method 314
implemented in Structure and in the population-based analysis implemented in BAPS. 315
316
This pattern of strong structure on the local scale with weak differences among geographic 317
regions was confirmed by the new technique of genetical bandwidth mapping, a technique that is 318
specifically designed for data sets where sample sizes are irregular and occasionally small. This 319
is characteristic of coral populations in eastern Indonesia —the extreme biodiversity and patchy 320
PeerJ PrePrints | https://peerj.com/preprints/25v1/ | v1 received: 31 May 2013, published: 31 May 2013, doi: 10.7287/peerj.preprints.25v1
PrePrin
ts

composition of coral communities in this region (Veron et al 2009) makes obtaining large sample 321
sizes of individual species difficult. Genetical bandwidth mapping identified putative barriers to 322
dispersal within Raja Ampat and within Teluk Cenderawasih indicating that the results from 323
AMOVA and assignment tests are not artifacts of sample sizes. Interestingly, genetical 324
bandwidth mapping also identified mainland West Papua as a region of genetic discontinuity in 325
both species, supporting the presence of a dispersal barrier common to a wide range of marine 326
invertebrates in this part of the Bird’s Head Seascape (Barber et al. 2006, Barber et al. 2010, 327
Crandall et al. 2008, DeBoer et al. 2008, Carpenter et al. 2011, Barber et al. 2011). These 328
patterns are concordant between the two coral species based on visual inspection of the maps 329
(Figures 3 and 4). Although sample sizes and fixation indices were within the ranges where 330
genetical bandwidth mapping can accurately infer genetic breaks (Cercueil et al. 2007), 331
additional research could result in more accurate estimates of coral connectivity in the region. 332
For example, taking a community genomics approach aligned with quantitative morphological 333
and reproductive studies and oceanographic modeling (Treml and Halpin 2012) would improve 334
our ability to detect subtle genetic structure and the presence of cryptic lineages (Chen et al. 335
2007, Souter 2010, Bongaerts et al. 2010), ecophenotypes (Nir et al. 2011), and cryptic species 336
(discussed below) in corals of the Bird’s Head Seascape. 337
338
Differences between species 339
340
Results also indicate a clear difference in levels of genetic structure between P. damicornis and 341
S. hystrix, the latter having higher genetic structure. Genetic clustering analyses in BAPS and 342
Structure indicate that nearly every S. hystrix locality formed its own unique cluster with 343
PeerJ PrePrints | https://peerj.com/preprints/25v1/ | v1 received: 31 May 2013, published: 31 May 2013, doi: 10.7287/peerj.preprints.25v1
PrePrin
ts

minimal evidence of admixture among localities. The only clear geographic association was seen 344
in the clustering of Alyui with Kri Island, which cluster together in both BAPS and Structure. 345
Otherwise, each S. hystrix locality is genetically distinct, possibly suggestive of the occurrence of 346
multiple ecophenotypes (Nir et al. 2011). Given the geographic proximity of our study sites, and 347
previous evidence suggesting the monophyly of S. hystrix relative to its easily identifiable sister 348
species S. caliendrum (Bongaerts et al. 2010), we find it unlikely, though not impossible, that our 349
genetic clusters represent reproductively isolated cryptic species. P. damicornis populations 350
exhibited lower levels of genetic structure based on fixation indices, and fewer clusters were 351
resolved by BAPS and Structure, suggesting that this species has lower genetic structure than S. 352
hystrix. Cryptic species in P. damicornis might also exist, but we find this even less likely than in 353
S. hystrix given P. damicornis’s reproductive plasticity and long larval duration. 354
355
Differences in observed genetic structure among these two corals may be explained by 356
differences in their larval dispersal abilities. The majority of larvae of both species have been 357
observed to settle within a few days of release (Isomura and Nishihira 2001). However, 358
aquarium-based research on the larval biology of P. damicornis indicates the potential for long 359
distance dispersal via a maximum larval duration of at least 103 days (Richmond 1987). It is not 360
known whether S. hystrix similarly possesses this ability, but as more corals are studied in this 361
way, maximum larval life spans are proving to be much higher than previously thought (Graham 362
et al. 2010). The presence of zooxanthellae in S. hystrix larvae, coupled with evidence of diverse 363
reproductive strategies such as polyp bail-out (Sammarco 1982) and rafting (Jokiel 1984) suggest 364
that extended larval durations may be possible in this species as well. However, the observation 365
of higher structure in S. hystrix in comparison to P. damicornis in this and other studies (Ayre 366
PeerJ PrePrints | https://peerj.com/preprints/25v1/ | v1 received: 31 May 2013, published: 31 May 2013, doi: 10.7287/peerj.preprints.25v1
PrePrin
ts
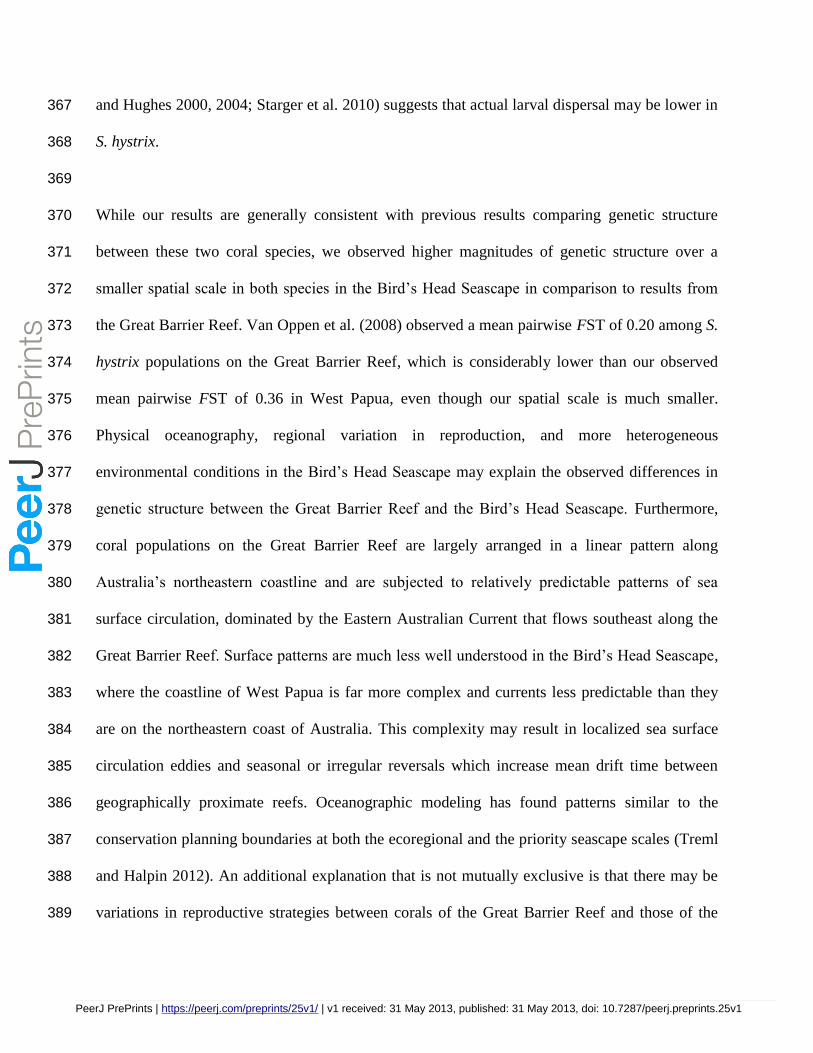
and Hughes 2000, 2004; Starger et al. 2010) suggests that actual larval dispersal may be lower in 367
S. hystrix. 368
369
While our results are generally consistent with previous results comparing genetic structure 370
between these two coral species, we observed higher magnitudes of genetic structure over a 371
smaller spatial scale in both species in the Bird’s Head Seascape in comparison to results from 372
the Great Barrier Reef. Van Oppen et al. (2008) observed a mean pairwise FST of 0.20 among S. 373
hystrix populations on the Great Barrier Reef, which is considerably lower than our observed 374
mean pairwise FST of 0.36 in West Papua, even though our spatial scale is much smaller. 375
Physical oceanography, regional variation in reproduction, and more heterogeneous 376
environmental conditions in the Bird’s Head Seascape may explain the observed differences in 377
genetic structure between the Great Barrier Reef and the Bird’s Head Seascape. Furthermore, 378
coral populations on the Great Barrier Reef are largely arranged in a linear pattern along 379
Australia’s northeastern coastline and are subjected to relatively predictable patterns of sea 380
surface circulation, dominated by the Eastern Australian Current that flows southeast along the 381
Great Barrier Reef. Surface patterns are much less well understood in the Bird’s Head Seascape, 382
where the coastline of West Papua is far more complex and currents less predictable than they 383
are on the northeastern coast of Australia. This complexity may result in localized sea surface 384
circulation eddies and seasonal or irregular reversals which increase mean drift time between 385
geographically proximate reefs. Oceanographic modeling has found patterns similar to the 386
conservation planning boundaries at both the ecoregional and the priority seascape scales (Treml 387
and Halpin 2012). An additional explanation that is not mutually exclusive is that there may be 388
variations in reproductive strategies between corals of the Great Barrier Reef and those of the 389
PeerJ PrePrints | https://peerj.com/preprints/25v1/ | v1 received: 31 May 2013, published: 31 May 2013, doi: 10.7287/peerj.preprints.25v1
PrePrin
ts

Bird’s Head Seascape. It is well established that P. damicornis can be either a brooder or 390
spawner depending on location (Baird et al. 2009), and may undergo ‘reverse metamorphosis’ 391
from polyp to planula when stressed (Richmond 1985). Similarly, S. hystrix can undergo polyp 392
bailout when stressed (Sammarco 1982). It is therefore possible that regional differences in 393
reproductive strategy between the Great Barrier Reef and the Bird’s Head Seascape are 394
contributing to the observed genetic differences. P. damicornis has also been observed rafting on 395
pumice, which could increase drift times under rare circumstances (Bryan et al. 2012). Coral 396
reproduction studies here would serve to shed light on this question. 397
398
On coral species 399
400
Although the possibility exists that some of the genetic variation we observed represents cryptic 401
lineages or species, presently we find limited evidence in the literature for the existence of 402
cryptic coral species. Therefore, we cannot reject the original species descriptions at this time. 403
However, we do not discount the possibility that cryptic species can and probably do exist in the 404
Bird’s Head Seascape where several undescribed coral species have recently been discovered 405
(Mangubhai et al. 2012). Likewise it is possible that reproductive barriers may exist among some 406
of the individuals and populations in our dataset. If this were true, it could potentially invalidate 407
some of the assumptions made in our genetic analysis methods which assume cohesion. 408
Unchanged, however, would be (1) our conclusions that genetic subdivision is widespread and 409
complex within these nominal coral species in the Bird’s Head Seascape, and (2) the knowledge 410
that the Bird’s Head Seascape is home to a remarkable assemblage of endemic coral species 411
(Veron et al. 2009) and genetic variants requiring immediate conservation action. Applying 412
PeerJ PrePrints | https://peerj.com/preprints/25v1/ | v1 received: 31 May 2013, published: 31 May 2013, doi: 10.7287/peerj.preprints.25v1
PrePrin
ts

genomic methods and quantitative morphological characters in a phylogenetic context, as well as 413
conducting reproductive and ecological studies on coral species, would help characterize 414
biodiversity in the Bird’s Head Seascape, advance our understanding of the evolutionary 415
processes that generate and maintain this diversity, and further inform MPA design and 416
management. 417
418
Population decline and coral reef conservation 419
420
The Bird’s Head Seascape is home to some of the most diverse, modern day coral reef 421
ecosystems (Mangubhai et al. 2012). However, one of the disturbing results from this study is 422
that these reefs may not have been immune to population declines. The mean M values, a genetic 423
measure used to infer population declines, for P. damicornis and S. hystrix populations in West 424
Papua (averaging 0.64 and 0.65 respectively) are strikingly similar to those of the Mediterranean 425
Monk Seal (M =0.64) and the Northern Elephant Seal (M = 0.66) (Garza and Williamson 2001), 426
two highly endangered species that have suffered massive population declines. This result 427
strongly suggests a similar, recent population decline in these two coral species. Increasing 428
human pressures on coral reefs in the Bird’s Head Seascape, coupled with increasing sea surface 429
temperatures and episodes of coral bleaching, are likely to exacerbate coral decline throughout 430
the region unless strategic conservation action is taken. Marine conservation initiatives in coral 431
reef regions are increasingly focused on designing and implementing effective networks of 432
MPAs (Roberts 2005, Clifton 2009, Horigue et al. 2012, Mangubhai et al. 2012) with the optimal 433
size and spacing of the individual MPAs within a network being a critical aspect of applied MPA 434
research (Shanks 2003, Mills et al. 2010). While difficulties obtaining the large sample sizes 435
PeerJ PrePrints | https://peerj.com/preprints/25v1/ | v1 received: 31 May 2013, published: 31 May 2013, doi: 10.7287/peerj.preprints.25v1
PrePrin
ts

needed precluded the use of more quantitative estimates of connectivity, and the presence of 436
cryptic species remains possible, our results unequivocally identify fine-scale genetic structure, 437
which strongly suggests limited genetic connectivity among reef building corals within the 438
Bird’s Head Seascape on small spatial scales. This is especially clear in the clustering of S. 439
hystrix individuals by location and the genetical bandwidth maps of both species showing 440
genetic discontinuities within Raja Ampat and within Teluk Cenderawasih. As genetic 441
connectivity requires far fewer dispersing individuals than does demographic connectivity, the 442
strong genetic differentiation in both of these coral species indicates demographic independence 443
of these populations throughout the Bird’s Head Seascape (Hedgecock et al. 2007). 444
445
While methods exist to infer connectivity through genetic assignment tests (e.g. BayesAss+), 446
robust results generally require larger sample sizes than were logistically and biologically 447
possible in our study. While our results cannot provide strong inferences of connectivity, our 448
analyses do show strong evidence for the absence of connectivity. As the number of samples and 449
loci required to detect genetic structure is inversely proportional to the strength of population 450
subdivision (Hillis et al. 1996), the observation of strong genetic structure, even with sample 451
sizes between 10 and 20 individuals, demonstrates that populations of these coral species are 452
strongly isolated across the Bird’s Head Seascape. As such, designating a small number of large, 453
widely-spaced "anchor" MPAs in the hopes that they will serve as larval sources, seeding 454
adjacent unprotected areas, would be an ineffective strategy to protect these coral populations. A 455
more effective strategy to maintain biodiversity and connectivity in the Bird’s Head Seascape is 456
one that is currently being implemented: a network of numerous, relatively closely-spaced MPAs 457
over a broad geographic area. This strategy is designed to provide protection of local reefs as 458
PeerJ PrePrints | https://peerj.com/preprints/25v1/ | v1 received: 31 May 2013, published: 31 May 2013, doi: 10.7287/peerj.preprints.25v1
PrePrin
ts

well as support regional genetic connectivity across the entire Bird’s Head Seascape. In fact, the 459
preliminary results of the present study were directly incorporated into the Bird’s Head Seascape 460
MPA network design process, which included an objective to limit the spacing between MPAs to 461
25-100 km (Huffard et al. 2012b). The network of seven MPAs in the Raja Ampat region is a 462
good example of this approach, with an average MPA size of 160,000 ha and spacing between 463
nearest MPAs averaging less than 60 km. However, further research is advisable to determine 464
whether the number and spacing of these reserves is sufficient, and how many coral reef taxa 465
will benefit from this arrangement. Similarly, Teluk Cenderawasih would also benefit from a 466
network of numerous closely spaced reserves. The Taman Nasional Teluk Cenderawasih covers 467
a large area, nearly 1.5 million hectares, but only includes the western half of the bay. Due to the 468
genetic differentiation of most local populations, it would be advisable to also designate 469
additional MPAs in the eastern half of the bay and to the northeast of the bay, in the vicinity of 470
Adoki and Owi, both to protect local diversity as well as facilitate regional connectivity. 471
Fortunately, the Indonesian Ministry of Marine Affairs and Fisheries and the local Biak 472
government recently gazetted the Padaido Islands Marine Tourism Park in this northeast 473
quadrant of Cendrawasih Bay, and additional MPAs are now being considered. 474
475
Genetic diversity has been historically overlooked in international conservation policy 476
implementation (Laikre 2010). This is also true at the subnational level, where genetic data are 477
very rarely incorporated in conservation planning. However, ours is case where genetic data can 478
and do directly inform conservation action. For example, in addition to arranging MPAs to 479
maintain connectivity, we recommended that the Bird’s Head Seascape MPA network should 480
also serve to protect representative populations from each genetically unique cluster, thereby 481
PeerJ PrePrints | https://peerj.com/preprints/25v1/ | v1 received: 31 May 2013, published: 31 May 2013, doi: 10.7287/peerj.preprints.25v1
PrePrin
ts

conserving the maximum degree of coral genetic diversity. Our data from S. hystrix, where all 482
but two of the sample localities (Kri Island and Alyui) represent distinct genetic clusters, argued 483
for the inclusion of each of these localities within MPAs to maintain this unique genetic diversity 484
into the future. Now, 9 of the 13 localities sampled in this study are indeed included in MPAs 485
within the BHS network (Mangubhai et al. 2012). In the case of P. damicornis, 3 sites 486
(Mauwara, Lemon and Alyui) represent unique genetic clusters that should be prioritized for 487
inclusion in MPAs; in this case, Mauwara is now included in the Kaimana MPA, Alyui is largely 488
protected by a pearl-farming concession and is bordered by the 155,000 ha Kawe MPA, and 489
Lemon is currently under consideration for inclusion as a new MPA. As coral reefs face the 490
coming onslaught of increased coral bleaching (Oliver et al. 2009) and ocean acidification 491
(Pandolfi et al. 2011), it is imperative to maximize protection of genetic diversity to preserve the 492
ability of local populations to adapt to changing environmental conditions. 493
494
Funding limitations in combination with political and socioeconomic realities that motivate 495
unsustainable natural resource use only increase the need for sound science on which to base 496
conservation strategies. Genetic investigations like this provide a disproportionately large 497
amount of data relative to time spent in the field, and the results can help fill some of the most 498
critical scientific gaps in MPA planning (Sale et al. 2005). Although not all reefs can be assessed 499
in a scientifically rigorous manner, insights into the patterns and processes of biological diversity 500
can be used to design effective management schemes that can be put to use in an effective time 501
frame. In our case, the means to apply genetic data to conservation action already exist in 502
ongoing, multi-institutional partnerships in the Bird’s Head Seascape (Green and Mous 2004, 503
Huffard et al. 2012b, Mangubhai et al. 2012). Examination of additional taxa in a similar fashion 504
PeerJ PrePrints | https://peerj.com/preprints/25v1/ | v1 received: 31 May 2013, published: 31 May 2013, doi: 10.7287/peerj.preprints.25v1
PrePrin
ts

to those presented here (Carpenter et al. 2011, Barber et al. 2011), including economically 505
important species, will provide a wide range of results that resource managers may utilize in 506
refining the optimum MPA network for the Bird’s Head Seascape and should serve as an 507
important example for ongoing efforts to design further MPA networks within the Coral Triangle 508
and elsewhere. 509
510
Acknowledgments: 511
512
We thank the Indonesian Institute of Sciences (LIPI) and all national and local authorities for 513
research permission in Indonesia (permit # 2712/SU/KS/2005) and permission to export coral 514
tissues in compliance with CITES (permit # 07218/IV/SATS-LN/2006). Funding for coral 515
collections was provided by a Pew Conservation Fellowship to M.V. Erdmann as well as grants 516
to P.H. Barber from NSF (OCE-0349177) and Conservation International. Laboratory work was 517
supported by R. DeSalle and G. Amato at the Sackler Institute for Comparative Genomics at the 518
American Museum of Natural History and an NSF grant to A. C. Baker (OCE-0099301). C.J. 519
Starger was also supported by an NSF-GK12 Teaching Fellowship through Columbia 520
University’s Chemistry Department. 521
522
Literature Cited: 523
524
Adams A, Ebersole J (2010) Phase shifts and stable states on coral reefs. Marine Ecology 525
Progress Series 413: 201-216. (http://dx.doi.org/10.3354/meps08751) 526
527
PeerJ PrePrints | https://peerj.com/preprints/25v1/ | v1 received: 31 May 2013, published: 31 May 2013, doi: 10.7287/peerj.preprints.25v1
PrePrin
ts
Allen G (2008) Conservation hotspots of biodiversity and endemism for Indo-Pacific coral reef 528
fishes. Aquatic Conservation 18: 541–556. (http://dx.doi.org/10.1002/aqc.880) 529
530
Allen GR, Erdmann MV (2012) Reef Fishes of the East Indies Volumes I–III. Tropical Reef 531
Research, Perth. (ISBN 978-0-9872600-1-7) 532
533
Ayre DJ, Hughes TP (2004) Climate change, genotypic diversity and gene flow in reef-building 534
corals. Ecology Letters 7: 273-278. (http://dx.doi.org/10.1111/j.1461-0248.2004.00585.x) 535
536
Ayre D, Hughes T (2000) Genotypic diversity and gene flow in brooding and spawning corals 537
along the Great Barrier Reef, Australia. Evolution 54: 1590-1605. 538
(http://dx.doi.org/10.1111/j.0014-3820.2000.tb00704.x) 539
540
Baird AH, Guest JR, Willis BL (2009) Systematic and biogeographical patterns in the 541
reproductive biology of scleractinian corals. Annual Review of Ecology, Evolution and 542
Systematics 40: 551-571. (http://dx.doi.org/10.1146/annurev.ecolsys.110308.120220) 543
544
Barber PH, Erdmann MV, Palumbi SR (2006) Comparative phylogeography of three 545
codistributed stomatopods: origins and timing of regional lineage diversification in the Coral 546
Triangle. Evolution 60: 1825-1839. (http://dx.doi.org/10.1111/j.0014-3820.2006.tb00526.x) 547
548
PeerJ PrePrints | https://peerj.com/preprints/25v1/ | v1 received: 31 May 2013, published: 31 May 2013, doi: 10.7287/peerj.preprints.25v1
PrePrin
ts

Barber P, Cheng S, Erdmann M, Tengardjaja K, Ambariyanto (2011) Evolution and 549
Conservation of Marine Biodiversity in the Coral Triangle: Insights from Stomatopod Crustacea. 550
In: Held C (editor) Crustacean Issues CRC Press. 400 pages. 551
552
Baums IB, Miller MW, Hellberg ME (2006) Geographic variation in clonal structure in a reef 553
building Caribbean coral, Acropora palmata. Ecological Monographs 76, 503-519. 554
(http://dx.doi.org/10.1890/0012-9615(2006)076[0503:GVICSI]2.0.CO;2) 555
556
Bongaerts P, Riginos C, Ridgway T, Sampayo EM, Van Oppen MJH, Englebert N, 557
Vermeulen F, Hoegh-Guldberg O (2010) Genetic divergence across habitats in the widespread 558
coral Seriatopora hystrix and its associated Symbiodinium. PLoS ONE 5: 10871-10871 559
(http://dx.doi.org/10.1371/journal.pone.0010871) 560
561
Botsford L, Hastings A, Gaines S (2001) Dependence of sustainability on the configuration of 562
marine reserves and larval dispersal distance. Ecology Letters 4: 144-150. 563
(http://dx.doi.org/10.1046/j.1461-0248.2001.00208.x) 564
565
Bruno J, Selig E (2007) Regional decline of coral cover in the Indo-Pacific: Timing, extent, and 566
subregional comparisons. PLoS ONE 2: e711. (http://dx.doi.org/10.1371/journal.pone.0000711) 567
568
Bryan SE, Cook AG, Evans JP, Hebden K, Hurrey L, Colls PJ, Jell JS, Weatherley D, Firn J 569
(2012) Rapid, Long-Distance Dispersal by Pumice Rafting. PLoS ONE 7(7): e40583. 570
(http://dx.doi.org/10.1371/journal.pone.0040583) 571
PeerJ PrePrints | https://peerj.com/preprints/25v1/ | v1 received: 31 May 2013, published: 31 May 2013, doi: 10.7287/peerj.preprints.25v1
PrePrin
ts
572
Burke L, Reytar K, Spalding M, Perry A (2012). Reefs at Risk Revisited in the Coral Triangle. 573
World Resources Institute. (ISBN 978-1-56973-791-0) 574
575
Carpenter KE, Abrar M, Aeby G, Aronson RB, Banks S, et al. (2008) One-third of reef-building 576
corals face elevated extinction risk from climate change and local impacts. Science 321: 560 - 577
563. (http://dx.doi.org/10.1126/science.1159196) 578
579
Carpenter KE, Barber PH, Crandall ED, Ablan-Lagman MCA, Ambariyanto, Mahardika IGN, 580
Manjaji-Matsumoto BM, Juinio-Meñez MA, Santos MD, Starger CJ, Toha AHA (2011) 581
Comparative phylogeography of the Coral Triangle and implications for marine management. 582
Journal of Marine Biology vol. 2011, Article ID 396982, 14 pages 583
(http://dx.doi.org/10.1155/2011/396982) 584
585
Cercueil A, Francois O, Manel S (2007) The genetical bandwidth mapping: A spatial and 586
graphical representation of population genetic structure based on the wombling method. 587
Theoretical Population Biology 71: 332-341. (http://dx.doi.org/10.1016/j.tpb.2007.01.007) 588
589
Chen C, Dai CF, Plathong S, Chiou CY, Chen CA (2007) The complete mitochondrial genomes 590
of needle corals, Seriatopora spp. (scleractinia: Pocilloporidae): An idiosyncratic atp8, 591
duplicated trnw gene, and hypervariable regions used to determine species phylogenies and 592
recently diverged populations. Molecular Phylogenetics and Evolution 46: 19-33. 593
(http://dx.doi.org/10.1016/j.ympev.2007.09.013) 594
PeerJ PrePrints | https://peerj.com/preprints/25v1/ | v1 received: 31 May 2013, published: 31 May 2013, doi: 10.7287/peerj.preprints.25v1
PrePrin
ts
595
Clifton J (2009) Science, funding and participation: key issues for marine protected area 596
networks and the Coral Triangle Initiative. Environmental Conservation 36 (2): 91–96. 597
(http://dx.doi.org/10.1017/S0376892909990075) 598
599
Combosch DJ, Vollmer SV (2011) Population genetics of an ecosystem-defining reef coral 600
Pocillopora damicornis in the tropical eastern Pacific. PLoS ONE 6 (8): e21200. 601
(http://dx.doi.org/10.1371/journal.pone.0021200) 602
603
Connell J (1978) Diversity in tropical rain forests and coral reefs. Science 199: 1302-1310. 604
(http://dx.doi.org/10.1126/science.199.4335.1302) 605
606
Corander J, Marttinen P (2006) Bayesian identification of admixture events using multi-locus 607
molecular markers. Molecular Ecology 15: 2833-2843. (http://dx.doi.org/10.1111/j.1365-608
294X.2006.02994.x) 609
610
Corander J, Siren J, Arjas E (2008) Bayesian spatial modeling of genetic population structure. 611
Computational Statistics 23: 111-129. (http://dx.doi.org/10.1007/s00180-007-0072-x) 612
613
Cowen RK, Paris CB, Srinivasan A (2006) Scaling of connectivity in marine populations. 614
Science 311: 522-527. (http://dx.doi.org/10.1126/science.1122039) 615
616
PeerJ PrePrints | https://peerj.com/preprints/25v1/ | v1 received: 31 May 2013, published: 31 May 2013, doi: 10.7287/peerj.preprints.25v1
PrePrin
ts

Crandall ED, Frey MA, Grosberg RK, Barber PH (2008) Contrasting demographic history and 617
phylogeographical patterns in two indo-pacific gastropods. Molecular Ecology 17: 611-626. 618
(http://dx.doi.org/10.1111/j.1365-294X.2007.03600.x) 619
620
Crowder L, Lyman S, Figueira W, Priddy J (2000) Source-sink population dynamics and the 621
problem of siting marine reserves. Bulletin of Marine Science 66: 799-820. 622
623
Cunning R, Glynn PW, Baker AC (2013) Flexible associations between Pocillopora corals 624
and Symbiodinium limit utility of symbiosis ecology in defining species. Coral Reefs Online 625
(http://dx.doi.org/10.1007/s00338-013-1036-y) 626
627
DeBoer TS, Subia MD, Ambariyanto, Erdmann MV, Kovitvongsa K, et al. (2008) 628
Phylogeography and limited genetic connectivity in the endangered boring giant clam across the 629
Coral Triangle. Conservation Biology 22: 1255-1266. (http://dx.doi.org/10.1111/j.1523-630
1739.2008.00983.x) 631
632
Evanno G, Regnaut S, Goudet J (2005) Detecting the number of clusters of individuals using the 633
software Structure: a simulation study. Molecular Ecology 14: 26112620. 634
(http://dx.doi.org/10.1111/j.1365-294X.2005.02553.x) 635
636
Excoffier L, Lischer H (2010) Arlequin suite ver 3.5: A new series of programs to perform 637
population genetics analyses under linux and window. Molecular Ecology Resources 10: 564-638
567. (http://dx.doi.org/10.1111/j.1755-0998.2010.02847.x) 639
PeerJ PrePrints | https://peerj.com/preprints/25v1/ | v1 received: 31 May 2013, published: 31 May 2013, doi: 10.7287/peerj.preprints.25v1
PrePrin
ts

640
Excoffier L, Smouse PE, Quattro JM (1992) Analysis of molecular variance inferred from metric 641
distances among DNA haplotypes: application to human mitochondrial DNA restriction data. 642
Genetics 131: 479-491. 643
644
Falush D, Stephens M, Pritchard JK (2003) Inference of population structure using multilocus 645
genotype data: linked loci and correlated allele frequencies. Genetics 164: 1567-1587. 646
(http://www.genetics.org/cgi/content/full/164/4/1567) 647
648
Flot J-F, Couloux A, Tillier S (2010) Haplowebs as a graphical tool for delimiting species: a 649
revival of Doyle's "field for recombination" approach and its application to the coral genus 650
Pocillopora in Clipperton. BMC Evolutionary Biology 10:372 (http://dx.doi.org/10.1186/1471-651
2148-10-372) 652
653
Garza JC, Williamson EG (2001) Detection of reduction in population size using data from 654
microsatellite loci. Molecular Ecology 10: 305-318. (http://dx.doi.org/ 10.1046/j.1365-655
294X.2001.01190.x) 656
657
Graham E, Baird A, Connolly S (2010) Survival dynamics of scleractinian coral larvae and 658
implications for dispersal. Coral Reefs 27: 529-539. (http://dx.doi.org/10.1007/s00338-008-659
0361-z) 660
661
PeerJ PrePrints | https://peerj.com/preprints/25v1/ | v1 received: 31 May 2013, published: 31 May 2013, doi: 10.7287/peerj.preprints.25v1
PrePrin
ts

Green A, Mous J (2004) Delineating the Coral Triangle, its ecoregions and functional seascapes. 662
Report on workshop held at the Southeast Asia Center for Marine Protected Areas, Bali, 663
Indonesia (April 30-May 2, 2003) Version 11 (June 2004) Report from the Nature Conservancy 664
Southeast Asia Center for Marine Protected Areas, Bali, Indonesia. 665
666
Hedgecock D, Launey S, Pudovkin A, Naciri Y, Lapegue S, et al. (2007) Small effective number 667
of parents (nb) inferred for a naturally spawned cohort of juvenile European flat oysters Ostrea 668
edulis. Marine Biology 150: 1173-1182. (http://dx.doi.org/10.1007/s00227-006-0441-y) 669
670
Hillis DM, Moritz C, Mable BK. 1996. Molecular Systematics, Second Edition. Sinuaer 671
Associates Inc. 655 pages. (ISBN: 0878932828) 672
673
Hoegh-Guldberg O, Mumby P, Hooten AJ, Steneck RS, Greenfield P, Gomez E, Harvell CD, 674
Sale PF, Edwards AJ, Caldeira K, Knowlton N, Eakin CM, Iglesias-Prieto R, Muthiga N, 675
Bradbury RH, Dubi A, Hatziolos ME (2007) Coral reefs under rapid climate change and ocean 676
acidification. Science 318: 1737-1742. (http://dx.doi.org/10.1126/science.1152509) 677
678
Horigue V, Aliño P, White AT, Pressey RL (2012) Marine protected area networks in the 679
Philippines: Trends and challenges for establishment and governance. Ocean and Coastal 680
Management 64: 15-26 (http://dx.doi.org/10.1016/j.ocecoaman.2012.04.012) 681
682
Hubisz MJ, Falush D, Stephens M, Pritchard JK (2009) Inferring weak population structure with 683
the assistance of sample group information. Molecular Ecology Resources 9: 1322-1332. 684
PeerJ PrePrints | https://peerj.com/preprints/25v1/ | v1 received: 31 May 2013, published: 31 May 2013, doi: 10.7287/peerj.preprints.25v1
PrePrin
ts

(http://dx.doi.org/10.1111/j.1755-0998.2009.02591.x) 685
686
Huffard CL, Erdmann MV, Gunawan T (eds.) (2012a) Geographic priorities for marine 687
biodiversity conservation in Indonesia. Ministry of Marine Affairs and Fisheries and Marine 688
Protected Areas Governance Program. Jakarta. (ISBN 978-602-98450-6-8) 689
690
Huffard CL, Wilson J, Hitipeuw C, Rotinsulu C, Mangubhai S, Erdmann MV, Adnyana W, 691
Barber PH, Manuputty J, Mongdong M, Purba G, Rhodes K, Toha AH (2012b) Ecosystem based 692
management in the Bird's Head Seascape Indonesia: turning science into action. BHS 693
Ecosystem Based Management Program: Conservation International, The Nature Conservancy, 694
and WWF-Indonesia. Denpasar. 695
696
Hughes TP, Graham NA, Jackson JB, Mumby PJ, Steneck RS (2010) Rising to the challenge of 697
sustaining coral reef resilience. Trends in Ecology and Evolution 25: 633-642. 698
(http://dx.doi.org/10.1016/j.tree.2010.07.011) 699
700
Isomura N, Nishihira M (2001) Size variation of planulae and its effect on the lifetime of 701
planulae in three pocilloporid corals. Coral Reefs 20: 309-315. 702
(http://dx.doi.org/10.1007/s003380100180) 703
704
Jokiel P (1984) Long distance dispersal of reef corals by rafting. Coral Reefs 3: 113-116. 705
(http://dx.doi.org/10.1007/BF00263761) 706
707
PeerJ PrePrints | https://peerj.com/preprints/25v1/ | v1 received: 31 May 2013, published: 31 May 2013, doi: 10.7287/peerj.preprints.25v1
PrePrin
ts
Laikre L (2010) Genetic diversity is overlooked in international conservation policy 708
implementation. Conservation Genetics 11: 349-354 (http://dx.doi.org/10.1007/s10592-009-709
0037-4) 710
711
Leviton DA, McGovern TM (2005) “The Allee Effect in the Sea” in Marine Conservation 712
Biology: the Science of Maintaining the Sea's Biodiversity, Eds: Norse EA and Crowder LB. 713
Island Press (ISBN: 9781559636629) 714
715
Mangubhai S, Erdmann MV, Wilson JR, Huffard CL, Ballamu F, Hidayat NI, Hitipeuw C, 716
Lazuardi ME, Muhajir, Pada D, Purba G, Rotinsulu C, Rumetna L, Sumolang K, Wen W (2012) 717
Papuan Bird’s Head Seascape: Emerging threats and challenges in the global center of marine 718
biodiversity. Marine Pollution Bulletin (http://dx.doi.org/10.1016/j.marpolbul.2012.07.024) 719
720
McKenna S, Allen G, Suryadi S (2002). A marine rapid assessment of the Raja Ampat islands, 721
Papua province, Indonesia. Conservation International (ISBN: 1881173607) 722
723
Mills M, Pressey RL, Weeks R, Foale S, Ban NC (2010) A mismatch of scales: challenges in 724
planning for implementation of marine protected areas in the Coral Triangle. Conservation 725
Letters 3 (5): 29303 (http://dx.doi.org/10.1111/j.1755-263X.2010.00134.x) 726
727
Mora C, Andrfout S, Costello MJ, Kranenburg C, Rollo A, Veron JEN, Gaston KJ, Myers RA 728
(2006) Coral reefs and the global network of marine protected areas. Science 312: 1750 - 1751. 729
(http://dx.doi.org/10.1126/science.1125295) 730
PeerJ PrePrints | https://peerj.com/preprints/25v1/ | v1 received: 31 May 2013, published: 31 May 2013, doi: 10.7287/peerj.preprints.25v1
PrePrin
ts

731
Morey S, Shriver J, O’Brien J (1999) The effects of Halmahera on the Indonesian throughflow. 732
Journal of Geophysical Research 104: 23281-23296. (http://dx.doi.org/10.1029/1999JC900195) 733
734
Nir O, Gruber DF, Einbinder S, Kark S, Tchernov D (2011) Changes in scleractinian coral 735
Seriatopora hystrix morphology and its endocellular Symbiodinium characteristics along a 736
bathymetric gradient from shallow to mesophotic reef. Coral Reefs 30:1089–1100 737
(http://dx.doi.org/10.1007/s00338-011-0801-z) 738
739
Nof D (1995) Choked flows from the Pacific to the Indian Ocean. Journal of Physical 740
Oceanography 25: 1369-1383. (http://dx.doi.org/10.1175/1520-741
0485(1995)025<1369:CFFTPT>2.0.CO;2) 742
743
Oliver J, Berkelmans R, Eakin M (2009) Coral Bleaching in Space and Time. In: van Oppen 744
MJH, Lough JM (eds) Coral Bleaching: Patterns, Processes, Causes and Consequences. 745
Springer. (ISBN-10: 3540697748) 746
747
Palumbi S (2003) Population genetics, demographic connectivity and the design of marine 748
reserves. Ecological Applications 13: S146-S158. (http://dx.doi.org/10.1890/1051-749
0761(2003)013[0146:PGDCAT]2.0.CO;2) 750
751
PeerJ PrePrints | https://peerj.com/preprints/25v1/ | v1 received: 31 May 2013, published: 31 May 2013, doi: 10.7287/peerj.preprints.25v1
PrePrin
ts
Pandolfi JM, Connolly SR, Marshall DJ, Cohen AL (2011) Projecting coral reef futures under 752
global warming and ocean acidification. Science 333 (6041): 418-422. 753
(http://dx.doi.org/10.1126/science.1204794) 754
755
Paz-García DA, Chávez-Romo HE, Correa-Sandoval F, Reyes-Bonilla H, López-Pérez A, 756
Medina-Rosas P, Hernández-Cortés MP (2012) Genetic Connectivity Patterns of Corals 757
Pocillopora damicornis and Porites panamensis (Anthozoa: Scleractinia) Along the West Coast 758
of Mexico. Pacific Science 66(1):43-61. 759
760
Pinzón JH, LaJeunesse TC (2011) Species delimitation of common reef corals in the genus 761
Pocillopora using nucleotide sequence phylogenies, population genetics, and symbiosis ecology. 762
Molecular Ecology 20(2): 311-325. (http://dx.doi.org/10.1111/j.1365-294X.2010.04939.x) 763
764
Pinzón JH, Sampayo E, Cox E, Chauka LJ, Chen CA, Voolstra CR, Lajeunesse TC (2013) Blind 765
to morphology: genetics identifies several widespread ecologically common species and few 766
endemics among Indo-Pacific cauliflower corals. Journal of Biogeography EarlyView (online) 767
(http://dx.doi.org/10.1111/jbi.12110) 768
769
Pritchard JK, Stephens M, Donnelly P (2000) Inference of population structure using multilocus 770
genotype data. Genetics 155: 945-959. 771
772
Reaka-Kudla ML. 1997. “The global biodiversity of coral reefs: A comparison with rainforests” 773
In: Reaka-Kudla, M. L., D. E. Wilson, and E. O. Wilson (eds.), Biodiversity II: Understanding 774
PeerJ PrePrints | https://peerj.com/preprints/25v1/ | v1 received: 31 May 2013, published: 31 May 2013, doi: 10.7287/peerj.preprints.25v1
PrePrin
ts
and Protecting Our Natural Resources, pp. 83-108. Joseph Henry/National Academy Press, 775
Washington, D. C. (ISBN: 0-309-05584-9) 776
777
Richmond RH (1985) Reversible metamorphosis in coral planula larvae. Marine Ecology 778
Progress Series 22: 181-185. 779
780
Richmond R (1987) Energetics, competency, and long-distance dispersal of planula larvae of the 781
coral Pocillopora damicornis. Marine Biology 93: 527-533. 782
783
Roberts C (2005) “Marine Protected Areas and Biodiversity Conservation” in Marine 784
Conservation Biology: the Science of Maintaining the Sea's Biodiversity, Eds: Norse EA and 785
Crowder LB. (ISBN: 9781559636629) 786
787
Sale PF, Cowen RK, Danilowicz BS, Jones GP, Kritzer JP, Lindeman KC, Planes S, Polunin 788
NVC, Russ GR, Sadovy YJ Steneck RS. (2005) Critical science gaps impede use of no-take 789
fishery reserves. Trends in Ecology and Evolution 20: 74-80. 790
(http://dx.doi.org/10.1016/j.tree.2004.11.007) 791
792
Sammarco P (1982) Polyp bail-out - an escape response to environmental stress and a new 793
means of reproduction in corals. Marine Ecology Progress Series 10: 57-65. 794
795
PeerJ PrePrints | https://peerj.com/preprints/25v1/ | v1 received: 31 May 2013, published: 31 May 2013, doi: 10.7287/peerj.preprints.25v1
PrePrin
ts

Schmidt-Roach S, Lundgren P, Miller KJ, Gerlach G, Noreen AME, Andreakis N (2012) 796
Assessing hidden species diversity in the coral Pocillopora damicornis from Eastern Australia. 797
Coral Reefs (http://dx.doi.org/10.1007/s00338-012-0959-z) 798
799
Shanks A (2003) Propagule dispersal distance and the size and spacing of marine reserves. 800
Ecological Applications 13: 159-169. (http://dx.doi.org/10.1890/1051-801
0761(2003)013[0159:PDDATS]2.0.CO;2) 802
803
Slatkin M (1995) A measure of population subdivision based on microsatellite allele frequencies. 804
Genetics 139: 457-462. 805
806
Souter P (2010) Hidden genetic diversity in a key model species of coral. Marine Biology 157: 807
875-885. (http://dx.doi.org/10.1007/s00227-009-1370-3) 808
809
Starger CJ, Yeoh SSR, Dai C-F, Baker AC, Desalle R (2008) Ten polymorphic STR loci in the 810
cosmopolitan reef coral, Pocillopora damicornis. Molecular Ecology Resources 8: 619–621. 811
(http://dx.doi.org/10.1111/j.1471-8286.2007.02017.x) 812
813
Starger CJ, Barber PH, Ambariyanto, Baker AC (2010) The recovery of coral genetic diversity in 814
the Sunda Strait following the 1883 eruption of Krakatau. Coral Reefs 29: 547-565. 815
(http://dx.doi.org/10.1007/s00338-010-0609-2) 816
817
PeerJ PrePrints | https://peerj.com/preprints/25v1/ | v1 received: 31 May 2013, published: 31 May 2013, doi: 10.7287/peerj.preprints.25v1
PrePrin
ts

Stat M, Baker A, Bourne DG, Correa AMS, Forsman, Z, Huggett M, Pochon X, Skillings D, 818
Toonen R, van Oppen M, Gates RD (2012) Molecular delineation of species in the coral 819
holobiont. Advances in Marine Biology 63: 1-65. (http://dx.doi.org/10.1016/B978-0-12-394282-820
1.00001-6) 821
822
Treml EA, Halpin PN (2012) Marine population connectivity identifies ecological neighbors for 823
conservation planning in the Coral Triangle. Conservation Letters 824
(http://dx.doi.org/10.1111/j.1755-263X.2012.00260.x) 825
826
van Oppen M, Lutz A, De’ath G, Peplow L, Kininmonth S (2008) Genetic traces of recent long-827
distance dispersal in a predominantly self-recruiting coral. PLoS ONE 3: e3401. 828
(http://dx.doi.org/10.1371/journal.pone.0003401) 829
830
Varkeya DA, Ainswortha CH, Pitchera TJ, Goramb Y, Sumailaa R (2010) Illegal, unreported 831
and unregulated fisheries catch in Raja Ampat regency, eastern Indonesia. Marine Policy 34: 832
228-236. (http://dx.doi.org/10.1016/j.marpol.2009.06.009) 833
834
Veron JEN (2000) Corals of the World. Townsville: Australian Institute of Marine Science. 1382 835
pages. 836
837
Veron J, DeVantier LM, Turak E, Green AL, Kininmonth S, Stafford-Smith M, Peterson N. 838
(2009) Delineating the Coral Triangle. Galaxea 11: 91-100. 839
840
PeerJ PrePrints | https://peerj.com/preprints/25v1/ | v1 received: 31 May 2013, published: 31 May 2013, doi: 10.7287/peerj.preprints.25v1
PrePrin
ts

Wallace CC, Turak E, DeVantier L (2011) Novel characters in a conservative coral genus: three 841
new species of Astreopora (Scleractinia: Acroporidae) from West Papua. Journal of Natural 842
History 45: 1905–1924. 843
844
Weir B, Cockerham C (1984) Estimating F-statistics for the analysis of population structure. 845
Evolution 38: 1358-1370. (http://www.jstor.org/stable/2408641) 846
847
Wilkinson C (2008). Status of Coral Reefs of the World: 2008. Global Coral Reef Monitoring 848
Network. 849
850
Womble W (1951) Differential systematics. Science 28: 315-322. 851
852
PeerJ PrePrints | https://peerj.com/preprints/25v1/ | v1 received: 31 May 2013, published: 31 May 2013, doi: 10.7287/peerj.preprints.25v1
PrePrin
ts

Table 1: Sampling locations in Papua and West Papua, Indonesia 853
854
Number of samples
Region Locality Latitude Longitude P. damicornis S. hystrix
Raja Ampat Alyui Bay 0° 10.47 S 130° 14.85 E 20 19
Mayalibit 0° 17.85 S 130° 48.49 E 9 20
Kri Island 0° 33.38 S 130° 40.68 E 30 9
Jefman 0° 55.64 S 131° 07.41 E 22 22
Gam Passage 0° 25.88 S 130° 33.16 E 4 0
Teluk Cenderwasih Lemon 0° 53.41 S 134° 04.90 E 18 20
Rumberpon 1° 44.23 S 134° 12.15 E 13 19
Adoki Village 1° 08.53 S 135° 59.68 E 10 12
Serui 1° 54.32 S 136° 13.65 E 6 0
Owi 1° 15.26 S 136° 10.99 E 9 9
Ambai 1° 57.64 S 136° 19.23 E 15 22
Fakfak / Kaimana Mommon 3° 56.38 S 132° 48.21 E 4 18
Mauwara 3° 49.65 S 134° 03.51 E 23 0
Namatote 3° 46.73 S 133° 52.93 E 0 21
Total 169 191
855
PeerJ PrePrints | https://peerj.com/preprints/25v1/ | v1 received: 31 May 2013, published: 31 May 2013, doi: 10.7287/peerj.preprints.25v1
PrePrin
ts

Table 2: Population statistics for Pocillopora damicornis: Give are the number of samples (N), 856
number of unique genotypes (Ng), M value (M), its variance (M var), and BAPS cluster. 857
858
Locality (region) N Ng M M var Cluster
Alyui Bay (R4) 20 16 0.61 0.07 1
Mayalibit (R4) 9 9 0.63 0.07 2
Kri Island (R4) 30 30 0.61 0.06 2
Jefman (R4) 22 22 0.72 0.06 3
Lemon (TC) 18 18 0.64 0.08 4
Rumberpon (TC) 13 13 0.62 0.04 3
Adoki Village (TC) 10 7 0.61 0.07 2
Owi (TC) 9 9 0.67 0.08 3
Ambai (TC) 15 15 0.62 0.05 3
Mauwara (F/K) 23 21 0.59 0.05 5
859
PeerJ PrePrints | https://peerj.com/preprints/25v1/ | v1 received: 31 May 2013, published: 31 May 2013, doi: 10.7287/peerj.preprints.25v1
PrePrin
ts

Table 3: Population statistics for Seriatopora hystrix: Give are the number of samples (N), 860
number of unique genotypes (Ng), M value (M), its variance (M var), and BAPS cluster. 861
862
Locality (region) N Ng M M var Cluster
Alyui Bay (R4) 19 17 0.61 0.06 1
Mayalibit (R4) 20 20 0.49 0.09 2
Kri (R4) 9 9 0.62 0.03 1
Jefman (R4) 22 17 0.66 0.07 3
Lemon (TC) 20 20 0.67 0.09 4
Rumberpon (TC) 19 19 0.79 0.09 5
Adoki Village (TC) 12 12 0.7 0.11 6
Owi (TC) 9 9 0.79 0.09 7
Ambai (TC) 22 22 0.72 0.08 8
Mommon (F/K) 18 18 0.7 0.1 9
Namatote (F/K) 21 21 0.81 0.08 10
863
PeerJ PrePrints | https://peerj.com/preprints/25v1/ | v1 received: 31 May 2013, published: 31 May 2013, doi: 10.7287/peerj.preprints.25v1
PrePrin
ts

Table 4: Results from AMOVA for Pocillopora damicornis. Four genetic structures are tested. 864
“All samples” indicates that there was no hierarchical structure imposed. '3 regions' tests the 865
significance of a priori geographic structure among Teluk Cenderawasih, Raja Ampat, and 866
Fakfak/Kaimana. Finally, the structures inferred by BAPS and Genetical Bandwidth Mapping 867
(GBM) are tested. Estimators are calculated based on both the infinite alleles model (F statistics) 868
and stepwise mutation model (R statistics) of microsatellite evolution. Negative values are 869
presented, but are effectively equal to zero. 870
871
F statistic p % var R statistic p % var
All samples
Among localities FST 0.139 <0.00001 13.940 RST 0.130 <0.00001 13.000
Within localities 86.060 87.000
3 regions
Among groups FCT -0.028 0.874 -2.830 RCT 0.017 0.382 1.660
Among localities within regions FSC 0.156 <0.00001 15.990 RSC 0.120 <0.00001 11.810
Within localities FST 0.132 <0.00001 86.840 RST 0.135 <0.00001 86.540
Structure inferred by BAPS
Among clusters FCT 0.140 0.003 14.000 RCT 0.060 0.240 6.020
Among localities within clusters FSC 0.030 0.007 2.610 RSC 0.079 0.013 7.460
Within localities FST 0.166 <0.00001 83.400 RST 0.135 <0.00001 86.520
Structure inferred by GBM
Among clusters FCT -0.011 0.555 -1.070 RCT 0.063 0.178 5.930
Among localities within clusters FSC 0.148 <0.00001 14.940 RSC 0.076 0.007 7.160
Within localities FST 0.139 <0.00001 86.130 RST 0.136 <0.00001 86.530
872
PeerJ PrePrints | https://peerj.com/preprints/25v1/ | v1 received: 31 May 2013, published: 31 May 2013, doi: 10.7287/peerj.preprints.25v1
PrePrin
ts
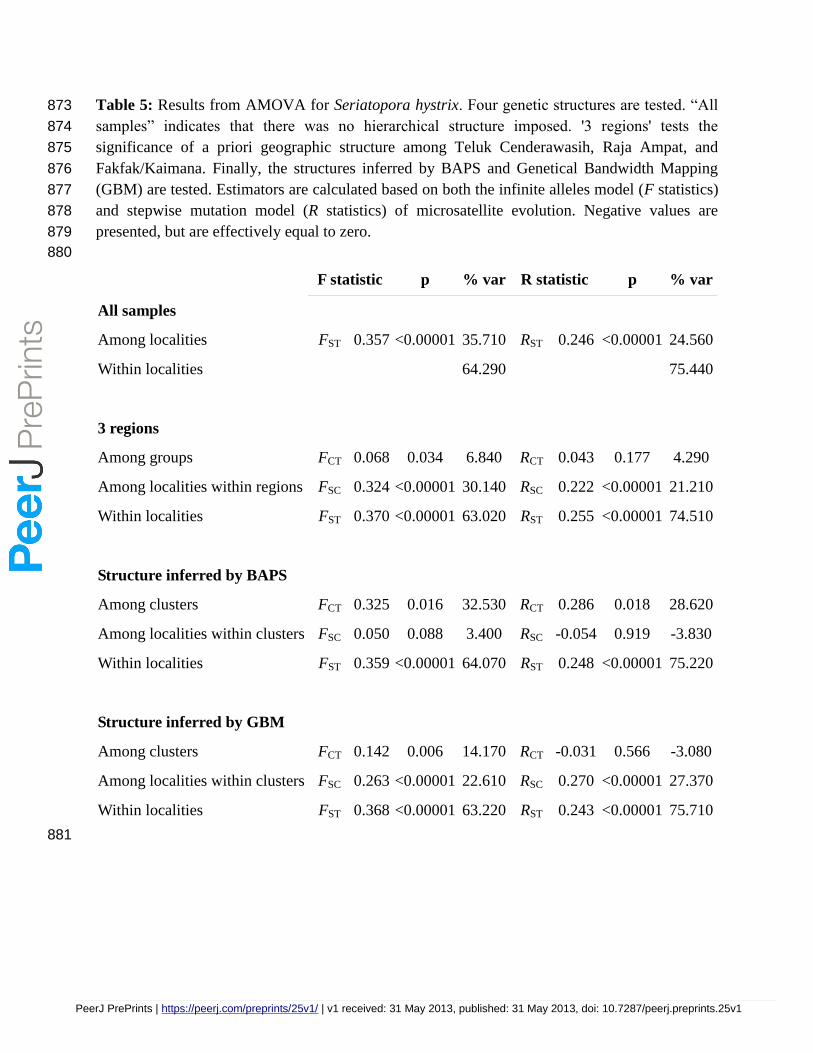
Table 5: Results from AMOVA for Seriatopora hystrix. Four genetic structures are tested. “All 873
samples” indicates that there was no hierarchical structure imposed. '3 regions' tests the 874
significance of a priori geographic structure among Teluk Cenderawasih, Raja Ampat, and 875
Fakfak/Kaimana. Finally, the structures inferred by BAPS and Genetical Bandwidth Mapping 876
(GBM) are tested. Estimators are calculated based on both the infinite alleles model (F statistics) 877
and stepwise mutation model (R statistics) of microsatellite evolution. Negative values are 878
presented, but are effectively equal to zero. 879
880
F statistic p % var R statistic p % var
All samples
Among localities FST 0.357 <0.00001 35.710 RST 0.246 <0.00001 24.560
Within localities 64.290 75.440
3 regions
Among groups FCT 0.068 0.034 6.840 RCT 0.043 0.177 4.290
Among localities within regions FSC 0.324 <0.00001 30.140 RSC 0.222 <0.00001 21.210
Within localities FST 0.370 <0.00001 63.020 RST 0.255 <0.00001 74.510
Structure inferred by BAPS
Among clusters FCT 0.325 0.016 32.530 RCT 0.286 0.018 28.620
Among localities within clusters FSC 0.050 0.088 3.400 RSC -0.054 0.919 -3.830
Within localities FST 0.359 <0.00001 64.070 RST 0.248 <0.00001 75.220
Structure inferred by GBM
Among clusters FCT 0.142 0.006 14.170 RCT -0.031 0.566 -3.080
Among localities within clusters FSC 0.263 <0.00001 22.610 RSC 0.270 <0.00001 27.370
Within localities FST 0.368 <0.00001 63.220 RST 0.243 <0.00001 75.710
881
PeerJ PrePrints | https://peerj.com/preprints/25v1/ | v1 received: 31 May 2013, published: 31 May 2013, doi: 10.7287/peerj.preprints.25v1
PrePrin
ts

Figure 1: The Bird’s Head region of West Papua, Indonesia. Sampling localities are shown as 882
white circles. The solid black line delineates the border of Teluk Cenderawasih National Park. 883
884
885
886
PeerJ PrePrints | https://peerj.com/preprints/25v1/ | v1 received: 31 May 2013, published: 31 May 2013, doi: 10.7287/peerj.preprints.25v1
PrePrin
ts

Figure 2: Results from Bayesian assignment methods implemented in Structure and BAPS for 887
Pocillopora damicornis. X indicates exclusion from BAPS analysis due to Ng = 6 or less. K = 2 888
and K = 6 were used as heuristics as described in the text. 889
890
891
PeerJ PrePrints | https://peerj.com/preprints/25v1/ | v1 received: 31 May 2013, published: 31 May 2013, doi: 10.7287/peerj.preprints.25v1
PrePrin
ts

Figure 3: Results from Bayesian assignment methods implemented in Structure and BAPS for 892
Seriatopora hystrix. K = 2 and K = 11 were used as heuristics as described in the text. 893
894
895
896
897
PeerJ PrePrints | https://peerj.com/preprints/25v1/ | v1 received: 31 May 2013, published: 31 May 2013, doi: 10.7287/peerj.preprints.25v1
PrePrin
ts

Figure 4: Genetical Bandwidth Map for Pocillopora damicornis. Green areas indicate regions of 898
genetic homogeneity. White areas indicate putative barriers to larval dispersal and are 899
highlighted with blue dashed lines. The solid black line indicates the borders of Taman Nasional 900
Teluk Cenderawasih. 901
902
903
904
905
PeerJ PrePrints | https://peerj.com/preprints/25v1/ | v1 received: 31 May 2013, published: 31 May 2013, doi: 10.7287/peerj.preprints.25v1
PrePrin
ts
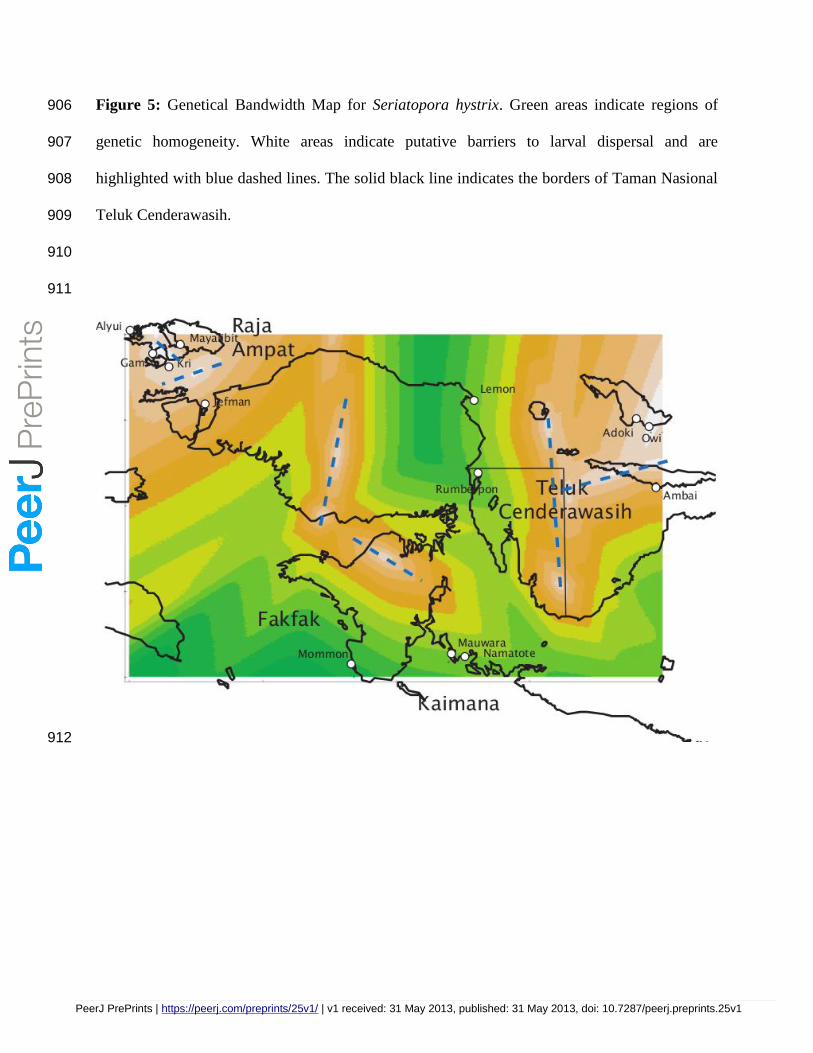
Figure 5: Genetical Bandwidth Map for Seriatopora hystrix. Green areas indicate regions of 906
genetic homogeneity. White areas indicate putative barriers to larval dispersal and are 907
highlighted with blue dashed lines. The solid black line indicates the borders of Taman Nasional 908
Teluk Cenderawasih. 909
910
911
912
PeerJ PrePrints | https://peerj.com/preprints/25v1/ | v1 received: 31 May 2013, published: 31 May 2013, doi: 10.7287/peerj.preprints.25v1
PrePrin
ts