to: mayor and city council from: charles ozaki, city and
TRANSCRIPT
To: Mayor and City Council From: Charles Ozaki, City and County Manager Prepared by: Kevin Standbridge, Deputy City and County Manager
Pat Soderberg, Finance Director Joyce Alberts, Budget Manager Brenda Richey, Deputy Finance Director Valerie Price, Accounting Manager
Meeting Date Agenda Category Agenda Item # April 23, 2019 Manager’s Report 13(d)
Budget Tracking and Revenue Reports - February 2019 Summary
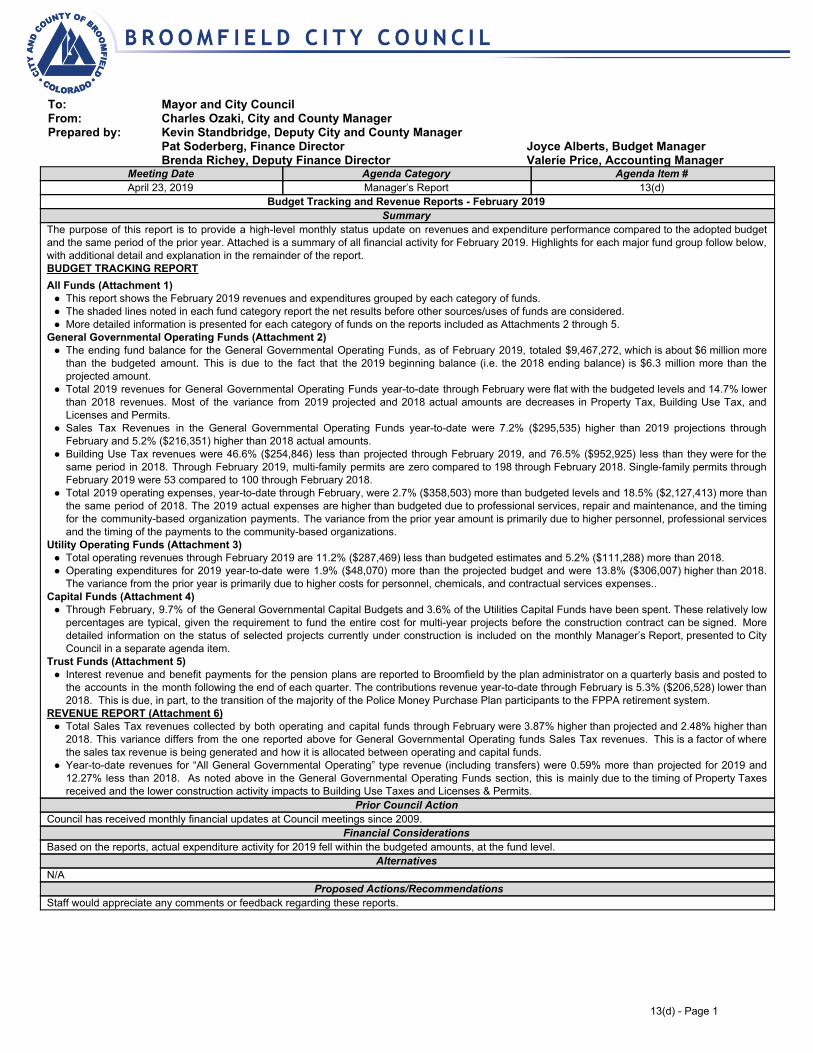
The purpose of this report is to provide a high-level monthly status update on revenues and expenditure performance compared to the adopted budget and the same period of the prior year. Attached is a summary of all financial activity for February 2019. Highlights for each major fund group follow below, with additional detail and explanation in the remainder of the report. BUDGET TRACKING REPORT All Funds (Attachment 1)
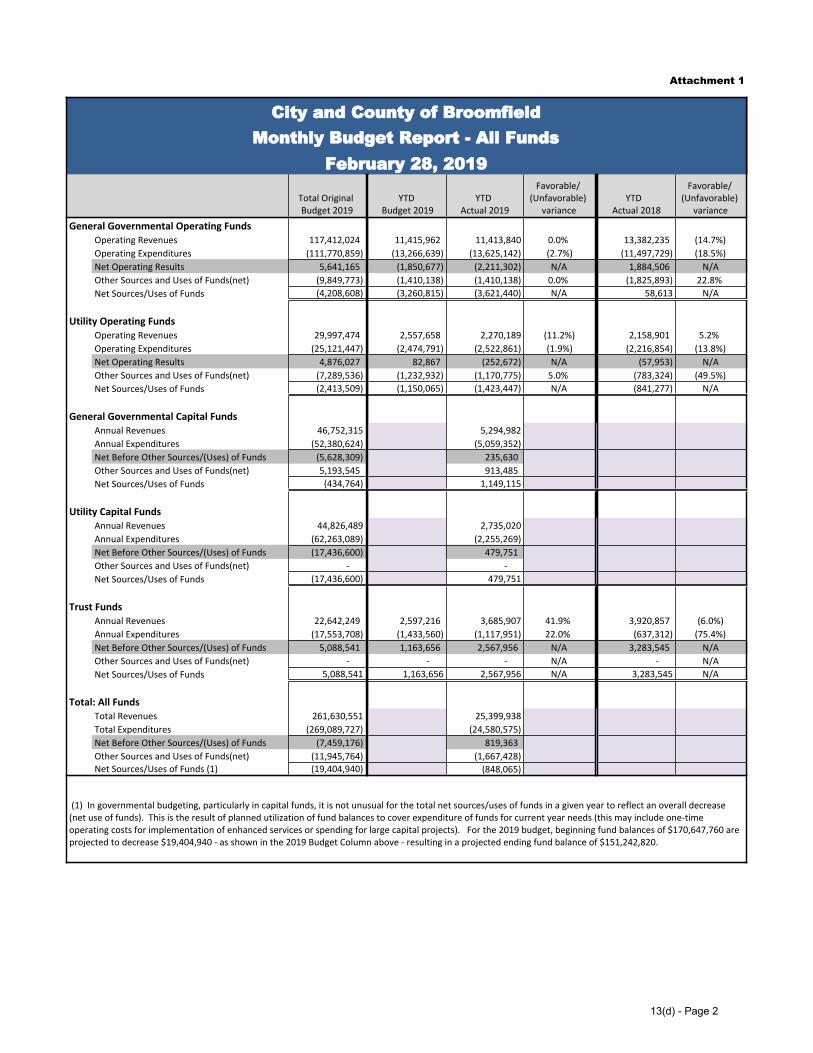
● This report shows the February 2019 revenues and expenditures grouped by each category of funds. ● The shaded lines noted in each fund category report the net results before other sources/uses of funds are considered. ● More detailed information is presented for each category of funds on the reports included as Attachments 2 through 5.
General Governmental Operating Funds (Attachment 2) ● The ending fund balance for the General Governmental Operating Funds, as of February 2019, totaled $9,467,272, which is about $6 million more
than the budgeted amount. This is due to the fact that the 2019 beginning balance (i.e. the 2018 ending balance) is $6.3 million more than the projected amount.
● Total 2019 revenues for General Governmental Operating Funds year-to-date through February were flat with the budgeted levels and 14.7% lower than 2018 revenues. Most of the variance from 2019 projected and 2018 actual amounts are decreases in Property Tax, Building Use Tax, and Licenses and Permits.
● Sales Tax Revenues in the General Governmental Operating Funds year-to-date were 7.2% ($295,535) higher than 2019 projections through February and 5.2% ($216,351) higher than 2018 actual amounts.
● Building Use Tax revenues were 46.6% ($254,846) less than projected through February 2019, and 76.5% ($952,925) less than they were for the same period in 2018. Through February 2019, multi-family permits are zero compared to 198 through February 2018. Single-family permits through February 2019 were 53 compared to 100 through February 2018.
● Total 2019 operating expenses, year-to-date through February, were 2.7% ($358,503) more than budgeted levels and 18.5% ($2,127,413) more than the same period of 2018. The 2019 actual expenses are higher than budgeted due to professional services, repair and maintenance, and the timing for the community-based organization payments. The variance from the prior year amount is primarily due to higher personnel, professional services and the timing of the payments to the community-based organizations.
Utility Operating Funds (Attachment 3) ● Total operating revenues through February 2019 are 11.2% ($287,469) less than budgeted estimates and 5.2% ($111,288) more than 2018. ● Operating expenditures for 2019 year-to-date were 1.9% ($48,070) more than the projected budget and were 13.8% ($306,007) higher than 2018.
The variance from the prior year is primarily due to higher costs for personnel, chemicals, and contractual services expenses.. Capital Funds (Attachment 4)
● Through February, 9.7% of the General Governmental Capital Budgets and 3.6% of the Utilities Capital Funds have been spent. These relatively low percentages are typical, given the requirement to fund the entire cost for multi-year projects before the construction contract can be signed. More detailed information on the status of selected projects currently under construction is included on the monthly Manager’s Report, presented to City Council in a separate agenda item.
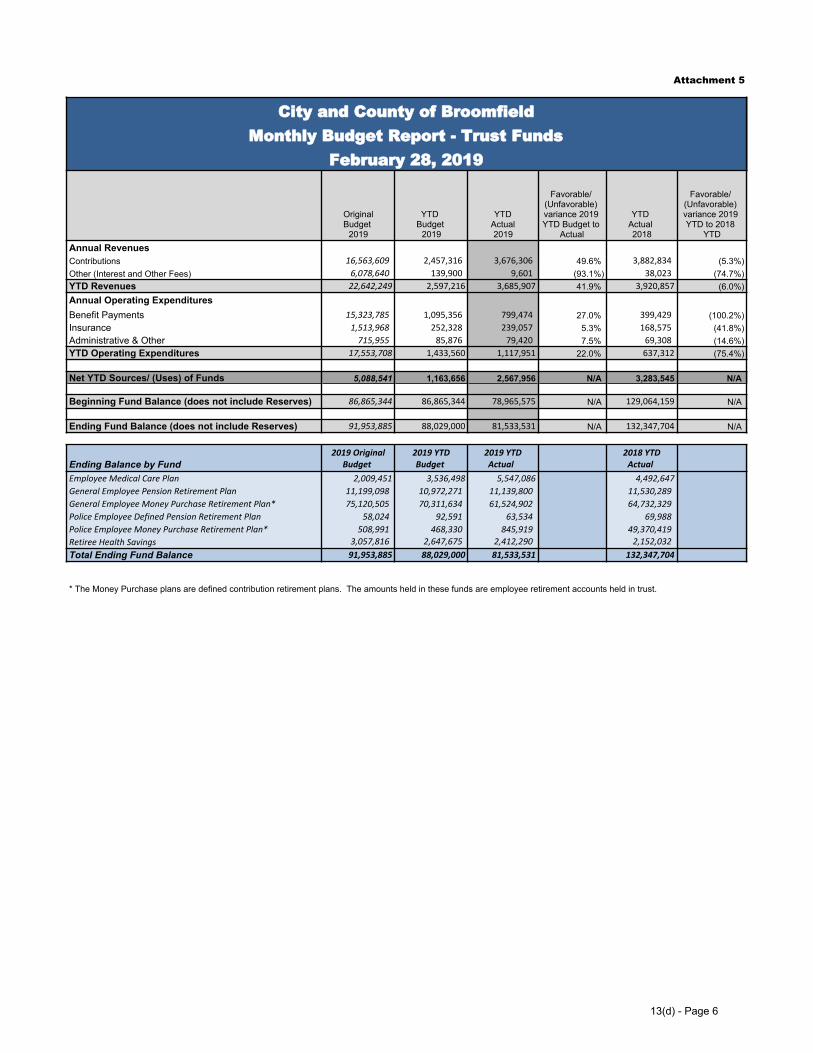
Trust Funds (Attachment 5) ● Interest revenue and benefit payments for the pension plans are reported to Broomfield by the plan administrator on a quarterly basis and posted to
the accounts in the month following the end of each quarter. The contributions revenue year-to-date through February is 5.3% ($206,528) lower than 2018. This is due, in part, to the transition of the majority of the Police Money Purchase Plan participants to the FPPA retirement system.
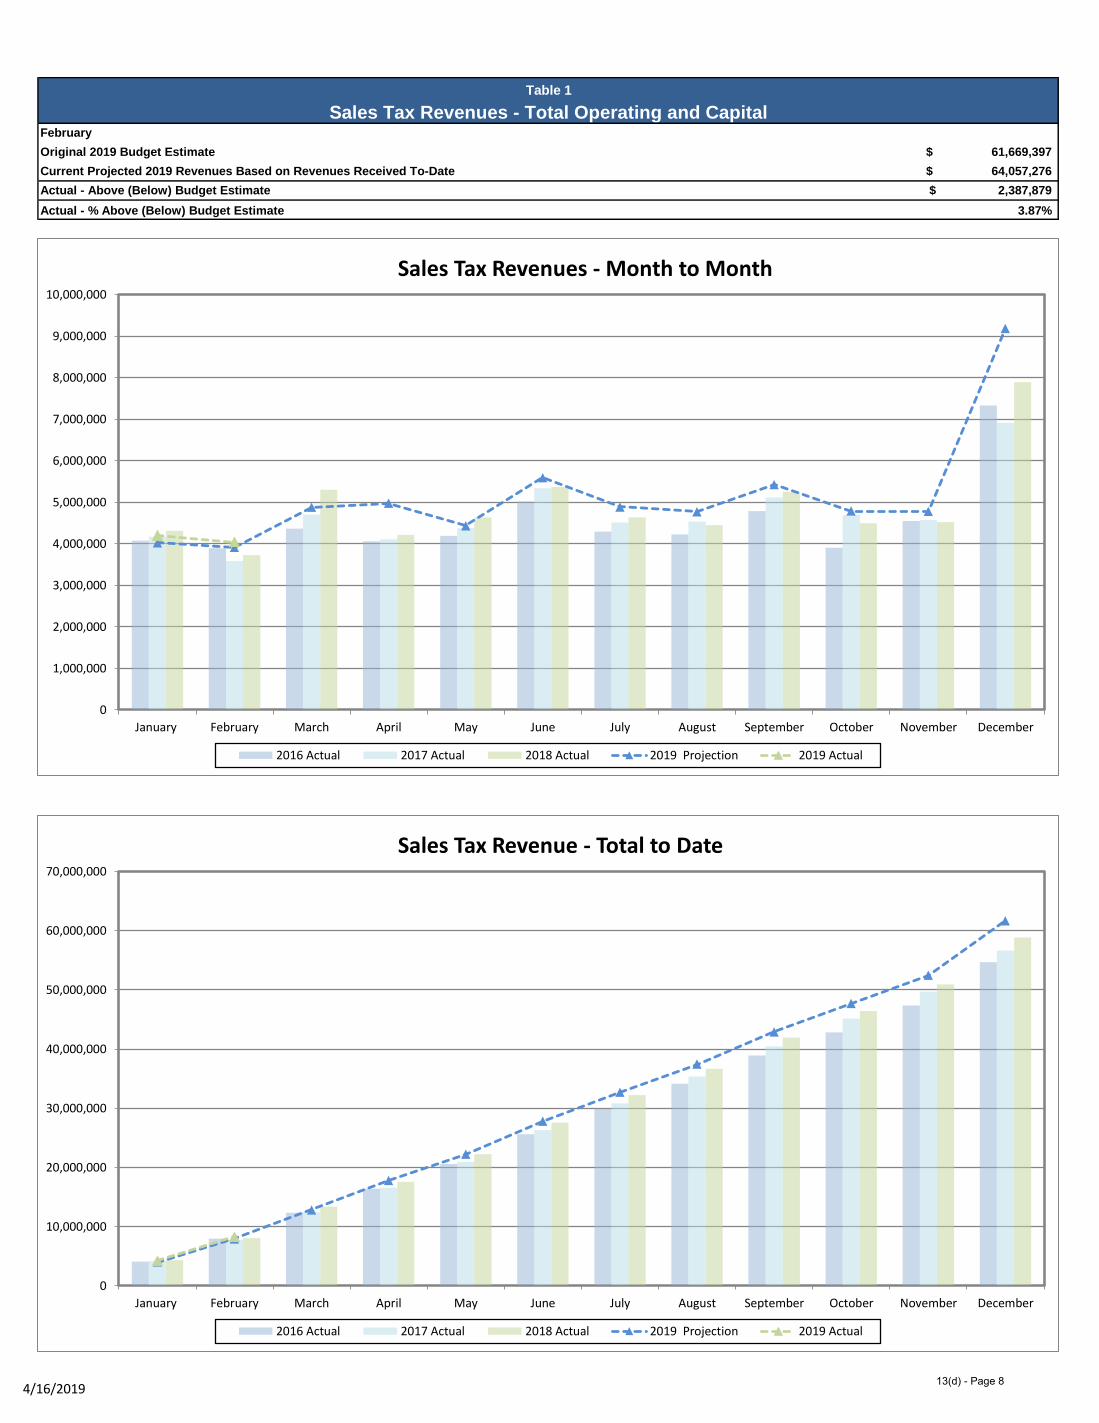
REVENUE REPORT (Attachment 6) ● Total Sales Tax revenues collected by both operating and capital funds through February were 3.87% higher than projected and 2.48% higher than
2018. This variance differs from the one reported above for General Governmental Operating funds Sales Tax revenues. This is a factor of where the sales tax revenue is being generated and how it is allocated between operating and capital funds.
● Year-to-date revenues for “All General Governmental Operating” type revenue (including transfers) were 0.59% more than projected for 2019 and 12.27% less than 2018. As noted above in the General Governmental Operating Funds section, this is mainly due to the timing of Property Taxes received and the lower construction activity impacts to Building Use Taxes and Licenses & Permits.
Prior Council Action Council has received monthly financial updates at Council meetings since 2009.
Financial Considerations Based on the reports, actual expenditure activity for 2019 fell within the budgeted amounts, at the fund level.
Alternatives N/A
Proposed Actions/Recommendations Staff would appreciate any comments or feedback regarding these reports.
13(d) - Page 1
Attachment 1
City and County of BroomfieldMonthly Budget Report - All Funds
February 28, 2019
Total Original Budget 2019
YTD Budget 2019
YTD Actual 2019
Favorable/ (Unfavorable)
varianceYTD
Actual 2018
Favorable/ (Unfavorable)
variance
General Governmental Operating FundsOperating Revenues ( 117,412,024) ( 11,415,962) 11,413,840 0.0%) ( 13,382,235) (14.7%)Operating Expenditures ( (111,770,859) ( (13,266,639) ( (13,625,142) (2.7%) ( (11,497,729) (18.5%)Net Operating Results ( 5,641,165) ( (1,850,677) ( (2,211,302) N/A ( 1,884,506) N/AOther Sources and Uses of Funds(net) ( (9,849,773) ( (1,410,138) ( (1,410,138) 0.0%) ( (1,825,893) 22.8%)Net Sources/Uses of Funds (4,208,608) (3,260,815) (3,621,440) N/A 58,613 N/A
Utility Operating FundsOperating Revenues ( 29,997,474) ( 2,557,658) 2,270,189 (11.2%) ( 2,158,901) 5.2%)Operating Expenditures ( (25,121,447) ( (2,474,791) ( (2,522,861) (1.9%) ( (2,216,854) (13.8%)Net Operating Results ( 4,876,027) ( 82,867) ( (252,672) N/A ( (57,953) N/AOther Sources and Uses of Funds(net) ( (7,289,536) ( (1,232,932) ( (1,170,775) 5.0%) ( (783,324) (49.5%)Net Sources/Uses of Funds (2,413,509) (1,150,065) (1,423,447) N/A (841,277) N/A
General Governmental Capital FundsAnnual Revenues 46,752,315 5,294,982Annual Expenditures ( (52,380,624) ( (5,059,352) Net Before Other Sources/(Uses) of Funds ( (5,628,309) ( 235,630) Other Sources and Uses of Funds(net) ( 5,193,545) ( 913,485) Net Sources/Uses of Funds (434,764) 1,149,115
Utility Capital FundsAnnual Revenues 44,826,489 2,735,020Annual Expenditures ( (62,263,089) ( (2,255,269) Net Before Other Sources/(Uses) of Funds ( (17,436,600) ( 479,751) Other Sources and Uses of Funds(net) ( - ) ( - ) Net Sources/Uses of Funds (17,436,600) 479,751
Trust FundsAnnual Revenues ( 22,642,249) ( 2,597,216) 3,685,907 41.9%) ( 3,920,857) (6.0%)Annual Expenditures ( (17,553,708) ( (1,433,560) ( (1,117,951) 22.0%) ( (637,312) (75.4%)Net Before Other Sources/(Uses) of Funds ( 5,088,541) ( 1,163,656) ( 2,567,956) N/A ( 3,283,545) N/AOther Sources and Uses of Funds(net) ( - ) ( - ) ( - ) N/A ( - ) N/ANet Sources/Uses of Funds 5,088,541 1,163,656 2,567,956 N/A 3,283,545 N/A
Total: All FundsTotal Revenues 261,630,551 25,399,938Total Expenditures ( (269,089,727) ( (24,580,575) Net Before Other Sources/(Uses) of Funds ( (7,459,176) ( 819,363) Other Sources and Uses of Funds(net) ( (11,945,764) ( (1,667,428) Net Sources/Uses of Funds (1) (19,404,940) (848,065)
(1) In governmental budgeting, particularly in capital funds, it is not unusual for the total net sources/uses of funds in a given year to reflect an overall decrease (net use of funds). This is the result of planned utilization of fund balances to cover expenditure of funds for current year needs (this may include one-time operating costs for implementation of enhanced services or spending for large capital projects). For the 2019 budget, beginning fund balances of $170,647,760 are projected to decrease $19,404,940 - as shown in the 2019 Budget Column above - resulting in a projected ending fund balance of $151,242,820.
13(d) - Page 2

Attachment 2
City and County of BroomfieldMonthly Budget Report of General Governmental Operating Funds
(Excludes Capital, Utility Enterprise and Trust Funds)February 28, 2019
OriginalBudget2019
YTDBudget
2019
YTDActual2019
Favorable/ (Unfavorable) variance 2019 YTD Budget
to Actual
YTD Actual 2018
Favorable/ (Unfavorable)
variance 2019 YTD to
2018 YTDAnnual Revenues Taxes Sales Tax (including Sales Tax Audit Revenue) ( 31,422,321) ( 4,112,008) ( 4,407,543) 7.2%) ( 4,191,192) 5.2%) Property Tax ( 34,452,465) ( 782,125) ( 584,277) (25.3%) ( 1,414,866) (58.7%) Specific Ownership Tax ( 2,348,346) ( 212,200) ( 211,524) (0.3%) ( 399,230) (47.0%) Use Tax - Building Materials ( 3,243,039) ( 547,357) ( 292,511) (46.6%) ( 1,245,436) (76.5%) Use Tax - Vehicle ( 3,820,900) ( 580,121) ( 701,651) 20.9%) ( 590,644) 18.8%) Gas and Electric Tax ( 2,483,000) ( 15,198) ( - ) (100.0%) ( 17,318) (100.0%) Other Taxes ( 1,920,500) ( 46,787) ( 22,786) (51.3%) ( 51,006) (55.3%) License and Permits ( 4,096,775) ( 763,323) ( 578,125) (24.3%) ( 923,178) (37.4%) Intergovernmental Health and Human Services ( 9,820,499) ( 775,679) ( 1,117,543) 44.1%) ( 910,028) 22.8%) Highway User Tax/Registration Fees ( 2,345,000) ( 341,409) ( 391,247) 14.6%) ( 362,062) 8.1%) Other Intergovernmental ( 1,713,538) ( 162,409) ( 99,952) (38.5%) ( 144,963) (31.0%) Charges for Services Recreation Services ( 5,360,350) ( 841,947) ( 884,615) 5.1%) ( 998,858) (11.4%) Internal Services ( 7,587,151) ( 1,264,019) ( 1,264,526) 0.0%) ( 1,179,632) 7.2%) Other Charges for Service ( 4,874,390) ( 677,651) ( 623,670) (8.0%) ( 725,782) (14.1%) Investment Earnings ( 673,700) ( 85,471) ( 94,115) 10.1%) ( 53,435) 76.1%) Other Revenue ( 1,250,050) ( 208,258) ( 139,755) (32.9%) ( 174,605) (20.0%)YTD Revenues-General Government Operating Funds 117,412,024 11,415,962 11,413,840 (0.0%) 13,382,235 (14.7%)Annual Expenditures Personnel ( 73,251,519) ( 8,452,098) ( 8,409,953) 0.5%) ( 7,797,403) (7.9%) Supplies ( 5,603,966) ( 642,893) ( 568,529) 11.6%) ( 497,373) (14.3%) Contractual Professional Services ( 6,965,802) ( 695,865) ( 853,961) (22.7%) ( 514,413) (66.0%) District Attorney Services ( 2,628,857) ( 438,143) ( 398,143) 9.1%) ( 363,562) (9.5%) Community Based Organizations ( 1,717,835) ( 176,042) ( 524,138) (197.7%) ( 123,773) (323.5%) Insurance ( 2,370,795) ( 646,360) ( 377,006) 41.7%) ( 430,309) 12.4%) Utilities ( 4,631,415) ( 352,258) ( 365,522) (3.8%) ( 339,463) (7.7%) Repair and Maintenance ( 5,331,962) ( 844,549) ( 1,123,943) (33.1%) ( 620,497) (81.1%) Other - Training; Printing; Postage; Dues; Rental ( 2,918,282) ( 431,010) ( 265,500) 38.4%) ( 282,552) 6.0%) Operating Equipment ( 464,697) ( 149,500) ( 149,361) 0.1%) ( 113,455) (31.6%) Human Services Client Benefits ( 5,885,729) ( 437,921) ( 589,086) (34.5%) ( 414,929) (42.0%)YTD Expenditures-General Government Operating Funds 111,770,859 13,266,639 13,625,142 (2.7%) 11,497,729 (18.5%)
Net Operating Results - Over/(Under) 5,641,165 (1,850,677) (2,211,302) N/A 1,884,506 N/A Other Sources/(Uses) of Funds Capital Funds - Transfers Out ( (3,353,334) ( (558,890) ( (558,890) 0.0%) ( (975,334) 42.7%) Debt/Lease Payments ( (3,628,842) ( -) ( - ) N/A ( -) N/A Contribution to Benefit Plans ( (1,821,247) ( (851,248) ( (851,248) 0.0%) ( (850,559) (0.1%) Transfers to Reserves ( (1,116,350) ( -) ( - ) N/A ( -) N/A Transfers from Reserves ( 70,000) ( -) ( - ) N/A ( -) N/ASubtotal Other Sources/(Uses) of Funds (9,849,773) (1,410,138) (1,410,138) 0.0%) (1,825,893) 22.8%)
Net YTD Sources/ (Uses) of Funds (4,208,608) (3,260,815) (3,621,440) N/A 58,613 N/A
Beginning Fund Balance (does not include Reserves) 6,780,976 6,780,976 13,088,712 N/A 7,516,363 N/A
Ending Fund Balance (does not include Reserves) 2,572,368 3,520,161 9,467,272 N/A 7,574,976 N/A
13(d) - Page 3

Attachment 3
City and County of BroomfieldMonthly Budget Report of Utilities Operating Funds
February 28, 2019
OriginalBudget2019
YTDBudget2019
YTDActual2019
Favorable/ (Unfavorable) variance 2019 YTD Budget
to Actual
YTD Actual 2018
Favorable/ (Unfavorable)
variance 2019 YTD to
2018 YTD
Annual RevenuesCharges for Services ( 27,867,120) ( 2,202,599) ( 2,109,137) (4.2%) ( 2,009,563) 5.0%)Environmental Compliance Fee (ECF) ( 1,616,690) ( 269,448) ( 127,433) (52.7%) ( 124,452) 2.4%)Other (Interest, Contributions, Fees) ( 513,664) ( 85,611) ( 33,619) (60.7%) ( 24,886) 35.1%)YTD Operating Revenues - Utilities Funds 29,997,474 2,557,658 2,270,189 (11.2%) 2,158,901 5.2%)Annual Operating ExpendituresPersonnel ( 6,457,347) ( 745,079) ( 788,966) (5.9%) ( 681,709) (15.7%)Supplies Chemicals ( 945,777) ( 79,139) ( 133,882) (69.2%) (88,484) (51.3%) Equipment (less than $5,000) ( 522,620) ( 13,559) ( 13,999) (3.2%) ( 10,987) (27.4%) Other Supplies ( 594,451) ( 40,761) ( 85,195) (109.0%) ( 64,301) (32.5%)Contractual Contractual Services ( 1,088,223) ( 117,880) ( 145,187) (23.2%) ( 103,593) (40.2%) Denver Water ( 6,630,254) ( 185,414) ( 157,157) 15.2%) ( 115,225) (36.4%) Water Fees - CBT/NCWCD ( 1,662,234) ( 149,446) ( 140,654) 5.9%) ( 239,113) 41.2%) Repair and Maintenance ( 492,969) ( 90,800) ( 52,020) 42.7%) (39,145) (32.9%) Insurance ( 291,023) ( 79,297) ( 47,531) 40.1%) (42,267) (12.5%) Utilities ( 1,729,642) ( 154,096) ( 157,056) (1.9%) (139,420) (12.6%) Services Rendered - General Fund ( 4,346,440) ( 724,407) ( 724,408) (0.0%) (639,514) (13.3%) Other - Training; Printing; Postage; Dues; Rental ( 360,467) ( 94,915) ( 76,806) 19.1%) (53,096) (44.7%)YTD Operating Expenditures - Utilities Funds 25,121,447 2,474,791 2,522,861 (1.9%) 2,216,854 (13.8%)
Net Operating Results - Over/(Under) 4,876,027 82,867 (252,672) N/A (57,953) N/AOther Sources/(Uses) of FundsOperating Equipment (greater than $5,000) ( (74,453) ( - ) ( -) N/A ( - ) N/AOperating Capital Water Operating Capital Repair and Maintenance ( (1,900,325) ( (137,332) ( (130,866) 4.7%) ( (17,044) (667.8%) Sewer Operating Capital Repair and Maintenance ( (2,923,350) ( (665,737) ( (574,836) 13.7%) ( (35,183) (1533.8%) Reuse Water Operating Capital Repair and Maintenance ( (169,000) ( (5,000) ( (4,956) 0.9%) ( (259,485) 98.1%)Transfers from ECF Reserves ( 280,000) ( - ) ( -) N/A ( -) N/ATransfers to ECF Reserves ( (1,616,690) ( (269,448) ( (127,433) 52.7%) ( (124,452) (2.4%)Transfers to Defined Benefit Pension Plan ( (371,379) ( (155,414) ( (332,684) (114.1%) ( (347,160) 4.2%)Debt Service Payment ( (514,339) ( - ) ( -) N/A (0) N/ASubtotal Other Sources/(Uses) of Funds (7,289,536) (1,232,932) (1,170,775) 5.0%) (783,324) (49.5%)
Net YTD Sources /(Uses) of Funds (2,413,509) (1,150,065) (1,423,447) N/A (841,277) N/A
Beginning Fund Balance (does not include Reserves) 19,488,193 19,488,193 30,577,033 N/A 30,187,463 N/A
Ending Fund Balance (does not include Reserves) 17,074,684 18,338,128 29,153,586 N/A 29,346,186 N/A
13(d) - Page 4

Attachment 4
City and County of BroomfieldGeneral Governmental and Utility Capital Funds
February 28, 2019General Governmental Funds Utilities Funds
OriginalBudget 2019
YTD Actual2019
YTD Actual as a % of
Budget
OriginalBudget 2019
YTD Actual2019
YTD Actual as a % of
Budget
Annual RevenuesTaxes ( 43,693,415) ( 4,971,391) 11.4%) ( -) ( -) N/AIntergovernmental ( 650,000) ( 21,693) 3.3%) ( -) ( -) N/ACharges for Services ( -) ( -) N/A ( 43,183,928) ( 2,521,039) 5.8%)Other (Interest, Contributions, Fees) ( 2,408,900) ( 301,898) 12.5%) ( 1,642,561) ( 213,981) 13.0%)Total Annual Revenues 46,752,315 5,294,982 11.3%) 44,826,489 2,735,020 6.1%)Capital Expenditures Capital Improvement Program Projects Building & Facilities ( 1,328,230) ( 211,179) 15.9%) ( -) ( -) N/A Drainage & Stormwater ( 103,500) ( -) 0.0%) ( -) ( -) N/A Community Development ( 8,151,733) ( 1,415) 0.0%) ( -) ( -) N/A Information Technology ( 1,633,400) ( 345,044) 21.1%) ( -) ( -) N/A Landscaping ( 1,046,240) ( 43,007) 4.1%) ( -) ( -) N/A Open Space Acquisition & Improvement ( 853,103) ( 413,137) 48.4%) ( -) ( -) N/A Parks & Recreation ( 3,453,962) ( 3,186,198) 92.2%) ( -) ( -) N/A Planning & Miscellaneous ( 2,685,000) ( 50,000) 1.9%) ( -) ( -) N/A Public Art & Culture ( 77,658) ( 18,012) 23.2%) ( -) ( -) N/A Trail Improvements ( 3,408,906) ( 24,774) 0.7%) ( -) ( -) N/A Transportation ( 10,109,409) ( 617,471) 6.1%) ( -) ( -) N/A Vehicle & Equipment ( 1,868,150) ( 149,115) 8.0%) ( -) ( -) N/A Utility Funds Projects Water Fund Projects ( -) ( -) N/A ( 38,809,050) ( 1,650,428) 4.3%) Sewer Fund Projects ( -) ( -) N/A ( 12,602,277) ( 604,841) 4.8%) Reuse Fund Projects ( -) ( -) N/A ( 1,788,738) ( -) 0.0%)Lease Payments - General Governmental Funds ( 4,054,658) ( -) 0.0%) ( -) ( -) N/ADebt Service on Bonds- General Governmental Funds ( 13,606,675) ( -) 0.0%) ( -) ( -) N/ADebt Service on Bonds - Utilities Funds ( -) ( -) N/A ( 9,063,024) ( -) 0.0%)Total Capital Expenditures 52,380,624 5,059,352 9.7%) 62,263,089 2,255,269 3.6%)
Net Before Other Sources/(Uses) of Funds (5,628,309) 235,630 N/A (17,436,600) 479,751 N/A
Other Sources/(Uses) of Funds Transfers to Reserves ( (4,012,039) ( (620,781) 15.5%) ( -) ( -) N/A Transfers from Reserves ( 5,852,250) ( 975,376) 16.7%) ( -) ( -) N/A Interfund Transfers In ( 3,353,334) ( 558,890) 16.7%) ( -) ( -) N/ASubtotal Other Sources/(Uses) of Funds 5,193,545 913,485 17.6%) ( -) ( -) N/A
Net Annual Activity (434,764) 1,149,115 N/A (17,436,600) 479,751 N/A
Beginning Balance, in excess of Reserves 14,544,400 130,746,320 N/A 42,968,847 102,039,073 N/A
Ending Fund Balance (does not include Reserves) 14,109,636 131,895,435 N/A 25,532,247 102,518,824 N/A
Ending Balance by Fund Budget YTD Actual Budget YTD Actual
Sale & Use Tax Capital Improvement Fund (CIP) 1,104,557 106,764,846Asset Replacement Fund ( 2,390,155) ( 6,826,427) Conservation Trust Fund (Lottery Funds) ( 231,894) ( 1,477,687) Open Space and Parks Fund ( 1,487,047) ( 4,365,405) Service Expansion Fee Fund (SEF) ( 7,477,647) ( 6,557,854) Development Agreement Fund ( 1,134,339) ( 5,435,099) Debt Service Fund ( 283,997) ( 468,117) Utilities Funds 25,532,247 102,518,824Total Ending Fund Balance 14,109,636 131,895,435 25,532,247 102,518,824
Note 1. The ending fund balance does not include reserve amounts that have been earmarked for specific uses. The projected ending reserve balance, as of December 2019, held in the Governmental Capital Funds are estimated to be: $3,595,456 Facilities Improvements; $5,453,632 Asset Protection; $313,684 Open Space- Markel Parcel 4; CIP Fund - Debt Sinking Fund $5,296,067 and $14,221,633 Debt Service Reserves. The projected Debt Service Reserves held in the Utility Funds as of December 2019 equal $38,151,938.
13(d) - Page 5
Attachment 5
City and County of BroomfieldMonthly Budget Report - Trust Funds
February 28, 2019
OriginalBudget
2019
YTD Budget
2019
YTDActual2019
Favorable/ (Unfavorable) variance 2019 YTD Budget to
Actual
YTD Actual 2018
Favorable/ (Unfavorable) variance 2019 YTD to 2018
YTDAnnual RevenuesContributions ( 16,563,609) ( 2,457,316) ( 3,676,306) 49.6%) (3,882,834) (5.3%)Other (Interest and Other Fees) ( 6,078,640) ( 139,900) ( 9,601) (93.1%) (38,023) (74.7%)YTD Revenues 22,642,249 2,597,216 3,685,907 41.9%) 3,920,857 (6.0%)Annual Operating ExpendituresBenefit Payments ( 15,323,785) ( 1,095,356) ( 799,474) 27.0%) (399,429) (100.2%)Insurance ( 1,513,968) ( 252,328) ( 239,057) 5.3%) (168,575) (41.8%)Administrative & Other ( 715,955) ( 85,876) ( 79,420) 7.5%) (69,308) (14.6%)YTD Operating Expenditures 17,553,708 1,433,560 1,117,951 22.0%) 637,312 (75.4%)
Net YTD Sources/ (Uses) of Funds 5,088,541 1,163,656 2,567,956 N/A 3,283,545 N/A
Beginning Fund Balance (does not include Reserves) 86,865,344 86,865,344 78,965,575 N/A 129,064,159 N/A
Ending Fund Balance (does not include Reserves) 91,953,885 88,029,000 81,533,531 N/A 132,347,704 N/A
Ending Balance by Fund 2019 Original
Budget 2019 YTD
Budget 2019 YTD
Actual 2018 YTD
Actual Employee Medical Care Plan 2,009,451 3,536,498 5,547,086 4,492,647General Employee Pension Retirement Plan ( 11,199,098) (10,972,271) ( 11,139,800) ( 11,530,289) General Employee Money Purchase Retirement Plan* ( 75,120,505) (70,311,634) ( 61,524,902) ( 64,732,329) Police Employee Defined Pension Retirement Plan ( 58,024) (92,591) ( 63,534) ( 69,988) Police Employee Money Purchase Retirement Plan* ( 508,991) (468,330) ( 845,919) ( 49,370,419) Retiree Health Savings ( 3,057,816) ( 2,647,675) ( 2,412,290) ( 2,152,032) Total Ending Fund Balance 91,953,885 88,029,000 81,533,531 132,347,704
* The Money Purchase plans are defined contribution retirement plans. The amounts held in these funds are employee retirement accounts held in trust.
13(d) - Page 6

City and County of Broomfield
Financial Report – Revenue Tracking System Report
#2019-02 for
February, 2019
Prepared by the Broomfield Finance Department
Attachment 6
13(d) - Page 7
Actual - Above (Below) Budget Estimate
Actual - % Above (Below) Budget Estimate 3.87%
Table 1
February
Original 2019 Budget Estimate 61,669,397$
Sales Tax Revenues - Total Operating and Capital
Current Projected 2019 Revenues Based on Revenues Received To-Date 64,057,276$
2,387,879$
January February
MarchAprilMayJuneJuly
AugustSeptember
OctoberNovemberDecember
0
1,000,000
2,000,000
3,000,000
4,000,000
5,000,000
6,000,000
7,000,000
8,000,000
9,000,000
10,000,000
January February March April May June July August September October November December
Sales Tax Revenues - Month to Month
2016 Actual 2017 Actual 2018 Actual 2019 Projection 2019 Actual
0
10,000,000
20,000,000
30,000,000
40,000,000
50,000,000
60,000,000
70,000,000
January February March April May June July August September October November December
Sales Tax Revenue - Total to Date
2016 Actual 2017 Actual 2018 Actual 2019 Projection 2019 Actual
4/16/201913(d) - Page 8

Actual - Above (Below) Budget Estimate
Actual - % Above (Below) Budget Estimate 21.81%
Current Projected 2019 Revenues Based on Revenues Received To-Date 8,034,788$
1,438,623$
Table 2
Use Tax on VehiclesFebruary
Original 2019 Budget Estimate 6,596,165$
January February
MarchAprilMayJuneJuly
AugustSeptember
OctoberNovemberDecember
0
100,000
200,000
300,000
400,000
500,000
600,000
700,000
800,000
January February March April May June July August September October November December
Use Tax on Vehicles - Month to Month
2016 Actual 2017 Actual 2018 Actual 2019 Projection 2019 Actual
0
1,000,000
2,000,000
3,000,000
4,000,000
5,000,000
6,000,000
7,000,000
January February March April May June July August September October November December
Use Tax on Vehicles - Total to Date
2016 Actual 2017 Actual 2018 Actual 2019 Projection 2019 Actual
4/16/201913(d) - Page 9
Actual - Above (Below) Budget Estimate
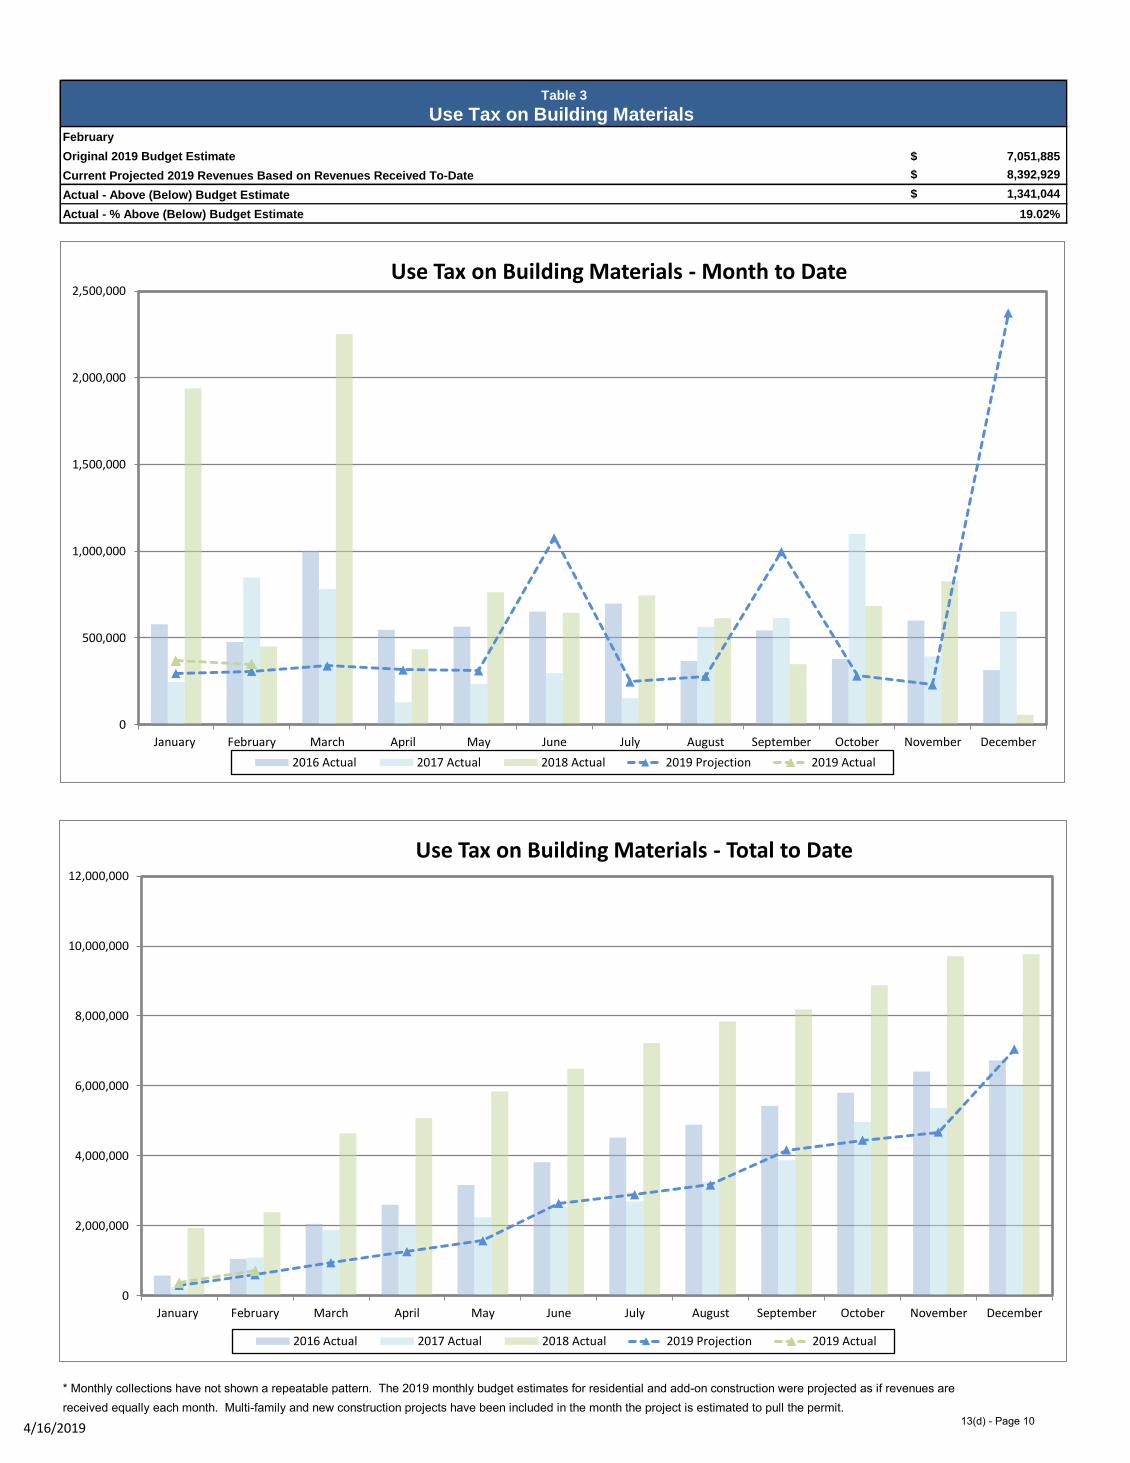
Actual - % Above (Below) Budget Estimate 19.02%
Table 3
Use Tax on Building Materials February
Original 2019 Budget Estimate 7,051,885$
Current Projected 2019 Revenues Based on Revenues Received To-Date 8,392,929$
1,341,044$
January February
MarchAprilMayJuneJuly
AugustSeptember
OctoberNovemberDecember
2014 Data
received equally each month. Multi-family and new construction projects have been included in the month the project is estimated to pull the permit. * Monthly collections have not shown a repeatable pattern. The 2019 monthly budget estimates for residential and add-on construction were projected as if revenues are
0
2,000,000
4,000,000
6,000,000
8,000,000
10,000,000
12,000,000
January February March April May June July August September October November December
Use Tax on Building Materials - Total to Date
2016 Actual 2017 Actual 2018 Actual 2019 Projection 2019 Actual
0
500,000
1,000,000
1,500,000
2,000,000
2,500,000
January February March April May June July August September October November December
Use Tax on Building Materials - Month to Date
2016 Actual 2017 Actual 2018 Actual 2019 Projection 2019 Actual
4/16/201913(d) - Page 10

Actual - Above (Below) Budget Estimate
Actual - % Above (Below) Budget Estimate 0.00%
Current Projected 2019 Revenues Based on Revenues Received To-Date 39,201,193$
-$
Table 4
Property Tax RevenueFebruary
Original 2019 Budget Estimate 39,201,193$
January February
MarchAprilMayJuneJuly
AugustSeptember
OctoberNovemberDecember
2014 Data
* The first property tax collections occur in February of each year.* Negative amounts reflect abatements.
* The revenues associated with Property Taxes are set each year by assessed valuation and mill levies. The total amount projected on an annual basis should remain at the original budgeted amount unless valuation adjustments are made through the Assessor's Office resulting in tax abatements from original amounts due. Final payments for the year are due by June 30th.
-2,000,000
0
2,000,000
4,000,000
6,000,000
8,000,000
10,000,000
12,000,000
14,000,000
16,000,000
January February March April May June July August September October November December
Property Tax - Month to Month
2016 Actual 2017 Actual 2018 Actual 2019 Projection 2019 Actual
0
5,000,000
10,000,000
15,000,000
20,000,000
25,000,000
30,000,000
35,000,000
40,000,000
45,000,000
January February March April May June July August September October November December
Property Tax - Total to Date
2016 Actual 2017 Actual 2018 Actual 2019 Projection 2019 Actual
4/16/201913(d) - Page 11

Actual - Above (Below) Budget Estimate
Actual - % Above (Below) Budget Estimate 26.50%
Current Projected 2019 Revenues Based on Revenues Received To-Date 4,604,456$
964,431$
Table 5
Building Permit Fees February
Original 2019 Budget Estimate 3,640,025$
January February
MarchAprilMayJuneJuly
AugustSeptember
OctoberNovember
2014 Data
2014 Data
* Modified Cash Basis.
0
500,000
1,000,000
1,500,000
2,000,000
2,500,000
3,000,000
3,500,000
4,000,000
4,500,000
January February March April May June July August September October November December
Building Permit Fees - Total to Date
2016 Actual 2017 Actual 2018 Actual 2019 Projection 2019 Actual
0
200,000
400,000
600,000
800,000
1,000,000
1,200,000
1,400,000
January February March April May June July August September October November December
Building Permit Fees - Month to Date
2016 Actual 2017 Actual 2018 Actual 2019 Projection 2019 Actual
4/16/201913(d) - Page 12

Actual - Above (Below) Budget Estimate
Actual - % Above (Below) Budget Estimate 15.33%
324,255$
Table 6
Highway Users' Tax
Current Projected 2019 Revenues Based on Revenues Received To-Date 2,439,255$
February
Original 2019 Budget Estimate 2,115,000$
January February
MarchAprilMayJuneJuly
AugustSeptember
October
NovemberDecember
*$602,456 received in August 2018 for July 2018 payment of SB 18-100 allocation.
0
100,000
200,000
300,000
400,000
500,000
600,000
700,000
800,000
900,000
January February March April May June July August September October November December
Highway Users' Tax Month to Month
2016 Actual 2017 Actual 2018 Actual 2019 Projection 2019 Actual
0
500,000
1,000,000
1,500,000
2,000,000
2,500,000
3,000,000
January February March April May June July August September October November December
Highway Users' Tax- Total to Date
2016 Actual 2017 Actual 2018 Actual 2019 Projection 2019 Actual
4/16/201913(d) - Page 13

Actual - Above (Below) Budget Estimate
Actual - % Above (Below) Budget Estimate 0.59%
January February
MarchAprilMayJuneJuly
AugustSeptember
OctoberNovemberDecember
Table 7
All General Operating Governmental Type Revenues February
Original 2019 Budget Estimate 130,530,034$
Current Projected 2019 Revenues Based on Revenues Received To-Date 131,303,298$
773,264$
0
5,000,000
10,000,000
15,000,000
20,000,000
25,000,000
January February March April May June July August September October November December
All General Governmental Type Revenues - Month to Month
2016 Actual 2017 Actual 2018 Actual 2019 Projection 2019 Actual
0
20,000,000
40,000,000
60,000,000
80,000,000
100,000,000
120,000,000
140,000,000
January February March April May June July August September October November December
All General Governmental Type Revenues - Total to Date
2016 Actual 2017 Actual 2018 Actual 2019 Projection 2019 Actual
4/16/2019 13(d) - Page 14

Actual - Above (Below) Budget Estimate
Actual - % Above (Below) Budget Estimate (0.70%)
Table 8
Current Projected 2019 Revenues Based on Revenues Received To-Date 17,698,235$
Water Sales Revenue February
Original 2019 Budget Estimate 17,823,006$
(124,771)$
January February
MarchAprilMayJuneJuly
AugustSeptember
OctoberNovemberDecember
2014 Data
0
500,000
1,000,000
1,500,000
2,000,000
2,500,000
3,000,000
January February March April May June July August September October November December
Water Sales Revenue - Month to Month
2016 Actual 2017 Actual 2018 Actual 2019 Projection 2019 Actual
0
2,000,000
4,000,000
6,000,000
8,000,000
10,000,000
12,000,000
14,000,000
16,000,000
18,000,000
20,000,000
January February March April May June July August September October November December
Water Sales Revenue - Total to Date
2016 Actual 2017 Actual 2018 Actual 2019 Projection 2019 Actual
4/16/201913(d) - Page 15

Actual - Above (Below) Budget Estimate
Actual - % Above (Below) Budget Estimate (22.32%)
(5,158,445)$
Current Projected 2019 Revenues Based on Revenues Received To-Date 17,953,673$
Table 9
Water License Fees Revenue February
Original 2019 Budget Estimate 23,112,118$
January February
MarchAprilMayJuneJuly
AugustSeptember
OctoberNovemberDecember
2014 Data
* Modified Cash Basis.* Monthly collections have not shown a repeatable pattern. The 2019 monthly budget estimates for residential and add-on construction were projected as if revenues are received equally each month. Multi-family and new construction projects have been included in the month the project is estimated to pull the permit.
0
1,000,000
2,000,000
3,000,000
4,000,000
5,000,000
6,000,000
7,000,000
8,000,000
9,000,000
January February March April May June July August September October November December
Water License Fees - Month to Month
2016 Actual 2017 Actual 2018 Actual 2019 Actual
0
5,000,000
10,000,000
15,000,000
20,000,000
25,000,000
January February March April May June July August September October November December
Water License Fees - Total to Date
2016 Actual 2017 Actual 2018 Actual 2019 Actual
4/16/201913(d) - Page 16

Actual - Above (Below) Budget Estimate
Actual - % Above (Below) Budget Estimate 0.04%
Table 10
Sewer Sales Revenue February
Original 2019 Budget Estimate 6,836,064$
Current Projected 2019 Revenues Based on Revenues Received To-Date 6,838,540$
2,476$
January February
MarchAprilMayJuneJuly
AugustSeptember
OctoberNovemberDecember
2014 Data
0
200,000
400,000
600,000
800,000
1,000,000
1,200,000
January February March April May June July August September October November December
Sewer Sales Revenue - Month to Month
2016 Actual 2017 Actual 2018 Actual 2019 Projection 2019 Actual
0
1,000,000
2,000,000
3,000,000
4,000,000
5,000,000
6,000,000
7,000,000
8,000,000
January February March April May June July August September October November December
Sewer Sales Revenue - Total to Date
2016 Actual 2017 Actual 2018 Actual 2019 Projection 2019 Actual
4/16/201913(d) - Page 17
Actual - Above (Below) Budget Estimate
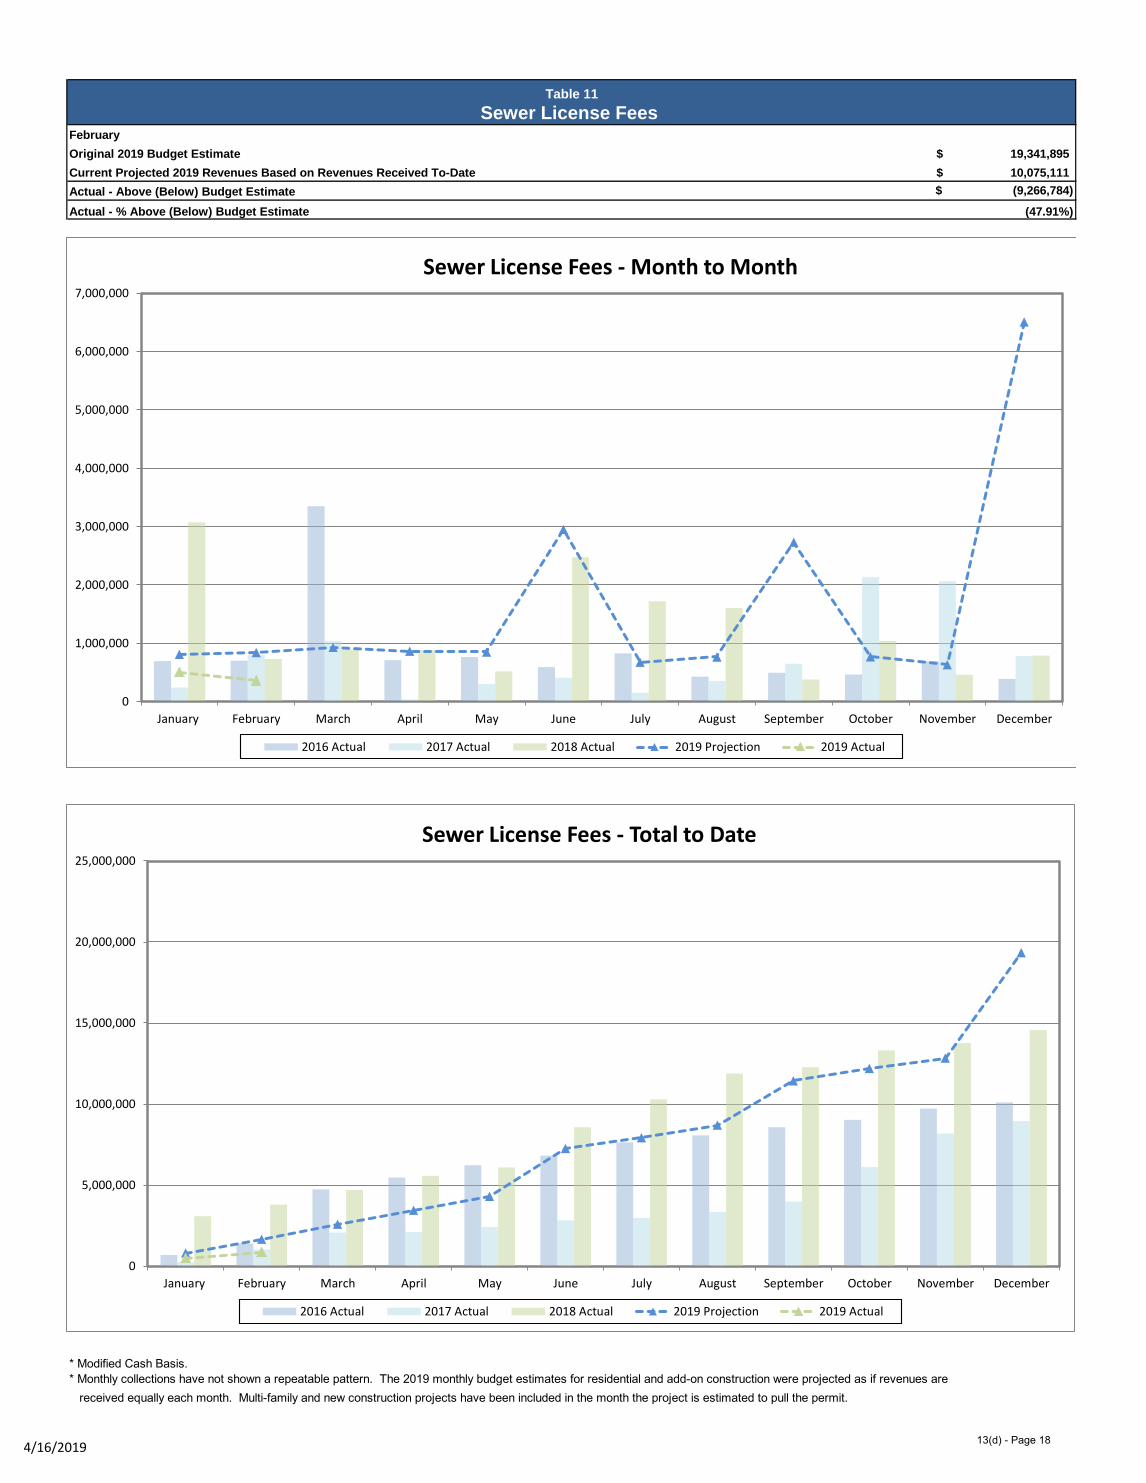
Actual - % Above (Below) Budget Estimate (47.91%)
(9,266,784)$
Table 11
Sewer License Fees February
Original 2019 Budget Estimate 19,341,895$
Current Projected 2019 Revenues Based on Revenues Received To-Date 10,075,111$
January February
MarchAprilMayJuneJuly
AugustSeptember
OctoberNovemberDecember
2014 Data
* Modified Cash Basis.* Monthly collections have not shown a repeatable pattern. The 2019 monthly budget estimates for residential and add-on construction were projected as if revenues are
received equally each month. Multi-family and new construction projects have been included in the month the project is estimated to pull the permit.
0
1,000,000
2,000,000
3,000,000
4,000,000
5,000,000
6,000,000
7,000,000
January February March April May June July August September October November December
Sewer License Fees - Month to Month
2016 Actual 2017 Actual 2018 Actual 2019 Projection 2019 Actual
0
5,000,000
10,000,000
15,000,000
20,000,000
25,000,000
January February March April May June July August September October November December
Sewer License Fees - Total to Date
2016 Actual 2017 Actual 2018 Actual 2019 Projection 2019 Actual
4/16/201913(d) - Page 18

Actual - Above (Below) Budget Estimate
Actual - % Above (Below) Budget Estimate (21.78%)
Current Projected 2019 Revenues Based on Revenues Received To-Date 59,842,652$
(16,664,489)$
Table 12
Enterprise Funds Revenues February
Original 2019 Budget Estimate 76,507,141$
January February
MarchAprilMayJuneJuly
AugustSeptember
OctoberNovemberDecember
2014 Data
0
2,000,000
4,000,000
6,000,000
8,000,000
10,000,000
12,000,000
14,000,000
16,000,000
18,000,000
20,000,000
January February March April May June July August September October November December
Enterprise Funds - Month to Month
2016 Actual 2017 Actual 2018 Actual 2019 Projection 2019 Actual
0
10,000,000
20,000,000
30,000,000
40,000,000
50,000,000
60,000,000
70,000,000
80,000,000
90,000,000
January February March April May June July August September October November December
Enterprise Funds - Total to Date
2016 Actual 2017 Actual 2018 Actual 2019 Projection 2019 Actual
4/16/201913(d) - Page 19