to strategic planning for the barge and dec …
TRANSCRIPT

RD-A156 521 A GUIDE TO STRATEGIC PLANNING FOR THE INLAND BARGE AND 1/j-TOWING INDUSTRY(U) DRAVO NECKLING CORP NEW ORLEANS LAl8 DIBMER ET AL. DEC 84 3861-4-09 MR-RD-779-85995
UNCLASSIFIED DTI- 3 -C-3S8 F/G 15/ L
EIIIIIIIIIIIIu
-IIIIIl".
IIIIIII.

A Guide to Strategic Planning
for the Inland Barge and Towing Industry
N
0
1
CONTRACT NO. DTMA91-83-C-30063 'REPORT NO. MA-RD-770-85005 DETIE
• F E B 2 2 1985
ELE
SMaritime Administration DECEMBER 1984
S a-oi Tio ",3l idLl'L±!, ;::,''~. -j
LEGAL NOTICE
This report was prepared as an account of government-sponsoredwork. Neither the United States, nor the Maritime Administra-tion, nor any person acting on behalf of the Maritime Administra-tion (A) Makes any warranty or representation, expressed orimplied, with respect to the accuracy, completeness, or useful-ness of the information contained in this report, or that the useof any information, apparatus, method, or process disclosed inthis report may not infringe privately owned rights; or(B) Assumes any liabilities with respect to the use of or fordamages resulting from the use of any information, apparatus,method, or process disclosed in this report. As used in theabove, "persons acting on the behalf of the Maritime Administra-tion" includes any employee or contractor of the Maritime Admin-istration to the extent that such employee or contractor pre-pares, handles, or distributes, or provides access to any infor-mation pursuant to his employment or contract with the MaritimeAdministration.
*i

S0272-181
.ElO DOCUMENT '-ao? No. I. a. m~sagim. As*aa Ma.
P MA-RD-770-85005 _
4. Twla Sm"m . nmw DwA Guide to Strategic Planning for the Inland Barge and December 1984Towing Industry - Final Report
7. Aswke(a) & PW9 ie Opebefte.n beL no.
B. Dibner I.B. Jacobson J. Kryschtal, L.E. Sutton 3861-4O09. Pmtwwmlmg OqaslieMam KW O Ad~m 3G ft PaeoUT~eaW SumM No.Dravo Mechling Corporation Temple, Barker & Sloane, Inc.400 Poydras Street 33 Hayden Avenue AL G = or Gemso() Me.New Orleans, LA 70130 Lexington, MA 02173 oDTMA91-83-C-30063
I. Som~orf Oqamztime Name and Address I& TyWe f ftepot & Putted Covered
U.S. Department of Transportation FinalMaritime Administration Final400 Seventh St., S.W. ,.Washington, D.C. 20590 _
IL S meaonitV Me
Jointly sponsored by Maritime Administration and Dravo Mechling Corporation.
| Almt(Limit: 2U0 wards)
-This manual provides a structure for strategic planning that has been applied by aninland barge and towing company. It describes the procedures followed, informationrequirements, and the analysis of the industry, competitors, markets, and otherenvironmental factors. Also included are extensive appendices including: bibliography,commodity classification, historical commodity flows, barge line capabilities, a samplemarket survey, forecasting methodology, and financial forecasting model.
- • -1
17. Deaunm Analsis a. OmCr~aoTransportation Traffic ForecastsInland Waterways Commodity Flows.Barge and Towing IndustryStrategic Planning
. lUmntlflmts/OPwmnmdl Terme m
0OSATI FI a lrsw
.i Aemuhon wam Approved for Kelease so. mm Ci.e (TWS so") al. N. of pses
National Technical Information Service Unclassified 203Springfield, VA 22161 . Sm y, Cis(This. € "). e.U. Pan
Unclassified .-I".u;-Oft AN .mS S m ,,maeao on norso M M (4-f" "
(tomgy NTIS-IS)
-, °. ° , . -. .*°'-, -,% % °. °. " , . *. -, % , °% ,. "•. % .".-" '.' " -" o',,.- %-%°.... D ° % '°". '%ma . - .,o -.- * ."emm, ama,° 5 .
. . . , -. . . .. - . -_, -,_. .. _.-_. .- .. . .. .. .. .. . . - . .. .. ._ , _, . ,.,. ..,/. ,. . . . .....- . . .. . . - - . .-.. .. .

AGuide to Strategic Planning
* for the Inland Barge and Towing Industry
Accession For
Unannomc(d
Just if icri i,)rL
By -
CONTRACT NO. DTMA91-83-C30063REPORT NO. MA-RD-770-85005
* ~US Departmen Of 1osottoMaritim Adainistatifi DECEMBER 1984

7.. - -.-- §.-o-
S
CONTENTS
FOREWORD
Status of Inland Barge and Towing Industry iNeed for Strategic Planning iiPlanning Requirements for Barge Lines iv
I. INTRODUCTION: A STRUCTURE FOR STRATEGICPLANNING
Summary I-iPhase One: Analysis of External andInternal Environments 1-3
Phase Two: Strategy Development 1-8Phase Three: The Strategic Plan I-11Conclusion 1-12
II. INFORMATION REQUIREMENTS
Types of Information II-1Strategic Information Database 11-2U.S. Army Corps of Engineers Data 11-2
*III. INDUSTRY AND COMPETITOR ANALYSIS
Industry Analysis III-1Competitor Analysis 111-2
IV. MARKET ANALYSIS
The Need for Forecasting Markets IV-lMarket Definition IV-2Methodology Selection IV-3The Basis for Forecasting IV-4Forecast Structure IV-7Traffic Forecasts IV-9Equipment Forecasts IV-12Maintenance of the Forecasting System IV-13
6- S
. .-'. . .J..*-. .. -
S
2
CONTENTS (continued) P
V. OTHER ENVIRONMENTAL FACTORS
Legal and Regulatory Environment V-iPhysical Characteristics of the Waterways V-3New Technology V-4Barge Line Resources V-4Other Modal Activities V-6
VI. THE DEVELOPMENT AND IMPLEMENTATION OFTHE STRATEGY
Strategic Issues VI-1Corporate Mission VI-2Planning Period VI-2Strategic Objectives VI-3Strategic Alternatives VI-4Testing and Evaluating StrategicAlternatives VI-5
Strategy Selection VI-5Implementation VI-6 .Business Plans VI-6Monitoring Performance VI-8
APPENDIX A--Bibliography
APPENDIX B--Commodity Classification for DomesticWaterborne Commerce
APPENDIX C--Principal Historical Commodity Flows
APPENDIX D--Barge Line Capabilities
APPENDIX E--Sample Telephone Market Survey
APPENDIX F--Examples of Forecasting Methodology
APPENDIX G--Forecast of Barge Transportation Demand .by Commodity P
APPENDIX H--Financial Forecasting Model
- I
- P ..
.. . . . . . . * o ° . , o . .- . ° • . *. * 2 .* .i . -. . *. . . .. . . .- .

FOREWORD ,
Under the sponsorship of the United States Maritime Adminis-tration, Dravo-Mechling Corporation (DMC) and Temple, Barker &
U Sloane, Inc. (TBS), developed and now describe in this document astructure and methodology for strategic planning that has beenspecifically designed to meet the needs of the inland barge andtowing operator.
STATUS OF INLAND BARGEAND TOWING INDUSTRY
From 1940-1980, the U.S. inland barge industry was a growingand relatively stable segment of the bulk marine transportationindustry. Compared to the oceangoing subsidized sector of the 0U.S. merchant marine, it is relatively free from regulations forthe majority of its traffic.
For these reasons, the inland barge industry had attractedmany corporate owners and investors. In many cases their port-
[ folios had grown to include barge fleets, towboats, fleeting andoperating services, bulk and general cargo loading and dischargeterminals, new construction, and repair shipyards. In addition,some major customers--including grain companies, coal producers,utilities, agricultural cooperatives and chemical companies--hadinvested directly in inland barge operations. Many companiesexpanded their roles in a range of functions from private termi- pnal operators through barge building. In recent years, thesecompanies have been affected by the activities of independentinvestors and private carriers who have changed the structure and
. behavior of the industry. The current depression in equipmentuse and carrier profitability and revenues has led to bankrupt-cies, mergers, and aquisitions, and has altered customers' rela- ptionships with the for-hire carriers. It is critical thatcarriers understand and respond appropriately to these changes.
" The industry also finds itself operating in an increasingly* complex and volatile economic and trade environment. In the last
decade, barge loadings have expanded significantly as a result of pthe increased agricultural exports from the Gulf of Mexico ports,
* where commercial, government-financed, and government-to-govern-ment programs have been established. Exports of coal to foreignutilities and steel producers have increased. For the foreignpurchasers of these dry bulk commodities, the United States
• remains a vital, but often the last-choice, supplier that meets a
-m
• . - . .

ii
the fluctuating year-to-year needs, which are driven by inter-national political, economic, and financial realities. Strongdemand during one year is often followed by weak demand duringthe next. In the domestic arena, the changing levels of energyand natural-resource consumption during economic recessions andexpansions have complicated trading conditions and investmentdecision-making. All these factors lead to erratic fluctuationsin demand for barge services, which are difficult to satisfy.
The inland barge and towing industry has also been facedwith a changing regulatory environment. Railroad deregulationand the resulting pricing policies will be a fundamental competi-tive aspect of the 1980s. And it is possible that the bargeindustry will be eliminated from the Interstate Commerce Commis-sion's (ICC) regulatory realm. Nationwide initiatives for waterresource development and waterway user fees for cost recoverywill affect both the costs and markets of inland barge operationsand could cause other economic effects on the regions served bythe industry. Finally, fuel availability, quality, and pricemust be related to capital and operating decisions concerningtowboat investments.
NEED FOR STRATEGIC PLANNING
The business environment for the 1980s and 1990s will placeheavy demands on private enterprise for the effective use ofassets. Because of the volatility of inland barge conditions,the returns from operations as well as the market value of assetscan vary widely from year to year. If individual companies donot make the appropriate decisions, the entire industry as wellas the shippers that rely on the barge industry can be profoundlyaffected.
In this increasingly complex and competitive environment,independent inland barge carriers will face difficult decisionsrelated to the refurbishing of capital assets. If barge lineowners cannot forsee future returns on investments that compare .
favorably to returns in other businesses or that exceed theircapital costs, even the more successful companies might considerthe divestiture of assets, if they could find buyers. But ifthey remain in the ring, they may find themselves driven to lowcost, low risk, and timid strategies that would ultimately reduceservice and industry capability.
Like most sectors of the maritime industry, the inland bargeindustry has in all too many instances been directed by managerswith limited exposure to other industries, who generally have
" p , ' ,O % ° • ' . o• o . • - •°° % - "% / " •" • . . " • , • . " ° ° ° ° " .-. . - . . . • . ° . - " . ° . ." . . .
iii
more technical than management training, more operational thananalytical experience, and who now find themselves surrounded bycomplex market issues, legislation, and regulation.
As the inland barge industry's executive decision-making*environment has changed, so has the governmental policy makers'
framework. To ensure that government programs are tailored tothe industry's needs in the new environment, it is crucial toachieve a better understanding of the market conditions that theindustry will face in the future.
The following premises state the reasons for recognizingstrategic planning as vital to the recovery and future health of 0the inland barge industry:
e Knowledge of expected market supply and demand iscritical to the future of the inland barge and towingindustry.
* Planning is fundamental to successful management inwhat should be an increasingly volatile industry.
e The evaluation of fundamental economic, industrial,regulatory, competitive, and political issues is acritical step in the planning process.
e Managing in a marketplace of excess capacity and/orweak trade levels requires greater care in makinginvestment, operational, sales, and other decisionsthan managing in a strong market.
* Techniques can be developed to give managers importantinformation to guide them in strategy development andimplementation.
e Strategies are composed of various service, price,cost, charter, investment, financial, operating, andorganizational elements.
PLANNING REQUIREMENTSFOR BARGE LINES
The planning requirements of an inland barge line must focus ..on the following:
9 Developing an analysis and forecasts of both currentand potential markets;
.--- -"

iv
e Assessing the need for new industry and company strate-gies and structures to better confront competitive andunderlying economic realities;
* Matching equipment and technology to the evolving mar-ket requirements and competitive conditions;
e Improving the productivity of physical, capital, andhuman resources;
* Developing the managerial talent and organizationalstrengths, without which strategic plans remain justunused blueprints;
e optimizing the industry and company capitalization andcapital access; and
* Constructively addressing the legislative, regulatory,and associated inter- and intra-industry practicesthat impede progress and performance.
During the next decade every inland carrier will be chal-lenged by the constant need to make major equipment decision3against the backdrop of increasing competition. This documentprovides a mechanism for the inland barge and towing companies toidentify likely future market and competitive conditions anddevelop appropriate strategies using state-of-the-art strategicplanning concepts and techniques.
. . .. . . . .

I. INTRODUCTION:A STRUCTURE FOR STRATEGIC PLANNING
* SUMMARY 0
Recent history underscores the unpredictability that theoperator of an inland barge line is likely to face over the nextdecade. The government-imposed export restrictions, changingenergy prices, and worldwide recession can play havoc with themost carefully planned company strategy. These shocks to longterm trends can not be forecasted. However, effective strategicplanning can mitigate much of the destabilizing impact of theunexpected.
This manual develops--and this chapter briefly outlines--astructure for planning that will enable managers of inland bargelines to deal more effectively with the challenges of the future.The planning process consists of three phases: first, an analy-sis and forecast of the company's business environments, second,the development of company objectives and strategies, third, theimplementation of the selected strategy.
Figure I-1 illustrates the sequence of and interaction amongthe various steps of the planning process. The process beginswith an analysis of the various environments within which thecompany operates. This analysis provides a basis for projectingthe future external factors that will affect the barge line.
RGiven this projection, the company's capabilities are assessed todetermine the issues of strategic importance--factors that mayplay a critical role in the company's future success. Then al-ternative strategies are then designed to address the challengesof the strategic issues. These strategies are rigorously testedto select those that will be most effective in the future. Fi-nally, the cycle is completed when the strategy selected is im-plemented. Monitoring performance against strategic objectives
* leads to the identification of new strategic issues. Then theprocess begins anew.
Effective planning leads to developing strategies that:(1) align the barge line's resources to use its strengths inareas of opportunity while avoiding vulnerability; (2) ensureenough flexibility to respond to the unforeseen; and (3) provideyardsticks that monitor the company's progress towards its stra-tegic objectives.
An established planning system enables a barge line torespond quickly to meet the challenge of short-term crises as
*. well as long-term planning needs. Quick reactions are built into
____ . . . . . .. . . .• .. *

1-2
~ 'C,
@(A
00
cc,
0 O
(n 0-
t zl
EZ
0
0-zZza

.ng sensors that continually environmental factors. The an)rmation. dditionally, once of the company's particular s.will become experienced in number of these topics overlap
,ategic information. The exis- and competition), they are disLps ensure that short-term deci- and subsequently integrate intkny's course in crises so that future environment.Light of longer term goals and
Analyze External Environments:he strategic planning processof focus, of course, depends on-term mission. For example, a g The Industryirticular market, such as facinglong haul spot grain movements, An analysis of the inlandLy on that service and later the strategic planner with a frporate other services, such as can measure the performance ofother hand, a company that benefit of an analysis of the
and services must integrate its key factors behind the successDader focus of an overall corpo- produces useful insights intoFnd services. instance, the planner's compan
S- •tures can be investigated to santrate on strategic planning . ty are linked. An analysis ofa only the barge industry. - growth over time identifies th:epts and approaches discussed and, consequently, whether orfor a wide range of associated "suppliers of capital. Knowled
equipment available to the indabout expected rate levels and
ilar focus of planning, it is's preliminary concerns. Earlyach as low freight rate levels The Markettermine the type and level ofa planning process must also be A forecast of demand forLing and decision-making dead- company's market sectors is a
planning exercise. The forecaand volumes of cargoes as well
Legic planning process are destinations.
As a first step, the trafcommodity and shipper group.any trends and shifts in the r
9segments.
Each key commodity shoul,Lng process consists of an anal- torical changes in total traffids that affect the company from tant origin/destination pairs.a forms the basis for projecting - the following:cternal influences on the com-ket, competition, and other * Grain
- Fertilizer
-. . . . . . . . . . . . ...

1-5
9 Coal
e Construction materials
e Ores
e Minerals
* Iron and steel products
e Forest products S
e Chemicals
e Clean petroleum products
e Dirty petroleum products .0
In developing a market forecast, it is necessary to go be-yond the analysis of historical trends in commodity movements andlook at the underlying economic and other forces that affect themovements. The demand for transportation on the river systemcomes from the demand for the goods to be moved. Therefore, the .need for shipping services is a direct function of the economicconditions surrounding the production and consumption of thecommodities. To project the traffic levels on specific waterwaysrequires forecasting the general economic conditions and outlook .
for the specific sectors of industry, mining, and agriculture. A* knowledge of slated industrial projects and commodity export .
opportunities is also valuable for producing a reliable tradeforecast.
This forecasted market for services by the barge industryshould not be confused with the market for services of the plan-ner's barge line. Forecasts of the company's markets are basedon more specific factors such as equipment availability, ratestructure, sales performance, competitors' actions, and otherfactors, both internal and external to the company.
The Competitors
To analyze competitors, a planner must learn who they areand what are their present and projected strategies. The analy-sis should identify the competitors' relative strengths and weak-nesses, thus indicating potential opportunities for and threatsto the company. The planner should seek insights into how speci-fic competitors may react to environmental changes or to specific
-" strategies adopted by the company.

1-6
One of the key aspects of this analysis is to use importantbusiness attributes to profile a competitor's position as itrelates to the company. These attributes include the number and -
types of towboats and barges in service, market segments served(e.g., by river and commodity), rate activity, and market role(e.g., leader or follower).
Important insights that may be obtained from analyzing com-petitors include the following:
% Understanding their market interests based on theirequipment profiles, deployments of towboats and barges,and access to additional equipment.
0 Knowing their marketing strategies as revealed by theiractivities in public trading of covered barge con-tracts, and bids offered to shippers.
e Noting their operating efficiencies by observing theirfleeting locations, tow makeups, operating areas, andfrequency of service.
0 Determining whether or not competitors' perceivedstrategies in specific market segments are compatible .with their overall interests.
All markets that each competitor serves should be analyzedto determine its flexibility in equipment deployment, previousactions in similar situations, and the priorities that specifictypes of traffic hold in the competitor's total sphere of -operations.
Other Environmental Factors
The complexity of the business environment in which a bargeline operates requires that a number of other factors be ana-lyzed. The primary areas requiring attention are: the legal andregulatory environment, changes in the physical characteristicsof the waterways, new technology, availability of resources used
* by barge lines, and activities of competing inland modes oftransportation.
* Legal and Regulatory
The objective of an analysis of the legal and regulatoryenvironment is to identify the areas that support or limit thecompany's operations. With this information, the planner canbuild strategies that gain the maximum advantage from the en-
. _ • . . ,° .. - .. -° -. °.............................................................'..' .. ....-...-.. . ,.
1-7
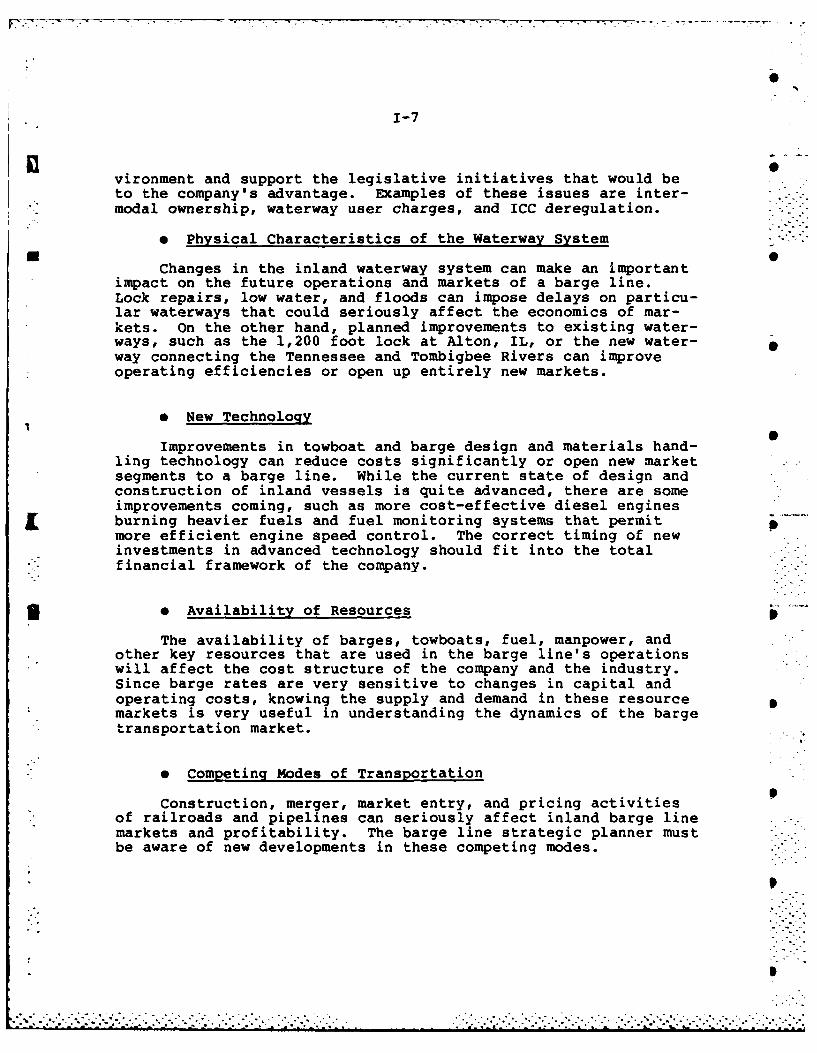
vironment and support the legislative initiatives that would beto the company's advantage. Examples of these issues are inter-modal ownership, waterway user charges, and ICC deregulation.
e Physical Characteristics of the Waterway System* 0
Changes in the inland waterway system can make an importantimpact on the future operations and markets of a barge line.Lock repairs, low water, and floods can impose delays on particu-lar waterways that could seriously affect the economics of mar-kets. On the other hand, planned improvements to existing water-ways, such as the 1,200 foot lock at Alton, IL, or the new water-way connecting the Tennessee and Tombigbee Rivers can improveoperating efficiencies or open up entirely new markets.
* New Technology
Improvements in towboat and barge design and materials hand-ling technology can reduce costs significantly or open new marketsegments to a barge line. While the current state of design andconstruction of inland vessels is quite advanced, there are someimprovements coming, such as more cost-effective diesel enginesburning heavier fuels and fuel monitoring systems that permitmore efficient engine speed control. The correct timing of newinvestments in advanced technology should fit into the totalfinancial framework of the company.
* * Availability of Resources
The availability of barges, towboats, fuel, manpower, andother key resources that are used in the barge line's operationswill affect the cost structure of the company and the industry.Since barge rates are very sensitive to changes in capital andoperating costs, knowing the supply and demand in these resourcemarkets is very useful in understanding the dynamics of the bargetransportation market.
- Competing Modes of Transportation
Construction, merger, market entry, and pricing activitiesof railroads and pipelines can seriously affect inland barge linemarkets and profitability. The barge line strategic planner mustbe aware of new developments in these competing modes.
9
I."
................................................
. . . . . . . . . . . . . . . . . . . . . . . . . . . . . . . .. . .. . . . . . . . . . . . . . . . . .. . . . . . . . .

I-8
Assess Internal Strengths andWeaknesses
The Company
The next step is to conduct an internal assessment of thecompany's strengths and weaknesses relative to others in theindustry. A prime objective of the internal evaluation is toidentify areas of competitive advantage, such as fully depreci-ated barges, that may be used to exploit future opportunities.However, the assessment should also identify areas of weakness,such as high cost terminal operations that may dictate a futurestrategy of shutting down these facilities to decrease the com-pany's vulnerability. Particular performance criteria that aplanner should assess include indicators of service levels, cus-tomer satisfaction, market share, cost structure, equipment use,financial performance, information systems, and adequacy of per-sonnel.
Develop Forecasts
The final step in the first phase is to develop forecasts ofthe markets in which company is currently active or has an inter-est in entering. The forecasts are primarily focused on thedemand side of the market: to determine the future requirementsof shippers to use barge services to transport their raw materi-als and products on the inland waterway system. The supply sideis also important, as represented by the expected availability ofbarges and towboats to transport the commodities. It is thefuture interactions of these two elements that determine themarket for a barge line. The planner should use whatever infor-mation that he can obtain to develop useful forecasts of allelements of the markets served by the company.
PHASE TWO: STRATEGY DEVELOPMENT
During the second phase of the planning process, the sepa-rate elements of analysis carried out earlier must be combined inorder to determine how their interaction shapes the future en-vironment and the barge line's ability to prosper. A number ofdifferent analytical approaches may be required to integrate allthe components. In creating an understanding of the company'sfuture environment, the planner should identify the issues thatare likely to be critical to the company's success. These stra-tegic issues provide the focal point for developing and evaluat-ing alternative strategies.
. ..

4 S
1-9
Corporate Mission andStrategic Objectives
A corporate mission defines what a company plans to be.Strategic objectives are yardsticks that measure the success of
* the company in fulfilling that mission. The projected futureenvironment provides a frame of reference to express the com-pany's mission and strategic objectives. A statement of corpo-rate mission need only include: (1) what markets the companywill serve, (2) what customer needs will be met, and (3) how thecompany will provide those services. Strategic objectives aremore specific and should reflect the company's perceptions of thefuture business environment and its own ability to prosper withinthat environment.
Effective strategic objectives provide a basis for allocat-ing resources and evaluating the company's performance. Theyshould provide measurable benchmarks for tracking and controllingperformance in order to identify or anticipate a need for mid-course corrections. To successfully meet these objectives, thecompany's personnel who are responsible for implementing thestrategies must be committed.
Strategic objectives must be sufficiently specific to serveas valid measures of performance. However, they must also bevaried enough in the criteria they set to preclude manipulatingthe results through inappropriate tradeoffs, such as boostinggrowth in revenues at the expense of profits, or delaying vesselreplacement in order to maximize short-term ROI.
Strategic Issues
Strategic issues are major changes in the barge line's en-vironment that are considered likely to have a significant impacton the company's future. Early in the process, the environmentalanalysis may well identify numerous important strategic issues.Others may surface later as the company's ability to perform inthe future is projected against the backdrop of the forecastenvironment. Such issues generally fall into the followingareas:
e Changes in the amount or nature of commodities moving
on specific waterways
e Towboat and barge availability
9 Behavior of competitors, both barge operators and othermodes
o-? • .'.

I-10
e Legal and regulatory constraints
* Waterway capacity
* Developments in technology
e Availability of resources
o The company's ability to meet future challenges
The Selection of Strategy
Developing strategy focuses on the means by which the com-pany can meet the challenges posed by the strategic issues andattain its strategic objectives. To avoid preselecting a lessthan optimal strategy, a number of alternative strategies shouldbe developed. So that a company gains a broad perspective on itsproblems and their potential solutions, these strategic optionsshould stem from a variety of the company's functional areas.The process of developing several options, which are then sub-jected to rigorous, unbiased testing, should lead to a vote ofconfidence for the strategy that is finally chosen.
Each strategic option should possess enough financial detailso that resource requirements, cash flows, and market positionare clearly defined over the planning period. Planners shouldspecifically note and resolve the potential conflicts or para-doxes within a strategy, e.g., growth versus short-term profita-bility.
Computer simulation is very effective in integrating thediverse elements produced by the strategic analysis. Simulationtests the strategic options under the projected environmentalconditions. Assumptions on future operating costs and ratescan be loaded into an interactive computer model to project thecompany's financial, market share, and capacity use. The modelcan also test the sensitivity of strategic options to variationsin key assumptions.
Planners should relate the projected performance of eachstrategic alternative to selected criteria, such as the internalrate of return, consistency with strategic objectives, flexibili-ty of response to unforeseen environmental changes, minimizationof downside risk, and effective use of human and capital re-sources.
In the process of testing and evaluating, it is possiblethat additional strategic issues may emerge, requiring a loop
.. ,...".

~I-ll
back to the development or refinement of further strategies todeal with the new issues.
*PHASE THREE: THE STRATEGIC PLAN
The third and final phase of the planning process culminatesin a plan that is both comprehensive and workable. Of primaryimportance in this phase is communicating to all those concernedwith its implementation the philosophy and details of the stra-tegic decision. Responsibility must be delegated to those ex- Spected to carry out the strategy. Because many of these indivi-duals may already have participated in the strategy's develop-ment, their commitment should instill confidence in the selectedstrategy among their colleagues.
Development of Business Plans
A series of detailed business plans transforms the strategyfrom the abstract to the concrete. Normally integral parts offormal planning documents (such as five-year and annual plans),these plans include the following: p
The Sales Plan identifies and prioritizes specific customerneeds and, where applicable, the particular customers or marketsegments where sales efforts should be focused.
The Competitive Plan states assumptions about the competi-tion's behavior and develops the specific actions the organiza-tion should take to neutralize any competitive activity thatcould damage the strategic plan.
The Operations/Service Plan details how the organizationwill carry out its strategy in terms of vessel and land-basedoperations in order to meet the strategy's timetable.
The Financial Plan develops short-term financial detailsthat are used to develop budgets and financial controls.
The Organizational/Personnel Development Plan structures the Sorganization to meet the demands of the strategic plan and allo-cates human resources in order to best carry out the strategy.
The Corporate Development Plan synchronizes the needs andcontributions of the barge line with those of the rest of cor-poration's divisions.
• . ]
. . . . . . . . . . . . . . . . . . .. . . . . . . .%.....,-.......~ - ________ .
1-12
Each business plan can be taken to the appropriate level ofdetail required to formulate one-year plans and budgets. Thisfinal critical step carries the objectives and broad detail ofthe strategic plan through to the implementation stage.
Monitoring Performance
Along with the strategic plan and its offshoots (the busi-ness plans), several yardsticks gauge progress. Should the en-vironment alter so that the original strategic plan becomes un-workable, the yardsticks provide an early indication of any majordifferences between plan and reality. Such an indication willsend the planner back to the appropriate point in the planningprocess to deal with the new issue.
CONCLUSION
The essence of strategic planning is the process of plan-ning, not the plan. A formalized system as we have described isneeded to guide and stimulate the process of strategic planning.In the end, the plan is the product of a series of assumptionsabout the future, some of which are bound to prove inaccurate.The dynamic process of planning is critical to directing theenterprise through the future's uncertainties.
A strategic planning system offers tremendous decision-mak-ing assistance to the managers of a barge line. The principalassets of such a system include: the greater depth and perspec-tive it adds to a company's understanding of the environment; theincreased communication it creates between people within thecompany in the expression of objectives, the sensing of needs,and the development of strategies; and, finally, the coordinationof all the company's resources into a consensus-based strategy toposition the company to prosper in the future.
II. INFORMATION REQUIREMENTS
Information fuels the strategic planning process. Without*accurate and planning-oriented data, the planning process deteri-
orates to groping in the dark, using just intuition and hearsay. 0Especially for the analysis of the firm's environments conductedin Phase I, planners should collect data regularly and systemati-cally.
TYPES OF INFORMATION
The strategic planner's information needs are many andvaried, but generally fall into the following categories:10
* Information on the industry in which the company oper-ates. This information can provide insights into thesuccesses and failures of similar barge lines, thefactors behind such events, and major trends on anindustrywide basis. Such knowledge can prove useful in
I determining the market value of firms in the industryand associated problems of capital formation.
e Financial and operational data on the company itself.This information can be used to compare the company'sperformance to industry yardsticks and help determinethe company's unique strengths and weaknesses.
* Environmental information on the applicable laws andregulations, waterway characteristics, new technology,and availability of resources.
* Finally, and of central importance to the identifica-tion of future areas of opportunity and threat, infor- 0mation on the supply and demand aspects of the marketsin which the company competes or may in the futurecompete. Essentially, this entails a knowledge of thecompany's competitors and customers.
Although we will generally deal with these various databaseareas separately, it must be noted that during the strategicplanning process the areas cannot always be analyzed separatelybut instead must be integrated and synthesized. Because they are - -
* interrelated, one must understand how these parts fit the wholein order to project the firm's future environment.
- . •
1 2 * .- "
11-2
STRATEGIC INFORMATION DATABASE
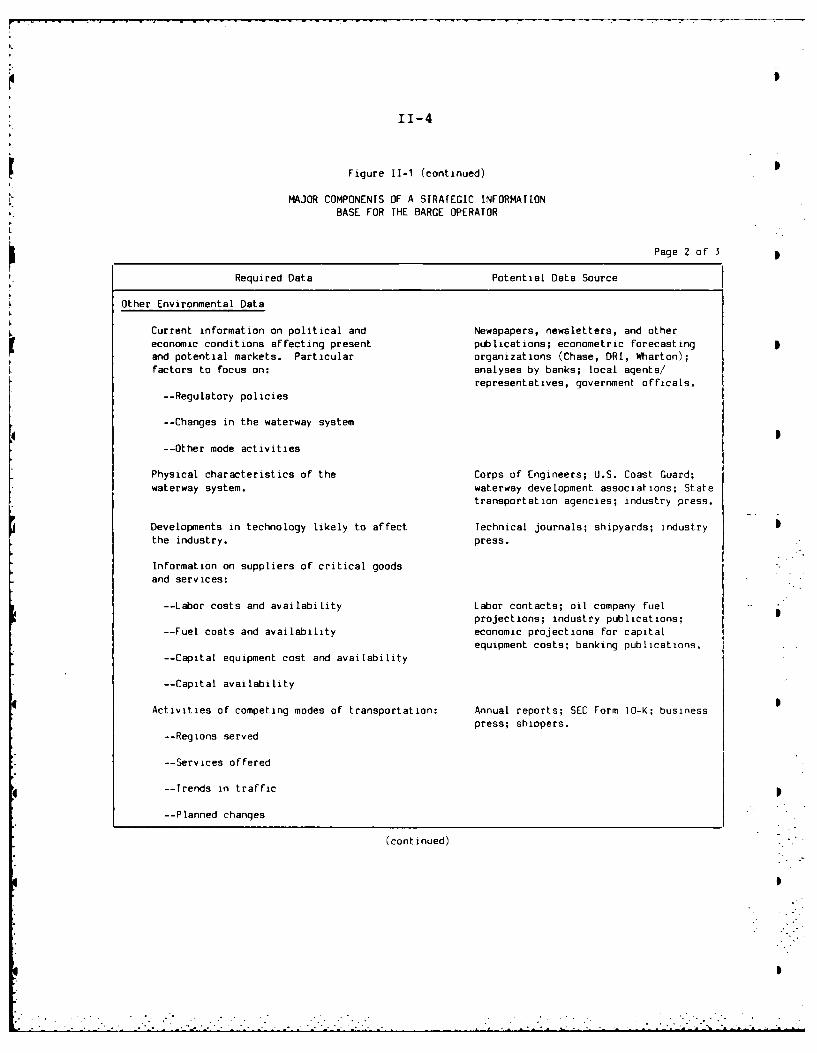
Figure II-i provides a summary of the suggested major com-ponents of a strategic information database. The means of stor-ing these data may range from collecting hard-copy annual reportsor press clippings on competitors to computerizing trade andmarket-share data. Maintaining such an information base plays auseful function both in regular strategic planning and in crises,when solid, timely, and easily accessible data may be critical toon-the-spot decision making.
The following chapters describe the specific means of stor-ing, retrieving, and analyzing the data. These sections coverthe various components of the strategic analysis of a company andthe environments in which it operates.
Appendix 4 is an annotated bibliography that describes anumber of governmental and private information sources that areavailable to the public. References are arranged according tothe following topics:
* Commodity flow statistics
e Shipper industry data
e Government studies
e Terminals
* Equipment
0 Costs
9 Competitors
e Economic factors
e Information sources
CORPS OF ENGINEERS DATk
The Waterborne Commerce Statistics, prepared by the CofE,Waterborne Commerce Statistics Center (WCSC), provide the mostconsistent, accurate, and meaningful source of historical inlandwaterways transportation data. Waterborne Commerce of the United
Si
_________________________________________ 1jLI:.jj.Lij9,f ~ :.|

11-3
Figure 11-1
MRJOR COMPONENTS OF A STRATEGIC INFORMATIONBASE FOR THE BARGE OPERATOR
Page I of 3
Required Data Potential Data Source 0
Industry Data
Financial and operating data on other Anual reports; SEC Form 10-K; businessbarge operators, press.
Current information on competitors, Business/industry publications; MarAdincluding: data; Corps of Engineers statistics;
contacts with customers and suppliers.-Fleet configuration, capacity, and
use
-New buildings
-Market share
-Intelligence on potential strategic moves
-Ownership, management
Company Data
Detailed operations and financial data on own Internal management accounts andcompany, including: reporting systems.
-Tons and ton-miles carried by river andcommodity
-Tons and revenue of movements betweenorigin/destination pairs by commodity
-Customer revenues and tons by river andcommodity
-Equipment acquisition and operating costs
-Terminal operating costs
-Towing capacity and use
-Barge capacity and use S
-Outside towing expense
-Overhead expenses
-Financial statementh
(continued)
... -
11-4
Figure 11-1 (continued)
MAJOR COMPONENTS OF A STRATEGIC INFORMATIONBASE FOR THE BARGE OPERATOR
Page 2 of 3 p
Required Data Potential Data Source
Other Environmental Data
Current information on political and Newspapers, newsletters, and othereconomic conditions affecting present publications; econometric forecastingand potential markets. Particular organizations (Chase, DRI, Wharton);factors to focus on: analyses by banks; local agents/
representatives, government officals.--Regulatory policies
--Changes in the waterway system
--Other mode activities
Physical characteristics of the Corps of Engineers; U.S. Coast Guard;waterway system. waterway development associations; State
transportation agencies; industry press.
Developments in technology likely to affect Technical journals; shipyards; industrythe industry. press.
Information on suppliers of critical goodsand services:
--Labor costs and availability Labor contacts; oil company fuelprojections; industry publications;
--Fuel costs and availability economic projections for capitalequipment costs; banking publications.
--Capital equipment cost and availability
--Capital availability
Activities of competing modes of transportation: Annual reports; SEC Form 10-K; businesspress; shippers.
--Regions served
--Services offered
--Trends in traffic p
--Planned changes
(continued)
_
• - .. -, ,-i- • ..IT ,T.- .:_ . .:. -L. LI- ."i -... -. ,. _ " " •""" ""

* 0i
3ntinued)
IATEGIC INFORMATION States is available to the pub'E OPERATOR regional data and one volume o
20 months after the end of thecovered in the reports. Part
Page 3 of 3 Mississippi River System and tPn of key interest to inland wate
Potential Data Source national summary, is also impodered from the U.S. Army EnginBox 60267, New Orleans, LA, 70
Before distributing the pCorps of Engineers " preliminary data in summary fo
Outside users asked the WCSC tso that interested parties in
Maritime Administration as possible. WCSC agreed to aested companies should contactyear to request copies of thes
Department of Agriculture 0
The commodity forecastingDepartment of Energy !report can be modified and mai
-e ocontained in the one page summDepartment of Energy System internal traffic and th
Intracoastal Waterway traffic... possible for managers to updat
St. Louis Merchants Exchange accurate data for the prior yeyear. More detailed forecasts
Waterways Freight Bureau, barge waterways.line tariffs
The commodities that haveway system are reported in fou
DRI; Chase; Wharton neers. The Commodity ClassifiCommerce is enclosed in Appendpal historical commodity flowsand the Gulf Intracoastal Wate1981. The data are displayed
* •segments.
The approach to classifyiway system must include both ttion as well as the forms of astrategic planning is to assis
Market research * the demand for their equipmentdata should be displayed accorused, regions served, and specexample, commodities that arebarges, such as coal and bauxifrom commodities that are norm
* • such as grain and iron ore.
Unfortunately, some of thcodes of the CofE have mixed p
.•
" .- ..°..
,' .< i " i -... -.. " - .- -'- .-.- . -.' . -. ... • - i'" -- .- _ _ _ _ __._ _ __. ._ __._ _.. ... .. - .. - - , ,.
11-7
example, fertilizer and fertilizer materials are reported by theCofE in the following categories:
1471 Phosphate rock1479 Natural fertilizer materials, n.e.c.
m 2871 Nitrogenous chemical fertilizers, except mixtures2872 Potassic chemical fertilizers, except mixtures2873 Phosphatic chemical fertilizers, except mixtures2879 Fertilizers and fertilizer materials, n.e.c.3271 Lime
In addition, fertilizer movements are often reported by bargeoperators to the CofE as chemicals and are then included in the Sfollowing categories:
2819 Basic chemicals and basic chemical products, n.e.c.2891 Miscellaneous chemical products
It is difficult to relate barge types to commodity classifi- 0cations. For example, nitrogenous chemical fertilizers includeboth urea, which is carried in covered hopper barges, and anhy-drous ammonia, which is carried in temperature controlled tankbarges. It is impossible to identify which of the many types of
[ chemicals were carried as dry or liquid bulk cargoes.
While these inaccuracies exist when using the CofE data as abasis for forecasting demand for services of specific bargetypes, approximations are quite useful and have been used todevelop the forecasts shown below.
. . . ,-L ".• "L' .. "L ' 'L L ' " ' " ' 0 ' . ." ' ' " " ' ." "- . - . .. ,

III. INDUSTRY AND COMPETITOR ANALYSIS
This chapter focuses on two important steps that occur early* in the planning process: analyzing the barge and towing industry
in which the company competes and analyzing the major strengthsand weaknesses of the company's competitors.
INDUSTRY ANALYSIS
As suggested in the Chapter I discussion of the generalframework for strategic planning, a knowledge of the industry asa whole is valuable in gaining insights into a particular com-pany's strengths and weaknesses. Not only can the planner mea-sure the company's relative performance, but he can also identifythe factors underlying both the success of the industry leadersand the failure of weaker firms.
Barge and Towing Industry
There is a limited amount of publicly available data onindividual companies in the industry. Since many barge lines areprivately held, they do not publicly disclose annual reports.And because most publicly held barge lines are small parts oflarge diversified companies, data on the barge line are oftenreported in a service or product group such as "transportation"so that the barge line information can't be singled out.
Information on the industry as a whole is equally scarce.However, one useful resource is the annual study of financialstatements performed by Robert Morris Associates, which uses dataprovided by banks. In recent years, 50-70 barge line companieshave been reported. The information about assets, liabilities,and income, and the calculations of financial ratios are usefulfor understanding the following:
" The inland barge industry's overall financial perform-ance
" Comparison between the barge and towing industry andother transportation modes
* Comparison between the planner's company and the in-dustry as a whole
* * i *~. .* .* . -.-. _

111-2
In addition to Robert Morris Associates' annual studies, similardata are available from Dun and Bradstreet.
Total Industry Analysis
The industry's financial performance for the years 1979-1983 is shown in Figure III-1. Assets and liabilities are shownas percentages of totals and classified as current or non-cur-rent. Income and expense data are shown as percentages of sales.Note the relative increases in operating and other expenses inthe 1981 to 1983 period and the concurrent decreases in operatingprofit and pre-tax profit. The financial ratios are presented inthe form of ranges and mean values.
Inter-Industry Analysis
In addition to examining the barge and towing industry as awhole, it is useful to compare the inland transportation systemto other modes such as railroads, motor carriers, and pipelines.
In analyzing the barge industry, a critical issue is itsability to attract capital in the future. The question is impor-tant both from the perspective of the individual company (its -ability to attract the capital needed to meet its growth andasset-replacement requirements) and that of the whole industry(its ability to support additional capacity needs). This issuecannot be addressed without comparing the performance of theinland barge industry with that of the other U.S. transportationindustries. In addition to the previously noted resources on thebarge industry, Moody's Transportation Manual and TRINC's BlueBook of the Trucking Industry provide data on U.S. rail, air, androad carriers. Figure 111-2 provides a time series of data thatcan be compared to that of the barge industry, as in Figure III-3. It is important to note that the financial analyses of rail-roads and trucking companies are based on Interstate CommerceCommission accounting methods which can result in understatementsof financial ratios such as Return on Equity.
COMPETITOR ANALYSIS
As a starting point, the planner should identify competitorsand collect enough detail on their operations to permit a thor-ough analysis of their strengths, weaknesses, and current strate-gies. Although the competition generally comes from other for-hire barge operators, the concept of competition must be broad
* ** . * . .. . .. . . . . .. . . . .* .n . . . .... - - --

111-3
Figure I[I-1
* INLAND BARGE INDUSTRY FINANCIAL PERFORMANCEI
(percent)
1979 1980 1981 1982 1983I
AssetsCash 6.9 9.6 7.8 7.5 6.2Accounts and Notes Receivable 18.0 15.4 19.1 16.0 11.5Inventory 2.6 4.5 3.9 4.6 2.5All Other Current 3.4 1.9 2.3 2.2 1.0
Total Current 31.0 31.5 33.0 30.3 21.2 3
Fixed Assets (net) 58.5 54.5 55.6 61.6 67.1Intangibles (net) 0.2 1.4 0.4 0.5 0.6All Other Non-Current 10.3 12.7 11.0 7.6 11.0
Total Non-Current 69.0 68.5 67.0 69.7 78.8
Total Current and Non-Current 100.0 100.0 100.0 100.0 100.0
LiabilitiesNotes Payable--Short Term 3.9 6.2 5.9 7.4 6.0Current Mat.--LTD 7.1 5.0 5.7 9.8 4.6
Accounts and Notes Payable 12.3 9.2 13.5 9.8 6.2 AAccrued Expenses 3.0 3.8 2.8 3.3 2.6All Other Current 4.9 7.1 7.3 5.0 3.8
Total Current 31.2 31.4 35.2 31.3 23.3
Long-Term Debt 36.2 32.5 35.0 37.5 40.3All Other Non-Current 2.7 4.9 2.6 4.6 5.5Net Worth 29.9 31.2 27.2 26.6 30.9
Total 100.0 100.0 100.0 100.0 100.0
Income DataNet Sales 100.0 100.0 100.0 100.0 100.0Operating Expenses 82.8 80.9 85.2 89.2 87.7Operating Profit 17.2 19.1 14.8 10.8 12.3All Other Expenses 4.5 4.8 6.0 7.6 9.4Profit Before Taxes 12.7 14.3 8.8 3.2 2.9
1Source: Robert Morris Associates' Annual Statement Studies.
I . !

111-4
Figure 111-2
FINANCIAL STATISTICS
U.S. INLAND TRANSPORTATION INDUSTRIES
1976-1981
(dollars in millions)
1976 1977 1978 1979 1980 1981
Inland Barge Lines1
Revenue $900.3 $999.7 $1,163.0 $1,288.6 $1,487.9 $1,691.6Net Income $29.6 $27.1 $24.6 $40.6 $48.9 $57.5Total Assets $857.4 $833.1 $1,047.7 $1,160.9 $1,062.8 $1,691.6Stockholders' Equity $327.1 $260.6 $187.1 $259.4 $284.3 $422.9Profit Margin 3.3% 2.7% 2.1% 3.2% 3.3% 3.4%ROA 3.5% 3.3% 2.4% 3.5% 4.6% 3.4%ROE 9.1% 10.9% 13.2% 15.7% 17.2% 13.6%
Class 1 Railroads2
Revenue $18,836.7 $20,429.9 $21,721.3 $25,219.1 $28,102.9 $30,733.9Net Income $(111.6) $227.1 $306.8 $938.3 $1,191.4 $2,204.5Total Assets $36,029.8 $38,377.9 $38,895.2 $41,830.6 $45,888.6 $48,819.8Stockholders' Equity $15,183.7 $15,920.9 $16,182.8 $17,796.1 $19,860.0 $21,725.1Profit Margin (0.5)% 1.1% 1.4% 3.7% 4.2% 7.2%ROA (0.3)% 0.6% 0.8% 2.2% 2.6% 4.5%ROE (0.7)% 1.4% 1.90 5.3% 6.0%. 11.1% . ...!
Intereitz MotorCarriers]Revenue $13,208.8 $13,777.94 $18,328.4 $16,384.1 $16,716.5 $18,092.2Net Income $364.9 $462.8 $594.6 $359.4 $149.5 $393.5Total Assets $6,028.4 $6,385.2 $8,006.9 $7,490.9 $7,307.0 $7,595.0Stockholders' Equity $2,821.3 $3,020.9 $3,573.6 $3,283.7 $3,004.1 $3,234.6Profit Margin 2.8% 3.4% 3.2% 2.2% 0.9"4 2.2%ROA 6.1% 7.2% 7.4% 4.8% 2.0% 5.2%ROE 12.9%a 15.3% 16.6% 10.9% 5.0. 12.2%
1Source: TBS analysis of Robert Morris Associates' Annual Statistical Studies (SIC 4441).2Source: Moody's Transportation Manual.3Source: ATA Financial Analysis of the Motor Carrier Industry (Group A, 8, & C).
°. W..t w

III-5
Figure 111-3
C14PARATIVE FINANCIAL RATIO ANALYSIS
U.S. INLAND BARGE INDUSTRY VERSUSOTHER U.S. INLAND TRANSPORTATION INDUSTRIES
(percent)
1976 1977 1978 1979 1980 1981
Return on AssetsBarge Lines 3.5 3.3 2.4 3.5 4.6 3.4Railroads (0.3) 0.6 0.8 2.2 2.6 4.5Motor Carriers 6.1 7.2 7.4 4.8 2.0 5.2
Return on EqutlBarge Lines 9.1 0.4 13.2 15.7 17.2 13.6 SRailroads (0.7) 1.4 1.9 5.3 6.0 11.1Motor Carriers 12.9 9.3 16.6 10.9 5.0 12.2
Profit Margin
Barge Lines 3.3 2.7 2.1% 3.2% 3.3 3.45 Railroads (0.6) 1.1 1.4 3.7 4.2 7.2Motor Carriers 2.8 3.4 3.2 2.2 0.9 2.2
Source: Figure 111-2.
* 3
I. S
. -:
• -..... ..... ........ ... ... ....... .....

111-6
enough to include all existing and potential sources of competi-tion, for example, private barge operators, railroads, and pipe-lines. The planner should be particularly aware of the threatfrom potential private competitors--shippers that are presentlyserved by barge lines but may begin private barging of their owntraffic and offering available equipment for hire to othershippers.
Once thb scope of the competition has been determined, thestrategic planner should seek to understand the historical com-petitive behavior in order to make an overall assessment of thenature of the competition. A database should be developed foreach competitor, using such historical data as the following:
e Competitors' financial data such as revenues, assets,
short-term and long-term debt
e Ownership and corporate structure of competitors
e Fleet profile by competitor: the total number ofbarges and towboats, by capacity, type, and use forboth the entire river system and the planner's firm'sdirect competition
e Market activity: the major commodities carried, riversserved, important origin/destination pairs, and keyshippers served
e Share of available barge capacity
e Other services offered, such as terminals, fleets,and repairs
9 Relationships with other barge lines and vendors
In general, because of the sketchy information availableabout inland barge operators, it is difficult to assemble a com-plete picture of competitors' finances. However, it is possiblewith some effort to collect information about competitors' equip-ment availability and use active markets (by commodities carriedand rivers served), and corporate organization and managementstyles.
Some of this information is available from governmentalsources, such as the U.S. Army Corps of Engineers. Sometimes,individual companies provide information in their annual reports,promotional literature, and press releases to trade journals.Other intelligence can be collected within the planner's owncompany from competitors' former employees, shipper contacts, and
. .. . . .. . . .i

111-7
the operating personnel's observations of competitors' tows,fleets, switchings, loadings, and unloadings.
Although much of this information may be floating around theplanner's company, it must be assembled and reviewed methodicallyto provide useful market information and an understanding of Scompetitors' past and future activities.
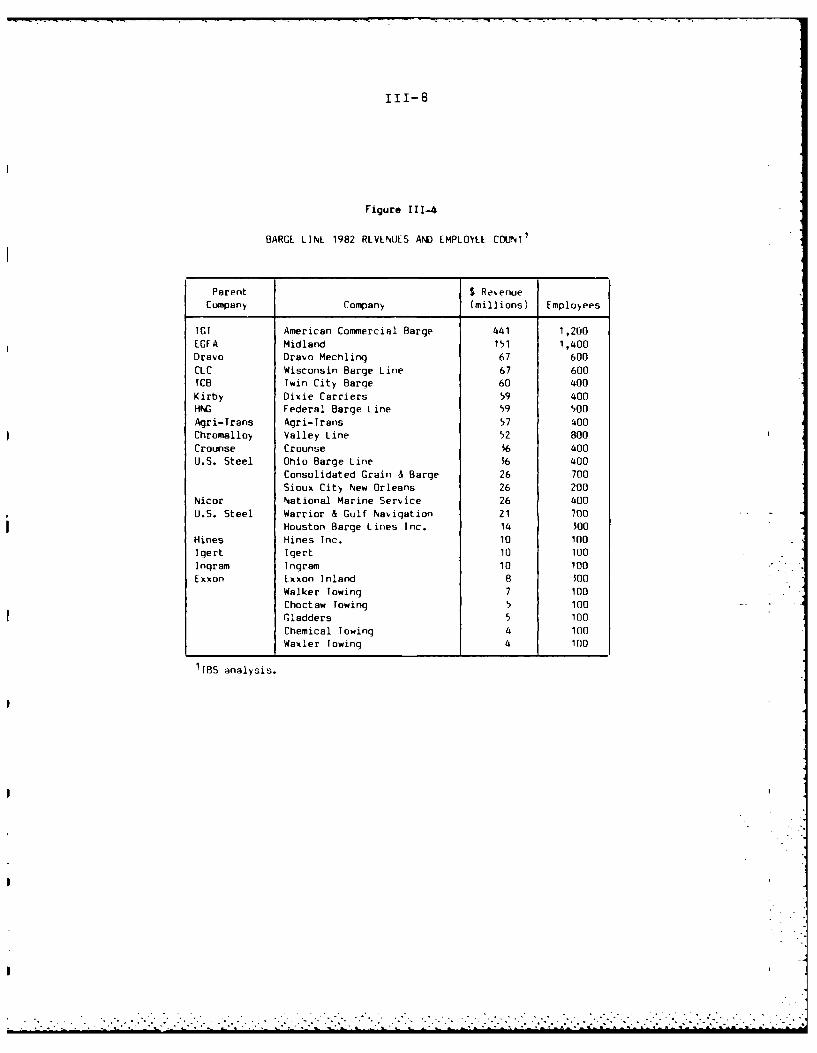
The figures that follow illustrate examples of informationon competitors. Figure 111-4 shows TBS's estimates of 1982 reve-nues and numbers of employees for 25 large barge lines, whichused publicly available data and estimates. hppendix D shows the Scapabilities of 30 large barge lines by identifying their typesof equipment, terminals, building and repair facilities, otherservices offered, and fleet locations.
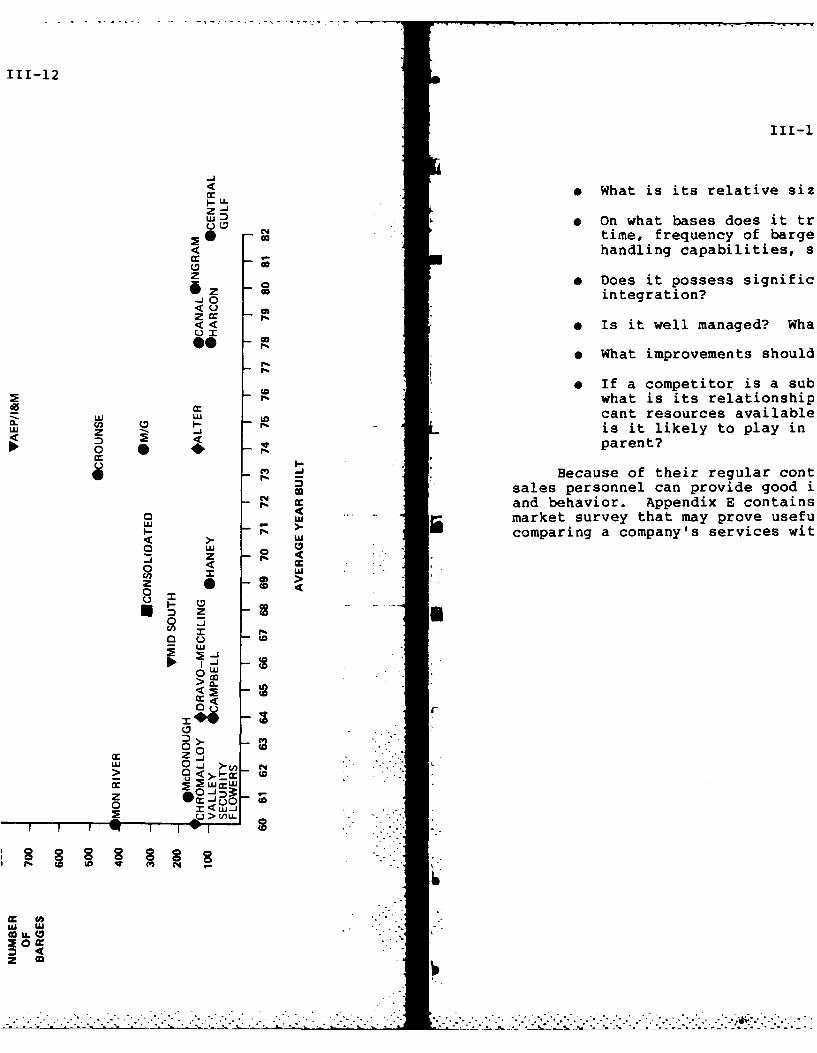
Major covered hopper fleets are lic:ted in Figure 111-5 for26 barge operators by number of barges, capacity, and average Syear built. The data are plotted in Figure 111-6 to give a visu-al representation of the barge capacities. Similar informationfor open hopper barge fleets of 20 companies is listed in Fig-ure 111-7 and depicted graphically in Figure 111-8.
This information helps the strategic planner gain insightinto several aspects of each competitor's behavior so that thefollowing questions may be answered:
e What are the capabilities of the major competitors?
* What are their operating strategies? S
* What are their strengths and weaknesses with respect tomarket coverage and carriage of key commodities onspecific rivers?
e What has changed over time? S
There are also numerous qualitative issues. Each competi-tor's fleet profile can help answer the questions below:
* What are the capabilities and financial shape of thecompetitor's fleet? S
* Does the competitor's fleet tend to specialize?
* Does it employ significant scale economies?
* What is its relative market position?
111-8
Figure 111-4
BARGE LINL 1982 REVENUES AND EMPLOYEE COUNT1
Parent $ RevenueCompany Company (millions) Employees
TGT American Commercial Barge 441 1,200EGFA Midland 151 1,400Dravo Dravo Mechling 67 600CLC Wisconsin Barge Line 67 600FCB Twin City Barge 60 400Kirby Dixie Carriers 59 400HNG Federal Barge Line 59 500Agri-Trans Agri-Trans 57 400Chromalloy Valley Line 52 800Crounse Crounse 36 400U.S. Steel Ohio Barge Line 56 400
Consolidated Grain & Barge 26 700Sioux City New Orleans 26 200
Nicor National Marine Service 26 400U.S. Steel Warrior & Gulf Navigation 21 700
Houston Barge Lines Inc. 14 500Hines Hines Inc. 10 100Igert Igert 10 100Ingram Ingram 10 100Exxon Exxon Inland B 500
Walker Towing 7 100Choctaw Towing 5 100
£Gladders 5 100Chemical Towing 4 100Waxler Towing 4 100
1TBS analysis.

I
111-9
.- = I%. C O'r. 4 ~~Cq~N 'Co N.IN W 1.P. 'C ,-r--int- 1
4-
a
Cr-s't' 'C ~ CNC - .1%~r.or-. f ~~.i%4 -'
~ N- N P%~NN.-. ~% C
-t -~ - S
C .- S.
* - S
* N~N~"'4O' 4 -~& ~ in So ~ &
S
I* .5 a, ~ .5
~ -~ - . aa- -SO i..a >... a 0.5.
5-0~ S'.L SW 03~SO~ - RC a
'-0o u SC.a UOa03S US ~EC
C0 50a SLLC* 3.. r - &
0~ 0~5.5-
-m NNCNQL - .055* ~r.'C,
* aqaqataqin -'- S S )- ~ *..I.
- 0 C~--~ i * a .- CI- S U
.c 0'~N~i N 'CC '- ~'~ ~ -
C 'CC - S U s* U a
N ~ - S SLiiN~OLN.iO ~ U,
'C C - pN
0~: a ~ U= -
0~
C U a
2'S 5.
I, --- U C
a -0
IE~ SO~'- ~.
-5'0-~ - U SOS
5.S -
r ~5-rn OLi'CNt.'CCOr. Co r-r-'Cr-r-r-'-r
S 4~
C - 0 aC 'CLi'O O'N0NC C -
~ 'C0'CC 40 C'N N 4
U. *~ --
N'C. 'C -
~ ~ ~' in
M a
* t 5.. Li,S. V =
t ~ .~ UC2' U S -- U ~ 0
- 5 a So p s.o~~I .~ U
-~ ~ s--. ~ 5.0'~ 60 0 05..440 U5.JUUU.0.

111-10
cn
LU
- z w
o 0 0
0 0 a I
LU,
4 Cz
(6 a
0 aZu. 4w 0 wC
I J2 m > > c
C),L
z! I , ~>o u~O~ 0£, 0 <
I-00 Cw.L
*i -JC)0 raCczwL
z U. < ui a C/)
LU > U ccw u(
2 ~~ <
. cc 0 cc

3 1
liI-h
V x
IIII
oto
U, - N
L 7
z .- •--
4 0
111-12
III-
4- 0 What is its relative siz
J D e On what bases does it trU -time, frequency of barge
< handling capabilities, s
Z - * Does it possess significintegration?
< L
e Is it well managed? Wha
P What improvements should
* If a competitor is a subwhat is its relationship
- cant resources availablez is it likely to play inzII parent?
o "Because of their regular contm- sales personnel can provide good i
N and behavior. Appendix E contains.. ,market survey that may prove usefu
N comparing a company's services wit
0 wcc
Cn
0 wi
W
0
Mz>, >-L- .- w...
0 <,,,. , .
Lu LU . -
_z0 ""
-----------------------------------------------------------------------------------
I S
IV. MARKET ANALYSIS
* In the context of strategic planning, the aim of marketanalysis is to develop an understanding of the factors underlyingthe demand for transportation services within specific marketareas in order that a soundly based projection of demand may bemade several years into the future. Because of the complex na-ture of waterborne commerce, this is not an easy task. However,based on several years of experience in market analysis and fore-casting, we have set out below the elements of one representative 0methodology that first identifies the key factors influencing thetraffic on the waterways and then, projecting those factors, pro-duces a forecast of waterborne commerce. The projected demandfor barge services, in turn, is derived from the projected demandfor barge cargoes.
THE NEED FOR FORECASTING MARKETS
All industries rely on forecasts to guide their decision-making process. Implicitly or explicitly, managers accept cer-tain basic operating conditions as the foundation on which theirlong term, annual, seasonal, and daily plans and directions aremade. The implicit use of forecasting can, by default, rely on acontinuation of the prevailing market and industry trends. Theseforecasts may include increasing, decreasing, or stable trends indemand and supply for services. Explicit reliance on forecastingcan be as basic in concept as managements acceptance that theeconomy or an industry's level of activity will change by somepercentage on a year to year, or more frequent, basis.
The nature of inland waterways transportation makes the useof forecasts critical for both tactical and strategic decision-making. This is in large part due to the industry's role intransporting basic, raw, and semi-finished commodities whosevalues fluctuate on a daily and seasonally in response to major
* national and international market forces. For this reason, car-riers have learned to make decisions based on seasonal assump-tions of freight rates, cargo availability, operating conditions,
* costs, and competitive behavior. They have also explicitly orimplicitly used forecasts to support decisions to acquire orcommit for long term utilization of marine equipment.
The inland waterways industry's reliance on forecasts iscomparable to the ocean marine industry's reliance on forecasts S

IV-2
with one major exception. The more diverse and internationalocean bulk marine transportation industry has fostered a varietyof information sources such as magazines, broker services, andeconomic projections of ocean trade. Since the current depres-sion of the international bulk markets began, the number andimportance of these forecasts has increased. By contrast, theinland waterways industry has tended to rely on sporadic fore-casts that have been funded in whole or in part by governmentagencies. The forecasts made for this manual are included inthis category. The industry has thus far not found it necessaryto develop a public forum to discuss and present forecasts on aregular and consistent basis through commercial initiatives or adeliberate industry program.
It has been the practice of major inland carriers to performsome forecasting as part of their corporate planning responsibil-ities. However, these forecasts remain confidential and have notbeen widely disclosed to the industry. Since the forecasts canbe an important competitive tool, there are many reasons to keepthem confidential. On the other hand, forecasts can serve asimportant indicators for the industry to confront and discuss thekey issues of supply and demand that will impact the profitabil-ity of the industry as a whole. It is hoped that in the prevail-ing market environment the analysis of supply and demand by car-riers in industry forums will be more and more frequent and thatthe quality of these forecasts will thus improve.
MARKET DEFINITION
The first step is to define the markets that barge operatorsserve. Markets are defined by the geographical areas served andthe commodities carried. An alternative method for definitioncould be by geographical areas and barge types used. This ap-proach is more useful for operational planning than for marketanalysis because it can mask the driving factors that affect thedemand for barge services for each commodity. The preferredapproach is to deal with commodities and then aggregate them intocommodity categories that match equipment needs such as covereddry bulk, open dry bulk, clean petroleum products, dirty petrol-eum products, deck cargoes, and special loads such as oversizeand overweight, temperature-controlled, or pressure-controlled.
However, too much refinement of the commodity types willlead to too many classifications, which will be more difficult tomanage. Each company must decide for itself how to classify itsown traffic to provide meaningful categories that are detailedenough but also manageable. A barge operator that specializes in
* .. . . . . . .. . . . . . . . . . . . . . . . . . .

IV-3
clean petroleum products and chemicals may desire to use very
specific chemical types to keep track of and make forecasts ofthose cargoes. A large multi-service operator may consider allof the chemicals as one market segment.
* The geographical areas where the barges are loaded and dis-charged are also part of the definition of markets. Coal that 0originates and terminates on the Ohio River or its tributaries iscertainly not in the same market as coal that originates in thatarea but is delivered to a utility on the Gulf IntracoastalWaterway.
The analyst must not lose sight of the true origins and Bdestinations of these commodities in the analysis of market de-mand. To do so would prevent complete understanding of the fac-tors that determine why the cargoes move over the waterways. Itis important to consider the ultimate origins and destinations tosee what are the underlying causes for historical and futuredemands in transportation of the commodity. In addition, alter- Bnative modes of transportation may be available closer to theorigin or destination of the movement. For example, knowledge ofinland rail terminals and rail rates is important for the under-standing of barge lines' competitors for movements of Illinois
5corn to export terminals at the Gulf of Mexico. On the otherhand, Knowledge of Far East destinations along with rail and ship "rates is useful to understand the westward movements of grain byrailroad out of Nebraska instead of southward by barge on theMissouri River.
Finally, the analyst should limit forecasting activities tothat portion of the overall market that the company can activelyserve.
METHODOLOGY SELECTION
The methodology for developing forecasts of industry demandfor barge transportation should be accurate, useful, and easilyproduced. Each of these characteristics is discussed below.
Accuracy 0
Itis impossible to develop exact forecasts of future cargodemand for inland waterway transportation. Contrary to the popu-lar conception of forecasts, they do not, and should not beexpected to, portray the future precisely. Their primary purposeis to preserve for future review a company's best thinking about Bthose conditions in the future that can affect its performance
°S
... o

IV-4
and its operating environment. In this way the decisions made bysome managers can be understood by all and the insight that isgained by managers over time can be used to enhance the operatingstrategy and tactics of the company. There is a strong need tohave an explicit record of what the company expects in the futurewhen important decisions such as long term investments inequipment are made.
It is possible, however, to develop a forecasting methodol-ogy that will identify directions and turning points in trendsfor demand. No forecasting methodology can anticipate any crit-ical disruptions in demand that are caused by recession, naturaldisaster, or sudden market shifts due to, for example, an oilimport or grain export embargo. The goal of the methodologydescribed herein is to provide a reasonably accurate advancewarning of the future impacts of current events and policies thatwill affect the demand for barge transportation.
Useful Format
The forecasts should be in a form that is useful to thebarge line executive when he is making short- and long-term deci-sions concerning marketing and sales efforts as well as equipmentdecisions on acquisitions, maintenance, deployments, scheduling,and disposals. This means that the forecasts should focus on thespecific waterways and commodity types that the company desiresto serve.
The most useful forecasts are those that can be relatedreadily and directly to the current and historical market. Thispermits forecast users to relate the predicted future trends topast conditions in as meaningful a way as possible. The closerelationship of historical data and forecast data also permitsusers to corroborate, evaluate, and calibrate changes in outlookswith the greatest confidence.
Ease of Production
Ease in producing the forecasts is important if the meth-odology is to become a practical tool for decision making. Fore-casting methodologies should be easy enough so that an employeewith a bachelors degree in engineering or accounting can maintainthe system. However, ease of operation requires that a tradeoffbe made with accuracy. The more sophisticated traffic forecaststhat have been developed in the past by government agencies orconsultants have used various forms of regression analysis. Useof this type of econometric technique generally requires a levelof knowledge that is obtained from graduate degree programs.This capability is infrequently available in an inland bargecompany.
* . * . .. . . . . . .. . . . 7 * ~ . * * . ,

IV-5
The methodologies used in these forecasts of river trafficrelates economic forecasts to historical parameters that arederived from past traffic levels. A number of economic forecast-ing firms such as Data Resources, Inc. (DRI), Chase Econometrics,Inc., and Wharton Econometric Forecasting Association, Inc., pro-vide general and industry-specific time series of production andprice information on a consistent basis to the public. Usingthese resources, barge industry managers can relate their indus-try to the best thinking and effort of economists who are con-cerned with broad economic trends that directly and indirectlyaffect the inland industry. Barge industry managers can concen-trate on that which they know best and can rely on the cumulativeexpertise and continuous involvement of economists in the fore-casting of national, international, and industrial trends.Wherever there are specific commodities that are particularlyimportant to a carrier, these forecasts can be modified toreflect other available information about those commodities.
It is important that carriers recognize that their specificbusinesses are driven by specific customer, industrial, competi-tive, regional, and regulatory issues. In order to perform aswell as possible, management should take the time to plan andexplore the major trends and factors that affect their business.For example, carriers engaged in the transportation of grain mustwork hard to identify those issues that most affect their busi-
* . ness, their customers, and their competitors and should attemptto find information that bears out their general knowledge of themarketplace. In this way the quality of long-term decision-mak-ing can enhance short-term performance. Without this informationthe quality of short-term performance will be driven only byshort-term knowledge.
THE BASIS FOR FORECASTING
- Inland waterways forecasts should be performed in a way thatis efficient for managers to operate. Its users should guide itsdevelopment. The first use of a forecast is to identify the mostfundamental industry conditions that will prevail. For more thana decade a valuable forecast would have predicted dramatic growthin grain cargoes and stagnation in the petroleum liquid cargotrades. It would have helped identify gradual long-term growthin coal exports.
The fundamental challenge in forecasting is to predict thebehavior of those indicators that are most important to a speci-fic manager. In the case of inland waterways traffic, the keyneeds are the prediction of tons and ton-miles for the commodi-
. ties that drive overall industry conditions and the specific
. . . ]

IV-6
commodities of concern to an individual carrier. The predictioncf trade is most often accurately explained by trends in broaderindustrial indicators that depend on or use to some degree inlandwaterways transportation. Because grain, coal, aggregates, andpetroleum are by far the main bulk of inland waterway traffic,the planner can rely on their performance to forecast industrytrends. He can then predict the behavior of other commodities bytagging their performance to the major commodities.
The most pressing question facing managers today is: whencan managers expect conditions to support an increase in rates,revenues, and contribution to fixed costs? In order to do this,forecasts of tons must be translated into forecasts of ton-miles.
Ton-miles serve as the industry's basic measurement oftransportation demand. Ton-miles more closely describe bargedemand than any other readily available measure. Tons of trafficreflect the economic and industrial conditions of shippers andconsignees. To calculate ton-miles from tons, average lengths ofhaul must be determined and multiplied by the tonnage. This datacan be developed from public sources and our forecasts demon-strate how this can be done.
To the extent that the nature of various trades remainsrelatively constant, and for short periods of time and smallvariations in tonnage, tons can serve as a useful indicator oftransportation demand. However, if growth or decline in a tradeis based on significant swings in the amount of cargo trafficthat differ widely from the average, these swings should be re-cognized. For example, the high levels of coal exports from up-river terminals to Baton Rouge and New Orleans represent a verydifferent kind of coal trade than the relatively short-haul coalmovements that serve Ohio River utilities. For this reason, aforecast of sharp decreases or increases in export coal tonnageshould carry with it a corresponding recognition that this is avery large change in transportation demand as measured in ton-miles. Similarly, a forecaster might predict that a dramaticincrease in soybean exports, which tend to load at the LowerRiver terminals, will account for the majority of grain trafficgrowth. This will result in relatively fewer additional ton-miles than the increases that would be derived from a similaramount of wheat from river terminals that are located much fur-ther north.
In some cases the historical relationship between industrytrends and inland waterways traffic will be close. When thisoccurs there is a strong suggestion that the factors of commoditysubstitution and modal shifts between barge, rail, pipeline,truck or alternative ports are minimal and that the inland indus-try experiences in a direct way the trends of the shipping indus-
S1

IV-7
try. In other cases the industry trends and the waterways traf-fic levels diverge or have changed in time. When this occurs theanalyst must recognize that that creates a strong suggestion thatadditional factors such as substitution, modal shifts, or alter-native routing are at play and will significantly affect thefuture demand for inland waterways transportation in ways that do 0not directly parallel the industry's prospects.
An inland waterways forecaster must also use his industryintelligence to recognize discreet one-time changes in trafficthat can result from the completion of new industrial projects orevents of a legislative or regulatory nature that alter trade 0levels dramatically in a very short period. Specific examples ofevents and trends that affect the inland barge industry are iden-tified below:
* The completion of coal-fired electric utility plantsin tie Florida panhandle and Tampa areas that rely on 0barge-delivered coal.
e The deregulation of U.S. crude oil prices whichaltered the production, trading, and import patternsfor many Gulf Coast refiners and contributed to theelimination of many small entitlement refiners.
e The prospect of imports of Columbian coal to coastalutilities, such as those located in Florida.
e The completion of petroleum products pipelines thatreduce the refiners' reliance on the barge system. S
e Crude oil price deregulation in residual oil refining,which has reduced the amount of black oil produced inthe lower Mississippi River refining area and there-fore its transportation requirements on the riversystem. 0
FORECAST STRUCTURE
The relationships between historical and future industry 0trends and historical and future inland waterways traffic can bereviewed in several ways. These range from sophisticated andrigorous mathematical regressions of one trend against the otherto a graphical review of these indicators and qualitative deci-sions as to their future trends. For the purposes of this fore-cast, a simple, mathematical relationship. The mathematical 0relationship between the indicator and the traffic level that is Jidentified by dividing traffic level in tons by the indicator in
0

IV-8
an appropriate index was used because it is simple, does notrequire significant investments in software and intepretationtime by managers, and provides reasonably accurate assessmentsand indications of trade/industry relationships. For many com-modities in this forecast, the actual mathematical relationshipsalong with the trade levels and industry indicators are pres-ented. In this way, analysts who review these forecasts shouldbe able to understand the trends and processes used to developthese forecasts.
The forecast that has been prepared for this study is di-vided into ten major commodity groups. These groups have beendesigned to provide analysts with insights into the developmentsin the major forehaul and backhaul dry bulk, liquid bulk, andgeneral cargo commodities. To the maximum extent possible, thesecommodity groups have been assembled in a way that grouped drybulk, liquid bulk and general cargoes into separate categories.The commodity groups that have been developed are as follows:
* Major agricultural products--including corn, wheat,soybeans, prepared animal feeds, and grain millproducts
e Coal
o Crude oil
9 Clean petroleum products--including gasoline, jetfuel, distillate, kerosene, lube oils and greases,naptha, solvents, and liquified gases
* Dirty petroleum products--including residual oil,asphalt, tar and pitch, crude tar oil, and gases
* Construction materials--including cement, limestone,sand, stone, gravel, and crushed shell
e Major fertilizers--including phosphate rock, nitro-genous chemical fertilizers, fertilizers and mate-rials, n.e.c., and lime
o Chemicals and aromatics--including sodium hydroxide,alcohol, benzine, toluene, basic chemicals, andproducts
e Waterway improvement materials
* All other commodities
." .

IV-9
I.These groupings ar3 sufficiently detailed to provide an
overview of industry prospects and focus attention on the keycommodities that underly basic supply/demand balances.
TRAFFIC FORECASTS
Figure IV-l provides an overview of historical and forecasttraffic for the 1970-1990 period for the Mississippi River Sys-tem. Historical data for the years 1970-1982 is provided by theU.S. Army Corps of Engineers Waterborne Commerce of the UnitedStates Statistics. The years 1983-1990 present forecasts pre-pared for the study using methodology that is discussed in detailbelow.
It can be seen in Figure IV-I that historical traffic peakedin 1979 at 370.8 million short-tons and declined 6.3 percent by1982. The forecast indicates that 1982 will represent the lowpoint in Mississippi River System traffic. It will be followedby a period of slow growth toward traffic levels that will exceedthe 1979 peak by 1986. Overall, a 12.6 percent growth is proj-ected between the 1982 tonnage figure and the 1990 forecast of391.4 million tons. The growth between the 1979 peak and 1990forecast is 5.6 percent. This projected slow growt reflects thelong-term limitations on the growth of agricultural and coaltraffic based on forecasts of nationwide agricultural and coalexports. The grain forecast is based on an expected decrease ofthe barge share of total U.S. grain exports via Mississippi Riverports to 42 percent in 1990. If the 1983 barge share of 50 per-cent is maintained through 1990, the total Mississippi RiverSystem tons will grow to 407.4 million tons.
This figure shows that growth is projected largely becauseof slight increases in coal, construction material, fertilizer,chemical, and miscellaneous commodity activity. Growth is likelyto be broadly based, unlike the major increases in agriculturalproducts and coal that characterized the 1970s. This forecastreflects the current conditions in world energy supply, the in-creasingly competitive international market due to the strongU.S. dollar, and continued foreign impediments to American com-merce.
Figure IV-2 summarizes historical and forecast traffic forthe Gulf Intracoastal Waterway. The table shows that traffic hasgenerally fluctuated between 95 and 105 million tons between 1970and 1982 having reached its high in 1972 at 108 million tons andits low in 1982 with 81 million tons. The forecast for the 1983through 1990 period shows a relatively steady level of traffic
, . .. . . ..-

* .
I: a
i~0' C
CL.
0 00 0 - 0
IL 00 0
U0 0 6 .1
1.:: 0U8 No
a 0LI (PI --4 4c o cc0a
- I
- 0 0 10 S
- -- - - - Sal

'V-11
CD"0-C0"7
-E
n
M~ S C C iC : 9 9 - 1
-m
E0a)z
2Su
00
z
c-i
U CL
c-x~ 00
= - M
C-C
0' 0
oa -0s-
C)C
=c
0 0U)2
- C -~e.cJ-J'(. -, 9
-~ r - -~ r- -r r- r-- w~ m i w~ w m ms m0 a,a, U

IV-12
below 90 million tons. Declines or stagnation in crude oil,petroleum products, construction materials, coke, minerals, andchemicals traffic will offset the slight growth in coal and allother commodities.
These forecasts of future traffic have been developed interms of tons because the detailed data that is needed to gener-ate the forecasts is recorded and published in tons by the Corpsof Engineers.
Ton-miles are a more effective measure of demand becausethey are more closely related to the utilization of the towingequipment. The Corps of Engineers reports limited informationabout ton-miles statistics. In Part 5 of the annual WaterborneCommerce of the United States, ton-miles and average lengths ofhaul are shown for groupings of major commodities. These can beused to develop general measures of ton-miles from the detailed
* ton data described above. Figure IV-3 shows both historical andforecast average lengths of haul for major commodity groupings.The forecast is based on no major shifts in the lengths of haulduring the 1980's. Note that the data are for internal traffic,which includes the Columbia/Snake River System and coastalrivers. This national average will slightly undetstate midwes-tern transit distances, but is a reasonable measure for the Mis-sissippi River System and the Gulf Intracoastal Waterway.
The ton data are then aggregated in Figure IV-4 into thesame commodity group categories as the lengths of haul inFigure IV-3. The ton-mile products of these columns are dis-played in Figure IV-5 to provide the historical and forecasttraffic in terms of the ton-mile measure of utilization. Theresults of this methodology were compared with the total familiesreported by the Corps of Engineers during the period 1970 to1982. The calculated totals each year were within three percentof the reported totals.
EQUIPMENT FORECASTS
Equally important for the understanding of the inland bargemarket is the need for information describing the supply ofequipment. Historical information has been collected from theCorps of Engineers' Waterborne Commerce Statistical Center totabulate the number and capacity of towboats and barges operatingon the Mississippi River System and the Gulf Intracoastal Water-way. Forecasts of fleet size and capacity were made through the1980's. The data are presented in Figure IV-6.
[,0 .

13
:IIx
IV-3 Figur
TRAFFICA
FORECAST MISSISSIPPI RIVER SYSTEM ANSULF INTRACOASTAL WATERWAY
1
Sin miles) (millions a
TotalConstruction Mississippi Major Cand Waterway Chemicals All River System Agriculture Coal and &Improvement and Other Year and GIWW Products Coke PMaterials Fertilizer Commodities
69 704 514 1970 396.5 23.9 104.2 172 712 539 1971 408.4 23.9 100.0 173 670 520 1972 434.7 30.9 114.0 172 658 487 1973 417.7 32.2 109.0 1
76 695 515 1974 433.1 35.6 112.0 1
71 721 511 1975 426.5 39.4 120.6 1
83 719 532 1976 442.0 44.8 121.7 1.92 733 540 1977 456.8 46.7 122.6 1109 729 578 1978 456.8 51.9 110.7 1109 729 57 1979 469.4 54.8 127.2 1
124 721 610 1980 459.8 64.3 129.3 1:109 720 573 1981 452.9 66.3 136.5 1106 705 591 1982 428.1 73.8 126.2 1
110 720 580 1983F 437.5 73.1 125.1 11110 720 580 1984F 449.8 70.2 128.2 11110 720 580 1985F 454.1 71.6 127.9 11110 720 580 1986F 460.4 72.5 129.4110 720 1987F 472.5 75.7 130.4110 720 580 1988F 483.2 79.3 131.5110 720 580 1989F 476.3 80.8 132.5110 720 580 1190F 478.8 82.9 133.6
1 110 720 580 ______________
ludes Columbia/Snake River System and F = ForecastedI GIWW traffic. Source: U.S. Army Corps of Engineers, Waterborne
borne Commerce of the United States, Part 5.
• . . .. *.

IV-15
Figure IV-5
IRAFFIC AND FORECAST 0MISSISSIPPI RIVER SYSTEM AND GULF INTRACOASTAL WATERWAY
(billions of ton-miles)
Total Construction SMississippi Major Crude Oil and Waterway Chemicals AllRiver System Agriculture Coal and $ Petroleum Improvement and Other
Year and GIWW Products Coke Products Materials Fertilizers Commodities
1970 158.6 26.1 26.5 35.8 4.5 19.8 25.91971 146.7 25.6 26.4 40.4 4.9 20.8 28.61972 161.6 34.6 32.1 39.3 4.7 22.4 28.51973 153.0 38.6 29.3 35.4 4.8 20.3 24.61974 167.8 42.0 31.4 36.0 5.2 20.0 33.21975 166.6 44.5 34.7 34.8 4.2 22.1 26.31976 177.7 49.9 33.6 36.7 4.6 23.0 29.91977 188.8 52.4 36.3 39.4 5.3 25.4 30.01978 195.2 57.3 33.3 38.5 6.9 27.0 32.21979 206.1 61.8 42.1 36.6 7.5 28.9 29.2 01980 217.6 72.0 45.6 32.8 6.4 28.2 32.61981 219.5 71.6 56.4 29.5 4.9 26.6 30.51982 204.6 78.1 47.2 27.6 4.6 22.6 24.51983F 211.6 80.4 43.8 27.0 5.4 25.0 30.01984F 215.4 77.2 44.9 26.7 5.9 27.3 33.41985F 219.0 78.8 44.8 26.3 6.0 28.6 34.51986F 222.2 79.8 45.3 25.9 6.2 29.6 35.41987F 229.7 83.3 45.6 25.6 6.6 31.6 37.01988F 238.2 87.2 46.0 25.3 6.7 34.1 38.91989F 237.1 88.9 46.4 25.0 6.2 32.5 38.11990F 238.9 91.2 46.8 24.7 6.3 31.8 38.1
Source: Figure IV-3 and IV-4. 0
_0
r- .- - - - = . . + ~ - - - ..- . o . .. . - . - o- - . .. . . "- . .' . . . .~ " o. o- - - - .. . ° .j o. +. - -. + -. - ,.-0 -

IV-16
d) >1 C
0 0
0L) 0
0 -0OY' mt0o m~~O - O oo mOO
9. > : PN"Mo 0 .-. 1 cOC I O JO omoo
cc - 4201 .
0 00^ cr r o T06I- CLJ0
w m. 0 1
ui Z NV 0C -wG oc oc cc oc4c~
3 0
0 %0 Ch er%*Co l l l m0 0~
41. UO * mr k O r,' . Nu u
> CL W>0.-- --- ---. -
0 -C a
cc 07 0 UNaUN% -0 00 000o 0 %.. 0(u-% 0.JP" 0" 0ro00 0
4.. 0Z OD r-4. - U. O0LN0^00C %000000M0~- 4i00--
a) E C. 0 I Nc l -c 0 *I I 1 * 0
V) 4- Ln
o o
zCL u
00 4..
m X 4.. 0.4 14' r- tl"d% w 61%~ Vf W4.. a-nc 3 I nC4I Tl r ,r ,r l ,r 001^ , .0
a. *A 0 ...J ~ < NU\U 'SW \LNW L NW
0 3C
C r,-_ \V NFN0 _ c0000a,0r
W %-%06NW Y\C 0N\ :rC00 0 rrr
0 .. 0. . . . . . . . . .4 U.4'~ . 0. ..0 00 CL U I r! O ^0 - 11 ^LNV ~QW CM
3 1^ " r- " - ps 0coc or-C 7
0 004
0. u- .C
00 a 0 X
-:c -C ! U* L. )a)c
r.~~~~ ~ ~ ~ r- 0l U...1>r c o o ocoEocoO>- 4.. 0 U 0 W0

" - -- . -. - k -- -. . - . . f . _r . _ < _r . _ .-. '- - - - -
IV-17
The towboat fleet will probably remain at current capacity Sfor the next few years until traffic recovers sufficiently to useup current excess capacity. It is estimated that the fleet willnot expand until 1987, unless there is a significant jump inutilization prior to that year. This could be brought aboutthrougn a major foreign grain crop failure or other disruption tonormal transportation flows. The average horsepower of the tow-boat fleet will be reduced over time as operators adjust theirequipment to economical fuel operations and replace overpoweredboats with vessels using smaller engines.
Dry hopper barges are currently in excess supply. Demandfor their services is expected to increase over the next six Byears. This will primarily be driven by traffic increases incoal, grain, fertilizer, sand and gravel, and coal. The currentexcess capacity will slowly be eliminated as open and coveredhopper barges are used more intensively through the decade.
Tank barges are also in excess. There will also be changes 0in cargoes carried during the 1980's as less crude oil and morepetroleum products and petrochemicls are moved over longer dis-tances. This will improve the utilization of the tank bargefleet but will not support increases in the number of tankbarges.
In all of the above fleets, there will be some specializedconstruction during the 1980 's, but most of this expansion infleet size will be compensated with selective scrappings andcasualty losses.
MAINTENANCE OF THE FORECASTING SYSTEM
The forecasts of the inland waterways can be updated asnecessary by industry analysts. Actual historical data willbecome available only once per year and it is reasonable to ex- Spect that a review of the overall forecast validity would beaccomplished at least once per year. However, the forecast canbe modified for any commodity, at any time, formally or informal-ly, and will continue to be a useful reference for managers.Industries where data is more timely, such as the grain or coalindustry, can update their data more frequently. 5
S .
.S-
V. OTHER EWIRONKENTAL FACTORS
kThe strategic analysis of the barge line's internal andexternal environments should not be restricted to examining themarket demand for barge services and the availability of com-peting equipment. In order to develop a comprehensive projectionof the firm's operating environment, the analysis should includean examination of the current situation and possible changes inthe legal and regulatory environment, physical characteristics ofthe waterway, new technology, availability of necessary re- Ssources, and activities of competing transportation modes.
LEGAL AND REGULATORY ENVIRONMENT
A planner must analyze the present and projected legal andregulatory environment of the inland barge industry. Congres-sional and regulatory activity can make a big impact, particu-larly from the following federal agencies:
o Department of Transportation (DOT)
9 U.S. Maritime Administration (MarAd)
o U.S. Coast Guard (USCG)
* National Transportation Safety Board (NTSB)
* Department of Labor (DOL)
e Occupational Safety and Health Administration (OSHA)
o U.S. Army Corps of Engineers (CofE)
e Department of Justice (DOJ)
a Department of Agriculture (USDA)
e Environmental Protection Agency (EPA) 0
e Interstate Commerce Commission (ICC)
* Federal Maritime Commission (FMC)
° i :iS
: 2 1 " " -. -- -i i i --..' -i .- -i ' i --. i , -~ -i '- - i - .' --' i " -- -'i .i .-. . ..i -. i .i -.. .. -: -. ' --. .- 'i " -. . -.-" i - .- .' .-/ .. -.. --' i i~S.

V-2
Through their taxing and spending powers, as well as by changing 5laws and regulations governing barges, other forms of transporta-tion, and shipping customers, other segments of the federal gov-ernment, such as the Office of Management and Budget (OMB) andvarious committees of the Senate and House of Representatives,directly affect the industry.
A feel for the relevant developing issues allows the bargeline to adopt an action-oriented goal of trying to obtain favor-able legal and regulatory changes. Small operators have beenable to expand their effectiveness by joining industry associa-tions on both a long-term basis and for specific threateningissues. Some effective barge industry associations include: theNational Waterways Conference, Inc., the American Waterways Oper-ators, Inc., and the Water Transport Association. In addition totheir lobbying and public information activities, each organiza-tion publishes a member newsletter that collects and distributesuseful informaticn.
In addition to federal activities, barge lines are affectedby state and local governments. These governments can increasecosts and restrictions through zoning, taxation, permitting foruse, and eminent domain. On the other hand, these governmentalactivities can encourage and support economic development whenstate and local policymakers perceive that inland river transpor-tation is economically beneficial.
The strategic planner should assess the likely direction ofall regulatory and legislative programs. Examples of issues tolook out for include the following:
o Waterway user charges
o Port user charges
o Fleeting regulations
o Channel and lock improvements
o Regional development programs
o Economic regulation of all domestic modes of transpor-tation 5
o Safety and environmental regulations
o Agricultural subsidy and export programs
o Embargoes on international trade 5
. . .-... ..........

V-3
e Energy programs affecting coal and petroleum transpor-
tation
* Tax policy
Each policy area can affect the cost structure of towing opera-tions or the market demand for towing services.
One example of the regulatory impact on costs is a CoastGuard consideration of requireme.its to eliminate single-hull tankbarges. The towing industry showed that this proposed regulationwould require $2.8 billion in additional capital and operatingcosts. Other industry-generated information showed that theproposed regulation would reduce pollution only slightly. As aresult, the Coast Guard modified the proposal extensively. Asanother example, four successive embargos on export grain ship-ments severly reduced the demand for southbound covered hopperservices.
PHYSICAL CHARACTERISTICSOF THE WATERWAYS,
The conditions of the various waterways should be monitoredfor both short-term operational needs and for longer term marketimpact. In the first case, delays caused by high or low water,lock maintenance, or vessel casualties detrimentally affect theflow of traffic on a waterway. For the longer term, the occur-rence affects decisions by shippers on preferred shipping originsor destinations, modal choices, or terminal locations. For in-stance, a shipper who has frequent problems with delivery inter-ruptions due to ice on the Illinois Waterway may decide to locatehis next plant further south on the upper Mississippi nearSt. Louis. A choice such as this lessens the aggregate demandfor barge services on specific waterways. Of course, improve-ments in the physical characteristics of waterways (such as a newdam with expanded lock capacity at Locks and Dam 26 on the upperMississippi or the waterway connecting the Tennessee and Tombig-bee Rivers) expand the demand for barge services or create en-
*tirely new markets.
The strategic planner should always be aware of river condi-tions and should attempt to acquire additional information fromexisting and potential shippers to gauge the potential impact onthe demand for the barge line's and its competitors' services.
.

V-4
NEW TECHNOLOGY
With the availability of new technology to improve towboatand barge design and operations, it is important that the strate-gic planner takes these changes into account. However, decidingto use new technology cannot be done on an engineering basisalone. The planner should consider the context of the entireoperation's cost profile, including manning levels and otheroperating and maintenance expenses. Thus, an investment in moreefficient engines that burn lower cost, higher viscosity oil mustbe made at the appropriate time for retrofitting older towboatsor building new vessels.
Advancements in materials handling technology often makesbarges for special cargoes obsolete. One example was the shiftfrom dry sulphur to liquid sulphur loadings. Another was theintroduction of pneumatic cement barges. New barge designs cangive the company a strategic advantage if investments are madeearly when the technology is still new. Although this can pre-clude competitors from making similar investments if they canidentify the market's limited size, it can be risky, since thisindustry has a recent history of overinvesting in equipment.
BARGE LINE RESOURCES
Planning for the economical operation of the barge linerequires an understanding of the markets for resources that thecompany uses. These resources can be grouped as follows:
* Barge and towboat equipment
0 Labor
e Equipment supplies and maintenance
e Fuel
e Port services
Each category includes a number of elements that affect the costand availability of the company's barge and towing services.
0I
S

V-5
Equipment 0
The availability and costs of barges and towboats are themajor considerations affecting the decision for bidding on anybarge traffic. This factor applies to operating costs in theshort term when comparing the company's equipment to that avail-able to competitors. For a longer term, a company can decide tooffer its own equipment or it can go after the business when nocompany-controlled equipment is available. It can choose tocharter, lease, or otherwise contract for outside vessels for theoperation. This decision can be made for both barges and tow-boats. In the case of towboats, the power necessary for the movecan usually be divided between the linehaul portion and the pick- Bup or delivery portions. In some cases, it will be more economi-cal to contract out part of the move to another carrier or tocontract in equipment that is more suitable and efficient.
Labor B
The labor rates and availability of personnel used to oper-ate the towboats is an important component of vessel operationscosts. At present, there is an oversupply because of the currentdownturn in the industry. Therefore, labor cost reduction is nowpossible. The availability of good management talent at competi-tive prices is also important. A new emphasis on innovativemarketing and implementing information and planning systems hascreated a demand for new executive talent.
Equipment Supplies Uand Maintenance
Equipment supplies and vessel maintenance absorb a largepart of the operating costs of the company's vessels. Plannersmust decide how to preposition critical parts, inventory levels,and whether to use in-house or contract personnel and facilitiesto service and maintain the floating equipment. For the use ofoutside vendors, it is important to identify high-cost regionswhere limited competition exists. Operating and maintenance andrepair policies should be established to minimize these costs.Important tradeoffs are often made between higher M&R costs andhigher revenues received from traffic that can prove more harmful Bto the equipment, operating personnel, or the public. These arenot always apparent, but often involve analyses of potentialrisks. For example, many barge lines hesitate to enter chemicaland petroleum trades due to the higher costs and risks involved.On the other hand, other barge lines have been financially suc-cessful specializing in these fields. Thus, it's important to Bknow the costs and understand the risks that are associated withtargeted markets.
zt.. .[ ,u _-._. _.? . . j . - • ° . "•. "- .- ". .. .. o /-I o [ S

V-6
Fuel
Fuel availability has been a problem in the past. Exceptfor those towboats operating on heavier blends of diesel oil,there are now numerous places to buy fuel at market prices.However, a number of barge lines have considered developinghedges against fuel price fluctuations and shortages by enteringthe futures market. This can provide stability to permit morecareful planning of costs for future operations.
Port Services
Port services include fleeting, shifting, cleaning, load-ing/unloading, and other miscellaneous tasks such as dewateringand steam heating. A similar decision process to that for M&Rservices can be used to determine which of these activitiesshould be done in-house and which through vendors. This is prin-cipally determined by location, volume of use, frequency of need,and cost Pnd availability of outside vendors. Since these costsare often a large proportion of the total movement cost, it isimportant to have accurate cost accounting systems for both in-ternal and external expenditures.
* *** *
In summary, the planner should know the company's resourcerequirements. Information should be assembled about the avail-ability and costs of resources both in the company and the mar-ketplace. By tracking these resource costs and using them appro-priately vis-a- vis the company's objectives, the planner canmake better strategic decisions. For example, if the company isa low cost linehaul operator, it should be careful in assessingthe development of cost centers in the company to provide ancil-lary services. On the other hand, if the company emphasizes thequality of its service and needs to use in-house resources tomaintain a guaranteed standard, then its objective is different.In either case, the planner needs to understand the dynamics ofthe resource markets to intelligently analyze these options.
OTHER MODAL ACTIVITIES
Barge lines compete extensively with railroads, pipelines,truck lines, and coastal ship and barge lines. The competitionis not only head to head on a daily basis, but is also long term

v-7
and subtle. The competition develops when shippers make deci-sions about locations for new plants, sources of raw materials,or markets. Their transportation costs are only part of thatdecision. For many high-volume and low-unit value commodities,transportation is a major portion of the total delivered cost.Barge line planners should learn about customers' existing and Sfuture locations and other marketing decisions in order to under-stand their own lines' markets. Equally important for a completeunderstanding of the competitive marketplace is the knowledge ofchanges in competing modes' services to these customers.
a S I
S
VI. THE DEVELOPMENT AND IMPLEMENTATION OF THE STRATEGY S
Having undertaken a thorough analysis of the company's pre-sent and probable environments--both internal and external--theplanner can turn to the development of strategies designed tomeet the future challenges. The first step is to focus strategicdevelopment on the most critical issues.
STRATEGIC ISSUES S
With a projection of the future environment in hand, thestrategic planner is in a position to overlay an analysis of thecompany's strengths and weaknesses on that projection. Thisanalysis should focus on the company's ability to prosper in thefuture environment. Inevitably, the planner finds several key Sfactors, which we shall call strategic issues. Strategic issuesare factors that are likely to create opportunities for andthreats to the company. The following scenarios are examples ofsuch issues:
* The Tennessee-Tombigbee waterway will soon be opened Sfor navigation from the Tennessee River to Mobile. Newmarkets may or may not develop for short- and long-haulshipments. To develop a major share of any potentialmarkets, companies should commit themselves early toassign resources, position equipment and develop rela-
U tionships with local towboat operators, vendors, and Sespecially shippers.
* Overcapacity plagues the inland barge industry. Tow-boats and barges are tied up and their future is uncer-tain. Slow recovery in demand for tneir services isforecasted. An industry proposal has been developed toscrap excess hopper barges. The company can contributeto the relief of an industrywide problem. On the otherhand, some of the excess equipment can be useful whenbusiness picks up.
e The company specializes in the long-haul affreightmentof grain and other dry bulk commodities. A number oftowboats are tied up end crews laid off. An opportun-ity arises to acquire a bankrupt company's tank bargesand towboats. The industry's liquid trade is improvingfaster than the dry bulk trade.
. . ...-

VI-2
CORPORATE MISSION
Provided with an assessment of the future environment andthe identification of strategic issues, senior management candefine a mission for the company. Essentially, this entailsanswering three straightforward questions:
e Who are the company's customers?
e What are the customers' needs?
o How may these needs be met?
A corporate mission statement should answer these questionsbroadly. For example:
"Achieve and maintain the position of market leader inproviding barge transportation service on the
* Mississippi River System through innovative responsesto shippers' needs and a rigorous emphasis on manage-ment and control."
The mission may be broadened or narrowed depending on thelevel of horizontal or vertical integration desired in the com-pany and the market areas served. Remember that the missionstatement guides strategic planning, rather than constrains it.
PLANNING PERIOD
For the capital-intensive barge industry, in which the majorassets (vessels) often operate for more than 20 years, the stra-tegic planning period should cover a minimum of 10 years. Ofcourse, the accuracy of forecasts decreases over time because ofthe cumulative uncertainties and unforeseen events that arebeyond the scope of even the most brilliant mortal to forecast.Even so, it is valuable to assess the impact of future events(such as energy shortages) because a longer term perspectiveprovides a sense of the timing and sequence of strategic moves.Effective strategies tend to be opportunistic in that they aresufficiently flexible so that they may be adjusted to deal withunforeseen opportunities and threats.

* 0 VI
STRATEGIC ALTERNATIVES
nust be related to its percep- The development of a strateits own capabilities and egic issues identified from the
planning process generally strategy must ensure that the stwo areas. and should cover the full planni
individuals at different companyshould fulfill a variety of the areas defined by the strateg
ing the strategies. This procestives. The planner should encou
ocating resources competing strategies in order toSfr tof approaches to the issues. A
hmarks for tracking and con- should participate in developingrder to identify or anticipate native strategies so that a consctions achieved.
of the personnel responsible Strategic alternatives shouctives, thereby reflecting or planning period. Although not d
budgets and financial reports, einclude financial detail so that
in among staff flow, and market position can be
ning period. The proposed stratty to react to new opportuni- position in relation to the folli
* Market share
itly specific to serve as valid 9 Market role (leader or
tnough to prevent game-playing * " Competitors' projectedie expense of profits, or de-.n a high short-term ROI). In * Needs for new equipmen.on, the numerical long-term'it growth, cash flow, earnings * Marketing strategy (mae complemented by nonfinancial
e regions, key customers
leadership, new market pene-
iel development, and techno- * organizational structu
So* Possible avenues of sy.nk of strategic objectives sions;y has been developed, theied to determine whether or not - The regulatory environ
* !--Align with existing
--Support favorable le
initiatives
* 6
* 6

VI-5
1 Timing is central to developing an effective strategy. A 0
"strategic window" may be identified--that is, an area of oppor-tunity that is a unique alignment of environmental conditions andthe company's special capabilities. However, the pace of change,both in- and out-side the company, may leave the strategic window
Wopen for only a brief period. Inaction or mistiming damages thecompany's ability to exploit the opportunity.
TESTING AND EVALUATION OFSTRATEGIC ALTERNATIVES
Alternative strategies should be tested objectively by de-veloping forecasts of the range of results that can be expectedfrom each alternative. The results should be stated in quanti-tative terms, such as revenues and costs. Pro forma financialcalculations can then be developed to determi-ne the potentialimpact of the alternatives on the company's balance sheets. 0
Computer simulation is efficient for evaluating alternativeoperating strategies. A computer simulation takes a strategywith its inherent assumptions on traffic demand, fleet use,rates, and costs, and projects the results of the strategy overthe planning period in the form of income and cash flow state-ments and capacity use tables. Various mainframe and personalcomputers spreadsheet packages can be used to develop the com-puter simulation. A sample model was developed using EPS Incorp-orated's FCS-EPS spread sheet program and is described in Ap-pendix H. As each company has a unique mix of customers, equip-ment, and operating patterns, the model can be modified for acompany's operations and for the type of spreadsheet available tothe planner.
The benefits of using a computer model to evaluate a long-range strategy are twofold: it tests the effectiveness of alter-native strategies in dealing with a projected set of environment-al conditions and provides a framework to help structure opera-tional strategies. Broadly speaking strategic planning entailsmaking general assumptions. The computer model aids the plannerby forcing him to state these assumptions explicitly. Computersimulation also enables the planner to vary the assumptions, suchas growth projections and rate and cost forecasts, to test alter- 0native strategies for sensitivity to the variations.
STRATEGY SELECTION
The pro forma financial statements that are calculated- either by hanT or by a computer model enable the planner to rank
. o •.

VI-6
alternative strategies on the basis of the internal rate of re-turn, the demand on scarce resources, the timing and impact ofpositive and negative cash flows, and effects on the company'sfinancial statements. Other factors to consider when selectingare these:
* Consistency with the company's goals and priorities
e Compatibility with projected environmental conditions
o Adaptability to internal and external changes
o Level of risk
o Use of the company's personnel, knowledge, technology,and financial resources
o Ability to generate a consensus on its future directionas measured by morale level
o Consistency of logic and actions
IMPLEMENTATION
Successful implementation is the final test of the effec-tiveness of strategic planning. Management will not tolerate aprocess that does not bear fruit.
The most important first step in turning the abstractioninto action is to communicate it to those responsible for imple-mentation. These individuals must be party to the overall cor-porate mission, strategic objectives, and assumptions and ration-ale underlying the strategy. Without a thorough understanding ofthe strategy's details and the reasons behind it, the implement-ers' attempts may flop. A full understanding of the planningprocess gives them the information they need to make the planwork.
One method to ensure effective communication is to involveseveral implementers in developing and selecting the strategy, sothey can appreciate the benefits of the process and the planitself.
S
. . . .. . • . - , . . • , , . , .

VI-7
BUSINESS PLANS
An effective strategy implementation must bridge the gapbetween the abstract, long-range focus of strategic planning andthe concrete, short-term policies and directives needed for im-plementation, which requires a detailed analysis. The short-termplans or "business plans" can range from formal five-year plansand annual budgets to monthly sales targets and barge trip re-sults. These business plans should cover the following:
o Marketing
o Competition
o Operations/service
f * Finance
o Organization/personnel development
o Corporate development
A comprehensive scope and sufficient detail to allow imple-mentation of the strategic plan are essential to the businessplans at this stage of the process.
The Sales Plan should identify and prioritize specific cus-tomer needs and, where applicable, particular market segments to
* target.
The Competitive Plan should state assumptions about competi-tors' activities and develop the specific responses that theorganization should take to neutralize the damage. Such actionsmight include forming coalitions or pre-empting the competition.
The Operations/Service Plan should detail how the organiza-tion will carry out its strategy in terms of vessel and terminaloperations in order to meet the level and phased development ofservices called for in the strategy.
The Financial Plan should include short-term detail fromwhich budgets and financial controls can be developed. It shoulddetail cash flows in specific revenue and cost areas and identifycash requirements and surpluses. It should also address invest-ment policy for surplus cash reserves.
The Organization/Personnel Development Plan should helpstructure the organization to meet the demands of the strategic Splan. The organizational structure should reflect the priorities

VI-8
and objectives of the company's strategy. Also, plans shoulddevelop the organization's human resources to best carry out thestrategy.
The Corporate Development Plan should synchronize the needsand the contributions of the barge line and those of the rest ofthe company's units. The barge line must progress in a directionand at a pace that fits the overall corporate goals and re-sources.
MONITORING PERFORMANCE
By establishing strategic objectives and projecting resultsat a service level over an extensive planning period, the strate-gic planning process provides a number of yardsticks with whichto measure the company's effectiveness in carrying out the chosenstrategy. Explicit assumptions concerning future environmentalconditions are another product of the strategic planning process.Any divergence of the company is performance from the plan or ofreal environmental conditions from projections are detected bythese yardsticks. A continued monitoring process thus providesan early warning system that can identify unforeseen areas of .opportunity or threat to the company. These may be addressed asthe strategic issues in an ongoing strategic planning process.
STRATEGIC PLANNING
The company strategy is developed, implemented, and mon-itored in Phase II and III of the planning process. The cycle isthen renewed on an annual or more frequent basis by first updat-ing the information that was collected and analyzed in Phase I.As each successive cycle is developed, new issues and strategiesare developed, implemented, and then monitored. With very fewiterations the strategic planning process will become an inte-gral part of the company decision making process.
0
.....................................-.

S
0
a S
S
APPENDIX A
BIBLIOGRAPHY S
0
*
S
S
S
S

k APPENDIX A
BIBLIOGRAPHY
B Reference materials have been categorized into 9 groups by 0
subject matter as follows:
* Commodity flow statistics
* Shipper industry data
* Government studies
* Terminals
e Equipment
0 Costs
* Competitors
_ e Economic factors
a Information sources
1. COMMODITY FLOW STATISTICS
Commodity Research Bureau, Inc. Commodity Yearbook. Publishedannually.
Interstate Commerce Commission, Bureau of Accounts. TransportStatistics in the United States, Carriers by Water, Part 5.Published annually.
Maritime Transport Committee. Maritime Transport 1980. Preparedfor Organization for Economic Cooperation and Development.1981.
The American Waterways Operators, Inc. Inland Waterborne Com-merce Statistics. Published annually.
United States Army Corps of Engineers. Waterborne Commerce ofthe United States, Part 2, Waterways and Harbors of Gulf Coast,Mississippi River System and Antilles. Published annually.
• . -. .'. .

A-2
United States Department of Transportation, Maritime Administra-tion, Office of Domestic Shipping. Domestic Waterborne Trade ofthe United States. Published annually.
United States Department of Transportation, Maritime Administra-tion, Office of Doemstic Shipping. Commodity Movements on theInland Waterways. Computer data, available annually.
2. SHIPPER INDUSTRY DATA
American Iron and Steel Institute. Annual Statistical Report-
American Iron and Steel Institute. Published annually.
Coal Age (a monthly review of issues and technology within thecoal industry). Published by McGraw-Hill, Inc.
Energy Users Report ( weekly review of energy policy, supply, andtechnology). Published by Bureau of National Affairs, Inc.
Hill, Lowell D., Fuller, Stephen W., and Leath, Mark N. SoybeanMovements in the United States, Interreqional Flow Patterns andTransportation Requirements in 1977. North Central RegionalResearch Publication No. 273, Southern Cooperative Series Bulle-tin 251, Illinois Bulletin 766, January 1981.
International Bulk Journal. (An independent monthly magazine forthe international dry bulk market.) Published by IBJ Associates.Note: Annual Review in February Issue.
Oil and Gas Journal (a weekly publication of issues and technol-ogy affecting the oil and gas industry). Published by PennWellPublishing Company.
United States Department of Agriculture, Foreign AgriculturalService. Foreign Agriculture Circular.
United States Department of Agriculture. Foreign Agriculture.(Monthly publication for business firms selling United Statesfarm products overseas.)
United States Department of Agriculture, Office of Transporta-tion. World Agricultural Transportation, The Green Sheet.(Monthly publication of world agricultural news.)
United States Department of Agriculture, Foreign AgriculturalService. FAS Report. (A weekly roundup of world agriculturalproduction and trade).
Si

A-3
United States Department of Agriculture, Agricultural MarketingService. Grain and Feed Market News. (Published weekly.)
United Nations Department of Economic and Social Affairs, Statis-tical Office of the United Nations. World Energy Supplies 1965-1968. Statstical Papers, Series J No. 13, 1970. 0
United States Department of Agriculture. Agricultural Statis-tics. Published annually.
United States Department of Agriculture, Economic Research Serv-ice. Growth in World Demand for Feed Grains Related to Meat andLivestock Products and Human Consumption of Grain. Foreign Agri-cultural Economic Report. Published annually.
United States Department of Commerce, Bureau of IndustrialEconomics. 1982 United States Industrial Outlook for 200 Indus-tries with Projections for 1986. January 1982. 6
United States Department of Energy, Energy Information Admini-stration, Office of Energy Markets and End Use. Monthly EnergyReview. DOE/EIA-0035 (83/02). Published monthly.
United States Department of Energy, Energy Information Admini- 0stration. Petroleum Supply Monthly. DOE/EIA-0109. Publishedmonthly.
United States Department of Energy, Energy Statistics Branch.State Energy Data Report Statistical Tables and Technical Docu-mentation 1960 through 1978. DOE/EIA-0214 (78), April 1980. 0
United States Department of Energy, Office of Coal, Nuclear,Electric and Alternate Fuels. Coal Distribution January - Juneand Coal Distribution July-December. DOE/EIA-0125 (82/2Q). Pub-lished annually.
Wilson, Carroll L. Coal-Bridge to the Future, Report of theWorld Coal Study. Cambridge: Ballinger Publishing Company,1980.
Wilson, Carroll L. Future Coal Prospects: Country and RegionalAssessments--World Coal Study. Cambridge: Ballinger Publishing 6Company, 1980.
.. "0
-•S . ,

A-4
3. GOVERNMENT STUDIES
Baumel, Phillip C., Beaulier, Jeffrey, and Hauser, Robert J. ofIowa State University. Impact of Inland Waterway User Charges onCorn, Wheat, and Soybean Flows. United States Department ofCommerce and United States Department of Transportation. PB82-196023, March 1982.
Baumel, Phillip C., and Huyser, Curtis D. of Iowa State Univer-sity. Impact of Inland Waterway User Charges on FertilizerFlows. United States Department of Commerce and United StatesDepartment of Transportation. PB82-196031, March 1982.
ABureau of Business and Economic Research, Memphis State Univer-sity. Impacts of a Waterway User Charges on the Economy ofTennessee. Bureau of Waterways and Rail Tennessee Department ofTransportation. May 1978.
Consad Research Corporation. Projecting the Demand for OhioRiver Basin Waterway Traffic Using Correlation and Regression.United States Army Corps of Engineers. Contract DACW69-78-C-0018, January 1979.
Data Resources, Inc. Analysis of Issues Relating to the EconomicImpact of Inland Waterway User Taxes and Charges. United StatesDepartment of Commerce and United States Department of Transpor-tation. PB82-196056, March 1982.
Data Resources, Inc. The Economic Impact of Inland Waterway UserCharges. United States Department of Commerce and United StatesDepartment of Transportation. PB82-196007, March 1982.
Gulf South Research Institute. Economic Analysis of Gulf Intra-coastal Waterway, Lousiana Section. Ozarks Regional CommissionFinal Report, August 1978.
Manalytics, Inc. Coal Transportation Capability of Existing Railand Barge Network, 1985 and Beyond. United States Department ofCommerce, National Technical Information Service. PB-260 597,September 1976.
Ohio Valley Improvement Association. Ohio River Navigation,Past-Present-Future. 1979.
United States Army Corps of Engineers, Institute for Water Re-sources, Water Resources Support Center. National WaterwaysStudy, Summary of Team's Proposed Recommended Plan. ReviewDraft, July 1981.
I
:: :: ,. ;L :: :.:. ,:~ i:;__: . . . ..- __ _;:: : :; . ' -: :.-. : .. . _ " - .._._._;_. .. _ . . ; - . .
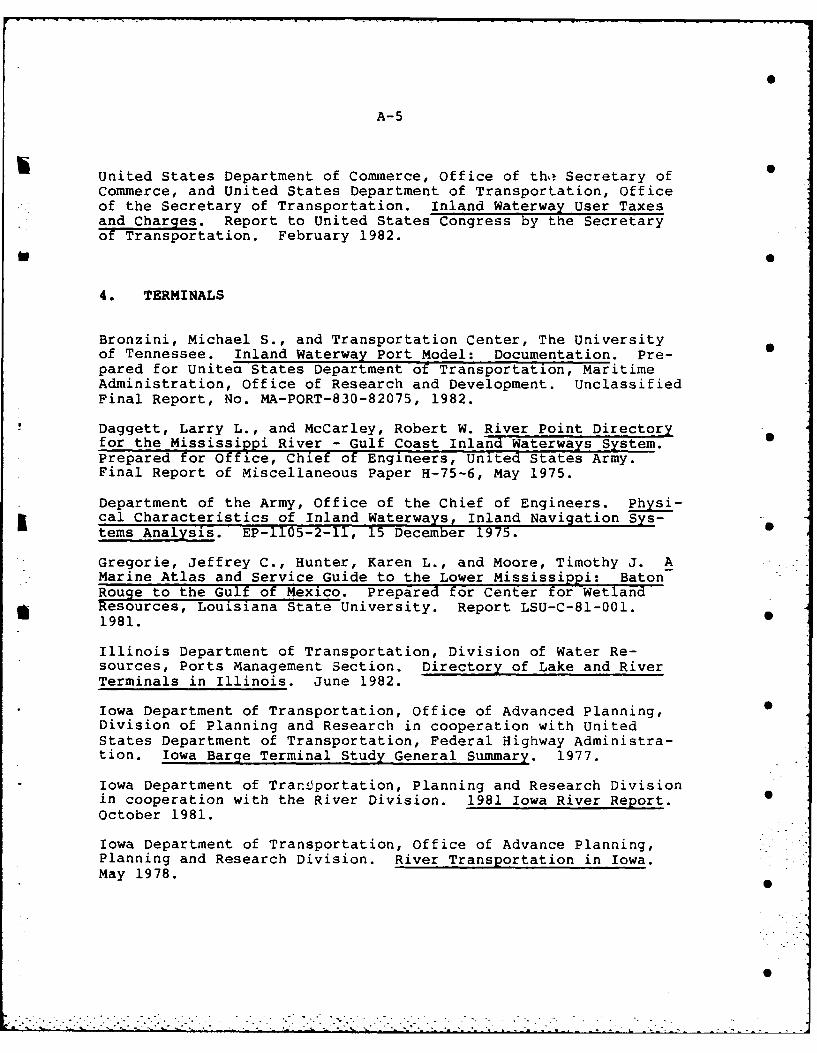
A-5
b United States Department of Commerce, Office of thi Secretary of 0
Commerce, and United States Department of Transportation, Officeof the Secretary of Transportation. Inland Waterway User Taxesand Charges. Report to United States Congress by the Secretaryof Transportation. February 1982.
4. TERMINALS
Bronzini, Michael S., and Transportation Center, The Universityof Tennessee. Inland Waterway Port Model: Documentation. Pre-pared for Unitej States Department of Transportation, MaritimeAdministration, Office of Research and Development. UnclassifiedFinal Report, No. MA-PORT-830-82075, 1982.
Daggett, Larry L., and McCarley, Robert W. River Point Directoryfor the Mississippi River - Gulf Coast Inland Waterways System.Prepared for Office, Chief of Engineers, United States Army.Final Report of Miscellaneous Paper H-75-6, May 1975.
Department of the Army, Office of the Chief of Engineers. Physi-cal Characteristics of Inland Waterways, Inland Navigation Sys-tems Analysis. EP-1105-2-11, 15 December 1975.
Gregorie, Jeffrey C., Hunter, Karen L., and Moore, Timothy J. AMarine Atlas and Service Guide to the Lower Mississippi: BatonRouge to the Gulf of Mexico. Prepared for Center for WetlandResources, Louisiana State University. Report LSU-C-81-001.1981.
Illinois Department of Transportation, Division of Water Re-sources, Ports Management Section. Directory of Lake and RiverTerminals in Illinois. June 1982.
Iowa Department of Transportation, Office of Advanced Planning,Division of Planning and Research in cooperation with UnitedStates Department of Transportation, Federal Highway Administra-tion. Iowa Barge Terminal Study General Summary. 1977.
Iowa Department of Tranviportation, Planning and Research Divisionin cooperation with the River Division. 1981 Iowa River Report. SOctober 1981.
Iowa Department of Transportation, Office of Advance Planning,Planning and Research Division. River Transportation in Iowa.May 1978.
. . . . . . . . .. .0

A-6
Robinson, Gerry P. Aashto Annual Report on Department Of Trans-portation Water Transportation Programs. Published annually.
Tennessee Department of Transportation, Bureau of Waterways andRail Transportation. Tennessee Waterways Directory. (Authoriza-tion No. 1302), January 1980.
The American Waterways Operators, Inc. American Waterways Ship-yard Conference Shipyard Survey 1971-1979. 1979.
United States Army Engineering District, Chicago. Upper Missis-sippi River Comprehensive Basin Study. Prepared for UMRCBSCoordinating Committee. 1970.
United States Army Corps of Engineers, Water Resources SupportCenter. Port Series Reports, updated periodically and listed asfollows:
Port Series No. Port(s) Described
18 Mobile, AL19 Panama City and Pensacola, FL and Port
Canaveral, FL20 New Orleans, LA20A Mississippi River Ports Above and Below
New Orleans, LA21 Baton Rouge and Lake Charles, LA22 Port Arthur, Beaumont, and Orange, TX23 Galveston and Texas City, TX24 Houston, TX25 Corpus Christi, TX26 Freeport, Port Lavaca, Port Isabel, and
Brownsville, TX46 Chicago, IL60 Pittsburg, PA and Ports on the Ohio,
Monongahala, and Allegheny Rivers, PA61 Huntington, WV and Ports on the Ohio River
Miles 40-317 and Kanawha River, WV62 Cincinnati, OH and Ports on Ohio River
Miles 317-56063 Louisville, KY, and Ports on Ohio River
Miles 580-980 and Cumberland and GreenRivers
65 Illinois Waterway, IL69 Minneapolis-St. Paul, MN, and Ports on
Upper Mississippi River Miles 300-860AOR
70 St. Louis, MO and Ports on UpperMississippi River Miles 0-300 AOR
-

A-7
b Port Series No. Port(s) Described
71 Memphis, TN; Helena, AR; and Ports onLower Mississippi River Miles 620-894AHP
72 Natchez, Vicksburg, and Greensville, MSB and Ports on Lower Mississippi River
Miles 255-620 AHP
EQUIPMENT0
Fleet Data Service. Guide to American Inland Towboats, Volume IIGulf Intracoastal Waterway and Volume III Mississippi RiverSystem. Published annually.
Marine Engineering/Log Marine Directory. New York: Simmons-Boardman Publishing Corporation, 1983. Published annually.
Owen, Dan, ed. Inland River Record Diesel and Steam Vessels ofthe Mississippi River System and Gulf Intracoastal Waterway andTributaries in Operation. An annual publication of The WaterwaysJournal.
The Work Boat. A monthly publication of the issues and technol-ogy affecting the support boat industry. Published by H.L. PeacePublications.
UUnitea States Army Corps of Engineers, Waterborne Commerce 0Statistics Center. Transportation Lines on the Mississippi RiverSystem and the Gulf Intracoastal Waterway. TransportationSeries 4. Published annually.
United States Department of Transportation, United States CoastGuard. Merchant Vessels of the United States (including yachts) 0
Volume I-Volume II. Last publication 1981.
Wolfe, Eric K. A Description and Analysis of the Empty MovementsOccurring on the United States Inland and Intercoastal WaterwaySystem. AAR Truck and Waterway Information Center, Staff paper8U-04, December 1980. 0

LybrandporatedTranspoDepartmi
Wolfe, IIntroduiroads,
7. col
Owen, D.Waterwa
Wolfe,!AAR TruiMay 198
8. ECI
Data Re
Data Re:seas ona.
9. IN]
Hamirickrent StiMar itimical Sys-
UnitedStatistannuall:

A-9
United States Department of Transption, Office of Public Affairs. M
, and United Research Incor- periodically.
or Ground Modes of Commone Manual. United States
10. MISCELLANEOUS INFORMATION
Inland Waterway Industry and ansociation ot American Rail- Larson, Captain Ron. River Tow Botment. October 1981. guide for the inland waterway seam
United States Department of TranspDirectory of Labor Management Affiperiodically.
An annual publication of The
inant Inland Water Carriers.Center. Staff Report 81-05,
!
ted States Economy. Published U
g-Term Review. Published on a
tion Sources: A Guide to Cur-nformation Committee of theoard Commission on Sociotechni-ncil. December 1978.
Office of Bureau ot Laborlletin 1990. Published semi-

S
S
S S
S
APPENDIX B
COMMODITY CLASSIFICATION FOR 0
DOMESTIC WATERBORNE COMMERCE
S
* 0
S
S
S
S
. ................................

APPENDIX B
COMMODITY CLASSIFICATION FOR DOMESTIC WATERBORNE COMMERCE
codsC"item Ne NO. Item Nunn
*Group 01-For. Product* Group 20-Food and Kindred Products
0101 Cotn a 2034 Vegetables and preparations. caned ad Otherwise prepared
0102 Barley end rye and preserved0103 Corn 2039 fruits. and fruit sod vegetable juices. cansad! and otherwise
* 0104 Oats prepared or preserved0105 RIC* 20K I Wheat flour and eamolina0106 Sorghum Grain. 2042 Animal feeds
0107 Wheat 2049 Grain mill products. not elsewhere classified0111 Soybeane 2061 Sugar0112 Pleamed 1062 Mlse0119 Oilseede. not elsewhere classified 2081 Athicbeverages0121 Tobacco, leaf 2091 Vegetable oIls, all grades; margarine end shortening0122 Way end Fodder 2092 Animl oils and fats, not elsewhere classified. including0129 Field crops, not elsewhere classified marin0131 fresh fruits 2094 Groceries0132 Bananas and platains 2095 Ice0133 Coffee, green and roasted (including instant) 2099 Miscellaoeoue food produccs0134 Cocoa beans0141 Fresh and frozen vegetables Group 21-Tobacco Products0151 Live animela (livestock) except so nimals. cat*.
dogs, etc. 2111 Tobacco manufactures
0161 Animals and aimal products, not elsewhere claeif led0191 Nlecellameous, fore products Group 22-Basic Textleos
d.Group O-Forest Froducts 2211 Basic textile products, except textile fiber.2212 Textile fibere not elsewhere classified
0841 Crude rubber and allied Stn0861 Forst products, not elsewhere classified Group 23-Apparel and Other Finished Textile
Products Including KnitGroup 09-Fresh Fish end Other Mertes Products
2311 Apparel and other finished textile producte. including knit0911 fresh fish, except shellfish0912 Shellfish. except prepared or preserved Group 24-Limber and Wood Product.0913 Menhaden Except Furniture0931 Marine @se. immufactured
2411 LogsGroup 10-Mtallic Ores 2412 Rafted loge
2413 Fuel wood, charcoal, sod waseees1011 Iron ore and conentretes 2414 Timber. poets, poles, piling, adother wood In the rough
*1021 Copper ore end concentrates 2415 Pulpwood, log*1051 Bauxite and other alualoim ores and concentrates 2416 wood chips. steves, moldings, and excelsior
1061 Manganese ores and concentrates 2421 Lumber1091 WNoferrous metal ores end concentrates. not elsewhere 2431 Veneer, plywood, end other worked wood
classified 2491 Wood manufactures. not elsewhere classified
UGroup Il-Coal Group 25-Furniture and Fixtures4
1121 Coal ad Ilpite 2511 Furniture and fixturea
Group 13-Crude Petroleum Group 26-Pulp, Paper eod Allied Products
*1311 Crude petroleum 2611 Pulp2621 Standard newsprint paper
Group 14-Nonemtallic Minerals. Except Fuels 2631 Paper aod paperhoard2691 Pulp, papar and paperboard products, not esewhere classified
1611 Linestone flux end Calcareous scone1412 Building stone. uimorkad Group 27-Printed Metter01662 Send. gravel end crushed rock
*1451 Clay. ceramic end refractory materias 2711 Printed netter1671 Phosphate rock1479 Natural fercilizer mterials. not elsewhere Group 28-Canicala and Allied Products-
classified1691 salt 2810 Sodiu, hydroxide (caustic ends)1492 Sulphur, dry 2811 Crude products from coal tar, petroleum, ad natural gas.1493 Sulphur, liquid except benzene and toluene1696 Gypsum~, crude end plasters 2812 Dyes, organic pigment, dyeing and tanning materlals1499 Nontallic amanrals, except fusle, not elsewhere 2813 Alcohols
classified 2816 Sadioactive and essociated "terials, Including wastes2817 gensime and toluene. crude end commercially pure
Group 19-Ordesce end Accessories 2818 Sulphuric acid2819 basic chemicals and basic chemical products, not elsewhere
1911 Ordonce and accessories clasified2821 Plastic matenials. reganareted cellulose end synthetic resins.
Group 20-Food nd Kindred Products including film, sheeting. and lesinetes2822 Synthetic rubber
2011 Want, fresh. chilled, or frosefn 2823 Synthetic (man-medal fiber2012 Meat sad mat products prepared or preserved, 2831 Drugs (biological products. medicinal chemicals, botanical
Including tamned meat products product* end phermaceutics. preparations)2014 Tallow, asimal fats ad oils 2841 Soap, detergents, end cleaning preparations; perfume. cosmetics,2015 Animal by-products, mot elsewhere cleseified and other toilet preperatlone2021 Dairy product*. except dried milk end cram 2851 Points. varnishes, lacquers, sem Le. and allied products
* 2022 Dried milk mod cream 2861 Gum and wood chemicals2031 Fish sad fish products, including shellfish. 2871 Nitrogenoue chemical fertilizers, except mixtures
prepared or preserved 2872 Potsoic chemical fertilixers, except mixtures2871 Phosphatic chemical fortilizere, except mixtures

B-2
Cade CodaN.Item Nat" 1o. Item Nam.
Group 26-Oieadcals and Allied Products group 34-febricated Metal Products.
Except Ordnance, Machinery and276 Is$eccicidee, fungicides. pesticides, and disinfectants Tras~portation 9quipment279 7*1atilsers end fertilizer mterias. not elsewhere
classified 3411 Fabricated metal products, except ordnance, machinery. and2091 Miscellaeous chical Products tranaportation equipment
Group 29-Petroleum end Coal ?roducts group 35-Machinery, Except Electrical
2911 Gasoline. including additives 3511 Machinery, except electrical2912 Jet fuel2913 Kerosae group 34-Electrical Machinery, Equipent2914 Distillate fuel Oil and Supplies2915 Resaidual fuel oil2916 Lubricating oil$ and Brenan 3611 Electrical machinery equipmnt and supplies2917 Naphtha, mineral spirits. solvents. not elsewhere
classified Group 37-Transportation Equipment2916 Asphalt, tar, and pitches2920 Coke, Including petroleum coke 3711 Mtor vehicles. parts and equipment2921 Liquefied petroleum Baes, coal gaaes. natural ga,. 3721 Aircraft and parts
and natural pea liquids 3731 Ships and boats2951 Asphalt building maerials 3791 Misellaneous transportation equipment
S2991 Petroleum and coal products, not elsewhereclassified Group 30-Instruments. Photographic end
Grou 30Ruber nd MscelanousOptical Goode, Watches and Clocks
Platics Products 3611 Instrumente, photographic and optical goods, watches and clocl
3011 Rubber and socellaneous platic products Group 39-Miscellaneous Products ofManufacturing
Grou 31Loaherand ~ster rodcts3911 Miscellaneous products of manufacturing3111 leather and leather products
Group 40-Wasto and Scrap MaterialsGroup 32-Stone. Clay, Glass and
Concrete Product. 4011 Iron and steel scrap4012 Nonferrous metal scrap
3211 Glass and glass products 4022 Textile wats, scrap, end sweepings3241 Building cement 4024 Paper vats and scrap3251 Structural clay products. including refractories 4029 Waste and scrap, not elsewhere classified
* 3271 Lise3231 Cut atone and stone products Group 4l-Special Item3291 Mscellaneous nonmtallic mineral products
Grop 3-Prmar Meal rodcts4111 WaterGrop 3-Prmar Meal rodcts4112 Miscellaneous shipments not identifiable by commodity
4113 LCL freight3311 Pig Iron 4115 Materiala used In waterway improvement. Government materials3312 Slag 4119 Zmpty containers
*3313 Coke (coal and petroleum), petroleum pitches and 92995 Department of Defene controlled cargo and special categoryaephalts, and naphtha and solvents item
3314 Iron and steel ingots. and other primary for.including blanks for tube and pipe, and sponge
0Iron *Cargoes exported on Department of Defense controlled vessels3315 Iron and stoel hers, rode, angles, shapes and (other than goods for the use of U.S. Armed Forces abroad) and non-
sections, Including sheet piling Department of Defense shipmente of military component items3316 I ron and steel plates and sboets (abbreviated SCI) for which commodity detail is not furnished to tht3317 Iron and steel pipe and tube Corps of Enginsee.3316 Perroalloys3319 Primary Iron and steel products, not elsewhere
clasified Including castings In the rough3321 Nonferrous metals primary smlter product, basic
sbaps. mire castings and forging., except0 copper, lead, ainc and aluminum
3322 Copper and copper alloys, whether or notrefined, uaworbed
3323 Le and zinc including alloys, umorked3324 AIlmsum ad aluminum alloys. ummorked
Source: U.S. Army Corps of Engineers, Waterborne Comerce of the United States.
S
S
p S
S
APPENDIX C
PRINCIPAL HISTORICAL COMMODITY FLOWS P
-- 4II
£ I
I
p
I
S
. . ...........

2~ Z;R s
* -, -- -I-lu:-- 'U
gs A.-p= N NfE WR3qG tl
- x -q*
C CU
C -E
=4 L-) > -
CL
- -- - - -3! i!i 13 FF E : 2g? Fi-:
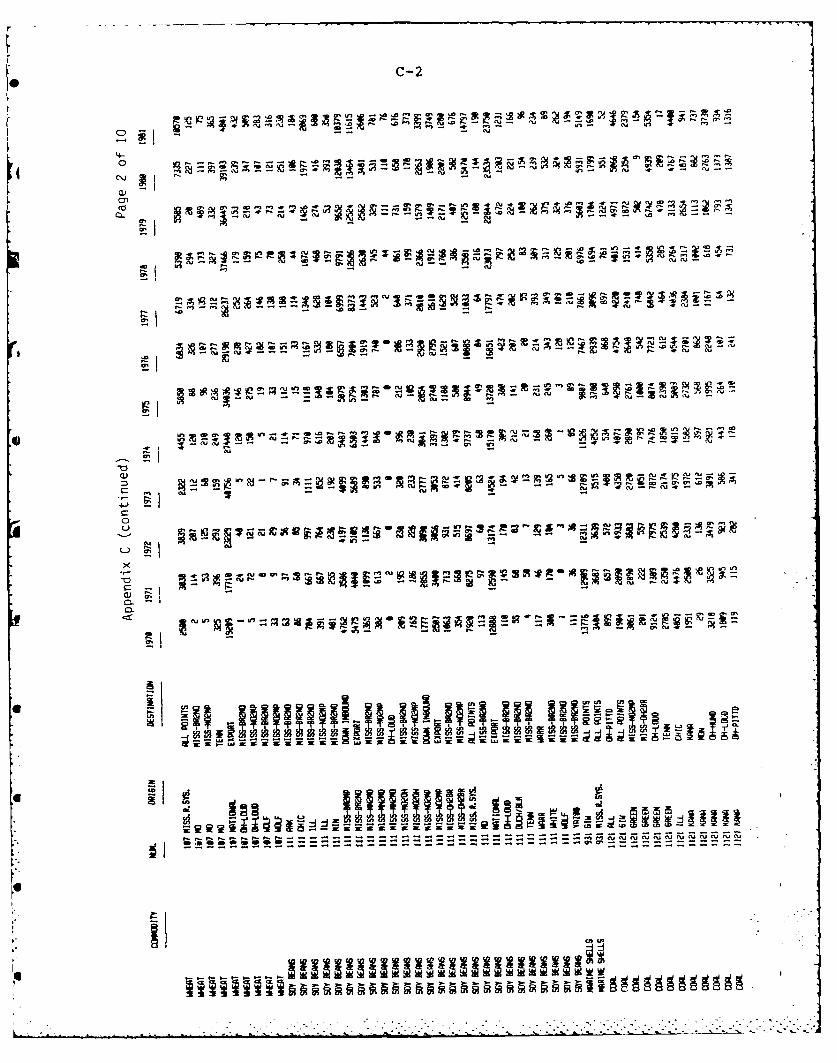
c-2
ou u, CU'O ' ~ ~,
la * VP R2n.- p~
ijcu~u
Lb -' C --- --- --- --- --- --- --
oc

C-3
4-.-n. n r q
_Aec_ _ 0 o- Mr-.c m00
= -- • -
0: ! -) !! !! .01!i
_ "<U cu m rUCu .
Wo a
i~ . o
SIIn
3e -u -- li t0 -N F-w r
q -u
S O a .0 e
ru -- -C1
4 4 . - ----
-. - - - - - - - -.. .- -

C-4
!SE - -0u0
~r
CL - _2 _e x _FK 10 _ g,
0
i- %
HEM m W-
H 'N
T ..... . 4 .I. ...- - - - - - - - - -
- - --- - -OC

C-50
I -Sa ]l
4JJ
0 0 I
(U ;
LC
T TT
: ' " 15 2 ' - ..." "
" -L . . • 5 -5 - 5

C-6
4-.~ ~~~~~~~ Cut'd~te e u - e r - e ~ a . r -
CD
Cu
m e 1 e1 e t 5 e - - - -
- uF E umtmni .2t2i
ww
- .q.--------------
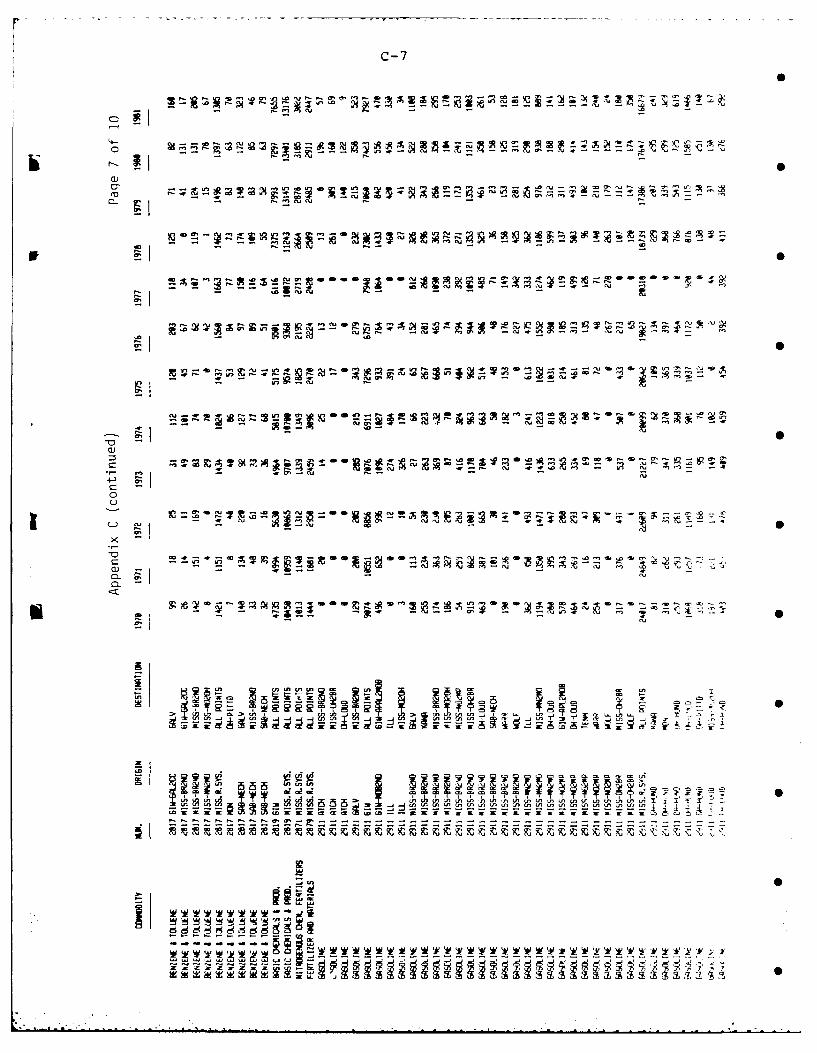
c-7
gz S Z- -~
gz T T 4 r" A I.
A 4 :1-
~~I_
-; -ri 3 N G q 2t
Le V1 ;z N cv9 u :3
.1 - 4O cu iT
Ot0
-n., .L a-2 ~
- -- - - - -S - - -
% I. %- :
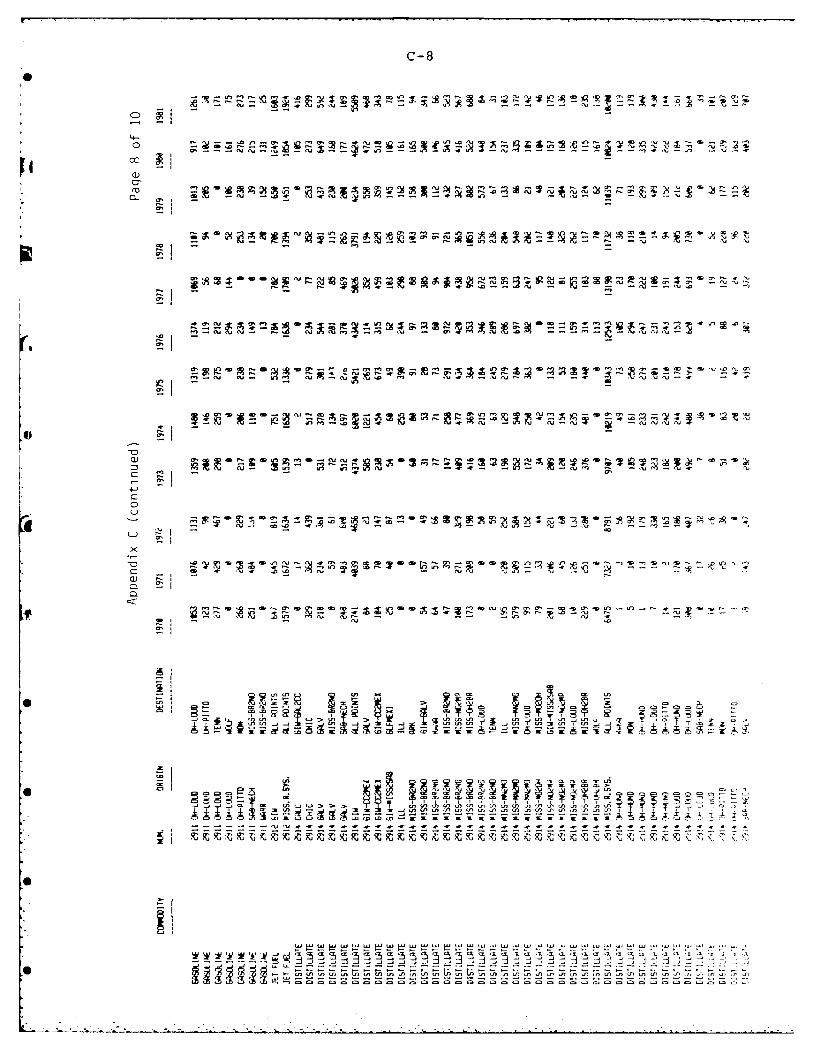
C-8
Q)
CC'
a,41 cuCU
0 ~ e e~u
(IF
n- I~ n-1

AD-AL58 521 A GUIDE TO STRATEGIC PLANNING FOR THE INLAND BARGE AND 2TOMING INDUSTRY(U) DRAVO NECLING CORP NEW ORLEANS LAB DIBNER ET AL. DEC 84 3861-4-8 NA-RD-778-85185
UNCLASSIFIED DTHA91-83-C-38963 F/G 15/5 ML
IIIIIIIIIIIIIIIIIIIIIIIIIlElllllllllllluIIIIIIIIIIIIIlEIIIIIIIIIhhl
EIIIIIIIIu

.3 2
l111III1.25~ 1 321_A
MICROCOPY RESOLUTION TEST CHART
NIATIONAL BUREAU OF STANDARDS 1963-A
{i--
DL
'o*.___
Mli-'*',.i Qii i I I I .25 HU I 1 l

C- 9
M-i
L 0. -.a - -
-l ' -
im -g I -w w w

C-10
CU
cL.
(U nn W@ (a c 4 0AA

C-l
Appendix C Footnotes
1Table of Abbreviations for Commodity Flown
Abbreviations Origin or Destination
ALL All rivers
MISS.R. SYS. Mississippi River SystemmiSS Mississippi RiverMISS-M42NO Miesisaippi River-Minnesota River to Now OrleansISS-MN2MO Mississippi River-Minnesota River to Miseouri River 0
MISS-*U2NO Mississippi River-Missouri River to New OrleansMISS-40204 Mississippi River-Missouri River to Ohio RiverMISS-OH2BR Mississippi River-Ohio River to Baton Rouge
ISS-OR2NO Mississippi River-Saton Rouge to New OrleansMISS-NO2MP Mississippi River-New Orleans to Mouth of PassesMIN Minnesota RiverSTCRX St. Croix RiverCHIC Chicago SLAKE MICH Lake MichiganILL Illinois WaterwayNo Missouri RiverOH-PI TO Ohio River-Pittsburgt DistrictOH-HUND Ohio River-Huntington DistrictON-LOUD Ohio River-Louisville DistrictMON Monongahela RiverKANA Kanaha River •BIG SANDY Big Sandy RiverGREEN Green and Barren RiversCUMB Cumberland RiverTENN Tennessee RiverWARR Warrior, Black Warrior, Tombigbee, Alabama and Mobile RiversWOLF Wolf RiverARK Arkansas RiverI WHITE White River -YAZOO Yazoo RiverOUCH/BLK Ouchits/Black RiverArCH Atchafalaya RiverGIW Gulf Intracoastal WaterwayGIW-FLA2ALA Gulf Intracoastal Waterway-Florida to Alabama RiverGIW-APP2MOB Gulf Intracoestal Wterway-Appalschicola to Mobile
i GIW-NO82NO Gulf Intrscoastal Wterway-Mobile to New OrleansGIW-NZSS2S%8 Gulf Intracoaetsl Wterway-iseAssippi River to Sabine River 0GIW-GALZCC Gulf Intracoastal Waterway-Galveston to Corpus ChristiGIW-CC2MEX Gulf Intracoastal Waterway-Corpus Christi to MexicoGLFMEX Gulf of MexicoESCAM Escambie RiverCALC Calcasieu RiverSAB-NECH Sabine and Neches RiversGALV Galveston
2Commodity descriptions:
Other Grains includes Barley and Rye (0102), Oats (0104), Rice (0105), andSorghum Grains (0106).
Fertilizers and Materials includes Phosphate Rock (1471), Natural FertilizerMaterials, NEC (1479), Nitrogeneous Chemical Fsrtilizers,112871), PotassicChemical Fertilizers (2872), Phosphoric Chemical Fertilizers (2873), andrertilizers and Fertilizer Materials, NEC (2879).
Chemicals includes Radioactive and ksaociate Materials (2816), BasicChemicals end Beic Chemical Products, NEC (2819), Plastic Mateirsls (ZZI),and Insecticides, Fumtcidee, Pesticides, and OLsinfectente (2876).
Iron and Steel Finished Poducts includes Iran and Steal Bars, Rode, Angles,Shpes, end Sections, Includi- Sheet Piling (3315), Iron and Steel Plates Sand Sheets (3316), and Primary Iron and Steel Products, NEC, includingCotings (3319).
3Source: U.S. Army Corps of Engineers Weterborne Commerce of the UnitedSaePert S.
SO

. . .* - I -
I.
0
0
r
3 0
S
APPENDIX Dg
BARGE LINE CAPABILITIES
[ p
S
S
S
p
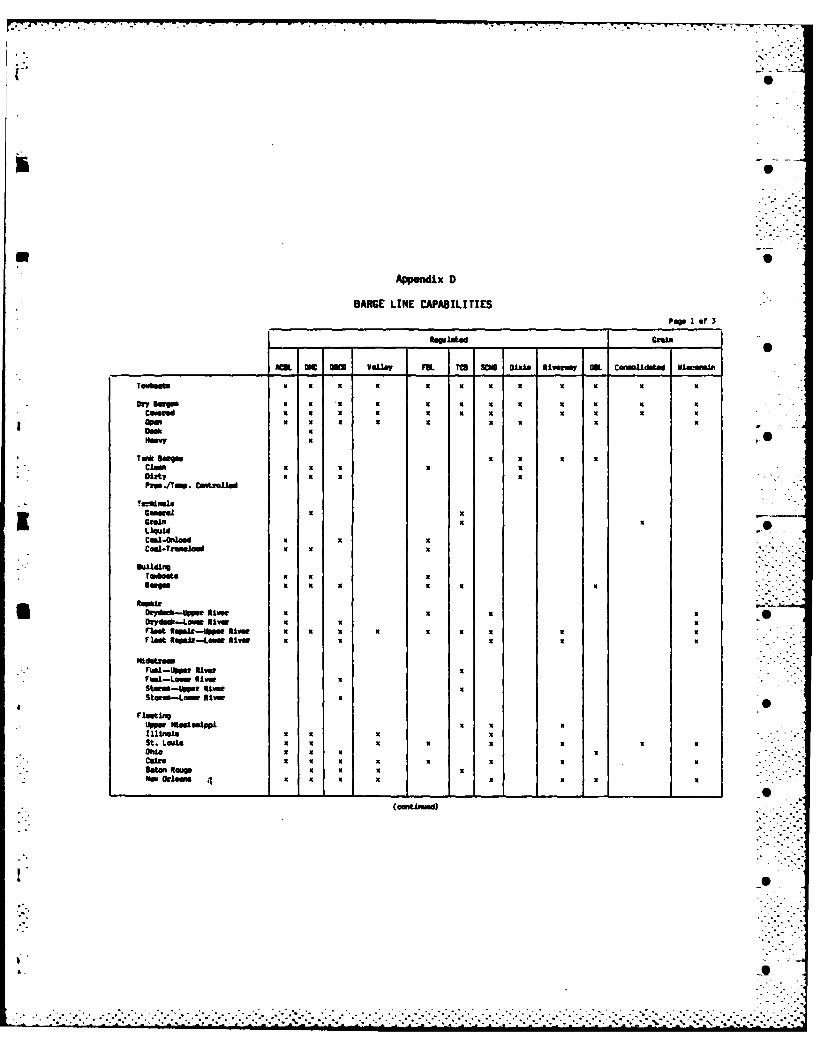
Appendix D
BARGE LINE CAPABILITIESPop I of 3
___ate Grain
AM. OWE W Valley FUL TO SOU Dixie Alvea OIL Cmmolidsted wiuggumin
onra xDOWNy a
Dirty K KPrm.ATm. controlld
Grain K
JkuidTesK
RepaIraDKydmk-I-tW Iiv x K KDry*-Lmw live K x
Sbest Repir..4.ower River Kx
Pul- Rpgit River K
fuui-Lower River K
Sterso-gpur RivinrK
leingiK KKK
St. LculK KKKOho K K
(coniud
,did

D- 2
Appendix D (continued)
3 BARGE LINE CAPABILITIES
b~i.-t~~.cool col-fhInato
caw Coma Conti- Mt id- pd.
AVI-Trams AIYWD CorLar Pas I Carriers Compa.1, Croinmiu We Mionswo liver A Soth~ AmaTobot X X X X X X X X K X X
*i ~~~~Dyk 9819-K K K K
O-Dock,
S4 Piua./Top. Contrad
TerminalsGoimelC fain X X X XL1quid X
CM14tUW)o K
DulldiM
omega at hye
ryndml-ippa ivr RimK
Float Rapahz-Liw River K X X I K
Fuml-Lovor RiverStare-Upper RiverStohes-Lowe Rive
Floating
St. Louis X
Cairoastwasa RougeWevOiIow K K
(cotiue)

D- 3
Appendix D (continuied)
BARGE LINE CAPABILITIES
Pop 3 of 3
Liquid
Stvit C s haOtlin clmzam Ifind
Dry BargesK
Co mse d 2 K
cuam
Pm/Tav Cmstz.Jad
Terinalsai
grainLiquidCoai-Tratace
Tata"
Orydok-Uppor Ri-eOyoc-Lumet River XFloet R"ir-tpr RivetVlmtk 2Ralai-Lom Rive X
3 Nidtream -Fuei-tow River
St ra-pe RivalStwe.-L River
St. LauOhioClt.
Waan Rouge
Saga.o TU/OC dots.

APPENDIX 9
SAME TELEPHONEMARKET SURVEY

Company Date
TEEPHONE SURVEY (IF RIVER SHIPPE]RS
Hello, my name is , from the economic and management consulting firmof Temple, Barker & Sloane, Inc., in Lexington, Massachusetts. We are conducting a survey for an inlandbarge line client to learn how they can improve their services to shippers on the inland waterways.
1. Do you select barge companies to move freight on the inland waterways?
If NO:
Who should I speak to?
What is the telephone number?
2. Are you responsible for:
Grain Go to page 2
Coal Go to page 3
Other Dry Bulk Cargoes Go to page 4
Liquid Cargoes _ Go to page 5
Regulated or breakbulk cargo? Go to page 6w "
-0T L.
A . - ,
.S
S
I. , ..,... "'"S""' ."-"- , .- -; T....I.:.L...i... " " : ;::" :" ." ' ." ' .":".:"" ." ' .'.;i -...,.-- :: :

E-2
GRAIN
CARGO DRAVO-
ACBL ARTCO BUNGE CARRIERS CONSOLIDATED MECHLING FEDERAL RIVERM.N
1. Of the following barge lines,which do you think gives thebest overall service? (Write1 for Best, 2 Next Best, etc.)
2. Which do you think beat deliversthe barges for loading whereand when you need them? (Best,next best, etc.)
3. Which 'j--ges do you think pro-vides toe best quality barges?(Best, next best, etc.)
4. Which do you think best keeps youadvised of barge locations andproblems? (Best, next best, etc.)
5. Which do you think is best insolving problems of accounting,claims, and other aspects ofthe move? (Best, next best, etc.)
6. Which do you think is the mostcost competitive? (Best, nextbest, etc.)
7. Is there any barge line thatyou think is better than
(Name best):
1. for overall service?
2. for delivering empty barges? ..-_
3. for quality barges?
4. for keeping you advised?
5. for solving problems?
6. for cost competitiveness?
7. How can barge line service be improved for your cargo?_
... ..... . . . . . . .• . . - . . . •. . - • - . - • . . . . • - . ° • % " . . ..

E-3 S
MAL
1 0
DRAVO-ACRI CROUNSE MECHLING FEDERAL ORCO
1. Of the following barge lines,which do you think gives the
* best overall service? (Write S1 for Best, 2 Next Best, etc.)
2. Which do you think best deliversthe barges for loading whereand when you need them? (Best,next best, etc.)
3. Which barges do you think pro-vides the best quality barges?(Best, next best, etc.)
S 4. Which do you think best keeps youadvised of barge locations and
problems? (Best, next best, etc.)
5. Which do you think is best insolving problems of accounting,claims, and other aspects ofthe move? (Best, next best, etc.)I ,
6. Which do you think is the mostcost competitive? (Best, nextbest, etc.)
7. Is there any barge line thatyou think is better than
(Name best):
1. for overall service7
2. for delivering empty barges? ,
3. for quality barges?
4. for keeping you advised?
5. for solving problems? "__"
6. for cost competitiveness?
7. How can barge line service be improved for your cargo'__
• ' ' " " " "- ".' •" " '" " " .' " . '. '. -'- """, "- - - -" - " ""' -" " "'" -" ". " "" , ' -'L'""- "- -""- - " - -".""

E- 4
OTHER DRY BULK
CONTI- DRAVO-ACBL CONSOLIDATED CARRIERS MECHLING MEMCO VALLEY
1. Of the following barge lines,which do you think gives thebest overall service? (Write1 for Best, 2 Next Best, etc.)
2. Which do you think best deliversthe barges for loading whereand when you need them? (Best,next best, etc.)
3. Which barges do you think pro-v ides the best quality barges?(Best, next best, etc.)
4. Which do you think best keeps youadvised of barge locations and
* problems? (Best, next best, etc.)
5. Which do you think is best insolving problems of accounting,claims, and other aspects ofthe move? (Best, next best, etc.)
6. Which do you think is the mostcost competitive? (Best, nextbest, etc.)
7. Is there any barge line thatyou think is better than
_________(Name best):
1. for overall s ________________
2. for delivering empty barges? _____________
3. for quality barges' _____________
4. for keeping you advised?______________
5. for solving problems? _____________
* ~~6. for cost competitiveness? _____________
7. How can barge line service be improved for your cargo?____________________________
0
.. . . . . .. . ..
ii
E-5
LIQUID
DRAVO- NATIONAL ORCO
ACBL DIXIE MECHLING MARINE (CHOTIN)
1. Of the following barge lines,which do you think gives thebest overall service? (Write1 for Best, 2 Next Best, etc.)
2. Which do you think best deliversthe barges for loading where
and when you need them? (Best,next best, etc.)
3. Which barges do you think pro-vides the best quality barges?(Best, next best, etc.)
4. Which do you think best keeps youadvised of barge locations andproblems? (Best, next best, etc.)
5. Which do you think is best insolving problems of accounting,claims, and other aspects ofthe move? (Best, next best, etc.)
6. Which do you think is the most
cost competitive? (Best, nextbest, etc.)
7. Is there any barge line thatyou think is better than
(Name best):
1. for overall service? _ _ _
2. For delivering empty barges? '-"_,_I
3. for quality barges? _
4. for keeping you advised?
5. for solving problems? •_"
6. for cost competitiveness_
7. How can barge line service be improved for your cargo?
, .•

E-6
REGULATED (OR BIIEAM"cnLx)
DRAVOACBL MECHL ING FEDERAL ORCO SCNO VALLEY
1. Of the following barge lines,which do you think gives thebest overall service? (Write1 for Best, 2 Next Best, etc.)
2. Which do you think best deliversthe barges for loading whereand when you need them? (Best,next best, etc.)
3. Which barges do you think pro-vides the best quality barges?(Best, next best, etc.)
4. Which do you think best keeps youadvised of barge locations andproblems? (Best, next best, etc.)
5. Which do you think is best insolving problems of accounting,claims, and other aspects ofthe move? (Best, next best, etc.)
6. Which do you think is the most
cost competitive? (Best, nextbest, etc.)
7. Is there any barge line that
you think is better than
(Name best):
1. for overall service?
2. for delivering empty barges?
3. for quality barges?
4. for keeping you advised?
5. for solving problems?
6. for cost competitiveness? ._....._'
7. How can barge line service be improved for your cargo?____
"0- % - " . " . % " . . . - " . . .•- ' .-. -. = .- -• -. - o ,- .- . " . .•. -, -° "= -. -.= . '''
.-..".. .'.........'....-................,..,....-......-"......-......-.-......-........,.-.,-............-....-.....-.-.'..--.--........'-.-....---'-....,

E-7
R Thank you for your assitance, we know that this information will help our client be more responsive to the
needs of you and other barge shippers.
Verify Name_____________________
Phone Number_____________________
Address______________________
LS
II S
i Appendix F
EXAMPLES OF FORECASTING METHODOLOGY
I .
I°
:: ::~I~ii
S
• ". i-" ; " i. " .' ' -" . -." .- i . " " ." . " - 'i . ." :i-. i ' . . " . ".. ._ - i~I
.. . ."- . . ... . ... ... . .. . . , -: . ... " . , - _ . " -: -. , . -2 : . -'. '. .2 . - - - " ,. ,, - ... •" " 2 ' _' _'. " _'. ', . - . -'. .'.

* 0
* SAppendix F
EXAMPLES OF FORECASTING METHODOLOGY
* 0The forecasting procedures are explained below with two
examples of fertilizer and grain.
FERTILIZER
Tons of fertilizer movements on the Mississippi River Systemwere forecasted and are displayed in Figure F-1. The table showshistorical and forecasted fertilizer barge traffic, nationalfertilizer production, and the nondimensional parametric explan-atory factor. Note that 1982 is the last year in which completedata were available. The figure is separated after that year tosingle out forecasted data. The analysis begins from left toright for the historical data and then continues from right toleft for the forecasted data. Each column will be explainedbelow in that order.
Data Sources for 1970-1982
Column 1. Historical Mississippi River System fertilizermovements in short tons were available in Part 2 of the U.S. Army
* Corps of Engineers (CofE) Waterborne Commerce of the UnitedStates.
Column 2. All U.S. fertilizer consumption is found in theStatistical Abstract of the United States.
Column 3. Data Resources, Inc. (DRI) publishes an histori-cal fertilizer production index in its U.S. Long Term Review.
Column 4. An explanatory factor showing the relative quan-tities of barge traffic to national consumption was calculated bydividing Column 1 by Column 2.
Forecasting Methodology for 1983-1990
Column 1. The forecasts of Mississippi River System trafficwere calculated by multiplying the explanatory factors in Col-umn 4 by the forecasted national consumption figures in Column 2.
. . ..

F-2
Figure F-i
MISSISSIPPI RIVER SYSTEM TRAFFIC AND FORECASTFERTILIZER
1 2 3 4Mississippi All U.S. DR! Index of Explanatory
River Fertilizer Production FactorSystem Consumption2 for (1.3)
Fertilizer (millions of AgriculturalMovements 1 tons) Chemicals(millions of (1967 = 1.000)
Year short tons)
1970 3.9 39.6 1.079 .0981971 4.5 39.9 1.035 .1131972 6.5 39.9 1.089 .1631973 5.9 41.8 1.270 .141
1974 6.5 47.1 1.447 .1381975 6.2 42.5 1.641 .1461976 6.0 49.2 1.854 .1221977 7.0 51.6 2.012 .1361978 7.1 47.5 2.118 .1491979 7.6 51.5 2.216 .148 -
1980 8.4 52.8 2.307 .1591981 7.3 54.0 2.415 .1351982 6.5 48.7 2.087 .133
1983F 6.3 45.1 1 .9 32a .141984F 6.7 48.0 2 .056 a .141985F 7.3 51.9 2 .22 3a .141986F 7.7 55.0 2 .35 7a .141987F 8.2 58.7 2 .514 a .141988F 8.7 62.0 2 .6 57 a .141989F 8.9 63.8 2.734 a .141990F 9.3 66.6 2.855a .14
1Source: U.S. Army Corps of Engineers, Waterborne Commerce of
the United States, Part 2 (phosphate rock, nitrogenous chemi-cal fertilizers, fertilizers and materials, n.e.c., and lime).
2Oata Resources, Inc., U.S. Long Term Review, Winter 1983-84,p. 11.47.3Source: DOC, Statistical Abstract of the United States,
(FEA), p. 670.DRI,, op. cit., CYCLELONG1283, p. 1.127.
F Forecasted.
..................................................................................

i - ' .
--- " -. - - -. - - - .- . . . -.---. --. . . . - . . . .I .I . . . . . . - .- _ v
I
F-3
Column 2. The forecast of total U.S. fertilizer consumption*] was calculated with the ratio of the DRI index to the U.S. con-
sumption for the last year of actual data (1982). This factor of23.33 (48.7 divided by 2.087) was then multiplied by the DRIindex in Column 3 to get forecasted U.S. consumption in Column 2.
Column 3. The DRI forecasts of national fertilizer produc-tion were obtained for recent years from the U.S. Long TermReview.
Column 4. An average of .14 for the explanatory factor wascalculated and used for future years. This represents a constantratio for Mississippi River System traffic compared to total U.S.consumption.
GRAIN
The mechanism that is used to determine expected barge de-mand for grain transportation focuses on export demand. Grainexport demand forecasts have been developed by DRI for both shortand long terms. Historical data describing exports is availablefrom the U.S. Department of Agriculture (USDA) and historicaldata describing river movements is available from the CofE. Aswe proceed through the analysis tabulated in Figure F-2, specificsources will be cited.
As before, the analysis begins from left to right for thehistorical data and then generally from right to left for theforecasted data. Each column will be explained below in thatorder.
Data Sources for 1970-1982
Column 1. Historical Mississippi River System grain move-ments in short tons are available in Part 2 of CofE's WaterborneCommerce of the United States.
Column 2. The number of bushels of Mississippi River grainexported through ports on the Gulf of Mexico was found in USDA'sGrain and Feed Market News.
Column 3. An explanatory factor showing the relative pro-portion of barge movements to Gulf exports was calculated bydividing Column 1 by Column 2. Note that the different units,short tons and bushels, were ignored.

F-4
4 a,
0;;
* 0-10N .Z *°
... .... NN NN NNN "'".
°U,
L CL
01 .1
"99999999 .9999.99
- SIn
U,~~~~~ V 'aN v-O~.'.
- - ---- 0 -
... ,.:.',.'...,2. .- .i... .,i..,. -. .....-. :.,.2. ., . . -. .. -. -,i," ,'-- .-i, -. .., , .- ,-, .. .. -.- ,- .- .- .- -'.- . . -.-- ,. ...-. ,-. , 'S" "' -'' " " -- """ """ " '" '" "" .. . -' ' " -" " " -"' " "- - " : "-"-"--- - '-"-"-"-az- la-l '
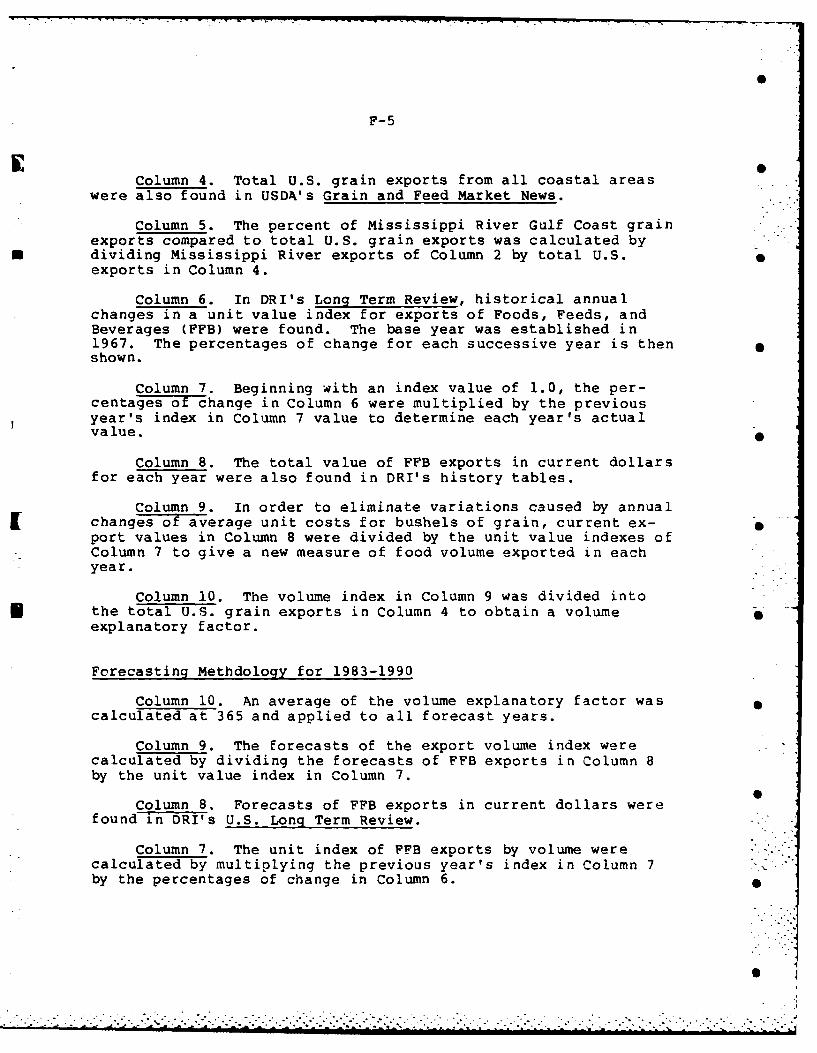
F-5
Column 4. Total U.S. grain exports from all coastal areaswere also found in USDA's Grain and Feed Market News.
Column 5. The percent of Mississippi River Gulf Coast grainexports compared to total U.S. grain exports was calculated bydividing Mississippi River exports of Column 2 by total U.S.exports in Column 4.
Column 6. In DRI's Long Term Review, historical annualchanges in a unit value index for exports of Foods, Feeds, andBeverages (FFB) were found. The base year was established in1967. The percentages of change for each successive year is thenshown.
Column 7. Beginning with an index value of 1.0, the per-centages of change in Column 6 were multiplied by the previousyear's index in Column 7 value to determine each year's actualvalue.
Column 8. The total value of FFB exports in current dollarsfor each year were also found in DRI's history tables.
Column 9. In order to eliminate variations caused by annualchanges of average unit costs for bushels of grain, current ex-port values in Column 8 were divided by the unit value indexes ofColumn 7 to give a new measure of food volume exported in eachyear.
Column 10. The volume index in Column 9 was divided intothe total U.S. grain exports in Column 4 to obtain a volumeexplanatory factor.
Forecasting Methdology for 1983-1990
Column 10. An average of the volume explanatory factor wascalculated at 365 and applied to all forecast years.
Column 9. The forecasts of the export volume index werecalculated by dividing the forecasts of FFB exports in Column 8by the unit value index in Column 7.
Column 8. Forecasts of FFB exports in current dollars werefound n DRI's U.S. Long Term Review.
Column 7. The unit index of FFB exports by volume werecalculated by multiplying the previous year's index in Column 7by the percentages of change in Column 6.
0

F-6
Column 6. Forecasts of FFB percentages of value changeswere also in DRI's U.S. Long Term Review.
Column 5. Estimates of share of Mississippi River exportsas a percentage of national exports were made for future years.The share is estimated to drop from 50 percent in 1983 to 42 per-cent in 1990.
Column 4. The forecasts for total U.S. grain exports werecalculated by multiplying the export volume index of Column 9 bythe volume explanatory factor of Column 10.
Column 3. The export share explanatory factor of Mississip-pi River traffic was averaged and applied to all forecast years.
Column 2. The forecasted amounts of Mississippi River Gulfexports were calculated by multiplying the Mississippi River per-cent of U.S. exports in Column 5 by the total U.S. exports inColumn 4.
Column 1. The Mississippi River grain movement forecastswere then finally determined by multiplying the Mississippi RiverGulf exports in Column 2 by the explanatory factor in Column 3.
....i
i4
I
"I'
I2
- " .

- - 1.1 I -
S
* 6
* 0
0
Appendix GI FORECAST OF BARGE TRANSPORTATION DEMAND BY COMMODITY
I -B
*
* 0
S
S
6
.3L Appendix G
FORECAST OF BARGE TRANSPORTATION DEMAND BY COMMODITY
GRAIN FORECAST
Because the inland waterways industry transports more ton-miles per year of grain than any other commodity, the grain fore-cast is the largest and most important component of the indus-try's forecast. Although more tons of coal per year move throughthe inland waterways, grain represents more ton-miles because ofthe longer average trips of grain cargoes.
The category grain is composed of corn, wheat, soybeans,prepared animal feeds, and grain mill products, but this forecastanalyzes it as an aggregate of these commodities.
Summary Forecast
Figure G-1 summarizes the historical and forecast trafficfor grain. Note that this forecast provides more than one pos-sible outcome. The reasons are: the barge services' rate levelsare a question mark, and equally uncertain is the barge indus-try's ability to compete for the grain market.
To reflect these uncertainties, two outcomes are forecast.The base case assumes that the rates recover and the barge shareof total U.S. exports declines from its 1983 peak (50 percent ofall U.S. exports) to a 1990 share of 42 percent. The second caseis a high-traffic scenario, in which the rivers' share of U.S.exports remains at a constant 50 percent. The outcome would beincreased traffic but severely depressed rates. This high-traf-fic forecast is presented in parentheses in Figure G-1 and wasnot used in the example forecast of total traffic that was shownin Figure F-2.
The figure's Column 1 presents the historical and forecastgrain traffic on the Mississippi River System. After the trafficrose dramatically from 23.9 million short tons in 1970, it peakedat 73.8 million tons in 1982. Under a scenario of rising ratesand reduced river share of national exports (the base case), theforecast calls for a slow decline, followed by a slow increasefrom a low of 70.2 million tons in 1984 to 82.9 million tons in1990.
U i
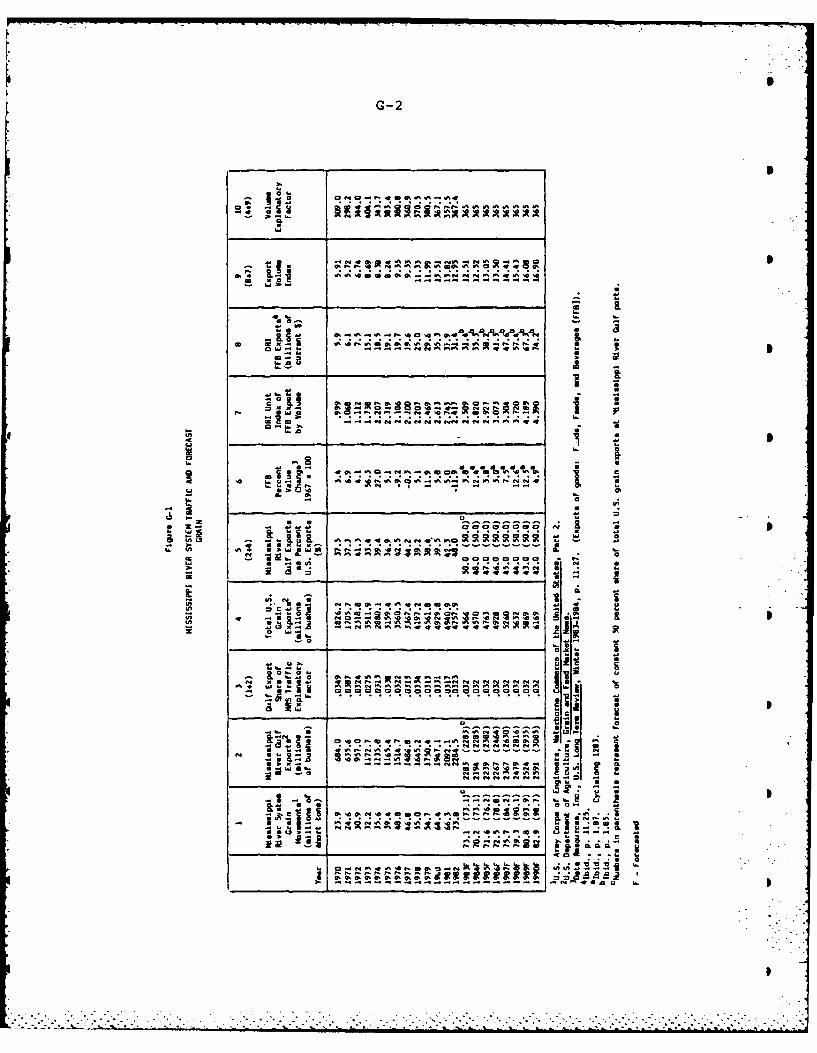
G-2
X Ot Ot r A ,9A
B
0.4
a~a-N4.a.o.v Inf.4
a. 9,Oi N . . . .I
.
6 ' 4 a . 0. . .% . ..-- - - - - - -
in.
M Ot A
W• ." It
4! 9 "9
0 .-1
I-Sa
P! a-
I~~~~~~~ R

G-3
hS
Under the alternative scenario (of a constant 50 percent forU.S. export share), the forecast projects a faster increase intonnage to 98.7 million short tons in 1990.
The relationship between the Mississippi River System'sagricultural traffic and total exports from Mississippi River 0served Gulf ports has been relatively close throughout the13 years of historical data.
The percentage of Mississippi River Gulf port's export graintonnage share versus the total of U.S. grain exports shows varia-tions in Column 5 between 33.4 percent in 1973 to an all-time 0high of 53 percent in 1983. These shares reflect a developingtransportation infrastructure and fluctuating barge rates thatcan increase or decrease the competitiveness of barge transporta-tion from the grain belt, thus making direct rail delivery toAtlantic, Gulf, Pacific, and Great Lakes ports more or lessattractive.
The year-to-year changes in agricultural prices forecast byDRI in Column 6 show that in certain years, such as 1973 and1974, sharp price increases occurred. In other years, smallerincreases and even decreases have been evident. DRI's cumulativechanges in value, calculated by altering a 1967 index of 1.0 forthe year-to-year price changes, in Column 7, show that slightincreases in prices are forecast for the remainder of the 1980s.
Column 9's volumes were derived from a combination of Column8's values and Column 6's information. To check the data's re-liability, the actual U.S. exports for 1970-1982 were divided bythe imputed volumes (Column 9). With a few exceptions (which mayin fact reflect changes in the composition of exports) the rela-tionships have been fairly close, particularly for 1974-1982. onthis basis, exports were projected (presented in Column 4), bymultiplying the DRI volume index by an explanatory factor of 365,
r which was developed in Column 10. This shows a very gradual 5
increase in U.S. exports for 1983-1990.
Figure IV-l is the basic working document for assessinggrain traffic to 1990. In addition to this document, managers
and planners should seek other solid data for analyzing year-to-year changes. The numerous figures that follow are good placesto start.
b •

G-4
Ws 4i A W. NN 41 0% 00. F.,N ~*~~~~~A -f 4'.4 04 ~0~PIpU
-4 -MFN6, -L
f um a 0c A -1% -4 4% 0% 0% " -C4 ..4 N s N cc No44 44
4' C4- -4-N40 A %0v
zs4- -4 s4- - - -4 -U, S -%a -
o q cc 4l , 4 o ar ^%
... w4 4 ^ 0 " S (1% N0
Ill W C % NIll Ch 0p% 4f C W
N4 -4 RA 41 it "1 A N -4 0 W - 'CIA
I"q N 04 ' 04 0%I04 N o C PON NW
0A
4T0 a aaaZ m 0 08% %1
-44tF -a ok fr' -404%VW ..4~ Ch4 -4 -- 4
0 0 ,14IZuN C- a--4 C -44-4-4
04 -- 4 -- -4=-- =
cc -- 0- 'a LN U-4 % O U0 0 0 Cm- NV QIP 4 r ~
00 0 0 CNr UNO0IAIAIAIA441%%C; 00%1;cm~ 0. N% 0 4CK P
N4 N& -4 ? '- Nr ^N
2 S -----Ok~ -I -
0 % -0-P - - - - - -. A-A-0-
UN-llN 0 M 0% A C0 P F ON
it al 0% S c... 44 tJ.4 -'V AIAI I-'C C'CPC'C
Il 1- CA c
-4%a0l -
(.5 I^ aa aN aaaaaa .1W6. 06" It (7, W 0% 0
-0% a% .4 Uw% - P
'4u -45 N400.--'C00 0 -4P I.-400 I~-.C..0N-4.~ C w
Z, 0. 4.0 %NA0 a 1^%o PON N 4 4t At
CPL. 'Ci0 4 %~o 0 P 4tRI0'PL tnn
a h r.I a aaa aa a a a. a a, C 4
0aSO0-4 0 0% ~4 4I C- W% -%
,1-- 1-4 ^~ 0 f 0 r., -M 014 UWS4 P % 0 4.W% #A kA .4A -W'W%
0% , 0~I~-~C .I%4 0 0K Chm-4 -4 -404-4- 4I4 4- - % N -4-4-

G-5
Figure G-3
WORLD GRAIN EXPORTS
(millions of metric tons)
U.S. ShareYear U.S. Canada Argentina Australia Other Total in Percent
1970 29.7 13.8 7.8 8.5 13.5 73.2 40.5%1971 28.4 17.1 7.0 10.7 12.6 75.8 37.51972 43.2 18.3 4.1 9.1 14.3 89.0 48.5 01973 92.9 15.6 9.0 5.1 16.9 139.4 66.61974 77.7 13.0 9.3 9.6 20.1 129.7 59.91975 83.8 14.9 7.7 11.6 19.2 137.2 61.11976 92.1 15.3 8.1 11.9 19.0 146.4 62.91977 87.7 17.4 14.8 16.6 14.8 147.3 59.51978 110.3 18.6 13.6 9.6 17.3 169.3 65.21979 120.2 16.0 15.0 14.5 16.4 182.2 66.0 01980 128.3 20.8 11.7 16.2 21.1 198.1 64.81981 128.8 21.5 20.1 11.6 23.8 205.9 62.61982 121.2 25.7 16.2 15.5 21.1 200.0 60.61983e 119.6 18.7 18.2e 15.5e 21.Oe 193.0e 62 .Oe
E = Estimated.
Source: Organization for Economic Development and Cooperation hritime Statistics andFearniey and Egars World Bulk Trades and Review.
* S
* °-
• . . ..

G-6
Grain Exports
Figure G-2 provides a historical overview of grains thatwere inspected for export. World grain exports (in metric tons)are presented in Figure G-3. The figure shows that the UnitedStates has faced sharp competition from Canada, Argentina, Aus-tralia, and other nations. Although the United States' sharecontinues to far outstrip the rest, dramatic improvements areunlikely.
Figure G-4 shows U.S. grain exports by world area destina-tions. It suggests that the westbound trade from Pacific, Gulf,and Atlantic ports to nations in the Pacific Rim is both moreresilient and stable than the eastbound trade to the United King-dom, Mediterranean, Eastern Europe, Africa, and the Americas.
For example, the United States' eastbound exports have beenseverely hampered by the declining Eastern European commerce,which fell from a high of 27 million metric tons (1979) to a lowof 15 million (1982). Eastbound shipments to the United Statesand Europe stagnated at 20 million metric tons and then graduallydeclined through 1982. In addition, the world's neediest areas,India and Africa, are unlikely to increase their imports becauseof economic constraints. As for westbound traffic, its stabilityis shown by the case of the Japanese imports of American grain,which should remain around 20-23 million metric tons.
- - Information Sources
Figure G-5 provides one example of publicly available intor-mation. The CofE publication discloses the major grain traderoutes for corn, soybeans, wheat, and grain mill products forselected years during 1970-1981. Tonnage for origin and destina-tion pairs are shown.
0 In general, the greatest amount of inland transportationindustry data are available for agricultural commodities. TheU.S. Department of Agriculture and private companies generatehourly grain quotations and daily barge rates, grain transporta-tion, sales, and inspection data, as well as weekly and monthlystatistics. This strategic forecast has not used tr.ese for pre-sentation to the industry, but they can provide additional timelyinformation on the mechanics and forces of the grain transporta-tion industry. Barge operators should analyze this informationregularly.
0m ~ i

* G-7
100
N 4 N0 cc
06.

G-8
Figure G-5
PJOR TRADE PATTERNS FORMISSISSIPPI RIVER SYSTEM GRAIN MOVEMENTS
(millions of tone carried)
1970 1975 1980 1981 From To
Corn
1.8 4.0 10.8 11.5 MISS-MN2M0 MISS-8R2NO2.8 5.9 9.3 9.7 ILL MISS-OR2NO0.8 2.7 2.6 2.5 MISS-WN2MD MISS-NO2l1.4 3.6 1.9 1.5 ILL 1ISS-N02W0.1 0.5 1.4 1.5 OH-LOUD MISS-8R2N0.1 0.1 0.5 0.8 MISS-NO20H MISS-8R2NO0.7 0.5 0.7 0.7 MIN MISS-BR2N03.4 2.9 3.1 4.4 All Other All Other
11.2 20.2 30.3 31.1 Total Total
Soybean
1.4 1.3 3.5 2.6 MISS-MN2M0 MISS-BR2NO0.8 1.1 2.0 2.1 ILL MISS-aR2N01.1 1.2 2.2 1.3 MISS-OWIBR MISS-BR2NO0.1 0.4 1.2 1.2 O-LOUD MISS-BR2NO0.4 0.8 0.5 0.8 MISS-HN2M0 MISS-NO2P . .0.4 0.6 0.4 0.7 ILL MISS-N02W0.2 0.2 0.7 0.7 MISS-MO20H MISS-OR2NO0.4 0.6 0.6 0.7 MISS-OH28R MISS-NO2I3.1 2.7 4.4 4.7 All Other All Other
7.9 8.9 15.5 14.8 Total Total
Wheat
0.1 0.1 0.4 0.7 MISS-W2BR MIS-42W0.1 0.3 0.7 1.3 MISS-OH2BR MISS-BR2N0
- - 0.5 0.8 NISS-NO20H MISS-NO22W- 0.1 0.5 0.5 MISS-M020H MISS-8R2N0
0.2 0.6 0.7 0.7 NISS-MN2MO MISS-NO2W0.1 0.6 0.8 1.1 MISS-MN211 MISS-BR2N4
- 0.3 0.3 0.5 OH-LOUD ISS.-102W2.0 4.0 3.4 4.9 All Other All Other
2.5 5.9 7.3 10.5 Total Total
Other Grains
- - 0.1 0.1 HISS-OH26R MISS1-02W- 0.4 0.7 MlSS-14BR MISS-SR2NO
- - 0.1 0.1 ARK MISS-BR2NO- - 0.2 WF rISS-BR2NO
- - - 0.1 OH-LOUD MISS-BR2N40.5 0.3 0.3 0.4 All Other All Other
0.5 0.3 0.9 1.6 Total Total
Source: U.S. Army Corps of Engineers, Wterborne Commerce ofthe Unilted States, Part 5.

G-9
COAL
Coal is the largest commodity moving on the inland riversystem in terms of tonnage, with grain exceeding coal in ton-miles. Figure G-6 provides an overview for 1980-1990. Columns 1through 5 of this exhibit summarize the composition of exportsfrom the river and Column 4 presents the total Mississippi River 0System traffic. Column 5 traces the domestic inland traffic netof exports, showing the relative stability of domestic traffic byexcluding the volatile and rapid development of the export coalmarket in 1980 and 1981.
The figure shows that coal tonnage for the system peaked in 01981 at 130 million short tons and declined to a low of an esti-mated 119 million in 1983. The forecast shows that the systemwill recover from its currently depressed state over the remain-der of the decade, so that by 1990 the traffic should reach its1981 level, thanks to greater coal exports. By contrast, theprojection for domestic coal movements to domestic consumersshows both stable and fluctuating levels of traffic that reflectthe gradually increasing domestic coal consumption in the wake ofthe loss of coke and coal traffic and certain utility coal traf-fic.
Domestic and Export Trends
Although many industry-watchers assumed that the utilities'increased coal consumption would bring prosperity to the inland
* industry, the coal commerce patterns of the 1970s suggests thatthe river system may not benefit from growth in U.S. coal con-sumption. The reasons are twofold: first, the river systemoperates in a mature industrialized region that traditionallyrelied on coal to produce electricity, so that the level of coaldemand should be unchanged. Second, in addition to serving theutility market, the inland waterway industry provided coke andcoal to steel mills, which are now declining markets because of 0the domestic steel industry's overall malaise.
The influential role of export coal in 1980-1981 is evident,because total export levels from the Mississippi broke the recordof 1.5 million tons for 1945-1979. Exports peaked in 1981 at13.6 million tons. After 1981, traffic declined sharply both in SNew Orleans and Baton Rouge. Nonetheless, increased exports wereprojected on the assumption that even as metallurgical coal ex-ports declined, steam coal exports from the United States toScandinavian and Mediterranean nations will see some recovery,
. .. .'.
G-10
once the deep draft in topping off schemes get working. However,if export coal levels do not recover along with the projectedeconomic recovery of Europe, then the system's traffic levelswill probably stagnate at 120 million tons.
Domestic Consumption
Columns 7 and 8 of Figure G-6 present the relationships be-tween domestic traffic going to domestic consumers and the U.S.'stotal consumption. In 1970-1972, approximately one ton in fivethat was consumed in the United States moved by barge. By 1982,this ratio had fallen to one ton in 6.3. This trend is forecastto continue, so that by 1990 only one ton in 7.1 will move to itsdomestic consumer by Mississippi System barge. Column 8 refinesthe historical ratio and carries it into the future, using athree-year rolling average.
Column 9 of this exhibit summarizes the behavior of onecomponent of domestic consumption that moves by barge. Thiscomponent is the movement of coal by inland barge to lower Miss-issippi ports for transloading and shipment by ocean barge toutilities in Tampa and elsewhere. As Column 9 indicates, thistrade has remained relatively stable. Although the inland bargeindustry ha3 won some new contracts for moving Florida-bound coalfrom the Ohio River to points on the Gulf Intercoastal Waterway,this will probably be offset by competition from low-cost Colom-bian coal, which should displace U.S. suppliers at Florida portsat some point in the 1980s. Whenever the Colombian competitiongains a foothold, it is likely that the inland barge trafficlevels will not stagnate.
Figure G-7 presents the historical and forecast data forU.S. coal consumption. The information covers 1970-1983 on anactual basis and is forecast through 1990. The composition ofcoal consumption should remain constant, with electrical utilitycoal slowly increasing through the end of the decade, coal plantactivity recovering from its 1982 low, but coke demand not reach-inq the levels achieved before 1982. In addition, other indus-trial, residential, and commercial coal demand will probablyremain stable becaise of stable or slowly increasing real pricesof petroleum.
""9

G-11
ai La o-4J -9
0
-C ~ ~ a. .. . . . . . . . . . C
'4m &.. r, 00 44*~~ .4 % R PN 0 W\ No w-- - -- - -
LI \0 %0 r *- .l .- r l
W 0
>..
I- - 0 0 -4 4,-
In r...gt a N - a-- a-- -a, -
L.J 41
a, U
0 0 0 - 4. 1
-C- a n
0' Wn 00~~9 1.- 7Z0h4--
X L%,cc. U) C4 O a-t 1^ \0N rI %~ I I I
.. j~~. f. oe 09. 4 - 4
t- a..
7 2.

G-12
Figure G-7
U.S. COAL CONSUMPTION BY USERS AND FORECAST
1970-1990
(in thousand short tons)
Residential andElectric Utility Coke Plants Other Industrial Commercial
Year Tone Percent (W) Tons Percent () Tons Percent () Tons Percent ( ) Total
1970 319,000 61.9 95,600 18.6 88,400 17.2 12,000 2.3 515,0002971 326,000 66.0 83,200 16.8 73,800 14.9 11,000 2.2 494,0001972 352,000 67.7 87,700 16.9 71,300 13.7 9,000 1.7 520,0001973 389,212 69.2 94,101 16.7 68,154 12.1 11,117 2.0 562,5841974 391,811 70.2 90,191 16.2 64,983 11.6 11,417 2.0 558,4021975 405,962 72.2 83,598 14.9 63,670 11.3 9,410 1.7 562,6411976 448,371 74.3 84,704 14.0 61,799 10.2 8,916 1.5 603,7901977 477,126 76.3 77,739 12.4 61,472 9.8 8,954 1.4 625,2911978 481,235 77.0 71,394 11.4 63,085 10.1 9,511 1.5 625,2251979 527,051 77.4 77,368 11.4 67,717 10.0 8,388 1.2 680,5241980 569,274 81.0 66,657 9.5 60,347 8.6 6,451 0.9 702,7301981 596,797 81.5 61,014 8.3 67,395 9.2 7,421 1.0 732,627
1982 593,666 84.0 40,908 5.8 64,097 9.1 8,240 1.2 706,9111983 625,211 84.9 43,800 5.9 65,980 9.0 8,448 1.1 736,6721984F 632,500 82.9 49,500 7.2 67,000 8.8 8,000 1.1 757,0001985F 643,900 82.5 53,000 7.5 70,000 9.0 8,000 1.0 774,9001986F 645,700 82.3 54,500 7.7 70,000 8.9 8,000 1.0 778,200 -
1990F 644,100 82.4 59,500 7.6 70,000 9.0 8,000 1.0 781,200
F z Forecast
Source: DOE Monthly Energy Review; Energy Information Administration (1970-1983).TBS analysis of Data Resources Inc. data (1984-1990).
. .. -

- -- - - - - - - - - -
G-13
Coal Indicators 5
As background information for the inland barge industry,this Appendix provides several key coal indicators. Figure G-8summarizes the U.S. coal industry for 1970-1983. Domestic pro-duction peaked in 1982 at 838 million tons, declining to 784million tons in 1983. Exports grew steadily between 1978-1981from 41 to 113 million short tons, while stocks fluctuated by asmuch as 100 million tons, ranging between a low of about 63 daysin late 1974 and a high of 106 days in late 1980. Stocks of coalwill continue to fluctuate with every new United Mine Workersagreement and each export contract.
Figure G-9 examines the composition of U.S. electrical gen-eration by primary energy source, showing coal's historical highof 54.5 percent of the total kilowatts generated in 1983. Coalgeneration is forecast to remain stable over the rest of thedecade. By contrast, petroleum generation should grow althoughpetroleum's performance will be significantly below its percent- Sage and absolute volume of kilowatts generated during the late1970s. This reflects the maturity of the coal generating powerplant inventory and the utilities' use of petroleum and alterna-tive sources of power to meet the forecasted, slowly increasingdemand for electric power.
Figure G-10 examines coal's efficiency in producing elec-tricity. Since 1977, the industry has produced approximately2,000 kilowatt hours of electricity per ton of coal. It isassumed that this level will continue through the end of the1980s.
Figure G-11 examines the roles of coke and coal in domesticsteel production. The tonnage of coke and coal required declinedsharply, from .7 coking tons per production ton in 1970 to .48in 1983. The reasons are: (1) the increased use of more modernfurnaces, (2) the introduction of regional electric furnaces, and(3) the steel industry's reliance on the most efficient, lowest Scost mills during the recent recession.
For the remainder the 1980s, it is assumed that the rate ofconsumption will stay at a half ton of coking coal per ton ofsteel production. Column 4 of Figure G-11 presents the DRI fore-cast index of steel production and compares it to that of the 0Statistical Abstract of the United States. Since the two sourcesare very close, clearly the DRI index has an enviable track re-cord, and should be a worthwhile resource.
S

G-14
Figure G-8
SUMMARY OF U.S. COAL SITUATION
1970-1983
(in thousand short tons)
ExportDomestic Percentage of Days1
Year Production Consumption Imports Exports Production Stocks Stock
1970 613,000 515,000 36 71,000 11.6 NA NA1971 561,000 494,000 ill 57,000 10.2 NA NA1972 602,492 520,000 -- 55,997 9.3 117,442 821973 598,568 562,584 127 53,587 9.0 104,335 681974 610,023 558,402 2,080 60,661 9.9 96,323 631975 654,641 562,641 940 66,309 10.1 128,050 831976 684,913 603,790 1,203 60,021 8.8 134,438 811977 697,205 625,291 1,647 54,312 7.8 157,098 921978 670,164 625,225 2,953 40,714 6.1 145,551 851979 781,134 680,524 2,059 66,042 8.5 181,646 971980 829,700 702,730 1,194 91,742 11.1 204,028 1061981 823,775 732,627 1,043 112,541 13.7 185,274 921982 838,112 706,911 742 106,277 12.8 195,254 1011983 784,865 736,672 1,271 77,772 9.3 168,654 84
Source: Department of Energy, Monthly Energy Review.

G-15
I.
Figure G-9
ELECTRICITY GENERATION BY PRIMARY ENERGY SOURCESU.S. HISTORY AND FORECAST
1970-1990
(million kilowatt-hours)
JQIND49&G CoalI Petroleum2
All Fuel Percentage PercentageYear Coal Petroleum Other Total (W (%)
1973 847,651 314,343 698,716 1,860,710 45.6% 16.91974 828,433 300,931 737,776 1,867,140 44.4 16.11975 852,786 289,095 775,768 1,917,649 44.5 15.11976 944,391 319,988 773,317 2,037,696 46.3 15.71977 985,219 358,179 780,925 2,124,323 46.4 16.91978 975,742 365,060 865,529 2,206,331 44.2 16.51979 1,075,037 303,525 868,810 2,247,372 47.8 13.51980 1,161,562 245,994 878,883 2,286,439 50.8 10.81981 1,203,203 206,421 885,188 2,294,812 52.4 9.01982 1,192,004 146,797 902,410 2,241,211 51.8 6.41983 1,259,424 144,499 906,362 2,510,285 54.5 6.3
1984F 1,265,049 146,987 997,583 2,407,619 52.5 6.11985F 1,287,731 145,270 1,029,199 2,462,200 52.3 5.91986F 1,291,400 135,151 1,076,249 2,502,800 51.6 5.41990F 1,288,161 194,691 1,184,148 2,667,000 48.3 7.3
1DRI EUF % COAL.2DRI ELF % PET.
F = Forecasted
Source: Coal, Petroleum, and Other Consumption by TBS analysis of DOE MonthlyEnerqX Review, Energy Information Administration (1970-1983).JQIND49&G time series from Data Resources Inc. (1984-1990).
.. . . .. . . . .. . . . . . . . .. .. .. . . . . . . . . . .' . . . ..." ' - - . . - - -"' , - " . " "-

G-16
Figure G-10
ANALYSIS OF ELECTRIC UTILITYCOAL CONSUMPTION EFFICIENCY AND FORECAST
Coal CoalKilowatt-Hours Tore for Kilowatt-Hours
Year Millions I Electricity2 Per Ton
1973 847,651 389.2 2,1801974 828,433 391.8 2,1101975 852,786 406.0 2,1001976 944,391 448.4 2,1101977 985,219 477.1 2,0701978 975,742 481.2 2,0301979 1,075,037 527.1 2,0401980 1,161,562 569.3 2,0401981 1,203,203 596.8 2,0201982 1,192,004 593.7 2,0101983 1,259,424 625.2 2,0141984F 1,265,049 632.5 2,0001985F 1,287,731 643.9 2,0001986F 1,291,400 645.7 2,0001990F 1,288,161 644.1 2,000
1 Source: Figure G-9.2Source: Figure G-7.
F Forecasted.
0
. -

G-1 7
IFigure G-l1
U.S. COKING COALHISTORY AND FORECAST
1 2 3 4 5(1.2) (2.4)
U.S. Steel1 Coking Tons DRI Iron2
Coking Tons Production per and SteelCoal (millions Production Production Explanatory
(millions) short) Ton Index Factor
1970 95.6 132 .72 1.065 123.91971 83.2 120 .69 .951 126.21972 87.7 133 .66 1.072 124.11973 94.1 151 .62 1.231 122.71974 90.2 146 .62 1.217 120.01975 83.6 117 .71 .967 121.01976 84.7 128 .66 1.052 121.7 S1977 77.7 125 .62 1.021 122.41978 71.4 137 .52 1.140 120.21979 77.4 136 .57 1.147 118.61980 66.7 112 .60 .945 118.51981 61.U 121 .50 1.023 118.31982 40.9 74 .55 .622 118.51983F 43.8 92 .48 .739 118.5 51984F 49.5 99 .50 .839 118.51985F 53.0 106 .50 .897 118.51986F 54.5 109 .50 .916 118.51990F 59.5 119 .50 1.003 118.5
15ource: Statistical Abstract of the United States. g2DRI indicator 3QIND331.
F Forecasted.
. . . . . . . . .i ; . . . . ... : _ . . . . ...

G-18
Origins and Destinations
Finally, Figure G-12 presents the summary of coal originsand destinations, drawn from CofE statistics. It identifies themajor port piers so that operators can examine both actual traf-fic and long-term trends.
CRUDE OIL
Figure G-13 presents the historical and forecast informationon crude oil traffic on the Mississippi River System. The figurereveals a close correlation betwen Mississippi crude oil trafficand the volume of crude oil production in Petroleum Area DefenseDistrict III (PADD III), which comprises the Gulf states andtheir offshore regions. Between 1970-1979 this relationship wasextremely close. Since then, however, the demand for river traf-fic dropped faster than PADD III crude production, primarilybecause of the increasing use of pipelines to carry crude oil.
The figure shows that PADD III crude production has beendeclining steadily since 1972, despite the crude oil priceincreases, deregulation of crude oil prices, and record levels ofoffshore drilling during the late 1970s. This decline shouldcontinue at the rate of approximately five percent a year. Theforecasted ratio of barge traffic to PADD III production, whichis the average of 1981-1982, will remain constant. Therefore, asproduction declines, so will the associated barge traffic.
PETROLEUM PRODUCTS
Refinery Overview
To analyze properly the petroleum products trade for theinland waterways, one must examine the nation's energy policy,rate of energy consumption, and other specific indicators. Thepetroleum products trade is segmented into two major categories:dirty products (residual fuel oil, asphalt, tar, pitch, and crudetars) and clean products (all other basic petroleum fuels).
. .. . . . .. . . . . . . . . . . . . . . . . . . . . ..
. . . . . . . . . .. . . . . . . . . . . . . . . . . .***§~~-.j* *~-*

- Ii I
lS
G-19
Figure G-12
MAJOR TRADING PATTERNS FOR MISSISSIPPI RIVER SYSTEM COAL MOVEMENT
(millions of tons) S
1970 1975 1980 1981 From To Primary Secondary
22.2 19.2 15.0 12.1 MON MON Steel Utility0.4 - 2.8 7.7 OH-LOUD OH-HUND Utility :nduetry2.8 5.3 6.4 6.1 OH-LOUD OH-LOUD Utility Industry0.1 - 5.8 6.1 MISS-MO20H MISS-OH28R Utility Industry3.5 1.9 4.8 5.7 OH-HUND OH-PITD Steel Industry7.3 6.1 7.3 5.5 MON OH-PI TD Steel Utility9.1 8.1 4.9 5.4 GREEN OH-LOUD Utility Industry4.9 4.5 4.7 4.9 OH-PITD OH-PITD Steel Utility- 5.7 5.2 4.5 OH-LOUD CUMB Utility Industry4.9 5.1 4.8 4.4 ILL CHIC Utility Industry0.6 0.1 4.2 4.2 OH-HUND OH-LOUD Utility Industry3.2 2.3 3.8 4.1 OH-HUND MON Steel Utility0.4 0.5 1.2 4.1 OH-LOUD MISS-NO2W Export Utility3.9 2.1 1.5 3.7 TENN TENN Utility Industry3.2 2.0 2.8 3.7 KAN OH-HUND Utility Industry ,1.4 6.5 2.9 3.2 OH-HUND OH-HUND Utility Industry3.1 2.8 2.4 2.4 GREEN MISS-NO2MP Export --
2.8 2.6 2.5 2.3 MISS-MO20H MISS-MN2MO Utility Industry- 1.9 2.5 2.2 OH-PITD TENN Utility Industry2.6 4.5 2.7 2.1 OH-PITD OH-HUND Utility Industry- - 2.8 2.0 MISS-MO20H TENN Utility Industryf - 0.7 1.4 1.6 OH-LOUD ESCAM Utility --
- 1.9 1.5 1.4 MISS-MN2MO MISS-MN2MO Utility Industry0.7 1.4 1.3 1.3 O-PITD OH-LOWD Utility Steel0.1 0.1 1.4 1.3 KAN OH-PITD Steel Utility- - 1.1 1.1 OH-LOUD WOLF Utility Industry
24.8 24.3 25.3 27.5 All Others All Others ....
102.0 115.7 123.0 130.6 Totals
Source: U.S. Army Corps of Engineers, Waterborne Commerce of the UnitedStates, Part 5.
I..
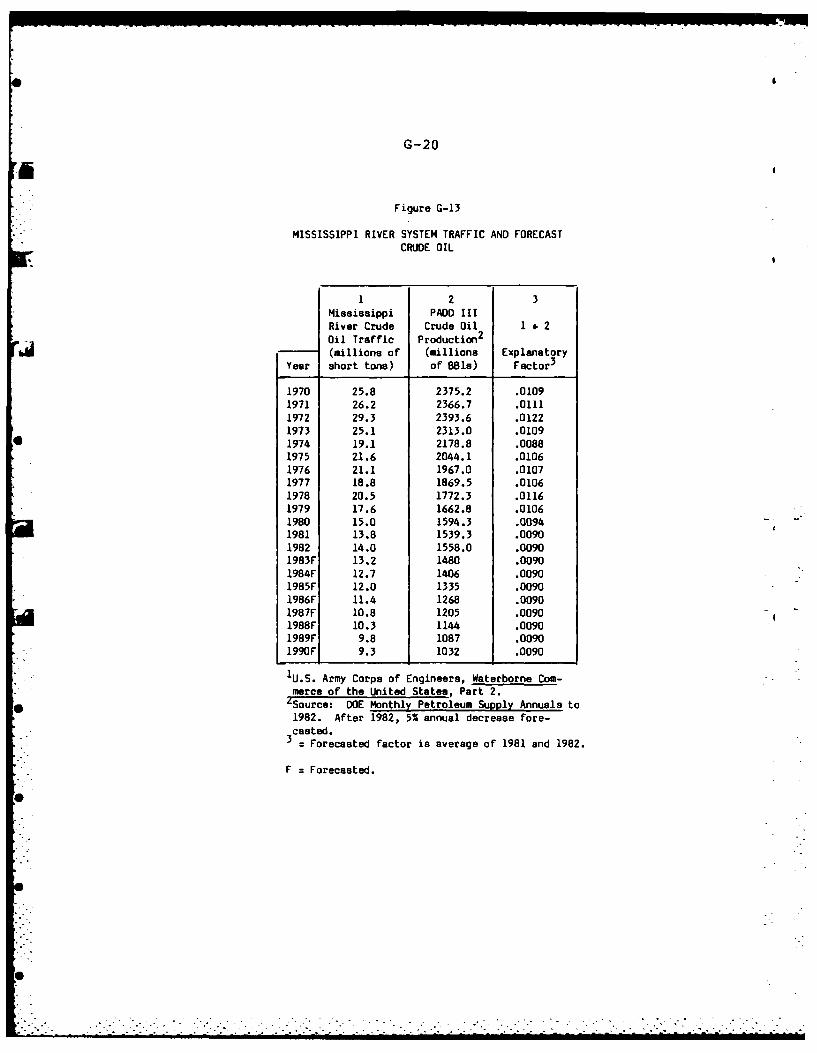
G-20
Figure G-13
MISSISSIPPI RIVER SYSTEM TRAFFIC AND FORECASTCRUDE OIL
1 2 3
Mississippi PADD IIIRiver Crude Crude Oil I # 2Oil Traffic Production
2
(millions of (millions Explanatory
Year short tons) of BBle) Factor3
1970 25.8 2375.2 .01091971 26.2 2366.7 .01111972 29.3 2393.6 .01221973 25.1 2313.0 .01091974 19.1 2178.8 .00881975 21.6 2044.1 .01061976 21.1 1967.0 .01071977 18.8 1869.5 .01061978 20.5 1772.3 .01161979 17.6 1662.8 .01061980 15.0 1594.3 .00941981 13.8 1539.3 .00901982 14.0 1558.0 .00901983F 13.2 1480 .00901984F 12.7 1406 .00901985F 12.0 1335 .00901986F 11.4 1268 .00901987F 10.8 1205 .00901988F 10.3 1144 .00901989F 9.8 1087 .00901990F 9.3 1032 .0090
1U.S. Army Corps of Engineers, Waterborne Com-merce of the United States, Part 2.2Source: DOE Monthly Petroleum Supply Annuals to1982. After 1982, 5% annual decrease fore-casted.3 = Forecasted factor is average of 1981 and 1982.
F Forecasted.
-0o
",-
.
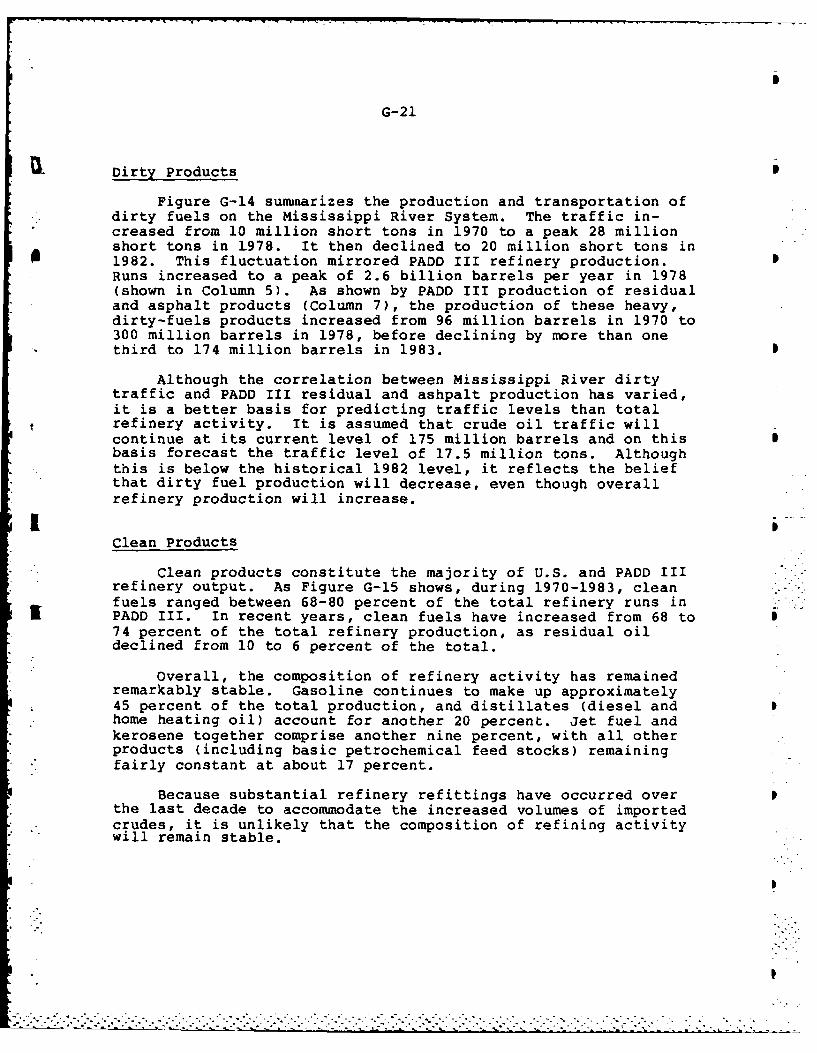
G-21
Dirty Products
Figure G-14 summarizes the production and transportation of* dirty fuels on the Mississippi River System. The traffic in-
creased from 10 million short tons in 1970 to a peak 28 millionshort tons in 1978. It then declined to 20 million short tons in
*1982. This fluctuation mirrored PADD III refinery production.Runs increased to a peak of 2.6 billion barrels per year in 1978(shown in Column 5). As shown by PADD III production of residualand asphalt products (Column 7), the production of these heavy,dirty-fuels products increased from 96 million barrels in 1970 to300 million barrels in 1978, before declining by more than onethird to 174 million barrels in 1983.
Although the correlation between Mississippi River dirtytraffic and PADD III residual and ashpalt production has varied,it is a better basis for predicting traffic levels than totalrefinery activity. It is assumed that crude oil traffic willcontinue at its current level of 175 million barrels and on thisbasis forecast the traffic level of 17.5 million tons. Althoughthis is below the historical 1982 level, it reflects the beliefthat dirty fuel production will decrease, even though overallrefinery production will increase.
Clean Products
Clean products constitute the majority of U.S. and PADD IIIrefinery output. As Figure G-15 shows, during 1970-1983, cleanfuels ranged between 68-80 percent of the total refinery runs inft PADD III. In recent years, clean fuels have increased from 68 to 374 percent of the total refinery production, as residual oildeclined from 10 to 6 percent of the total.
Overall, the composition of refinery activity has remained
remarkably stable. Gasoline continues to make up approximately45 percent of the total production, and distillates (diesel andhome heating oil) account for another 20 percent. Jet fuel andkerosene together comprise another nine percent, with all otherproducts (including basic petrochemical feed stocks) remainingfairly constant at about 17 percent.
Because substantial refinery refittings have occurred over Sthe last decade to accommodate the increased volumes of imported
* .crudes, it is unlikely that the composition of refining activitywill remain stable.
I

G-22
13;
CLU
04
. 4 C4" ( (-4C
CL 06
0.
4
cr 0
- j 4)C
0
C L~
- . 4.) In 10- w r
w 0 11% 4? A 00 14 Im0 0UU.f co -
C- V' C-4 " 4 -CL~- C. .4. C N N N N J N
4-CI
03 L CIO C-
0~' 4' 0 4
0..
U, 0 04
-~~ r. 4-C. 04 0 484N - 4 I IMI
).. f00 . Inw O
.- M-0 ~ 10% UlN Ma 0% oka ,*1a, 0
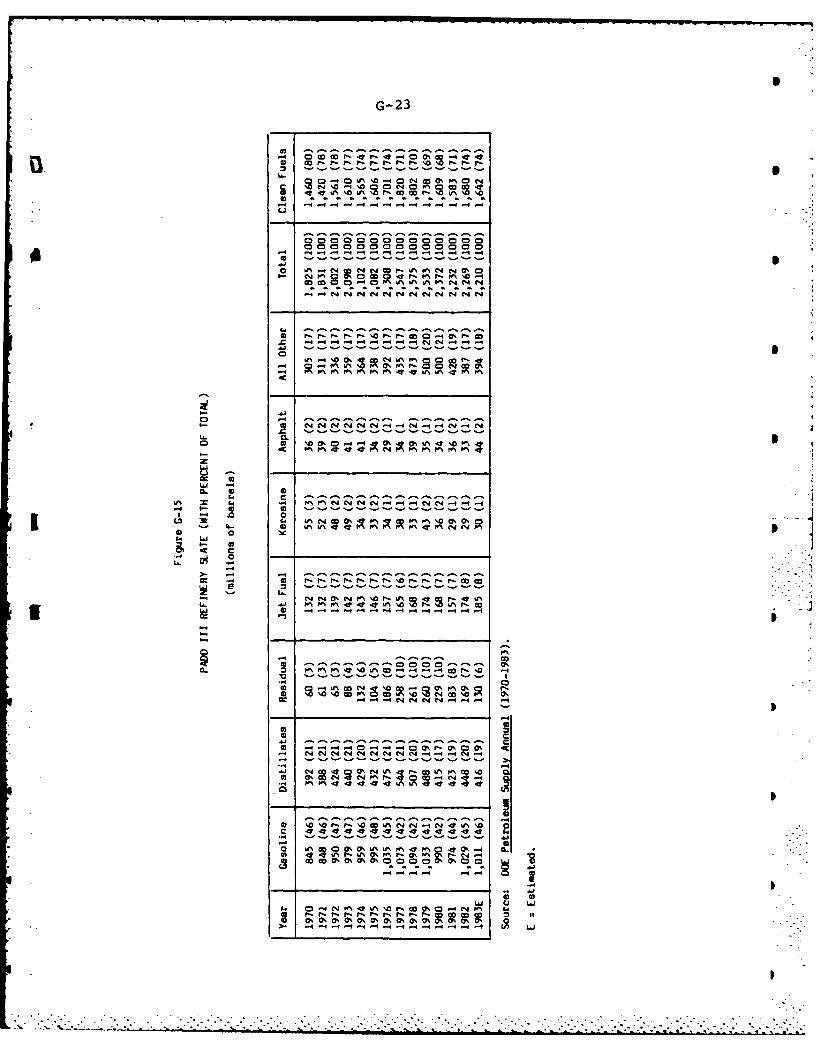
G-23
.6M a .4. -4 00 '-444
-4--
0 ~ ~ ~ ~ r PI % 0- 0 N r, %%P 0 -4
-------------- -
4.
CD V M s4 oWWo %C PINN NNPO% % wt %
&A " I NP -a PN N NIN N4 N NN
0 N* % ' ' F~'% f^ r4 'i~0
P--4
0- - -~ -~ -
-~ ~ NN C N PN In. -, N L^N-
41 #O W -4 etN V% r 4P' W
C n' - l
IA ~ ~ ~ ~ I C4 co %a~NN44N ,44
--------- - - - --4 -4 -4- 7 0 m -
m - 45C r 0C
61 0 %mLNL t(' C
4- coU ,j%& ^r
>.- - - -
LM %a. rw0 01 I
-. m M m 000m . 0% Q. 0
*
G-24
Figure G-16 summarizes the prospects for Mississippi RiverSystem clean fuels traffic. Here, the total volume of clean fuelis represented by gasoline, jet fuel, kerosene, distillate fueloil, lube oil, naptha solvents, and liquified gases. Clean fuelvolume ranged betwen 32 million short tons in 1982 to nearly 41in 1977, after which the traffic declined steadily. What's more,PADD III's production of clean fuel products also fell, althoughnot as dramatically. The forecast predicts that clean fuel pro-duction will remain relatively stable for the rest of this dec-ade: despite the continuing conservation and conversion to al-ternative fuel sources, the economy should also keep expanding,thereby forestalling any decreases in the demand for cleanfuels.
CHEMICAL AND AROMATICS TRAFFIC
Figure G-17 displays the historical and forecast data ontraffic for chemical and aromatic trades. This category includessodium hydroxide, the petrochemical products alcohol, benzine,toluene, and basic chemicals and products. The forecast reliedon the DRI basic chemicals production index, which has proven it-self an accurate indicator of chemical traffic. Because theoutlook for chemical production and, consequently, traffic isstrong the forecast calls for a recovery in 1984-1990, leading toa net growth above the 1979 peak.
Despite the recent growth in the chemical industry, theforecast predicts that trade will outstrip the peak historicallevels, but not until the mid-1990s, so that growth between 1985-1990 will be slight.
The exhibit alsc shows that between 1970-1982, the last ofwhich was a recession year, the net increase in traffic in thiscategory was three percent. Between 1970-1979, the last of whichwas the peak year, growth was 27 percent, compared to the growthin the chemical industry's output, an impressive 63 percent.Since the barge industry's growth was less spectacular, itsfuture increases will continue as the chemical industry expandsbut at a slower pace.
FERTILIZER TRAFFIC REPORT
Figure G-18 presents a forecast for fertilizer traffic onthe Mississippi River System. The historical data show signifi-cant growth between 1970 and the peak year, 1980. During thisperiod, the system's fertilizer tonnage more than doubled, inline with a 33 percent increase in fertilizer tonnage.
- - . - .. •

G- 25
-- 0 ' 1
ac CL
In
NR S
-m U . . . . c.;,
NOf .....N NfiN i fN

G-26
Figure G-17
MISSISSIPPI RIVER SYSTEM TRAFFIC AND FORECAST
CHEMICALS AND AROMATICS
1 2 3 4 5(12) (1.3)
ississipi U.S. Dept.System Chem- Commerceical Tone I Chemical(millions- Production DRI Basic Explanatory Explanatory
Year short) Index 2 Chsmicals 4 Factor 1 Factor 2
1970 15.0 120 1.179 .125 12.71971 15.6 126 1.236 .124 12.61972 16.3 144 1.377 .113 11.81973 15.0 155 1.477 .097 10.21974 16.9 159 1.533 .106 11.01975 14.8 147 1.360 .101 10.91976 15.2 171 1.617 .089 9.41977 16.3 186 1.718 .088 9.51978 17.1 197 1.818 .087 9.41979 19.1 212 1.921 .090 9.91980 18.7 207 1.875 .090 10.01981 17.8 216 1.869 .082 9.51982 15.5 196 1.573 .080 9.91983F 17.0 - 1.750 - 9.71984F 18.7 - 1.928 9.71985F 19.4 - 1.999 - 9.71986F 20.0 - 2.064 - 9.71987F 21.4 - 2.203 - 9.71988F 23.1 - 2.385 - 9.71989F 21.7 - 2.235 - 9.71990F 20.9 - 2.158 - 9.7
1 Source: USACE-WCUS Part 2.2Source: DOE Statistical Abstract of the United States. (1970-1982)3Source: OE/TBS forecast 1983 onward.4DRI JQINO281 and March 1984 CycleLong.
E = Estimated.F = Forecasted.
+-
.. . . . .. .. . . . .............. " . " + .,-- "+ ,-+ • . , • ......

G-27
Figure G-18
MISSISSIPPI RIVER SYSTEM TRAFFIC AND FORECAST
FERTILIZER
1 2 3 4 SMississippi All U.S. DRI Index of Explanatory
River Fertilizer Production FactorSystem Consumption2 for (143)
Fertilizer (millions of AgriculturalMovements tons) Chemicals(millions of (1967 = 1.000)
Year short tons)
1970 3.9 39.6 1.079 .0981971 4.5 39.9 1.035 .1131972 6.5 39.9 1.089 .1631973 5.9 41.8 1.270 .1411974 6.5 47.1 1.447 .1381975 6.2 42.5 1.641 .1461976 6.0 49.2 1.854 .1221977 7.0 51.6 2.012 .136
1978 7.1 47.5 2.118 .1491979 7.6 51.5 2.216 .1481980 8.4 52.8 2.307 .1591981 7.3 54.0 2.415 .1351982 6.5 48.7 2.087 .133
1983F 6.3 45.1 1.932a .141984F 6.7 48.0 2.056a .141985F 7.3 51.9 2.2258 .141986F 7.7 55.0 2.357' .14
1987F 8.2 58.7 2.514a .141988F 8.7 62.0 2.657a .141989F 8.9 63.8 2.734a .141990F 9.3 66.6 2.85 5a .14
ISource: U.S. Army Corps of Engineers, Waterborne Commerce ofthe United States, Part 2 (phosphate rock, nitrogenous chemi-cal fertilizers, fertilizers and materials, n.e.c., and lime). S
2 Data Resources, Inc., U.S. Long Term Review, Winter 1983-84,
p. 11.47.Source: DOC, Statistical Abstract of the United States,a , (FEA), p. 670.DRI, op. cit., CYCLELONG1283, p. 1.127.
F Forecasted. •
S-.
". " .- ' ' -" -. .". N -..' -. -. .i ..-' -i . .. --- .. .'- -" .- .--" -- . ,. ,. ."' - . ------.. -. ? .-, .' i ' , '. ' : < : ' , -' '. ' - . .i

G-28
The forecast indicates that the river system will experiencegradual increases as national fertilizer production increases.For the purposes of this forecast, the United States' tonnage wasused with the assumption that one ton of fertilizer in seven willmove on the Mississippi River System. This ratio has been rela-tively stable for more than a decade. Despite changes in thepricing structure and regulation of the railroad industry, fer-tilizer traffic on the Mississippi System should not feel theireffects. Thus, the historically stable ratio should remain sofor the long term.
Other factors contribute to the traffic's stability. Al-though, for instance, the increasing efficiencies of fertilizerproduction tend to reduce tonnages, these reductions should beoffset to some degree by the increasing demands for fertilizer.Since fertilizer plays a significant role as a northbound back-haul commodity from the lower Mississippi River, the continuedstability of fertilizer traffic will ensure that the barge in-dustry retains this source, which amounts to one ton for everyten downbound tons of export grain. However, because of thisratio imbalance, it is unlikely that fertilizer growth will givecarriers an opportunity to use fertilizer to absorb all theirnorthbound-cycle costs.
CONSTRUCTION MATERIALS
This category includes cement, limestone, stone, sand stone,gravel, and shell. The majority of this tonnage traditionallymoved short distances in private barge fleets because sand andstone is dredged from certain rivers and transported by deckbarge to riverside terminals. For this reason, the ton-milesassociated with these materials tend to be smaller in relation tototal ton-miles than the tonnage has been in relation to totalsystem tons.
Historical and Forecast Traffic
Figure G-19 presents the historical and forecast MississippiSystem construction material tonnage and the key DRI combinedstructures expressed in 1972 dollars for 1970-1990. Constructionmaterials commerce should recover from a 1982 low of 32 milliontons to a 1988 high of 49.5 million tons.
G-29
Figure G-19 also demonstrates the cyclical nature of thistraffic. Between 1970-1982, it varied between 46 million tons in1978 and 32 million tons in 1982. This range of traffic levelsstrongly correlates with the indices of overall constructionactivity, but it tends to be more volatile than the key indica-tors suggest.
In developing this forecast, the historical data was analy-zed for the key states in the river system as well as thenational construction information. The detailed information onthe key states generally indicated somewhat of a correlation toriver traffic.
Key states construction (presented in Column 2) is expressedin 1972 dollars and ranged between 34.8 billion dollars in 1978and 20.6 billion dollars in 1982. By contrast, total U.S. con-struction (also in 1972 dollars) ranged from a high of 108 bil-lion dollars in 1973 to a low of 78.8 billion dollars in 1975.
The relationship between Mississippi System construction andnational construction is slightly closer than between the riversand the key states. The reasons include fluctuating patterns,sand and gravel recovery from both rivers and shoreside loca-tions, changing patterns and locations of construction sites, andvarying levels of shell, cement, and limestone transportationtraffic, which responds to commodity prices.
Note that limestone is classed as a construction material,although the utility and agricultural industries also use it.
3Because the CofE data make no distinctions for different uses, itis impossible to make accomodations other than by including lime-stone here, as a mine mineral.
Construction Activity
Because construction activity affects barge traffic in con-struction materials, it is important to keep abreast of the con-struction industry's history and be on the lookout for newtrends. Column 3 of figure G-20 calculates the total value ofresidential and nonresidential structures built in the UnitedStates (in 1972 dollars). This total was compared to the MacGraw
" Dodge historical total construction levels, which appears in theStatistical Abstract of the United States. Using the informationin Column 5, it is easy to see that DRI's and MacGraw Dodge'svalues do not coincide precisely. However, the DRI nonresi-dential and residential structural forecasts were used. AsColumn 3 indicates, construction should recover in 1983-1984 andgrow slowly from 1985 onward.
•I

G- 30
4y w.- 0 0a I
Lx4
04' c
0.4
C,, W~ co' m 0 0 P0" w- a, Q'0 am0'0x 0S inf - - - - ---
V)V
U0 0 C
Z0 u.4 C
- C N 0U
U- . LnC C ~ 4
Z
C- - 0 C144) 0 r-
0~ ) I- ' L0
S 0 Cg
C..)m 00 *
- -' -~ -4 -- i

G- 31
C Q0 G0 1N 0% 99 9 9 9 9 90. .o aJ 0%o1'ow
co M -- *
OV- 'Coo%0% 4N M 00 lowIIIV ~ ~ ~ ~ ~ . 1 1 r_ .;91 I_ _ I ,*M
10 0 w ,Mr a o r
z
C2 u.0 I C
C-)4=r
-C M).
Z4(n 0 u c 0 " s15 s l~ m mL 0 - -
a) W. --1.. 01
cc -- C4
4) Z
- U-U-U-L-4-L
04.J 01 10 r- W (7 0 C4 UN \0 r,0% MC cy m4~ UUu~% -
rar ,r -M lch0 7 y y , m Ca , 0 ,L

G-32
Figure G-21 covers 1970-1982 construction activity in thekey states (Illinois, Ohio, and Pennsylvania) of the MississippiRiver System. When adjusted to 1972 dollars, strong cyclicalforces are evident. 1982 activity was more than 50 percent belowthe peak of 1978. The figure also shows where the majority ofconstruction occurred. Figure G-22 compares the constructionlevels in the key states to the national level. These keystates' share of national activity has been fairly stable, at
about 30 percent, with recession year decreases to a bottom of 26percent.
WATERWAY IMPROVEMENT MATERIALS FORECAST
Waterway improvements materials represent significantamounts of tonnage but proportionally a very small share of riverton-miles. The historical and forecast information (Figure G-23)shows an overall decline in waterway improvement tonnage over1970-1982. The tonnage varies and largely depends on the amountof CofE dredging and riprap operations. It is assumed that thetonnages for the remainder of the decade will be about six mil-lion short tons, but also recognized that this tonnage couldfluctuate. Because much of this tonnage is transported on flatdeck barges and constitutes heavy riprap, the impact of thiscommodity's traffic on most carriers is minimal.
PROJECTION OF ALL COMMODITY TRAFFIC
In addition to the commodities discussed above, the riversystem moves a volume of miscellaneous commodities that includesores, minerals, paper, lumber, steel products, sugar, salt, and avariety of other commodities. It is difficult to forecast eachof these without a great deal of research into the individualfactors affecting each commodity. In many cases, these commodi-ties move from import or export locations for a small number ofshippers. However, despite the diversity, the aggregate patternfor the the past 13 years is a reasonably accurate basis for thisforecast.
Figure G-24 compares the river system's total tons and allother tons to those of the U.S. Gross National Product (GNP)(both historical and forecast). The relationship between theriver system and GNP is clearly declining. Between 1970-1983,the ratio fell by approximately 17 percent at a steady rate. Inaddition, the relationship between all other tonnage and theriver system dropped even faster. Between 1970 to 1982, therelationship between all other tonnage and the GNP decreased by39 percent, which suggests that the river system has not sharedin the wealth. '1

G- 33
-4 AT--44 LA 4N4 FIN 0 N
WPN P. %a I N UN
6-S-
- 14 N -94W 4441
0% ~ ~ ~ C r-4 W 4% % % 0% O % o;% 14 C;0% N 4~V ~ 0N44- I N I %
4- C% N4V%4 1N ON 4. %0 NIX0 C44 W, -a N-s0 0
g- -4
00
le. 4-$- 4) Nl -
0
'Cr C N C4' 't00' 0%4% 0 Cc0 N 0P#0 *11
co 0
FIN U.' C
CU M ONI N' -yJ
C4C
00 LfC
~~~4 -L5 .:
to~4" a'. -L co4)c400
Z 11U c' m1. 3 )C-0 c 0 4) e4
0% 04N00 0 C CP'-. IrI -
0~ 0cs~~ ~ ~ CDC t *41

G-34
Figure G-22
ANALYSIS OF KEY INLAND STATES AND NATIONAL CONSTRUCTION
1 2 3 4Key States 1 3Construction Total U.S. Total U.S. Key States as
(billion $ 1972)1 (billion $) (billion $1972) % Total U.S.
1970 23.6 68.3 74.6 31.61971 27.7 80.2 77.0 36.01972 27.5 91.0 83.3 33.01973 30.4 99.3 93.9 32.41974 26.0 93.7 81.3 32.01975 22.4 90.0 71.5 31.31976 28.0 110.1 83.2 33.71977 29.6 139.7 99.8 29.71978 34.8 158.4 105.3 33.01979 32.3 168.4 102.9 31.41980 23.3 148.4 83.0 28.11981 20.7 153.5 78.6 26.81982E 20.6 154.6 74.8 27.5 ...
4I1 Source Figure G-21.
E = Estimated.F = Forecasted.
4I
p

S
G-35
Figure G-23
MISSISSIPPI RIVER SYSTEM TRAFFIC AND FORECASTWATERWAYS IMPROVEMENT MATERIALS
Three-YearWater Rolling Average
Improvement Tons Tons(millions) (millions)
1970 8.91971 8.2 8.31972 7.7 8.41973 9.2 9.61974 11.8 9.81975 8.5 9.21976 7.4 7.61977 6.9 7.81978 9.2 8.01979 7.9 7.6
1980 5.8 6.0 S1981 4.41982 4.71983E 6.01984F 6.01985F 6.01990F 6.0
Source: USACE WCUS Part 2.
E = Estimated.F = Forecasted.
. . .b
. . . . . . . . . . . . . . . . . . . .. . . . . . . . . . .. .-.
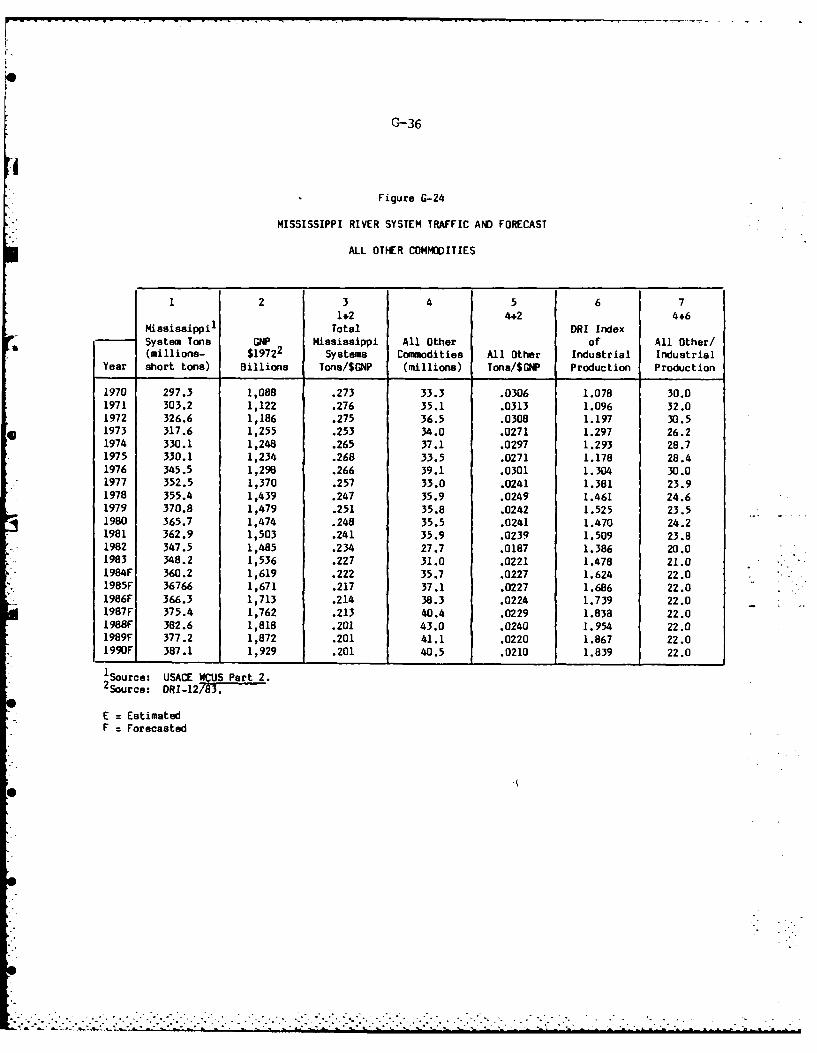
G-36
Figure G-24
MISSISSIPPI RIVER SYSTEM TRAFFIC AND FORECAST
ALL OTHER COMMODITIES
1 2 3 4 5 6 71+2 4+2 4+6
Mississippi, Total DRI IndexSystem Tons GNP Mississippi All Other of All Other/(millions- $19722 Systems Commodities All Other Industrial Industrial
Year short tons) Billions Tons/$GNP (millions) Tons/$GNP Production Production
1970 297.3 1,088 .273 33.3 .0306 1.078 30.01971 303.2 1,122 .276 35.1 .0313 1.096 32.01972 326.6 1,186 .275 36.5 .0308 1.197 30.51973 317.6 1,255 .253 34.0 .0271 1.297 26.21974 330.1 1,248 .265 37.1 .0297 1.293 28.71975 330.1 1,234 .268 33.5 .0271 1.178 28.41976 345.5 1,298 .266 39.1 .0301 1.304 30.01977 352.5 1,370 .257 33.0 .0241 1.381 23.91978 355.4 1,439 .247 35.9 .0249 1.461 24.61979 370.8 1,479 .251 35.8 .0242 1.525 23.51980 365.7 1,474 .248 35.5 .0241 1.470 24.21981 362.9 1,503 .241 35.9 .0239 1.509 23.81982 347.5 1,485 .234 27.7 .0187 1.386 20.01983 348.2 1,536 .227 31.0 .0221 1.478 21.01984F 360.2 1,619 .222 35.7 .0227 1.624 22.01985F 36766 1,671 .217 37.1 .0227 1.686 22.01986F 366.3 1,713 .214 38.3 .0224 1.739 22.01987F 375.4 1,762 .213 40.4 .0229 1.838 22.01988F 382.6 1,818 .201 43.0 .0240 1.954 22.01989F 377.2 1,872 .201 41.1 .0220 1.867 22.01990F 387.1 1,929 .201 40.5 .0210 1.839 22.0
1 Source: USACE WCUS Part 2.2 Source: ORI-12/83.
E = EstimatedF = Forecasted

G-37
To what extent will the river system continue to lose its 0share as the economy expands? One potential answer lies in DRI'sforecast and historical data that describe industrial productionin the United States (see Column 6). Industrial production in-creased significantly, reaching a peak in 1979 that was nearly 40percent above the 1970 level. Comparison of industrial produc-tion to the river systems' all other tons reveals that the sys-tem's decrease here mirrors its decline in relation to the GNP.However, the decrease occurred primarily in the first half of the1970s and since then it has shrunk. It is also possible that the1982-1983 recession caused a temporary sharp decrease in rivertraffic in all other commodities, as U.S. exports and imports ofbasic commodities dropped in response to reduced factory orders.However, the continuation of the recession should stimulate thebarge industry to improve marketing efforts to attract the ship-pers. Thus the river system should be able to snare a slightincrease in its share. Furthermore, regulatory changes couldpromote intermodal transshipping of certain cargoes.
For the purposes of this forecast, it was assumed that astable relationship will continue between the GNP and the riversystem. On this basis, traffic will recover along with indus-trial production, seeing slight growth so that by 1987 the allother category will somewhat exceed the 1976 peak. Although thisforecast may prove optimistic, it is based on sound data and Sanalysis.
B , I...
S
• ' 'L " "''S

G-38
FORECAST OF THE GULF INTERCOASTAL WATERWAY TRAFFIC
The Gulf Intercoastal Waterway represents an additional 10percent of ton-miles compared to the Mississippi River System.Much of the tonnage that moves on the Gulf Intercoastal alsomoves on the Mississippi River System and very little of thetonnage on the Gulf Intercoastal originates and terminates on thesystem itself. Rather, this waterway is a conduit between majorTexas ports and the Mississippi System, and between Mobile andtributaries in the Mississippi System. Traffic on the waterwayis nevertheless important to the industry for several reasons.First, many carriers have specialized in providing transportationon this river system because the physical lock and channel widthand depth constraints on this waterway the system absorb moreequipment than its tons or ton-miles would suggest. Secondly,the Gulf Intercoastal System is particularly significant fortransporating tank cargoes.
There are several obstacles to forecasting trade on the GulfIntercoastal. Most important, it does not produce or consumesignificant amounts of the cargo that it carries. Secondly, itstraffic does not correspond directly to the nation's economicdevelopment. However, these obstacles are not insurmountable.
Traffic Overview
Figure G-25 provides a summary of the historical and fore-cast traffic for the Gulf Intercoastal Waterway. Between 1970-1982, traffic declined by nearly 20 percent, largely led by thedeclines in crude oil transportation. The decreases in tonnageover this period were also affected by sharp swings in traffic,following a peak demand in 1972 when 108 million tons were trans-ported. In contrast to the inland system, the transportation ofpetroleum products has remained relatively strong and is forecastto do so through the end of the 1980s. Also, a decrease in theproduction of marine shell, which is used in concrete productionalong the Gulf Coast, accounted for significant tonnage declines.Coke and chemical aromatics traffic increased, as did the ton-nages of coal, which should increase further with the startup ofpower stations in the Florida panhandle.
The forecasting of Gulf Intercoastal traffic is presented ina series of exhibits (Figures G-26-G-34) that cover the majortraffic categories. The forecast is conservative by not acknow-ledging that net increases in coal consumption could occur inresponse to decisions by Texas and Florida utilities to increaseconversions and therefore would rely on riverborne delivery.
. .j

G- 39
a,'
Cc.
.0 ' V00C' a 2
00
zz
LiiL0 0
00
C
0 00c-n c *
0
00-
0' MOWN US 0O ID 000*P1 N - - - - --- - - - U
Ch in, cy ta C C
3Z (Y' 0.~ 0 ,a ,ol(7
0cc0~ 0 V
Li~ cir-r DM oG Mc c0
a, , c, m () (1 (7 0 cl (1 olaa, ~s 1 O m cl. a,00- - - - - - - -- - -- - - - -S

G-40
Figure G-26
GIWW TRAFFIC AND FORECAST
COAL
1 2 3
U.S. Coal2 I . 2GIWW Coal I Consumption Explanatory
Year (millions tons) (millions tons) Factor
1970 1.9 515.0 .00371971 2.9 494.0 .00591972 4.9 520.0 .00941973 4.4 562.6 .00781974 4.9 558.4 .00881975 4.3 562.6 .00761976 4.8 603.8 .00791977 4.2 625.3 .00671978 4.0 625.2 .00641979 5.0 680.5 .00731980 5.1 702.7 .00731981 4.6 732.6 .00631982 4.0 707.0 .00571983F 4.9 736.7 .00661984F 4.8 757.0 .00631985F 5.0 774.9 .00641986F 5.1 778.2 .00651990F 5.3 781.2 .0068
'Source: USACE WCUS Part 2 (through 1981).2 Source: Figure G-7.
E = EstimatedF = Forecasted
Ldf. _ _. . . ..__ _ _._ _ . . . ._ _
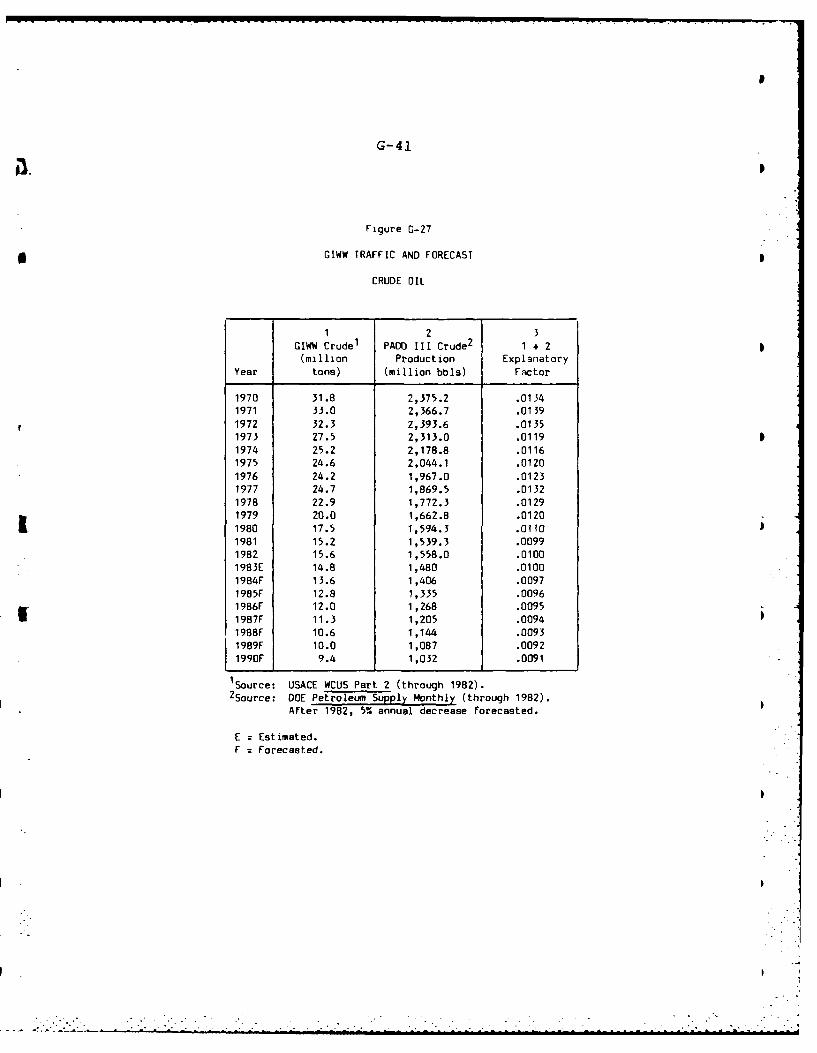
G- 41
Figure G-27
* OIWW TRAFFIC AND FORECAST
CRUDE OIL
12 3
GIWW Crude1 PADO III Crude2 1 * 2(million Production Explanatory
Year tons) (million bbls) Factor
1970 31.8 2,375.2 .01341971 33.0 2,366.7 .01391972 32.3 2,393.6 .01351973 27.5 2,313.0 .01191974 25.2 2,178.8 .01161975 24.6 2,044.1 .0120
1976 24.2 1,967.0 .01231977 24.7 1,869.5 .01321978 22.9 1,772.3 .01291979 20.0 1,662.8 .0120
I1980 17.5 1,594.3 .01101981 15.2 1,539.3 .00991982 15.6 1,558.0 .01001983E 14.8 1,480 .0100
1984F 13.6 1,406 .00971985F 12.8 1,335 .00961986F 12.0 1,268 .0095
ft1987F 11.3 1,205 .00941988F 10.6 1,144 .0093F1989F 10.0 1,087 .00921990F 9.4 1,032 .0091
1Source: USACE WCUS Part 2 (through 1982).2Source: DOE Petroleum Supply Monthly (through 1982).
Arter-1982, 5% annual decrease forecasted.
E =Estimated.F =Forecasted.
. . . . . . .4

G-42
Figure G-28
GIWW TRAFFIC AND FORECAST
PETROLEUM PRODUCTS
1 2 3GIWW Product PADO III
Traffic1 Refinery Runs2 1 * 2(million Distillate Explanatory
Year tons) and Residual Factor
1970 20.2 452 .0451971 23.9 449 .0531972 23.5 489 .0481973 ?2.6 528 .0431974 25.6 561 .0461975 24.0 536 .0451976 25.4 661 .0381977 30.9 802 .0391978 28.9 768 .0381979 33.3 748 .0451980 29.8 644 .0461981 30.1 584 .0521982 29.6 617 .0481983E 27.3 546 .0501984F 27.5 550 .0501985F 27.5 550 .0501990F 27.5 550 .050
1Source: USACE Part 2 (through 1981).2Source: DOE Petroleum Supply Monthly (through 1982).
E = Estimated.F = Forecasted.
. . .

G-43
Figure G-29
ANALYSIS OF GULF COAST CONSTRUCTION AND FORECAST
2 3 4 5 6 73 4Adjusted DRI Total
Total Const. Total Const. I + 2 Adj. Factor Construction U.S. 5 # 6Alabama1 Texas I Total (billion (billion Structures 2 Explanatory
Year (billion $) (billion $) (billion $) $1972) $1972) ($1972) Factor
1970 1.0 4.1 5.1 .915 5.6 83.7 .0671971 1.2 5.0 6.2 .961 6.5 95.2 .068
1972 1.4 5.8 7.2 1.00 7.2 106.4 .068
1973 1.6 6.2 7.8 1.058 7.4 108.0 .0691974 1.3 6.5 7.8 1.152 6.8 90.0 .076
1975 3.1 6.4 9.5 1.258 7.6 78.8 .0961976 1.9 7.9 9.8 1.324 7.4 89.0 .083
1977 2.0 10.7 12.7 1.400 9.1 99.2 .092
1978 2.6 13.8 16.4 1.504 10.9 105.1 .1041979 2.5 13.1 15.6 1.637 9.5 106.2 .089
1980 1.9 13.6 15.5 1.787 8.7 93.7 .093 51981 1.8 16.2 18.0 1.952 9.2 94.5 .097
1982E - - - - 8.7 91.5 .0951983F - - - - 9.6 100.7 .095
1984F - - - - 10.5 111.0 .095
1985F - - - - 10.5 110.9 .095
1986F - - - - 10.9 114.8 .095
1987F - - - - 11.5 121.4 .095
1988F - - - - 11.8 123.7 .095
1989F - - - - 10.7 113.1 .0951990F - - - - 11.1 116.9 .095
1Source: DOC Statistical Abstract of the U.S., F.W. Dodge original data.2Source: Forecast DRI.
E = Estimated.F = Forecasted.
" " "' '
I
I
Il

G-44
Figure G-30
GIWW IRAFFIC AND FORECAST
MARINE SHELLS
1 2 3GIWW Marine 3 Year 3 Year
ShEIls 1 Average Average Ratio
Year (million tons) (million tons) to Prior Year
1970 13.8 --.1971 12.9 13.0 --1972 12.3 12.7 .981973 12.8 12.2 .961974 11.5 11.4 .931975 9.8 9.6 .841976 7.5 8.4 .881977 7.9 7.5 .891978 7.0 6.8 .911979 5.6 6.2 .911980 5.9 5.0 .891981 5.2 -- .90
1982 3.9 -- .901983E 4.2 -- .901984F 3.8 -- .901985F 3.4 -- .901986F 3.1 -- .901987F 2.8 -- .901988F 2.5 -- .901989F 2.2 -- .901990F 2.0 -- .90
1Source: USACE WCUS Part 2.
E = Estimated.F = Forecasted.
6!-
0!
6o
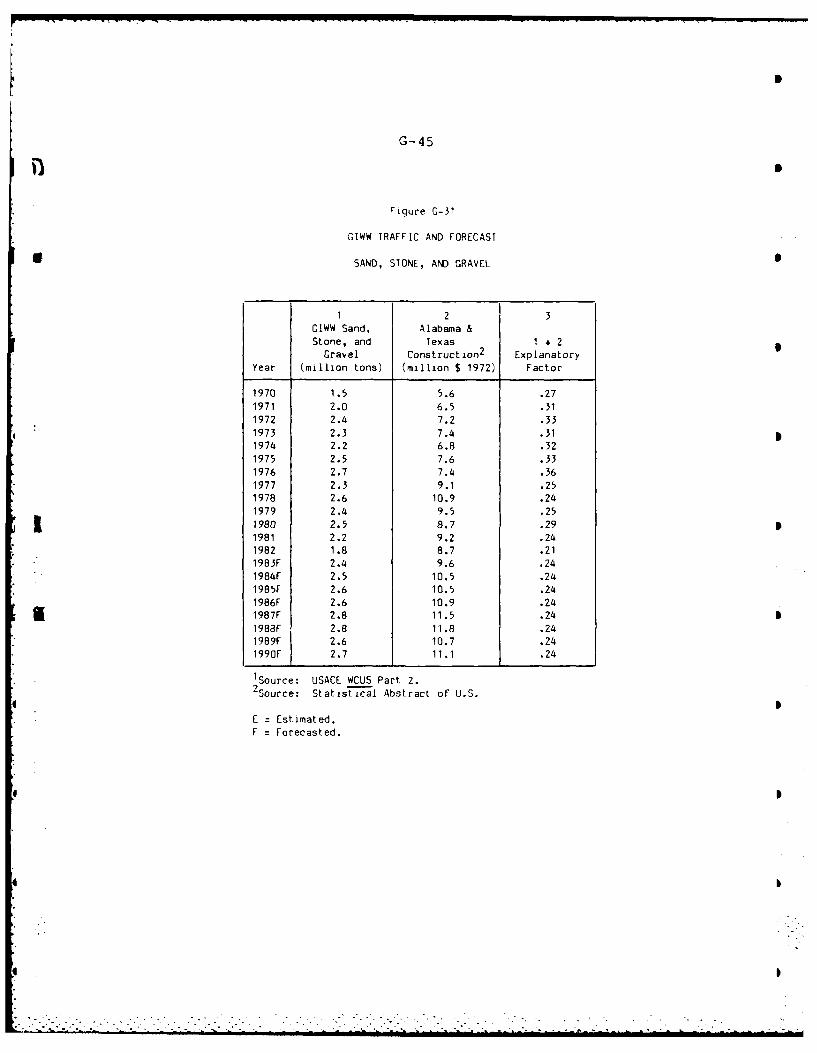
G-45
Figure G-31
GIWW TRAFFIC AND FORECAST
SAND, STONE, AND GRAVEL
1 2 3
GIWW Sand, Alabama &Stone, and Texas 1 4 2
Gravel Construction2 ExplanatoryYear (million tons) (million $ 1972) Factor
1970 1.5 5.6 .271971 2.0 6.5 .311972 2.4 7.2 .331973 2.3 7.4 .311974 2.2 6.8 .321975 2.5 7.6 .331976 2.7 7.4 .361977 2.3 9.1 .251978 2.6 10.9 .241979 2.4 9.5 .251980 2.5 8.7 .291981 2.2 9.2 .241982 1.8 8.7 .211983F 2.4 9.6 .241984F 2.5 10.5 .241985F 2.6 10.5 .241986F 2.6 10.9 .241987F 2.8 11.5 .241988F 2.8 11.8 .241989F 2.6 10.7 .241990F 2.7 11.1 .24
1Source: USACE WCUS Part 2.2Source: Statistical Abstract of U.S.
E = Estimated.F = Forecasted.
* Ji

G-46
Figure G-32
GIWW TRAFFIC AND FORECAST
CONSTRUCTION MATERIALS
1 2 3GIWW GIWW Sand, Stone
Year Marine Shell 1 Gravel1 Total
1970 13.8 1.5 15.3
1971 12.9 2.0 14.91972 12.3 2.4 14.7
1973 12.8 2.3 15.11974 11.5 2.2 13.7
1975 9.8 2.5 12.31976 7.5 2.7 10.21977 7.9 2.3 10.2
1978 7.0 2.6 9.61979 5.6 2.4 8.01980 5.9 2.5 8.41981 5.2 2.2 7.41982 3.9 1.1 5.71983E 4.2 2.4 6.61984F 3.8 2.5 6.3
1985F 3.4 2.6 6.01986F 3.1 2.6 5.71987F 2.8 2.8 5.61988F 2.5 2.8 5.31989F 2.2 2.6 4.81990F 2.0 2.7 4.7
'Source: USACE WCUS Part 2.
E r Estimated.F = Forecasted.
L
, .6 i i . . . . _ .: . : :.

G-47
ii.
Figure G-33
GIWW TRAFFIC AND FORECASTUCHEMICALS AND AROMATICS
1 2 3 4 5PADO 1I1 1 + 2 2 + 4
GIWW Chemicals Aromatic and DRITraffic
1 Petrochemical Chemical
(million Runs2
(mil- Explanatory Production ExplanatoryYear tons) lion bbls) Factor Index
3 Factor
1970 9.2 305 .030 1.179 258.71971 9.1 311 .029 1.236 251.61972 10.6 336 .932 1.307 244.01973 9.9 359 .028 1.477 243.11974 5.4 364 .015 1.533 237.41975 9.7 338 .029 1.360 248.51976 10.8 392 .028 1.617 242.41977 11.4 435 .026 1.718 253.21978 12.8 473 .027 1.818 260.21979 13.3 500 .027 1.921 260.31980 12.0 500 .024 1.875 266.71981 11.9 428 .028 1.869 229.01982E 10.0 386 .026 1.573 245.41983F 11.4 438 .026 1.750 2501984F 12.5 482 .026 1.928 2501985F 13.0 500 .026 1.999 2501986F 13.4 516 .026 2.064 2501987F 14.3 551 .026 2.203 2501988F 15.5 596 .026 2.385 2501989F 14.5 559 .026 2.235 2501990F 14.0 540 .026 2.158 250
1 Source: USACE WCUS Part 2.2Source: DOE Petroleum Supply Monthly.3DR[ JQIND281.
E = Estimated.F = Forecasted.
(Note: Col. 1 Forecasts are Col. 2 x Col. 3. Col. 2 based on Col. 4 x Col. 5(forecast).)
4
• . . . -,

G-48
Figure G-34
GIWW TRAFFIC AND FORECAST
ALL OTHER COMMODITIES
2 31,2
GIWW All Other1 GNP 2 ExplanatoryYear (million tons) (billion $ 1972) Factor
1970 15.6 1,088 .0141971 16.2 1,122 .014
1972 16.7 1,186 .0141973 15.9 1,255 .013
1974 22.6 1,248 .0181975 16.2 1,234 .013
1976 15.6 1,298 .0121977 17.6 1,370 .0131978 17.5 1,439 .0121979 11.9 1,479 .008
1980 15.9 1,474 .0111981 16.2 1,503 .0111982 9.8 1,485 .00071983E 16.9 1,536 .0111984F 17.8 1,619 .0111985F 18.4 1,671 .0111986F 18.8 1,713 .0111987F 19.4 1,762 .0111988F 20.0 1,818 .0111989F 20.6 1,872 .011
1990F 21.2 1,929 .011
1Source: USACE WCUS Part 2.2 Source: Forecast DRI.
E = Estimated.F = Forecasted.
. . .. • . .. .

G-49
However, the conservative forecast is justified because it takesinto account the hard competition from railroads for this traf-fic, as well as greater coal imports from Colombia.
HISTORICAL TON-MILE ANALYSIS
Figures G-35, 36, and 37 summarize ton-miles on the Missis-sippi River System and other connecting tributaries. Figure G-35summarizes this information as billions of ton-miles. This exhi-bit shows that the most dramatic growth occurred on the Missis-sippi River between Baton Rouge and New Orleans, because ofincreased grain exports, while traffic on other rivers grew atvarying rates. Figure G-36 measures this relative growth on anindex basis (with 1970 as the baseline year) and Figure G-37examines the composition of this traffic on a ton-miles basis (asa percentage of total traffic). The Mississippi System's trafficbetween the Ohio River and Baton Rouge increased from 36 to 43percent, while traffic on the Mississippi between Minneapolis andthe Missouri remained relatively constant.
BARGE TRAFFIC SUMMARY
This series of exhibits (Figures G-38 - G-47) summarizes thehistorical barge traffic using CofE data from the Part II of theWaterborne Commerce Statistics volumes. It is intended to pro-
3vide a snapshot view of the composition of trade of variouswaterways, showing the imbalances between loaded and empty, dryand tank barges, upbound/downbound or eastbound/westbound, asapplicable. The information is intended to help carriers assesstheir tows versus overall traffic averages. This traffic in-cludes movements of dredged materials aboard deck barges. There-fore, the traffic shown is slightly higher than the norm forlinehaul carriers. In general, barge trips and drafts under fourfeet are considered empty, with the exception of the Gulf Inter-coastal Waterway and the Mississippi River between the Ohio Riverand Baton Rouge, where trips under six feet are considered empty.
p
-. -

.-+.
G-50
0.- 4
I :°
i
C30
-0-
.. . . ... . . .
wig ----------
1Ch
• + ? - ..
+z

G-51S
a- U
- ~ -.. CN
i -* -
S
'U
!.~ ~-
.~ ~ S
a
v~ ~ ..- ~
I
S
S S S- - -- ----
a
S
z5.
U, -
U,U-- U,
'C a
'~ - N S~ S - ~ N - - I
a
14 -" 5*Ia ~ C
- .5.£ a S~ 15! aU S~;~ aI~I
h a.1 .. Sma ~
-5SaaU,
SS~*~~ I-~ S
a
- jS
.5' - - S C' ~ -- - - %~
.5'. .5% .85. S -
S
. . . . . . . . .

G- 52
0-
I!65..a4 N.%-
ccNNNNNNfd -i
a
3..3
m a, ao v v.aI. @
-tI c RC

- - - - - - - - - - --
G- 53
t- X,0 r- C
o
6f* CY
C4.M .x I> O 0 '' 0 '
fl 4 4 )
6r, UN I? W, 1
on f- MI M C0
I L. C- 04C 4C4W
cc 0' 4? a w % 4)I - C) It1 7
u~.. U I l1 l 6lIF r -1 ^ J
uj 0
Ll~I co 4) - (1t 0 (4 r y4o cc , 2-z00 o cc
Ln
L3.C
LM 1 0
IL.j *0Mf4 L..m J
4) -i
4), 00 5
E (0 "M ( 4: ) I..0I - a
d) T)C's01 .~N'O c'4%.N %s -4 0 1

G-54
-4 'D 0* UN 10.CJ~r.
C-40
0, 'C6 P
WN %
0 C
Lm. %Cr r NC C10,0. 01
in I
W% C4 %09 C I
I- 1- C
P.--I CLUSc, qC aPN" LNa0
'- 0 'a4 mvI ~ ~ ~ I PI0Ns~OIm~
- OL.. NN~ NN~.~%J64 0
0, 'o.
U, '4c 4c ,' NW ) c
z5 -4O~ 4L50
co
o UN - 0 c U;
-4 K4 P,% ',
0.% %aILw 0J
_ _ _ _ _ _ P, f .),r r

G-55
.~4a %a V% V~e 0- % FIN%0 P s' Uo m0 "O W,% r
. ~ ~ L -4N " 4- N 1 e r %C~ X 0 ?10 cc cc
Ic .0 -a 4r .% IN %
42 .4
e41
10
0 P- I CLo0,S
( Z w 42 cces1oC I- %C- 0~N0 ,oO ,.
u 3r I a,% 4%a2 0w
01 42-PI 0- - -4 01 WW
cc U .0 U PM 0I-W W w 1LsP,'a c C4 m "" 04u
am 4 r% C4r4C
coD 3cn C- 0. - 0
4 .. L.
01 1 CL 0 MW C, a,If -4 4
CL 0 WIn C,
- 14
.0 ccU n%.'rC4C a & 4 c
o 011 at~ m 0%(104V2 m %m
0. iS - - 4 -4-N

G-56
pV
b. sI 4 - eq
Ii
CO r, C
0 0 I.- M r%a a 4 0
- 0 '0L .4.. 0"W OPsUD -
o~I 4'
- % cc L" r- 10 ON iul
3 (M 0. a 0 L^ PIN"4 V
-. -- cm. C4Nou
LO co. um
t- o -00 ^
C.,, a,)
- I 0
z. 3
~0 CC a 0 0 O0L
S0a, w w CK PI
4 0% (P 4 PN0 A5 0% 4- M C'l
o .4 C4 D r- ca c 0 9.~
o%*Y 0, 0 a y c, 1,* C,

G-5 7
tv C4_ so__ _ _ _d_% _ _ P P
fl- - 444--
cc " j . o '-an an WI WP N ~40
~.C-4 UM
z I . I
.2- - MR- a 0L~
0
0 WN WN .004
In 0----a
4f4 At % Lr N UN 0 %r .1' LA
0 P-N PI % % . k4C
014 w h '4%
C4 C- 4c
0r L. I
W LCa - - . C a
PI PNN 0 'o W, ,% "' "
o co- in.
_________________ r,..

G- 58
- No r -C O Nfm 0 a) 0' ,C OC 4r
0 c
o co
W- 1-- 01M
co C'.
o - 0., 0 M 2-0.0, \0 'T
C- C-21
w- 10 If-' ; l(.0 C-I 1 "'J0\--- rC 4 ^'a
m 0' 2
r U I 0c
0' I. IT. r- 0 0 \ U r
-d 0 0
- 4 6^ (2 r0WM)a 7u IJ w~ " D' 2 ' -
.0_ V)- 0 tC,0 y,-t\
0 z) 0or oD C I
: 0.6fl ~ ~ 0 CY ;'Z Y
M 'o C ^
3)C
0 ' 0 0. C'J 0O C- co0' r- (D ICi -
0 0
0 0
ct) n
Z Ltd
S1

G-59
0-4
1-4 O .
PN N \r-W ^CD- 0-a s a
wmI 0,
cp. w a I- l
N r- I 4.~ .rI
0 t- CD)erI~
tm 0 0
*~~~ -4 0
p44%~
-
CI C- co~CI-
4.r C.4 r-- ID M
ca to -- Or D W r-.-40 mD C
tmm
C
CLr-4 'C" 0- T P\ -C4
0 vs 'o r-

G-60
4 co
0w In O 0 r- aJ
o ~ ~ ~ ' 0 P'O ~ 4. 9-4
c uN w
9- OL P, Pl 0% cz 91 " a
c wX m
cc
" m" 4'0 0 4U ' Cfl0 P
u- u~l u. L c r
0 -4
Pl% l 10 u, f, 9 0N ' . O 0,
m.. a mI0 n pN f-
- U
cc 0 Mf f- Pr- .ylC-4 C
030w , - l c O* w r-
u- 04 n(,Mr
CLCt..0
WIs
w 4 M -PC I N0
I CLvc4 - -4
9. c% PoN ct L o r9m..
I, a 0% 0%0N~ 'r~C Co..a

4 G-6 1
(v 0 2C t 'C ,1
4) m
L. (1 '11404'i(J ' JNri
x) " r-p c-ca ,oca
C11 Pl rl C YNC
X X -x
nj - a. CY 4) s - (7m 4) In 4)c, Na 01
I 4
V4
cc d)I C'Rd
'0 8 C >4 10 4)
C.r Le) - jL2- " 1 a- It r- c0- W C-4
cc LW W
I= IC'
-i Ir -' (7 6-M
cr~4 IT " " 1, -0C4a 7
< L1 0 m " * l D In CKr
I2 M4) C I' N N .r4C
-
< 6-
I C1 .0 r- U COU l' O
; r- WQI0' c 'r0 Dr.. Cy, M 4) s
c- mI r r 01
L ~~4 6- D (7
0~ " a. 0J- 00 2r. -
LO 'a
6- 0N 4 t'0 - O a. CUco4 :3 c , C41 - NClC
4) 0 C ' ~C14 ~0 ̂ CY, 0a 0' 0 0
en If .L C1 -
6oQ) L

G-62
0' '4 CF a, m~ u'. 0 0
-
- L.
c L...C
V))
I-i r- PIN 14 r-
ONr Y -o mC ,0 W% V)um .1-I04r-r r O ,'
C- >1:>1 Ln 0 0 O P -. (
(n UN W. " ,( 4
U. C-) C-4
d) C. CV)0
.. 4 - l 5.
LO w0 -- cC UN-r a) t CD -4C N2 r
0 DIN-C -.
CD CYC
122
CL.P
-4~0 CC l 1
-0 1uj
Cy,6 '1 "1' a)000 D '' ;C"L lC
- C N ; 00 PINf K\0.0 IA
I, CO 50r 0 O
oN i, a. cy w 0c 'IL.LO

b S
0
S
S
APPENDIX H
FINANCIAL FORECASTING MODELS
* S
a S
S
S
S
S
.. . . . . .
* S
FINANCIAL FORECASTING MODEL FOR ANINLAND BARGE AND TOWING COMPANY
* The financial forecasting model is based on revenue and costparameters which are unique to each barge and towing company.Forecasted revenue is based upon expected market share, availableequipment, utilization and freight rates. Expected costs aredependent upon fixed and variable towing costs, annual bargecosts, port expenses, and sales, general and administrative ex-penses. The model used is the FCS-EPS1 computer spread sheetpackage.
PARAMETERS
Each of the parameters must be estimated for the forecastperiod. For example, market share is determined from an analysisof historical market shares and estimations of whether the sharesfor each commodity group are expected to increase, decrease, orremain constant. The historical shares are calculated by divid-ing the company's actual tonnages by the industry tonnages des-cribed in Chapter IV and Appendix G. The expected market sharepercentages are then multiplied by the forecasted industry ton-nages to get forecasted company tonnages. In the model, thecommodity tonnages are grouped by equipment type: open, covered,and tank barges.
MODEL SECTIONS
The model is developed in three sections. The Logic Sectiondescribes all of the company parameters (C.P.) and their mathe-matical relationships. The Data Section provides the inputsvalues for the parameters for all time periods used in the model.The Report Section formats the outputs for presentation of theforecast results.
The Logic Suction is described below in detail. Otherstandard spreadsheet packages can also be used by applying theseequations. The company data can then be entered on each line forthe desired time periods.
1 FSC-EPS is copyrighted by EPS Incorporated.

H-2
LOGIC SECTION
Revenue
1) Annual Tonnage:Covered Hoppers (Based on Market Share)
2) Number of Covered Hoppers (Company Parameters--C.P.)
3) Annual Tonnage Per Covered Hopper (= Line 1/Line 2)
4) Average Tonnage per Trip:Covered Hoppers (C.P.)
5) Number of Loads Per Year Per Covered Hopper (= Line 4/Line 5)
6) Averaged Loaded Trip Miles:Covered Hoppers (C.P.)
7) Cargo Ton Miles:Covered Hoppers (= Line 2 x Line 4 x Line5 x Line 6)
8) Revenue Per Cargo Ton Mile:Covered Hoppers (C.P.)
9) Total Revenue:Covered Hoppers (= Line 7 x Line 8)
10-19) Repeat for Open Hoppers
20-29) Repeat for Tank Barges
30) Demurrage Revenue (C.P.)
31) Other Income (C.P.)
32) Total Revenue (= Line 9 + Line 19 + Line 29 + Line 30 +Line 31)
Towing Costs
33) Fixed Towing Cost (C.P.)
34) Cost Per Cargo Ton Mile (C.P.)
35) Variable Towing Cost (= Line 34 x (Line 7 + Line 17 +Line 27))
36 Total Towing Cost (= Line 35 + Line 33)
."." . . .
. . . . . . . . . . . . . . . . . . . . . . . . . . . . . . .. . . . .

H-3
dLBarge Expense
37) Annual Cost Per Barge:Covered Hoppers (C.P.)
38) Annual Cost:Covered Hoppers (= Line 2 x Line 37)
39) Annual Cost Per Barge:Open Hoppers (C.P.)
40) Annual Cost:Open Hoppers (= Line 12 x Line 39)
41) Annual Cost Per Barge:Tank Barges (C.P.)
42) Annual Cost:Tank Barges (= Line 22 x Line 41)
43) Total Annual Barge Cost (= Line 38 + Line 40 + Line 42)
Port Expenses
44) Port Expenses Per Barge Load (C.P.)
45) Port Expenses:Covered Barge (= Line 2 x Line 5 x Line44)
46) Port Expenses:Open Hoppers (= Line 12 x Line 15 x Line44)
47) Port Expense:Tank Barges (= Line 22 x Line 25 x Line 44)
F 48) Total Port Expenses (= Line 45 + Line 46 + Line 47)
Other Expenses
49) Other Expense (C.P.)
50) Total Operating Expense (= Line 36 + Line 43 + Line 48 +Line 49)
-- 51) Gross Operating Profit (= Line 32 - Line 50)
0 52) Sales, General and Administration Expense (C.P.)
Earnings
53) Earning Before Interest and Taxes = Line 51 - Line 52
. . ...- ..

H-4
APPLICATION
Using a financial forecasting model, the planner can deter-mine the potential effects upon earnings due to changes in marketshare, freight rates, equipment configuration or operating pat-terns.
• '. ..
.°.•0.. ° .° . ° -.

FILMED
S 3-85
DTIC