tod finance summit12_6_12
DESCRIPTION
Presentations from the MAPC TOD Finance Summit on December 12, 2012TRANSCRIPT
Transit-Oriented Development
Finance Summit• December 6, 2012 •
Executive DirectorMetropolitan Area Planning
Council
Marc D. Draisen

GROWING STATION AREASTHE VARIETY AND POTENTIAL OF TRANSIT ORIENTED DEVELOPMENT IN METRO BOSTON

Transit Station Area Types
Metro Core Metro Core NeighborhoNeighborhood Subway od Subway
Urban Urban Gateway Gateway
Commerce Commerce Park Park
Trolley Trolley Suburb Suburb
Seaport / Seaport / Airport Airport
TransformaTransformational tional
SubwaySubwayTown & Town & Village Village
Suburban Suburban TransformaTransforma
tion tion UndevelopeUndevelope
d d
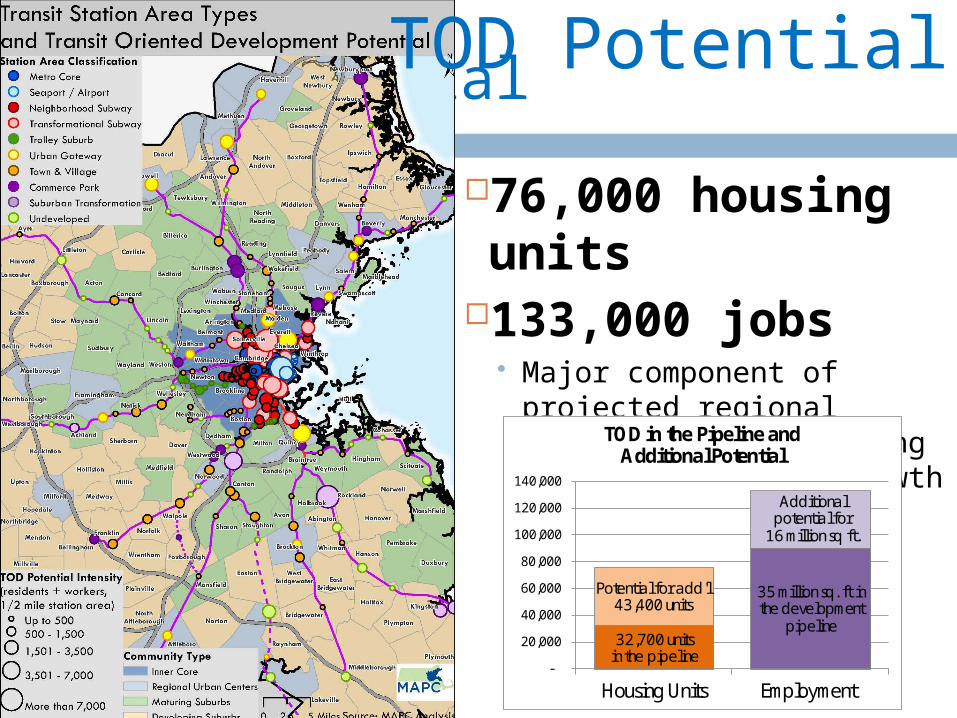
TOD Potential
76,000 housing units
133,000 jobs Major component of
projected regional growth - 31% of housing demand 56% of job growth
-
20,000
40,000
60,000
80,000
100,000
120,000
140,000
Housing Units Employment
TOD in the Pipeline and Additional Potential
Additional potential for
16 million sq ft.
32,700units in the pipeline
Potentialfor add'l 43,400 units
35million sq. ft in the development
pipeline
TOD Potential
Executive DirectorLocal Initiatives Support
CorporationBoston
Bob Van Meter

Creating an “Equitable Transit Oriented
Developmment Accelerator Fund (ETODAF)”
Bob Van Meter, Executive DirectorKristin Blum, Senior Program Officer
December 6, 20127
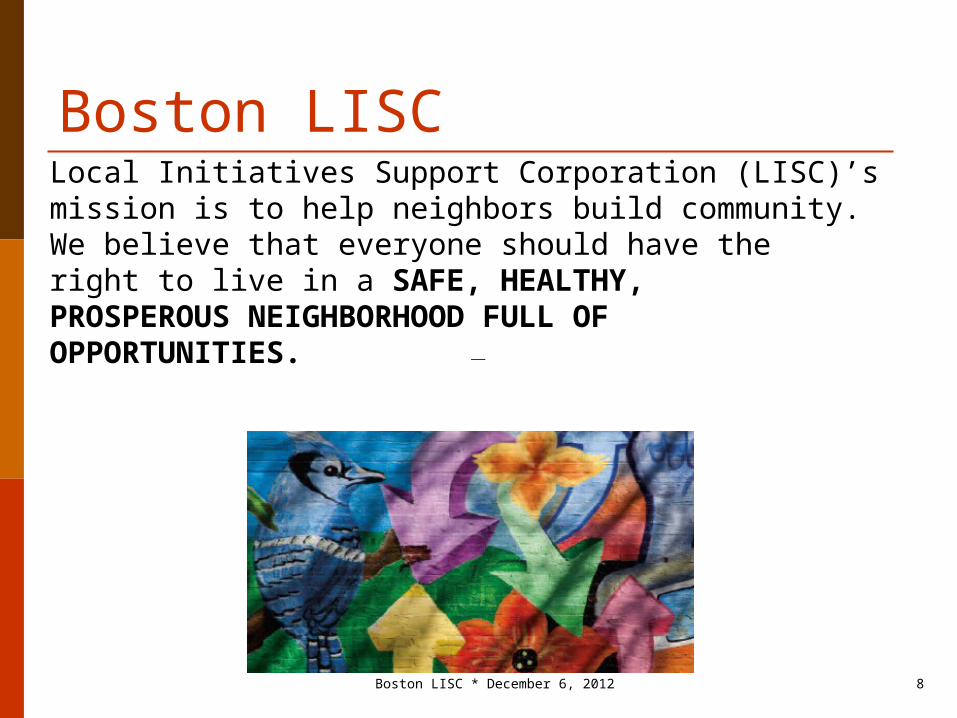
Boston LISCLocal Initiatives Support Corporation (LISC)’smission is to help neighbors build community.We believe that everyone should have theright to live in a SAFE, HEALTHY,PROSPEROUS NEIGHBORHOOD FULL OFOPPORTUNITIES.
Boston LISC * December 6, 2012 8

LISC is an Established Community Development Lender• Invested over $400 million
in loan capital nationally since 2004
• Boston LISC has a 30-year track record
• Over $45 million in loans in greater Boston with a loss rate of about 1%.
• LISC lends to non profit and for profit borrowers for affordable and mixed income housing, commercial and retail and other community development needs
Boston LISC * December 6, 2012 9

LISC’s TOD Background
Boston LISC * December 6, 2012 10
In the past 4 years, LISC has invested:
• $20 million in equity investments (New Markets and Low Income Housing credits) • $5.7 million in loan capital• $500,000 in grant funding
Supporting a range of TOD projects and locations totaling:
•625 units of affordable and mixed income housing; and •150,000 square feet of commercial space
Boston LISC * March 14, 2012

TOD as part of Building Healthy Communities of Choice LISC’s approach includes
economic development, public safety, active transportation options, access to food
Resilient Communities/ Resilient Families
TOD can bring economic diversity in stronger market communities with access to transit
Boston LISC * December 6, 2012 11

Benefits of EquitableTransit-Oriented DevelopmentFor HouseholdsHouseholds have
increased access to jobs and services
Combined cost of housing and transportation is reduced
Low income families have access to affordable housing in gentrifying transit communities
Boston LISC * December 6, 2012 12
For CommunitiesLess dependence on automobile use Reduce pollutionPedestrian friendly environments with services in walking/biking distanceCommunities serve a range of incomes in mixed-use settings

The Market is Demanding More TOD
Boston LISC * December 6, 2012 13
• Today, about 6 million households live within ½ mile of transit
• Demand for transit accessible housing is projected to reach 16 million by 2030!
• Meeting this demand means building 10 million housing units within a 10-minute walk of transit, or 2,000 units near every
station in the U.S. “This movement toward denser, mixed-use forms of development presents a golden opportunity
to create mixed-income transit villages, providing healthier environments, especially for low-income families.” –Convergence Partnership

The case for Equitable TOD “Equitable TOD” prioritizes investments that:
Support production and preservation of affordable housing near transit
provides other transit-accessible community services such as schools, health clinics, and food stores; and
enhances access for transit-dependent populations through connecting bicycle and pedestrian facilities.
Equitable TOD is about creating equal opportunities for people of all incomes to capture the benefits of transit oriented locations.
Market pressures often target new development to higher incomes; but lower income households are the highest users of transit.
Boston LISC * December 6, 2012 14

Distinct roles for equitable TOD in three different locations
Stronger markets Emerging/gentrifying markets Weaker markets
Boston LISC * December 6, 2012 15
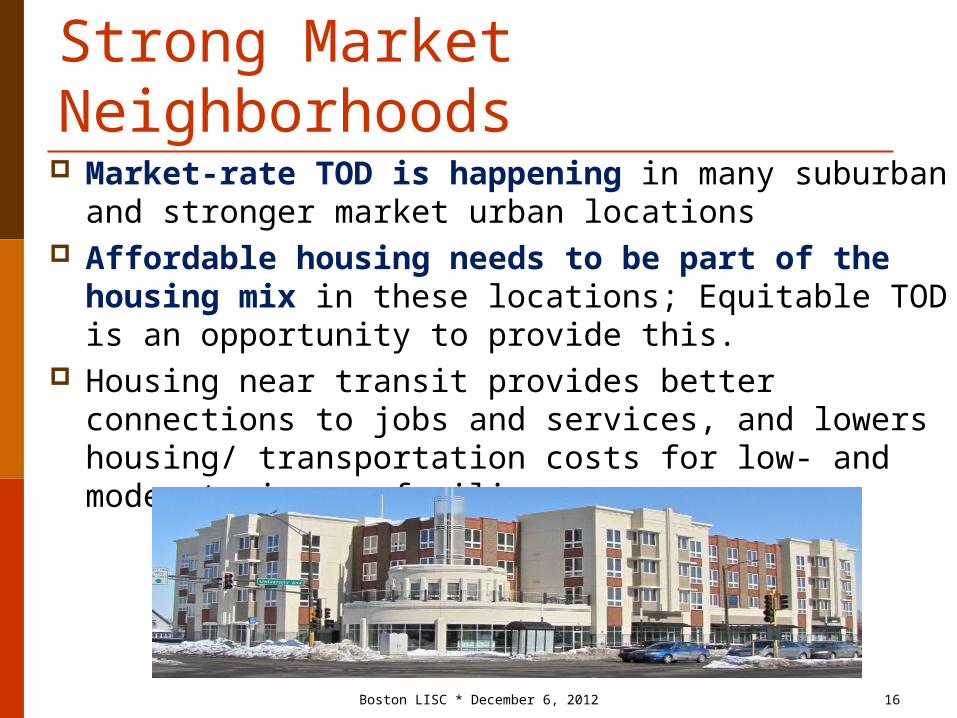
Strong Market Neighborhoods Market-rate TOD is happening in many suburban
and stronger market urban locations Affordable housing needs to be part of the
housing mix in these locations; Equitable TOD is an opportunity to provide this.
Housing near transit provides better connections to jobs and services, and lowers housing/ transportation costs for low- and moderate-income families
Boston LISC * December 6, 2012 16
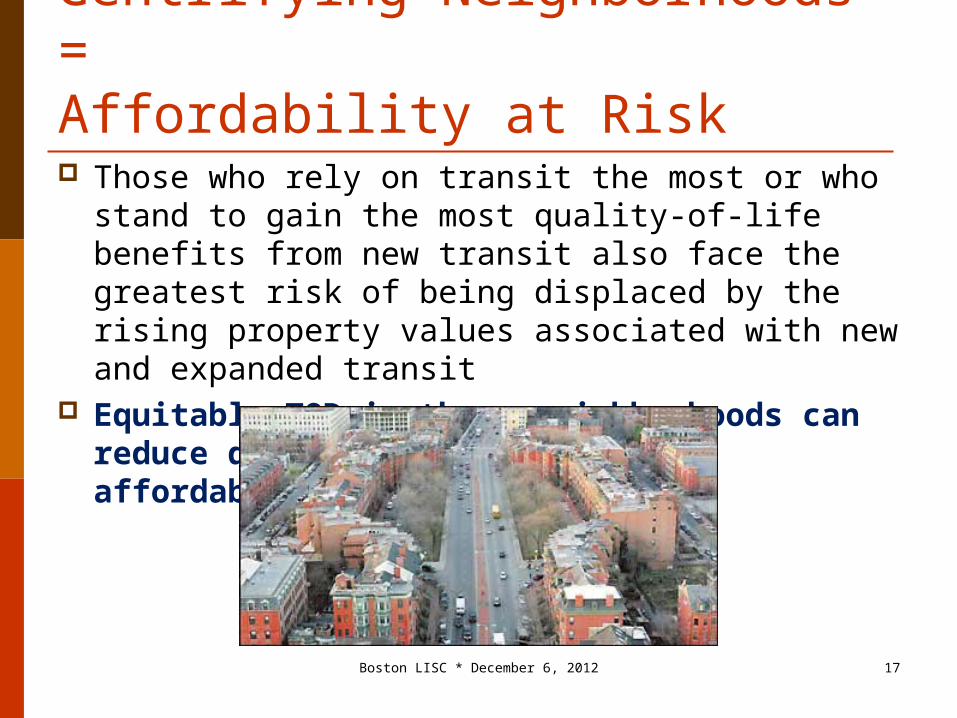
Gentrifying Neighborhoods = Affordability at Risk Those who rely on transit the most or who stand to
gain the most quality-of-life benefits from new transit also face the greatest risk of being displaced by the rising property values associated with new and expanded transit
Equitable TOD in these neighborhoods can reduce displacement and preserve affordability
Boston LISC * December 6, 2012 17

Weaker Market Neighborhoods: Catalyzing Revitalization TOD can be part of a revitalization strategy
that improves the neighborhood and attracts private investment;
Additional development, with increased density and foot traffic, can attract investment and improve property values; and
Increasing connections to jobs and services for neighborhood residents can result in equitable outcomes
Boston LISC * December 6, 2012 18
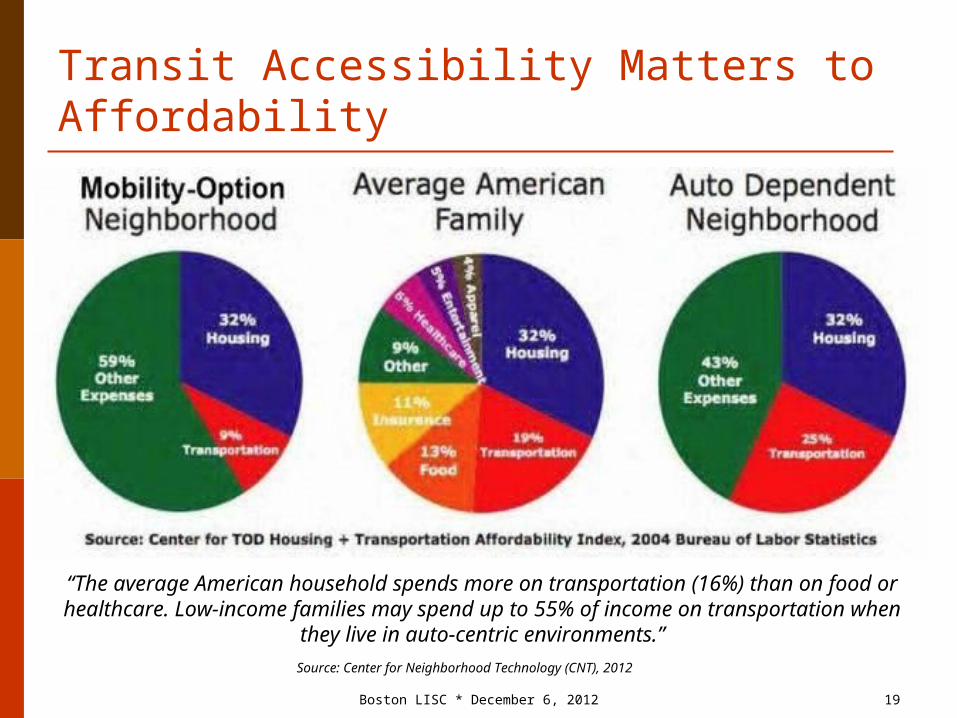
Transit Accessibility Matters to Affordability
Boston LISC * December 6, 2012 19
“The average American household spends more on transportation (16%) than on food or healthcare. Low-income families may spend up to 55% of income on
transportation when they live in auto-centric environments.”Source: Center for Neighborhood Technology (CNT), 2012

Why ETOD: Low-Income Households Most Burdened by Rising H+T Costs
Boston LISC * December 6, 2012 20
Working families making $20,000-50,000/yr pay 10% more of their income on transportation costs (~30%) than average households (~20%)
Source: “A Heavy Load”, Center for Housing Policy, 2006
While median-income households in the largest 25 U.S. metros have paid 44% more for housing and transportation over the last decade, they have earned only 25% more in income
Source: “Losing Ground”, Center for Housing Policy, 2012

Why ETOD: Low-Income and Minority Populations Most Burdened by Long, Burdensome Commutes
Boston LISC * December 6, 2012 21
A recent Northeastern University study found that, in Boston:
• White commuters who drive have the shortest commutes (27 min), and black commuters who bus have the longest (46 min)
• Black commuters spend an extra 66 hours/year waiting, riding, and transferring than white bus riders
“…affordable housing is scarce and often far from desireable
subway and rail stations.”Source: NEU Dukakis Center for Urban and Regional Policy, 2012

Strategies to Create ETOD
Policy changes in public funding allocation mechanisms to prioritize TOD (underway)
Land disposition to include equitable development
Transit system improvements and expansion Develop financing tools to facilitate and
prioritize TOD such as LISC’s proposed fund and the Healthy Neighborhoods Equity Fund to provide capital
Boston LISC * December 6, 2012 22
Development of Fund ConceptLISC started looking at the feasibility of a TOD fund at the request of philanthropic
partners and our CDC partners with active projects in TOD corridors
Identified Needs: Low interest, patient, flexible capital Higher loan to value limits Help with carrying costs Early planning reinforced by TOD Gap
Finance Analysis findingsBoston LISC * December 6, 2012 23
Boston LISC * March 14, 2012

Financing Challenges to TODSmall scale, strategic land assembly is
critical to creating larger parcels but is perceived as risky by lenders.
The competitive funding environment means projects must demonstrate high readiness. Holding periods are growing.
Non-profit TOD borrowers have difficulty meeting the LTV requirements of existing lenders.
Boston LISC * December 6, 2012 24
Boston LISC * March 14, 2012
Financing ChallengesLack of financing available for carrying
costs strains community based and nonprofit developers
Developers need to access multiple sources of predevelopment capital for the same deal
Alternative site control arrangements (option payments, rights of first refusal) are not always pursued
Boston LISC * December 6, 2012 25
Boston LISC * March 14, 2012
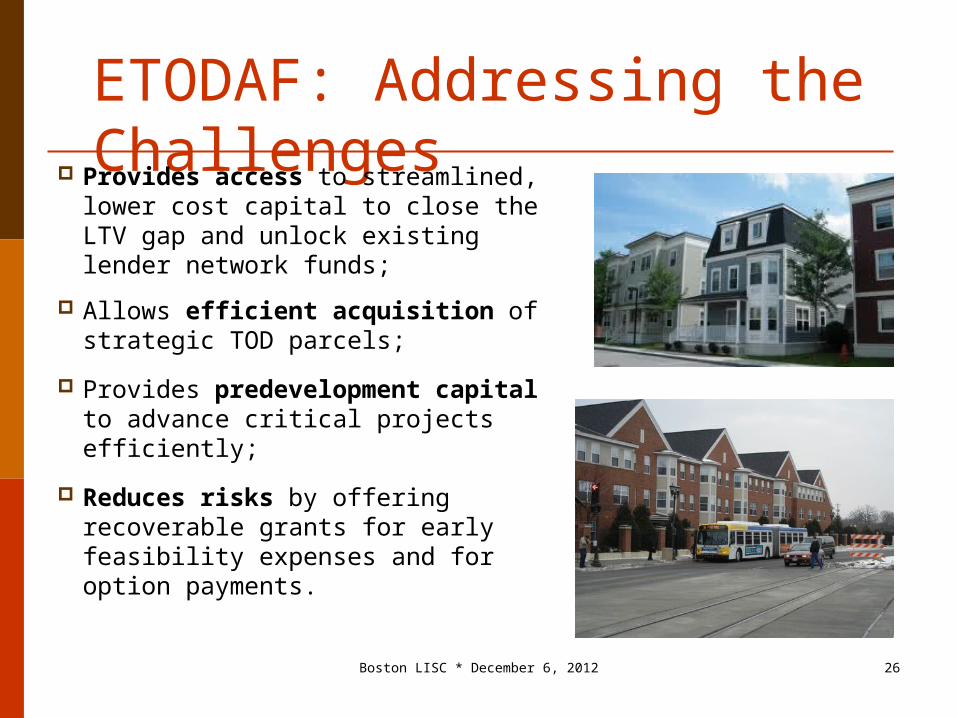
ETODAF: Addressing the Challenges Provides access to
streamlined, lower cost capital to close the LTV gap and unlock existing lender network funds;
Allows efficient acquisition of strategic TOD parcels;
Provides predevelopment capital to advance critical projects efficiently;
Reduces risks by offering recoverable grants for early feasibility expenses and for option payments.
Boston LISC * December 6, 2012 26
Boston LISC * March 14, 2012
Fund Overview (ETODAF) *The ETODAF- managed by Boston LISC- will
provide critical early stage capital and streamline access to capital to acquire and jump start equitable TOD developments.
Key funders are: State Government - EOHED is considering a
MassWorks grant through MassDevelopment for top loss reserve.
PRI requests are currently being considered by the Hyams Foundation and The Boston Foundation
LISC intends to seek PRIs from additional local and national funders interested in participating
Grant funders: LISC has secured start up funding from Hyams Foundation and Barr Foundation.
Boston LISC * December 6, 2012 27
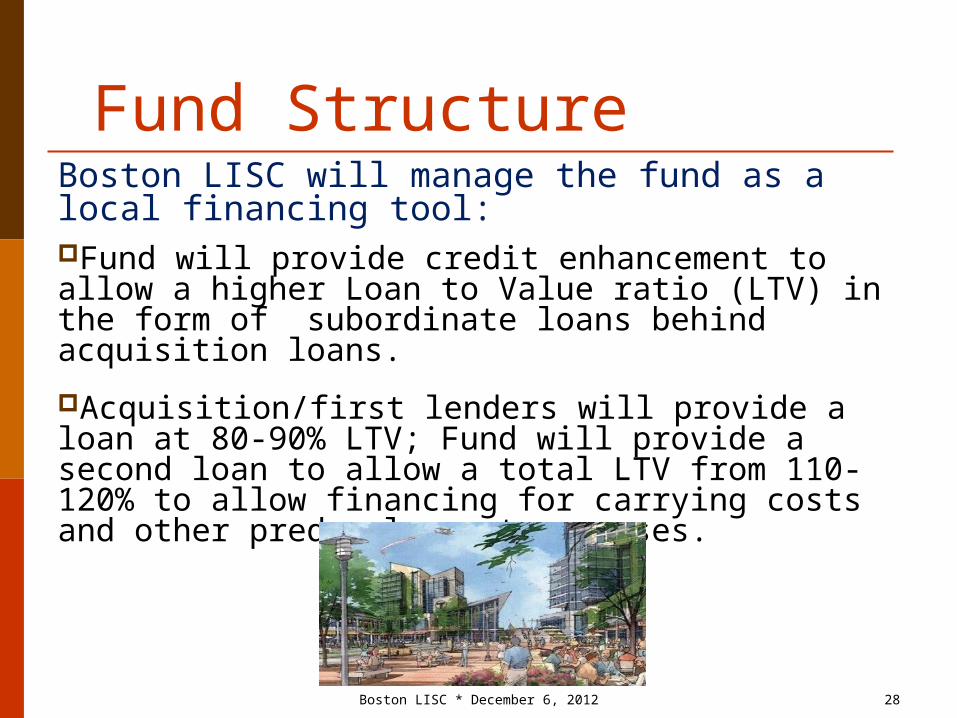
Fund StructureBoston LISC will manage the fund as a local financing tool:Fund will provide credit enhancement to allow a higher Loan to Value ratio (LTV) in the form of subordinate loans behind acquisition loans.
Acquisition/first lenders will provide a loan at 80-90% LTV; Fund will provide a second loan to allow a total LTV from 110-120% to allow financing for carrying costs and other predevelopment expenses.
Boston LISC * December 6, 2012 28Boston LISC * March 14, 2012

Eligible ProjectsEligible uses of the fund:
Affordable housing, mixed-income housing, mixed-use development, and neighborhood retail, commercial or community space (non-housing investments to be limited to 10-15% of fund).
Projects will need to meet Fund definitions:
PROXIMIITY to transit; CONNECTIVITY and orientation to transit; and AFFORDABILITY.
Boston LISC * December 6, 2012 29
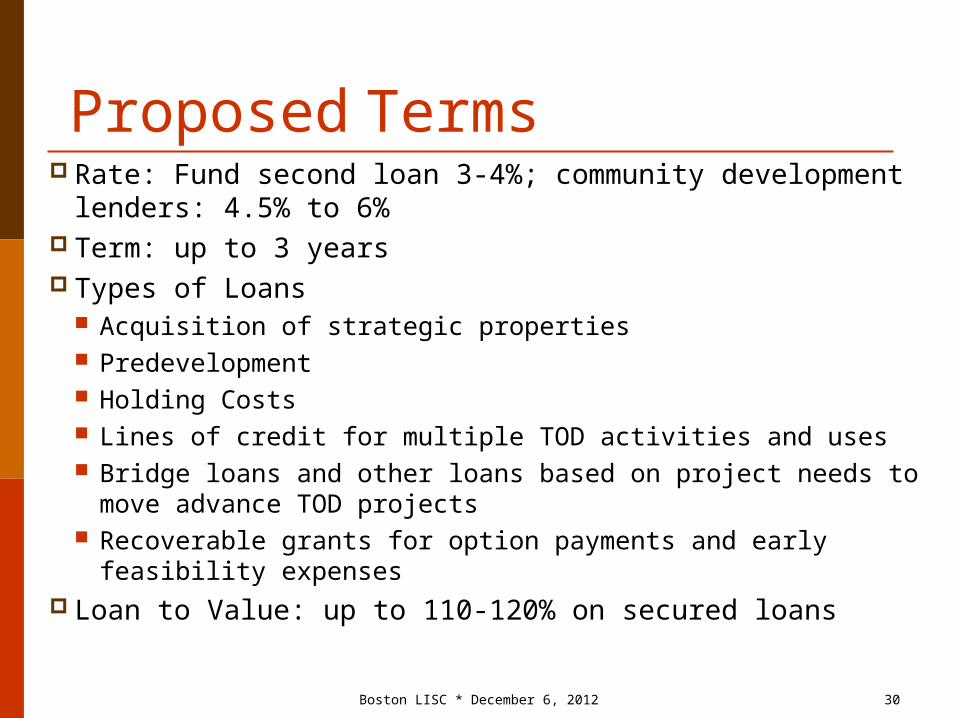
Proposed Terms Rate: Fund second loan 3-4%; community development
lenders: 4.5% to 6% Term: up to 3 years Types of Loans
Acquisition of strategic properties Predevelopment Holding Costs Lines of credit for multiple TOD activities and uses Bridge loans and other loans based on project needs to move
advance TOD projects Recoverable grants for option payments and early feasibility
expenses Loan to Value: up to 110-120% on secured loans
Boston LISC * December 6, 2012 30Boston LISC * March 14, 2012
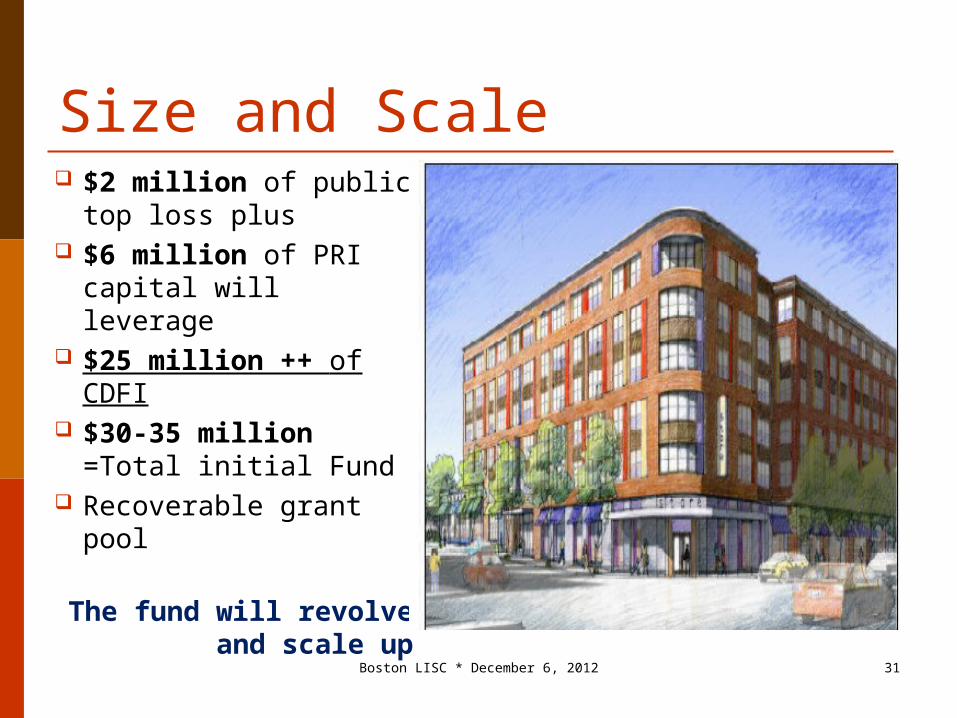
Size and Scale $2 million of public
top loss plus $6 million of PRI
capital will leverage $25 million ++ of
CDFI $30-35 million
=Total initial Fund Recoverable grant
pool
The fund will revolve and scale up
Boston LISC * December 6, 2012 31

How the Fund Makes a Difference Fills equity and loan to value (LTV) gap
Covers holding and interest costs
Encourages alternative site control arrangements by providing recoverable grants for this purpose
Systems change in predevelopment
systemBoston LISC * December 6, 2012 32

What would the TOD Fund do? Leverage capital,
underwriting expertise, and technical assistance of the existing network of funders
Streamline the process of raising early stage capital
Leverage public investment and private capital to respond to financing challenges
Reduce the need for multiple predevelopment sources for one project
Mitigate risks that prevent existing lenders from participating in TOD projects
Provide PRI investments for LTV gap at low cost
Utilize recoverable grants for the riskiest components and encourage alternative site control arrangements
Manage the pipeline by teeing up compelling projects that respond to State priorities.
Engage public partners as stakeholders
Boston LISC * December 6, 2012 33
Streamline ProcessStreamline Process Manage RiskManage Risk
Boston LISC * March 14, 2012
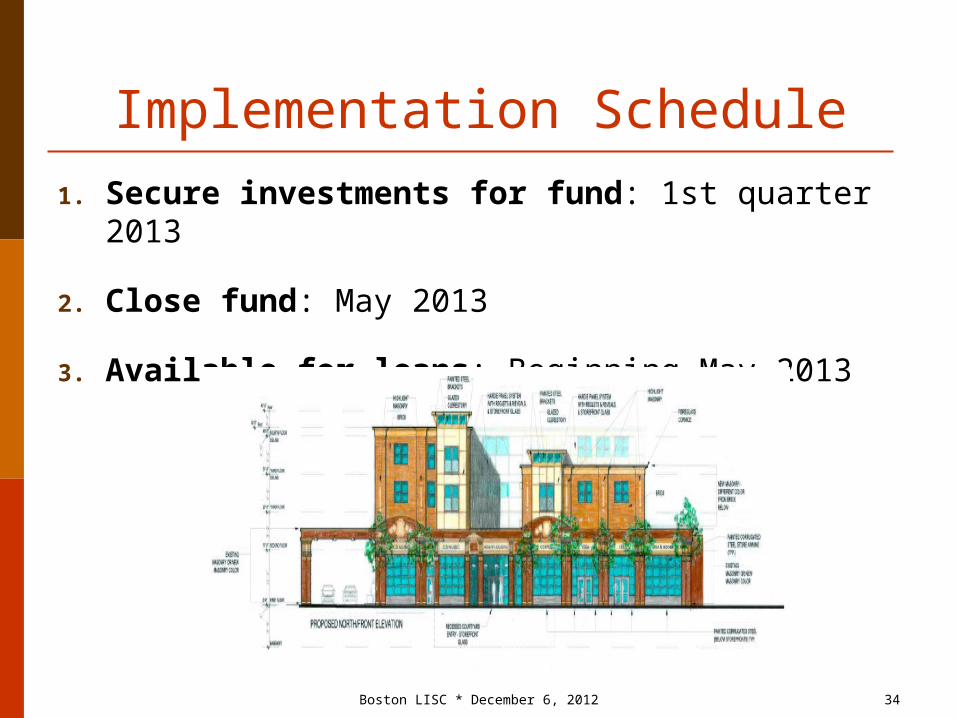
Implementation Schedule1. Secure investments for fund: 1st quarter 2013
2. Close fund: May 2013
3. Available for loans: Beginning May 2013
Boston LISC * December 6, 2012 34

Anticipated outcomes
Competitive, well funded non-profit sector able to advance equitable TOD transactions efficiently;
Affordable and revitalizing TOD in Fairmount Corridor and Gateway Cities to lead the market;
Mixed use, affordable urban village development to complement transit improvements;
Preservation of affordable housing in key urban transit corridors to avoid displacement as the market heats up; and
Creation of new affordable housing in gentrifying and stronger markets.
Boston LISC * December 6, 2012 35
Boston LISC * March 14, 2012

EDOTAF Aligned with Other Important Initiatives for Greater Impact Supports 13 of the 65 MetroFuture goals for
TOD, Smart Growth, Development of Affordable Housing Throughout the Region, particularly: Increasing affordable housing for working families Providing housing choices throughout the region without
displacement. Mass. Smart Growth Alliance’s Great
Neighborhoods Initiative Commonwealth’s new production goals and
Compact Neighborhoods initiative
Boston LISC * December 6, 2012 36

Complements CLF’s Healthy Neighborhoods Equity Fund Conservation Law Foundation Ventures
(CLFV) and Mass Housing Investment Corporation (MHIC) are working to develop Healthy Neighborhoods Equity Fund
The funds will be complementary (LISC: early stage capital; CLFV/MHIC: permanent equity)
Boston LISC * December 6, 2012 37
Thank you!Bob Van Meter, Executive Director, Boston LISC
Kristin Blum, Senior Program Officer, Boston LISC
[email protected] [email protected] www.bostonlisc.org
@LISC_Boston
Boston LISC * December 6, 2012 38
Conservation Law Foundation Ventures
Massachusetts Housing Investment Corporation
Bill ColemanMaggie ChurchJoe Flatley

Healthy Neighborhoods Equity Fund
TOD Summit PresentationDecember 6, 2012

What is the Healthy Neighborhoods Equity Fund?
$100M “blended” private equity fund – Transformative mixed-income, mixed-use projects in selected transit corridors– “Blended” structure of PRIs, mezzanine debt, and traditional PE – Innovative mix of institutional and social impact investors– Staged capitalization commencing 3rd quarter 2013 with $30MM first phase
CLFV/MHIC collaborative response to TOD funding gaps and opportunities for TBL outcomes– Leverage/finance upside not valued by underwriters– First bottom line: attractive risk-adjusted market returns– Second and third bottom lines: avoided VMTs, local economic development, improvements in
public health
The Fund conceived and managed as part of an integrated overall capital program– Capital program design informed by findings from GLC gap analysis– Coordinated synergy with LISC– Addresses multiple regional MetroFuture goals – Leverage state resources with new private capital– Managed by MHIC, a proven institutional fund manager
• CLF/CLFV mission “wheelhouse”
• History with “Big Dig” mitigation
• Private markets as part of social/environmental solutions
• Sponsor transformative projects by eliminating chronic
funding gaps
Why CLF / CLF Ventures?
What is CLF’s Role?
• Promote re-emerging interest in TBL outcomes
• Apply research linking TOD and health outcomes to investor strategies
• Collaborate with MHIC to capitalize the Fund
• Define/design metrics and participate in governance through formal committee or 501©3
• “Chancellor of Metrics” – guardian of project selection criteria and outcome metrics
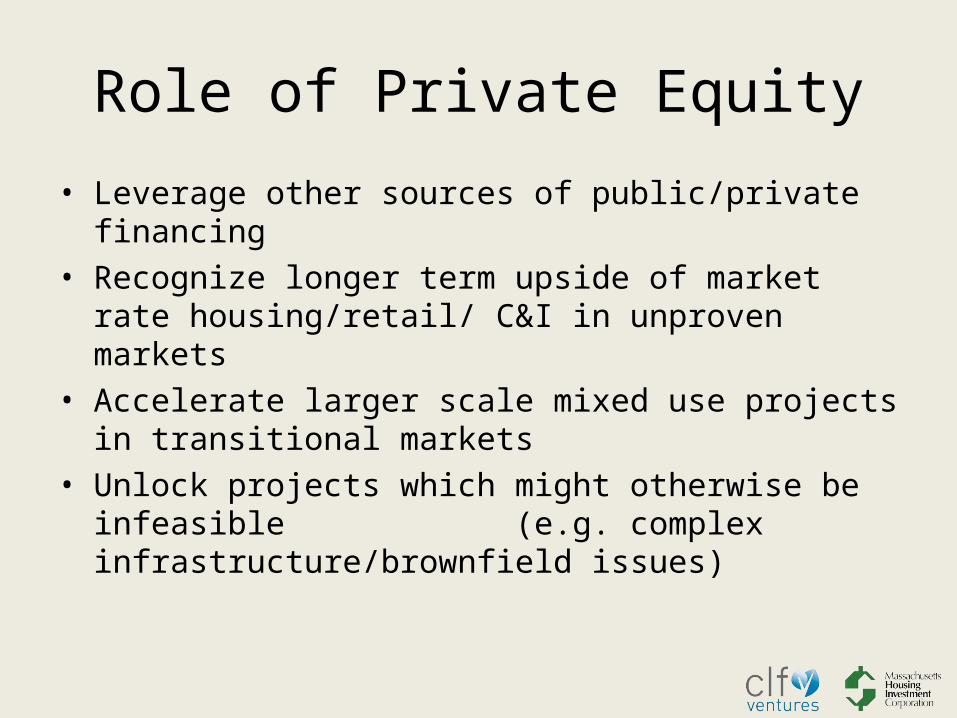
Role of Private Equity
• Leverage other sources of public/private financing• Recognize longer term upside of market rate housing/retail/
C&I in unproven markets• Accelerate larger scale mixed use projects in transitional
markets• Unlock projects which might otherwise be infeasible
(e.g. complex infrastructure/brownfield issues)
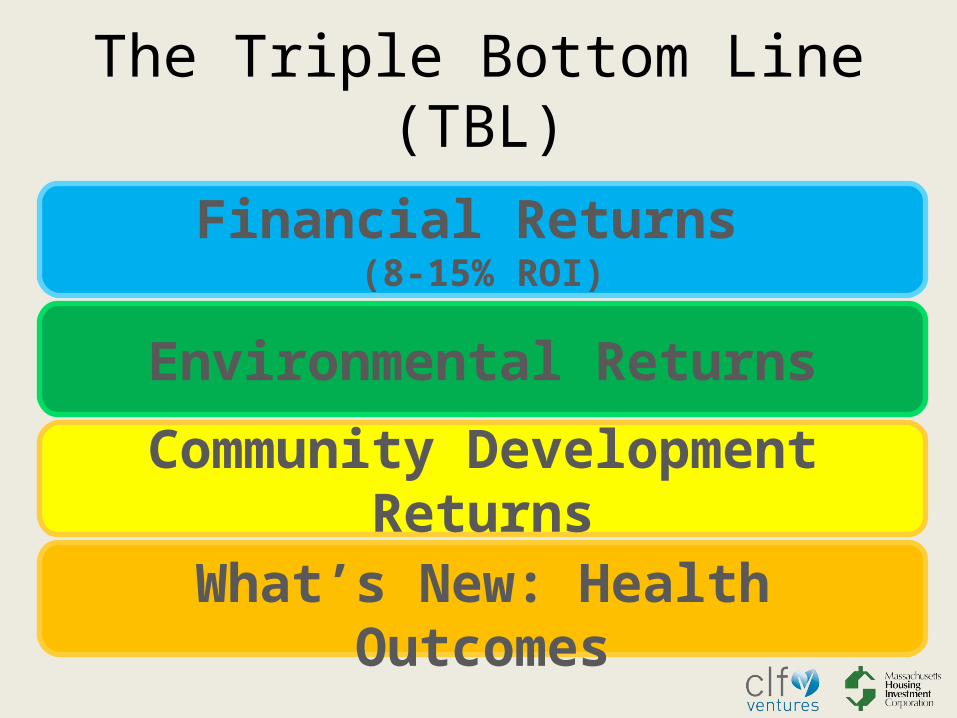
Community Development Returns
The Triple Bottom Line (TBL)
Financial Returns (8-15% ROI)
Environmental Returns
What’s New: Health Outcomes
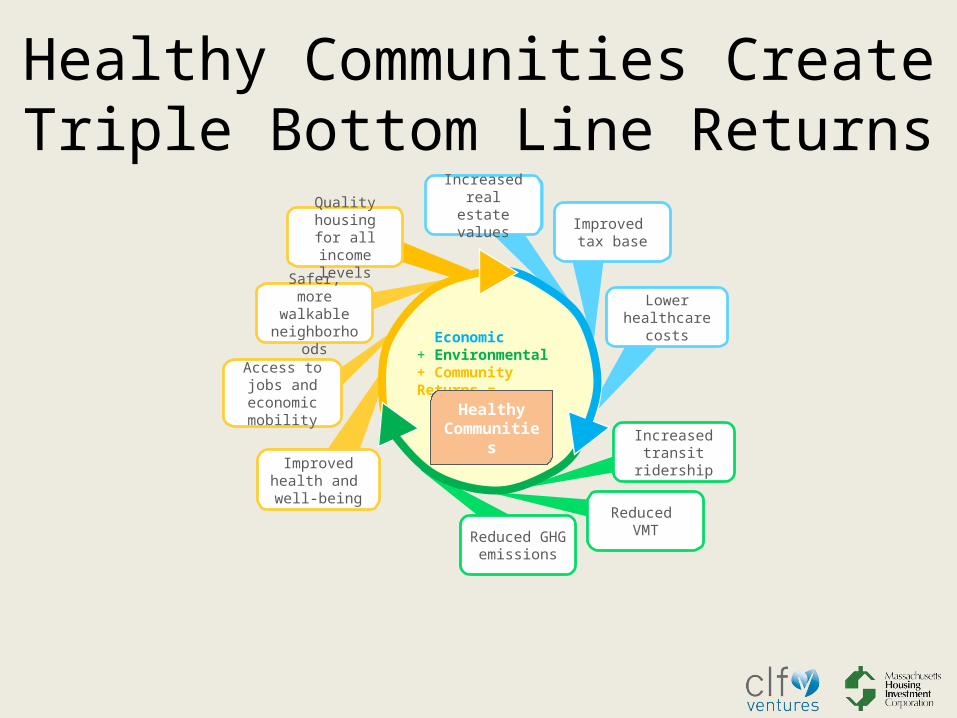
Access to jobs and economic
mobility
Safer, more walkable
neighborhoods
Improved health and well-being
Increased real estate values
Improved tax base
Lower healthcare
costs
Reduced GHG emissions
Reduced VMT
Increased transit ridership
+ Economic+ Environmental+ Community Returns =
Healthy Communities
Quality housing for all income levels
Healthy Communities CreateTriple Bottom Line Returns
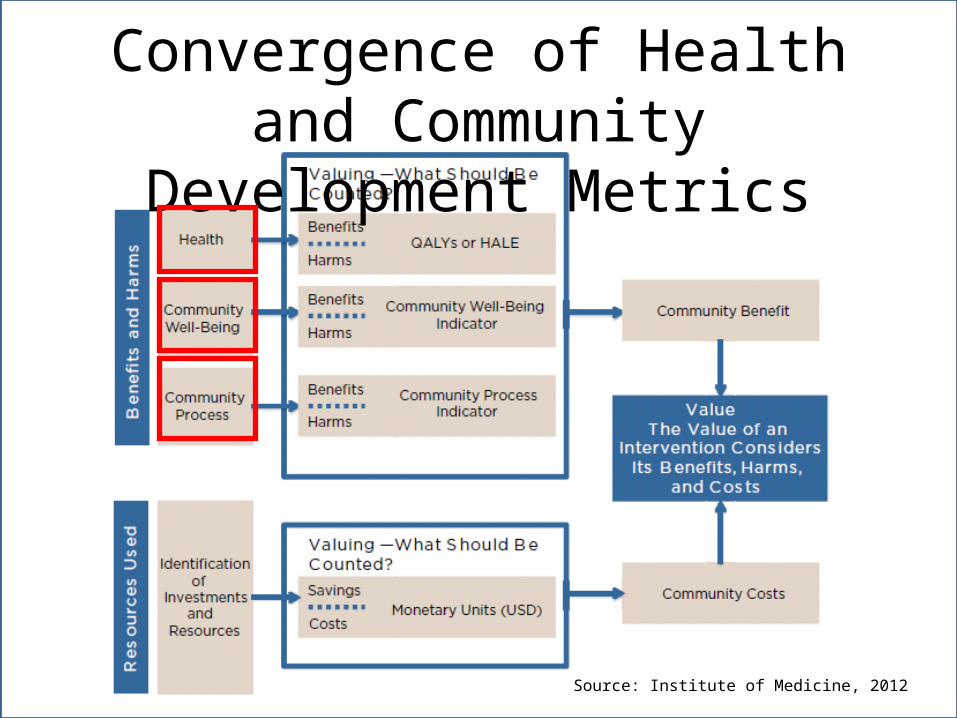
Convergence of Health and Community Development Metrics
Source: Institute of Medicine, 2012
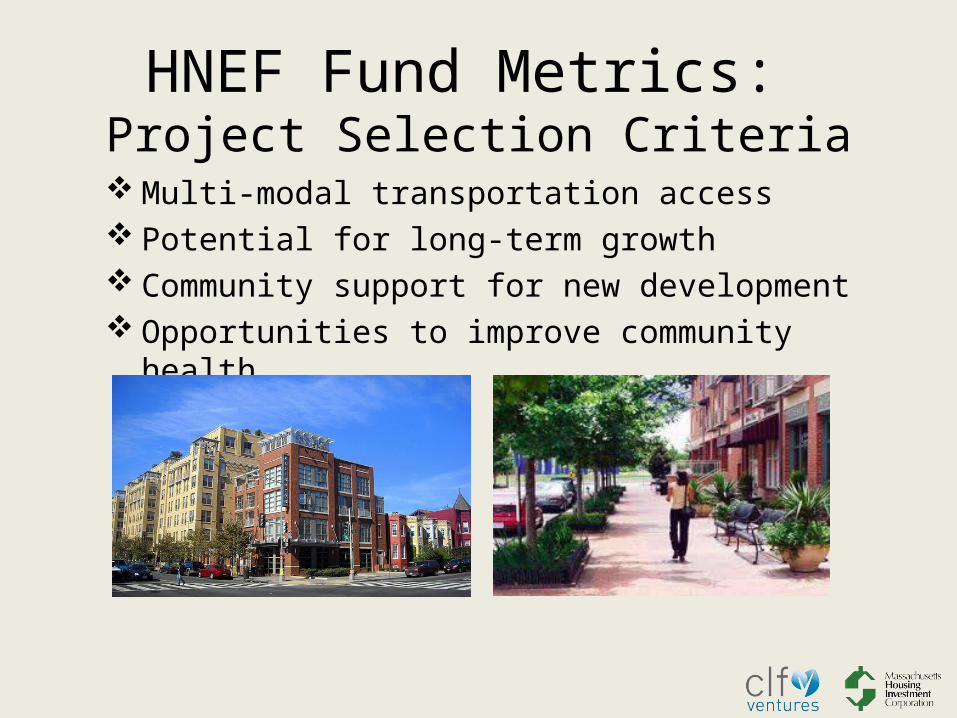
HNEF Fund Metrics: Project Selection Criteria
Multi-modal transportation access Potential for long-term growth Community support for new development Opportunities to improve community health

HNEF Fund Metrics: Project Outcomes
Increasing walkability and health/wellness opportunities Reducing VMTs; increased mode share for walking, biking, and
transit Improving energy and environmental performance Implementing community vision/ goals
AND…. Creating jobs and economic activity Expanding access to healthy food Increasing the range of quality housing options
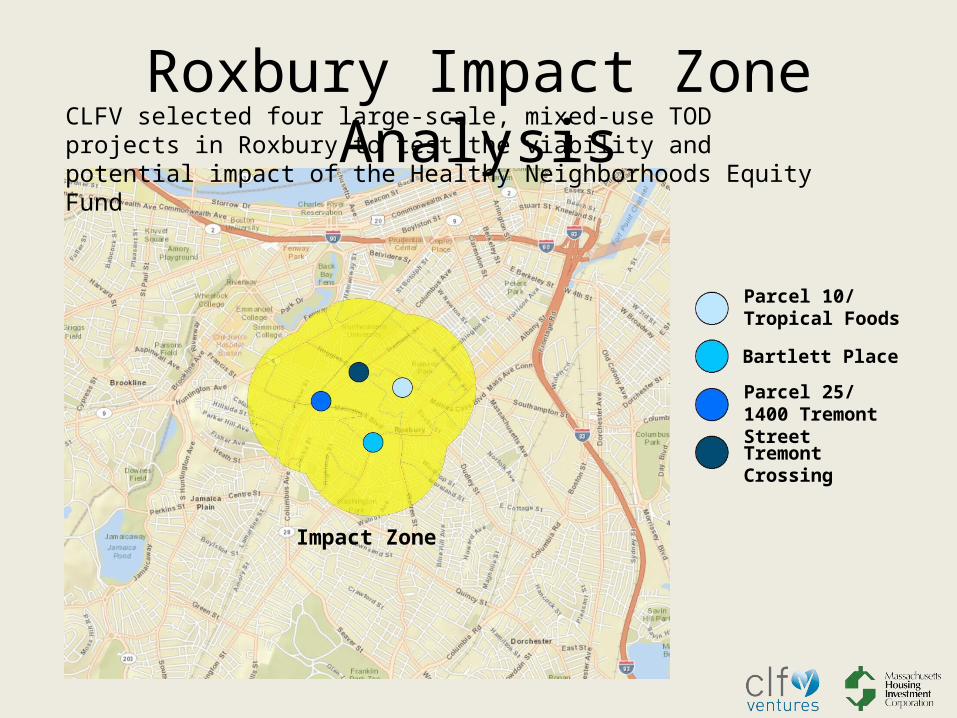
Roxbury Impact Zone Analysis
Bartlett Place
Parcel 25/1400 Tremont Street
Tremont Crossing
Parcel 10/Tropical Foods
CLFV selected four large-scale, mixed-use TOD projects in Roxbury to test the viability and potential impact of the Healthy Neighborhoods Equity Fund
Impact Zone
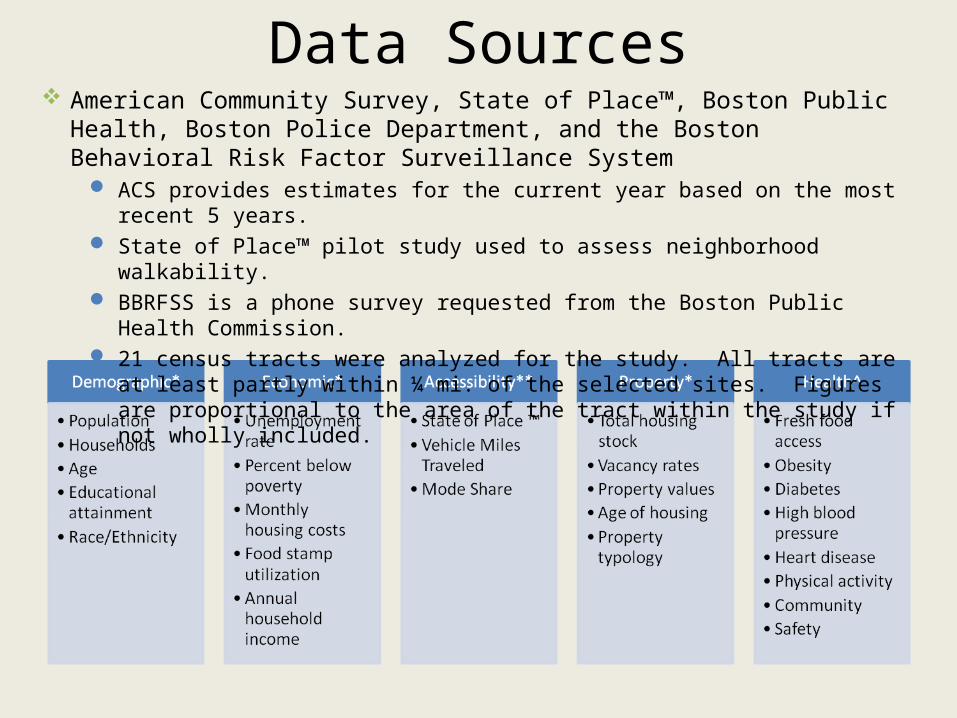
American Community Survey, State of Place™, Boston Public Health, Boston Police Department, and the Boston Behavioral Risk Factor Surveillance System
ACS provides estimates for the current year based on the most recent 5 years. State of Place™ pilot study used to assess neighborhood walkability. BBRFSS is a phone survey requested from the Boston Public Health Commission. 21 census tracts were analyzed for the study. All tracts are at least partly within ¼ mi. of
the selected sites. Figures are proportional to the area of the tract within the study if not wholly included.
Data Sources
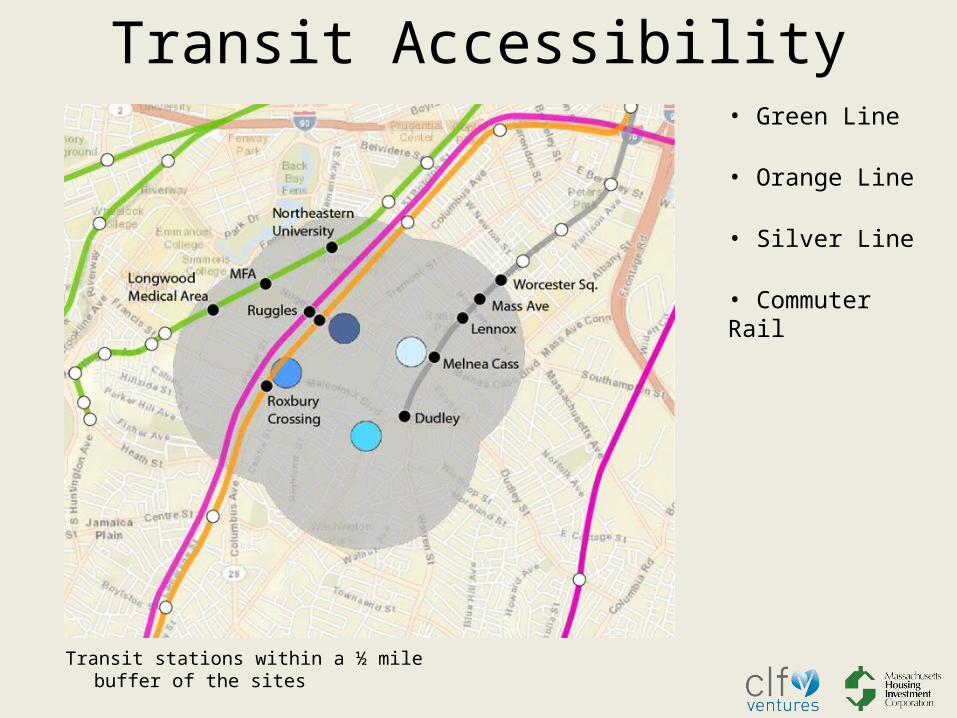
Transit stations within a ½ mile buffer of the sites
• Green Line
• Orange Line
• Silver Line
• Commuter Rail
Transit Accessibility
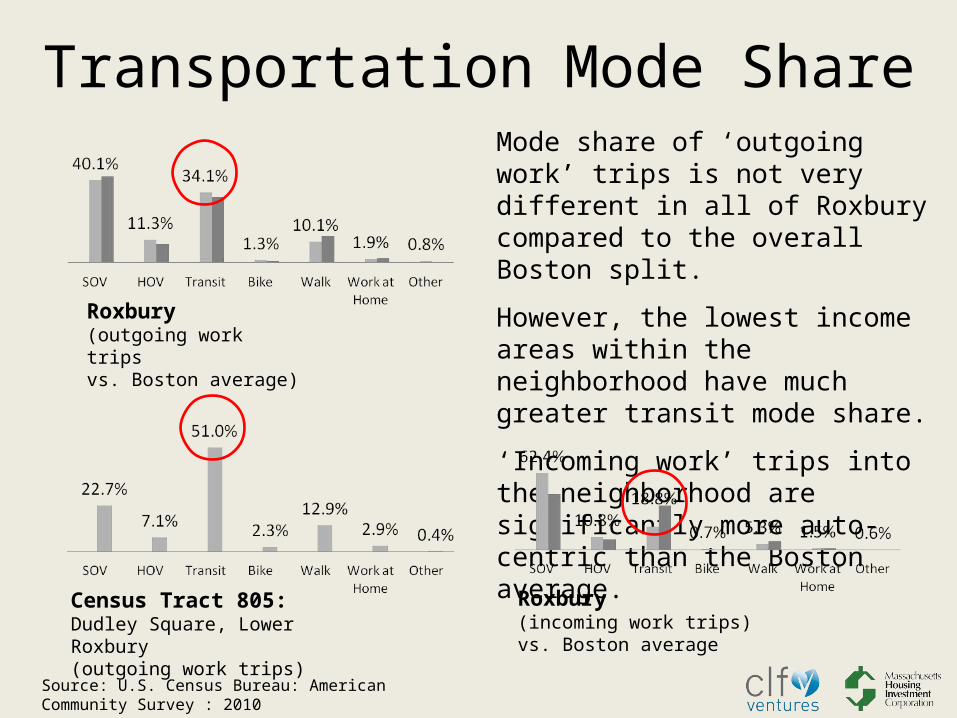
Census Tract 805: Dudley Square, Lower Roxbury(outgoing work trips)
Roxbury(outgoing work tripsvs. Boston average)
Mode share of ‘outgoing work’ trips is not very different in all of Roxbury compared to the overall Boston split.
However, the lowest income areas within the neighborhood have much greater transit mode share.
‘Incoming work’ trips into the neighborhood are significantly more auto-centric than the Boston average.
Roxbury(incoming work trips)vs. Boston average
Transportation Mode Share
Source: U.S. Census Bureau: American Community Survey : 2010
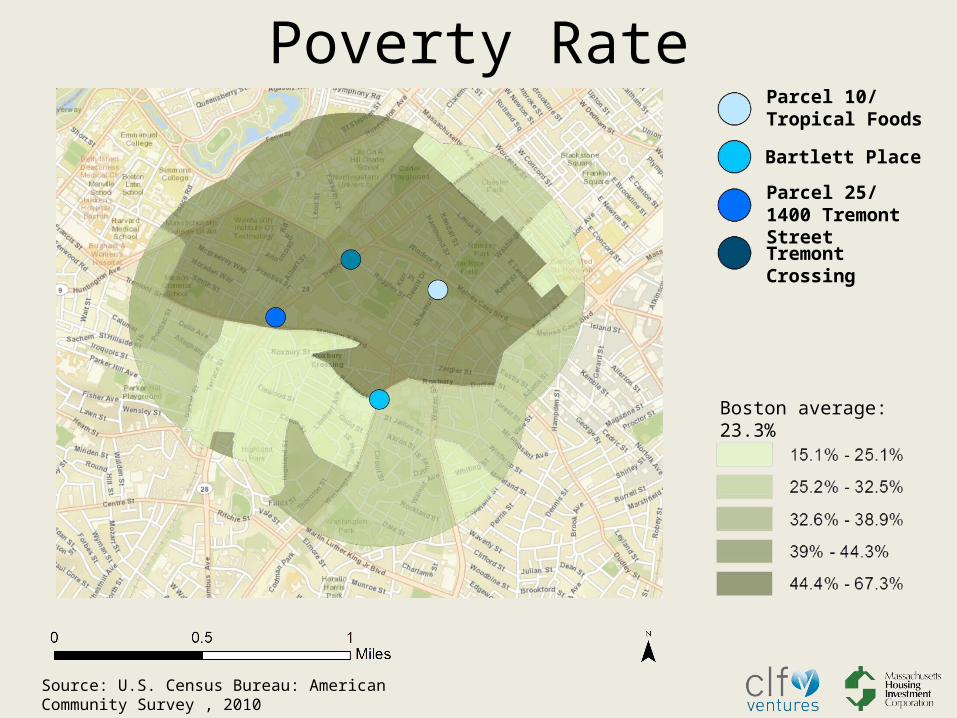
Boston average: 23.3%
Source: U.S. Census Bureau: American Community Survey , 2010
Poverty Rate
Bartlett Place
Parcel 25/1400 Tremont Street
Tremont Crossing
Parcel 10/Tropical Foods
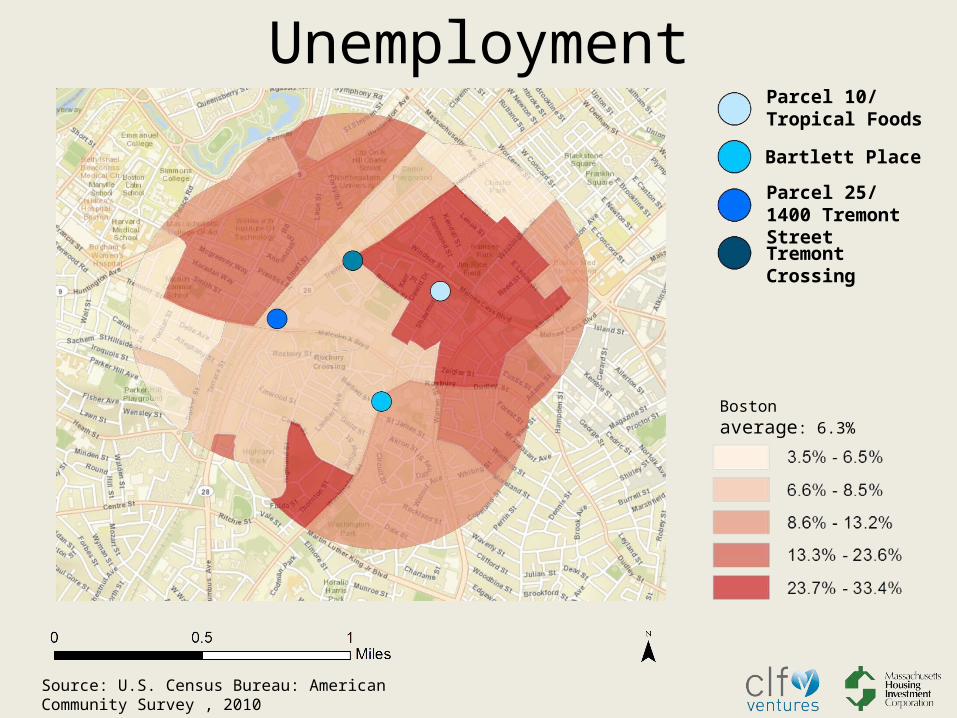
Boston average: 6.3%
Unemployment
Bartlett Place
Parcel 25/1400 Tremont Street
Tremont Crossing
Parcel 10/Tropical Foods
Source: U.S. Census Bureau: American Community Survey , 2010
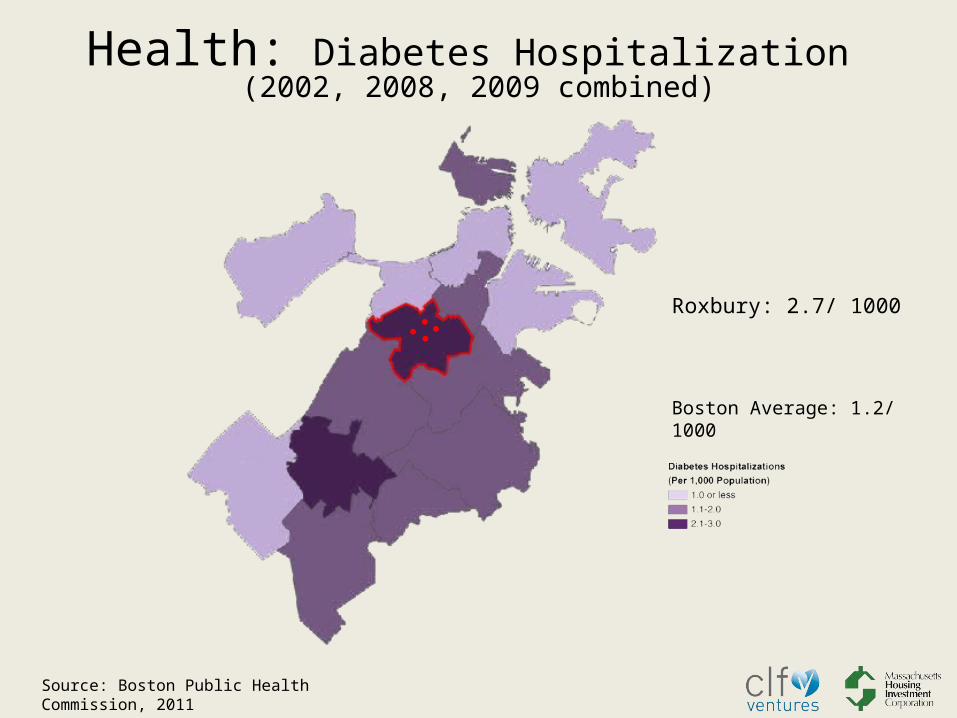
Health: Diabetes Hospitalization (2002, 2008, 2009 combined)
Boston Average: 1.2/ 1000
Roxbury: 2.7/ 1000
Source: Boston Public Health Commission, 2011

Boston Average: 19.4 / 1000
Health: Heart Disease Hospitalization (2007,2008,2009 combined)
Roxbury: 30.3/ 1000
Source: Boston Public Health Commission, 2011
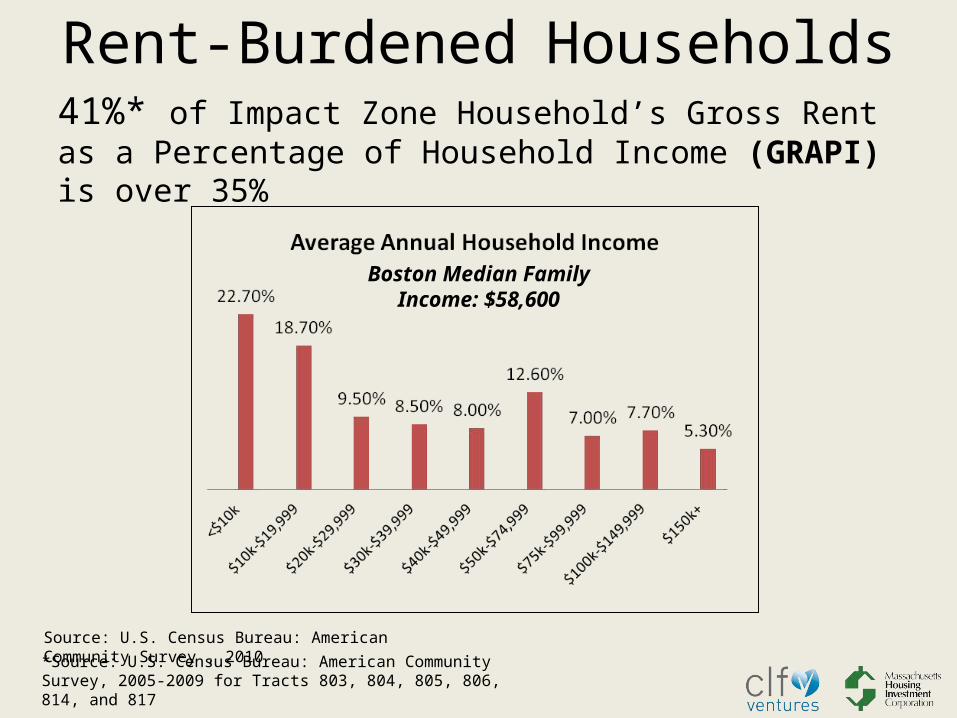
Boston Median Family Income: $58,600
Rent-Burdened Households
*Source: U.S. Census Bureau: American Community Survey, 2005-2009 for Tracts 803, 804, 805, 806, 814, and 817
41%* of Impact Zone Household’s Gross Rent as a Percentage of Household Income (GRAPI) is over 35%
Source: U.S. Census Bureau: American Community Survey , 2010
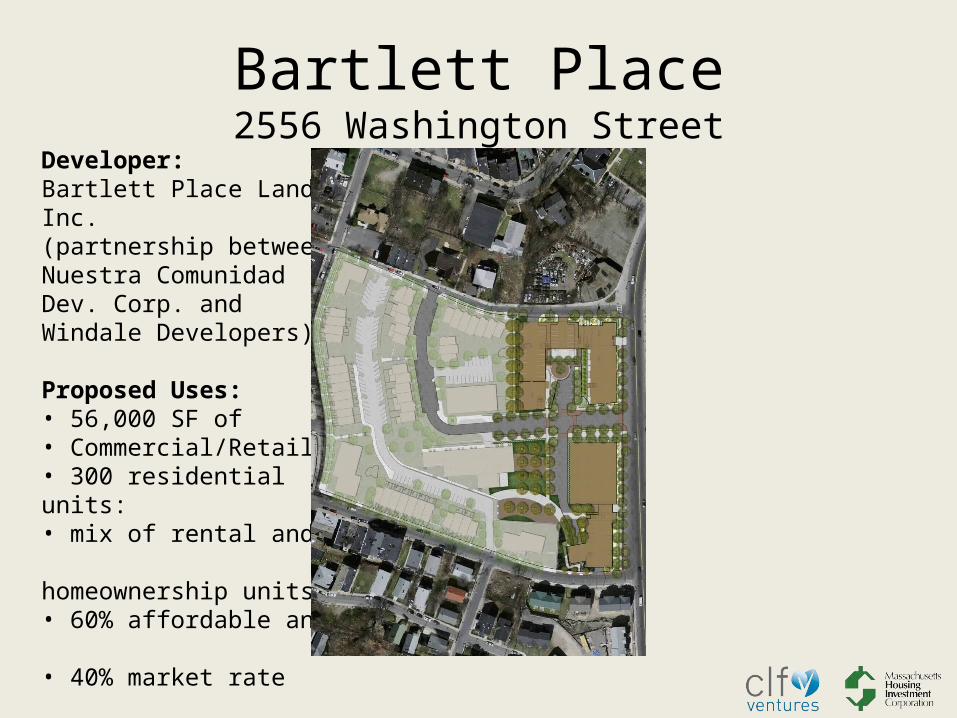
Bartlett Place2556 Washington Street
Developer: Bartlett Place Land Inc.(partnership between Nuestra Comunidad Dev. Corp. and Windale Developers)
Proposed Uses:• 56,000 SF of• Commercial/Retail • 300 residential units:• mix of rental and homeownership units • 60% affordable and • 40% market rate
Total Investment: $137 m

Cumulative Project ImpactNew Jobs
Affordable/Workforce Housing
Market -Rate Housing
Office and retail(SF)
Arts/ cultural (SF)
Total Investment
Bartlett Place
142 120 180
56,000 $137,000,000
Parcel 10/Tropical Foods
145 48 18
50,500
$44,000,000
Parcel 25
500* 65
200,000
$95,000,000
Tremont Crossing
1,738 240
700,000
58,000
$300,000,000
TOTAL 2,525 233 438
1,006,500
58,000
$576,000,000

Building Out a Community VisionRoxbury Community Master Plan: Boston Redevelopment AuthorityArts & Cultural HeritageEconomic Development & Job CreationTransportationHousingCommunity-Wide Urban Design Recommendations
Resilient Communities/ Resilient Families: Mission 180 - LISCCommunity Vision: Addressing community development through a public health lens, and working with residents to improve health outcomes.

Connecting the MetricsHealth Impact Assessments (three of four projects):
Awaiting funding decision from Mass. Dept. of Public Health
HIAs to be completed over 6 months (January - August 2013)
Will help inform health and wellness metrics for the Fund
State of Place™ Walkability Analysis Build on baseline walkability rating for
the neighborhood Examine most promising opportunities to
increase walkability Benchmark economic benefits of
increased walkability
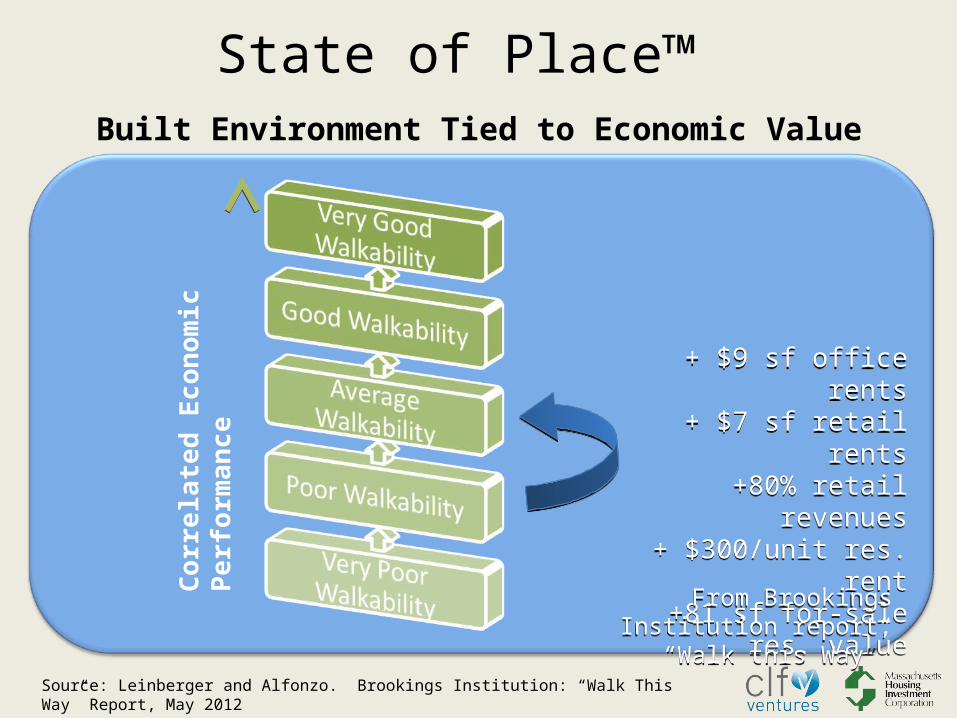
State of Place™ Built Environment Tied to Economic Value
Corr
ela
ted
Econ
om
ic
Perf
orm
an
ce
+ $9 sf office rents+ $7 sf retail rents
+80% retail revenues+ $300/unit res. rent
+81 sf for-sale res. value
+ $9 sf office rents+ $7 sf retail rents
+80% retail revenues+ $300/unit res. rent
+81 sf for-sale res. value
From Brookings Institution report, “Walk this Way”
From Brookings Institution report, “Walk this Way”
Source: Leinberger and Alfonzo. Brookings Institution: “Walk This Way” Report, May 2012
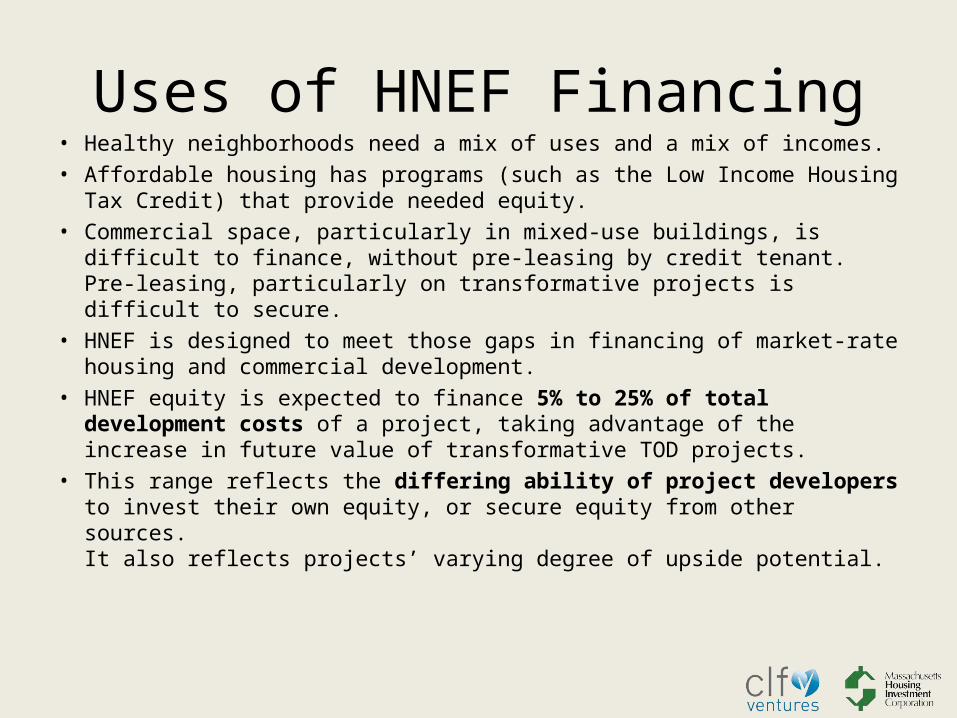
Uses of HNEF Financing• Healthy neighborhoods need a mix of uses and a mix of incomes.• Affordable housing has programs (such as the Low Income Housing Tax
Credit) that provide needed equity.• Commercial space, particularly in mixed-use buildings, is difficult to
finance, without pre-leasing by credit tenant. Pre-leasing, particularly on transformative projects is difficult to secure.
• HNEF is designed to meet those gaps in financing of market-rate housing and commercial development.
• HNEF equity is expected to finance 5% to 25% of total development costs of a project, taking advantage of the increase in future value of transformative TOD projects.
• This range reflects the differing ability of project developers to invest their own equity, or secure equity from other sources. It also reflects projects’ varying degree of upside potential.

HNEF Financing Terms• Projects will deliver return to investors over a 7 to 12 year period. Investor
returns will be generated via a share of project cash flow, along with priority distributions from refinancing or equity take-outs, and is expected to be in the range of 8-15%.
• While HNEF improves project feasibility, the trade-off is that it also requires the developer to share future upside with the HNEF investors.
• Terms for individual projects will depend on the degree of risk as well as the potential for upside returns.
• Sample terms (illustrative only): HNEF will receive an annual preferred return of 4% HNEF will receive 50% share of cash flow after preferred return For a project with substantial lease-up (or similar) reserves, 75% of release of
reserves will go to HNEF Payout from refinancing in 7-10 years to achieve target return of 15%, plus share
of equity upside above that
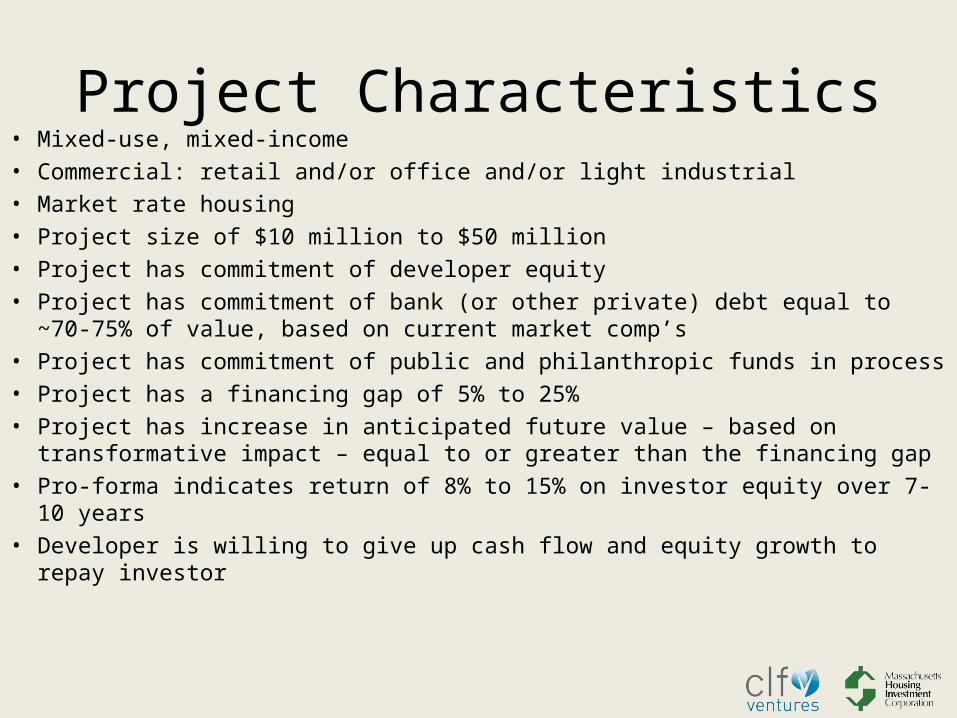
Project Characteristics• Mixed-use, mixed-income• Commercial: retail and/or office and/or light industrial• Market rate housing • Project size of $10 million to $50 million• Project has commitment of developer equity• Project has commitment of bank (or other private) debt equal to ~70-75% of
value, based on current market comp’s• Project has commitment of public and philanthropic funds in process• Project has a financing gap of 5% to 25%• Project has increase in anticipated future value – based on transformative
impact – equal to or greater than the financing gap• Pro-forma indicates return of 8% to 15% on investor equity over 7-10 years• Developer is willing to give up cash flow and equity growth to repay investor

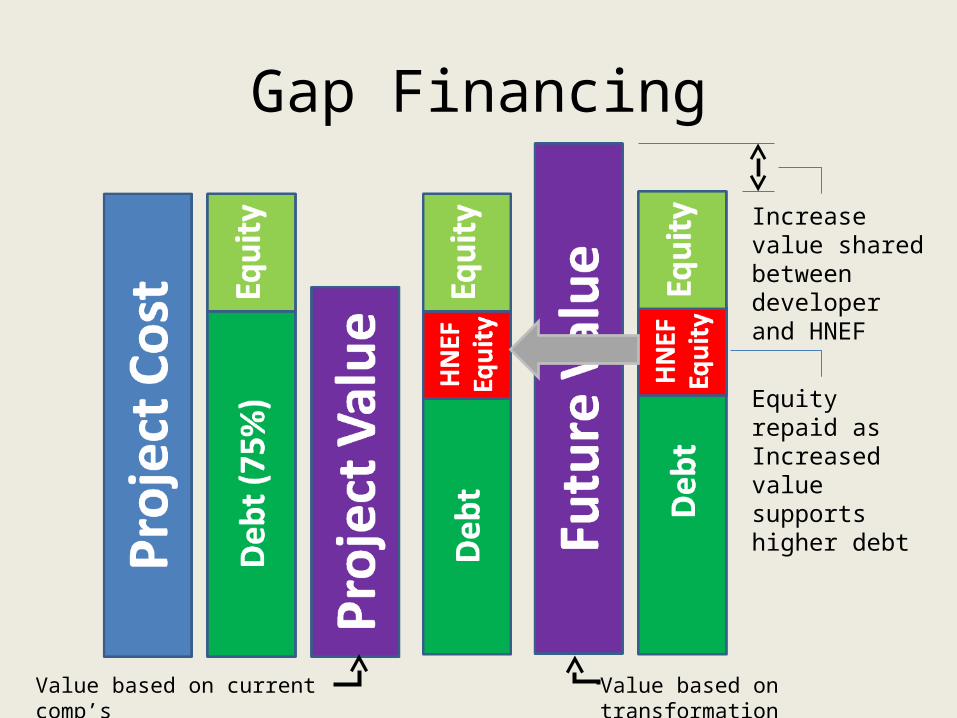
Assumes Value = Cost
• Debt = 75% of Value• Value based on current comp’s
Gap Financing
Gap Financing
Value based on current comp’s Value based on transformation
Increase value shared between developer and HNEF
Equity repaid asIncreased value supports higher debt
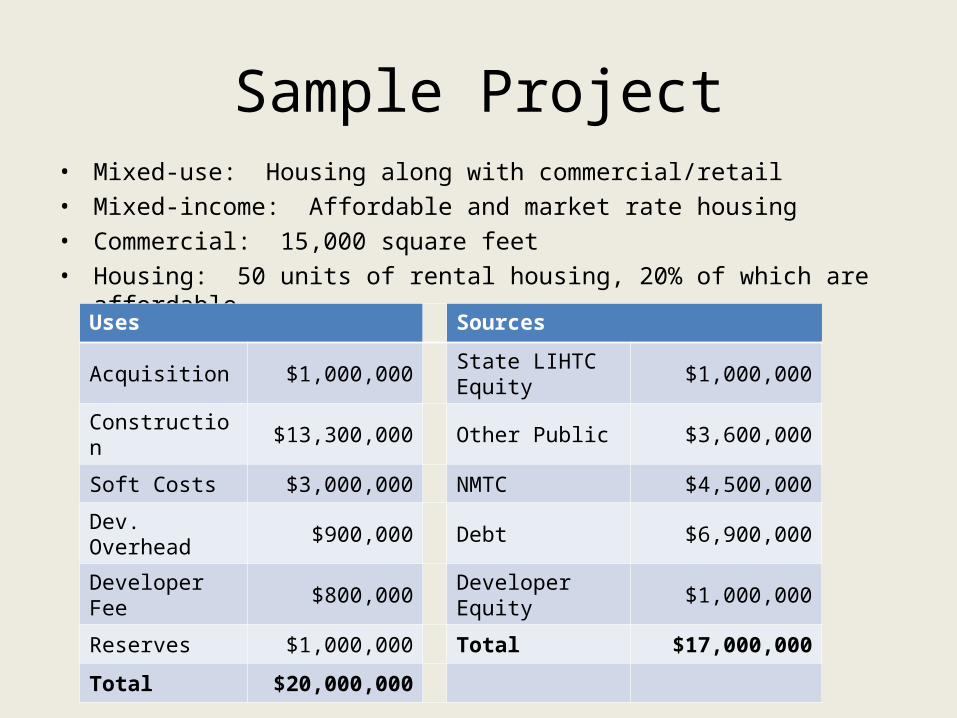
Sample Project• Mixed-use: Housing along with commercial/retail• Mixed-income: Affordable and market rate housing• Commercial: 15,000 square feet• Housing: 50 units of rental housing, 20% of which are affordable
Uses Sources
Acquisition $1,000,000 State LIHTC Equity $1,000,000
Construction $13,300,000 Other Public $3,600,000
Soft Costs $3,000,000 NMTC $4,500,000
Dev. Overhead $900,000 Debt $6,900,000
Developer Fee $800,000 Developer Equity $1,000,000
Reserves $1,000,000 Total $17,000,000
Total $20,000,000
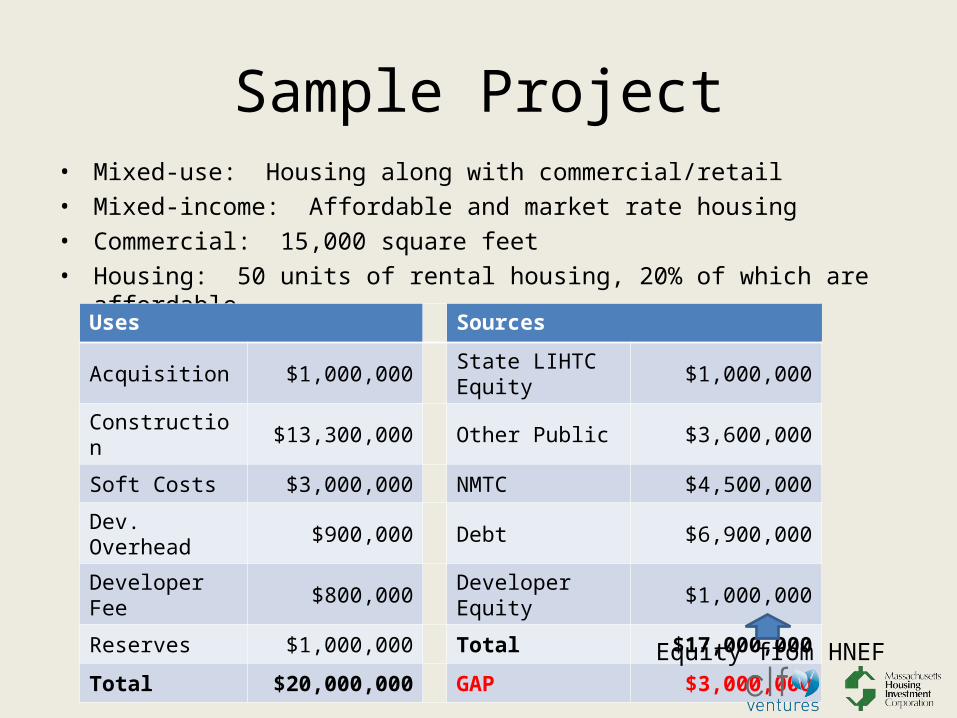
Sample Project• Mixed-use: Housing along with commercial/retail • Mixed-income: Affordable and market rate housing• Commercial: 15,000 square feet• Housing: 50 units of rental housing, 20% of which are affordable
Uses Sources
Acquisition $1,000,000 State LIHTC Equity $1,000,000
Construction $13,300,000 Other Public $3,600,000
Soft Costs $3,000,000 NMTC $4,500,000
Dev. Overhead $900,000 Debt $6,900,000
Developer Fee $800,000 Developer Equity $1,000,000
Reserves $1,000,000 Total $17,000,000
Total $20,000,000 GAP $3,000,000
Equity from HNEF

Fund Structure and Capitalization• The HNEF will be a structured fund with a capital stack aimed at ensuring the fund
can make transformative investments while meeting institutional investors return expectations.
• There will be a “top loss” investor with a tolerance for absorbing risk and lower return expectations, which will offset the return expectations of other investors.
• Program related investments from foundations and social impact investors will form the second tier, who can be expected to moderate their return expectations depending on the strength of the other bottom lines.
• Private (institutional) investors will make up the balance of the fund. • The overall goal of capital development will be to attract investors that will tolerate
a 8-15% blended return. Another objective of the Fund will be to create a blended equity structure with different timing and risk requirements to meet the complex needs of various TOD projects.
• Projects will be underwritten for financial feasibility by MHIC, while CLFV will review for conformance with HNEF’s healthy community goals.

Public Funds
PRI Investor PRI Investor PRI Investor
PrivateInvestor
Sub
ordi
nate
Ret
urn
Sen
ior
Ret
urn
Pari-passu
PrivateInvestor
PrivateInvestor
PrivateInvestor
PrivateInvestor
Capital Structure
Synergy with LISC Fund• Building healthy communities in TOD locations requires a mix of
uses, including affordable and market rate housing, as well as retail and commercial development.
• The CLFV/MHIC and LISC Funds complement each other in filling the financing gaps necessary to create such communities.
• The two Funds differ in timing and project type. The LISC Fund is intended to provide early pre-development financing to accelerate the financing of mixed-use projects in TOD locations. The CLFV/MHIC Fund is intended to provide patient equity for projects that include market and moderate income housing, as well as commercial and retail uses.
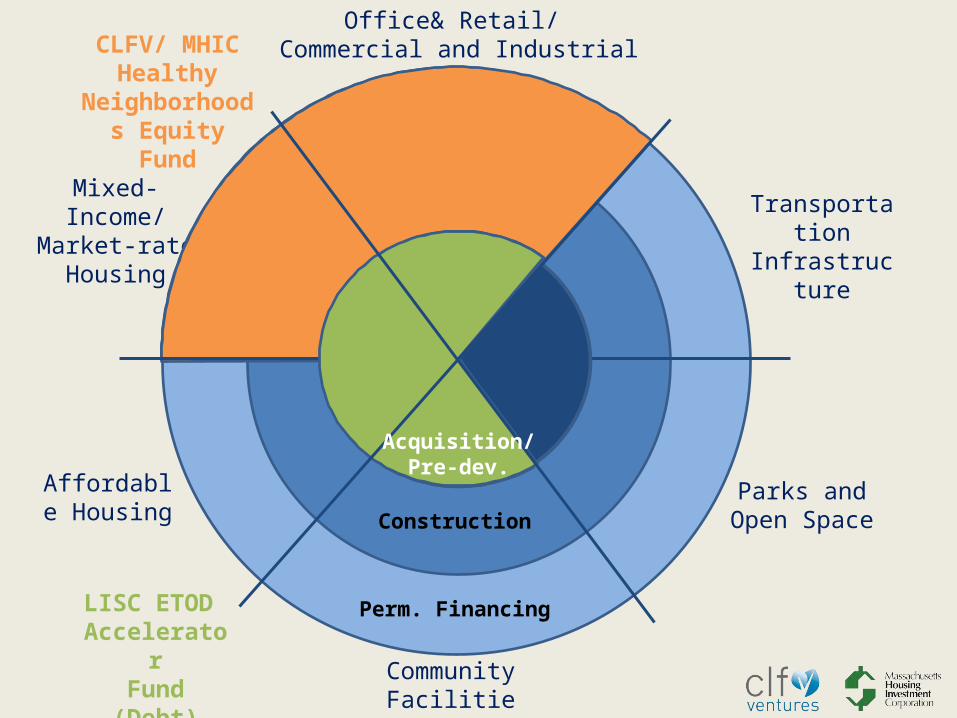
Transit-Oriented Development: Closing
the Financing Gap
Affordable Housing
Mixed-Income/ Market-rate
Housing
Office& Retail/ Commercial and Industrial
CommunityFacilities
Transportation Infrastructure
Parks and Open SpaceConstruction
Perm. FinancingLISC ETOD AcceleratorFund (Debt)
CLFV/ MHIC Healthy
Neighborhoods Equity Fund
Acquisition/Pre-dev.

Achieving Regional and Statewide Goals
• Statewide Goals:• Commonwealth of MA: 10,000 new MF units/ year• HNEF project criteria are consistent with
Commonwealth of Massachusetts “Compact Neighborhoods” principles
• MetroFuture Goals:• TOD neighborhoods in greater Boston have the
potential to accommodate 76,000 new housing units and 133,000 new jobs over the next 25 years
Clarifying questions about Equitable TOD Accelerator Fund
or Healthy Neighborhoods Equity Fund
Questions?

BREAK
SecretaryExecutive Office of Housing and Economic Development
Commonwealth of Massachusetts
Gregory Bialecki

President, LOCUSResponsible Real Estate
Developers and Investors
Christopher B. Leinberger
Thank you for attending today!