today’s debate on global climate change: search for the
TRANSCRIPT
114
114
Today’s Debate on Global Climate Change:Searching for the Scientific Truth
Paolo Zannetti ([email protected])President, EnviroComp Institute (www.envirocomp.org)
November 1998
Table of Contents
List of AbbreviationsIntroductionThe Emergence of Global ConcernThe Two Sides of the Issue
The First Group’s ArgumentThe Second Group’s Arguments
A Preliminary, Personal ConclusionAddendumSome Internet Resources and Information on Global WarmingReferencesFigures

115
115
List of Abbreviations
AOGCM Atmosphere-Ocean General CirculationModels
CA Californiacm CentimeterCO2 Carbon dioxideDOE Department of EnergyGHGs Greenhouse gases
GNP Gross national productppmv Parts per million volumeSSTs Sea surface temperaturesUN United NationsUNEP United Nations Environmental ProgrammeUS United StatesWMO World Meteorological Organization
Introduction
In the last few months, I have made a substantial effort to learn more about global issues and therole that increasing atmospheric concentrations of CO2 may play in generating global warming.This is a subject that I have followed with interest since the early 1980s, when I published areview paper on this matter for an Italian scientific magazine [Zannetti 1982]. At that time, thesubject was not very fashionable; today, global change is at the top of scientific and politicalagendas worldwide.
I would like to share with readers some scientific considerations and observations based upon myrecent reading. As a person who has worked in environmental sciences for more than 25 years, Ihave always followed the scientific method and I am somewhat disturbed by certain aspects ofthe current scientific debate on this topic. I hope readers will comment on my observations,provide constructive criticism, and send me additional information to expand this analysis and, ifneeded, correct any unclear or erroneous statements of mine.
I also feel obliged to state in advance that this work was performed as a personal scientificendeavor, with no pre-conceived agenda and no direct financial support from any group ororganization. I wish this clarification were not needed, but probably it is, in the current hotpolitical climate where ad-hominem attacks against scientists seem frequently based on theiraffiliation and sponsorship entities instead of the contents of their scientific arguments.
The Emergence of Global Concern
Scientists have often debated, in the last few decades, the possible role of anthropogenicactivities in changing the composition of the atmosphere and affecting the climate. We knowthat, on local and urban scales, climate has been affected by urbanization. For example,meteorologists have known for many decades that urban areas create a warm region, called“urban heat island” [Stern et al. 1984], which at the surface remains a few degrees higher thansurrounding rural regions. Also, we have evidence that decades of urban development withswimming pools and golf courses, as well as agriculture, in desert areas (e.g., Palm Spring, CA)have affected the local climate by increasing the average relative humidity.
The presence of anthropogenic effects on climate at larger scales (e.g., the continental and globalscale) is more difficult to assess. The reason is that continental and global climate is very

116
116
complex and affected by a very large number of parameters, including chaotic components.Climate changes can be detected, but the attribution of causes is a formidable challenge sinceobserved changes can be due to either natural variability or human-induced effects – or both.
One of the main reasons why concern about global changes and discussions on global warmingare popular today is illustrated in Figure 1, which shows combined land-surface and sea-surface,annual temperature anomalies from 1861 to 1994 over the entire globe. If you cover with yourhand the temperature data after 1980, hardly any evidence could be found of increasing globalwarming. But if you look at the temperature trend in this century and the effects of the twowarming periods of 1910-1940 and 1975-1994, an average warming trend may be inferred. Ifthis warming is then interpreted as just the initial phase of a large trend caused by accumulationof greenhouse gases (GHGs), such as carbon dioxide (CO2), then there is clearly reason forconcern.
In the last few years, an increasingly larger segment of the scientific world has studied globalissues. The increasing number of publications, computer simulation efforts, and monitoringactivities is impressive (see, for example, the list of Internet sites provided at the end of thisarticle). Furthermore, the political and economic implications of global change have attracted theinterest of the media and the common citizen. Many scientists, even those who do not havedirect expertise in global climate or environmental matters, have felt the need to express publicopinions and support, agreements and disagreements. These events, of course, are good and badat the same time.
The positive aspect is the increasing worldwide support to scientific research aiming atunderstanding and simulating the physical and chemical mechanisms of the earth.Environmental sciences are still “young” and the danger associated with possible future globalwarming is clearly triggering interest and support for this emerging area of study. The negativeaspect is the politicization of the scientific debate and the intrusion of non-scientific (or anti-scientific) methods, especially from activist groups with pre-defined agendas.
In this climate, the reader of scientific literature must be extra cautious and try to identify andgive maximum credence to those authors that appear to be unbiased, without pre-conceivedopinions, and adopt without reservation the scientific method.
The Two Sides of the Issue
In a nutshell, there are two main groups of scientists dealing with global change: the believersand skeptics. Of course, this is a gross parameterization of a large spectrum of ideas andthoughts. Many scientists, actually, consider themselves as “uncommitted”. However, at leastinitially, this basic subdivision is useful.
The first group – the believers – basically state that, today, there is enough evidence to suggest adiscernible human influence on global climate and, more specifically, a warming trend that isunlikely to be entirely natural in origin. In other words, modern science was not only able todetect global warming, but also to attribute its cause(s) to human activities, i.e., the

117
117
anthropogenic emission of greenhouse gases (GHGs), such as CO2. Global warming is expectedto cause several adverse effects, e.g., a rise in global mean sea level. The most important pieceof literature for this group is Houghton et al. [1996] – an impressive and comprehensive report,published under the umbrella of the World Meteorological Organization (WMO) and the UnitedNations (UN) Environmental Programme (UNEP).
The second group – the skeptics – are an increasingly large number of scientists who expresscaution and challenge some or most of the statements of the first group. Some statements arechallenged as scientifically untrue, others as inappropriate and premature in light of all knownuncertainties on this matter which are, indeed, quite large. Their publications appear periodicallyin reputable scientific journals and conference proceedings. They are not operating, at leasttoday, in an organized fashion under dedicated institutional umbrellas. The recent conference∗
“Countdown to Kyoto” in Canberra, Australia, represents perhaps the first comprehensive effortto create a “home” and an organized voice for this group.
Both groups include moderates and extremists, with the extremists – not surprisingly – being themost politicized segment of the two communities. The media have tended, so far, to give morespace and credibility to the first group, even though voices from the second group areincreasingly heard. Needless to say, there are excellent scientists in both groups, with many alsooccupying a position that can only be described as “in between” the two. There is no doubt that,eventually, in a few decades, the scientific method will prevail by confirming only those theoriesand conclusions that are fully supported by scientific evidence.
The First Group’s Argument
The first group’s arguments [Houghton et al. 1996] can be basically summarized in nine (9)items:
1. CO2 increase in the atmosphere is the most important factor affecting changes in globalradiative forcing+ .
This statement is summarized in Figure 2 which illustrates the role of CO2 incomparison with all other known factors which affect the change of radiativeforcing from pre-industrial times to the present day. In other words, the increasein atmospheric CO2 has recently been (and is expected to be) the single, mostimportant factor in causing global temperatures to increase on the earth.
∗ ‘Countdown to Kyoto’: The Consequences of the Mandatory Global Carbon Dioxide Emissions Reductions,Australian APEC Study Centre, Canberra, Australia, 19-21 August 1997.(http://www.arts.monash.edu.au/ausapec/kypaps.htm).
+ Radiative forcing is the perturbation to the energy balance of the Earth-atmosphere system, expressed in watts persquare meter [Wm-2]

118
118
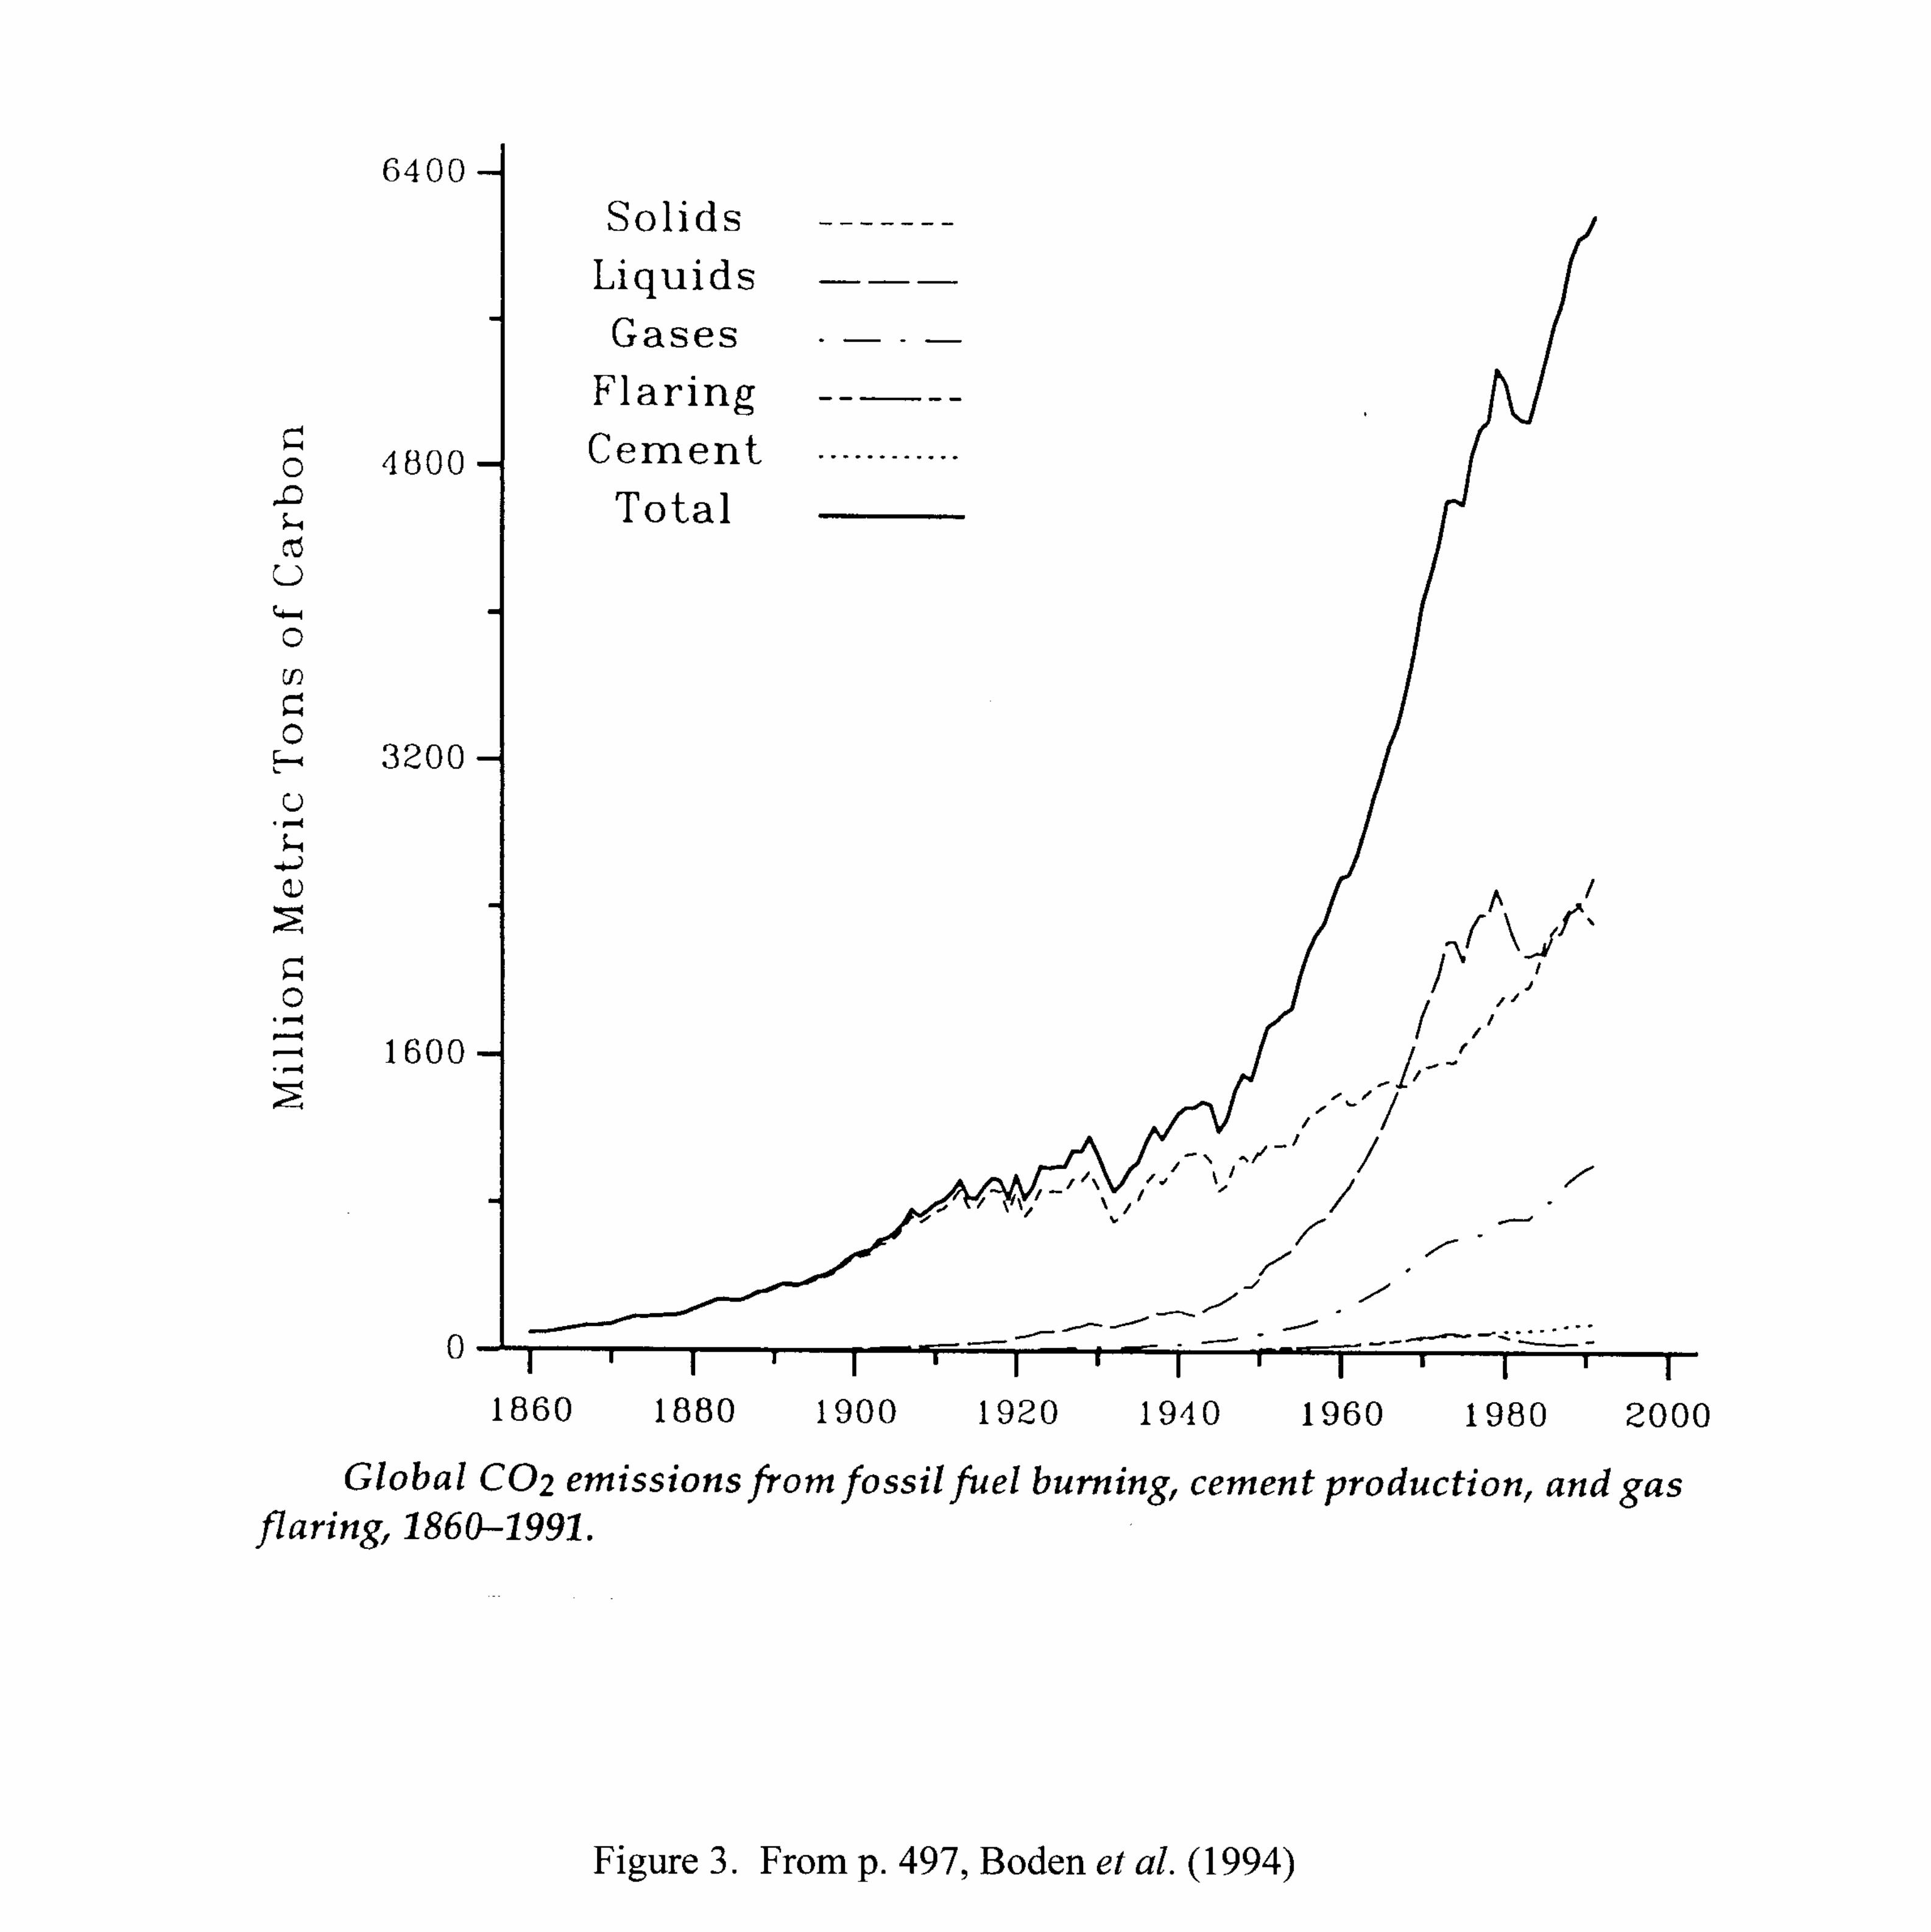
2. Anthropogenic CO2 emissions are increasing worldwide.
Figure 3 provides an estimate of the growing anthropogenic emissions of CO2from 1860 to present day. CO2 emissions have increased by a factor of 4 in thesecond half of this century. In 1991, approximately 6,200 million metric tons ofcarbon, was emitted to the atmosphere as a result of fossil fuel burning, cementmanufacturing, and gas flaring.
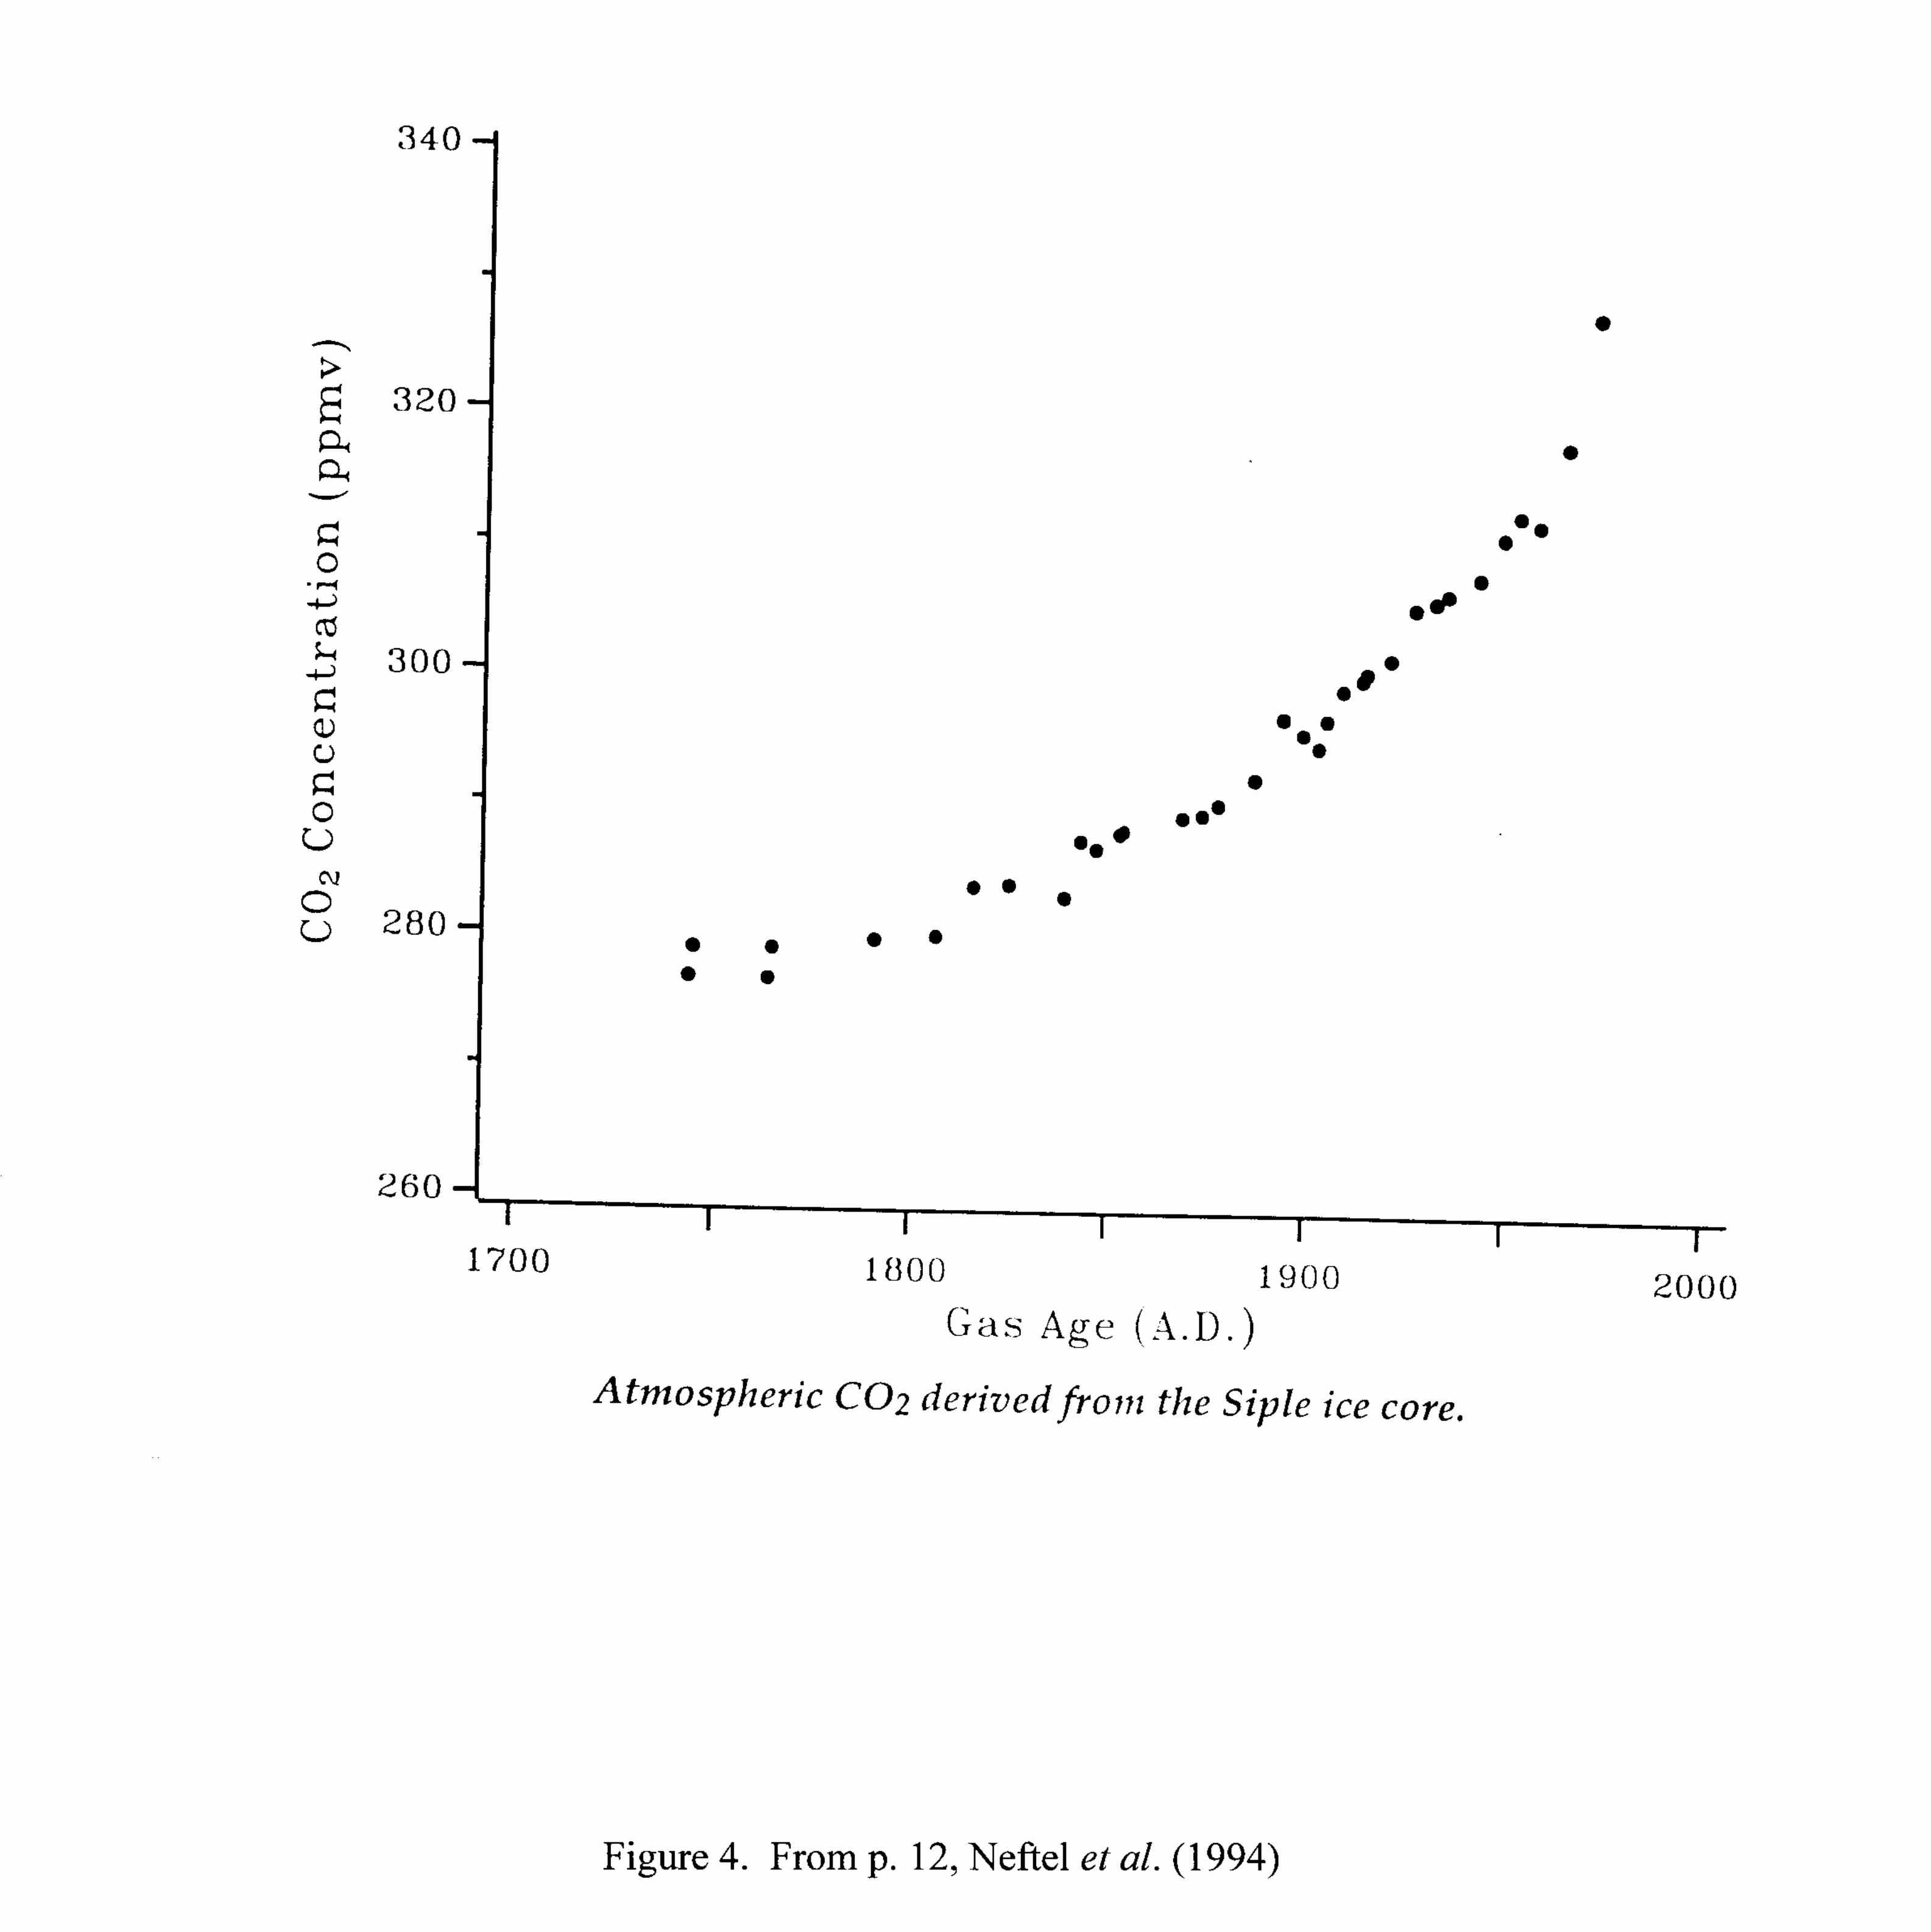
3. As a consequence of CO2 emissions, atmospheric concentrations of CO2 are increasing
worldwide.
Figure 4 gives an atmospheric CO2 record for the past 200 years, showing anincrease of CO2 concentrations, from a pre-1800, pre-industrial value of about 280ppmv to the current value of about 360 ppmv. Figure 5 illustrates the longestcontinuous record of atmospheric CO2 measurements available in the world, fromabout 315 ppmv in the 1950s to about 360 ppmv today.
4. The CO2 concentration increase is causing global temperatures to increase; “fingerprints”
of CO2-caused global warming have been found on spatial patterns.
Figure 1 indicates that global temperatures have increased during this century.There is an evident correlation between CO2 and temperature increase, illustratedin Figure 6. More importantly, unlike the previous computer models, the currentgeneration of global models (i.e., Atmosphere-Ocean General CirculationModels*, AOGCM) simulate well the temperature increase in this century whenthe direct effect of sulfates is taken into account (see Figure 7). The simulation ofthe AOGCM proves that the increase of global temperature is mostly due to theincrease of GHGs.
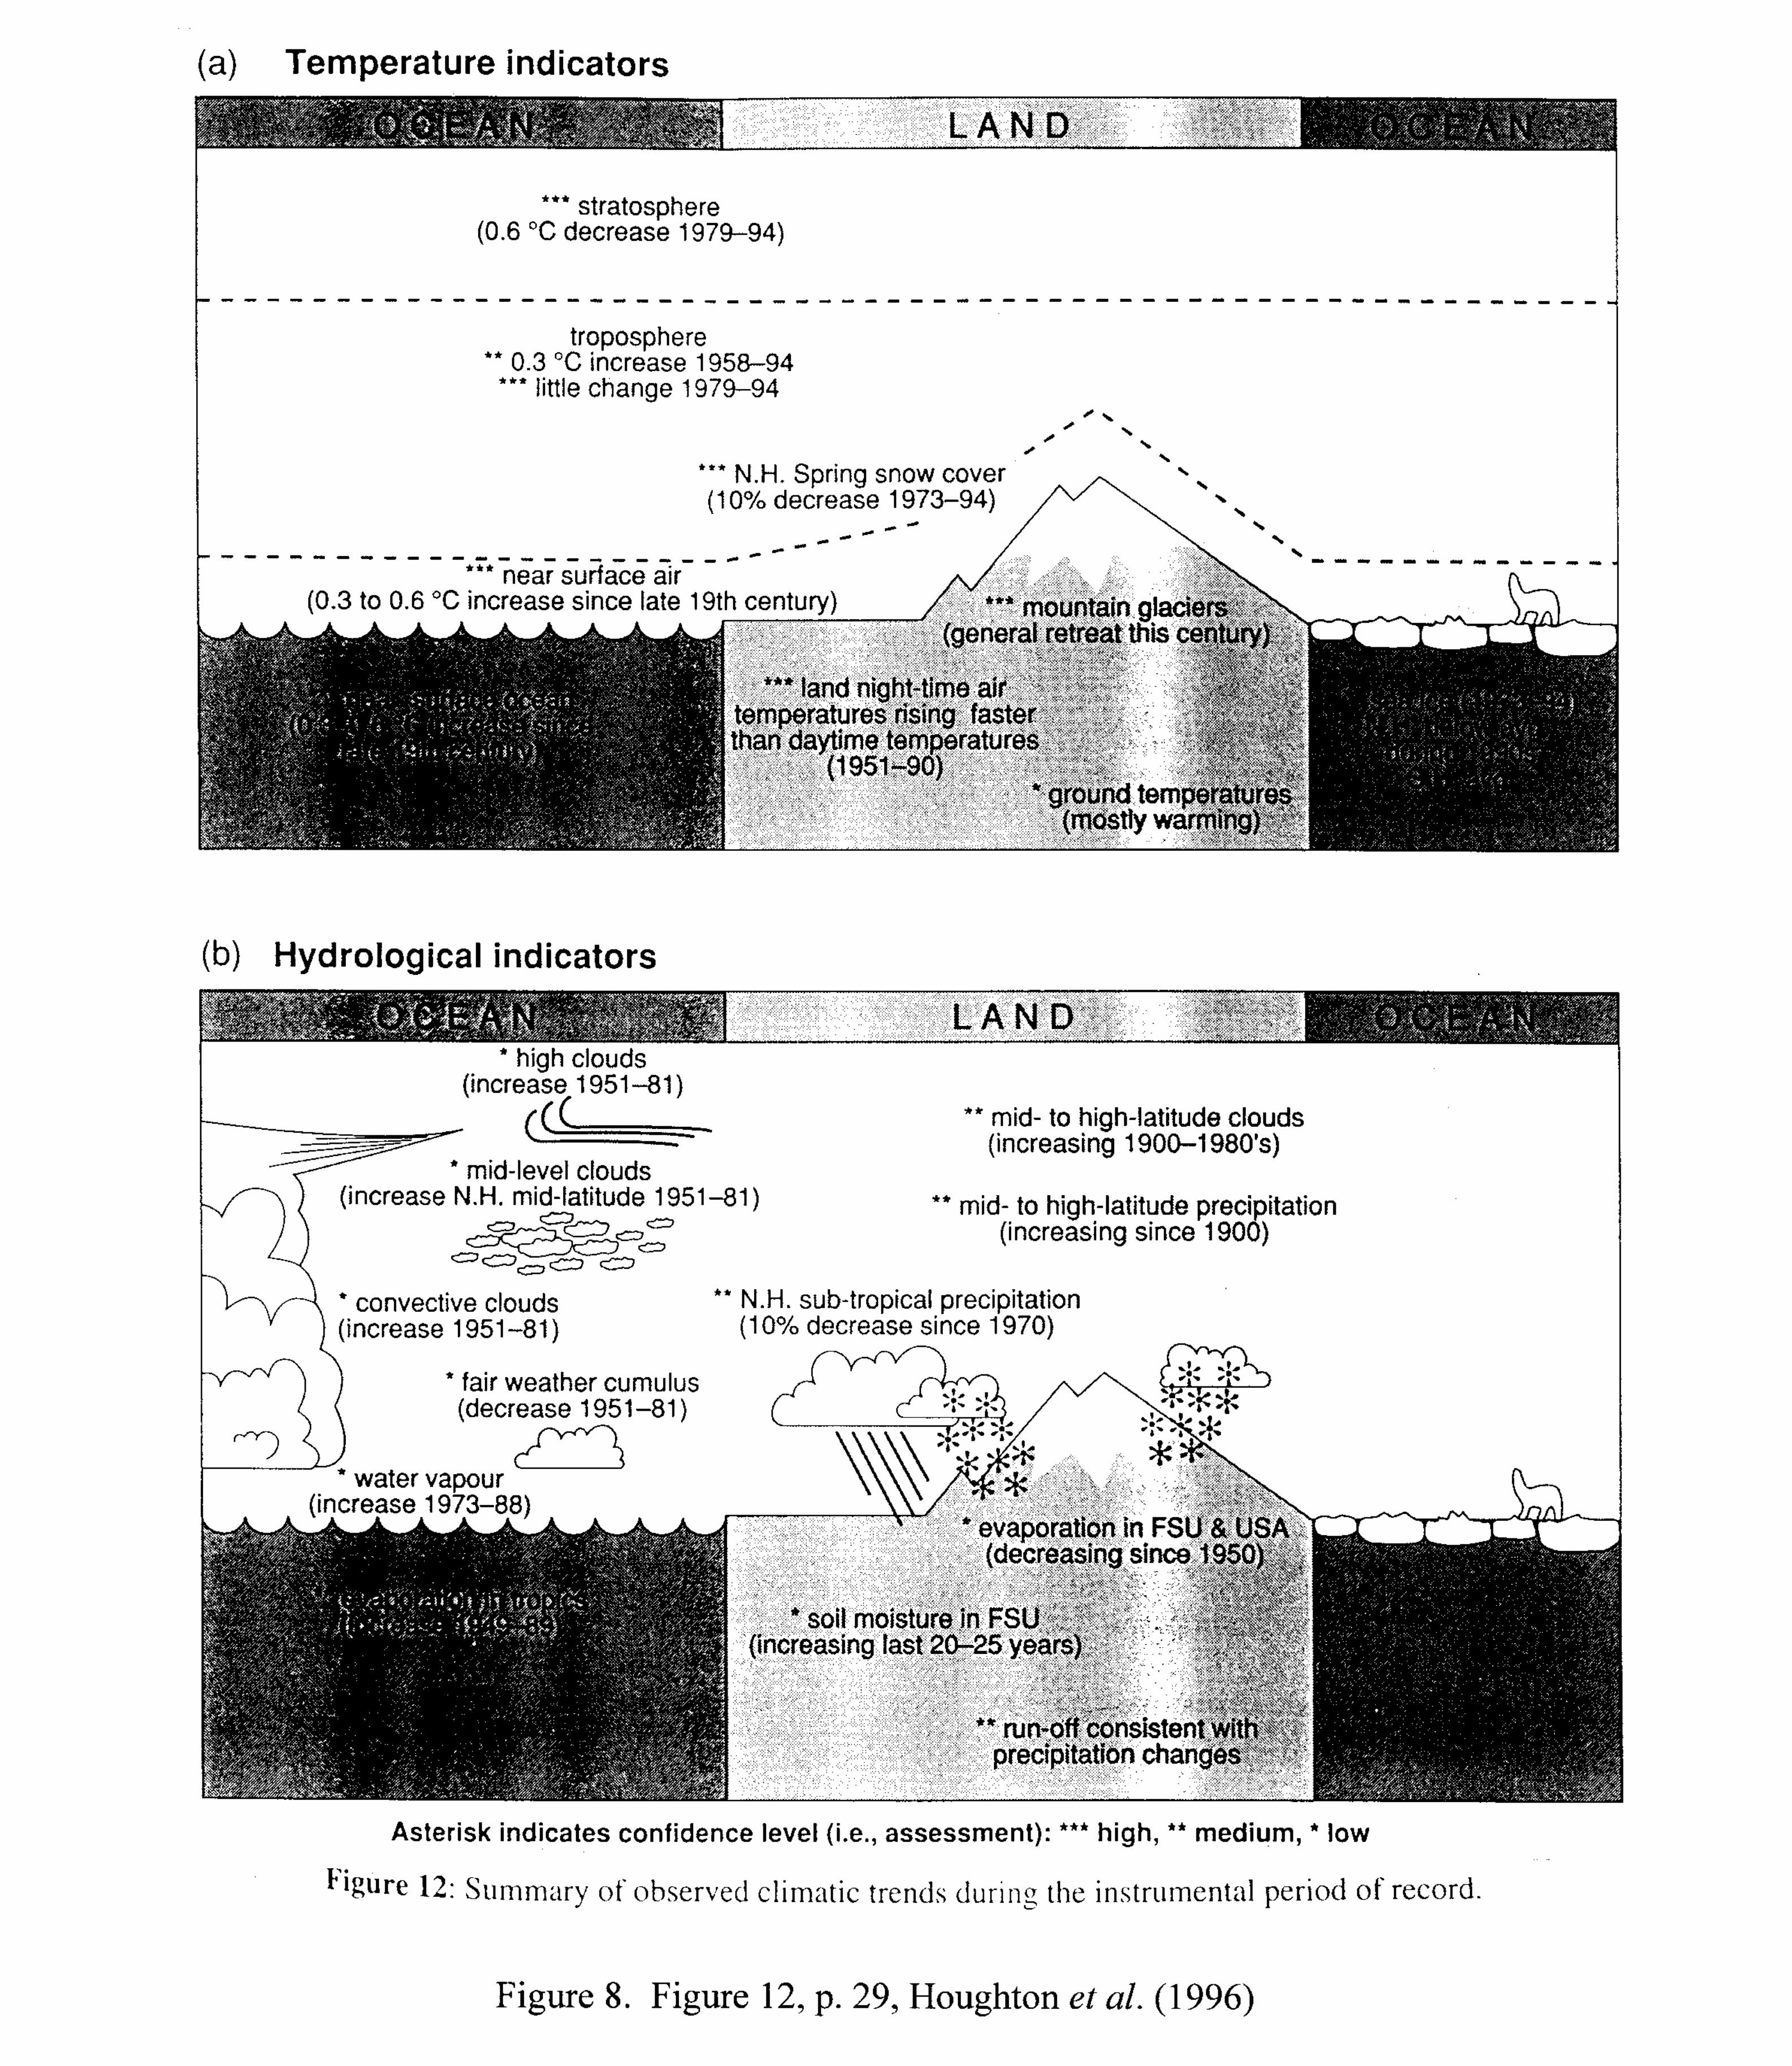
Recent studies, instead of focusing on global means, have compared observationswith the spatial patterns of temperature changes predicted by AOGCM. Thesestudies show significant correspondence between the observations and modelpredictions and, thus, indicate human influence on global climate. A summary ofthese observed climatic trends is illustrated in Figure 8.
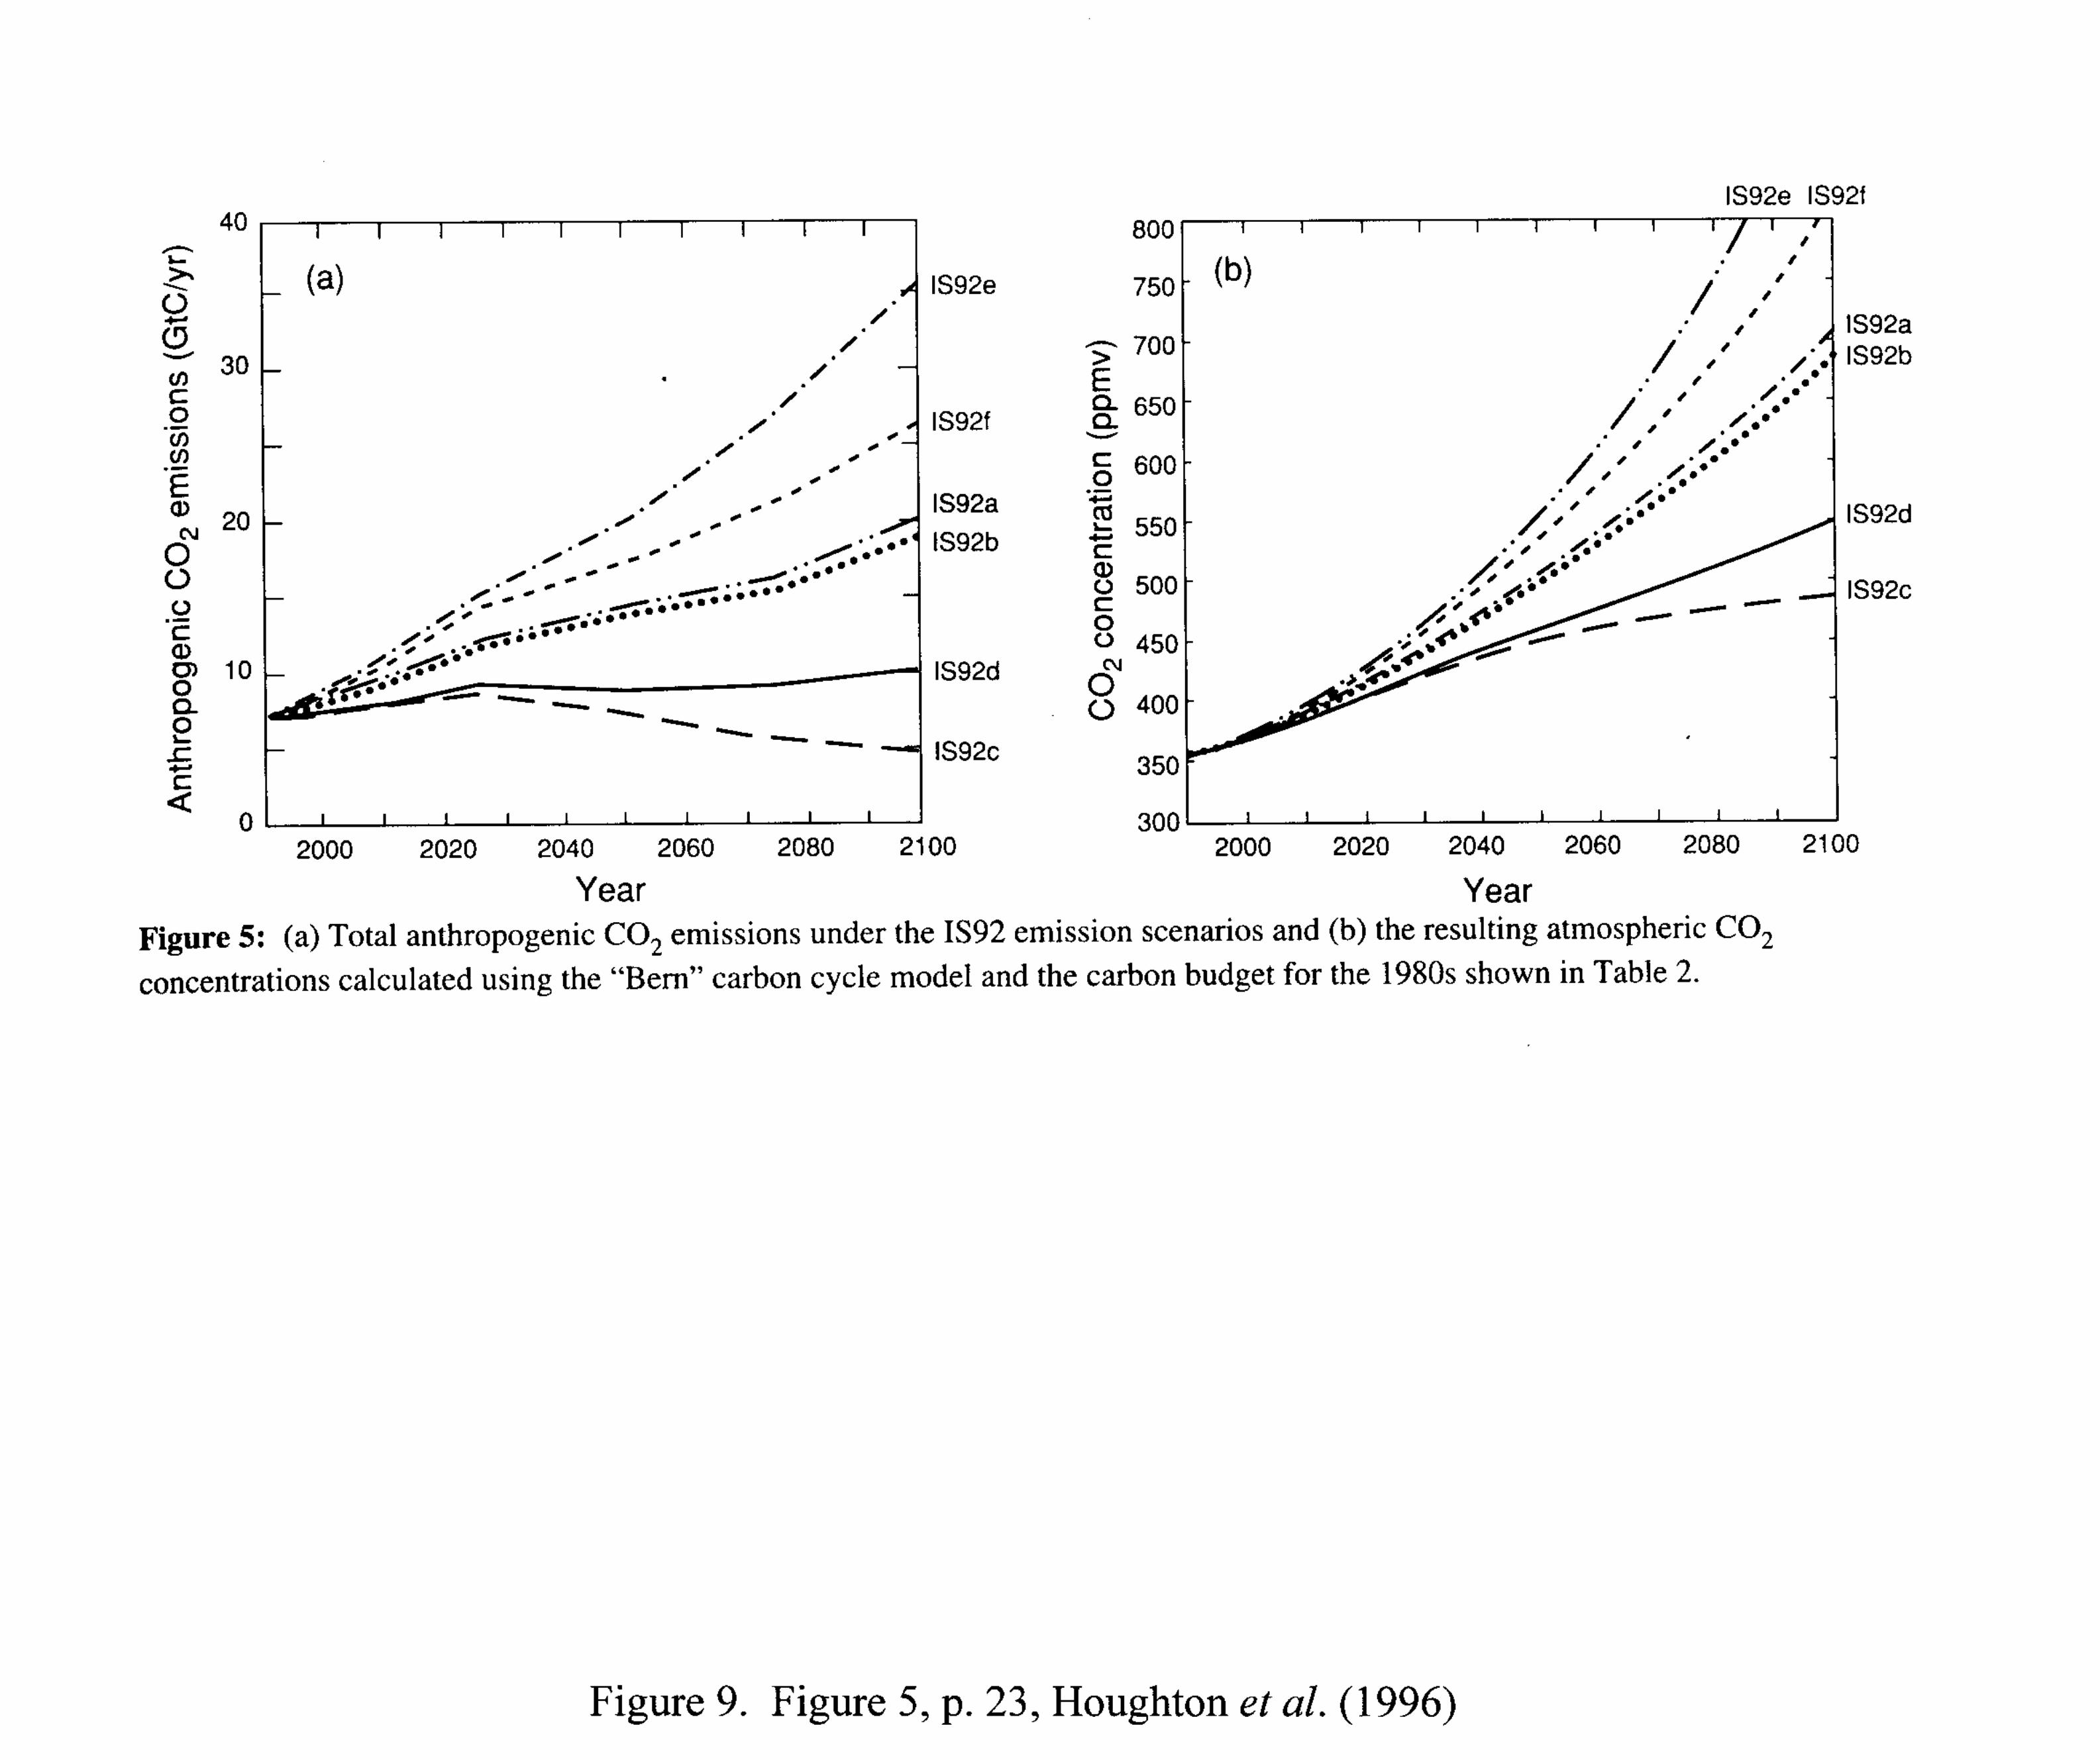
5. CO2 concentrations are expected to double in the next century.
The IS92 emission scenarios [IPCC 1992] provide projections of future emissionsof GHGs and aerosol precursors and the proportion of emissions remaining in theatmosphere. The projected CO2 emissions and resulting atmospheric CO2
* In coupling atmospheric and ocean general circulation models, typically the model atmosphere only sees the sea
surface temperatures (SSTs) and sea ice, while the model ocean sees the surface wind stress, the freshwater flux(precipitation minus evaporation), and the heat fluxes [Trenberth 1996]. An alternative approach to the utilizationof hydrologic models in the context of climate change simulations is discussed by Pielke et al. [1997].
119
119
concentrations are illustrated in Figure 9. Both CO2 emissions and ambient CO2concentrations are expected to double in the next century.
6. Current global AOGCM are reliable tools for forecasting climate change when simulations
include the likely effect of aerosols in addition to GHGs.
As illustrated in Figure 7, the most recent computer simulations using AOGCMinclude the cooling effect of sulfate aerosols and, by doing so, are able to simulatecorrectly the global warming in this century. This successful validation gives usconfidence in using the same models for forecasting future impacts of increasingCO2 concentrations in the next century.
7. Global model forecasts indicate that, as a consequence of increasing CO2 concentrations in
the next century, global temperatures will increase a few degrees Celsius.
Figure 10 illustrates the extreme range of possible global temperature increases inthe next century, from 0.8°C to 4.5°C, as simulated by the current AOGCM usingthe projections presented in Figure 9.
8. Global model forecasts indicate that, as a consequence of temperature increase, serious
adverse effects will be experienced.
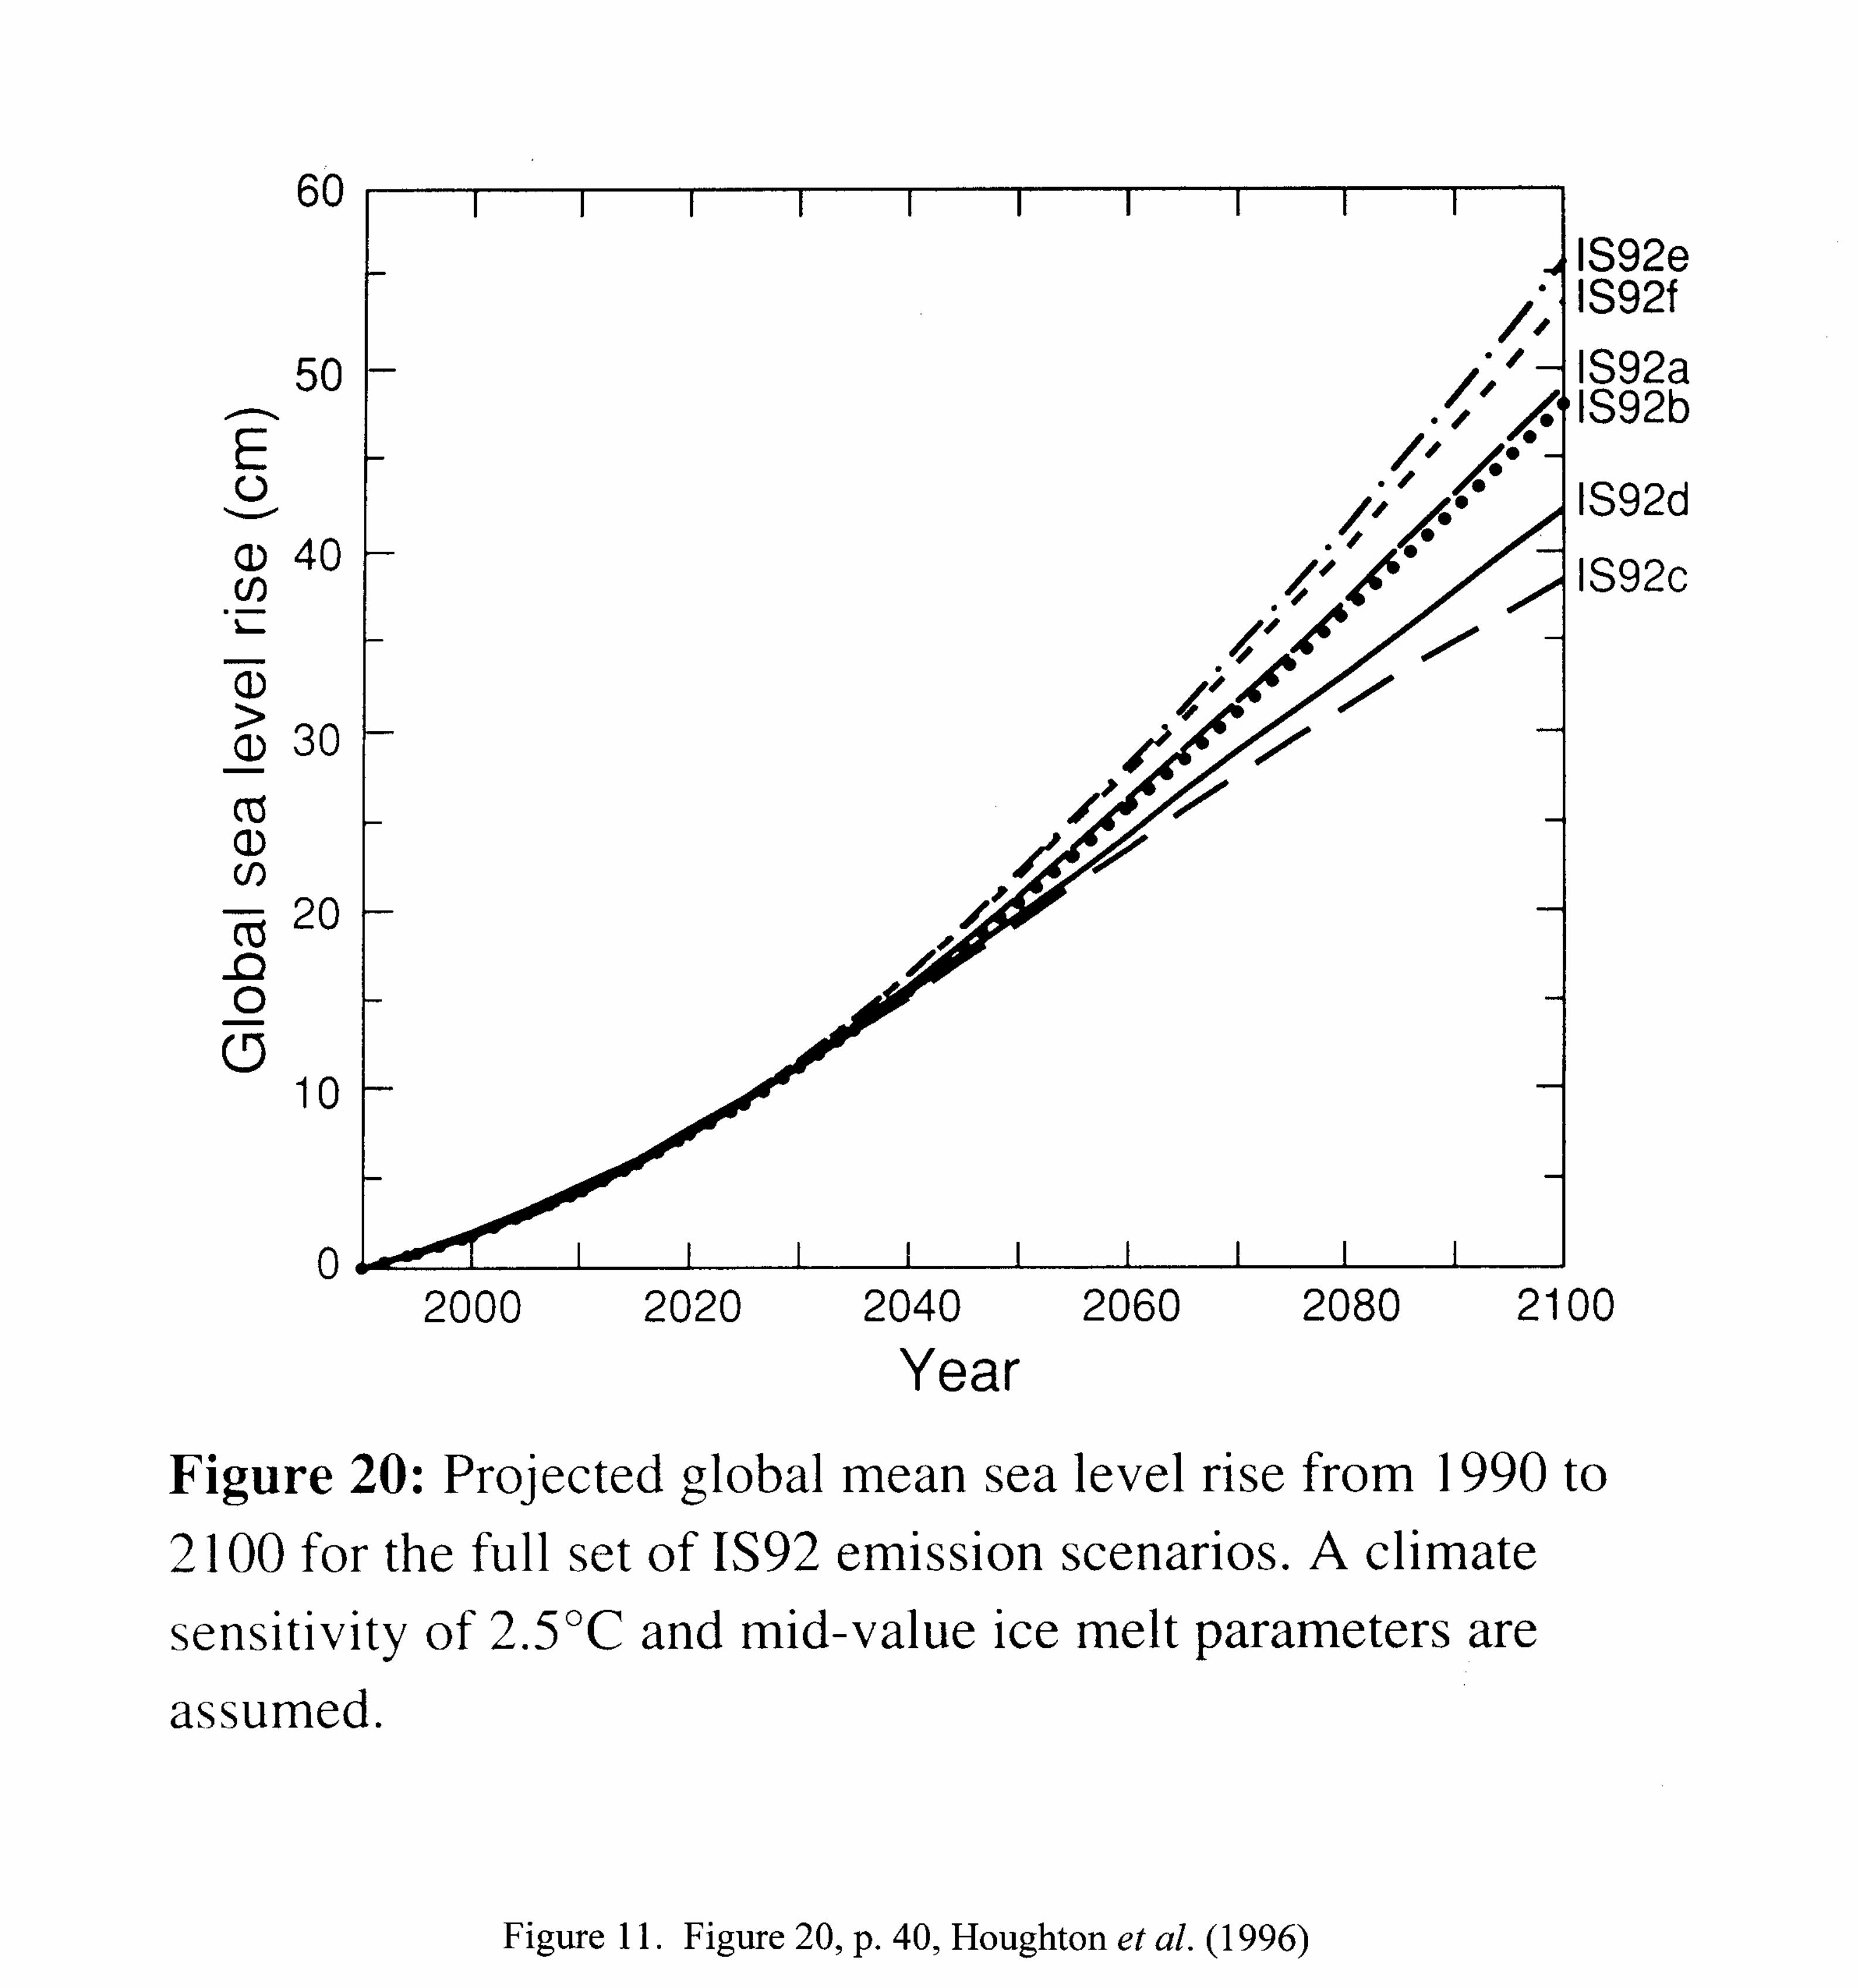
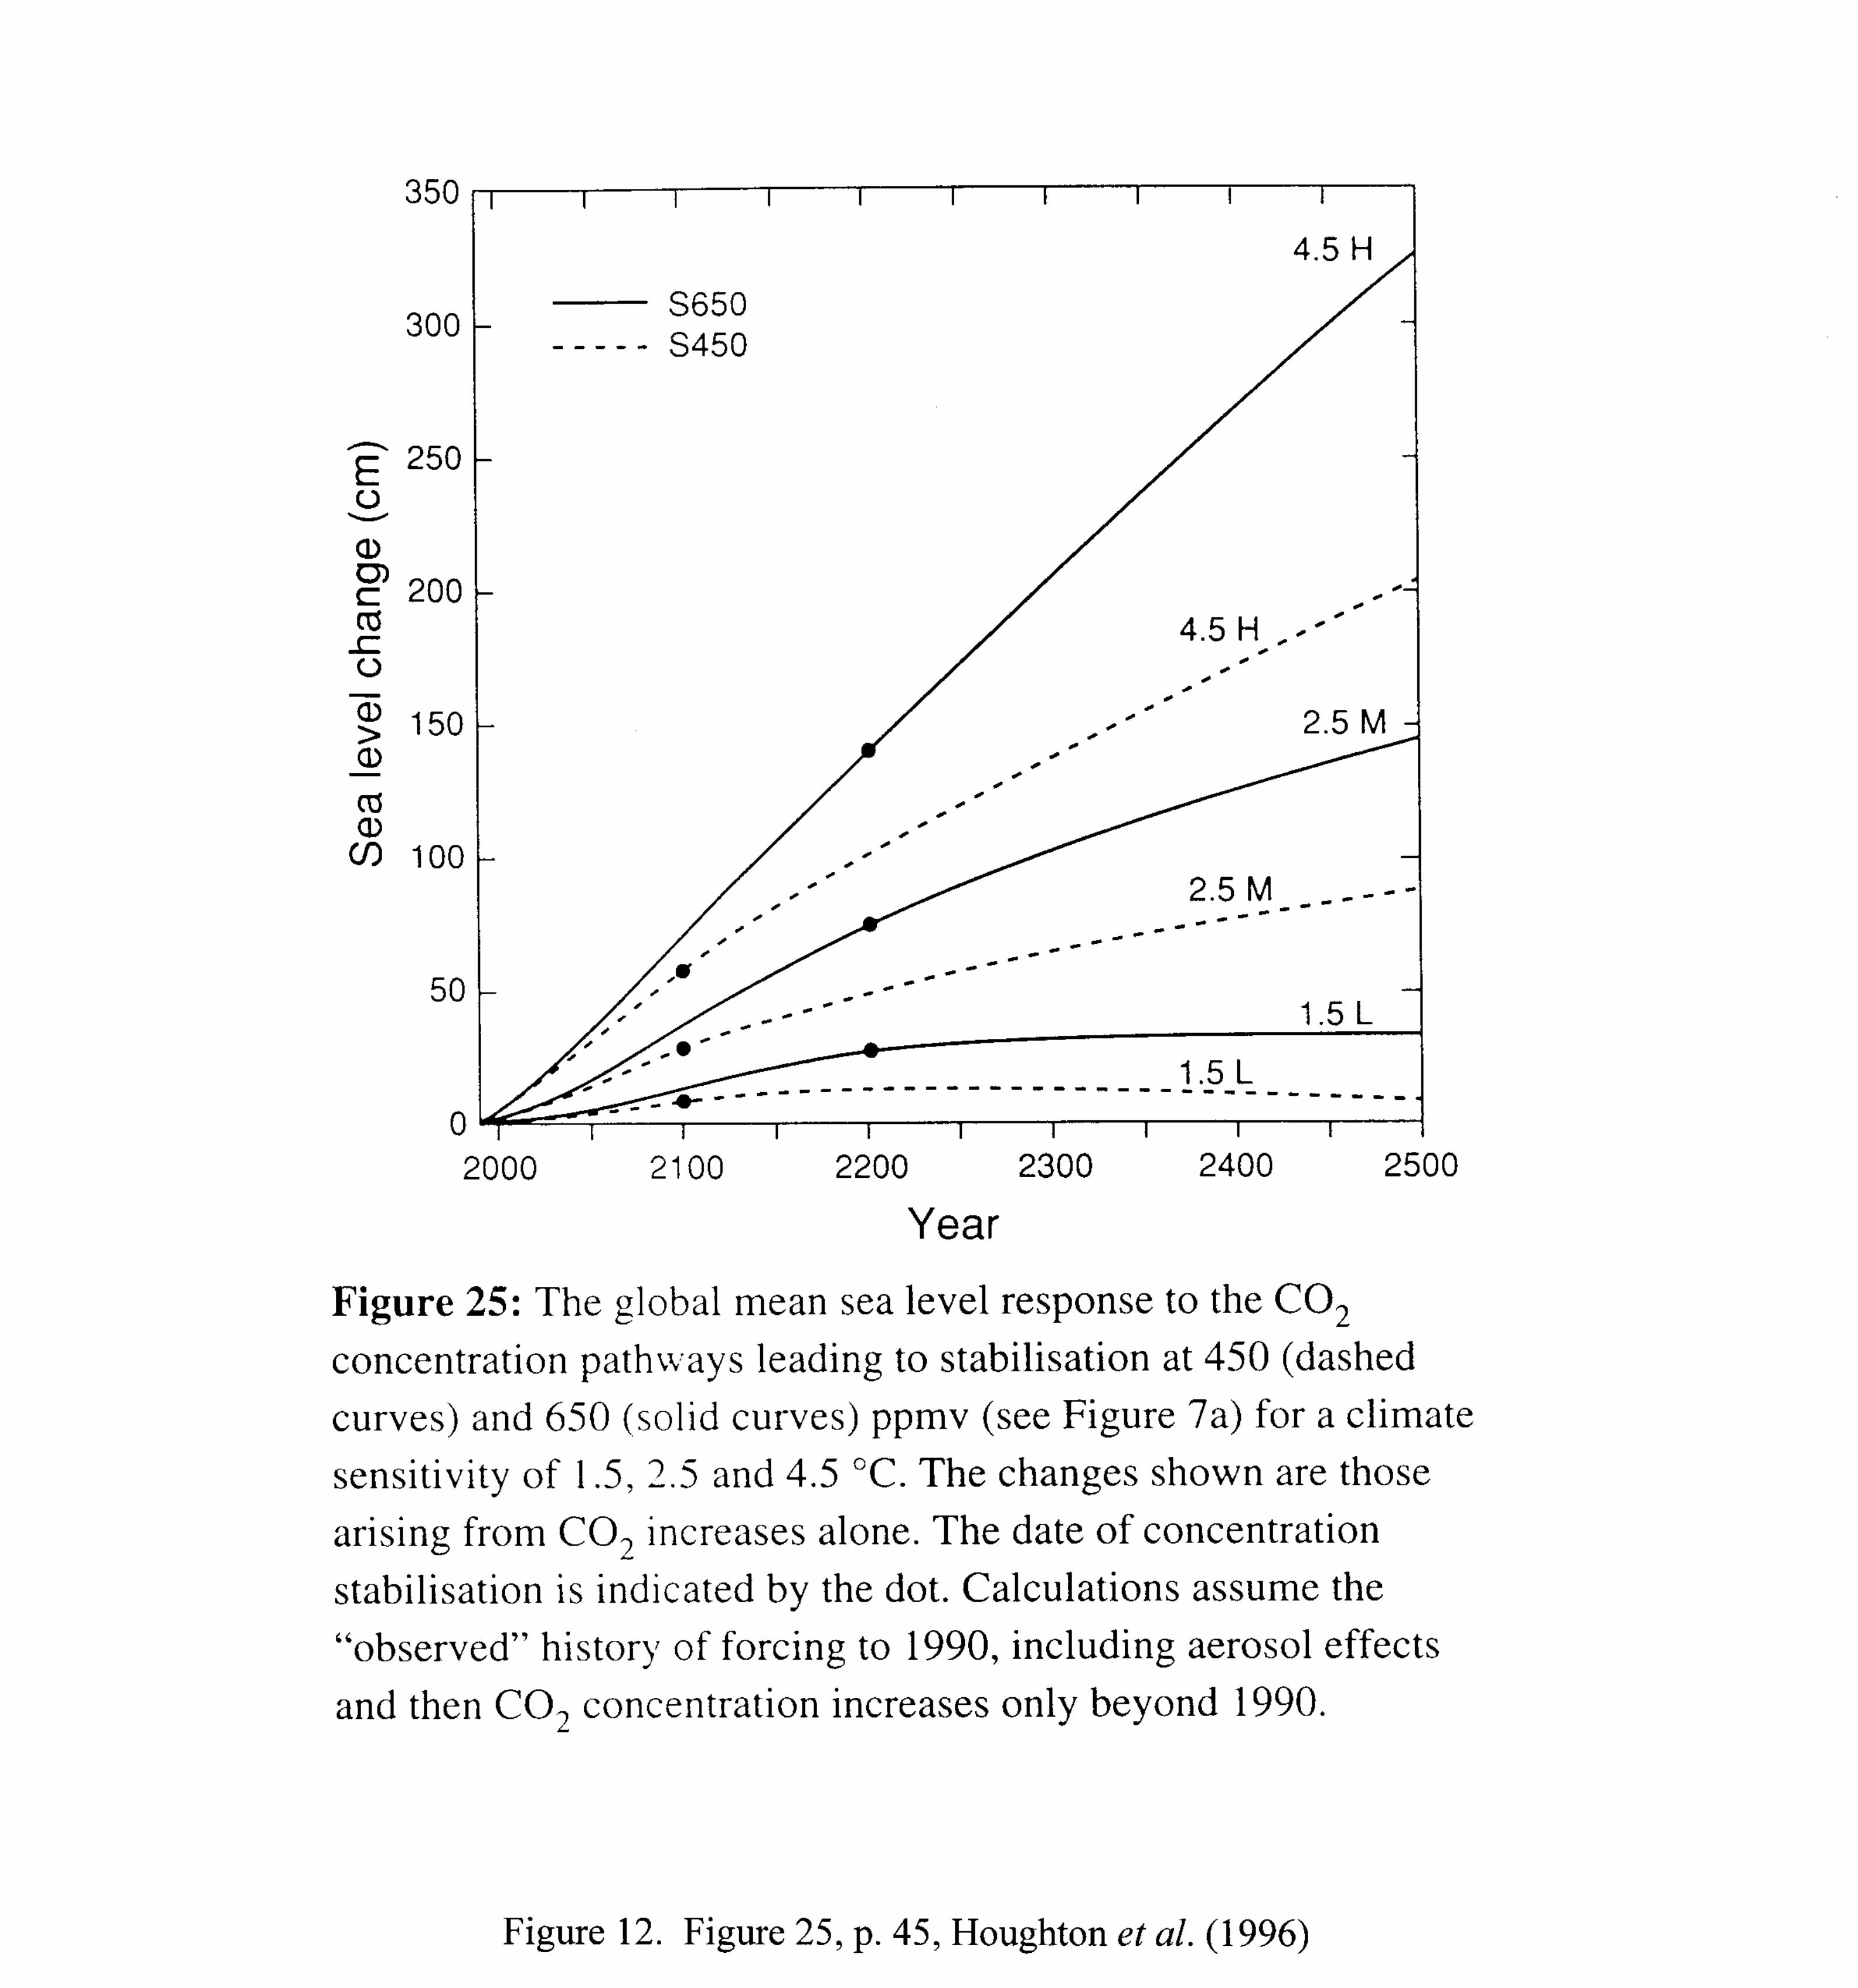
Several adverse effects can be attributed to the expected temperature increase inthe next century. For example, Figure 11 shows the projected global mean sealevel rise from 1990 to 2100, in the range from 38 cm to 56 cm. The rise isexpected to continue after 2100, as illustrated in Figure 12, depending upon thedifferent, achievable stabilization values for atmospheric CO2.
Other possible adverse effects include terrestrial and marine biotic responses.
9. To avoid or minimize adverse effects, government action and international treaties are
needed to curb CO2 emissions and, eventually, stabilize CO2 concentrations.
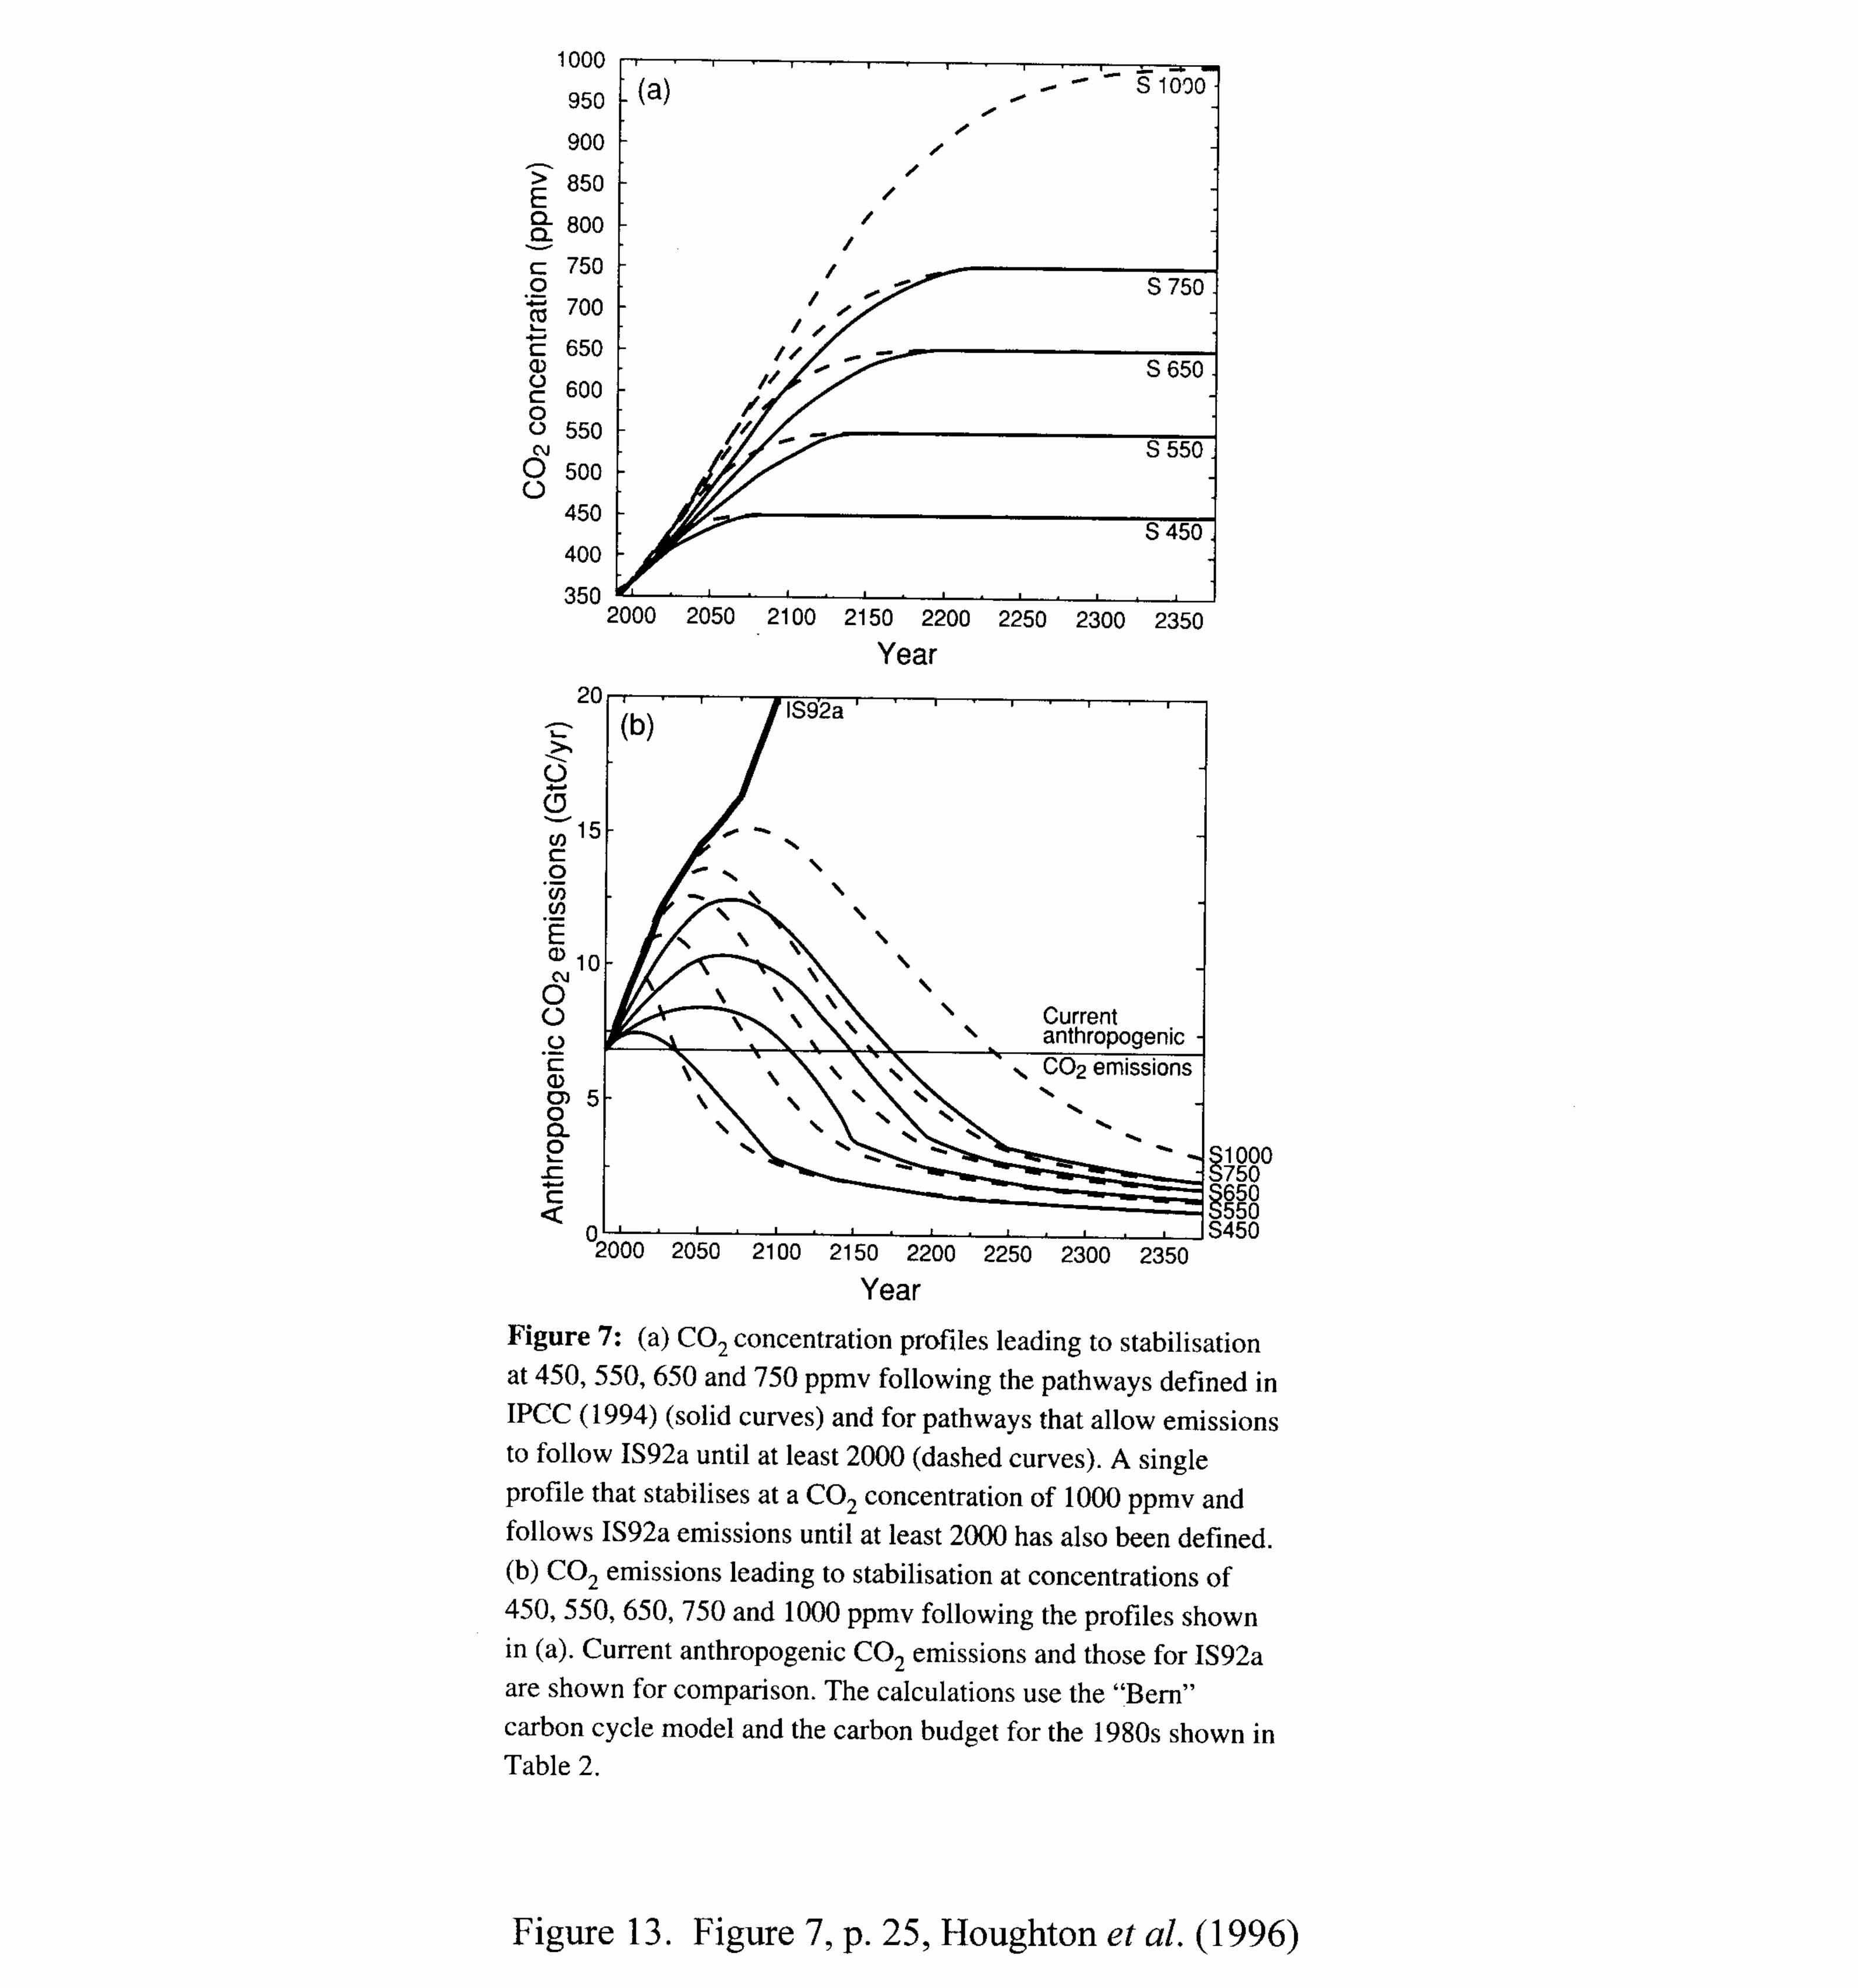
GHGs emissions have long-term ramifications because GHGs have long lifetimes(e.g., CO2 has a lifetime of over a century). Figure 13 illustrates the neededreduction in anthropogenic CO2 emissions required to stabilize atmospheric CO2at pre-defined levels. CO2 stabilization in the atmosphere can only be achievedby, first, decreasing the growth rate of CO2 emissions, and then stabilizing CO2emissions at levels well below the current ones.
The Second Group’s Arguments
The second group’s arguments are not found in comprehensive reports, with perhaps theexception of the proceedings of the conference “Countdown to Kyoto” mentioned before.Publications and statements from the second group are more “reactive” in nature, since they

120
120
focus on criticism (both constructive and destructive) of the first group’s statements andcalculations.
I will make an effort to illustrate some of the opinions of the second group (plus some generalobservations that may help put the first group’s arguments into a different perspective), inreference to the nine items used for the first group.
1. CO2 increase in the atmosphere is the most important factor affecting changes in globalradiative forcing.
Global radiative forcing is still poorly understood. The estimates presented inFigure 2 are very uncertain and could change radically with new knowledgeacquired in the next few years. In particular, the global mean radiative forcingdue to GHGs could be much lower that the values presented in Figure 2.
Parameters such as solar variation [Hoyt and Schatten 1997] and albedo changesmay be very important and, perhaps, more important than all the other factorscombined. Land use plays a significant role on local, regional, and global climate[Pielke 1997; Copeland et al. 1996].
Minor relative variations in atmospheric water vapor are more important thanmajor relative changes in CO2 concentrations. In fact, the role of water vapor as agreenhouse gas is much more important than all the anthropogenic GHGs. It hasbeen estimated that an increase in low cloud cover of only about 4% would havethe same magnitude temperature forcing as doubling CO2; and that a decrease incloud droplet size from 10 to about 8.5 µm would also match the radiative forcingfrom doubling CO2 [Slingo 1990; Trenberth 1996].
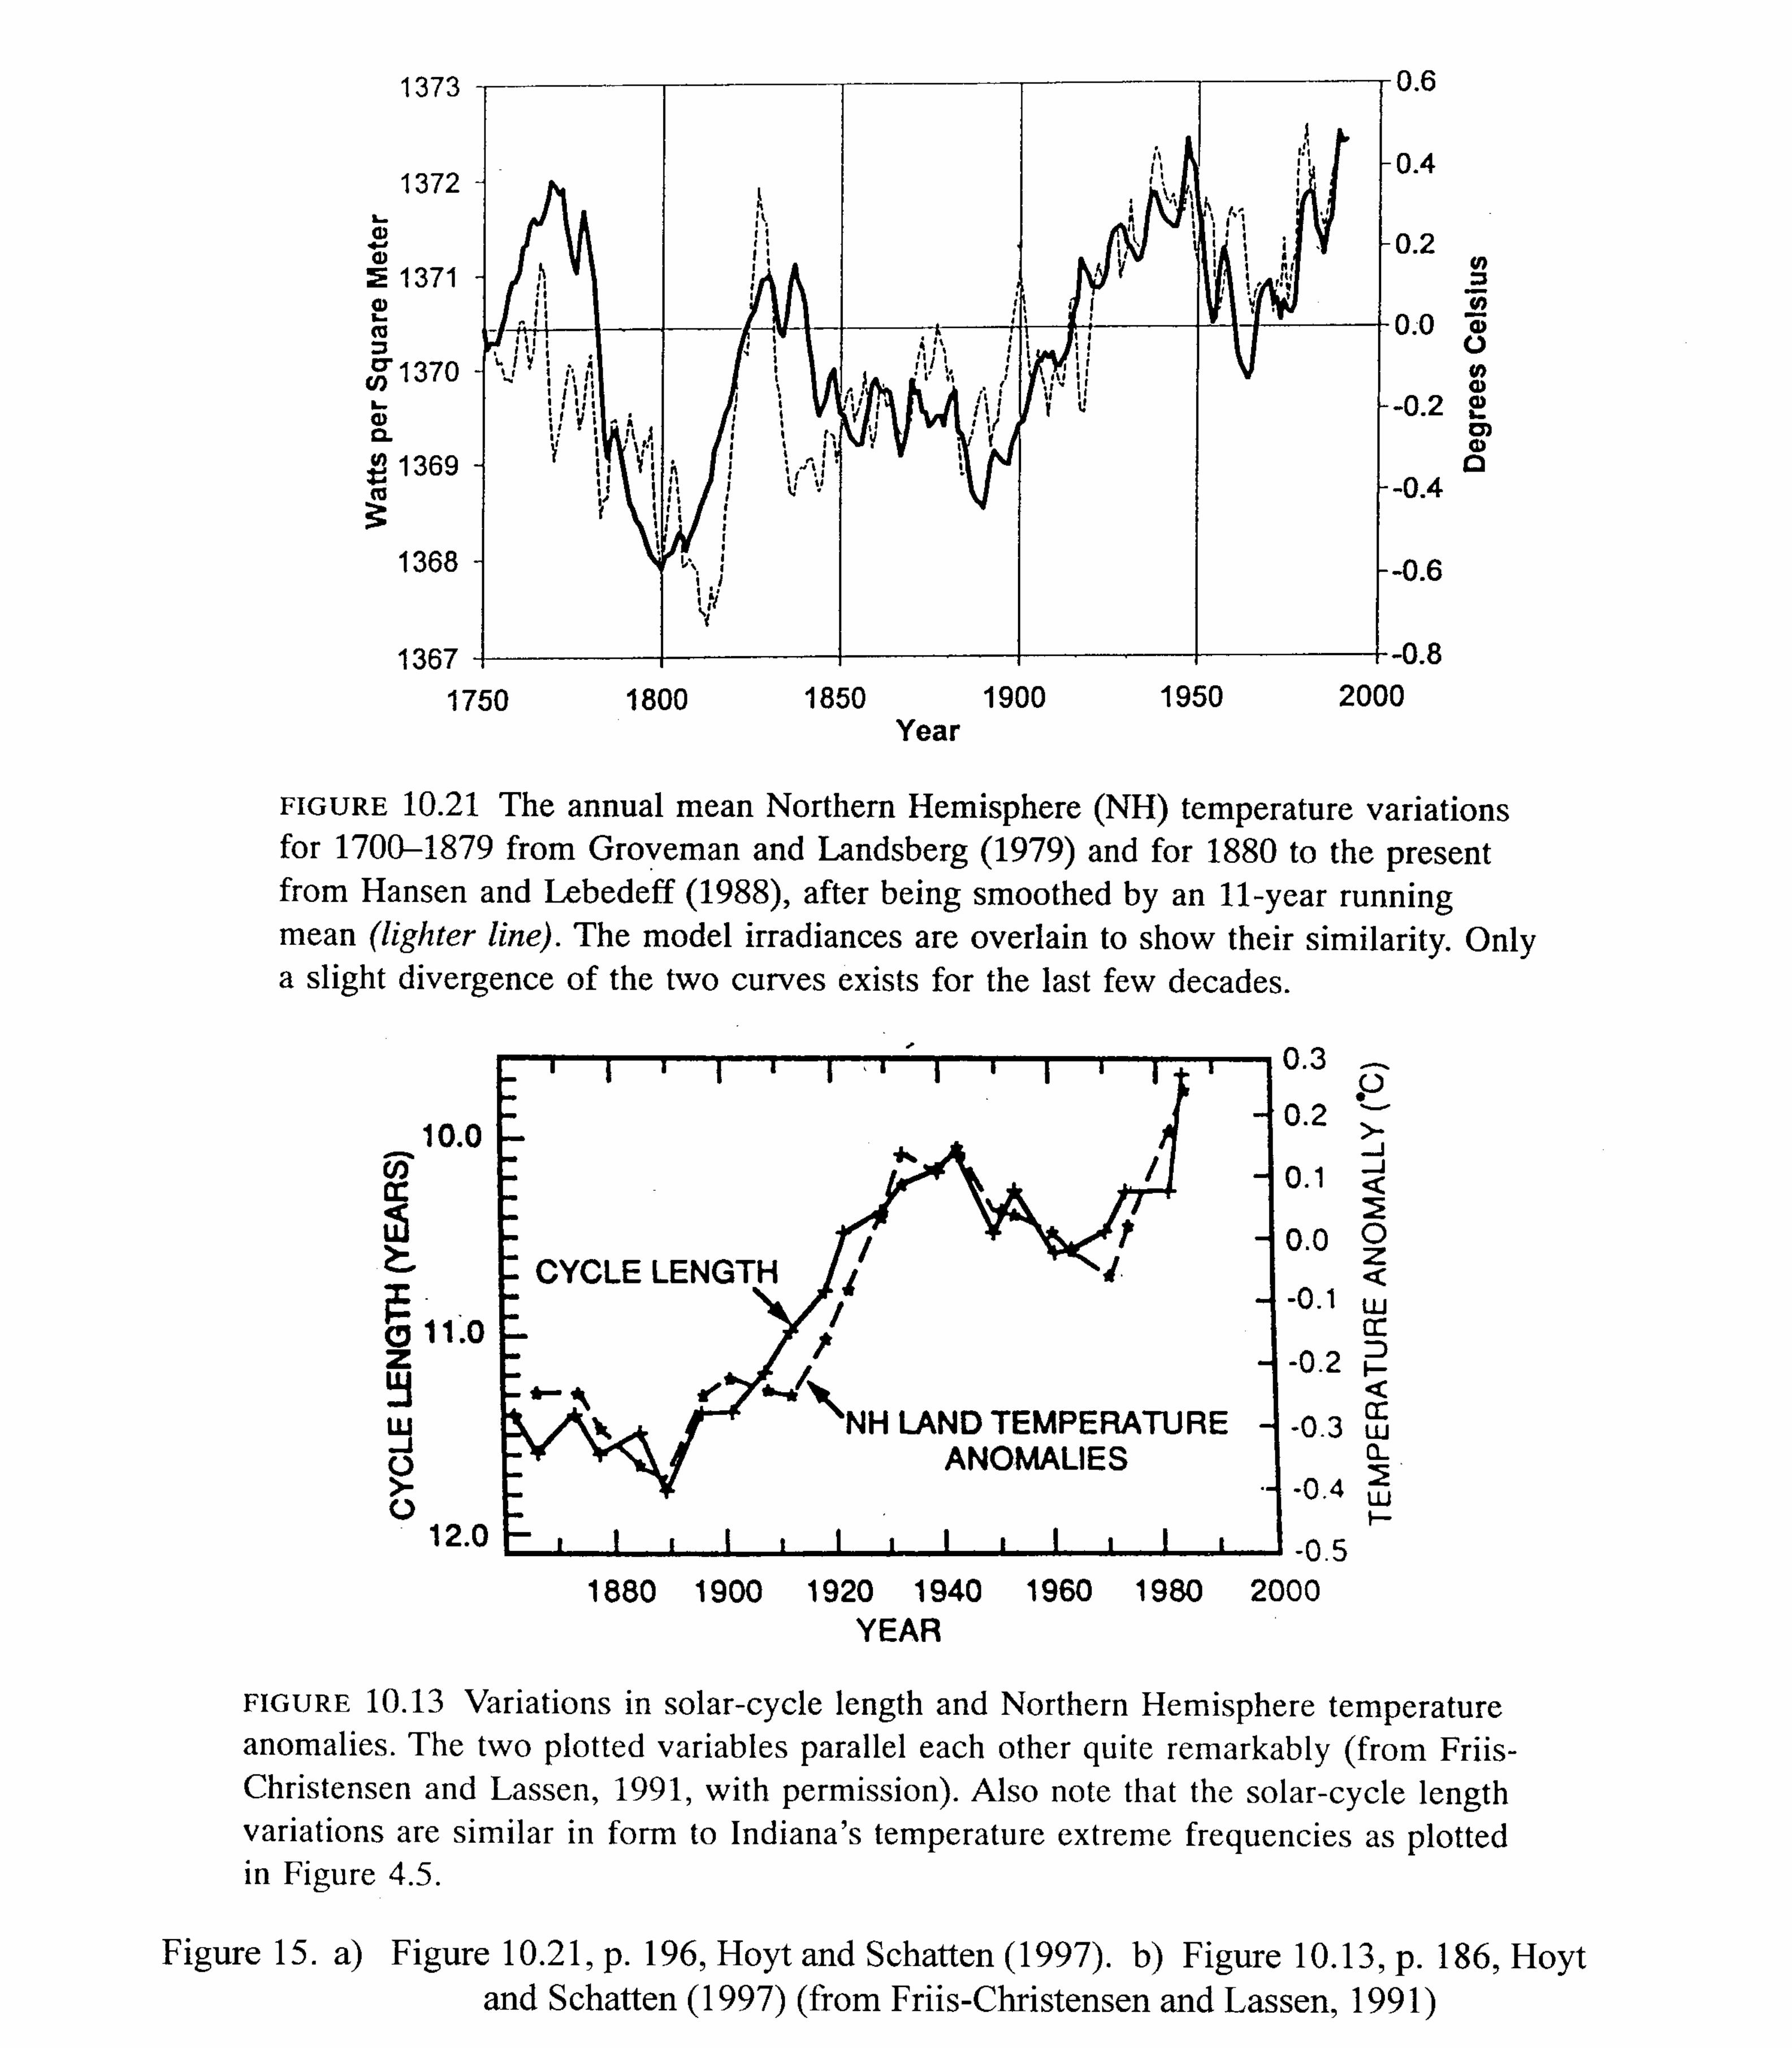
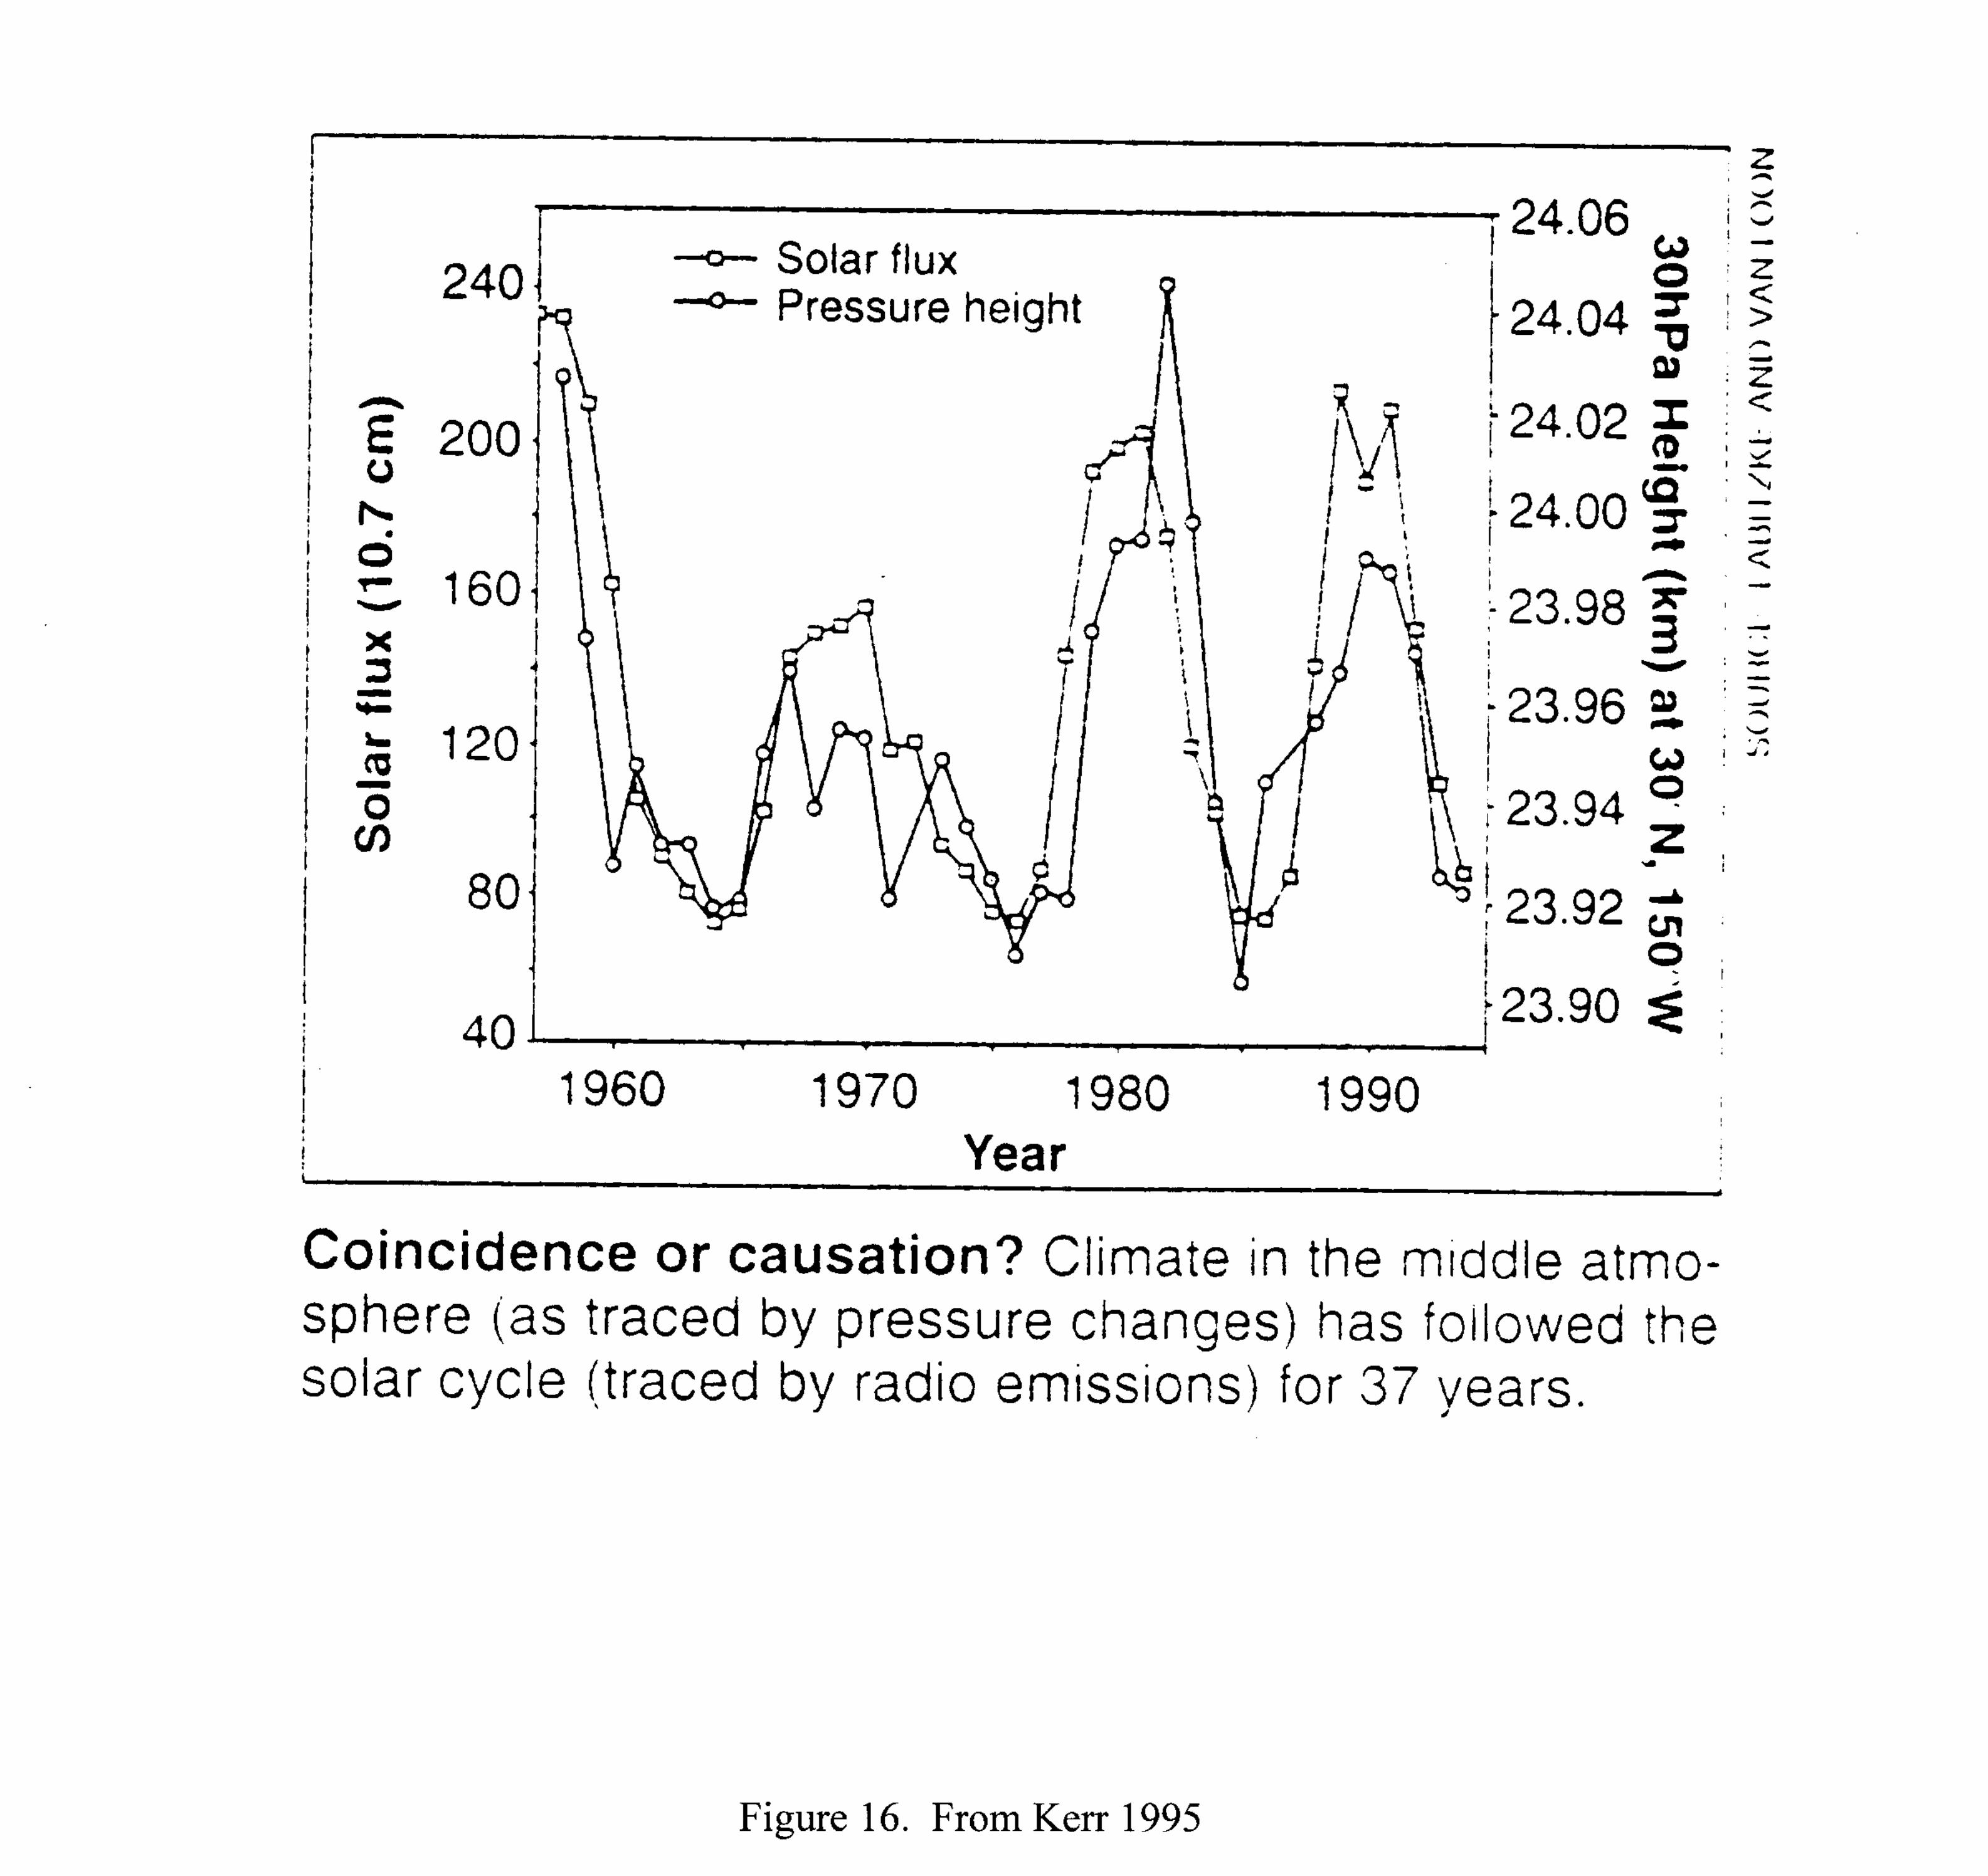
Recent studies [Lee 1992; Kerr 1995; Hoyt and Schatten 1997] (see Figures 14through 16) make a good case that the sun’s radiant output varies over decadesand longer time scales and that these variations are playing a significant role inclimate change. Also, since the 1920s, climate variations are consistent with acyclic solar forcing of 10-11 years [Hoyt and Schatten 1997].
Even the moon can affect the climate. In fact, most precipitation and proxyprecipitation records have much stronger cyclic variation (18-22 years) than thesolar cycles, implying lunar tidal influences [Hoyt and Schatten 1997].
2. Anthropogenic CO2 emissions are increasing worldwide.
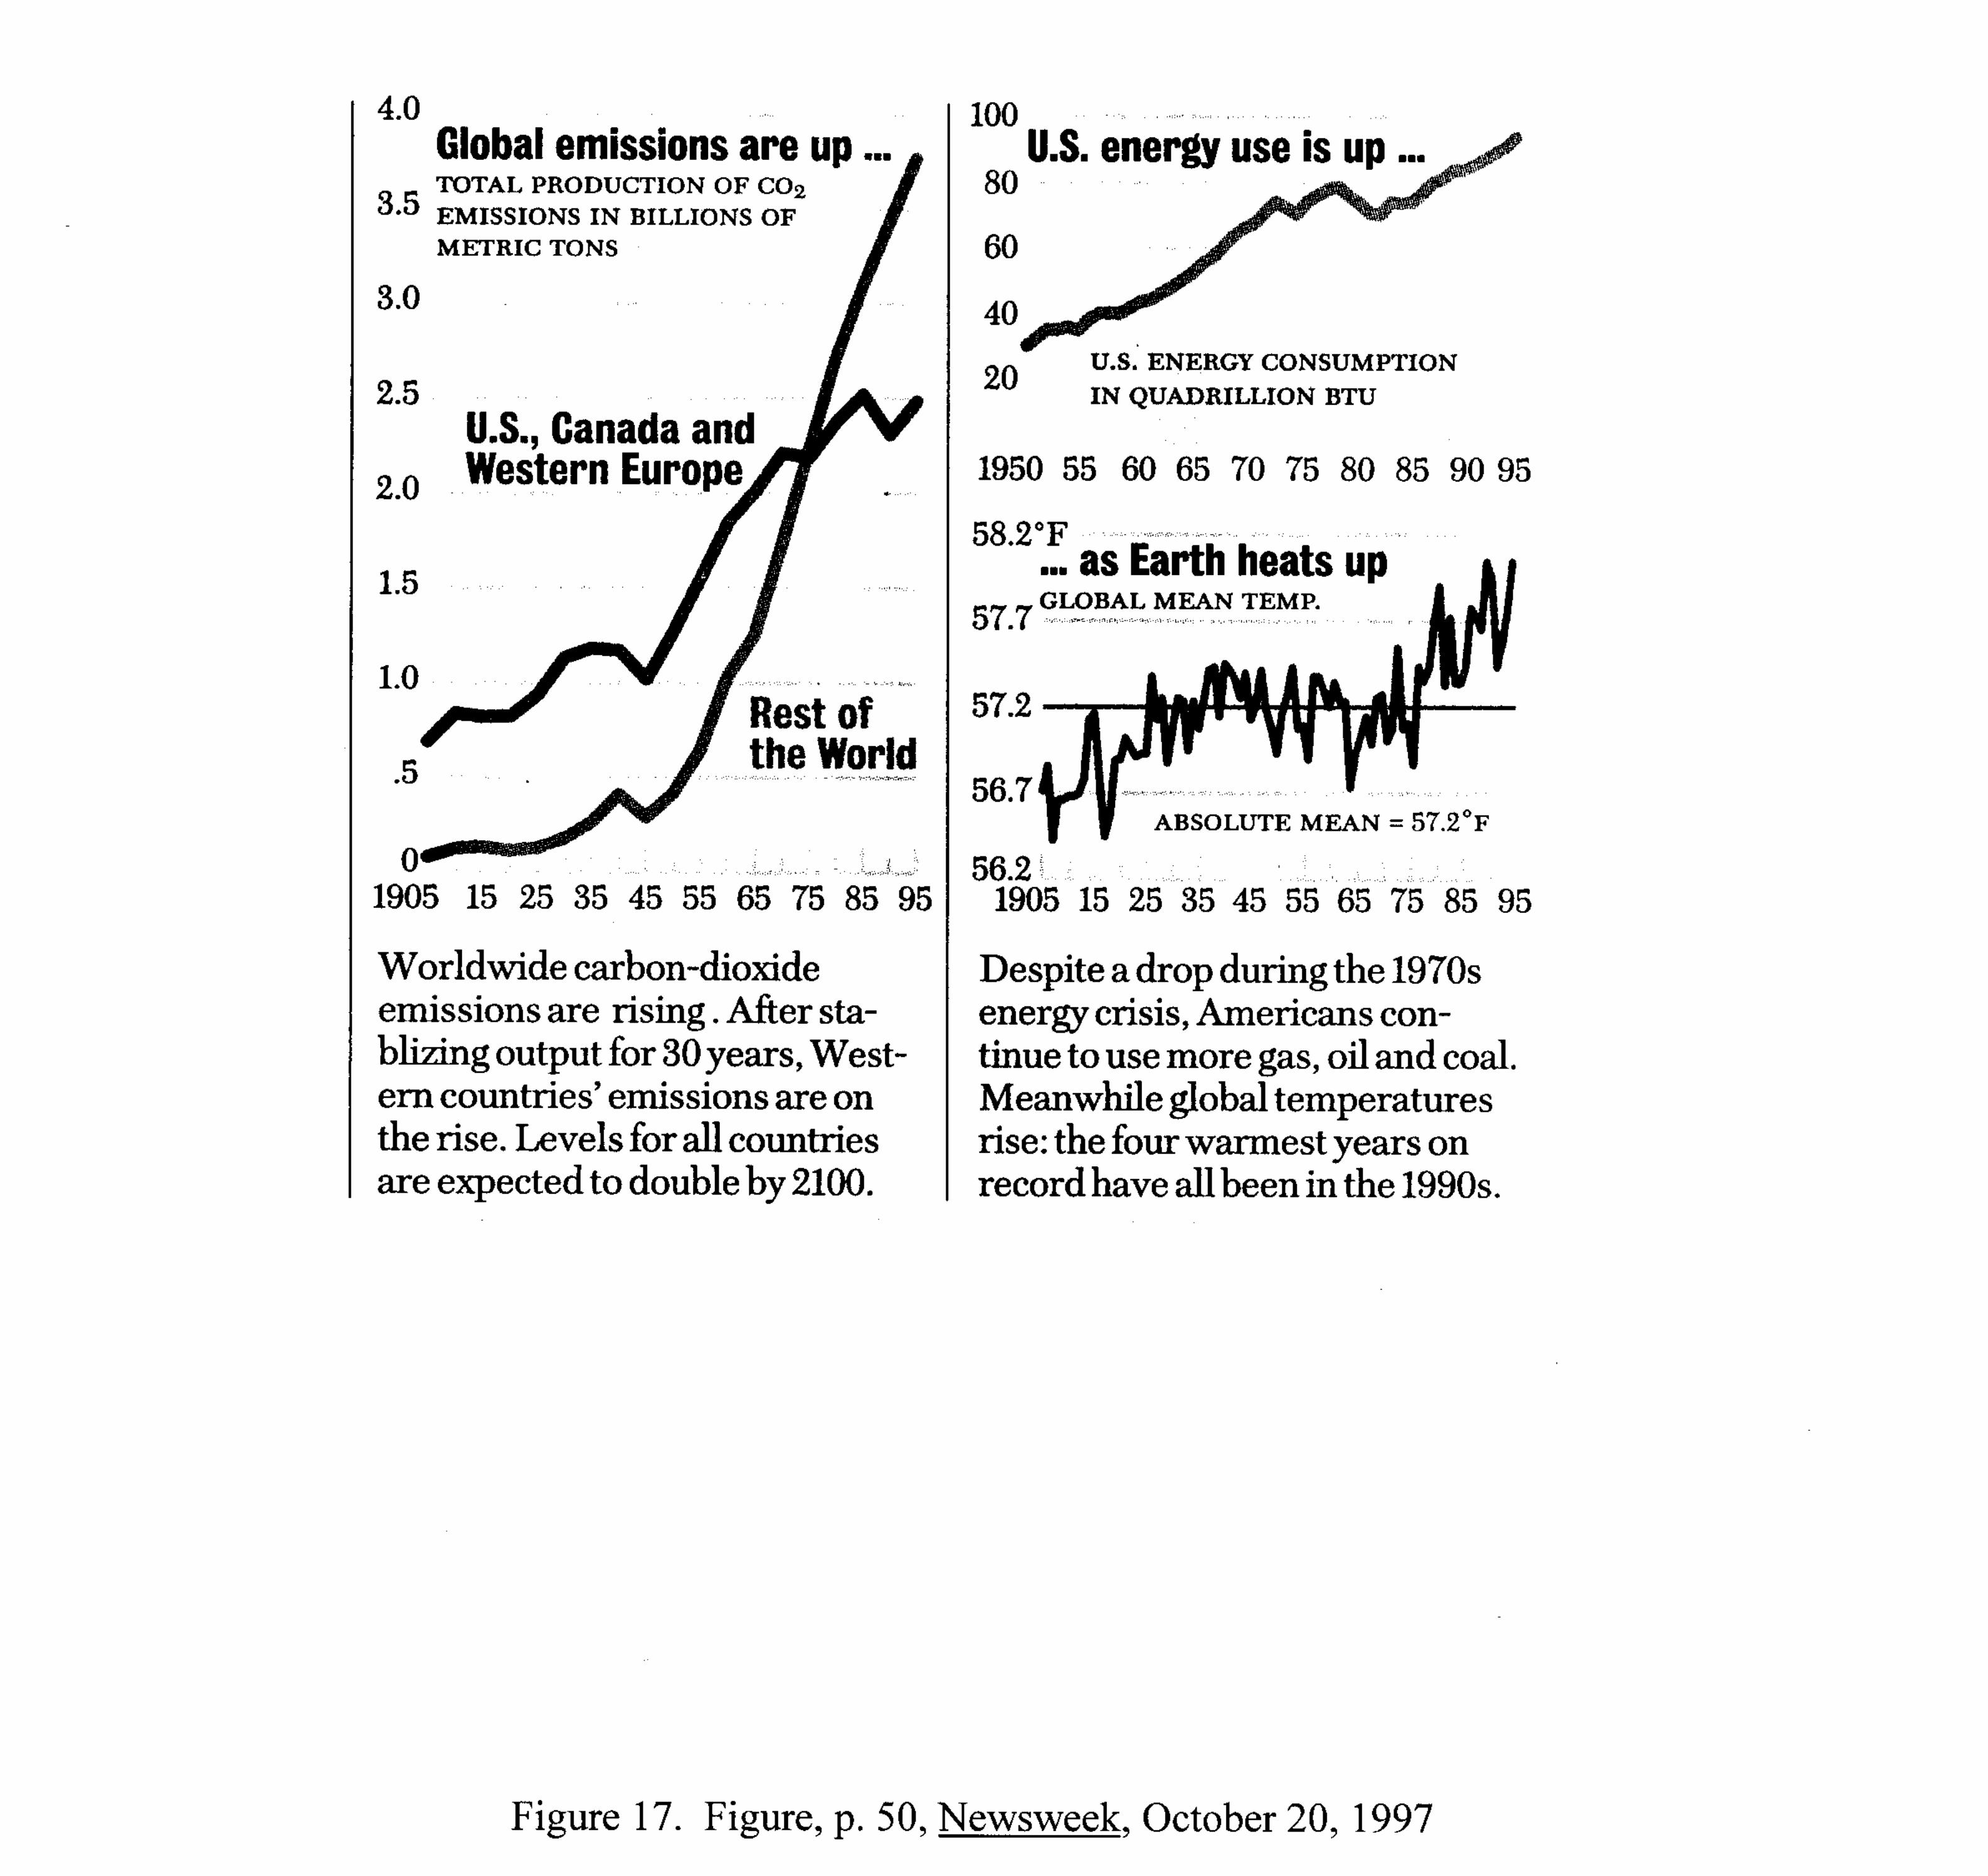
CO2 emissions are increasing, but at very different rates in different countries. Asillustrated in Figure 17 [Begley 1997], the US, Canada, and Western Europe seemto have reached a plateau at an emission of about 2.5 billion metric tons of CO2per year and show a low relative growth. The rest of the world instead is growing

121
121
fast with current emissions of about 4 billion metric tons of CO2 per year and agrowth rate of roughly 1 billion metric tons of CO2 per decade.
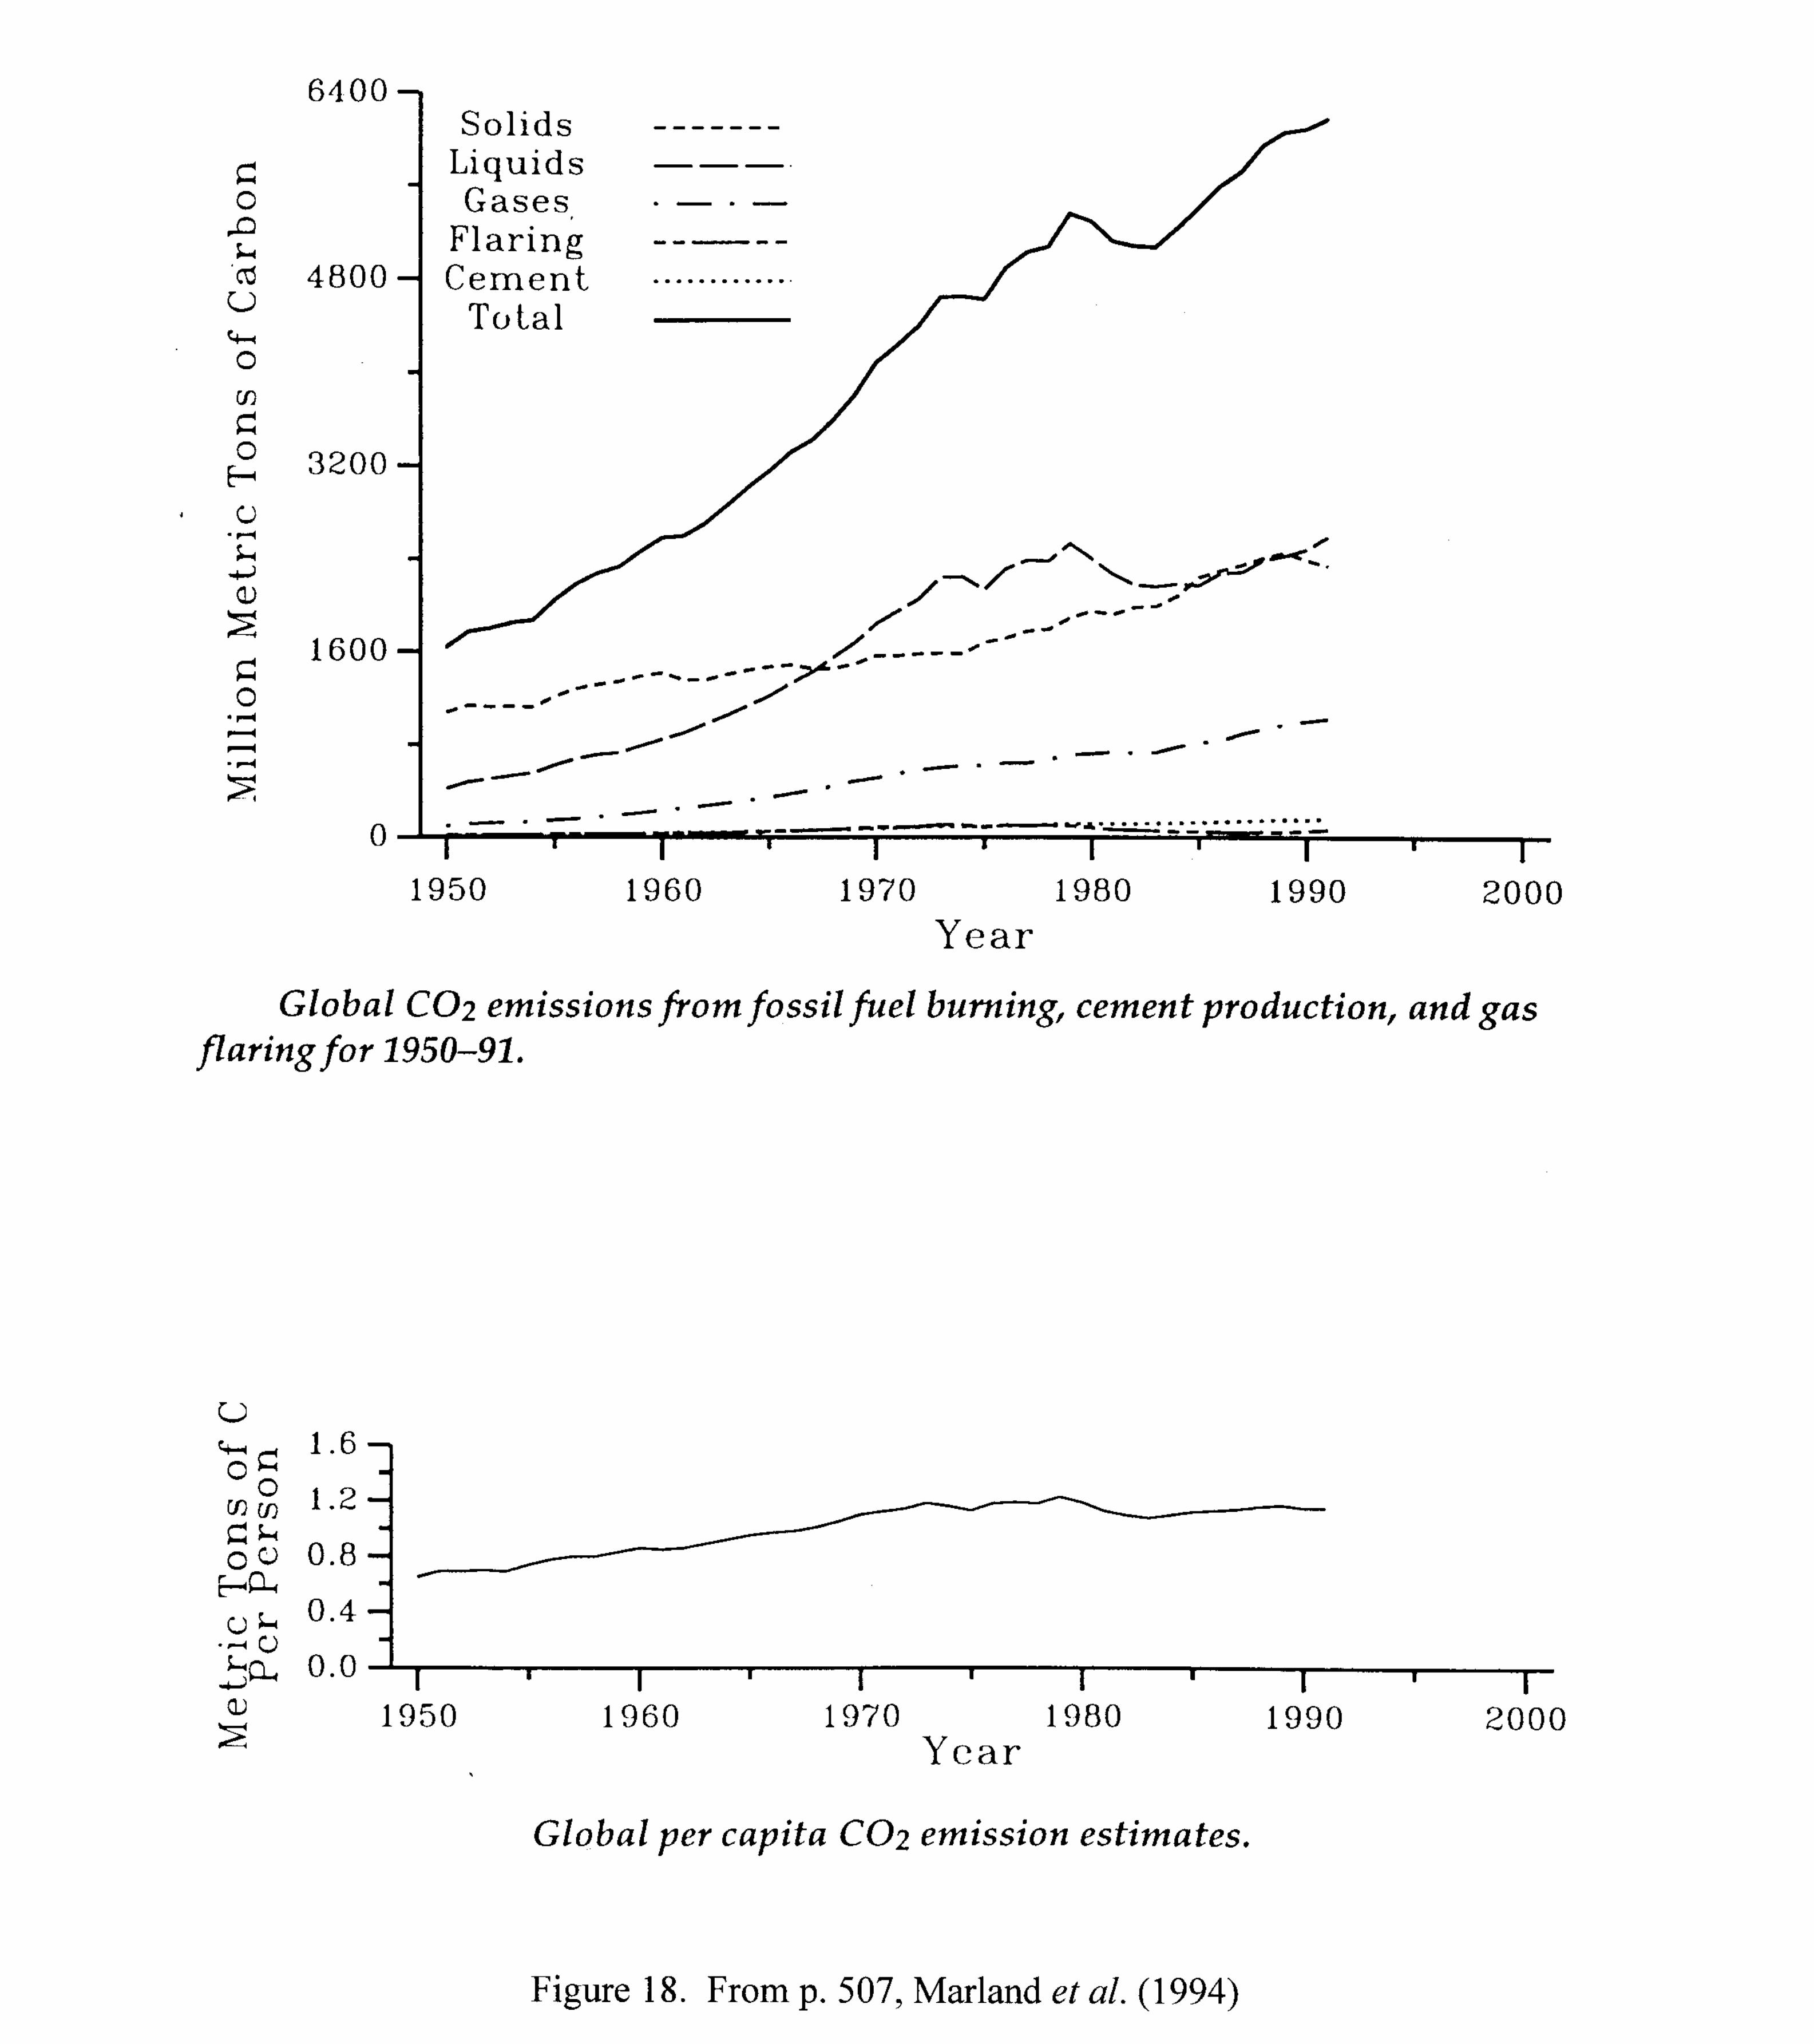
In spite of all changes and developments in the last half century, global CO2emission per capita have remain relatively constant at 1 metric ton of C per personper year ± about 30%, as illustrated in Figure 18. This seems to indicate thatpopulation control, more than anything else, should be seen as the main strategyfor controlling global CO2 concentrations.
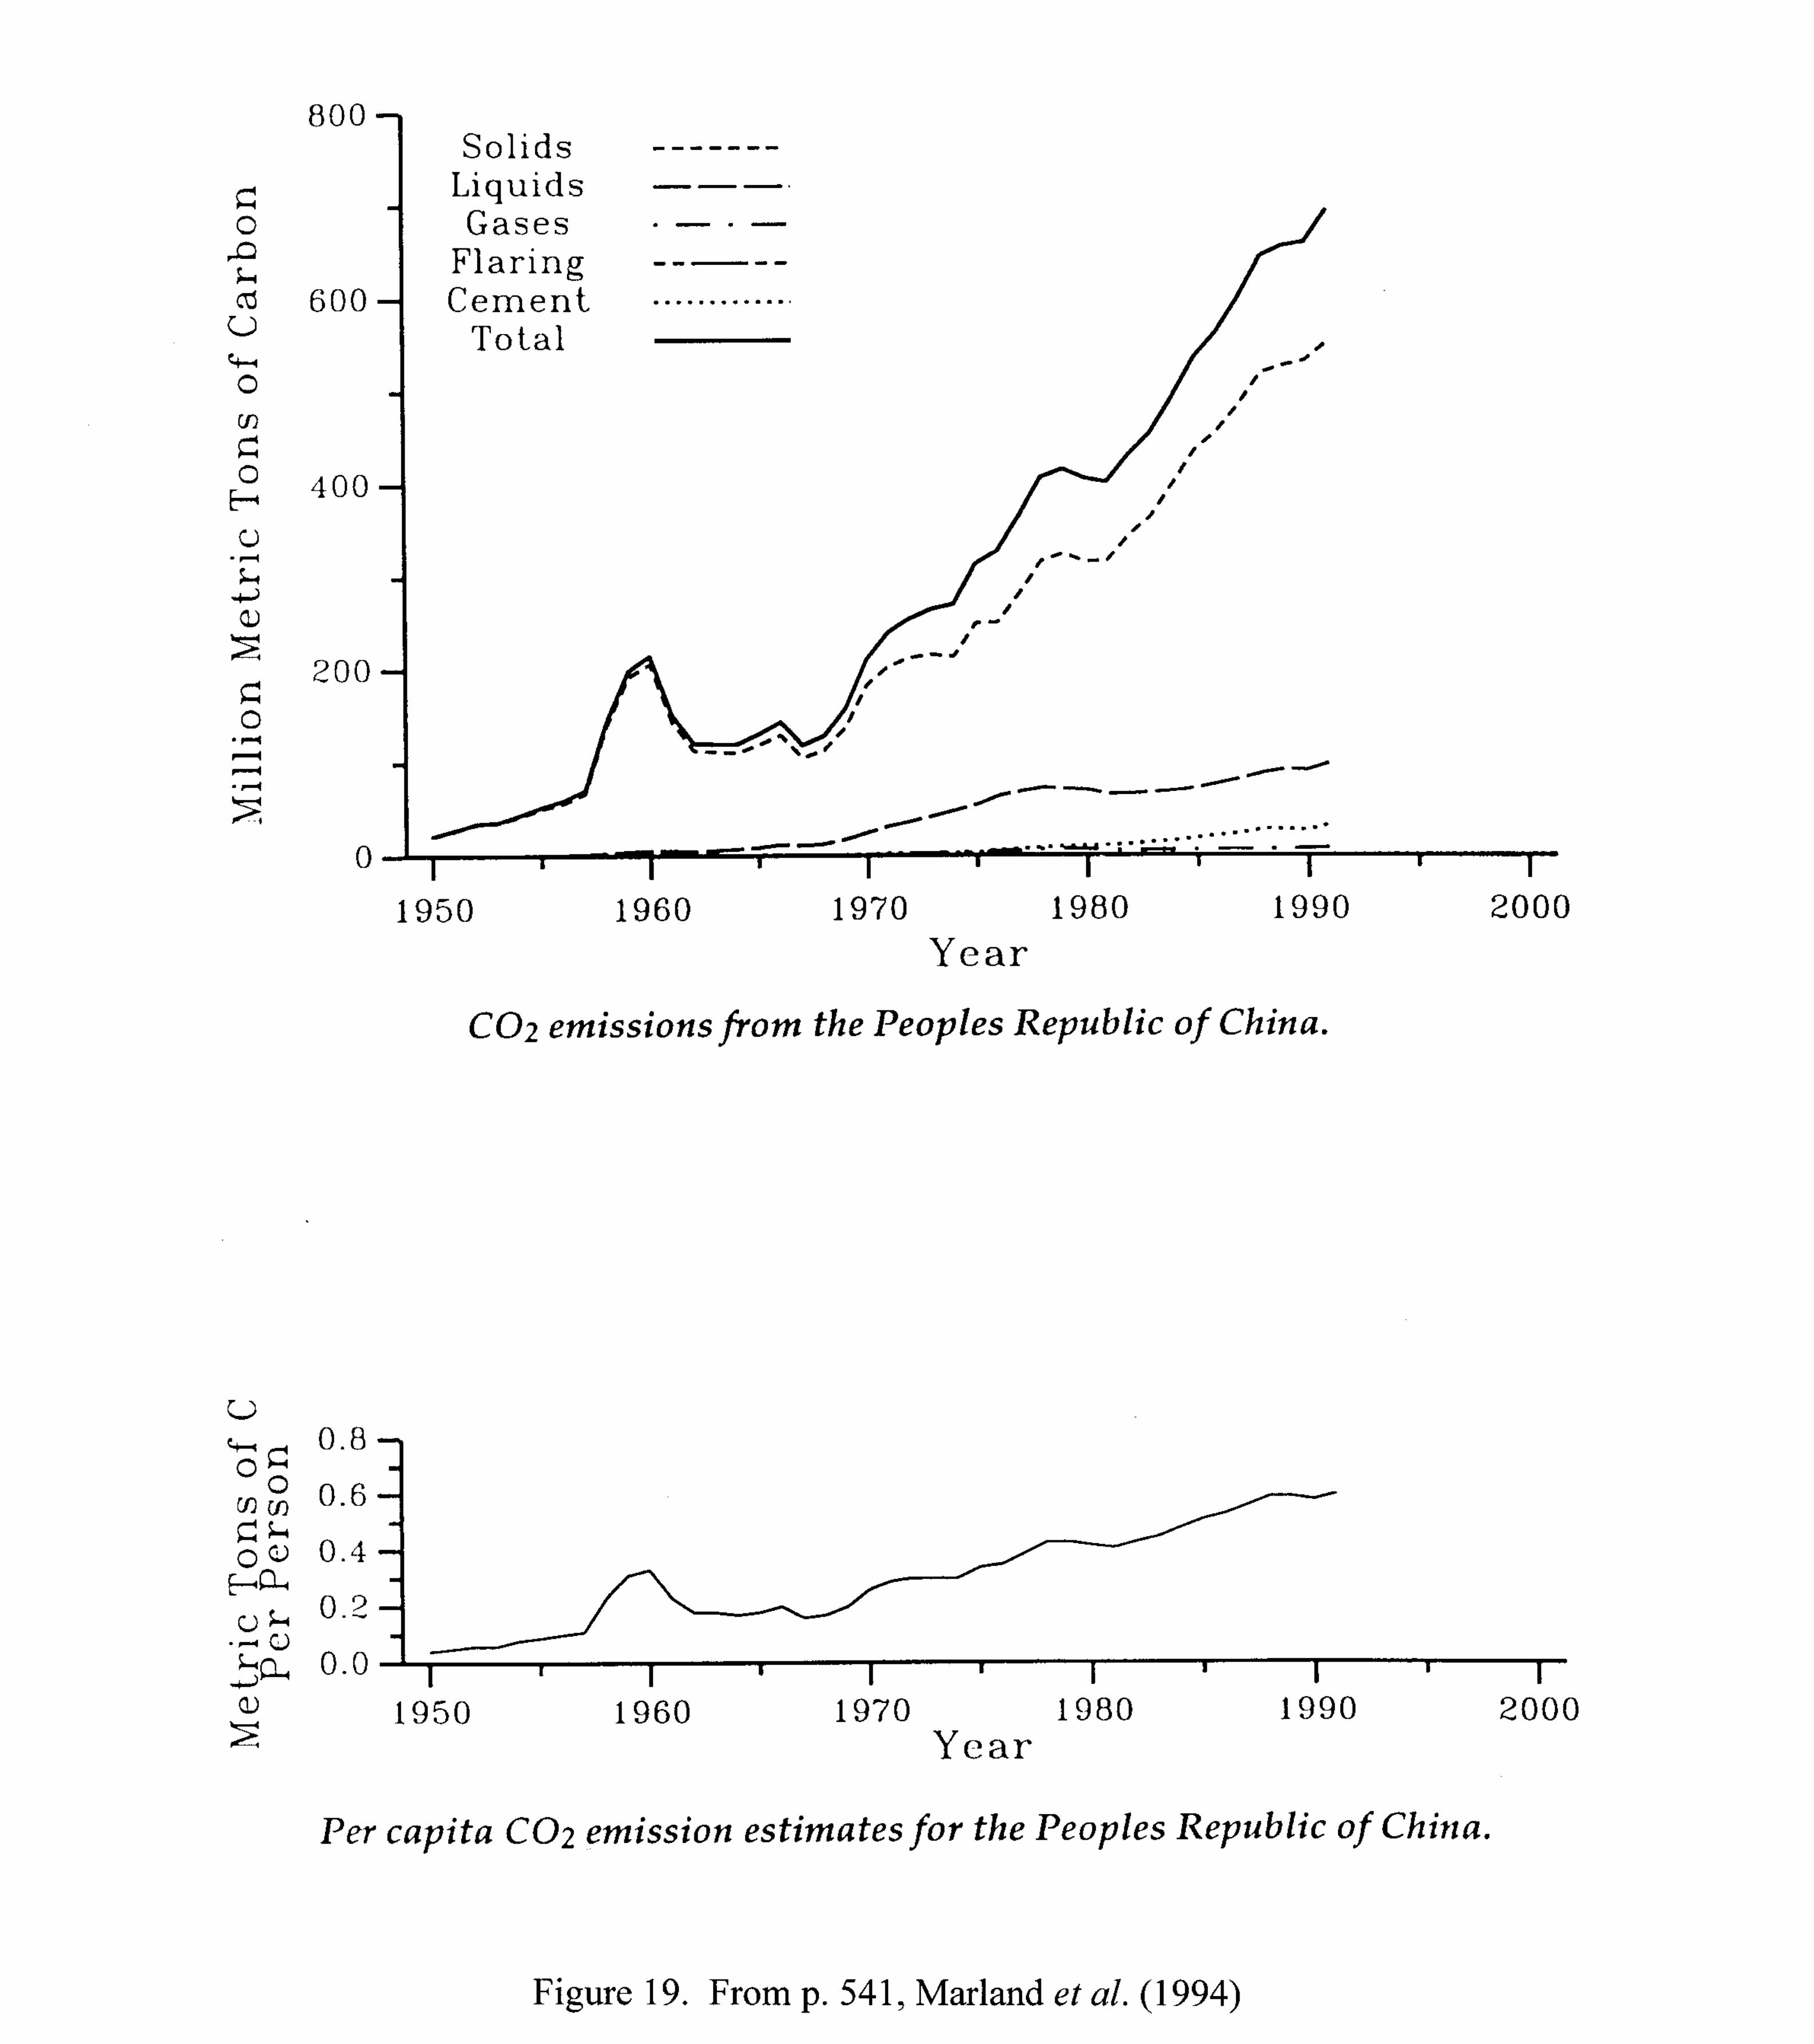
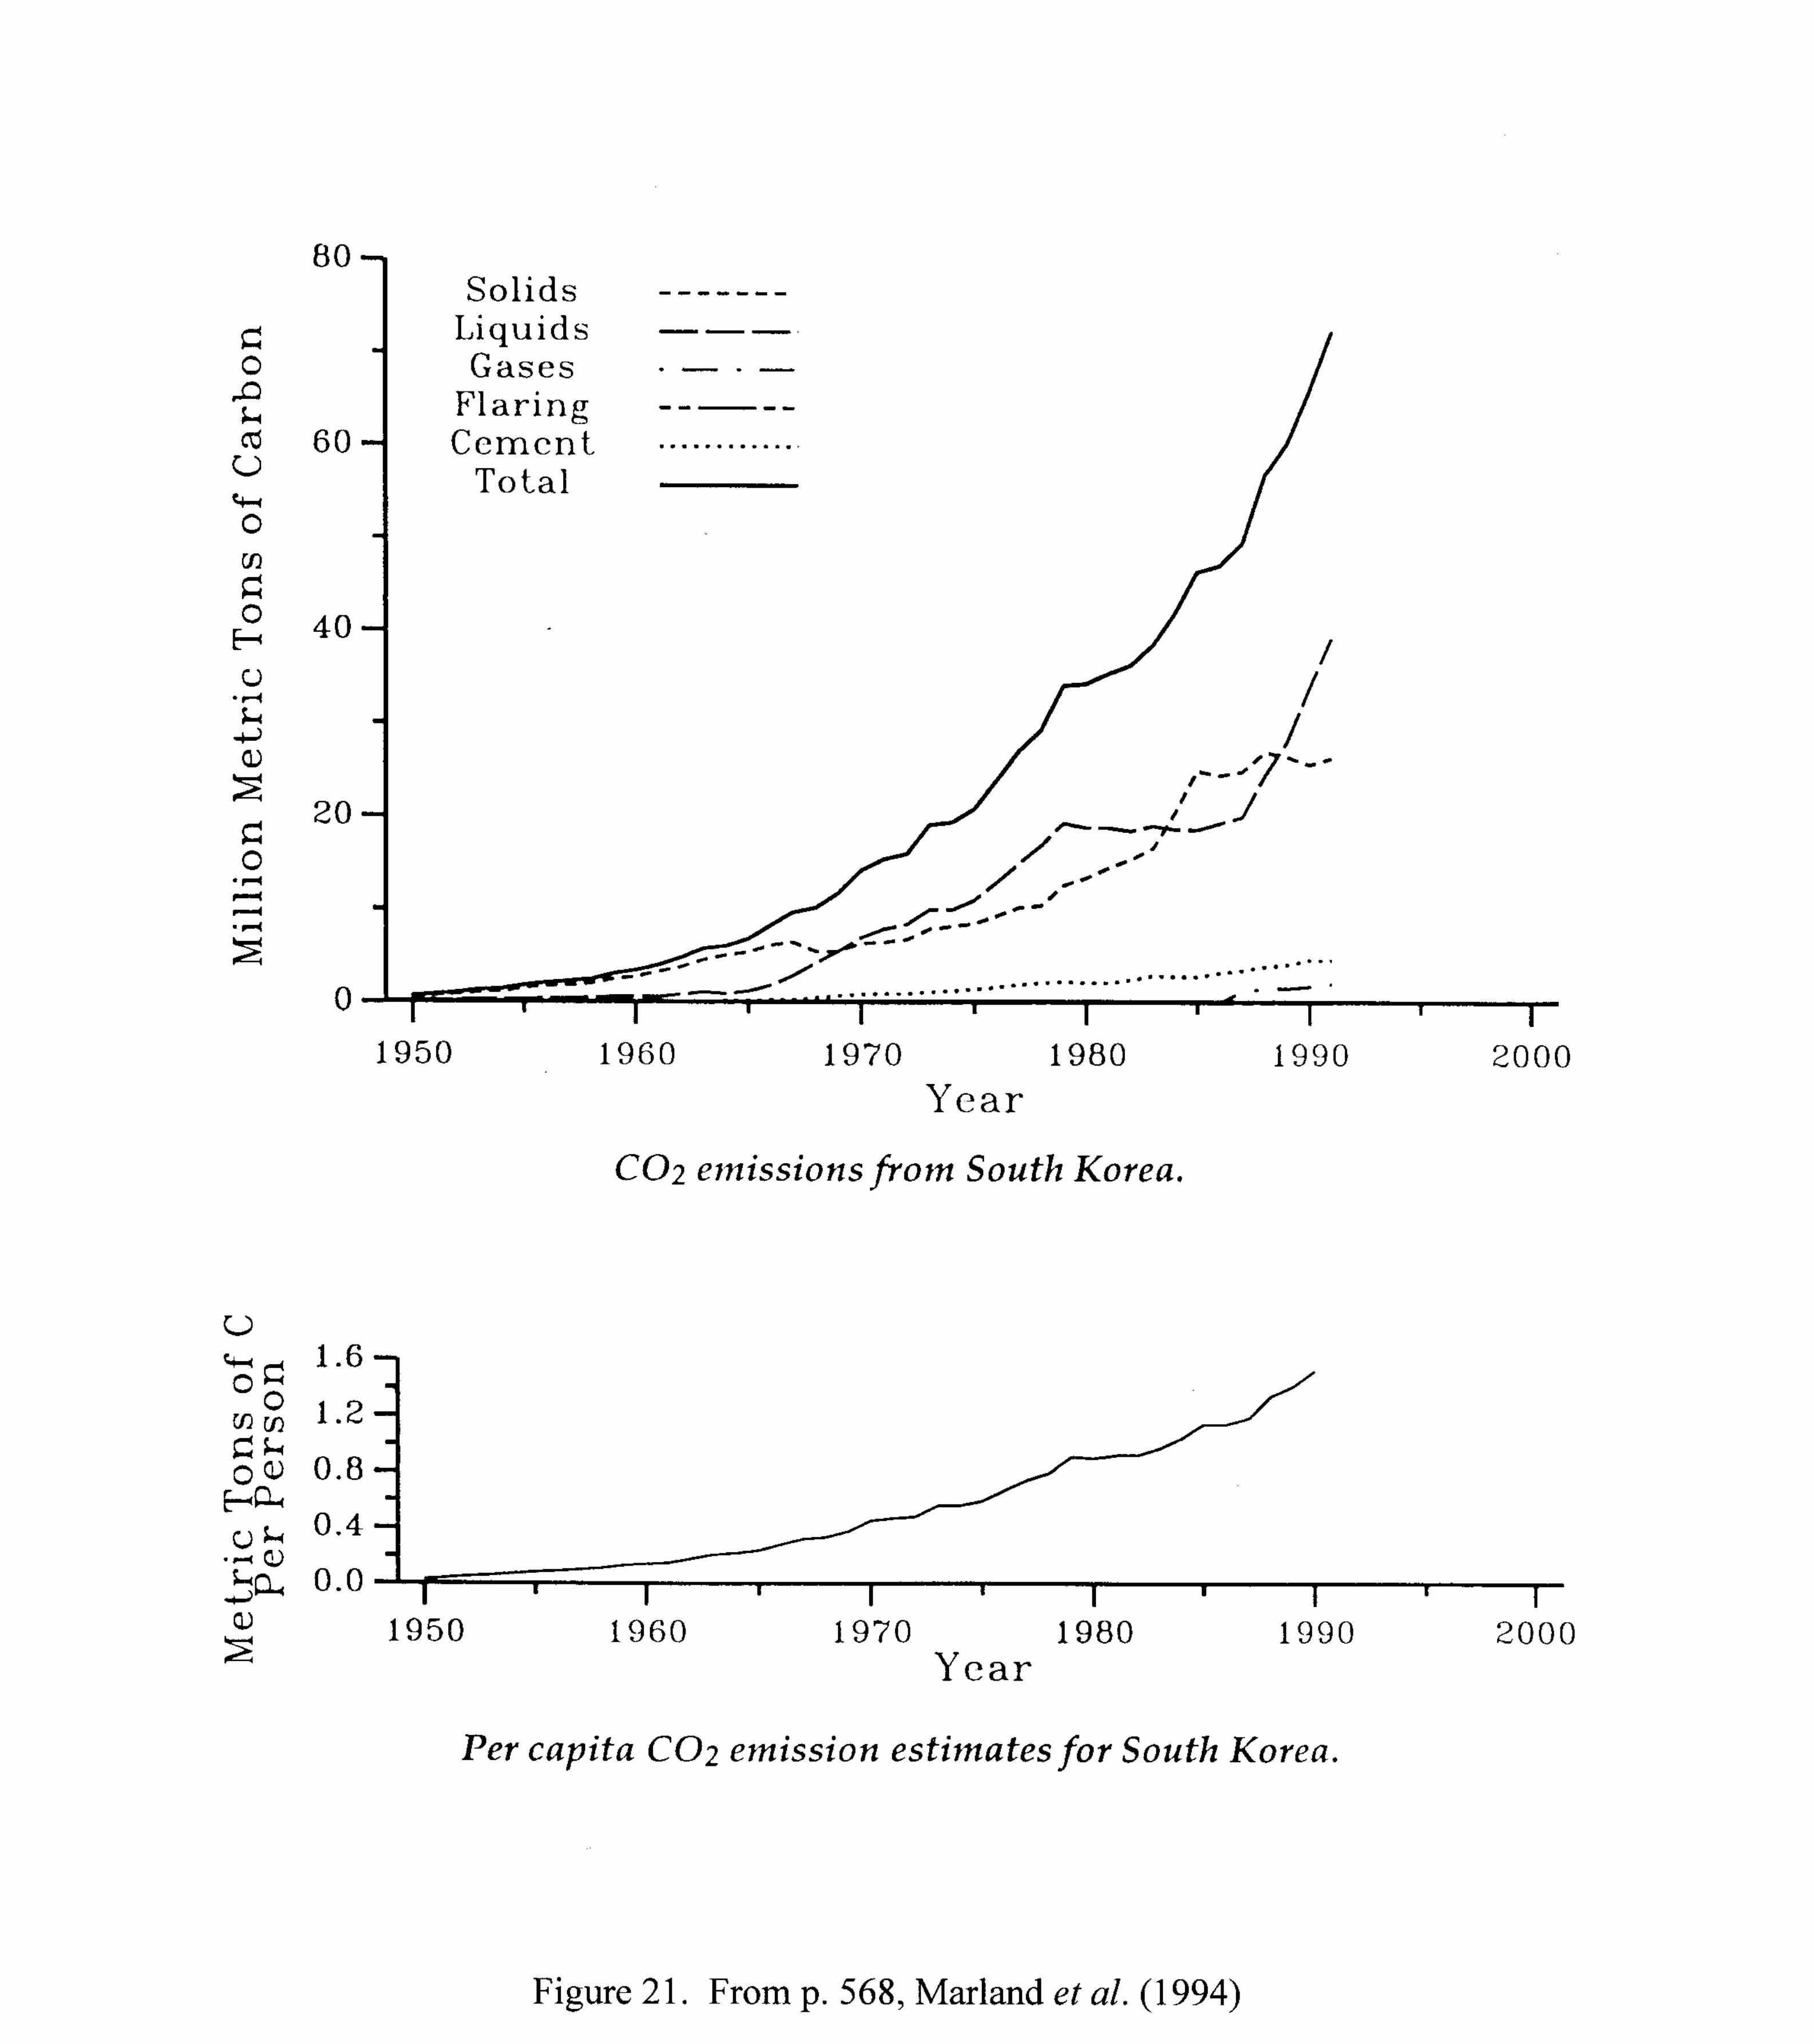
Some countries have an alarming exponential growth. Charts for the PeoplesRepublic of China, India, and South Korea are shown, respectively, in Figures 19through 21.
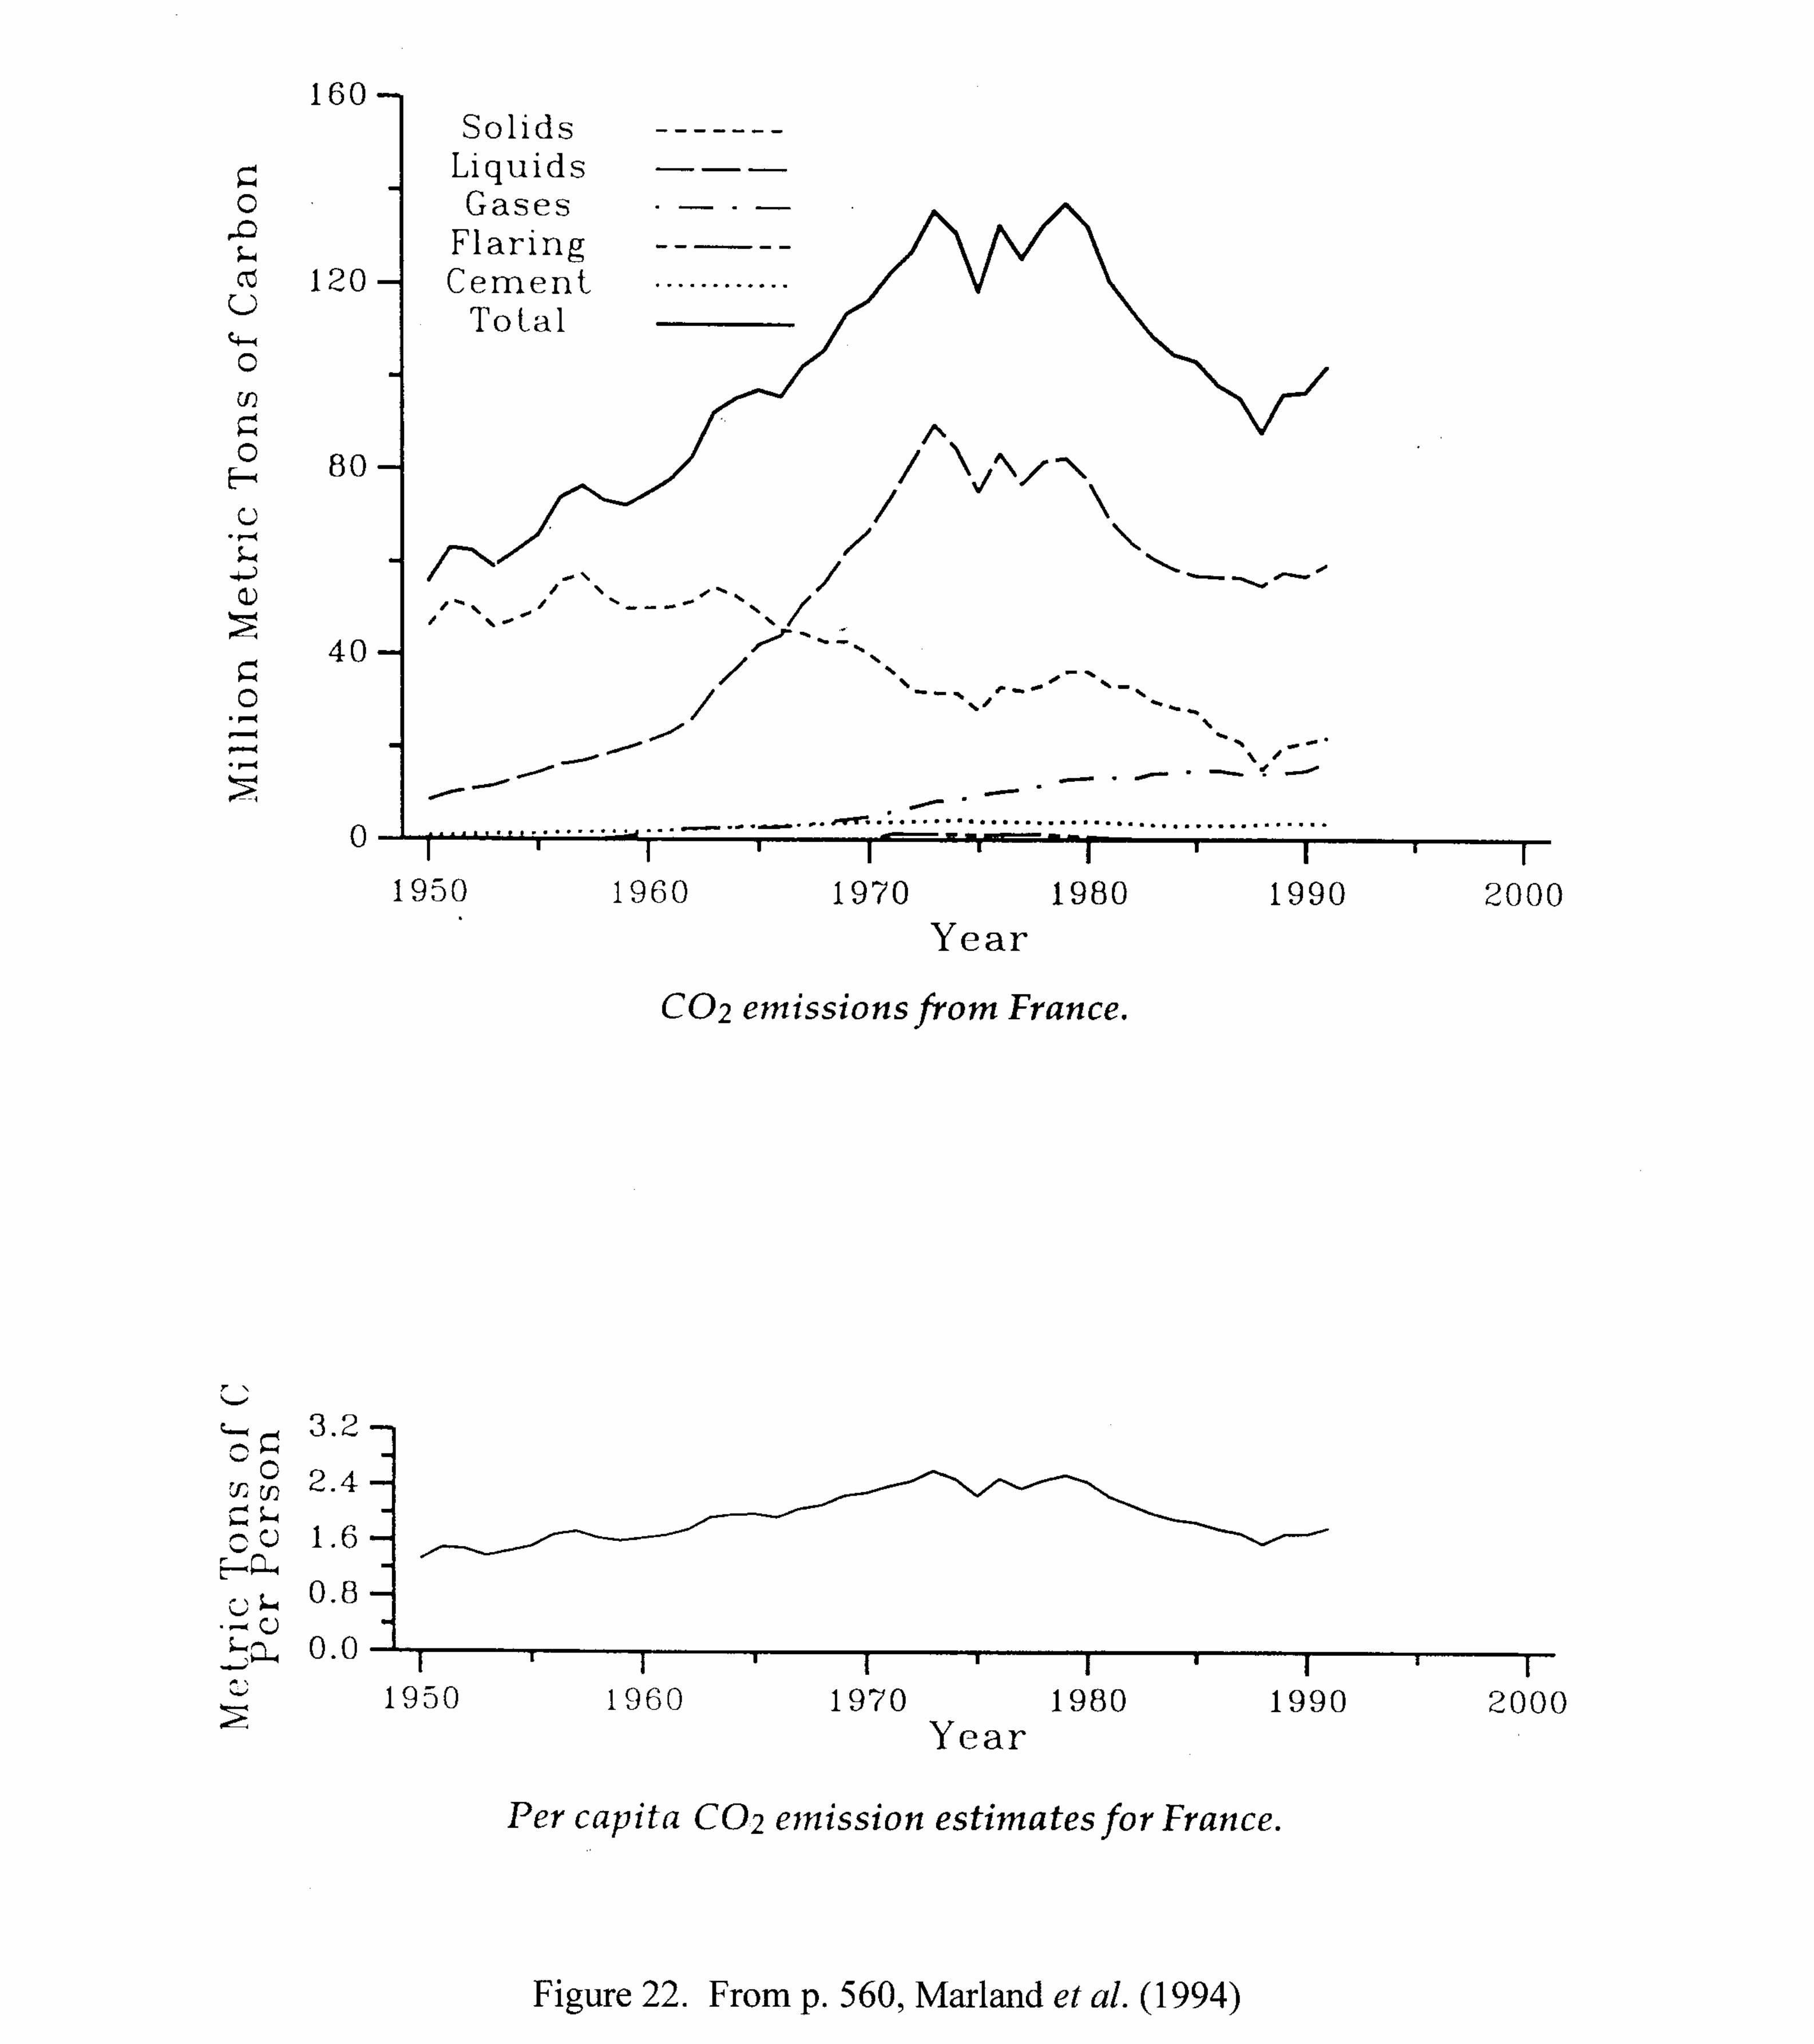
As illustrated in Figure 22, France is the only (accidental) success story inachieving a decrease of CO2 emissions, due to nuclear power generation. Thisissue should cause a re-thinking of the future role of nuclear energy throughoutthe world and, perhaps, help in redefining the nuclear energy policy for the nextcentury.
3. As a consequence of CO2 emissions, atmospheric concentrations of CO2 are increasing
worldwide.
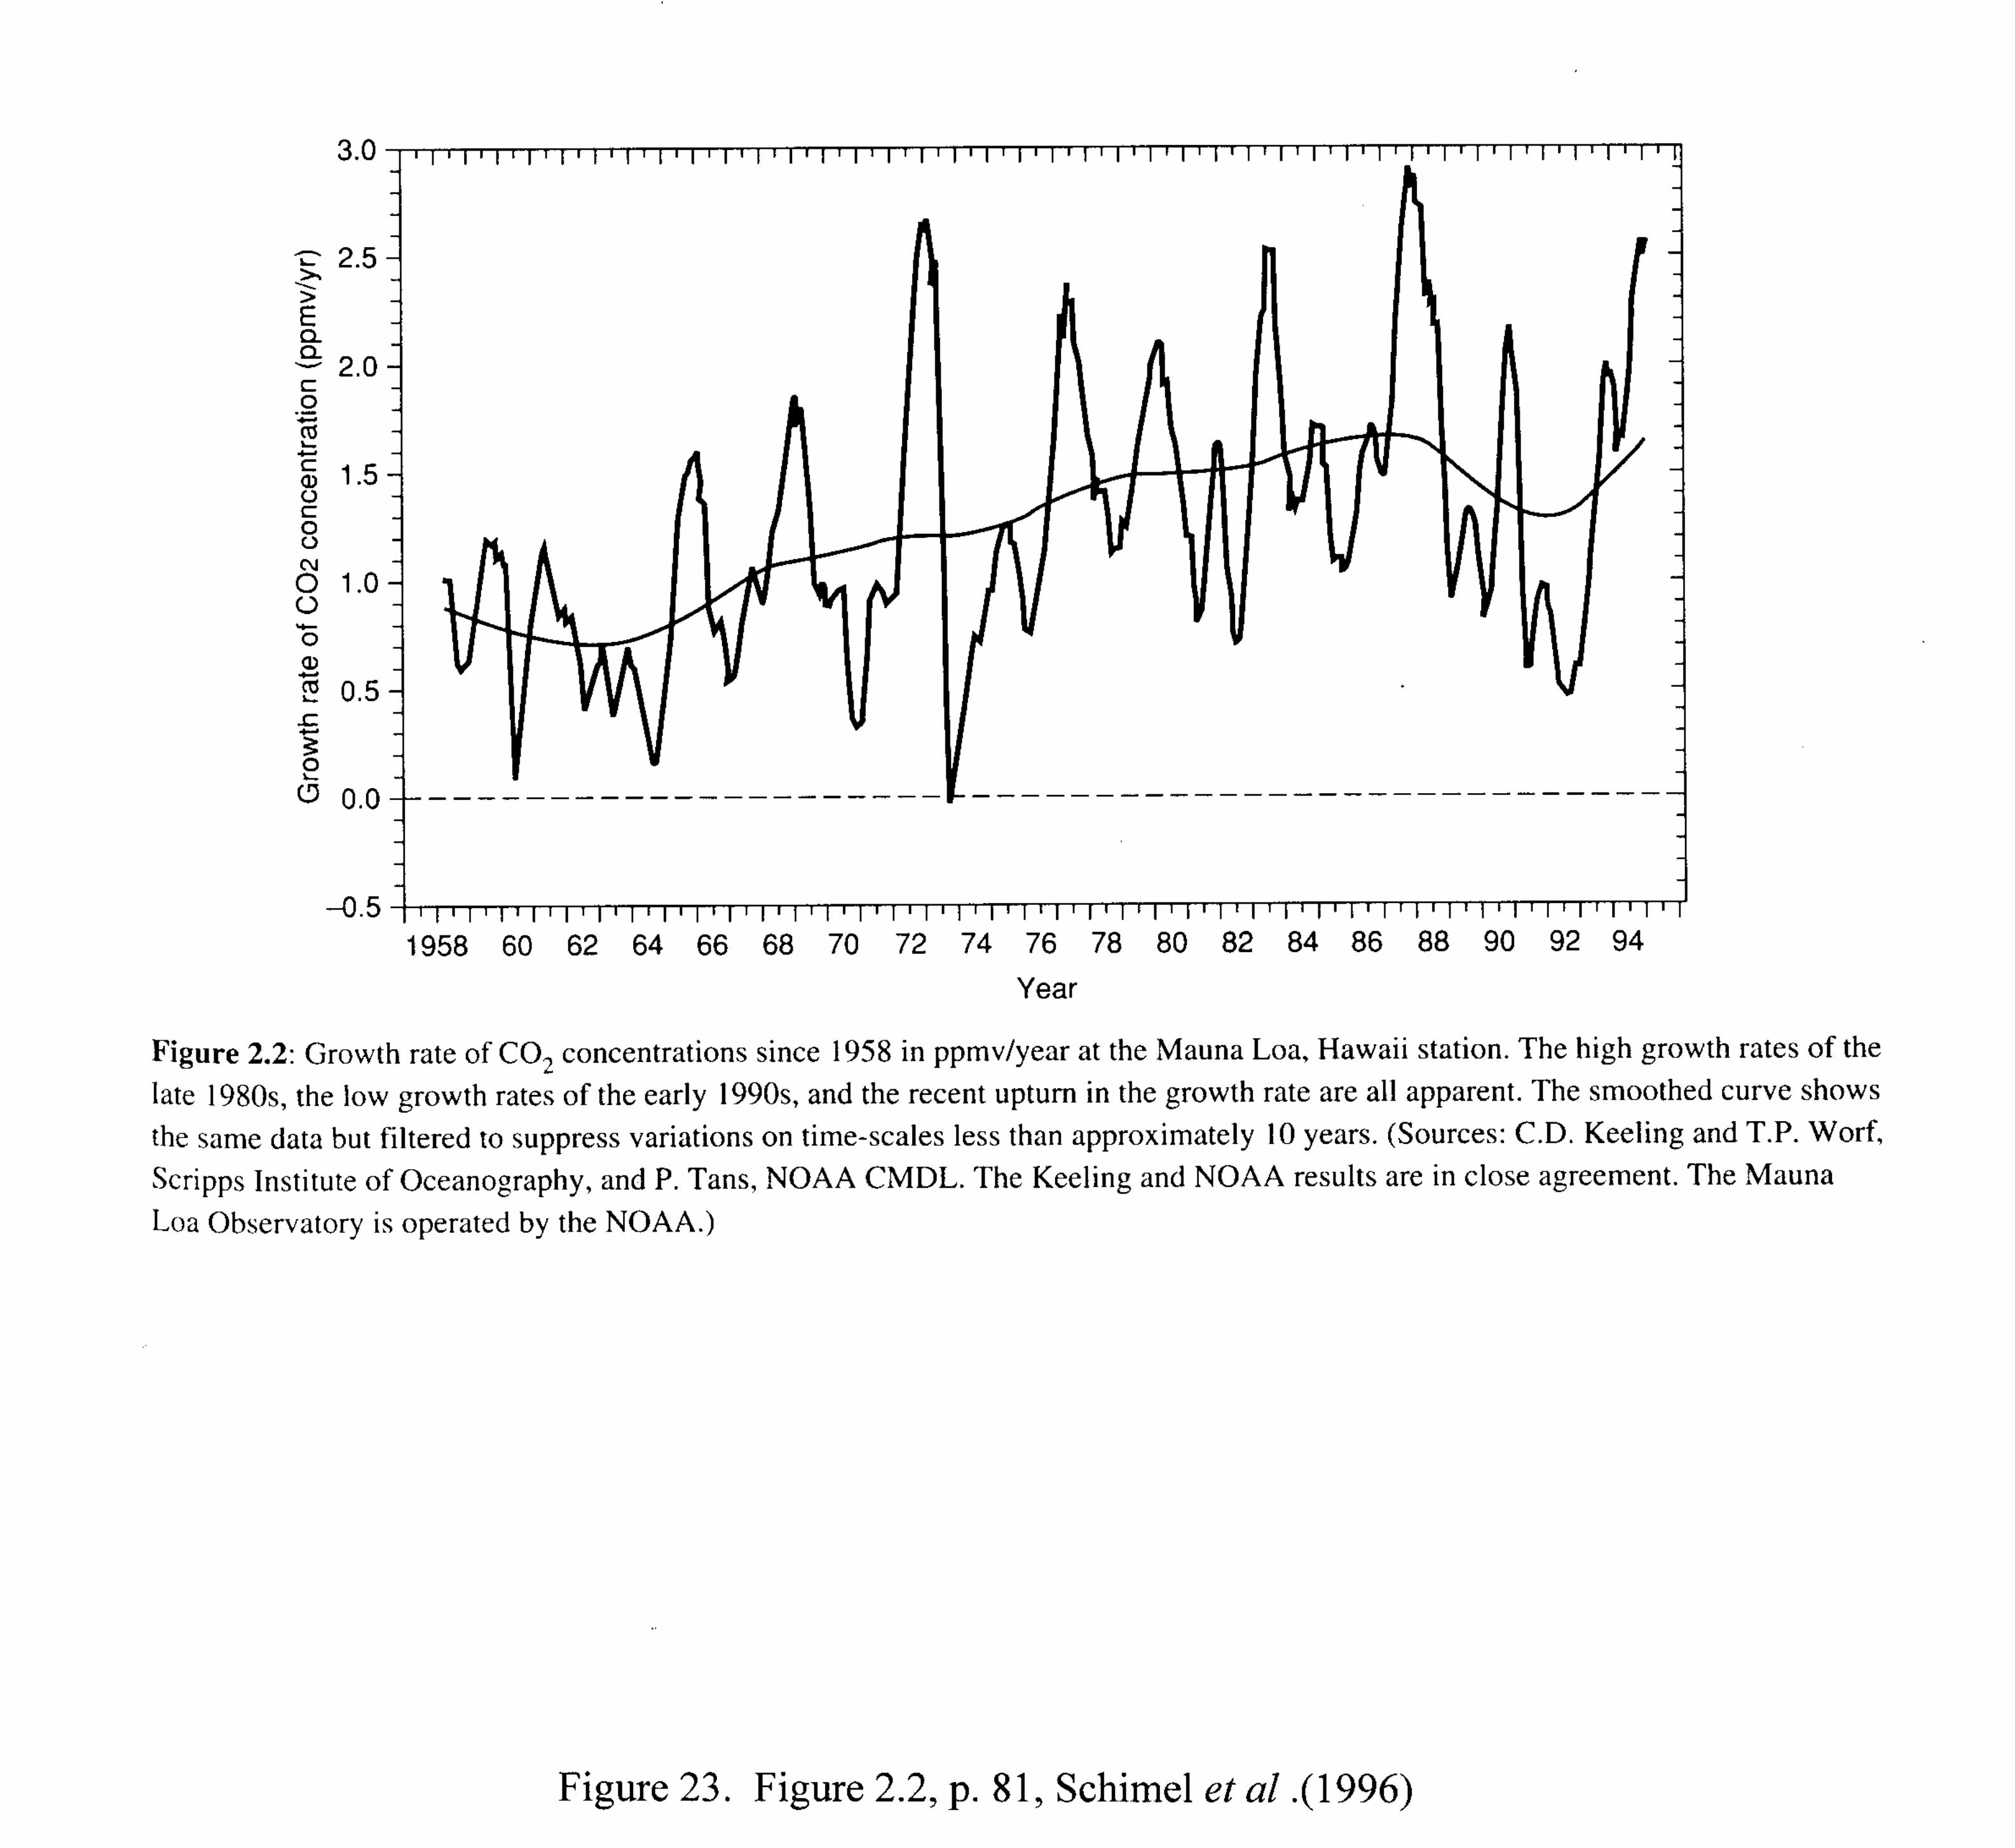
The causes of atmospheric CO2 increase worldwide are not fully clear. In spite ofthe high increase of anthropogenic emissions in the last decades, as illustrated inFigures 3 and 18, the growth rate of CO2 concentration has been relativelyconstant at about 1-1.5 ppmv/year, as illustrated in Figure 23, with even a(unexplained) decline in the early 1990s.
There is, then, a contradiction between the increasing global CO2 emissions inFigure 18 and the relatively constant growth rate of atmospheric CO2 in Figure 23– a factor that may indicate a strong non-anthropogenic component.
4. The CO2 concentration increase is causing global temperatures to increase; "fingerprints" ofCO2-caused global warming have been found on spatial patterns.
According to Figure 1, most of the warming in this century occurred before 1940,before CO2 concentrations increased significantly. This is not consistent with thetheory of a global warming caused by GHGs.
The warming illustrated in Figure 1 is obtained from data recorded at surfacestations. As observed by Christy [1997] and many others, these data are fromsparse stations with uneven global coverage. Moreover, land-based temperaturerecords are contaminated by urban-warming and other land-use changes.Consequently, stations located in the middle of city growth areas can produce awarming totally unrelated to any global factor. Corrections have been made to
122
122
account for these phenomena, but many scientists believe that the temperaturetime series are still contaminated by non-climatic effects tending to show aspurious warming.
The rise in surface air temperatures in the last 100 years is concentrated in the1917-1940 period, which may be related to minimal volcanic activity. Thisincrease seems largely due to natural variations and urbanization [Christy 1997].
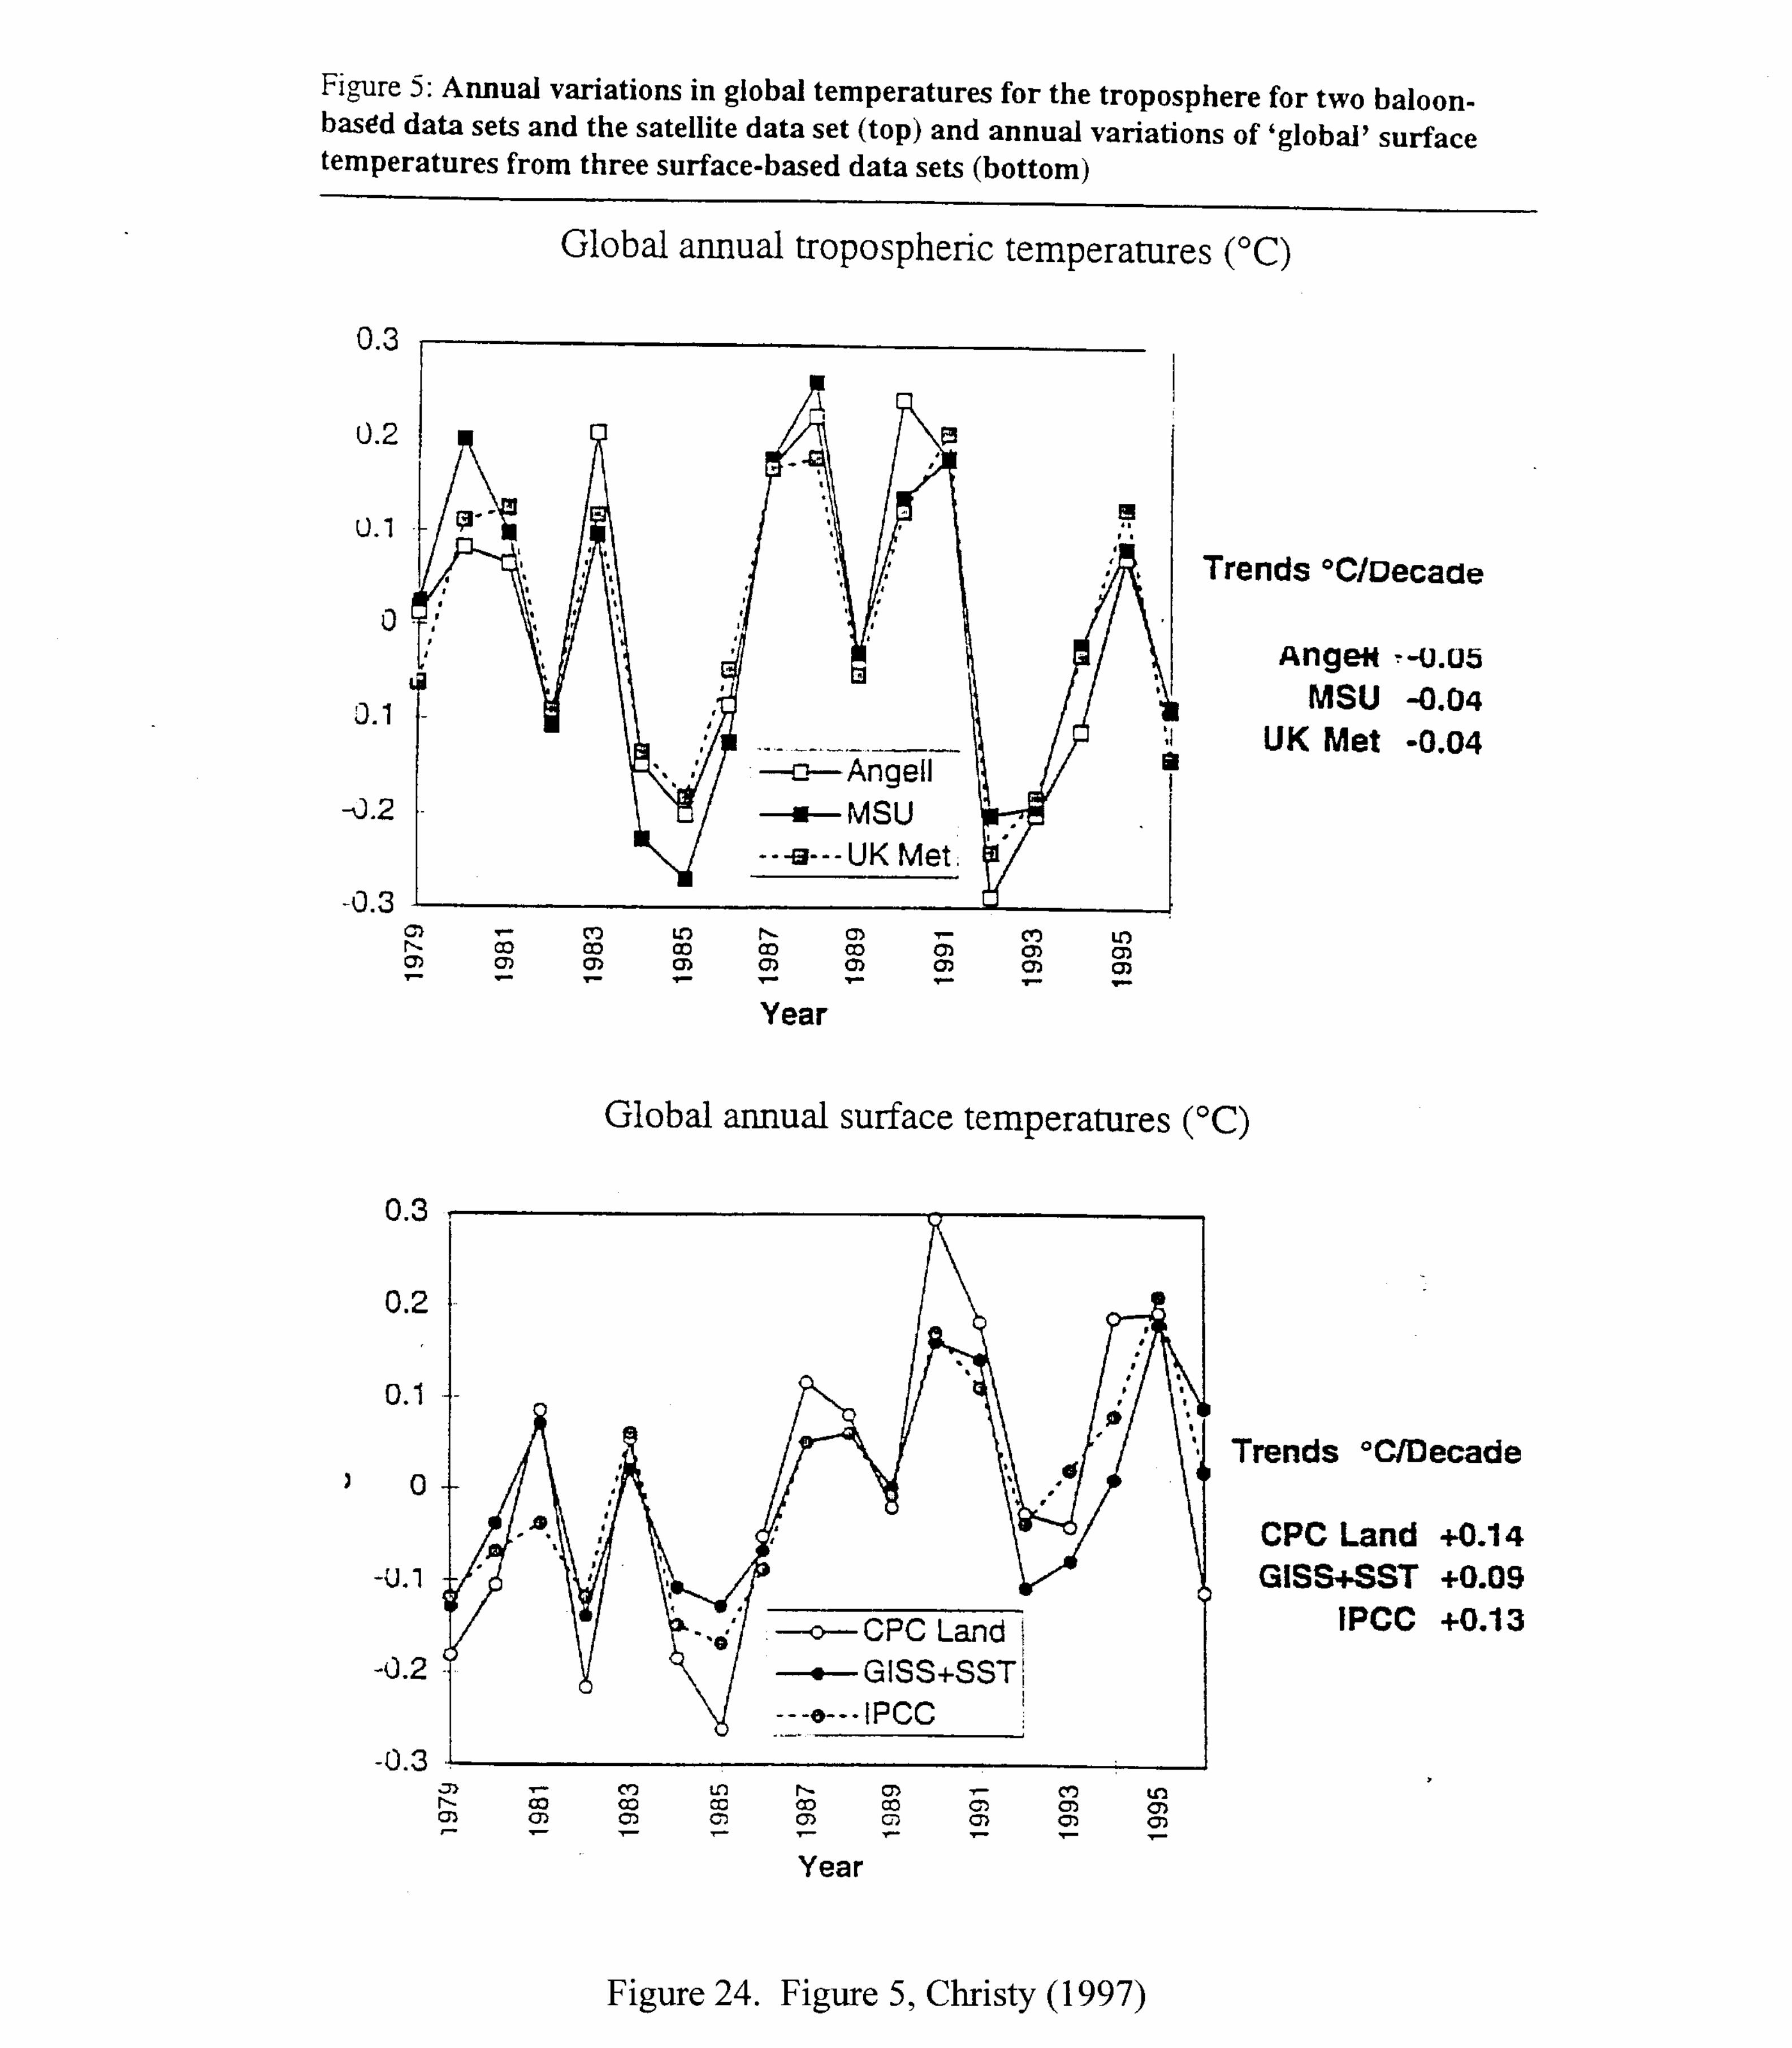
Global temperatures have been measured since 1979 from satellites. The methodconsists of basing global temperatures on the measurement of microwaveemissions from molecular oxygen. This method has been fully validated and hasshown precision on monthly values of ± 0.04°C [Spencer and Christy 1990]. Thistemperature monitoring system is truly global, truly homogeneous, and measuresthe entire lower troposphere (from surface to about 7 km altitude) instead of justthe surface. Satellite data from 1979 to 1996 shows a slight cooling of about0.04°C per decade which cannot be reconciled with the warming monitored in thesurface stations (Figure 24). Christy [1995] provides a justification of thisinconsistency – between satellite and surface data – by claiming that satellite datashowing a slight cooling are correct, while data from surface networks areaffected by inhomogeneity and disproportionate representation of extratropicalcontinental regions. In conclusion, the 1975-1994 global warming trend in Figure1 is not confirmed by, and actually inconsistent with, reliable temperaturemeasurements from satellites.
5. CO2 concentrations are expected to double in the next century.
These calculations of CO2 concentration trends are not included in the AOGCMsimulations but are independently performed using carbon cycle models, whichare still primitive and very uncertain. To be more credible, carbon cycle modelsmust be used in conjunction with AOGCM, validated against collected data, andbe capable of incorporating many more processes, such as biological carbonfixation, and remineralization and sedimentary interaction.
The growth rate of ambient CO2 concentrations has not increased substantially inrecent years (Figure 23). This seems to indicate that a doubling of CO2concentration in the next century may not occur.
6. Current global AOGCM are reliable tools for forecasting climate change when simulations
include the likely effect of aerosols in addition to GHGs.
The current climate models (AOGCM) have focussed on the physical climatesystem. In the simulations, the concentrations of constituents, such as ozone andCO2, are either fixed or pre-specified as a function of time [Trenberth 1997]. Inthis respect, these models are not real “CO2 models”, since the CO2 concentration
123
123
does not depend on the climate changes. Similarly, land surface, biological,ecological, and chemical processes are oversimplified or not included at all.
Current AOGCM are very uncertain, especially in the treatment of clouds, thehydrological cycle, and land surface. Probably the single greatest uncertainty inclimate models is the treatment of clouds [Trenberth 1997]. But clouds play a keyrole in affecting global temperature – a role which is much more important thanany GHG. Unresolved phenomena in AOGCM include the process of moistconvection by which heat and moisture are transported vertically, the hydrologicalprocesses that determine the moisture in the soil, and many of the dynamicprocesses in the ocean [Jacoby and Prinn 1994].
The main uncertainties in AOGCM are [Santer et al. 1996]:
1. errors in simulating current climate in uncoupled and coupled models,2. inadequate representation of feedback,3. flux-correction problems,4. signal estimation problems,5. “missing forcing” and uncertainties in space-time evolution of forcing,
and6. the cold-start effect.
The treatment of positive and negative feedback in AOGCM is inadequate andhighly uncertain. Without the positive feedback of water vapor, no current modelwould predict warming in excess of 1.7°C for a doubling of CO2 [Lindzen 1997].But the way current models handle factors, such as clouds and water vapor, isdisturbingly arbitrary. Indeed, there is compelling evidence for all the knownfeedback to be negative. An example of the complexity of feedback mechanismsis the ice-albedo case: warming may reduce the amount of sea ice, leading toreduced albedo and, therefore, enhanced warming; but more open water alsoprovides a source of moisture that may compensate for the change in albedo [Cesset al. 1991; Trenberth 1996].
The interactive coupling between atmosphere and ocean in AOGCM isnumerically incorrect and generally leads to simulating a climate drift into a newunrealistic state. This error is somehow accounted for by special ad-hoccorrections. However, the confidence in AOGCM predictions will remain low aslong as climate drifts are found. Simply stated, coupled ocean-atmosphere climatemodels cannot reproduce current climatic conditions without adjustments thatsuggest fundamental flaws in the physical understanding and representation of thecoupled ocean-atmosphere processes [Jacoby and Prinn 1994].
AOGCM are capable of simulating this century’s (annual mean) warming only byintroducing the cooling effect of increasing concentrations of sulfate aerosols (seeFigure 7). However, no measurements support the assumption of increasing
124
124
atmospheric aerosols. On the contrary, a vast body of measurements availablefrom 1900 onward indicate that atmospheric transmission is remarkably constant,as illustrated in Figure 25. This means that anthropogenic aerosols have notincreased sufficiently to influence climate as much as claimed in the recent runs ofAOGCM. Consequently, the global warming associated to CO2 increase is over-estimated and AOGCM-based simulations of temperature in this century do not fitthe actual measurements.
When further investigated, the apparently successful validation of AOGCMpresented in Figure 7 appears to be troublesome. It is true that, on a global scale,the inclusion of sulfate concentrations improves the simulation of global meantemperature. However, as illustrated in Figure 26, the simulation over NorthAmerica and Europe is not improved [Mitchell et al. 1995]. So, the success forglobal temperatures may just be the effect of error cancellation and not a trueimprovement of the simulation performance of the model. As correctly observedby Trenberth [1996] and many others, it is often possible to tune a model toachieve an apparent success, if the focus is only one quantity. However, changesin a model that improves one aspect may often adversely affect other variables,which seems to be the case illustrated in Figure 26. Models requirecomprehensive validation, not just calibration and tuning.
The role of aerosols in the forcing of climate is very complex [Charlson andHeintzenberg 1995]. Three categories of connections can be defined:
1. direct forcing (i.e., the theory of influence of aerosols on radiation),2. indirect forcing, and3. influences on heterogeneous chemistry.
Of these, only direct forcing is well understood. Also, the response tostratospheric aerosol forcing (e.g., during volcanic eruptions) is better understoodthan the one due to tropospheric aerosols.
Satellite-based observation (Figure 24) do not show any temperature increasesince 1979; therefore, the validation of AOGCM-based simulations of temperaturein this century (Figure 7) does not fit satellite measurements. This conclusionindicates that the global warming associated to CO2 increase, as simulated by thecurrent AOGCM, is over-estimated.
The Arctic, according to AOGCM simulations, is very sensitive to man-madegreenhouse effect. Still, there is no sign of Arctic warming in the satellite-baseddata [Baliunas 1994].
The range of uncertainty for AOGCM is wider that one would estimate based onthe spread of the models’ outputs themselves [Jacoby and Prinn 1994].
125
125
Current state-of-the-art AOGCM simulations can only run for a few days becauseof computer limitations. Compromise solutions have to be made for the long(decade to century) runs needed for climate simulations [Trenberth 1996].
The planetary surface temperature is simply not as responsive to small changes innatural greenhouse effect as it was once thought (modeled) to be [Michaels 1997].
7. Global model forecasts indicate that, as a consequence of increasing CO2 concentrations inthe next century, global temperatures will increase a few degrees Celsius.
Current AOGCM are not reliable tools for this type of forecast. They provideonly a subset of possible future climate conditions and represent sensitivityexperiments, not predictions [Pielke and Zeng 1994].
Current AOGCM largely over-estimates the global warming associated with CO2increase.
AOGCM must be able to replicate this century’s temperature before being usedwith confidence in projecting future changes.
8. Global model forecasts indicate that, as a consequence of temperature increase, seriousadverse effects will be experienced.
Forecasts of temperature increases are not reliable.
Adverse effects calculations are questionable.
CO2 increases have some positive effects. For example, enhanced CO2 levelsincrease some plant growth and productivity [Jacoby and Prinn 1994; Boese et al.1997].
Temperature increases have some positive effects, especially because most of theforecasted warming is expected to occur in winter, at night, and in cold regions.
9. To avoid or minimize adverse effects, government action and international treaties areneeded to curb CO2 emissions and, eventually, stabilize CO2 concentrations.
Today, we should not rely on computer models to judge global warming [Pielke1994]. Also, a delay in the implementation of CO2 controls, while waiting fornew evidence provided by better science, would have almost negligible effects. Arecent analysis by Wigley et al. [1996] concluded that there is little differencebetween immediate (1995) emission cuts and initiation of cuts in 2020. Bothscenarios lead to the same stabilized CO2 concentration of approximately 550ppmv, with the 25-year delay causing an additional, insignificant, globaltemperature rise of 0.2°C in 2100.
126
126
The cost of CO2 controls may be prohibitive and much below the benefits. Forexample, Baliunas [1994] estimates that stabilizing GHG concentrations couldcost about one-fourth of the GNP of the US on an annual basis. Moreover,countries like China, India, Indonesia, and Brazil seem unlikely to stimulatevoluntary CO2 abatement; therefore, rich countries will probably have to pay poorcountries to stabilize GHG concentrations. This would imply massiveinternational transfers of wealth on a scale well beyond anything in recordedhistory [Jacoby et al. 1997].
By allocating funds to CO2 controls with uncertain benefits, we may penalizeother environmental programs with higher potential benefits (e.g., reduction ofpopulation exposure to air toxics). Furthermore, CO2 controls may cause apossible increase of indoor concentrations associated with decreased air exchangeto save energy.
Other observations from the second group could be mentioned. And, of course, many of thesecond group’s arguments have been commented upon and criticized by scientists in the firstgroup. For example, Nicholls et al. 1996, state that the warming observed at surface stationscannot be attributed to urbanization, since it is also found in ocean temperatures and reflected inindirect temperature measurements (see Figure 8). I certainly cannot provide a summary of theentire debate here, since my main goal is just to present the main thoughts in the two sides.
A Preliminary, Personal Conclusion
My (very) preliminary, (very) personal conclusion on this matter will focus on four (4) mainitems.
1. The sun factor.
I believe, after reading the recent book by Hoyt and Schatten [1997], that the sunplays an important role in climate change and this role cannot be dismissed asnegligible (as implied in Figure 2) in comparison with that of GHGs. Only therecent satellite measurements provide truly accurate solar-irradiance monitoring.These data must be carefully examined in the next few decades to verify possiblelong-term variations in solar irradiance and their relation with climatic changes.
2. The global warming in the last two decades.
Satellite measurements of global temperature since 1979 do not show any globalwarming (Figure 24). This is in disagreement with surface temperature datashown in Figure 1. Unless convincing evidence is raised which challenges thevalidity of satellite data and provides a convincing argument against thediscussions of Christy [1995, 1997], satellite measurements indicate that surfacestations are not a good indicator of global temperature. If this is true, the entire
127
127
validation effort of the most recent AOGCM depicted in Figure 7 is wrong and thesensitivity of global temperature to changes in GHG concentrations is much lowerthat the values presented in Figure 2. Consequently, projections of temperatureincreases in the next century may be highly over-estimated. The clarification ofthis item, in rigorous terms, should be a top priority issue for the scientificcommunity.
3. The positive feedbacks.
Positive feedback occurs when a temperature increase causes variations that tendto further increase global temperature. For example, it is often assumed that, withwarmer climate, the earth may have less snow and ice cover; thus, reducing thealbedo and intensifying the warming. Also, at higher temperature the loweratmosphere contains more water vapor, which is a potent greenhouse gas. Thesepositive feedback’s magnify the 1.2°C gain that would be expected from directradiation alone under a doubling of CO2 concentrations [Jacoby and Prinn 1994]. One of the reason why AOGCM project large temperature increases in the nextcentury is the presence of positive feedbacks, which are highly uncertain anddifficult to quantify (for example, the cloud feedback is both positive andnegative). I find it hard to accept that the earth may be in a situation of “unstable”equilibrium where a perturbation (temperature increase) is followed by anamplification of the signal. Based on scientific intuition, I would be inclined tothink that, while we may certainly have positive and negative feedback, the totalfeedback can only be negative, i.e., in opposition to the signal, or absent at all.Otherwise, the earth’s history would have been characterized by largerfluctuations and instabilities.
4. The role of sulfates.
As an expert in air pollution, I find it very difficult to accept the selectiveinclusion of sulfates, as performed in the most recent AOGCM simulations, toaccount for a cooling effect. Sulfates are only a fraction (and often a smallfraction) of the total mass of aerosols that affect global radiative forcing. A vastbody of measurements is available from 1900 onward showing that atmospherictransmission is remarkably constant [e.g., Hoyt and Frohlich 1983]. These datasimply cannot be ignored.
A candid analysis of Figure 7 indicates that the role of sulfates in the most recentAOGCM simulations is absolutely critical for trusting these models. It is onlybecause of the increasing cooling caused by sulfates after 1920, that the modelsare capable of simulating a correct global temperature trend in this century (eventhough continental trends remain incorrect, as illustrated in Figure 26). But, asmentioned before, atmospheric transmission measurements do not support anincrease of atmospheric aerosols since 1920.

128
128
If the treatment of sulfate concentrations in AOGCM simulations is incorrect, wefind again that the sensitivity of global temperature to changes in GHGconcentrations must be much lower that the values presented in Figure 2.Consequently, projections of temperature increases in the next century may behighly over-estimated. The clarification of this item, in rigorous terms, should bea top priority for the scientific community.
So, am I a skeptic? Perhaps. But my skepticism is based upon scientific data and facts. Themost shocking experience for me is to encounter many scientists who, with little or noknowledge in atmospheric sciences, have convinced opinions on this issue! Also, I share manyof the observations and comments provided by Lindzen [1997] and find it extremely disturbingto see hundreds of scientists and many Nobel Laureates, with no qualifications nor technicalexperience on this matter, signing petitions.
I remain, however, a partial believer, in the sense that I have no doubt that the computermodeling approach to this problem is a sound scientific endeavor and that the current AOGCMare useful tools. As correctly observed by Trenberth [1997], models can be used and abused and,certainly, they do not offer the certainties that policy-makers would like. The scientificcommunity as a whole, however, must achieve a consensus on the proper use of these models,the quantification of their projections, and the calculation of the uncertainty bounds of theseprojections.
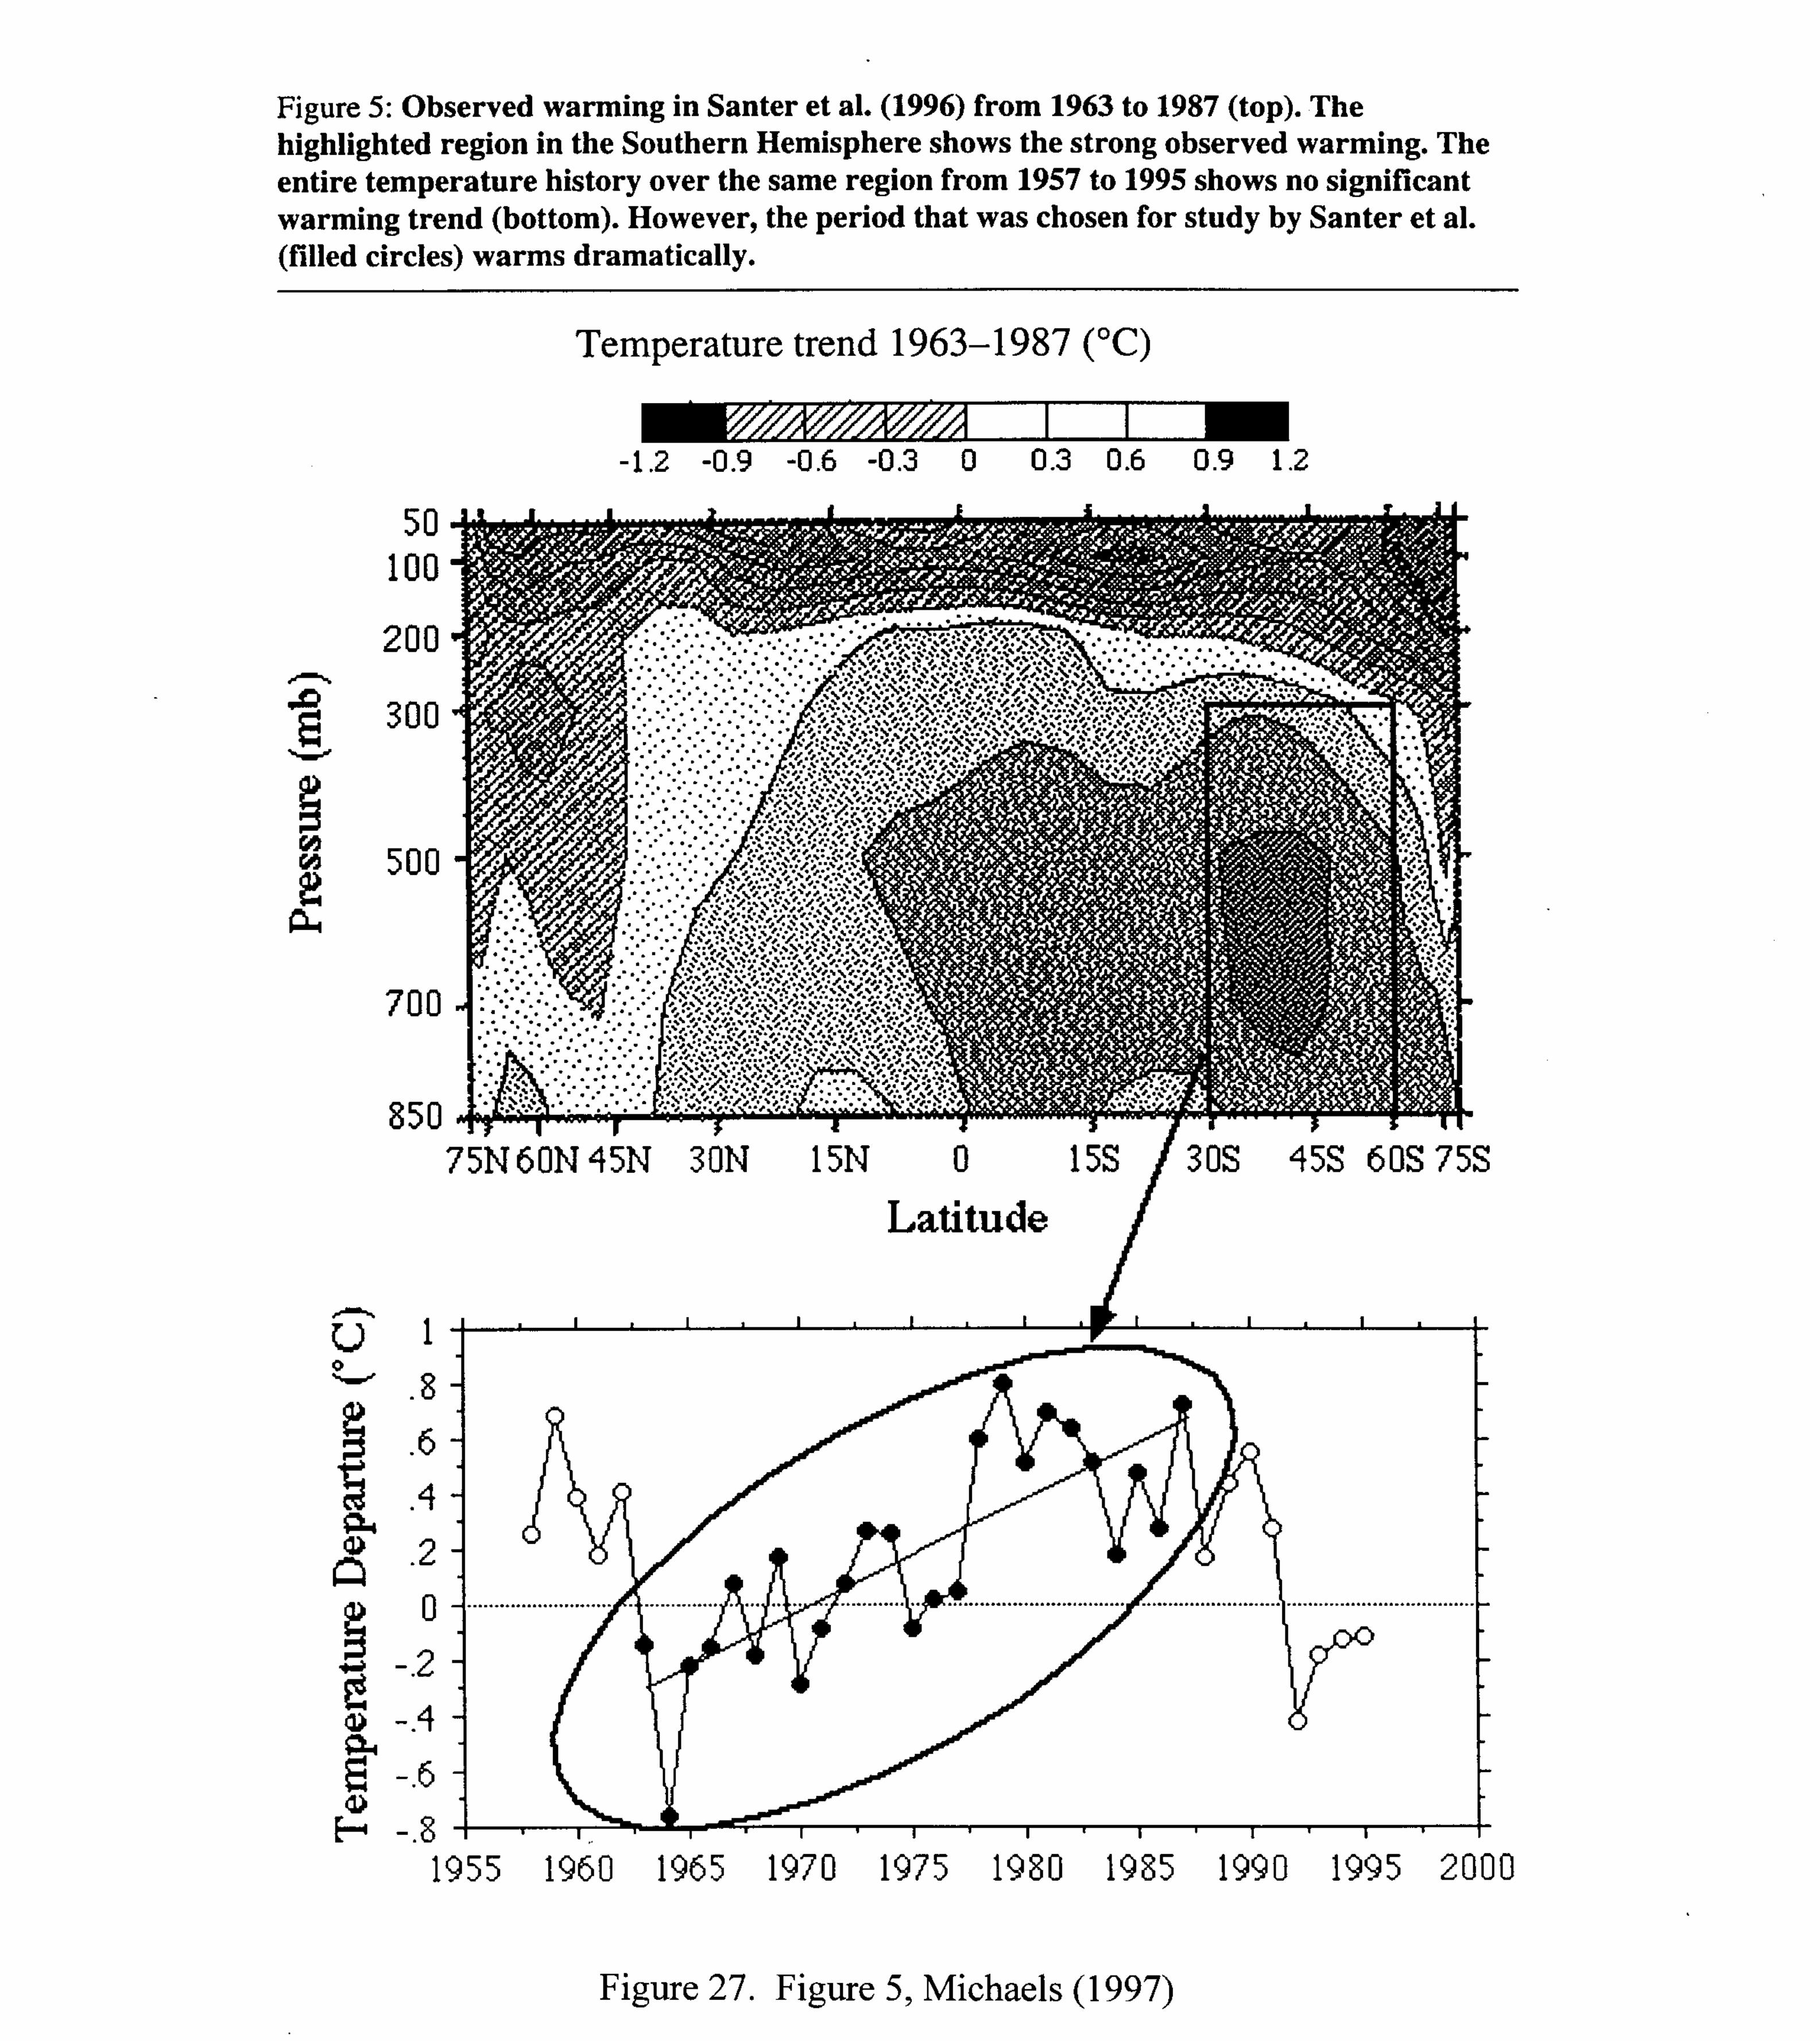
The scientific community must resist political, economic, and militant pressures from anydirection. Let’s examine, for example, Figure 27, a case in which Michaels and Knappenberger[1996] expose and criticize Santer et al. [1996a] for selecting only a subset of observational datain order to prove a sulfate + greenhouse hypothesis. If the accusation is correct, this represents avery disturbing event (and if the accusation is not correct, this is very disturbing too). All dataand scientific evidence must be used, without exception; they can be criticized but not ignored.One scientific side must listen to the other side and debate the arguments using, as the solearbiter, the scientific method. Also, the recent effort in trying to disqualify scientific opinions onsubjective considerations (e.g., the authors’ political affiliation or sponsors) instead of objectiveconsiderations, is very dangerous to the scientific community.
129
129
Addendum
In the last few months, I have circulated a preliminary draft of this chapter in the scientificcommunity. This draft generated interest and comments from many readers, who have alsoprovided additional information on this subject. Some selected comments are presented below.
Q.: My only question, personally, is about France being the only accidental success story - wouldnot Germany (via reunification), England (via switch to NG) and the former Soviet States allqualify as well?
A.: France is the only country that, in the last few decades, has shown a strong decline in CO2emissions. The other countries you mentioned made progress too, but more in reducing theirincreasing trend.
Following is a reference relating to the comparison of the surface and satellite temperature data:
Hansen et al (1997) "Forcings and chaos in interannual to decadal climate change". J. GeophysicalResearch 102(D22), 25679-25720.
A few references on satellite-based temperature measurements:
Hurrell, J. W., and K. E. Trenberth, 1997: Spurious trends in the satellite MSU temperaturerecord arising from merging different satellite records. Nature 386, 164--167.
and the followup correspondence and rebuttal: Trenberth, K. E., and J. W. Hurrell, 1997: Howaccurate are satellite `thermometers'. Nature 389, 342--343.
Hurrell, J. W., and K. E. Trenberth, 1997: Difficulties in obtaining reliable temperature trends:Reconciling the surface and satellite MSU 2R trends. J. Climate.
Trenberth, K. E., 1997: Global Warming: It's happening. article 9.http://naturalscience.com/ns/articles/01-09/ns_ket.html (Electronic journal).
Frederick Seitz, Past President of the National Academy of Sciences, USA, and PresidentEmeritus of the Rockfeller University has launched a petition to reject the global warmingagreement that was written in Kyoto in December 1997. For more information, contact PetitionProject, PO BOX 1925, La Jolla, CA 92038-1925 (USA).

130
130
Comments on "Todays Debate on Climate Change: Searching for the ScientificTruth, by P Zannetti"
ByR. D. BraddockEnvironmental SciencesGriffith UniversityNathanAustralia 4111 [email protected]
I have read the paper by Zannetti (1998) with considerable interest. I came to most of theseconclusions some 10 years ago and stood in conferences and said so. At the time, the scientificmethod seemed to be forgotten as the ' believers in the greenhouse ' entered the fray in earnest:how dare I challenge the established mantra??? The debate is still going today and the science isstill inconclusive as to the nature and extent of the Greenhouse Effect. This paper, Zannetti(1998), is a useful contribution to that debate, and a call for the proper use of the Scientificmethod.
The body of the paper is appropriate and well presented, but the conclusions seem to underplayand not fully represent the first part. Some additional features which could be mentioned, include
1) The Sun.
The sun is not a constant but is variable in its outputs. The Solar Constant is the measure of theradiative flux from the sun at a distance equivalent to the radius of the earth's orbit. The name ismisleading as we know that this flux varies (Kelly and Wigley, 1992). We do not have accurateoutput measures from the sun in the long term although satellites have observed and measuredthe sun's radiative output since about 1978 when the Nimbus satellite was launched for thatpurpose. The Marshall Report (1989) discusses some of the results and indicates the variability inthe solar constant.
One point is the variation in sunspot activity as a measure of solar activity. Sunspot activity hasbeen observed by the Chinese for some 3000 years or more, as slaves were forced to look at thesun and observe and count sunspots. The records are by no means reliable and the level ofresolution is quite problematic. The telescope arrived in about 1610, which was the start of theMaundler minimum in sunspot activity, and permitted better techniques for observation. Thesetechniques were eventually superceded by the satellites. This Maundler period lasted until about1700 and sunspot activity has been increasing since then [but also oscillating on a 10-11 and 22year cycle]. In addition, the little ice age coincided with this period, and temperatures haveincreased since but fluctuating of course. This should not be construed as an assumption of causeand effect.
However, one feature of the current Greenhouse debate is the lack of attention to the main inputof radiant energy to the earth. This is an area deserving of scientific attention.

131
131
2) The Models.
Zannetti (1998) raises several questions about the models which are in use for predicting climatechange, but does not follow through on how to improve them. Braddock et al.(1994) havemanaged to write IMAGE , one of the simpler climate models, as a mathematical system andstudied it for equilibria, stability and chaotic behavior. They also considered the sensitivity of themodel to variation in the values of a small range of the parameters, considered some of thestochastic properties and the application of control theory for achieving targets on atmosphericcomposition while minimizing some economic cost function. This form of analysis needs to beextended to other climate models although there are serious problems in computer resources totackle the calculations both mathematical and numerical.
The current models need to better handle the physics of water vapor, clouds etc, as well as theinteractions with ice. The carbon cycle needs to be improved, as do the other models [nitrogencycle and heat cycle] as these all affect the biosphere. The relationships and interactions with theatmosphere and ocean are also not well modeled. In a GCM, the basic modeling of other parts ofthe system needs to be brought to the same level of sophistication as that for the atmosphere.
3) Other Modeling Issues.
There is a range of models of differing complexity and sophistication from 'back of the envelopeto GCM', for each component of the integrated models. This raises a question as to the suitabilityof the match between models where the atmosphere [say] is but a module of a larger integrated[world?] model What are the error propagation of one crude model feeding information into amore sophisticated one, and vice versa. These aspects certainly need to be explored.
I would like to see a modeling situation where several models of differing sophistication andcomplexity can be incorporated into the integrated [Greenhouse] simulator Then we couldcompare the predictive power of the simulator at different levels of resolution, sophistication andcomplexity. Some advanced form of sensitivity analysis may give some idea as to which of thesub-models for each cycle [heat, carbon etc] are required to achieve various levels of resolutionand precision, and which need to be improved. Such a study could also investigate theinformation flow and transformations, and consider how they interact as errors propagate throughthe integrated whole.
4) Climate Relationships
Barnola et al. (1987) have discussed the link between the gas concentrations in ice bores andatmospheric temperatures, and found good correlation between the two. They also put the recordsthrough a spectral analyzer and found significant periods of 105000 years, 43-44000 years, and21000 years. All of these periodic cycles coincide with the periods of variation of the earth'sorbital and axial parameters. The variation in the radiative input from the sun does seem to havean effect on climate.

132
132
I have repeated their calculations and confirm their results. I also attempted to find a lag effectbetween the temperature, methane and carbon dioxide records from the Vostok Ice Cores. Thedata contains errors in the dating of the measurements, and Barnola et al. (1987) suggest errors ofmeasurement of up to 10000 years in the record, especially for the older data. I used crosscorrelation and least squares fitting of lagged records to try to identify time lags between thetemperature and gas concentrations. The lags seem to vary through the record but are of the orderof 1400 years with the gas signal lagging the temperature.
I attempted the same exercise with the historical sea level record as investigated by Chappell(1982) using geomorphological techniques in the Huon Gulf region in Papua New Guinea. Thetiming errors are worse than for the ice core data, and there are significant errors in the estimatedsea levels. Again, cross correlations were used to identify a range of lags with most being in therange 2000-6000 years with the sea level lagging the temperature record. I have not attempted topublish the work as the calculated lags all lie within the error range of the basic data, and the R-squared values are less than 0.6 for all of the fits.
There is still considerable politics going on in scientific circles, over the cause and effects of thegreenhouse, as Kyoto and its prelude showed. There is evidence of politics within the scientificcommunity over funding and influence. There is also evidence of a selective use of science in thepolitical world. I believe the scientific community needs to return to the scientific methods andtraditions.
REFERENCES
Braddock, R. D., Filar, J. A., and Zapert, R., 1993, Stochasticity in a Greenhouse Model, inStochastic Models in Engineering, Technology and Management,Ed., Osaki, S., and Murthy, D.N., World Scientific, Singapore, pp 67-75.
Braddock, R.D., Filar, J. A., Zapert, R., Rotmans, J., and den Elzen, M., 1994, The IMAGEGreen house Model as a Mathematical System, Applied Math. Modelling, vol. 18, pp 234-254.
Barnola, J. M.,Raynaud, D., Korotkevitch, Y. S., and Lorius, C., 1987, The Vostok Ice Core, A160000 Year record of Carbon Dioxide, Nature, vol. 329, pp 408-414.
Chappel, J., 1982, Sea Levels and Sediments, Archaeol. Oceania, vol. 17, pp 69-78.
Kelly, D., and Wigley, T. M. L., 1992, Solar Cycle Length, Greenhouse Forcing and GlobalClimate, Nature, vol. 360, pp 328-330.
Rotmans, J., 1990, IMAGE, An Integrated Model to Assess the Greenhouse Effect, Kluwer,Dortretch, Holland.
The Marshall Report, 1989, Scientific Perspectives on the Greenhouse Problem, MarshallInstitute, Washington, D.C., pp 1-43.
133
133
Zannetti, P., 1998, Today’s Debate on Climate Change:Searching for the Scientific Truth,http://www.envirocomp.org/html/publish/GlobalWarming/GWreport_x_EC.pdf
I note in your latest issue of ENVIRONews that several references are given concerning thesatellite temperature record. Please see the other point of view at:http://wwwghcc.msfc.nasa.gov/temperature/and the links contained therein.
I would like to suggest two additional sources: one is 'Energy Policy' (Elsevier) p.439-444: 'Awinning coalition of advocacy: climate research, bureaucracy and alternative fuels’, March 1997,which is based on a four year study of the IPCC and its internal politics and science. The secondis a 1997 book by Nigel Calder, ‘The Manic SUN’, which tells the human story of the Danestrying to get work on the solar hypothesis.
There are two other sources of information about “skeptics”. There is a British group whichincludes scientists at the Institute for Economic Affairs in London, 2 Lord North Street,Westminster London SW1P3LB ([email protected] or http://www.iea.org.uk). They havepublished 2 books on this subject. There is also the European Academy for EnvironmentalAffairs, under Prof. Dr. H. Metzner), phone: 07071 787 83; Fax 07071 72939.

134
134
Some Internet Resources and Information on Global Warming
Climate Countdown – National Environmental Trusthttp://www.envirotrust.com/climate.html
‘Countdown to Kyoto’: The Consequences of the Mandatory Global Carbon Dioxide EmissionsReductions, Australian APEC Study Centre, Canberra, Australia, 19-21 August 1997
http://www.arts.monash.edu.au/ausapec/kypaps.htm
Global Climate Information Projecthttp://www.climatefact.org/
Greenhouse gases section of the Energy Information Administration's (EIA) Worldwide WebServer
http://www.eia.doe.gov/oiaf/1605/frntend.html
U.S. Global Change Research Programhttp://www.usgcrp.gov/
Carbon Dioxide Information Analysis Center – The primary global-change data and informationanalysis center of the U.S. Department of Energy (DOE)
http://cdiac.esd.ornl.gov/
Massachusetts Institute of Technology – Joint Program on the Science and Policy of GlobalChange
http://web.mit.edu/globalchange/www/
U.S. Geological Survey Global Change Research Programhttp://GeoChange.er.USGS.gov/index.html
Union of Concerned Scientists – Compact section on global warminghttp://www.ucsusa.org/warming/index.html
George C. Marshall Institutehttp://www.marshall.org/globalfax.html
Global Warming – New York Timeshttp://www.nytimes.com/library/national/warming-index.html
White House Initiative on Global Climate Changehttp://www.whitehouse.gov/Initiatives/Climate/main.html
The Environmental Protection Agency – The Global Warming sectionhttp://www.epa.gov/globalwarming/
135
135
Global Warming Information Page – Maintained by Consumer Alerthttp://www.globalwarming.org/index.htm
Environmental News Networkhttp://www.enn.com/climate/
Global Warming: Focus on the Futurehttp://www.envirolink.org/orgs/edf/
United Nations Intergovernmental Panel on Global Warminghttp://www.ipcc.ch/
World Wildlife Fund's Climate Change Campaignhttp://www.panda.org/climate/
Add Up Your Carbon Dioxide Emissions – Games sitehttp://www.envirolink.org/orgs/edf/games/index.html
Global Climate Coalition – A coalition of private companies and trade associationshttp://www.worldcorp.com/dc-online/gcc/tech.html
Sierra Club Global Warming and Energy Campaignhttp://www.sierraclub.org/global-warming/home.html
Global Warming: Understanding the Forecast – From the Environmental Defense Fundhttp://www.edf.org/pubs/Brochures/GlobalWarming/index.html
The UNFCCC Official Web Site of the Climate Change Secretariathttp://www.unfccc.de/fccc/conv/file01.htm
Global Warming Centralhttp://www.law.pace.edu/env/energy/globalwarming.html

136
136
References
Baliunas [1994]: “Ozone & Global Warming: Are The Problems Real?” WashingtonRoundtable on Science and Public Policy, December 13, 1994.
Begley [1997]: “Building the Greenhouse Effect,” Newsweek, October 20, 1997.
Boden et al. [1994]: Boden, T.A., D.P. Kaiser, R.J. Sepanski, and F.W. Stoss (eds.), Trends ’93:A Compendium of Data on Global Change, Carbon Dioxide Information Analysis Center,Oak Ridge National Laboratory.
Boese et al. [1997]: “Elevated CO2 Mitigates Chilling-Induced Water Stress and PhotosyntheticReduction During Chilling,” Plant, Cell, and Environment, 20, pp. 625-632.
Cess et al. [1991]: Cess, R.D., G.L. Potter, H.-H. Zhang, J.P. Blanchet, G.J. Boer, S. Chalita, R.Colman, D.A. Daylich, A.D. Del Genio, V. Dymnikov, V. Galin, D. Jerrett, E. Keup, A.A.Lacis, H. Le Treut, X.Z. Liang, J.-F. Mahfouf, B.J. McAvaney, V.P. Meleshko, J.F.B.Mitchell, J.-J. Morcrette, P.M. Norris, D.A. Randall, L. Rikus, E. Roeckner, J.-F. Royer, U.Schlese, D.A. Sheinin, J.M. Slingo, A.P,. Soikolov, K.E. Taylor, W.M. Washington, R.T.Wetherald, and I. Yagai, “Interpretation of Snow-Climate Feedback as Produced by 17General Circulation Models,” Science, 253, pp. 888-892.
Charlson and Heintzenberg [1995]: Aerosol Forcing of Climate, John Wiley & Sons.
Christy [1995]: Christy, J.R., “Temperature Above the Surface Layer,” Climatic Change, 31,pp. 455-474.
Christy [1997]: Christy, J.R., “The Role of Satellite Measurements,” Proceedings of “Countdownto Kyoto,” Canberra, Australia, 19-21 August 1997, Australian APEC Study Centre,Canberra, Australia.
Copeland et al. [1996]: Copeland, J.H., R.A. Pielke, and T.G.F. Kittel, “Potential ClimaticImpacts of Vegetation Change: A Regional Modeling Study,” Journal of GeophysicalResearch, 101(D3), pp. 7409-7418.
Friis-Christensen and Lassen [1991]: “Length of the Solar Cycle: An Indicator of Solar ActivityClosely Associated with Climate,” Science, 254, pp. 698-700
Houghton et al. (eds.) [1996]: Houghton, J.T., L.G. Meira Filho, B.A. Callander, N. Harris, A.Kattenberg, and K. Maskell (eds.), Climate Change 1995 – The Science of Climate Change,Cambridge University Press.
Hoyt and Frohlich [1983]: “Atmospheric Transmission at Davos,” Switzerland, 1909-1979,Climatic Change, 5, pp. 61-72.

137
137
Hoyt and Schatten [1997]: Hoyt, D.V. and K.H. Schatten, The Role of the Sun in ClimateChange, Oxford University Press.
IPCC [1992]: Climate Change 1992: The Supplementary Report to the IPCC ScientificAssessment, Houghton et al. (eds.), Cambridge University Press.
Jacoby and Prinn [1994]: “Report #1: Uncertainty in Climate Change Policy Analysis,” MITJoint Program on the Science and Policy of Global Warming.[http://web.mit.edu/globalchange/www/rpt1.html]
Jacoby et al. [1997]: “Report #21: Needed: A Realistic Strategy for Global Warming,” MITJoint Program on the Science and Policy of Global Warming.[http://web.mit.edu/globalchange/www/rpt21.html]
Kattenberg et al. [1996]: Kattenberg, A., F. Giorgi, H. Grassl, G.A. Meehl, J.F.B. Mitchell, R.J.Stouffer, T. Tokioka, A.J. Weaver, and T.M.L. Wigley, “Climate Models – Projections ofFuture Climate,” Chapter 6, Climate Change 1995 – The Science of Climate Change,Houghton, J.T., L.G. Meira Filho, B.A. Callander, N. Harris, A. Kattenberg, and K. Maskell(eds.), Cambridge University Press.
Keeling and Whorf [1994]: Keeling, C.D. and T.P. Whorf, “Atmospheric CO2 Records fromSites in the SIO Air Sampling Network,” Trends ’93: A Compendium of Data on GlobalChange, ORNL/CDIAC-65, Boden, T.A., D.P. Kaiser, R.J. Sepanski, and F.W. Stoss (eds.),Carbon Dioxide Information Analysis Center, Oak Ridge National Laboratory, pp. 16-26.
Kerr [1995]: Kerr, R.A., “A Fickle Sun Could Be Altering Earth’s Climate After All,” Science,269(5224), pg. 633.
Lee [1992]: “Implications of Solar Irradiance Variability upon Long-Term Changes in theEarth’s Atmospheric Temperatures,” Journal of the National Technology Association, 65,pp. 65-71.
Lindzen [1997]: “Global Warming: The Origin and Nature of the Alleged Scientific Consensus,”The Cato Review of Business & Government.[http://www.cato.org/pubs/regulation/reg15n2g.html]
Marland et al. [1994]: Marland, G., R.J. Andres, and T.A. Boden, “Global, Regional, andNational CO2 Emissions,” Trends ’93: A Compendium of Data on Global Change,ORNL/CDIAC-65, Boden, T.A., D.P. Kaiser, R.J. Sepanski, and F.W. Stoss (eds.), CarbonDioxide Information Analysis Center, Oak Ridge National Laboratory, pp. 505-584.
Michaels [1997]: “The Search for an Explanation of the Apparent Lack of Dramatic andDamaging Global Warming,” Proceedings of “Countdown to Kyoto,” Canberra, Australia,19-21 August 1997.
138
138
Michaels and Knappenberger [1996]: “Human Effect on Global Climate?” Nature, 384, pp. 522-523.
Mitchell et al. [1995]: Mitchell, J.F.B., T.C. Johns, J.M. Gregory, and S.F.B. Tett, “ClimateResponse to Increasing Levels of Greenhouse Gases and Sulphate Aerosols,” Nature, 376, pp.501-504.
Neftel et al. [1994]: Neftel, A., H. Fiedli, E. Moor, H. Lötscher, H. Oeschger, U. Siegenthaler,and B. Stauffer, “Historical CO2 Record from the Siple Station Ice Core,” Trends ’93: ACompendium of Data on Global Change, ORNL/CDIAC-65, Boden, T.A., D.P. Kaiser, R.J.Sepanski, and F.W. Stoss (eds.), Carbon Dioxide Information Analysis Center, Oak RidgeNational Laboratory, pp. 11-14.
Nicholls et al. [1996]: N. Nicholls, G.V. Gruza, J. Jouzel, T.R., Karl, L.A. Ogallo, and D.E.Parker, “Observed Climate Variability and Change,” Chapter 3, Climate Change 1995 – TheScience of Climate Change, Houghton, J.T., L.G. Meira Filho, B.A. Callander, N. Harris, A.Kattenberg, and K. Maskell (eds.), Cambridge University Press.
Pielke [1994]: Pielke, R.A., “Don’t Rely on Computer Models to Judge Global Warming,” TheChristian Science Monitor, August 24.
Pielke and Zeng [1994]: Pielke, R.A. and X. Zeng, “Compounding of Uncertainty in ClimateChange Scenarios,” Global Climate Change – Science, Policy, and Mitigation Strategies,C.V. Mathai and G. Stensland (eds.), pp. 393-401, Air & Waste Management Association(A&WMA) International Specialty Conference.
Pielke [1997]: Pielke, R.A., “Theme 1: Role of Land-Cover as a Driving Force for RegionalClimate Change” (personal communication).
Pielke et al. [1997]: Pielke, R.A., G.E. Liston, L. Lu, R.A Pielke, Jr., and R. Avissar, “Land-Atmosphere Hydrology – Heterogeneity and Preliminary Assessment of Feedbacks,”submitted to Journal of Hydrology.
Santer et al. [1996]: Santer, B.D., T.M.L. Wigley, T.P. Barnett, and E. Anyamba, “Detection ofClimate Change and Attribution of Causes,” Chapter 8, Climate Change 1995 – The Scienceof Climate Change, Houghton, J.T., L.G. Meira Filho, B.A. Callander, N. Harris, A.Kattenberg, and K. Maskell (eds.), Cambridge University Press.
Santer et al. [1996a]: “A Search for Human Influence on the Thermal Structure of theAtmosphere,” Nature, 382, pp. 39-45.
Schimel et al. [1996]: Schimel, D., D. Alves, I. Enting, M. Heimann, F. Joos, D. Raynaud, T.Wigley, M. Prather, R. Derwent, D. Ehhalt, P. Fraser, E. Sanhueza, Z. Zhou, P. Jonas, R.Charlson, H. Rodhe, S. Sadasivan, K.P. Shine, Y. Fouquart, V. Ramaswamy, S. Solomon, J.Srinivasan, D. Albritton, I. Isaksen, M. Lal, and D. Wuebbles, “Radiative Forcing of Climate

139
139
Change,” Chapter 2, Climate Change 1995 – The Science of Climate Change, Houghton,J.T., L.G. Meira Filho, B.A. Callander, N. Harris, A. Kattenberg, and K. Maskell (eds.),Cambridge University Press.
Slingo [1990]: Slingo, A., “Sensitivity of the Earth’s Radiation Budget to Changes in LowClouds,” Nature, 343, pp. 49-51.
Spencer and Christy [1990]: “Precise Monitoring of Global Temperature Trends fromSatellites,” Science, 247, pp. 1558-62.
Stern et al. [1984]: Fundamentals of Air Pollution, Academic Press.
Trenberth [1996]: Trenberth, K.E., “Coupled Climate System Modelling,” Chapter 3, ClimateChange: Developing Southern Hemisphere Perspectives, T.W. Giambelluca and A.Henderson-Sellers (eds.), John Wiley & Sons, Inc.
Trenberth [1997]: Trenberth, K.E., “The Use and Abuse of Climate Models,” Nature, 386,pp. 131-133.
Wigley et al. [1996]: Wigley, T.M.L., R. Richels, and J.A. Edmonds, Nature, 379, pp. 240-243
Zannetti, P. [1982]: E' la anidribe carbonica nella atmosfera uno dei futuri maggiori pericoli per l'umanita'? [Is the increase of atmospheric CO2 one of the most serious future problems forthe human beings?]. lnquinamento, 24(3):59-62.

140
140
Figures
In this chapter, I took the liberty of scanning the figures below to provide the readers with usefulinformation on the subject. Full credits are provided for each figure.
Figure 1. Figure 3.3 c, p. 143, Nicholls et al. (1996)
Figure 2. Figure 2.16, p. 117, Schimel et al. (1996)
Figure 3. From p. 497, Boden et al. (1994)
Figure 4. From p. 12, Neftel et al. (1994)
Figure 5. From p. 18, Keeling and Whorf (1994)
Figure 6. Figure 1, Trenberth (1997) – (I apologize for the poor quality of this scanning)
Figure 7. Figure 6.3, p. 297, Kattenberg et al. (1996) - (I apologize for the poor quality of thisscanning)
Figure 8. Figure 12, p. 29, Houghton et al. (1996) - (I apologize for the poor quality of thisscanning)
Figure 9. Figure 5, p. 23, Houghton et al. (1996)
Figure 10. Figure 6.24, p. 323, Kattenberg et al. (1996)
Figure 11. Figure 20, p. 40, Houghton et al. (1996)
Figure 12. Figure 25, p. 45, Houghton et al. (1996)
Figure 13. Figure 7, p. 25, Houghton et al. (1996)
Figure 14. Figure 5.11, Hoyt and Schatten, 1997 (from Lee 1992, p. 121)
Figure 15. a) Figure 10.21, p. 196, Hoyt and Schatten (1997). b) Figure 10.13, p. 186, Hoytand Schatten (1997) (from Friis-Christensen and Lassen, 1991)
Figure 16. From Kerr 1995
Figure 17. Figure, p. 50, Newsweek, October 20, 1997
Figure 18. From p. 507, Marland et al. (1994)
Figure 19. From p. 541, Marland et al. (1994)
141
141
Figure 20. From p. 550, Marland et al. (1994)
Figure 21. From p. 568, Marland et al. (1994)
Figure 22. From p. 560, Marland et al. (1994)
Figure 23. Figure 2.2, p. 81, Schimel et al. (1996)
Figure 24. Figure 5, Christy (1997)
Figure 25. Figure 11.3, p. 211, Hoyt and Schatten (1997), [Hoyt and Frohlich 1983]
Figure 26. Figure 2, Mitchell et al. (1995)
Figure 27. Figure 5, Michaels (1997)