toeholds, bid premiums and bid success in public takeovers
TRANSCRIPT

School of Economics and Management
Department of Business Administration
FEKN90
Business Administration Degree Project Master of Science in Business and Economics
Spring term of 2013
Toeholds, bid premiums and bid success in public
takeovers, Sweden 1997-2012
Authors: Olle Davidsson
Fredrik Oddbjörn
Supervisor: Lars Oxelheim
Abstract
This thesis focuses on public takeovers and aim to disclose the revealing effects
on a bid contest caused by a bidder’s initial ownership in the target company, the
so-called toehold. We analyse the toehold’s impact on contest characteristics and
focus on its ability to determine (i) the bid premium required to acquire the target
and (ii) the expected probability of a successful outcome in the bid contest.
We apply financial theory to outline bidding behaviour as well as observable
dynamics in a takeover contest with toehold bidders. We include a discussion on
the competitive climate in a takeover contest in relation to the different toehold
strategies available. Theories have historically been inconclusive on the direct
effects of a toehold in a takeover contest. We argue that findings evident in
research on the US markets could not singlehandedly explain the results for any
given country and shareholder structure. Takeover contests are complex processes
and the regulatory framework and shareholder structure in which the target
operates could have a major influence on the result. By using quantitative
methods, we therefore challenge current theoretical relationships on a sample of
202 takeovers attempts of publicly listed firms in Sweden in the period 1997-
2012, a market known for a focused shareholder structure and strict disclosure of
holdings.
The results shown in the thesis indicate a clear relationship and invigorate for
new considerations on the subject. We provide firm evidence that toehold bidders
have systematically acquired firms at a lower premium in relation to non-toehold
bidders. In addition, even though the target is bought at a lower premium, toehold
bidders have shown indications to have a higher probability to succeed in their
takeover attempts. This perplex finding is discussed and it seems that deterring
effects on rival bidders entrance is of high importance. Furthermore, the finding
encourages an assessment of the historically evolved Swedish conditions for
ownership in relation to the proposed inefficiency in the market for corporate
control.
Key words: Public Takeover, Toehold, Bid Premium, Bid Success, Sweden
Words: 21,066

Table of contents
1 Acknowledgements ................................................................................................... 1
2 Introduction ............................................................................................................... 2
2.1 Organization of the thesis .................................................................................... 3
3 Terminology .............................................................................................................. 4
3.1 Takeovers ............................................................................................................. 4
3.2 Hostile and friendly takeovers ............................................................................. 4
3.3 Toehold ................................................................................................................ 5
4 Regulatory framework ............................................................................................. 6
4.1 Evolution of the Swedish ownership model ........................................................ 6
4.2 Swedish takeover regulations .............................................................................. 7 4.2.1 The British influences ................................................................................... 8 4.2.2 The mandatory bid principle ......................................................................... 9 4.2.3 Disclosure rules........................................................................................... 10
4.3 An international perspective .............................................................................. 11
5 Theoretical framework ........................................................................................... 13
5.1 Bidder benefits of toeholds in takeovers ............................................................ 13 5.1.1 Reduced complication of free-riding shareholders ..................................... 13 5.1.2 Toeholds enable overbidding ...................................................................... 14 5.1.3 Aggressive toehold bidding – a win win situation? .................................... 15 5.1.4 Deterring effect on rival bidders ................................................................. 15
5.2 Limitations of toeholds in takeovers .................................................................. 16 5.2.1 Information disclosure and price run-ups ................................................... 18 5.2.2 Market liquidity .......................................................................................... 19 5.2.3 Alternative explanations ............................................................................. 20
6 Hypotheses ............................................................................................................... 22
7 Method ..................................................................................................................... 23
7.1 Data collection ................................................................................................... 23
7.2 Data sampling .................................................................................................... 24
7.3 Data processing .................................................................................................. 26 7.3.1 Toehold ....................................................................................................... 26 7.3.2 Contest winner ............................................................................................ 26 7.3.3 Hostility ...................................................................................................... 27
7.4 Regression models ............................................................................................. 28 7.4.1 Bid premium regression .............................................................................. 28 7.4.2 Robustness of premium regression ............................................................. 29 7.4.3 Probability of success regression ................................................................ 29

7.4.4 Robustness of probability of success regression......................................... 29
8 Empirical findings ................................................................................................... 30
8.1 Description of dataset ........................................................................................ 30
8.2 Regression results .............................................................................................. 37 8.2.1 Bid premium ............................................................................................... 37 8.2.2 Probability of success ................................................................................. 39
9 Conclusion ............................................................................................................... 42
9.1 Summary and discussion ................................................................................... 42
9.2 Suggestion for future research ........................................................................... 45
10 Appendix ................................................................................................................ 47
10.1 Correlation matrix of regression variables ....................................................... 47
10.2 List of Swedish public takeovers, 1997-2012 .................................................. 47
11 References .............................................................................................................. 52
1
1 Acknowledgements
First and foremost, sincere thanks to our supervisor Lars Oxelheim for inspiring
discussions and input to our thesis. To all concerned parties, we greatly appreciate
all the support we have got throughout this process.
Olle Davidsson and Fredrik Oddbjörn
Lund, Sweden, 16 May 2013

2
2 Introduction
In this thesis, we focus on public takeovers and a bidder’s initial ownership in the
target company at the time of a bid’s announcement, the so-called toehold. The
focus is to reveal toeholds impact on the bid premium and the expected
probability to win the bid contest. The topic has previously been addressed among
researchers with inconclusive predictions on the theoretical effects of the bid
contest. In addition, it appears that shareholder structure and regulations in
relation to public takeovers across countries has not been accounted for. This
study, performed on the Swedish market for public takeovers, could hence
provide improved knowledge for academics, practitioners and regulators of the
relationships in a country with strict takeover regulations and a focused ownership
structure.
Two variables of specific importance will be addressed in the following
chapters, the bid premium and the probability of a successful outcome for the
initial bidder. In more detail, the bidder in a takeover is most often required to
offer the tendering shareholders a price higher than the current unaffected share
price for a takeover to succeed, a bid premium. This bid premium needs to
compensate the current shareholders for not being able to take part in any future
value enhancement (Haleblian, Devers, McNamara, Carpenter & Davison, 2009).
Prior research has attempted to determine the effects of toeholds on the bid
premium in takeover attempts. Several articles have been performed on takeover
contests on US data samples with contradicting theories about a toehold’s impact
on the bid premiums. Among those who argue for a positive relationship are
Chowdry & Jegadeesh (1994) while Betton & Eckbo (2000) together with
Hirshleifer and Titman (1990) and Shleifer & Vishny (1986) claim the opposite
relationship. One common explanation of the lower premium found in Betton,
Eckbo & Thorburn (2009) is the deterring effect on rival bidders entry caused by a
toehold of the initial bidder. Their findings support that a toehold increases one’s
probability to win the contest, lower the threat of a rival bidder and in those cases
a rival bidder enters the contest, it enters with an equally large toehold.
The toehold acquisition could hence come with some benefits to the bidder. If
the purchase was part of a short-term strategy before announcing a bid on the
target company, it would be preferred to purchase the toehold to an unaffected
share price. However, it is common that other investors anticipate an upcoming
bid when the acquirer has started his stake building. When investors begin to take
positions in the stock to gain from a potential value increase, they put an upward
pressure on the share price and create a run-up effect. This effect is one of the
risks and costs of acquiring a toehold.
So, why would Sweden be an appropriate object to study for these
relationships? In relation to prior studies made on the US market, the Swedish
3
market is justified to test empirically from a number of reasons. First, stricter
regulations on disclosure of company holdings in Sweden could increase the
markets perceived probability of an upcoming bid. This would lead to higher costs
of acquiring the toehold in the form of higher run-up costs and information
disclosure (Jarrell and Poulsen, 1989; King and Padalko, 2005; Schwert, 1996).
Second, the shareholder structure in Sweden is historically made up of large
controlling owners allowed to utilize controlling power through a system of dual-
voting rights and pyramidal ownership. The ownership structure that this has
facilitated is in stark contrast to the more dispersed structure evident
internationally as in the example of US.
Given these two structural deviations, we attempt to challenge the current
empirical discoveries obtained from research on the US market and test them on
the Swedish market. This study therefore aims to clarify the strategic impact of
toeholds on bid premiums and the probability of success in a Swedish public
takeover setting. We intend to provide vital knowledge to structural perceptions
an acquirer must assess before initiating a public takeover contest in Sweden. A
number of relevant questions will hence be examined in this thesis: What would
an acquirer have to pay in a Swedish public takeover in terms of bid premium?
What impact does a toehold have on the premium? Would an initial holding affect
the probability of success in the bid contest? In what way does a toehold affect the
competitive environment in a bid contest? Is the toehold decision affected by an
anticipated dismissal of the offer from the target’s board of directors?
2.1 Organization of the thesis
The thesis proceeds as follows:
Chapter 3 introduces the reader to the essential terminology to enhance the
understanding of the study in relation to takeovers, hostility and toeholds.
Chapter 4 presents the regulatory framework for a public takeover in a
Swedish setting. Regulatory- and shareholder structures are covered as a frame of
reference, later compared to international structures in UK and US.
Chapter 5 develops a theoretical foundation and discusses prior
inconclusiveness of toehold relationships as well as potential benefits and
limitations of toeholds in a public takeover
Chapter 6 outlines the tendencies among prior research and presents the two
hypotheses for this study
Chapter 7 constitutes the methodological chapter, outlining the quantitative
methods used in the study as well as data collection, sampling and adequate
adjustments of information
Chapter 8 consists of data description, analysis of patterns within the dataset
and observations of possible relationships among bid contest characteristics
Chapter 9 conclude and discuss the findings of this thesis, the two hypotheses
are analysed and suggestion for future research is provided
4
3 Terminology
This chapter will introduce the reader to the necessary terminology required to
fully understand this thesis. The below terms will play a central part and will be
explained in general terms in this chapter. The reader can then expect to
continuously enhance the understanding of the terms while reading this thesis, as
they will be used extensively.
3.1 Takeovers
The main objective for this thesis is focused on corporate acquisitions. The
structure of a corporate acquisition process is dependent on whether the target in
question is privately held or publicly listed. The typical way of purchasing a
privately owned company is through negotiations with the target company’s
owners or the board of directors (Betton, Eckbo & Thorburn, 2008c). During the
process a mutual agreement can be reached between the involved parties and there
are no requirements on announcing the bid publicly. The structure of a takeover
process differs slightly when the target is a publicly listed firm. Discussions and
negotiations can still have been held with the target’s owners or management
before a purchase attempt is made. However, the bidder is required to publicly
announce a legally binding takeover offer when he approaches the target
shareholder with a request to acquire the outstanding shares in the company. A
takeover offer is hence the term used when a bidder company makes an offer to
acquire the voting shares of an exchange listed target company. (Betton et al.,
2008c)
Therefore, the term takeover in this thesis is used to describe a corporate
acquisition of a firm that is publicly listed on a stock exchange. A takeover
attempt is the term used when a bidder firm announces a public takeover offer
directed to the target shareholders with a request to purchase all outstanding
shares.
3.2 Hostile and friendly takeovers
A public takeover could be divided into two sub-types, as being considered
friendly or hostile. Central to the definition is the target's board of director’s
action in relation to an incoming bid. As will be elaborated on in chapter 4, the

5
board of directors need to evaluate the announced takeover bid and present a
recommendation to their shareholder regarding whether to reject or accept the bid
(NasdaqOMX 2012).
The definition of what is considered a hostile bid varies widely between
different authors. A central reason behind this is that the central stakeholders, like
the target management, the board of directors and the shareholders, often have
different views on the assessment of a bid. For example, in his (2000) paper,
Schwert uses five mutually not exclusive definitions to determine hostility in a
takeover attempts and includes disclosed intent of an non-negotiated bid as well as
potential rumours in the market about an unsolicited bid coming up to more
objective definitions. Others, like Auerbach (1988) agree on a broader view and
define hostility through a combination of using different definitions.
In our thesis, we will use a less subjective definition that is commonly used in
academic articles. We will classify a bid as hostile when the board of directors of
the target company does not recommend its shareholders to accept the initial bid
(Betton et al., 2009; Schoenberg & Thornton, 2006; Schwert, 2000). In other
words, to classify the bid as hostile a physical action from the board of directors is
required. Accordingly, a bid is considered as friendly if not explicitly expressed
otherwise by the target board of directors.
3.3 Toehold
A central factor in this thesis is the bidder’s ownership of votes in the target
company. Before the bidder initiate the takeover process, he is legally allowed to
stakebuild the ownership. By acquiring shares on the open market before the
takeover offer is announced, this reduces the amount of shares that are required to
be purchased at a premium. Differently put, shares can be purchased ex-ante the
bid in order to have a target ownership when the bidder approaches other
shareholders for the remaining shares. This ownership position in a takeover
process is called a toehold (Betton & Eckbo, 2000; Ravid & Spiegel, 1999).
A toehold position can either be categorised as long term or short term
dependent on when the position was acquired. If the target shares were held prior
to six months before the bid was announced, it is considered to be a long-term
toehold. This is usually the case for large controlling shareholders that have had
ownership in the firm over several years. If the shares instead have been acquired
during the six months leading up to the bid, the toehold position is defined as
short term (Betton et al., 2009).
The different motives and implications of acquiring a toehold, as well as a
more thorough presentation of the theory on the subject, will be further presented
in chapter 5 of this thesis.

6
4 Regulatory framework
This chapter elaborates on the evolution of the Swedish shareholder structure and
relates the evolving structure to international comparable, mainly UK and US.
With understanding of the social development, one could more easily interpret
conditions in the Swedish market for corporate control. The role of the market for
corporate control is hence interpreted as to transfer resources to the person who
values them the most, stated differently as to facilitate a change in control (Skog,
1997). To this, the British influenced model for Swedish takeover regulations is
presented and two specific areas of importance are highlighted; the mandatory bid
principle and the disclosure thresholds.
4.1 Evolution of the Swedish ownership model
The early 1900s in Sweden was a period of focused industrial ownership, where
two men played an important role in the scope of this chapter; Marcus Wallenberg
Sr. (1864-1943) and Ivar Kreuger (1880-1932). As a large shareholder, Marcus
Wallenberg Sr. sought to control the management activities in a number of his
listed companies without actively managing the company himself. By segregating
the board from the management, the result was to form the Swedish model of
three independent organs; Shareholders, Board of Directors and Management. The
result was a clear separation of responsibilities between the shareholders, the
board of directors and the executive management. Ivar Kreuger on the other hand,
with his international conglomerate Swedish Match, introduced shares with
different voting rights. His motivation was to warrant control to Swedish investors
when he looked to London for raising capital to his listed companies. The dual
class shares enable shareholders of the stronger voting power class more control
of the company in relation to its capital invested compared to shareholders of the
weaker class. These two conditions would come to influence the scene for any
company active in mergers and acquisition in Sweden and could be argued to
have led to (i) a significant blockholder structure and (ii) the frequent use of
shares with multiple voting rights in Swedish listed companies (Nachemson-
Ekwall, 2012).
The evolution could not be explained singlehandedly by formal events; also
informal and socio-political factors have played an important role in the
emergence of controlling shareholders. To name some, first the banks and their
fully owned investment companies has historically had a close relationship to the
firms’ management compared to other shareholders since they emerged as
controlling owners of many industries in the financial crisis in 1920s

7
(Nachemson-Ekwall, 2012). Second, there has been a political support for
blockholdings facilitated by the dual voting rights and pyramidal ownership.
Angblad, Berglöf, Högfeldt & Svancar (2002) supports this result and claim that
there are two structural drivers that are allowed to be used in combination in
Sweden, the pyramidal ownership of closed end funds such as Investor and
Industrivärlden in combination with different voting rights. In the early 1990s,
these two groups controlled more than 50% of the market capitalisation on the
Stockholm Stock Exchange, but only two 2% of the dividend rights (Henrekson &
Jacobsson, 2012). Högfeldt (2004) describes the situation in a way that the
existing structure has politically been traded off by an indirect (direct) promise
from the largest firms to invest in Sweden and not migrate. The essence and
purpose of dual-voting rights could hence be seen as a tool in line with the Social
Democratic model of corporate ownership and thus Swedish interests where
promoted by the structure.
Moreover, the Swedish tax system has facilitated the emergence of
blockholders. A progressive personal income tax and the taxation of dividends
both at a corporate level and trough personal taxation on capital gains has drained
private owners historically in favour of corporate owners such as the investment
companies (Nachemson-Ekwall, 2012). It is noticeable that the emergence of the
blockholder structure is argued to have facilitated sell-outs in Sweden. A change
of control in this blockholder structure is difficult without the consent of the
controlling party. If a controlling owner decides to sell his block through a block
transfer or as a part of a takeover, the offer is more likely to succeed (Angblad et
al., 2001).
If then discussing the use of dual class voting rights in specific, the effects in
control concentration are high when comparing Sweden to other countries. A
study made by La Porta, Lopez-De-Silanes & Shleifer (1999) calculate the Vote
to Capital (V/C) ratio for 20 largest firms in 27 countries and conclude that
Sweden has the highest ratio of all with a V/C-ratio of 1.58. Angblad et al. (2002)
strongly argues that the main driver or the high V/C-ratio for Sweden is a result of
the widely used multiple voting right shares. In the mid 90s, over 85% of all
Swedish listed firms used the dual shares approach. In 2010, this had decreased
but still amounted to 50% (Henrekson & Jacobsson, 2012). What is important is
how this could affect the takeover setting later analysed in this paper. The
presence of different voting rights can ease the negotiation with target
shareholders of large blocks and simultaneously reduce the attractiveness of the
remaining shares. In addition, dual-voting rights could reduce the free-rider
problem of widely held firms and hence promote takeover activity in case of a
single bidder (Burkart & Lee, 2008).
4.2 Swedish takeover regulations
To begin, the rules for takeovers generally emanate from on the one hand the
takeover regulations, originated from civil law regulations for listed companies,

8
and on the other hand capital market regulations on liquidity and trading rights for
financial instruments (Nachemson-Ekwall, 2012). We will look at how the British
Takeover Code has inspired Swedish regulations and reflect on two dimensions
affecting our later research; the mandatory bid principle (MBR) and the
disclosure thresholds.
4.2.1 The British influences
Regulations of Swedish takeovers are often referred to as a combination of British
common law and Swedish civil law (Nachemson-Ekwall, 2012). The most
influential regulation on which Sweden has resembled upon is the British City
Code on Takeovers and Mergers, which was first released in the 1950s. One of
the fundamentals was that shareholders were given enough information about an
offer to make an intelligent decision and enough time to digest it. From that point,
shareholder primacy and board neutrality was established. Shareholder primacy
claims that shareholders interests would be assigned first priority while board
neutrality state that no actions would be taken by the board to frustrate a bid
unless it had been previously authorized at target’s general meeting (Nachemson-
Ekwall, 2012).
The UK system was formed using a combination of legislation and self-
regulation. The self-regulatory body of the Panel of Takeovers and Mergers was
established in 1968 with the purpose to issue and administer the Code and to
supervise and regulate takeovers. Sweden chose to adapt the same model.
Consequently, in the very same year the self-regulatory body of the Commerce
Stock Exchange Committee (Sw: “Näringslivets Börskommitté”, NBK) was
founded with a purpose to promote good practises on the Swedish stock market.
Their first recommendations came in 1971 and were formed based on the UK
Takeover Code. Two guiding principles were made central; (i) Enable
shareholders properly evaluate a bid and (ii) secure equal treatment of
shareholders of same shareholder class. Since 1986 up until today, there is a
second more independent body in Sweden, The Swedish Securities Council (Sw :
”Aktiemarknadsnämnden”). This body administer the rules issued by NBK and
deal with individual cases of compliance against regulations. The separation
between the two bodies was somewhat misleading; as the suggestion of directors
were done by the same organizations and that there has been a personnel union
between the two (Nachemson-Ekwall, 2012).
The two models share many similarities. One difference though that could be
stressed between the NBK and the Takeover panel was in the individuals who
were able to get a seat into the committees. While NBK included only
representatives from the private sector, both politicians and members of the
industry were included in the British Takeover panel. It was also said that NBK
had more power than its comparison. With the mandate to dictate the rules and
pricing mechanisms of takeovers, these two factors could have influenced the
direction in favour of the large blockholders in Sweden (Nachemson-Ekwall,
2012).

9
4.2.2 The mandatory bid principle
Only two years after the creation of the UK Takeover Panels in 1968, the
Mandatory Bid Principle (MBR) was introduced and has almost been left
unchanged since. The principle states that in the event of an emerging controlling
shareholder of more than 30% of the shares, a bid has to be made on all remaining
shares in the company. Minority shareholders would then get the right to sell their
shares to the same price as had been paid previously. In effect, the policy made it
more costly to acquire the company and supported management of the target
company who was confronted with a takeover attempt (Nachemson-Ekwall,
2012).
In Sweden, NBK, chose not to implement MBR at the time. Their rationale
was that it was regarded as in conflict with the blockholder governance structure
on the Swedish stock market. It was argued that the MBR would hinder the
restructuring of the corporate sector, as it would be harder to sell large block of
shares at a premium. The policy was left out until 1999 when MBR was
introduced, though still with some opposition. In contrast to the threshold of 30%
set in most European countries at the time, NBK set the controlling threshold at
40%. In addition, a shareholder already in control of 40% of the stocks or votes at
the time of the introduction would be excluded (Nachemson-Ekwall, 2012). The
position of large blockholder was hence not challenged and the introduction of the
MBR would not enforce them to dispose, neither acquires new fractions to their
large position. Nachemson-Ekwall (2012) further address that the introduction
was seen as positive from a minority shareholder’s perspective. The institutional
investors, often in control of B-shares, thought they would increase in value. This
addressed the issue of low valuations of low voting right shares. A common
practise of 10% price difference between A and B shares was decided if noting
else was agreed.
In 2003, MBR was amended to a 30% threshold to align Sweden with most
other European countries. Shareholders with a controlling stake of 40% as of 1
July 1999 were still to be excluded. Another significant difference was that three
representatives from institutional investors were to be included in the NBK board,
prior only consisting of representatives from the industrial sector alone. This was
a clear move away from the ability for the large blockholders to dictate the
structure and price of a takeovers to instead strengthen the role of minority
shareholders, often institutional investors (Nachemson-Ekwall, 2012). To our
interpretation, the dealing with the MBR is a clear example on the ability for large
shareholders to dictate the rules for the Swedish takeover market. By first
avoiding the introduction and then permitting large shareholders exception from
the newly introduced regulations, large shareholders interests has been assigned
first priority, sometimes on the expense of small shareholders realisation of gains
by allowing for more dynamics in the change of control.
10
4.2.3 Disclosure rules
The disclosure rules state that a shareholder is obliged to inform the market if his
holding in a company meets or passes any of the pre-defined thresholds
independent of the direction of the change. In Sweden, the thresholds are 5, 10,
15, 20, 25, 30, 50, 66 2/3 and 90% of the votes or number of shares in the
company (SFS 1991:980).
In UK, a company that hold or cease to hold 3% of the target shares has to
inform the market of this. In addition, each 1% above this 3% that is reached,
passed or fallen below has to be reported (Herbert Smith LLP, Gleiss Lutz and
Stibbe, 2010). In contrast to Sweden and UK, the US rules require a shareholder
to disclose a change of ownership if the purchases mean he penetrates the 5%
level of control in the firm (US Securities and Exchange Commission, 2013). US
firms have to register its intention with the holding, no such equivalent is found
either in UK or Sweden (Nachemson-Ekwall, 2012).
Differences in disclosure rules could have an impact on the takeover setting
and thus the market for corporate control. Siems & Schouten (2009) states that
higher disclosure help bidders to estimate the likelihood that their offer will
succeed and identify parties who could be approached for different strategic
reasons. In addition, the transparency enables other potential bidders to
materialize an offer if they are alerted of a third parties stakebuilding in the target.
On the other hand, a high level of ownership disclosure could negatively affect
the market for corporate control by several potential reasons. First, higher
disclosure could deter a bidder from a takeover attempt in the first place, as they
fear that possible competition would reduce its potential profits. Second,
disclosure of this type could alert management to take on defensive actions to
fence of any potential bidders and thus limit an effective market for corporate
control (Siems & Schouten, 2009). Third, an initial bidder incurs search cost when
attempting to identify a potential target. These search costs are part of the total
profit that the bidder will generate from a potential purchase, and will therefore
affect the offer price he is able to pay. When a target is found and the bidder
discloses his toehold purchase, the potential target is revealed to all other potential
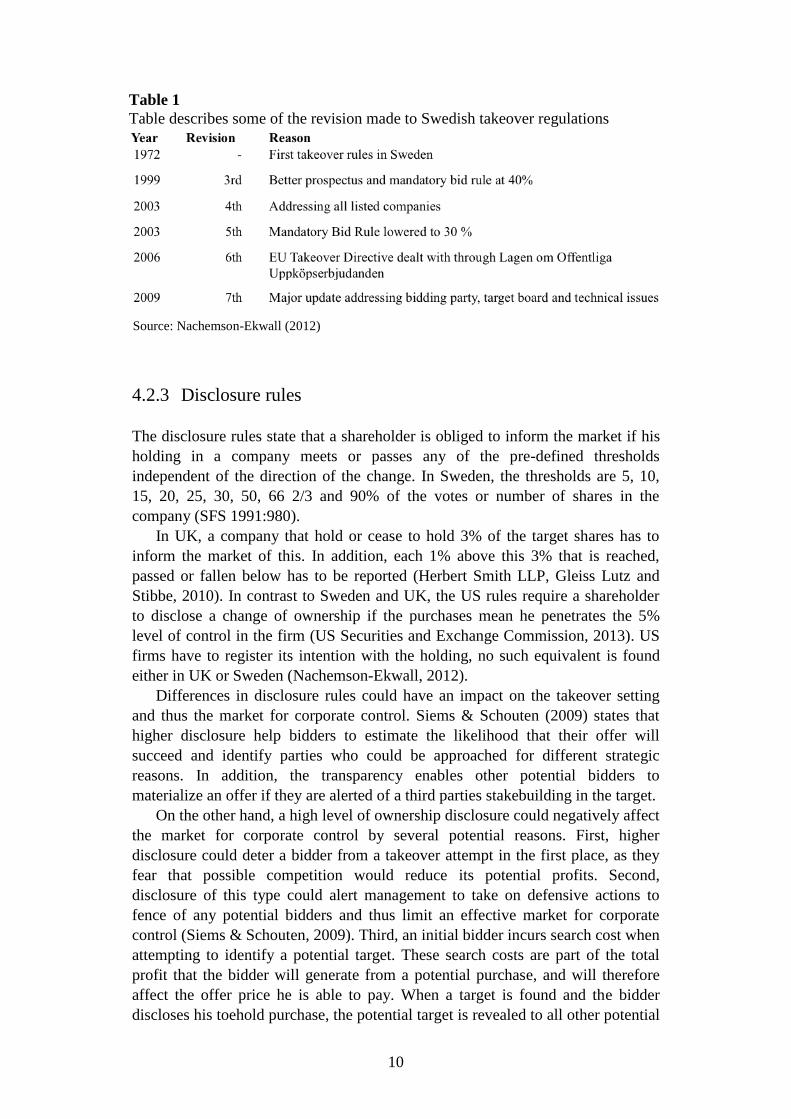
Table 1
Table describes some of the revision made to Swedish takeover regulations
Source: Nachemson-Ekwall (2012)

11
rival bidders. These bidders can free-ride on the search costs incurred by the
initial bidder and benefit from the target screening, allowing them to pay a higher
price than what would be possible for the first bidder (Bainbridge, 2008). This
potential to free-ride on other bidders can be counterproductive for the takeover
activity.
The most important element is though how these regulations impact the
possible actions for an investor. The US regulation allows for some levels of
investor exploitation of the rules, while the Swedish regulations are stricter. The
Swedish Finansinspektionen requires the investor who penetrates a disclosure
level to act fast. The investor needs to notify Finansinspektionen at latest the day
after the purchase has been made. Moreover, Finansinspektionen will announce
the change of ownership information to the market before noon the day after the
message was received (SFS 1991:980). The regulation that is in place in US
allows the investor more discretion. After a purchase is made that breaches the 5%
level the investor is allowed 10 days before they are required to file the 13d form
to disclose their holdings. During this period the investor is allowed to continue
purchasing shares in the market, which can be done without notifying the market
before ten days have passed since the initial penetration. This rule allows the
investor to accumulate a shareholding and stakebuild his ownership during the 10-
day window (Asquith & Kiescnick, 1999). A common takeover tactic is to
purchase 4.9% in the market and keep the ownership at that level until everything
for the takeover is prepared. Once the bidder is fully prepared to launch the bid,
he will purchase shares in the market to penetrate the 5% level, trigger the 10-day
window and buy aggressively once triggered. Once the 10-day window closes, the
disclosure form will be announced to the market together with the takeover offer
(Bainbridge, 2008). This enables investors looking at US targets to stakebuild
large ownerships unnoticed and use a guerrilla tactic, while an investor on the
Swedish market is unable to make such purchases below the radar and utilize such
tactic.
4.3 An international perspective
Up until now we have been introduced to the evolution of the Swedish ownership
model and some regulatory differences among countries related to a takeover.
Ultimately when later analysing the empirical findings related to the Swedish
market for corporate control, we could build on this knowledge to bring depth and
possible explanations to our results. A general perspective can now be made of
Sweden in an international public takeovers setting.
To begin, the strong focus of family ownership in Sweden is very high
compared to both UK and US. While the control of the 20 largest firms in the mid
90s was widely held in both UK and US, family’s and state controlled a
significant share of the largest Swedish firms (La Porta et al., 1999). Angblad et
al. (2002) maps 304 Swedish listed firms by type of controlling owner according
to the identity of the investor holding the largest fraction of votes. The study is

12
performed in the early stage of our analysed period, yet the results are significant.
For the full sample, 61.8% of the firms have a family/private owner, such as the
Wallenberg’s, as the single largest owner. If we narrow the sample to the 20
largest firms by market cap, the figure amounts to 50%. The second and third
largest owners for the full sample are other interest spheres (10.2%), such as
Industrivärlden, and foreign owners (8.6%).
Moreover, to us the difference in ownership structure is also interrelated to the
view of corporate control and regulations among Sweden, US and UK. Several
sources for change has effected the direction of rules historically, and
simultaneously encouraged different shareholder structures. First, country specific
events such as the Great Depression and Enron Crash in the US or the Kreuger
Crash in Sweden has driven reactions in the regulations, for example the Swedish
separation of investment companies and banks by law. Second, the growth of
institutional investors began earlier in UK than in US leading to the involving of
market actors in forming the regulations in UK in contrast to the legal track in US.
The choice of self-regulation and legislation distributes power among different
actors on the market. Board neutrality rule, makes the large influential
shareholders rather than management the ultimate decision makers during a bid
process. In US, takeover regulations has granted the target’s management with
more bargaining power to counteract a bid. The risk is therefore that a US bidder
end up paying a higher price than in a UK takeover. Only UK regulations have an
expressed disfavouring of controlling shareholders in certain situations. As an
example, shareholders in control of over 10% of the votes are not able to vote at
the general meeting in a parent-subsidiary merger. The acquirer would not be able
to merge the target into its own without the consent of a super-majority of the
other minority shareholders, which could imply a lower interest in controlling a
British publicly listed company. No such discrimination is found neither in US
nor Swedish regulations. It could be noted though that ordinary shareholders
inability to nominate candidates to the board of directors in US also makes it less
attractive to become a large shareholder compared to Sweden (Nachemson-
Ekwall, 2012).
To conclude, in order to understand the observations in the existence and size
of toeholds in each country we have to study the corresponding view on corporate
governance and takeover regulation. While UK has some regulations that
disfavour blockholding, US have no such expressed preference. It could be noted
though that the strong minority protection and power put in the hands of
management in US could explain a more dispersed ownership structure in line
with UK. It is more evident however that Sweden systematically has been in
favour to facilitate blockholdings in stark contrast to the other two mentioned.
With this knowledge in mind, it puts us in a position to analyse what previous
research can say about the relationship between toeholds and bid premiums in a
potential takeover.

13
5 Theoretical framework
The available literature on toeholds and bid premiums is indecisive of whether a
toehold would imply a higher or lower premium in a takeover situation. For
example, Hirshleifer & Titman (1990), Harrington & Prokop (1993) and Burkart
(1995) claims that owning a toehold leads to a higher ability to pay high
premiums, or overbid, partly since the toehold gives the bidder a lower average
price for the shares acquired in the takeover. This is inconsistent with Betton et
al. (2009) and Shleifer & Vishny (1986) who argue that toeholds are associated
with lower offer premiums in winning bids due to deterring effect on competition
and reduced issues with free-riding shareholders. In addition, Betton & Eckbo
(2000) claim that toeholds increase the probability of a successful takeover,
consistent with Grossman & Hart (1980), Walkling (1985) Hirshleifer & Titman
(1990), and Eckbo & Langohr (1989). To conclude, this chapter will examine
different aspects of toeholds and present the inconclusiveness of its effects among
researchers in the field. After we have presented some of the, of us defined,
benefits of toeholds they will be contrasted with some of the perceived
limitations.
5.1 Bidder benefits of toeholds in takeovers
The following section will discuss historical theories as well as the current state of
knowledge in relation to toeholds effect on bid premiums and probability of
success in takeovers. In order to provide a structure to this chapter, these will be
discussed in terms of benefits and limitations for the toehold bidder. A benefit is
by us seen as an ability to behave in a certain manner conditional on possessing a
toehold. We therefore see the size of the bid premium as a result of these
additional alternatives of action and do not assess a high or low premium as good
or bad. Such a label only assesses an isolated variable and does not account for
long-term effects in terms of profitability among others. In similar, the later
discussed limitations are aspects that affect the characteristics of a takeover
contest where the initial bidder possess or attempt to stakebuild share prior to the
offer announcement.
5.1.1 Reduced complication of free-riding shareholders
To begin with the benefits, Grossman & Hart conducted one of the first and most
cited papers in the field in 1980 on acquisitions with toeholds. They considered a

14
takeover model where the target was owned by small atomistic shareholders who
all faced the decision to accept the takeover bid or retain their shares. Each
shareholders individual decision would not impact the probability for the offer to
succeed; the offer would still be able to go through. Selling shareholders that
settled for the bid premium hence expose themselves to a risk that this might be
lower than the post-takeover value of their shares. For each shareholder, it
therefore seemed rational to “free-ride” on her fellow shareholders to tender. The
consequences of this framework are noticeable. First, the acquirer has to offer the
full added value per share for the offer to succeed, often referred to as the free-
rider condition for a successful offer. Second, the bidder has no incentive to incur
the search and bid costs, as they will not be covered by a successful bid. If the
free-rider condition would hold no takeovers would be made (Grossman & Hart,
1980).
Therefore, bidding with a toehold would solve this problem proposed by
Grossman & Hart (1980). From the already owned shares, a bidder would now
take part in the post-acquisition value from the already owned shares. The gain on
this strategy had to be large enough to cover the search and bid expenses. The
observation would hence increase the probability of successful offer by allowing a
bidder to gain on the toehold while making zero profit of the share in the formal
takeover offer (Eckbo, 2009; Grossman & Hart, 1980).
The above model does not account for blockholders in the target company.
This was to be addressed in the free-riding model presented by Shleifer & Vishny
(1986), also discussed in Eckbo (2009). The ownership structure now differed
from the Grossman & Hart (1980) framework, as did the behaviour of the target
shareholders. A large blockholder in the target company now affected the decision
rule for each small shareholder. The author argued that a blockholder’s decision to
sell or retain affects the probability that the offer will succeed, anticipated by the
small shareholders. In Eckbo (2009), small shareholders took the blockholder’s
expected actions into account and viewed a completion of the offer as more likely.
As a result, they would be willing to tender at a lower price than the full value
added as in Grossman & Hart (1980). By taking this view and adapt it to a
Swedish setting with a focused ownership, a blockholder that initiates a bid would
be able to pay a lower premium and reach a higher probability of success in the
offer.
5.1.2 Toeholds enable overbidding
The models of Grossman & Hart (1980) and Shleifer & Vishny (1986) do not
include the aspect that some transactions fail. To include this aspect, Hirshleifer &
Titman (1990) created a model to determine the relationship between initial
holdings and probability of winning based on rational bidders who bid according
to their individual value improvements of the takeover. The costs of a failed bid
was related to the alternative cost to the bidder, a bidder with a higher initial
holding hence faced a higher incentive to bid high relative a low-valuation bidder.
Since the higher premium level and probability of success was related according

15
to the author; the low initial holding bidder would have a lower probability to win
the auction. Accordingly, the probability to win was therefore higher for the
toehold bidder. The predictions of higher success were therefore consistent with
prior research by Walkling (1985) and Shleifer & Vishny (1986). Similar findings
were also evident in Bris (2002) where additional variables for stock liquidity and
information disclosure were considered.
5.1.3 Aggressive toehold bidding – a win win situation?
If bidding high enabled through initial ownership, does it then promote an
aggressive bidding behaviour? Loyola (2012) presents an intuitive argumentation
on two reasons to why a toehold bidder could bid more aggressively. First, a
toehold bidder can profit both from winning the auction and by losing to a rival
bidder. Conditional on losing, it transforms the toehold bidder into a seller who
sells their toehold to the winning bidder and hence gains on a more aggressive
bidding behaviour. Every bid therefore also represent an ask on its own holdings,
consistent with argument in Carroll & Griffith (2010). Second, conditional on
winning, the toehold bidder has a lower costs of overbidding since a lower
number of shares have to be acquired relative a non-toehold bidder consistent with
Hirshleifer & Titman (1990), Bulow, Huang & Klemperer (1999), Dasgupta &
Tsui (2000), Shleifer & Vishny (1986), Betton et al. (2009) and Loyola (2012).
The argument that a toehold bidder is able to bid in excess of his valuation is
also indicated in Burkart (1995). In the context, the author argued that it was
always optimal to bid over ones valuation of the target and that a bidder should
strive for a maximum toehold. With this view, the bid could sometimes lead to a
net-loss in the transaction with much of the profits accrued to selling shareholders.
However, this was rational based on a strict profit maximising approach compared
to management hubris and other working streams in the subject. Burkart pointed
to the additional aspects of the overvalued bid; namely its ability to pre-empt
competition from rival bidders. He argued that the level of the initial bid could
deter competition. In addition, the bid level necessary to prevent rival bidders to
enter the contest decreased with the size of the toehold. A maximum toehold was
therefore always optimal; a discussion that will be further examined in the
following section.
5.1.4 Deterring effect on rival bidders
As implied, the existence of toeholds could deter competition in a bid contest.
Burkart (1995) states that researchers have found it hard to find direct evidence
for this proposition. However, tentative support has been found in Stultz et al.
(1990) who report much larger toeholds in uncontested competitions than in
contested, a proxy for the deterring effects of toeholds. In similar, Betton & Eckbo
(2000) found that when rival bidders entered a takeover contest with a positive
toehold, the toehold size was on average of roughly the same size as of the initial

16
bidder. It therefore seems that rival bidders are aware of the toehold advantage
and wants to even out the playing field before entering the contest. This is also
supported by the argument that acquiring a toehold is a common and profitable
strategy as it could help the bidder win the auction, and win cheaply. (Betton &
Eckbo, 1997; Bulow et al., 1999; Jennings & Mazeo, 1993; Stultz, Walkling &
Long, 1984).
As presented previously, competitions can be divided into the subtypes
friendly and hostile. Dewatripont (1993) provides a model in a hostile takeover
setting by analysing the ‘leading shareholder’ strategy as a way to acquire the
company for a hostile bidder. The strategy amounts to an acquisition of shares in
the open market prior to the takeover, sometimes up to 20-30% but less than a
majority. By doing so, the hostile acquirer can deter competition of rival bidder
and white knights. In this sense, the bidder can reduce the dependence on the
relative management skills between bidders and the bid premium’s level in
relation to other incoming bids. Compared to prior models brought forward in this
study, Dewatripont confirms the deterring benefits to the bidder in a contest that
also accounts for parameters such as liquidity constraints and defensive actions of
target management.
When dealt with different subtypes in a completion, one can also account for
different type of bidders. Bulow et al. (1999) hence state that it is more to the
story in auctions dependent on whether bidders are strategic, with a private-value
of the target and auctions among financial actors with a common-value. “A
financial bidder should not generally compete with a strategic without a toehold
or other financial inducement” (Bulow et al., 1999, p.430). Moreover, these
financial actors may differ in estimated required returns; still they are more
similar in strategy. The deterring effects of toeholds are thus even more important
in common value auctions. The author argues that the toehold decreases the
bidder’s winners curse and allows the bidder to be more aggressive.
Simultaneously, the non-toehold bidder increases the risk of winner’s curse and
therefore bid more conservative. If all bidders have a toehold of equal size, they
would be more aggressive resulting in a higher price than if none had a toehold. A
competitive bidder would hence have to adapt its strategy to the toehold bidders
aggressiveness. The conclusion is that the deterring effect is adaptive to both
asymmetries in size and existence of toeholds. With this view, a toehold could
fend off competing bids that would have raised the final premium. By looking at
the deterring effects of a toehold, it also increases the chance to win consistent
with prior arguments from Walkling (1985), Shleifer & Vishny (1986), Hirshleifer
& Titman (1990) and Betton & Eckbo (1997).
5.2 Limitations of toeholds in takeovers
As presented above, there are a number of potential benefits of owning a toehold
when initiating a takeover attempt. Intuitively we should expect to see a high
frequency of toeholds in these processes. This is especially true considering a

17
large number of central papers, for example Grossman and Hart (1980) and
Shleifer and Vishny (1986), who state that the gains made on toehold owning’s
are a major contributor to the total profits obtained in a takeover process.
In contrast to what could be expected, many articles point towards a low
toehold frequency among bid contests. In their article, Jarrel and Poulsen (1989)
find that around 40% of the bidders in their dataset of US targets had no toeholds
prior to their takeover attempt. Bradley, Desai & Kim (1988) reached the
conclusion by investigating their dataset of US companies that more than 50% of
the bidder firms did not acquire a toehold position before executing their tender
offer. Moreover, most US firms covered by Jennings and Mazeo (1993) did not
acquire a toehold position either.
In a more recent article by Betton et al. (2009), the authors finds a distinct
trend by examining over 10,000 control bids on US public targets. The presence
of toeholds in takeover processes has been steadily declining since the early
1980s. During the time period 1973-2002 they find that toeholds were only visible
in 13% of all control bids. Toeholds could differently put be considered a rarity in
takeover attempts. Interestingly, when toehold positions actually do occur, they
tend to be large with an average size of around 20%. The author finds that it
seems to be a binary decision; their result indicates that one either initiate a
process with a large toehold or without a toehold at all.
Of interest, in the same article Betton et al. find that within hostile takeover
attempts, the presence of toeholds seem to be the norm with toeholds in 50% of
the occasions. Betton et al. explain this trend by linking the results to structural
developments within the takeover field. The peak of toeholds in the mid 80s
coincides with an increase in the usage of takeover defences among target
companies. The authors state that toehold bidding is optimal when the bidder is
prepared to make a hostile offer and challenge initial target rejection or active
defence actions. The high frequency of toeholds within hostile takeover attempts
would support this notion.
Despite above empirical findings, consensus theory states that a bidder should
accumulate the maximum amount of toehold ownership possible before initiating
his takeover attempt. This is not what we see when reviewing empirical results.
Along with the Betton and Eckbo results presented above, Jennings and Mazeo
(1993) and Stultz et al. (1990) finds that when toeholds actually do exist in a
takeover attempt, whether hostile or friendly, the bidders surprisingly hold well
less than 5% of the target stock.
This particular area of toehold ownership, called the toehold puzzle, is a
commonly debated subject among academics. If the consensus is that you make
best use of your chances and your profits in a takeover by maximizing your
toehold position, why do we not see more toehold positions among takeover
initiators? There must be conditions that steer bidders away from acquiring a large
toehold position before initiating a takeover attempt.

18
5.2.1 Information disclosure and price run-ups
One major complicating factor in the toehold puzzle is the existence of price run-
ups. Takeover attempts are in most instances preceded by upwards-directed target
stock price movements. These movements are generally called price run-ups and
are caused by the market actors’ anticipation an upcoming bid. The market values
the target stock to reflect the expected probability of a takeover attempt as well as
the potential synergies that will be realised if the bid succeeds (Bris, 2002). The
view that large toehold positions could be acquired to an unaffected share price
prior to the bid does therefore not seem to hold. As suggested by Schwert (1996)
it is very costly to buy a large toehold position since increasing the size of one’s
position will push up the pre-bid price.
There is a number of ways to intentionally or unintentionally disclose
information to the public regarding an upcoming bid. One common reason for
price run-ups would be leakage to the market in the form of rumours. Meulbroek
(1992) and Schwert (1996) finds higher run-ups in cases where SEC has been
investigating insider trading, suggesting that illegal trading could be one of the
price drivers before a tender offer. However, the illegal aspects of price run-ups
are in minority. Jarrell and Poulsen (1989) conclude in their paper that there are a
number of legitimate information sources that allow investors to anticipate
takeover attempts. King and Padalko (2005) agree in their paper where they relate
most run-up movements to public disclosures. Both of these papers suggest that
the main driver behind price run-ups is the regulatory framework in place. As
been presented in Chapter 4 of this paper, different legislation requires certain
ownership and intention disclosure when penetrating certain control thresholds.
For example, in US an investor needs to complete a 13d filing to the SEC when
reaching a 5% ownership threshold, while the Swedish regulation requires
ownership disclosure every time a 5% level is penetrated. These disclosures
provide the market with information about possible upcoming bids, and positions
are taken by investors to speculate on a bid premium to be realised within shortly.
There are more run-up related costs to acquiring a toehold than just the actual
costs of the toehold transaction. The traditional view assumes that the final bid
premium is independent of price run-ups before the offer is made (Betton et al.
2008b). The only cost of acquiring the toehold would then be the run-up effect on
the stock. However, as presented in Schwert (1996) and Betton et al. (2008b)
there is a strong relationship between price run-ups and increases in initial offer
premium. Betton et al. (2008b) finds that a $1 increase in stock price as a run-up-
movement results in a $0.8 increase in bid premium. Schwerts (1996) similar
findings indicated a $0.67 increase in initial bid premium for the same stock
movement.
Conclusively, owning a toehold provides the bidder with a very strong
position when initiating a takeover attempt. It is however difficult and expensive
to acquire a toehold position. If the bidder does not own a long-term toehold
previously, it is (i) costly to acquire a large short-term toehold through multiple
acquisitions on the market due to the price run-up. Moreover, (ii) acquiring a short
term toehold will according to above empirical results lead to overpaying for the

19
remaining shares through the inflated bid premium that follows the price run-up.
Schwert (1996) suggests that many bidders chose to not acquire target shares
before a tender offer, from fear of raising the total costs of a successful takeover.
Consistent with this, Betton et al. (2009) finds that only 3% of bidders in their
dataset acquire short-term toeholds before bidding. Schwert’s suggestion would
provide explanatory power to the empirical results of zero or low toeholds in
takeover situations.
5.2.2 Market liquidity
Ravid and Spiegel (1999) presents a model that according to theory explains an
optimal toehold strategy in a takeover situation. They introduce the concept of
market liquidity of the target stock. With high market liquidity, the authors state it
becomes easier to acquire a toehold without impact on the stock price. Ravid and
Spiegel argue that the optimal toehold hence becomes large when the liquidity is
high. Accordingly, the reverse also holds. When the market for the target stock is
characterized with low liquidity, the optimal toehold decreases towards zero, as
the toehold acquisition would create a greater run-up impact on the target stock.
Their suggestion gives an additional dimension given the academic consensus
that a toehold always should be acquired before initiating a takeover process.
Moreover, they see toeholds as a deterrence tool only, and their model states that a
toehold should only be purchased if the initial bidder is expecting any rival
bidders to enter the process. An interesting demonstration in their paper is the
finding that a large toehold is by no means a more efficient tool to deter
competition than a small toehold. The actual toehold position as a binary
categorization is the distinguishing factor when deterring rival bidders, a finding
that could provide explanatory power to the presence of small toeholds when
toeholds occur.
In his paper, Bris (2002) investigates why we do not see more open market
purchases by bidders prior to announcing a tender offer. Through the expected
increase in trading volume that follows short-term toehold building, Bris suggests
that the bidder releases information to the market about a potential upcoming bid.
The sizes of the trading orders allow shareholders to form an opinion about the
quality of the potential bidder. Bris suggests that market liquidity might allow
bidders to partially hide their trades in order to withhold this information from the
market. He proposes that stock liquidity and toehold size are positively related.
The articles suggests that the optimal toehold is, given stock liquidity, of a size
that does not allow the market to determine if a bid is going to occur or not. Under
low liquidity conditions, no toehold acquisition at all will therefore be the optimal
strategy for a bidder before announcing a tender offer.
Other central articles provide additional views to the market liquidity aspect of
toehold purchases. For example, Schwert (1996) presents that unusual patterns of
price movements and higher trading volumes are a common way for investors to
spot potential upcoming bids. In his paper, Qian (2001) presents his expectation
that a bidder would purchase toeholds up to the size that the market liquidity

20
allows, i.e. maximizing the toehold position given market liquidity constraints.
Others like Kyle and Vila (1991) provide the reader with an alternative solution
for acquiring toehold positions. They suggest that it is possible to camouflage
purchases in liquid market using noise traders. However, this notion fails to take
into account local disclosure regulations that prohibit owners to acquire shares
without disclosing their ownership when penetrating certain thresholds. Price run-
ups are agreed among academics to be a significant cost when acquiring a toehold
position.
5.2.3 Alternative explanations
Besides the run-up costs associated with information disclosure through public
announcements or market liquidity, the academic literature provides a number of
alternative explanations to the low frequency of toeholds in takeover situations.
Goldman and Qian (2005) agrees that a toehold increases the probability of
success in the transaction and acknowledges the benefits of owning one. In their
paper, they model the potential value of the target firm following a failed takeover
attempt by the bidder. In line with academic consensus the authors agree that a
larger toehold will increase the potential profits from a successful takeover
attempt. However, inconsistent with important central publications like Hirshleifer
and Titman (1990) or Chowdry and Jegadeesh (1994), Goldman and Qian argue
that holding a toehold potentially could reduce the profits from their position
given the takeover fails.
Goldman and Qian look at the targets managers’ incentives to block a
takeover attempt when modelling the failed takeover value of the company. They
argue that target managers have larger incentive to block a takeover if they
experiences private benefits of control. This is also true for the reverse situation.
Managers have smaller incentives to block the trade if they hold equity ownership
in the target and therefore would gain from the value-increasing takeover. Only if
the gain of the value increase exceeds their experienced private benefit will they
accept the takeover attempt, the managerial entrenchment. If a large toehold
owner attempts to take over the firm and fails, the market perceives this as if a
high level of entrenchment is present in the firm. High entrenchment reduces the
market value and the toehold owner’s position will be worth less, ex post, the
failed takeover attempt when the market re-evaluates the firm. Their model
predicts that a bidders optimal toehold should be negatively related with the size
of the target management’s equity ownership. Goldman and Qian hence puts
forward a model that presents a cost of owning a toehold and an explanation on
why you would enter a takeover contest without any prior, or a small, ownership
stake in the target.
Asquith and Kiescnick (1999) examines toehold positions among bidders on
the US market prior to initiating a takeover attempt. In accordance with the price
run-up theory, they state that all stock purchases before a tender offer would
incorporate market expectations about the coming takeover premium. They find
significant evidence that the target firm size have an impact on the relationship

21
between toehold and market premium. They find that the larger the target firms
the smaller toeholds could be expected. The intuition behind this is that it is more
difficult to obtain a large position in a large target due to higher market awareness
of the firm and the higher frequency of risk arbitrage investors speculating in
takeover bids. This leads to higher costs of acquiring a toehold and by that reason
we see smaller toeholds in takeover attempts on larger targets.
In his paper Qian (2001) looks into the puzzling question on why bidders
initiate takeover attempt with zero or low toeholds, despite the clear advantages of
such ownership in the target. He comes to the conclusion that a toehold is very
profitable in case of a successful takeover attempt. However, in case of a failed
attempt the toehold will be a source of loss for the bidder. The logic behind his
conclusion is that in a successful takeover attempt, a toehold is a source of gains
since target shares were purchased at the open market to a price on discount
compared to the premium inflated takeover bid. In the model a target is
considered to be undervalued because of agency problems between owner and
managers, as presented by Jensen (1986). His assumption is that if the target
management rejects the takeover bid, the market will readjust their valuation of
the target based on a view that the target is stuck with inefficient entrenched
management with private benefits of control. He models the two possible
scenarios and finds that the trade-off between possible gains versus possible
losses trades each other out. In other words, managers consumption smoothing
behavioural pattern drives them to acquiring a zero toehold before initiating a
takeover attempt.

22
6 Hypotheses
Based on the literature presented in chapter 5, we expect toeholds to be a vital
determinant of the dynamics in a takeover attempt. Our hypotheses will hence be
aimed towards analysing its relation to the price of the acquisition and the
probability of a successful outcome.
Toeholds, bid premiums and takeover probability
Hypothesis 1: There is a negative relationship in toehold size and bid premium
It has previously been argued that a toehold position leads to a lower offer
premium. Based on the theoretical suggestions by Shleifer & Vishny (1986),
Eckbo & Langohr (1989), Hirshleifer & Titman (1990), Betton & Eckbo (2000)
and Goldman & Qian (2005) we expect to see a negative relationship between the
toehold size and bid premium.
Hypothesis 2: The larger the toehold, the higher the probability of a successful bid
Furthermore, emphasize has been put into explaining the deterrence effects
caused by toeholds and the bidding behaviour that is associated with toehold
ownership. Based on the predictions of Walkling (1985), Shleifer & Vishny
(1986), Hirshleifer & Titman (1990), Burkart (1995) as well as Betton & Eckbo
(1997) we expect to see a higher probability to win for bidders with a toehold
position.
The next chapter will present the quantitative methods used to test our
hypotheses together with a detailed explanation of how the data has been collected
and processed in order to fit our analysis.

23
7 Method
In this chapter, a presentation will be given on the methods used to perform this
study. First, we will present the data collection process. We will then present the
sampling of this data to finally discuss some of the adjustments that have been
made in order to fit the purpose with respect to specific characteristics of the
Swedish takeover market. The statistical techniques for analysing the dataset are
influenced by the methods used in Betton & Eckbo (2000) of OLS estimations of
initial bid premium as well as a logit regression model of contest outcome
influenced by methods used in Walkling & Long (1984), Walkling (1985) and
Jennings & Mazeo (1993).
The quantitative methods used in this study rely on systematic empirical
investigations of social phenomena using statistical or mathematical techniques.
The relationship between theory and research is of a deductive approach. The
view on reality is objectivistic and intends to create a portrait of relationships
often hard to observe in its purest form. The tests performed in this study hence
use quantitative methods to test economics and finance theories (Bryman & Bell,
2003). In addition, a socioeconomic perspective is included in the regulatory
framework on how takeover regulations have developed. This takes on a view of
the takeover environment as being socially constructed. Human’s actions are
socially constructed and organizations are complex systems with agents organised
into groups with sometimes seemingly irrational decision models (Nachemson-
Ekwall, 2012). By adding a perspective of sociology and institutionalism, we
intend to provide an explanation to how the ownership structure has emerged in
Sweden.
We are aware of the possible limitations with a quantitative study based on
secondary sources, such as (a) not familiar with data, (b) complexity of data
material, (c) lack of control over the quality of data and (d) the availability of all
key data (Bryman & Bell, 2005). These will be discussed and incorporated
continuously in the appropriate sections of this chapter. We will now begin by
discussing the data collection process.
7.1 Data collection
The full dataset of public takeovers has been extracted from the databases of
NasdaqOMX, Zephyr and S&P CapitalIQ. No single database has been able to
provide details on all transactions singlehandedly. Furthermore, notifications of
certain characteristics such as hostility have sometimes been incorrectly notified
and/or measured. The databases have therefore been used in combination and

24
allowed us to create an extensive sample on this specific matter and geographic
market. The restraint of complete and available data was undertaken by
crosschecking all transactions with press releases available through Affärsdata
and CisionWire in combination with official offer documents available at time of
announcement. Reuters Eikon and Reuters Datastream have been used to extract
target tickers and historical share prices used to calculate bid premiums.
Researchers in this field have to be aware of some limitations in publicly
available data. An acquisition of a public target is a complex process with a large
amount of sensitive and undisclosed information. Discussions are also held among
actors in the process without the awareness of the public. Only publicly available
data can hence be collected and used in this study to not discriminate among bid
contests with different media coverage and over time. No rumoured information is
taken into consideration in the data collection. Given this condition, the
discussions held among actors prior to filing an official bid could embrace effects
in the competitive climate in the contest not visible to the public, nor in the result
of this study. Any effects of toeholds on contest characteristics could therefore be
deviating from what is possible to prove in this study.
7.2 Data sampling
When data has been extracted from the databases, a number of screening criteria
have been used to serve the objective of the study. As mentioned, this thesis
exclusively looks at public takeover bids, i.e. a bid directed towards the target
shareholders to acquire 100% of the outstanding shares in a publicly listed
company in Sweden. Transaction type has therefore been set to Public Takeover
or Full Tender Offer and geographic location to Sweden. The time frame has been
set to cover the 16-years period of transactions announced between 01/01/1997
and 12/31/2012. The analysed period provide available data from NasdaqOMX of
takeover contests on the Stockholm Stock Exchange. Information prior to this
faces a risk that correctness of data could be hard to validate. In 1999, a third
revision of the takeover rules was implemented that included clearer prospectus
requirements that has facilitated the data gathering process (Nachemson-Ekwall,
2012). In addition, this period covers two merger waves, the fifth in 1993-2000
and the sixth in 2004-2008 when Lehman Brothers crashed in September that
year. These periods are influenced by high takeover activity and good access to
funding of acquisitions. If narrowing the time frame of the analysed period, this
cyclicality could possibly affect the outcome of premiums and takeover success
(Nachemson-Ekwall, 2012).
By excluding rumoured bids, a total of 340 transactions have been identified.
From these, a number of actions have been performed to identify the appropriate
attributes. First, since this study identify control bids only, consistent with Betton
et al. (2009), the data sample has been adjusted for transactions where the bidder
already holds more than 50% of the votes in the company, hence already in
control when the bid for remaining shares was announced. These transactions
25
have been removed and only bids where a bidder initiates a process with less than
50% of the votes in search for a position of more than 50% is used. Second, the
sample is reduced in order to fit the model standard used in Betton and Eckbo
(2000) where multiple bids on the target from the initial or a rival bidder are
grouped into one contest. A takeover contest is constructed based on the initial bid
compared to how data is presented in the databases where individual bids are
sometimes viewed as separate contests. Instead, a contest is the result of a
takeover attempt with successive bids either through a rival bidder entering the
contest or by a bid jump from the initial bidder. New bids from the initial or rival
bidder that occurs within six months after the last bid are considered belonging to
the same contest. All bids on the target placed after six months of a prior are
considered as a beginning of a new public takeover contest. Third, we have
removed contests when the objective of the observed takeover attempts clearly
has been to merge two firms into one, creating a new combined entity. These
situations put the surrendering shareholders into a position where post-transaction
value increases are to a large extent attributable to them as well. The dynamics of
these takeover attempts are somewhat different than for full tender offer, which
makes them deceptive for our analysis and have been removed. Fourth, takeover
attempts that have failed to provide sufficient data to fit our analysis have been
removed. We have observed no systematic errors in the removed bid contests.
Given the above criteria, the final dataset consists of 202 transactions. This
could be argued as representative for the population of takeovers of publicly listed
firms in Sweden. As presented earlier, to this sample only rumoured bids, bids
with insufficient data and takeover bids where the initial bidder already controlled
the target should be added to reach the full population. When speaking of
takeovers in general terms, it also includes mergers and dependent on definition
acquisitions of targets with private owners among other buyer- and contest-
specific characteristics. Transferability of the knowledge from this study onto
these transactions could probably be valuable, however additional variables such
as merger negotiations and in what different ways one could buy shares pre-bid
have to be accounted for. We would expect the result to be transferable to public
takeovers in other countries of similar shareholder structure. However, since
regulatory environment is country specific to a large extent, this would have to be
included in relation to the results to make conclusions on findings across
countries.
The final data set includes transactions that meet the following criteria:
- Takeover bid announced between 01/01/1997-31/12/2012 and contest
outcome known at 23/03/2013.
- Targets listed on a Swedish stock exchange
- Bidder with less than 50% control of target company
- Bid on 100% of the remaining shares in the target company

26
7.3 Data processing
From the before mentioned databases, the sample has been processed to disclose
the desired contest characteristics, bid premiums and final outcome. With a time
horizon of announcement day t, t-6 and t+18 months the dynamics in each
individual transaction have been mapped. The following areas in 7.3.1 an onwards
are worth to stress since they are adjustments made to address essential areas for
the analysis.
7.3.1 Toehold
According to the definition presented in section 3.3, the toehold is the ownership
of a stake in the target company pre-announcement (Betton & Eckbo, 2000; Ravid
& Spiegel, 1999). By default, this is presented as a bidders portion of the target’s
capital in the database Zephyr. Since this study is interested in the share of control
synonymous with the share of the votes, this has to be corrected. Therefore, in
those transactions where dual class shares are used, we have adjusted the toehold
to account for the bidders share of the votes. Moreover, when premiums are
calculated, this is done using the stronger voting power share’s base price given
that both share classes are included as part of the offer. This could bring some
deviations from what is presented in the offering documents as an offer is placed
on all outstanding shares, where premium calculations could be adjusted to
relative weights of both share classes.
When information of size and existence of possible toeholds have been
missing in the offering document and information has been unable to be sourced
using other databases, the toehold has been classified as zero (Betton et al., 2009)
Moreover, a distinction has been made between short term and long term
toeholds, which is defined dependent on when the toehold position was acquired.
In line with Betton et al. (2009), a toehold is categorised as long term if target
shares were held prior to six month before the bid was announced. If all shares
were acquired in the six months leading up to the bid, we define the toehold
position as short term without the benefits of long-term interests into the
company.
The causality of variations in the toeholds and variations in the bid premium
and probability of success should not be a concern for the validity of the results.
Toeholds are per definition-acquired prior to announcement of offer. The opposite
relationship of offer premiums leading to higher toeholds should not be an option.
The conclusions should hence be based on a valid relationship (Bryman, 2003).
7.3.2 Contest winner
Each takeover contest has been addressed as successful or unsuccessful to the
initial bidder. Whether a bid is considered successful or not is determined by the
27
offer’s announced final acceptance from tendering shareholders. If the number of
shareholders accepts a bid to enable the bidder to reach an outcome with more
than 50% of the votes, the takeover bid is considered to be successful. The
concept of transaction success is hence not synonymous with completion of the
offer. In many occasions the bidder include a conditional offer that oblige the
bidder to complete the offer only if 70%, 90% or another eligible amount of the
shareholder accept the offer. If this condition is not fulfilled, the bidder can
choose to withdraw their offer. The transaction does hence not require shares to
physically change hands to be considered successful.
The above-mentioned treatment of success in transactions is in our view a
correct way to determine the level of bid premium that would allow the bidder to
obtain control of the company. An advantage with this view is that is does not
discriminate among actors with different incentives and expressed conditions in a
contest. A bidder with intent to buy any shares made available to him and a bidder
who is only interested in buying if all shares are made available to him are treated
equally. This adjustment is consistent with many existing studies that focuses on
whether the bidder is able to purchase the target shares or not (De et al., 1996).
7.3.3 Hostility
A bid has been classified as hostile when the board of directors of the target
company announced to their shareholder a recommendation not to accept the
initial bid. Out of 202 takeovers in the complete dataset, 45 were categorised as
hostile. The categorisation is a result of a process in which categorization from
Zephyr and CapitalIQ have been manually controlled by public announcements
during the event window.
A few aspects have to be stressed in these transactions. In some transactions
with a toehold bidder, an influential part of the board in the target company has
contained representatives from the bidder company. In these contest, the
independent board representatives’ recommendation has been used to determine
the bid categorisation. Second, if the bidder has engaged in a bid jump after the
initial bid and the board recommends the revised bid, the transaction is still
considered hostile. As discussed earlier, the reaction to the first bid therefore sets
the deal sub-type in a transaction. Third, only the board of directors’
announcements are judged to determine hostility in transactions. Public
announcements made by large shareholders or the Swedish Shareholders
Association (Sw: Aktiespararna) in relation to a bid is not used to determine
hostility. This is consistent with the NBK’s recommendation, where the board of
directors in the target company are obliged to present its view of the bid, and the
reason for it, to the shareholders of the target company.1 (Nyström & Sjöman,
2011).
1 Found in NBK 2003, II.19. First addressed as a duty in 1999, action prior seen as appropriate of board of
directors (Nyström & Sjöman, 2011).

28
7.4 Regression models
We will in the below section of this chapter outline the different regression
models we have constructed in order to test our hypotheses presented in chapter 6.
7.4.1 Bid premium regression
The first regression will test hypothesis 1, if there exists a negative relationship
between the possession of a toehold and the bid premium. The regressions aims to
identify the explanatory variables impact on the initial and final bid premium of
the takeover attempt. To provide additional explanatory power to our model and
to avoid spurious relationships, a number of control variables are introduced and
presented below.
As per Betton et al. (2009) the control premium is defined as the price offered
at the announcement day, t, in relation to the unaffected share price 42 days prior
to this date. This would hence reduce the impact of target price run-ups on the
control premium, otherwise potentially included in the price at day of
announcement. In our study, this imply (pini - p-42) / (p- 42). After adjusting for
splits and dividends, pini is the initial offered price per share at t to current
shareholders and p-42 is the share price 42 trading days prior to offer
announcement.
Initial Premiumt-42 = α0 + α1SZTOEHOLD + α2HOSTILE + α3CASH +
α4ln(TARGETSIZE) + α5BORIGIN + ε
Final Premiumt-42 = α0 + α1SZTOEHOLD + α2HOSTILE + α3CASH +
α4ln(TARGETSIZE) + α5BORIGIN + α6MULTIBID + ε
SZTOEHOLD: Scale variable of toehold size
HOSTILE: Dummy variable with 1 if target response is hostile, 0 if not
CASH2: Dummy variable with 1 if form of payment is cash only, 0 if other
Ln (TARGETSIZE)3: Logarithmic scale variable of target market capitalisation
BORIGIN4: Dummy variable with 1 if bidder origin is domestic, 0 if foreign
MULTIBID5: Dummy variable with 1 if contest includes rival bidders or bid jumps, 0 if not
2 CASH (payment) variable used since (i) cash vs. stock decision as payment method signals the bidders true
value to the market, and (ii) since cash opposed to stock is accompanied by an immediate tax burden that target
shareholders requires compensation for. Cash bids would be expected to pay higher premiums (Stavlos, 1987). 3 Ln (TARGETSIZE) used since bidders are likely to pay a higher premium for small firms given (i) it is harder
to conduct a correct valuation due to higher information asymmetries, (ii) since small firms have higher growth
prospects and (iii) since bidder firms can afford to pay high for smaller bolt on acquisitions (Danbolt, 2004). 4 BORIGIN used since studies show foreign firms tend to pay higher premiums, partly based on thresholds to
enter a new market is higher for a foreign firms relative domestic (Goergen & Renneboog, 2004). 5 MULTIBID used since bids in excess of initial bid inflates the total consideration per share in a contest.
29
7.4.2 Robustness of premium regression
To test the robustness of our results, the premium regression will be run with an
additional definition of initial and final premium commonly used among
practitioners as evident in the offering documents. This takes the offer price in
relation to the closing price at last day of trading before an announcement has
been made, at t-1. The price at last trading day could include price run-ups and
therefore result in deviations among transactions. It is therefore not frequently
used among academic researchers on the subject. However, running these tests
with the last trading day as the base share price component will also allow our
results to be used to include this aspect as well as allow for a wider interpretation
among practitioners in addition to academic purposes.
7.4.3 Probability of success regression
The second regression aims to clarify how the probability of success in a takeover
contest is dependent on a set of independent variables. Consistent with Walkling
(1985), Walkling & Long (1984) and Jennings & Mazeo (1993) we will use a
binomial logistic regression model to estimate this probability. The dependent
variable, probability of success, in the model can take on a value between a win
(1) and a no win (0) for the initial bidder. The resulting measure will hence
express the probability for the initiating bidder to win the contest.
Pr. of success = α0 + α1SZTOEHOLD + α2CASH + α3MULTIBID + α4
FPREMIUMt-42 + α5ln(TARGETSIZE) + α6HOSTILE ε
SZTOEHOLD: Scale variable of toehold size
CASH: Dummy variable with 1 if form of payment is cash only, 0 if other
MULTIBID: Dummy variable with 1 if contest includes rival bidders or bid jumps, 0 if else
FPREMIUMt-42: Initial bidders final offer price in relation to unaffected share price at t-42
Ln (TARGETSIZE): Logarithmic scale variable of target market capitalisation
HOSTILE: Dummy variable with 1 if target response is hostile, 0 if not
7.4.4 Robustness of probability of success regression
The robustness of the results when running the regression on the full sample will
be challenged by a second run performed on the subsample of 45 hostile
takeovers. This is done since previous research indicate that any relationships
could be hard to prove for a full sample given an overall high success rate and that
it has been a higher frequency of toehold bidders in hostile takeovers. (Walkling,
1985 and Betton et al., 2009).

30
8 Empirical findings
Chapter 8 contains a description of the dataset. We will present general patterns of
bid contest characteristics and outcome across the sample in section 8.1. In section
8.2, we will use the outcome of the quantitative methods used to statistically
challenge the hypotheses on bid premiums and success in the observed contests.
8.1 Description of dataset
Out of the 202 contests, a winner was acknowledged in 181 of which the initial
bidder won in 171 and a rival bidder in 10. The remaining 21 takeover attempts
ended without a winner, primarily because of an insufficient target acceptance
rate. An initial bidder that announced an offer would then have won in 84.5% of
all attempts. When a bid was received at the targets board of directors, a majority
of the contest were recommended onto its shareholders (78%). Still,
approximately one in five initial bids (22%) was turned down by the target board
of directors and categorized as hostile. The average price of the target shares was
29.8% above the unaffected share price in the initial bid. Since a high number of
contests (93%) did not lead to an increased offer or a rival bidder entering the
contest, the average final premium was only a bit higher at 31.8%. Based on the
Table 2 Table presents the complete dataset of 202 takeover contests. The top panel of data contain figures in absolute numbers.
The bottom panel presents the corresponding proportional values. Target value is expressed as firms Market Value at t-42
in millions of SEK. Variables are further defined in chapter 7, section 3.

31
data, one can state that a main driver behind a failed takeover bid was a hostile
response, which reduced the initial bidders chance of winning to 51.1%. In the
situation that a rival bidder entered a contest, friendly or hostile, not only would
the initial bidder have to pay a higher premium, 40.1% compared to 31.9%, only
one in five bid attempts led to a successful outcome. The two negative aspects of
hostility and rival bidders combined meant terrible news for the initial bidder.
When observed in the same contest, it led to an unsuccessful outcome for the
initial bidder in all of the seven attempts during the analysed period. We will now
look at the different aspects of the takeover contests in more detail.
When separating our data into hostile and friendly takeover contests, out of all
contests, 78% were friendly while the remaining 22% faced resistance by the
target board. Columns 2 and 3 in table 2 indicate that hostile transactions were
more common in large target companies with an average size 56.7% higher than
for friendly targets, 3,300MSEK compared to 2,105MSEK. Consistent with the
overall sample there is some skewness to these results indicated by a median
value of 493MSEK for hostile contests, which is marginally higher than for the
complete sample. These findings are consistent with the results obtained by
Betton et al. (2009) in their paper on US targets of less large targets in public
takeover attempts.
The percentage of friendly contests where the initial bidder won was high,
amounting to 94.3%. In contrast, the success ratio of hostile bids was modest with
a successful outcome for the initial bidder in only 51.1% of all contests. When
comparing these figures to the findings of Betton et al. (2009) for US firms, their
findings are lower, amounting to 68% and 34.4% respectively. This suggests that
the probability for a successful bid contest for an initial bidder is higher in
Sweden compared to US, independent of whether contest is friendly or hostile.
Fig. 1 Frequency distribution of hostile and friendly public takeover attempts in Sweden.

32
The separation of subtypes also allows us to observe deviations in premium
levels. Accordingly, the initial bid premium for hostile takeover attempts was
21.2% compared to 32.5% for friendly contests, a substantial difference of 11.3%.
One could argue that a low initial premium would cause a hostile response and
that the observed lower premiums for hostile takeovers therefore would be self-
fulfilling. The result is however unchanged when we test the result with two
counter-arguments. First, when we account for the higher frequency of multiple
bids in hostile takeovers one could say that this would be upwards adjusted in the
final premium. Though, when comparing the difference in final bid premiums the
result is unchanged, with 25.2% compared to 33.9% respectively. Second, since
more hostile contests are unsuccessful compared to friendly, could that be an
explanation to the observed lower premiums for hostile bid contests? If
controlling for this argument and only comparing successful bid contests, the
average final bid premium was still lower for hostile contests of 23.2% compared
33.94% for friendly. The results for the analysed sample therefore strongly
suggest that premiums are lower in hostile competitions compared to friendly. The
results contradict the results found by Betton et al. (2009) for US targets. While
their findings indicate that the initial (final) bid premiums for hostile targets are
5% (15%) above friendly targets, the result for Sweden indicates the reverse
relationship. Walkling and Long (1984) however found a similar but insignificant
result as ours based on US competitions.
Among all transactions, cash has been the most frequent method of payment
used in 75% of all contests. Initial bidders who made cash offers were successful
in 89.5% of the competitions while bidders who used stock or mixed payments
only succeeded in 70% of the cases. A possible explanation for this is the
difference in initial (final) bid premiums present between cash of 30.3% (32.3%)
Fig. 2 Frequency distribution of method of payment in public takeover attempts in Sweden.

33
and other payment methods of 28.3% (30.4%). This is consistent with the
predictions of Stavlos (1987) based on the immediate tax burden on cash
payments that target shareholders require compensation for. A viable reason for
the result could also be the potential bidder share price overvaluation that is
signalled through the usage of stock as payment. Given that the premiums are of
equal size in cash and stock offers, target shareholders devaluate the bid premium
when stock is used and hence could reject a higher proportion of the stock bids
due to an expected share price decline.
As for the competitive climate, by dividing our data sample into single and
rival bidder contests a number of interesting findings emerge. By observing the
complete contest sample, only 7.5% of the takeover bids have attracted rival
bidders. The data shows that rival bidders occurred in 15.6% of the contests when
the initial bid was met with a hostile response, while the proportion were only
5.1% in friendly attempts. This suggests that a rival bidder’s entrance in the
contest is attributable to initial target hostility. The initial bids that induce rival
bids seem to have a lower median premium than the comparable for single bidder
contests. As previously mentioned, this low premium is also the main driver for
the hostility categorisation, suggesting the reason behind rival bidders entering a
contest being simultaneously driven of low initial bids and target hostility.
By examining the competition aspect of a bid contest, we see that the
implications of a rival bidder entering the process are considerable. The final bid
premium in a rival contest has an average of 40.1% compared to 31.2% in single
bidder contests. Despite the high final bid premium offered by the initial bidder, a
rival bidder entering the contest largely reduces the probability of success. While
a bidder in a single bid contest wins in 89.8% of the contests, the initial bidder in
a rival process only obtains a successful outcome in 20% despite the high final bid
premium of 40.1%. The no winner outcome increases marginally from 10% to
Fig. 3 Comparison of the winner in public takeovers among contests with a single bidder and
contests with rival bidders. The premium definition used refers to the final offer in relation to
the share price 42 days prior to announcement.

34
13% of the contests, so the winner distribution changes to a majority of rival
bidders at the expense of initial bidders.
We add the toehold variable into the table in order to illustrate its impact on
our results. We see toeholds in 37.6% of our contests for the full sample, which
substantially exceeds Betton et al. (2009) frequency of 12.6%. Consistent with
their results, the toehold frequency in hostile takeovers is much higher than in
friendly contests. Our sample witness of toeholds in 67% (29%) of the hostile
(friendly) contests in our sample compared to the 50% (11%) frequency as seen in
Betton et al. (2009). There is some skewness to the friendly toeholds, where the
average size is 8.7% and the median is zero. When looking at the hostile toeholds,
this skewness completely disappears and we see an average of 20.4% and a
Fig 5. Presentation of the historical frequency distribution of toehold size measured in 5%-
intervals. A toehold is considered long if some or all shares were held six months before bid was
announced. In contrast, if all shares were acquired in the six months leading up to the bid, it is
considered short term (Betton et al., 2009) .
Fig. 4 Frequency distribution of toeholds in friendly and hostile takeovers.

35
median of 20.1%, suggesting an even distribution of toehold size in the hostile
sample.
When only focusing on the bids where the initial bidder owned a toehold, we
see that this was the case in 37.6% of the contests. As visible in figure 5, a
majority of the toeholds were of large size. In more detail, 59.2% of the toehold
owners controlled more than 30% of the votes in the target firm before the bid
was announced. With only a few exceptions, these had been held more than six
month before the takeover announcement date. When observing the toeholds of
less than 30%, the distribution among long and short-term possessions is more
evenly allocated. We have in this study argued that the Swedish market is
characterised by large controlling blockholders. These results seem to support this
condition. Accordingly, this indicates that the Swedish market for corporate
control has encouraged long-term blockholders and discouraged bidders from
building toeholds on a short-term basis due to strict disclosure rules.
When relating our dataset to the hypotheses we can point out a number of
important findings. First, the differences in the bid premiums in toehold contests
and the no-toehold contests suggest that it could be a relationship in support of
hypothesis 1. The relationship between toehold size and bid premium could be
expected to be negative, with smaller premiums for larger toehold size. The
premium difference between toehold and no-toehold contests visible in column 16
and 17 of Table 2, witness of 11.4% lower initial bid premiums and 10.3% lower
final bid premiums. This result suggest support for the theoretical results of
Shleifer & Vishny (1986), Eckbo & Langohr (1989), Hirshleifer & Titman (1990),
Fig. 6. The first axis presents a frequency distribution of successful and unsuccessful takeover
attempts across the full sample. The second axis presents the average final premium, t.42, over time.

36
Betton & Eckbo (2000) as well as Goldman & Qian (2005). These findings also
supports the empirical results by Asquith & Kieschnick (1999) and Betton Eckbo
(2000), but fails to support the positive relationship suggested by Chowdry &
Jegadeesh (1994) and Burkart (1995).
By observing the success rate it is clear that initial hostility has a major
implication on the outcome probabilities. In our dataset, the percentage of positive
outcomes is reduced from 94.3% to 51.1% when we move from friendly to hostile
target response. Conditional on the bid turning hostile the aspect of rival bidders
becomes even more important. If a rival bidder enters the contest, the percentage
of positive outcomes drops sharply. Out of our hostile contest with rival bidders
there is not a single occasion were the initial bidder won the competition, resulting
in 0% positive outcomes. If the process was friendly and a rival bidder entered,
the rival bidder’s impact was still large with a 72.9% drop from 94.3% positive
outcomes to a new success rate of 21.4%. Hence it seems vital to deter
competitors from entering a contest, independent of whether the initial bid
received a hostile target response or not.
In the theoretic chapter of this thesis, chapter 5, we have argued that a toehold
position has a deterring effect on rival bidders entry in a competition. More
importantly, when looking at the situation between toehold owners initiating a
hostile bid contest and presence of rival bidders, we see that rival bidders only
entered in 1 out of 30 (3.33%) of these contests. This was well below the no-
toehold contests where rival bidders entered in 7.9%, adding support to the
deterrence effect of toeholds suggested by Eckbo & Langohr (1989) and Betton &
Eckbo (2000). Interestingly, consistent with the results of Betton & Eckbo (2000)
we see that in 12 of 15 rival bid cases a rival bidder entered the contest with
equally or better toehold state and size as of the initial bidder. This would provide
additional proof of the benefits and the deterrence effect that follows with a
toehold ownership, requiring a rival bidder to even out the playing field before
entering the contest.
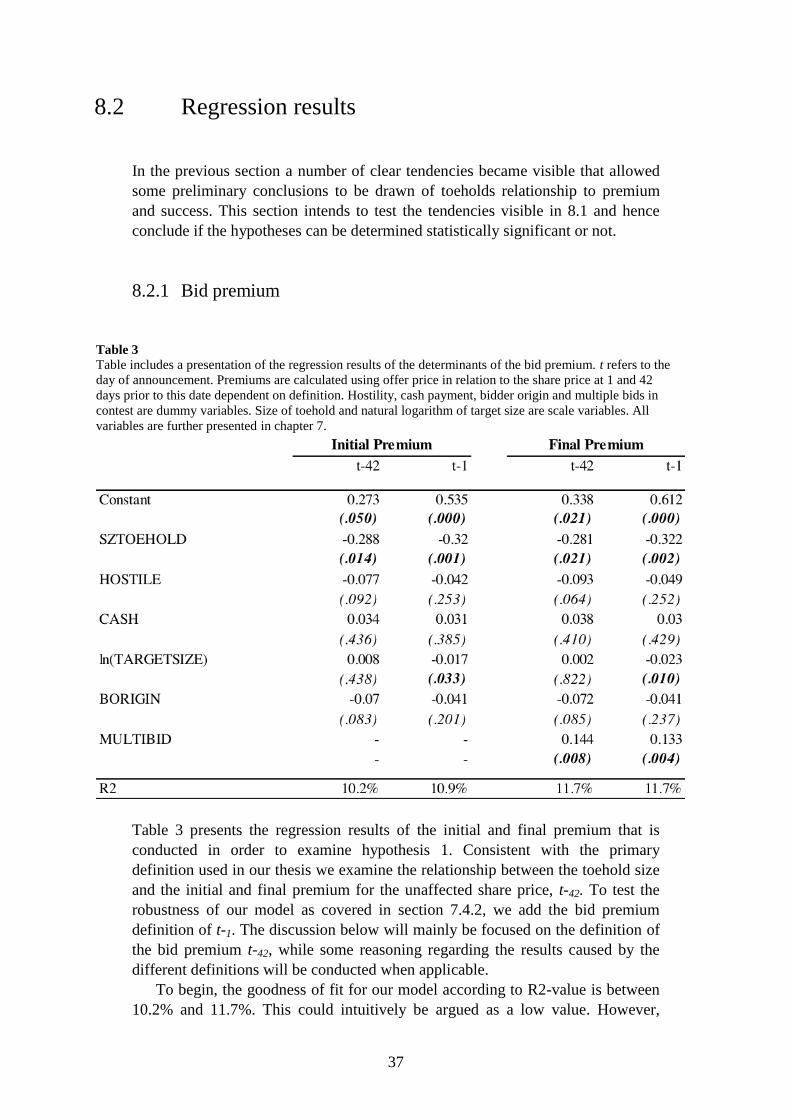
37
8.2 Regression results
In the previous section a number of clear tendencies became visible that allowed
some preliminary conclusions to be drawn of toeholds relationship to premium
and success. This section intends to test the tendencies visible in 8.1 and hence
conclude if the hypotheses can be determined statistically significant or not.
8.2.1 Bid premium
Table 3 presents the regression results of the initial and final premium that is
conducted in order to examine hypothesis 1. Consistent with the primary
definition used in our thesis we examine the relationship between the toehold size
and the initial and final premium for the unaffected share price, t-42. To test the
robustness of our model as covered in section 7.4.2, we add the bid premium
definition of t-1. The discussion below will mainly be focused on the definition of
the bid premium t-42, while some reasoning regarding the results caused by the
different definitions will be conducted when applicable.
To begin, the goodness of fit for our model according to R2-value is between
10.2% and 11.7%. This could intuitively be argued as a low value. However,
Table 3
Table includes a presentation of the regression results of the determinants of the bid premium. t refers to the
day of announcement. Premiums are calculated using offer price in relation to the share price at 1 and 42
days prior to this date dependent on definition. Hostility, cash payment, bidder origin and multiple bids in
contest are dummy variables. Size of toehold and natural logarithm of target size are scale variables. All
variables are further presented in chapter 7.

38
considering the fact that this study focus on a specific aspect of the takeover
situation the result is rather expected. For example, the regression model used to
determine this relationship disregards fundamentals like bidder synergies
(Gujarati & Porter, 2009), economic value aspects (Varaiya, 1987), management
hubris and free cash flow problems (Jensen, 1988; Lang & Walkling, 1991; Roll,
1986) and target financials that all are common determinants of the bid premium.
When benchmarking the R2-value to Betton & Eckbo (2000) whom use a similar
regression model to test the same dependent variable, our result of 10.2% for
initial premiums is well above their 5.8%. It could therefore be argued that the fit
of our model is rather good given the narrow scope of our analysis.
The constant in our regression shows a premium intercept of 27.3% for the
initial premium and 33.8% for the final. This is close to the average premiums
from the complete sample presented in 8.1 and indicates that the model provides a
good and intuitive platform to commence our analysis.
Consistent with our prediction in hypothesis 1 the toehold size variable has a
negative coefficient for the initial (final) premium of -0.288 (-0.281). The
negative relationship between toehold size and bid premiums are highly
significant, indifferent of the premium definition used. The given coefficients
translate into a relationship where the larger the toehold size, the lower premium.
By expressing this result as a marginal effect, a 1% increase in toehold size
reduces the premium level with 0.288% of the initial bid premium and 0.281% of
the final. These results provide significant evidence to the theoretical predictions
of hypotheses 1.
When analysing the remaining variables, hostility, cash, target size, bidder
origin and multiple bids, significant results are only detectable in one, namely the
target size. In section 8.1, emphasis was put on payment methods and its impact
on bid premiums. The dataset allowed us to see that cash payment resulted in
higher premiums than other methods. However, the regression fails to provide any
statistical significance to our results.
While one intuitively could expect hostility to show a negative relationship to
the bid premium by observing Table 2, with premium levels substantially lower
for hostile contests, the analysis of our dataset fails to find any statistical
significance for this argument.
As said, the target size is a significant determinant for the bid premium, but
not for all definitions. The variable hence fails to provide any significant results
when looking at the t-42 definition of the premium. However, it is highly
significant for the t-1 definition. This is a puzzling result, but it seems that larger
targets reduces the premium when we look at t-1. In the limitations of toeholds
section in this thesis we presented arguments for price run-ups in target share
price. A central aspect in these arguments was that the larger the firm size, the
more brokers covered the company and the more public attention was drawn
towards the firm. Our result could indicate that the price run up is more impactful
for larger firms, and the bid premium is hence reduced to a higher degree for
larger firms when comparing the share price at the last day of trading prior to the
announcement. This result is consistent with the prediction of Asquith &
Kieschnick (1999) who argues that toeholds should be smaller the larger the firm,

39
given the higher market awareness and the associated complications to build
toeholds. Our result would support their notion that the price run up is higher for
larger firms, which causes the base price for the bid premium to be inflated. With
a higher unaffected share price used to calculate the premium, the premium level
seems lower for larger firms than for smaller firms.
The variable multibid includes contests with rival bidders and revisions of
initial bidder’s offer. It is therefore by definition excluded from the initial
premium regression. The relationship between this variable and the final premium
was proven to be highly significant. Consequently, we see from the result that
when multiple bids occurred in the contests, the final premium increased with
14.4% at the unaffected share price and 13.3% compared to the last day of
trading.
8.2.2 Probability of success
Table 4 presents the results of the logit regression model on the estimated
probability of success in the bid contests. As seen in column 2 and 5, the results
are rather inconclusive of a toeholds determinacy in the full sample but
significantly improved for the hostile sub-sample. For the full sample, hostility
and competition in a bid contest decreases the probability of success as expected.
The effect on the initial bidders worsened outlooks in the contest is significant at a
1% level. Hostility is a commonly used explanation against the initial bidders
success.
It seems that cash as a payment method is a significant predictor of success.
The hard currency aspect of cash relative to stock payment, as discussed in 8.1,
Table 4
A presentation is given of the logit regression model used to define the determinants of the probability of
success in public takeover contests. The regression model is used on the full (202) and hostile (45) samples
separately. Size of toehold, final premium and the natural logarithm of target size are scale variables. Cash
payment, multiple bids in a contest and hostility are dummy variables. All variables are further presented
in chapter 7

40
increases the probability of a positive outcome by its value robustness for target
shareholders. This is an expected result given the previous discussion and the
available literature on the subject (Stavlos, 1987). In contrast to the significant
result of cash payment, the premium level and target size do not seem to
determine the final outcome in a bid contest for the full sample. For a large
sample of 202 contests of all sizes and firm fundamentals, these do not
independently seem to be a determinant of the success in a takeover contest.
The fit of the model for the full sample is a medium satisfactory 42%. This
could be attributed to the large amount of contests that were successful. A similar
disturbance to the result was found in Walkling (1985) who neither managed to
conclude on toehold relationships when hostile and friendly contests were studied
combined. A study with separated samples therefore had to be done. To our study,
we find two reasons for the insignificant effects in the regressions. First, the high
frequency of success across the full sample (84.5%) in combination with the
relatively low frequency of toeholds (37.6%) could be insufficient for
relationships to become evident. Second the frequency of unsuccessful contests is
higher in hostile takeovers in addition to a higher frequency of toeholds. The
observed negative coefficient of toeholds for the full sample could be understood
in this way and is therefore in a way slightly misleading. Subsequently, we cannot
find evidence for hypothesis 2 by studying the full sample. In order to avoid this
disruption, we attempt to run the logit regression model on the subsample of
hostile takeovers as presented in the robustness of the regression model in section
7.4.4. Differences could be expected as this includes a more dispersed distribution
of toeholds and success across the sample. In addition, bids in the sub-sample
hostile contests have all been rejected by the target board, which has previously
been stated as the most significant determinant of success in a takeover. In that
sense, it does not discriminate between contests recommended vis-à-vis not
recommended by the target board of directors.
Among the transactions that have been rejected by the board, the model
manages to provide a better explanation of the relationships, with an R2-value of
57.9%. Now, we can see a significant effect of toeholds and the size of the
company on the probability of success. Among the hostile contests, a revised bid
from the initial bidder or a rival bid being placed does not seem to affect the
probability of success in the model. Neither does the choice of payment method.
Interestingly, the final premium fails to determine the success outcome in the
contest. To us, this implies that firm characteristics or other fundamentals drives
the premium level and should hence not be included in a discussion were the level
of the bid premium is directly related to the probability of success. In essence,
something other has been of more significance to our model in the observed
takeovers, namely the possession of toeholds among the bidders.
To begin, the size of the toehold is significant in the way it determines the
contest outcome. A larger toehold increases the probability of success for the
initial bidder. This is consistent with hypothesis 2 and previous findings of
(Betton & Eckbo, 2000; Hirshleifer & Titman, 1990; Jennings & Mazeo, 1993
and Walkling, 1985)

41
Figure 7 (A) shows that a bidder with no toehold in a hostile takeover has a
probability to win of 12%. A toehold at the first level of disclosure (5%) increases
that probability to 19%. It is estimated more likely to succeed than loose at a
toehold level of 18%. For toeholds that triggers the mandatory bid principle in
Sweden at 30%, these have an estimated probability to win of at least 78%.
Intuitively, this means that all toeholds increase a bidders probability to win. If a
bidder could acquire a large block of shares in a company, it would most likely
lead to a successful takeover and subsequently the control of the company.
If we return to Table 4, not only the toehold mattered in the studied contests,
the other significant determinant was the market value of the target company. By
studying the hostile sample, target companies with smaller market values at t-42
were more likely to lead to an unsuccessful outcome.
In figure 7 (B), the 1st and 3
rd quartile of target companies are included. The
first conclusion that could be made is that the relationship of toehold size on the
increased probability of success is valid indifferent of the target firm’s size.
Second, the result indicates that it has been harder to push through a takeover of a
smaller firm. While this suggest additional analysis on the significance of toeholds
in relation to target firm’s size, we are satisfied to conclude that the relationships
are valid indifferent of target firm size. We are therefore in a position where the
results of the regression models could be summarized, discussed and
problematized in a wider scope related to the Swedish market for public
takeovers. Accordingly, this is being done in chapter 9.
0%
10%
20%
30%
40%
50%
60%
70%
80%
90%
100%
0 5 10 15 20 25 30 35 40 45 50
Pro
ba
bil
ity
of
succ
ess
in b
id c
on
test
Size of toehold in percentage
0%
10%
20%
30%
40%
50%
60%
70%
80%
90%
100%
0 5 10 15 20 25 30 35 40 45 50
Pro
ba
bil
ity
of
succ
ess
in
bid
co
nte
st
Size of toehold in percentage
Median
1st Quartile
3rd Quartile
A B
Fig. 7. A) Estimated probability of success among hostile takeovers. Assumptions based on median values from
Table 2. Example based on cash payment, bid premium of 31.8%, target market value 424MSEK and a single
bidder contest. B) Estimated probability of success among hostile takeovers of different sizes. Assumptions based
on median values from Table 2. Example uses cash payment, bid premium of 31.8%, target market value of 1st –
3rd quartile (162; 424; 2046msek) and a single bidder contest.

42
9 Conclusion
9.1 Summary and discussion
The focus of this thesis has been to analyse a bidder’s initial ownership in the
target firm, the toehold, and its ability to determine the bid premium and
probability to succeed in a Swedish public takeover contest. The study is based on
theories related to toeholds that currently seem unable to provide the reader with
an aligned view of the toeholds impact on the contest characteristics and its
outcome. Given the Swedish (i) disclosure rules and the (ii) shareholder structure
that clearly deviates from the US conditions, we identified conditions that
possibly could impact the applicability of the inconclusive theories. The purpose
of this thesis was to clarify the toeholds impact on bid premiums and the expected
bid success in Swedish public takeovers. The dataset collected for this thesis
consists of a total of 202 bid contests spanning from 1997 to 2012.
Given the current state of knowledge of the toehold relationships we
formulated two hypotheses, both covering two separated but interrelated areas of
importance in the toehold field. First, we expected the bid premiums to decrease
as the size of the toehold increased. Second, we expected that the larger the
toehold size owned by the initial bidder, the higher probability to win the bid
contest. Our hypotheses are based on the expectation that, with the regulatory
framework in place and the shareholder structure that characterise the Swedish
market, toeholds should be of larger size when present compared to previous
findings in US samples.
When analysing hypothesis 1, we found strong evidence for its negative
relationship to the bid premium. Already when separating contests into toehold
bidders and non-toehold bidders, the result witnessed of a possible relationship
between the groups where the average initial (final) premium was 11.4% (10.3%)
lower for toehold bidders. This strongly suggested that a relationship could be
proven. When then examining the full dataset using an OLS regression model, a
significant negative relationship could be seen. As suggested by our hypothesis,
the toehold coefficient turned out to be highly significant as a determinant of the
bid premium across all contests. This was clear evidence to hypothesis 1 and
consistent with the relationship predicted by Shleifer & Vishny (1986), Betton &
Eckbo (2000) and Goldman & Qian (2005) among others, while concurrently not
in support of the positive relationships suggested by Chowdry & Jegadeesh (1994)
and Burkart (1995).
Hypothesis 2 could partially be supported by our test. When using a logit
regression model to determine the probability of success for the initial bidder, the
full sample did not provide any significant results of a relationship between the

43
two variables. However, since the occurrence of toeholds and failed takeover
attempts has been unevenly distributed, with higher frequencies of both variables
in hostile takeovers, this result was rather expected. This has also been an issue
for previous researchers (Walkling, 1985). It was therefore reasonable to expect
more valid results by analysing the hostile sample separately, where contest
success was not disturbed by an overall high success rate. Consequently, when
analysing the hostile sample, the relationship between toehold size and probability
to win proved to be highly significant. The results confirmed our expectation that
the toehold size has a positive relationship with a successful contest outcome.
Therefore, if the bidder anticipated or experienced resistance from the target board
of directors, a toehold seemed to be useful to push the bid through consistent with
Betton et al. (2009). The results of hypothesis 2 hence support the predictions of
Hirshleifer & Titman (1990) that contest success is increasing with the size of the
toehold, independent of the bid premium level. This is also consistent with the
empirical results of Walkling (1985), Jennings & Mazeo (1993) and Betton &
Eckbo (2000). Our results however failed to support Chowdry & Jegadeesh
(1994) prediction that the toehold leads to a higher probability of success, but only
through the higher bid premium. This theory fails to find support in our result
partly through the lack of significance for the bid premiums impact on the
outcome, but also as toeholds bid premium relationship was negative as proven in
hypothesis 1.
Consequently, what conclusions can be made from the results of hypothesis 1
and 2 compared to what is already known? To begin, by including a chapter of the
regulatory deviations across countries, we presented arguments for why one
cannot take the results obtained from previous research on the US market for
granted when examining the situation in Sweden. We argue that one cannot fully
understand the conditions on the market for public takeovers by only analysing
differences in the shareholder structure. In order to explain toeholds presence and
their importance in a bid contest, one also has to consider the regulatory
conditions impacting, in our thesis focusing on how a toehold can be acquired or
disposed. Since the regulations on takeovers and share acquisitions differ across
the countries, the regulations would most likely affect the results. In addition,
Sweden has a high vote to capital ratio compared to other countries, with
regulations and market conditions that have facilitated the large shareholders.
These conditions are, seen by us, arguably the most important reason for the large
toeholds, seen on the Swedish market, consistent with our expectation. Moreover,
the findings hence highlight that relationships found on a sample of US takeovers
by (Betton et al., 2009) are valid for a market with a more concentrated
shareholder structure and stricter disclosure rules.
Now, if we consider the findings in hypotheses 1 and 2 to be true, they
indicate that toehold bidders can acquire firms cheaper, but still have a higher
expected probability to succeed. How could it be possible that toehold bidders win
more competitions but pay less in Swedish takeovers? One explanation for the
high probability to win is the deterring effect on potential entry of rival bidders in
a competition, as argued by Betton & Eckbo (2000), Hirshleifer & Titman (1990),
Jennings & Mazeo (1993) and Walkling (1985). A rival bidder is aware of the
44
toehold bidders incentives for aggressive bidding behaviour and his behaviour to
gain in the contest from the already owned shares in the target. Conditional on the
rival bidder not possessing a toehold, he lacks the benefits that the toehold owner
can utilize. We can based on above argue that there is less competition in a contest
with a toehold bidder due to the deterrence effect. This argument is consistent
with Stultz et al. (1990) and supported by our finding that less toehold bidders
were challenged with rival bids. In addition, in the contests where a rival bidder
entered the contest, they usually entered with an equal or better toehold state and
size as of the initial bidder. This was evident in 12 of 15 rival bids in our sample,
consistent with the findings in Betton & Eckbo (2000).
The uneven playing field caused by toeholds could hence be an explanation
and this thesis provides tentative support for the argument. However more
importantly, as discussed in the method chapter one should be aware of that a
public takeover is a complex process with a significant amount of undisclosed
information and discussions between actor without the public’s awareness. We
could expect, yet not conclude, that deterring effect in takeover contest could be
even bigger than what is possible to provide evidence for in this thesis.
If we then accept that the relationships hold, how would market actors comply
with it given that the Swedish shareholder structure is more focused than the US,
with toeholds both higher in frequency and larger in size? It could be argued that
the focused shareholder structure seen in Sweden cause impacts to amplify even
further. With larger deviations in strategic abilities between toehold and non-
toehold owners, a higher level of awareness among academics, practitioners and
regulators is required. We hence believe that the evolved Swedish shareholder
structure and regulations for takeovers and share acquisitions, to some extent, face
a risk of creating frictions by discriminating among the market actors ability to
compete in a takeover contest. It could be argued that the relationships and high
frequency of large controlling blockholders hence disallows the market to fully
function without inefficiencies.
Potential inefficiencies could be illustrated by two examples. In the first, we
consider a situation when a large shareholder initiates a takeover contest and a
rival bidder evaluates if to enter the competition or not. The first bidder’s toehold
position would work as a deterring tool against the rival bidder’s entrance, which
accordingly could refuse to enter the competition “naked” as he is aware of the
competitive advantage of the toehold owner. The rival bidder would be forced to
position him with an evenly large toehold position if he is determined to enter the
contest, as reported by Stultz et al. (1990) and Betton & Eckbo (2000). However,
it is hard for a rival bidder to match the toehold position held by a large owner by
acquiring shares in the market as a short-term strategy. Even if he manages to
acquire a desired block, it would most likely not be purchased to an unaffected
price due to the run-up costs caused by the high level of transparency of holdings
in Sweden. This reasoning will leave the large shareholder uncontested for the
target, resulting in less bidders and target shareholders’ loosing out on a potential
value maximization that a rival bidder would cause.
Second, inefficiencies are also evident in a situation when a bidder with no
toehold in the target consider bidding on a target, where the observed shareholder

45
contain one or several large shareholders. By applying the findings of Betton &
Eckbo (2000), and possibly anticipate competition from existing shareholders, this
initial bidder would want to enter the bid contest with an equally large toehold as
the large shareholder. If the bidder enters the contest naked and the large
shareholder decides to challenge as a rival bidder, our results shows that it is
highly likely that the large shareholder with a strong toehold position would win.
If bidding at all, a strategy of bidding with a toehold would hence be preferable.
As we have argued, the Swedish disclosure rules and the associated run up costs
prohibit the bidder to build a toehold unnoticed. Given the relationships found in
Sweden, we hence suspect that situations occur where large shareholders
systematically will benefit from their competitive advantage causing less
takeovers and an inactive takeover market for firms of this type.
Conclusively, this thesis has shown evidence that toehold bidders has a
substantial benefit when initiating a public takeover contest. The toehold bidder
pays on average a lower premium in the takeover and could be expected to win
more often. We have shown that the relationship is no different on the Swedish
market for public takeovers compared to prior research on a US sample. The
results therefore suggest that the abilities enabled through toeholds cause
inefficiencies on the market Swedish for corporate control, making it an area
suitable for further research.
9.2 Suggestion for future research
On the basis of the above-mentioned results, we find this subject to be of high
interest to evaluate further. A couple of aspects has been identified that could be
of interest to research more deeply. If beginning where our previous discussion
ended, the current Swedish condition for takeovers is something we identified as
ineffective in regards to toeholds impact on the competitive environment in a
takeover situation. However, no attempts are made in this thesis to analyse
potential amendments of the Swedish takeover regulations or other measures that
could reduce the competitive advantage currently in possession of large
shareholders. We are humble to the possibility that there might be certain aspects
regarding the takeover situation that we have not considered, or other benefits that
follows with the transparency in the current structure.
A study examining the consequences of different takeover regulations and
shareholder structures could be of great interest. For example, the US regulation
has been criticized for being poorly updated and unsuitable for a time period with
the current rapid information flows. A suggestion could be to research the
potential consequences of an updated set of regulations, with stricter disclosure
rules, and how the introduction could impact the US takeover market. Moreover,
by contrasting Sweden to markets with diverging takeover regulations, not
necessarily US or UK, one could enhance the understanding of the area. Perhaps
there is an optimal shareholder structure and takeover regulations that both protect
46
current owners from “corporate raiders”, yet facilitates an active takeover market
with emphasize on value maximization? Further research in this area is desirable.
If relating possible further research to the practical limitations that we have
experienced in this thesis, we identify several areas to add knowledge. A central
aspect in the argumentation throughout the thesis has been the price run-up costs
that occur pre-bid and the consequences that accompany short-term toehold
purchases. In the bid premium regression we indicated possible run-ups for large
targets, were a substantial difference was observed for the bid premiums when
comparing the values from different definitions. Our thesis would have been even
more thorough and robust if we would have been able to investigate the target
market movements before a bid announcement, and more closely examine the
market rumours including their impact on the share price. By adding variables on
target price run-ups and possible bid mark-ups for each contest, more of the
dynamics of the takeover situation could have been mapped. An examination of
the six months prior to bid announcement in relation to the toehold variables
impact on contest outcomes could be an interesting area to research further.
We have used quantitative methods in this thesis where the focus has been on
hard information available in databases. Two areas regarding more soft values
could be of interest to investigate. First, we noticed occasions where the toehold
owner announced a bid on the target, while controlling a number of the seats in
the board of directors. This complicates the boards procedure with their decision
making regarding whether to recommend the bid or not, as a large fraction of the
board is biased. Moreover, it could be assumed that aggressive takeover defences
rarely are activated when the bidder to a large extent owns the target. Target board
composition could hence be an important aspect that possibly impacts the
outcomes more than we could observe. This could very likely be a central
determinant for the probability of success when a toehold bidder initiates a
takeover contest. Second, we have argued that large blockholders presence in a
firm could have a deterring effect for bidders lacking toehold positions. An
examination of the frequency of blockholders in a target and the associated
characteristic of the takeover contest could provide valuable information. This is
especially interesting in takeover contest where the bid is submitted conditional
on a 90% acceptance rate. As an example, are we more likely to see takeover
attempts on targets with dispersed ownership with many small owners, or with a
low number of shareholders with corner positions that could block the takeover?
Differently put, to what extent is the targets shareholder structure a determinant of
takeover activity?
To conclude, we would like to analyse the bidding behaviour of toehold
bidders in more detail. This is particularly related to its bidding strategy. With the
finding in 8.1 of lower final bid premiums in hostile compared to friendly
takeovers in mind, could it be that toehold bidders skim the target with a low price
to take advantage of their bargaining power that the toehold brings? We would
hence like to find out more of bidders individual decision-making models that
accounts for both valuation metrics and contest characteristics. We therefore see
several areas of interest to explore in this subject and we expect much more to be
discovered on these puzzling relationships in the future.

47
10 Appendix
10.1 Correlation matrix of regression variables
10.2 List of Swedish public takeovers, 1997-2012
BORIGIN HOSTILE CASH TOESIZE RIVAL SUCCESS MULTIBID TARG.SZ FP42
BORIGIN - - - - - - - - -
HOSTILE 0.119 - - - - - - - -
CASH -0.082 -0.051 - - - - - - -
TOESIZE 0.175 0.284 0.216 - - - - - -
RIVAL 0.077 0.166 -0.144 -0.064 - - - - -
SUCCESS -0.158 -0.485 0.222 -0.057 -0.498 - - - -
MULTIBID 0.012 0.352 -0.071 0.037 0.619 -0.41 - - -
TARG.SZ -0.214 0.072 0.076 -0.132 0.122 -0.022 0.23 - -
FP42 -0.179 -0.139 0.03 -0.221 0.087 0.048 0.146 0.109 -

48
Nr
Date
of
Off
erT
arg
et c
om
pan
yB
uyer
Bu
yer
Dom
icil
M&
A W
ave
Dea
l T
yp
eP
aym
en
tT
oeh
old
Riv
al
Win
ner
Targ
et M
V*
1st
2n
dF
inal
Typ
eS
ize
Init
ial
Fin
al
Init
ial
Fin
al
Acc
epta
nce
Su
cces
sfu
l**
11997-0
3-1
7Ö
stgöta
Ensk
ilda
Ban
kD
en D
ansk
e B
ank A
SC
ross
-bord
er
Yes
Fri
endly
Cas
hN
o T
oeh
old
No
Init
ial
1474
50.5
50.5
No T
oeh
old
0.0
%n/a
n/a
90.0
%90.0
%>
50%
Yes
21997-0
5-1
5F
abeg
e A
B
Hufv
udst
aden
AB
Dom
esti
cY
esF
rien
dly
Sto
ckN
o T
oeh
old
Yes
Riv
aln/a
76.9
576.9
5N
o T
oeh
old
0.0
%n/a
n/a
14.0
%14.0
%0.0
%N
o
31997-0
8-0
6H
ufv
udst
aden
Inte
rnat
ional
Dil
igen
tia
Ab
Dom
esti
cY
esF
rien
dly
Sto
ckN
o T
oeh
old
No
Init
ial
4636
44.7
544.7
5N
o T
oeh
old
0.0
%24.0
%24.0
%25.0
%25.0
%96.5
%Y
es
41997-0
8-0
8G
OT
ICV
asak
ronan
Dom
esti
cY
esF
rien
dly
Cas
hN
o T
oeh
old
No
Init
ial
134
19.7
519.7
5N
o T
oeh
old
0.0
%16.2
%16.2
%12.9
%12.9
%97.0
%Y
es
51997-0
9-0
1IC
B S
hip
pin
g A
BF
rontl
ine
Ltd
Cro
ss-b
ord
er
Yes
Host
ile
Mix
edT
oeh
old
No
None
212
113.6
115
130
Short
31.0
%33.6
%52.9
%17.1
%34.0
%<
50%
No
61997-1
0-0
2T
rygg-H
ansa
S-E
-Ban
ken
AB
Dom
esti
cY
esF
rien
dly
Cas
hN
o T
oeh
old
No
Init
ial
10329
244
244
No T
oeh
old
0.0
%59.5
%59.5
%23.9
%23.9
%>
50%
Yes
71997-1
2-0
9L
inje
buss
CG
EA
Tra
nsp
ort
SA
Dom
esti
cY
esF
rien
dly
Cas
hT
oeh
old
No
Init
ial
806
112
112
Short
33.0
%77.8
%77.8
%22.4
%22.4
%>
50%
Yes
81998-0
3-1
6P
eak P
erfo
rman
ceC
arli
Gry
Inte
rnat
ional
A/S
Cro
ss-b
ord
er
Yes
Fri
endly
Cas
hN
o T
oeh
old
No
Init
ial
261
125
125
No T
oeh
old
0.0
%5.0
%5.0
%2.5
%2.5
%>
50%
Yes
91998-0
3-3
0N
K C
ityfa
stig
het
erH
ufv
udst
aden
AB
Dom
esti
cY
esF
rien
dly
Sto
ckN
o T
oeh
old
No
Init
ial
1148
74
74
No T
oeh
old
0.0
%25.4
%25.4
%10.4
%10.4
%98.3
%Y
es
10
1998-0
9-0
1B
enim
a F
erat
or
Engin
eeri
ng
Sig
ma
Ab
Dom
esti
cY
esF
rien
dly
Cas
hN
o T
oeh
old
No
Init
ial
188
34
34
No T
oeh
old
0.0
%4.6
%4.6
%36.0
%36.0
%93.0
%Y
es
11
1998-0
9-0
8N
äckeb
ro A
BD
rott
AB
Dom
esti
cY
esH
ost
ile
Cas
hT
oeh
old
No
Init
ial
3026
126
141
141
Short
10.3
%-0
.8%
11.0
%18.3
%32.4
%97%
Yes
12
1998-1
1-3
0P
lm A
bR
exam
Plc
Cro
ss-b
ord
er
Yes
Fri
endly
Cas
hN
o T
oeh
old
No
Init
ial
3672
118
118
No T
oeh
old
0.0
%39.6
%39.6
%38.0
%38.0
%>
50%
Yes
13
1998-1
2-0
2L
ilje
holm
en A
BD
uni
Dom
esti
cY
esH
ost
ile
Cas
hN
o T
oeh
old
Yes
Riv
al103
16
16
No T
oeh
old
0.0
%64.9
%64.9
%52.4
%52.4
%<
50%
No
14
1999-0
1-0
7S
pec
tra-
Physi
cs A
bT
her
mo I
nst
rum
ent
Syst
ems
Inc.
Cro
ss-b
ord
er
Yes
Fri
endly
Cas
hN
o T
oeh
old
No
Init
ial
1665
160
160
No T
oeh
old
0.0
%69.3
%69.3
%67.5
%67.5
%93.6
%Y
es
15
1999-0
2-0
1B
TL
Bil
sped
itio
nen
Sti
nnes
AG
Cro
ss-b
ord
er
Yes
Host
ile
Cas
hT
oeh
old
No
Init
ial
1434
45
45
Short
49.9
%38.5
%38.5
%47.5
%47.5
%98%
Yes
16
1999-0
2-1
1D
ahl
DIA
B (
EQ
T &
Rat
os)
Dom
esti
cY
esH
ost
ile
Cas
hT
oeh
old
No
Init
ial
1560
120
120
Long
28.0
%60.0
%60.0
%35.6
%35.6
%>
50%
Yes
17
1999-0
3-0
1P
rifa
st A
BB
alder
Dom
esti
cY
esF
rien
dly
Cas
hN
o T
oeh
old
No
Init
ial
1082
75
75
No T
oeh
old
0.0
%38.9
%38.9
%31.6
%31.6
%95.0
%Y
es
18
1999-0
3-0
8A
stic
us
AB
IVG
Im
mobil
ien A
G
Cro
ss-b
ord
er
Yes
Fri
endly
Cas
hN
o T
oeh
old
No
Init
ial
2352
117
117
No T
oeh
old
0.0
%56.0
%56.0
%37.6
%37.6
%98.7
0%
Yes
19
1999-0
4-2
6A
llm
enna
Sven
ska
Gods.
Dan
zas
Hold
ing A
gC
ross
-bord
er
Yes
Fri
endly
Cas
hN
o T
oeh
old
No
Init
ial
2365
265
265
No T
oeh
old
0.0
%28.0
%28.0
%23.8
%23.8
%>
50%
Yes
20
1999-0
4-2
9B
PA
Pro
curi
tas
Cap
ital
Par
tner
s ll
Dom
esti
cY
esF
rien
dly
Cas
hN
o T
oeh
old
No
Init
ial
844
30.5
30.5
No T
oeh
old
0.0
%33.8
%33.8
%27.1
%27.1
%>
50%
Yes
21
1999-0
5-1
2S
endit
Ab
Mic
roso
ft C
orp
ora
tion
Cro
ss-b
ord
er
Yes
Fri
endly
Cas
hN
o T
oeh
old
No
Init
ial
564
325
325
No T
oeh
old
0.0
%85.7
%85.7
%41.3
%41.3
%>
50%
Yes
22
1999-0
5-1
2G
ibec
kH
udso
n R
CI
Inc.
Cro
ss-b
ord
er
Yes
Fri
endly
Cas
hN
o T
oeh
old
No
Init
ial
163
115
115
No T
oeh
old
0.0
%85.5
%85.5
%33.7
%33.7
%>
50%
Yes
23
1999-0
6-2
9S
orb
Indust
ri A
BC
arl
Ben
net
AB
Dom
esti
cY
esF
rien
dly
Cas
hN
o T
oeh
old
No
Init
ial
n/a
45
45
No T
oeh
old
0.0
%n/a
n/a
1.1
%1.1
%>
50%
Yes
24
1999-0
8-1
0E
ldon A
bT
hule
Intr
esse
nte
r (E
QT
)D
om
esti
cY
esF
rien
dly
Cas
hN
o T
oeh
old
No
Init
ial
1223
205
205
No T
oeh
old
0.0
%51.9
%51.9
%41.4
%41.4
%67.9
%Y
es
25
1999-0
8-1
1M
eto
Chec
kpoin
t In
c.C
ross
-bord
er
Yes
Fri
endly
Cas
hN
o T
oeh
old
No
Init
ial
2059
65
65
No T
oeh
old
0.0
%n/a
n/a
62.5
%62.5
%>
50%
Yes
26
1999-0
8-1
6A
ga
Ab
Lin
de
Ag
Cro
ss-b
ord
er
Yes
Fri
endly
Cas
hT
oeh
old
No
Init
ial
10929
141
141
Short
7.0
%31.8
%31.8
%6.8
%6.8
%>
50%
Yes
27
1999-1
0-0
4W
ilken
son H
andsk
mak
arn
Wed
ins
Nord
en A
BD
om
esti
cY
esF
rien
dly
Sto
ckN
o T
oeh
old
No
Init
ial
108
66.1
566.1
5N
o T
oeh
old
0.0
%53.8
%53.8
%54.6
%54.6
%98.1
%Y
es
28
1999-1
1-0
1H
um
legår
den
Län
sförs
äkri
ngar
Dom
esti
cY
esF
rien
dly
Cas
hN
o T
oeh
old
No
Init
ial
756
91.7
591.7
5N
o T
oeh
old
0.0
%56.8
%56.8
%39.0
%39.0
%>
50%
Yes
29
1999-1
1-0
1N
&T
Arg
onaut
Sim
bel
Invest
men
t A
BD
om
esti
cY
esF
rien
dly
Cas
hT
oeh
old
No
Init
ial
238
8.1
8.1
Long
19.3
%40.9
%40.9
%40.9
%40.9
%95.9
%Y
es
30
1999-1
1-1
6C
elsi
us
Ab
Saa
b A
bD
om
esti
cY
esF
rien
dly
Cas
hN
o T
oeh
old
No
Init
ial
2770
179
179
No T
oeh
old
0.0
%62.0
%62.0
%31.1
%31.1
%99.0
%Y
es
31
1999-1
1-2
6G
ranin
gev
erken
sG
ranin
ge
Dom
esti
cY
esF
rien
dly
Sto
ckN
o T
oeh
old
No
Init
ial
8839
132
132
No T
oeh
old
0.0
%-0
.8%
-0.8
%1.5
%1.5
%97.5
%Y
es
32
1999-1
2-0
3G
uid
e K
onsu
lt A
bF
ram
fab A
bD
om
esti
cY
esF
rien
dly
Sto
ckN
o T
oeh
old
No
Init
ial
768
209
209
No T
oeh
old
0.0
%79.4
%79.4
%25.9
%25.9
%98.0
%Y
es
33
1999-1
2-2
2A
lthin
Med
ical
Ab
Bax
ter
Inte
rnat
ional
Inc.
Cro
ss-b
ord
er
Yes
Fri
endly
Cas
hT
oeh
old
No
Init
ial
232
100
100
Short
1.7
%n/a
n/a
47.1
%47.1
%99.7
%Y
es
34
2000-0
2-0
9F
asti
ghet
s B
alder
AB
Dro
tt A
BD
om
esti
cY
esH
ost
ile
Cas
hN
o T
oeh
old
No
Init
ial
371
135
140
140
No T
oeh
old
0.0
%33.7
%38.6
%32.4
%37.3
%95%
Yes
35
2000-0
2-1
4K
jess
ler
& M
anner
strå
leT
ract
ion
Dom
esti
cY
esF
rien
dly
Cas
hT
oeh
old
Yes
Riv
al171
65
65
Long
40.0
%54.8
%54.8
%20.4
%20.4
%<
50%
No
36
2000-0
2-1
7E
vid
enti
aC
laes
son &
Ander
zen I
nvest
Dom
esti
cY
esF
rien
dly
Cas
hT
oeh
old
No
Init
ial
622
91
91
Short
18.0
%12.3
%12.3
%13.8
%13.8
%98.0
%Y
es
37
2000-0
4-0
4B
t In
dust
ries
Ab
Toyota
Auto
mat
ic L
tdC
ross
-bord
er
Yes
Fri
endly
Cas
hN
o T
oeh
old
No
Init
ial
4956
275
275
No T
oeh
old
0.0
%55.4
%55.4
%35.5
%35.5
%>
50%
Yes
38
2000-0
4-1
0P
erst
orp
Ab
Per
storp
Intr
esse
nte
r A
bD
om
esti
cY
esF
rien
dly
Cas
hT
oeh
old
No
Init
ial
761
140
140
Long
5.4
%57.3
%57.3
%32.1
%32.1
%68.0
%Y
es
39
2000-0
4-1
2P
rovobis
Hote
l &
Res
t. A
bS
candic
Hote
ls A
bD
om
esti
cY
esF
rien
dly
Cas
hN
o T
oeh
old
No
Init
ial
352
37
37
No T
oeh
old
0.0
%100.0
%100.0
%85.0
%85.0
%98.6
%Y
es
40
2000-0
5-0
8F
olk
ebola
gen
Lin
dab
AB
Dom
esti
cY
esF
rien
dly
Cas
hN
o T
oeh
old
No
Init
ial
33
43.5
43.5
No T
oeh
old
0.0
%64.2
%64.2
%55.4
%55.4
%82%
Yes
41
2000-0
6-2
1S
ved
ala
Indust
ri A
bM
etso
Oyj
Cro
ss-b
ord
er
Yes
Fri
endly
Cas
hT
oeh
old
No
Init
ial
6458
185.1
185.1
Short
0.5
%37.6
%37.6
%54.3
%54.3
%92.0
%Y
es
42
2000-0
8-1
6Ir
o A
bM
ichel
Van
De
Wie
le N
vC
ross
-bord
er
Yes
Fri
endly
Cas
hN
o T
oeh
old
No
Init
ial
950
122.5
122.5
No T
oeh
old
0.0
%61.2
%61.2
%30.3
%30.3
%99.8
%Y
es
43
2000-0
8-2
1N
orr
port
en F
asti
ghet
s A
bN
s H
old
ing A
bD
om
esti
cY
esF
rien
dly
Cas
hT
oeh
old
No
Init
ial
899
140
140
Short
23.4
%31.5
%31.5
%19.1
%19.1
%98.6
%Y
es
44
2000-0
8-2
2A
llgon A
BL
GP
Tel
ecom
Hold
ing A
BD
om
esti
cY
esH
ost
ile
Sto
ckT
oeh
old
Yes
None
3324
143.3
6143.4
Short
1.0
%21.5
%21.5
%46.3
%46.3
%17%
No
45
2000-0
8-2
8G
yll
ing O
pti
ma
Bat
teri
es A
BJo
hnso
n C
ontr
ols
Inc.
Cro
ss-b
ord
er
Yes
Fri
endly
Cas
hN
o T
oeh
old
No
Init
ial
322
20
20
No T
oeh
old
0.0
%n/a
n/a
78.6
%78.6
%99.0
%Y
es
46
2000-0
9-1
3A
rete
Ab
Turn
it A
bD
om
esti
cY
esF
rien
dly
Sto
ckN
o T
oeh
old
No
Init
ial
293
214.5
214.5
No T
oeh
old
0.0
%61.3
%61.3
%53.8
%53.8
%92.3
%Y
es
47
2000-0
9-2
7D
ios-
Ander
s D
ios
Ab
Ap F
asti
ghet
er A
bD
om
esti
cY
esF
rien
dly
Cas
hN
o T
oeh
old
No
Init
ial
1247
78
78
No T
oeh
old
0.0
%47.2
%47.2
%32.2
%32.2
%91.0
%Y
es
48
2000-1
0-0
6F
b I
ndust
ri H
old
ing A
bB
ergm
an &
Bev
ing A
bD
om
esti
cY
esF
rien
dly
Cas
hN
o T
oeh
old
No
Init
ial
78
30
30
No T
oeh
old
0.0
%42.9
%42.9
%46.3
%46.3
%71.0
%Y
es
49
2000-1
1-2
7C
olu
mna
Fas
tighet
er A
BC
ellf
abri
ken
AB
Dom
esti
cY
esH
ost
ile
Mix
edN
o T
oeh
old
No
None
340
0.4
0.4
No T
oeh
old
0.0
%5.3
%5.3
%17.6
%17.6
%17%
No
50
2001-0
1-1
0A
rtem
a M
edic
al A
bC
ardia
c S
cien
ce I
nc.
Cro
ss-b
ord
er
No
Fri
endly
Sto
ckN
o T
oeh
old
No
Init
ial
99
12.9
612.9
6N
o T
oeh
old
0.0
%97.9
%97.9
%n/a
n/a
95.0
%Y
es
51
2001-0
1-2
6S
eger
stro
m &
Sven
sson A
bS
anm
ina
Corp
ora
tion
Cro
ss-b
ord
er
No
Fri
endly
Sto
ckN
o T
oeh
old
No
Init
ial
2444
180
180
No T
oeh
old
0.0
%59.3
%59.3
%72.2
%72.2
%97.8
%Y
es
52
2001-0
2-1
2IM
G A
bV
isio
n P
ark E
nte
rtai
nm
ent A
bD
om
esti
cN
oF
rien
dly
Sto
ckN
o T
oeh
old
No
Init
ial
31
20.8
20.8
No T
oeh
old
0.0
%70.5
%70.5
%22.4
%22.4
%98.0
%Y
es
53
2001-0
2-1
9A
tle
Ab
Woodro
se I
nvest
Ab
Dom
esti
cN
oF
rien
dly
Cas
hN
o T
oeh
old
No
Init
ial
7228
153
153
No T
oeh
old
0.0
%15.5
%15.5
%16.8
%16.8
%97.0
%Y
es
54
2001-0
2-2
1S
ydkra
ft A
bE
On S
candin
avia
Ab
Dom
esti
cN
oF
rien
dly
Cas
hT
oeh
old
No
Init
ial
16667
240
240
Short
42.8
%60.0
%60.0
%3.0
%3.0
%>
50%
Yes
Ou
tcom
eD
eal
Ch
ara
chte
rist
ics
Fu
nd
am
en
tals
Bid
Seq
uen
ce i
n S
EK
Toeh
old
Pre
miu
m t
-42
Pre
miu
m t
-1

49
Nr
Date
of
Off
erT
arget
com
pan
yB
uyer
Bu
yer
Dom
icil
M&
A W
ave
Dea
l T
yp
eP
aym
en
tT
oeh
old
Riv
al
Win
ner
Target
MV
*1st
2n
dF
inal
Typ
eS
ize
Init
ial
Fin
al
Init
ial
Fin
al
Acc
epta
nce
Su
cces
sfu
l**
55
2001-0
2-2
6S
ven
ska
Bra
nd
Län
sförs
äkri
ngar
Ab
Dom
esti
cN
oF
rien
dly
Cas
hT
oeh
old
No
Init
ial
143
81
81
Short
0.8
%42.1
%42.1
%39.7
%39.7
%93.1
%Y
es
56
2001-0
3-2
2P
erst
orp
AB
Sydsv
ensk
a K
emi A
B (
publ)
Dom
esti
cN
oF
rien
dly
Cas
hN
o T
oeh
old
No
Init
ial
624
122.1
122.1
No T
oeh
old
0.0
%67.3
%67.3
%45.4
%45.4
%98.6
%Y
es
57
2001-0
4-1
0M
atte
us
Ab
Nh N
ord
iska
Hold
ing A
bD
om
esti
cN
oF
rien
dly
Sto
ckN
o T
oeh
old
Yes
Init
ial
333
18
18
No T
oeh
old
0.0
%12.5
%12.5
%44.0
%44.0
%97.0
%Y
es
58
2001-0
4-2
3E
nir
o A
bS
eat
Pag
ine
Gia
lle
Spa
Cro
ss-b
ord
er
No
Fri
endly
Mix
edN
o T
oeh
old
No
None
15,7
50
164.4
9164.5
No T
oeh
old
0.0
%56.7
%56.7
%35.9
%35.9
%<
50%
No
59
2001-0
4-2
3S
candic
Hote
ls A
BH
ilto
n G
roup P
LC
Cro
ss-b
ord
er
No
Fri
endly
Mix
edN
o T
oeh
old
No
Init
ial
7,5
90
144
144
No T
oeh
old
0.0
%25.2
%25.2
%30.9
%30.9
%98.0
%Y
es
60
2001-0
5-1
1Ja
cobso
n &
Wid
mar
k A
bW
sp G
roup P
lcC
ross
-bord
er
No
Fri
endly
Cas
hN
o T
oeh
old
No
Init
ial
775
200
200
No T
oeh
old
0.0
%33.3
%33.3
%17.6
%17.6
%>
50%
Yes
61
2001-0
5-1
7M
atte
us
AB
Ara
gon F
KC
ross
-bord
er
No
Host
ile
Mix
edN
o T
oeh
old
Yes
Riv
al277
16.8
518
18
No T
oeh
old
0.0
%26.7
%35.3
%6.6
%13.9
%0%
No
62
2001-0
5-3
1F
rilu
ftsb
ola
get
E&
S A
BF
jäll
räven
AB
Dom
esti
cN
oF
rien
dly
Cas
hT
oeh
old
No
Init
ial
75
10
10
Long
18.1
%17.6
%17.6
%5.3
%5.3
%96.0
%Y
es
63
2001-0
6-1
5L
indab A
bL
indab I
ntr
esse
nte
r A
bD
om
esti
cN
oF
rien
dly
Cas
hN
o T
oeh
old
No
Init
ial
2,2
26
158
158
No T
oeh
old
0.0
%50.5
%50.5
%17.0
%17.0
%99%
Yes
64
2001-0
6-2
1L
undin
Oil
Ab
Tal
ism
an E
ner
gy I
nc.
Cro
ss-b
ord
er
No
Fri
endly
Cas
hN
o T
oeh
old
No
Init
ial
209
36.5
36.5
No T
oeh
old
0.0
%79.8
%79.8
%-0
.3%
-0.3
%97.0
%Y
es
65
2001-0
9-0
3V
isio
n P
ark E
nt.
Ab
Kf
Med
ia A
bD
om
esti
cN
oF
rien
dly
Cas
hN
o T
oeh
old
No
Init
ial
94
55
No T
oeh
old
0.0
%-1
.0%
-1.0
%19.0
%19.0
%93.3
%Y
es
66
2001-0
9-2
4Å
ngpannefö
renin
gen A
BS
wec
o A
BD
om
esti
cN
oH
ost
ile
Mix
edT
oeh
old
No
None
786
185
195
195
Short
13.0
%25.9
%32.7
%32.1
%39.3
%<
50%
No
67
2001-1
0-1
0A
ssiD
om
än A
BS
vea
skog
Dom
esti
cN
oF
rien
dly
Cas
hT
oeh
old
No
Init
ial
22,4
09
360
360
Long
35.3
%52.9
%52.9
%35.8
%35.8
%95.0
%Y
es
68
2001-1
0-2
5N
etw
ise
AB
Tri
o A
BD
om
esti
cN
oH
ost
ile
Sto
ckN
o T
oeh
old
No
None
37
9.5
14
14.0
6N
o T
oeh
old
0.0
%5.6
%56.2
%58.3
%134.3
%26%
No
69
2001-1
1-1
9S
candin
avia
Onli
ne
Enir
o A
BD
om
esti
cN
oF
rien
dly
Cas
hN
o T
oeh
old
No
Init
ial
136
11.5
11.5
No T
oeh
old
0.0
%n/a
n/a
64.3
%64.3
%98.0
%Y
es
70
2001-1
2-1
7K
ipli
ng H
old
ing A
bD
imen
sion A
bD
om
esti
cN
oF
rien
dly
Cas
hN
o T
oeh
old
No
Init
ial
23
77
No T
oeh
old
0.0
%25.0
%25.0
%17.6
%17.6
%91.7
%Y
es
71
2001-1
2-2
8M
edit
eam
Den
tal A
bM
eda
Ab
Dom
esti
cN
oH
ost
ile
Sto
ckN
o T
oeh
old
No
None
42
7.1
25
7.1
25
No T
oeh
old
0.0
%18.8
%18.8
%15.9
%15.9
%<
50%
No
72
2002-0
1-1
7Jo
hnso
n P
um
p A
BT
MT
One
AB
Dom
esti
cN
oF
rien
dly
Cas
hN
o T
oeh
old
No
Init
ial
233
24
24
No T
oeh
old
0.0
%14.3
%14.3
%0.0
%0.0
%99%
Yes
73
2002-0
1-2
9M
unksj
ö A
BJe
ffer
son S
murf
it H
old
ings
Cro
ss-b
ord
er
No
Host
ile
Cas
hT
oeh
old
No
Init
ial
2,6
87
77
85
85
Long
33.0
%24.2
%37.1
%20.3
%32.8
%97%
Yes
74
2002-0
2-1
8IM
S D
ata
AB
Mar
tinss
on G
ruppen
Dom
esti
cN
oF
rien
dly
Cas
hN
o T
oeh
old
No
Init
ial
91
4.0
54.0
5N
o T
oeh
old
0.0
%12.5
%12.5
%76.1
%76.1
%91.3
5%
Yes
75
2002-0
4-2
3R
eali
a A
bC
olu
mna
Fas
tighete
r A
bD
om
esti
cN
oF
rien
dly
Mix
edT
oeh
old
No
Init
ial
32
93.2
593.2
5L
ong
47.0
%15.1
%15.1
%15.1
%15.1
%94.3
%Y
es
76
2002-0
5-2
4E
ssel
te A
bJ.
W. C
hil
ds
Ass
oci
ates
Cro
ss-b
ord
er
No
Fri
endly
Cas
hN
o T
oeh
old
No
Init
ial
1,4
37
90
90
No T
oeh
old
0.0
%40.6
%40.6
%10.4
%10.4
%97.0
%Y
es
77
2002-0
7-0
5P
ronyx A
bT
elec
a A
bD
om
esti
cN
oF
rien
dly
Cas
hN
o T
oeh
old
No
Init
ial
21
3.3
3.3
No T
oeh
old
0.0
%3.1
%3.1
%15.4
%15.4
%95%
Yes
78
2002-0
8-0
1S
apa
Ab
Elk
em S
ver
ige
Ab
Dom
esti
cN
oF
rien
dly
Cas
hT
oeh
old
No
Init
ial
6,3
55
175
175
Long
43.0
%0.9
%0.9
%1.2
%1.2
%71.4
%Y
es
79
2002-0
8-2
9JP
Nord
iska
AB
Kau
pth
ing B
ank h
f.C
ross
-bord
er
No
Host
ile
Sto
ckT
oeh
old
No
Init
ial
393
12
12
Short
28.0
%33.3
%33.3
%41.2
%41.2
%86%
Yes
80
2003-0
1-0
9E
psi
lon H
old
ing A
bD
anir
Ab
Dom
esti
cY
esF
rien
dly
Cas
hT
oeh
old
No
Init
ial
192
22
22
Long
46.7
%7.3
%7.3
%27.9
%27.9
%94%
Yes
81
2003-0
1-2
1A
llgon A
bL
gp T
elec
om
Hold
ing A
bD
om
esti
cY
esF
rien
dly
Sto
ckN
o T
oeh
old
No
Init
ial
622
28.4
928.4
9N
o T
oeh
old
0.0
%29.5
%29.5
%78.1
%78.1
%75%
Yes
82
2003-0
2-1
7S
candia
consu
lt A
bR
ambøll
A/S
Cro
ss-b
ord
er
Yes
Fri
endly
Cas
hT
oeh
old
No
Init
ial
956
46
47
47
Short
34.0
%15.0
%17.5
%0.0
%2.2
%99.1
%Y
es
83
2003-0
3-1
2R
eali
a A
bW
elkin
s In
tres
sente
r A
bD
om
esti
cY
esF
rien
dly
Cas
hT
oeh
old
No
Init
ial
292
38
38
Long
46.0
%26.7
%26.7
%15.2
%15.2
%79.0
%Y
es
84
2003-0
3-2
0M
andam
us
Fas
tighete
r A
bL
rf F
asti
ghete
r A
bD
om
esti
cY
esF
rien
dly
Cas
hT
oeh
old
Yes
Riv
al1,5
51
84
84
Long
27.5
%11.3
%11.3
%13.5
%13.5
%40.7
%N
o
85
2003-0
4-0
6B
iora
Ab
Str
aum
ann H
old
ing A
gC
ross
-bord
er
Yes
Fri
endly
Cas
hN
o T
oeh
old
No
Init
ial
304
17
17
No T
oeh
old
0.0
%32.8
%32.8
%40.5
%40.5
%87.0
%Y
es
86
2003-0
6-1
3F
asti
ghets
Ab C
elt
ica
Lju
ngberg
gru
ppen A
bD
om
esti
cY
esF
rien
dly
Cas
hT
oeh
old
No
Init
ial
139
58
58
Short
15.2
%16.0
%16.0
%13.7
%13.7
%99.7
%Y
es
87
2003-0
6-2
6P
erbio
Sci
ence
Ab
Fis
cher
Sci
enti
fic
Sw
eden
Ab
Dom
esti
cY
esF
rien
dly
Cas
hN
o T
oeh
old
No
Init
ial
3,7
92
142.5
155
155
No T
oeh
old
0.0
%37.7
%49.8
%14.0
%24.0
%98.7
%Y
es
88
2003-0
9-1
9B
inar
Ele
ktr
onik
AB
Pom
ona-
gru
ppen
Dom
esti
cY
esF
rien
dly
Cas
hT
oeh
old
No
Init
ial
18
10.7
514
14
Long
48.7
%21.3
%58.0
%22.9
%60.0
%0.6
%N
o
89
2003-1
0-2
0F
asti
ghets
Ab T
orn
et
Lrt
Acq
uis
itio
n A
bD
om
esti
cY
esF
rien
dly
Cas
hN
o T
oeh
old
No
Init
ial
4,6
48
190
190
No T
oeh
old
0.0
%8.6
%8.6
%6.4
%6.4
%82.4
%Y
es
90
2003-1
1-2
1P
andox A
BA
PE
S H
old
ing
Cro
ss-b
ord
er
Yes
Host
ile
Cas
hT
oeh
old
No
Init
ial
2,0
42
105
108
108
Short
36.2
%28.0
%31.7
%-1
.9%
0.9
%99%
Yes
91
2003-1
1-2
4D
imen
sion A
bP
roac
t It
Gro
up A
bD
om
esti
cY
esF
rien
dly
Cas
hN
o T
oeh
old
No
Init
ial
87
2.9
2.9
No T
oeh
old
0.0
%3.6
%3.6
%76.8
%76.8
%94.6
%Y
es
92
2003-1
1-3
0L
GP
All
gon H
old
ing A
BP
ow
erw
ave
Tec
hnolo
gie
s In
c.
Cro
ss-b
ord
er
Yes
Fri
endly
Cas
hN
o T
oeh
old
No
Init
ial
1,4
69
61.8
961.8
9N
o T
oeh
old
0.0
%n/a
n/a
38.1
%38.1
%96.7
0%
Yes
93
2003-1
2-1
6U
tfors
Ab
Tel
enor
Asa
Cro
ss-b
ord
er
Yes
Fri
endly
Cas
hN
o T
oeh
old
No
Init
ial
1,0
18
0.9
90.9
9N
o T
oeh
old
0.0
%-1
5.4
%-1
5.4
%0.0
%0.0
%98.4
%Y
es
94
2003-1
2-1
7K
aroli
n M
achin
e T
ool A
BN
ord
stje
rnan
Dom
esti
cY
esF
rien
dly
Cas
hT
oeh
old
No
None
258
51
51
Long
40.1
%-1
.0%
-1.0
%-1
5.0
%-1
5.0
%40.1
%N
o
95
2003-1
2-1
8H
ois
t In
tern
atio
nal A
BH
ois
t In
tres
sente
rD
om
esti
cY
esF
rien
dly
Cas
hT
oeh
old
Yes
Init
ial
228
18
21
21
Long
34.5
%22.4
%42.9
%29.5
%51.1
%51.0
%Y
es
96
2004-0
6-2
9D
rott
AB
Ste
na
Fas
tighets
förv
alt
nin
g A
bD
om
esti
cY
esF
rien
dly
Cas
hT
oeh
old
No
Init
ial
54
150
150
Long
37.9
%42.9
%42.9
%50.8
%50.8
%93.0
%Y
es
97
2004-0
7-1
9F
abeg
e A
B
Wih
lborg
s F
asti
ghete
r A
bD
om
esti
cY
esF
rien
dly
Mix
edT
oeh
old
No
Init
ial
6,0
24
108
108
Long
41.1
%11.9
%11.9
%5.4
%5.4
%99%
Yes
98
2004-0
7-2
8B
rio A
bP
roventu
s In
dust
rier
Ab
Dom
esti
cY
esH
ost
ile
Cas
hT
oeh
old
No
None
145
48
48
Short
42.0
%-2
.0%
-2.0
%-1
2.7
%-1
2.7
%43%
No
99
2004-0
8-2
4F
rango A
bC
ognos
Inc.
Cro
ss-b
ord
er
Yes
Fri
endly
Cas
hN
o T
oeh
old
No
Init
ial
232
85
86
85.5
No T
oeh
old
0.0
%55.3
%56.2
%63.5
%64.4
%98%
Yes
100
2004-0
8-3
1V
lt A
bM
edia
intr
esse
nte
r P
lms
Ab
Dom
esti
cY
esF
rien
dly
Cas
hT
oeh
old
No
Init
ial
448
120
120
Long
47.0
%33.3
%33.3
%33.0
%33.0
%59%
Yes
101
2004-0
9-1
4S
ong N
etw
ork
s H
old
ing A
bT
dc
A/S
Cro
ss-b
ord
er
Yes
Fri
endly
Cas
hN
o T
oeh
old
Yes
Init
ial
2,3
30
70
83
95
No T
oeh
old
0.0
%57.3
%113.5
%47.4
%100.0
%97%
Yes
102
2004-1
1-1
5F
innveden
AB
Nord
ic C
apit
alD
om
esti
cY
esF
rien
dly
Cas
hN
o T
oeh
old
No
Init
ial
1,7
04
75
75
No T
oeh
old
0.0
%16.7
%16.7
%35.1
%35.1
%70%
Yes
103
2004-1
1-1
9A
inax
Ab
Sca
nia
Ab
Dom
esti
cY
esF
rien
dly
Sto
ckN
o T
oeh
old
No
Init
ial
6,5
98
274
274
No T
oeh
old
0.0
%13.5
%13.5
%-1
.8%
-1.8
%96%
Yes
104
2005-0
4-1
3F
oca
l P
oin
t A
bT
elel
ogic
Ab
Dom
esti
cY
esF
rien
dly
Mix
edN
o T
oeh
old
No
Init
ial
74
20.1
320.1
3N
o T
oeh
old
0.0
%33.3
%33.3
%0.6
%0.6
%92%
Yes
105
2005-0
4-2
0T
rio A
bN
etw
ise
Ab
Dom
esti
cY
esF
rien
dly
Sto
ckN
o T
oeh
old
No
None
160
2.8
72.8
71
No T
oeh
old
0.0
%14.9
%14.9
%14.9
%14.9
%0%
No
106
2005-0
5-1
2R
iddarh
ytt
an R
eso
urc
es A
bA
gnic
o-E
agle
Min
es L
tdC
ross
-bord
er
Yes
Fri
endly
Sto
ckT
oeh
old
No
Init
ial
772
10.2
510.2
5L
ong
14.0
%40.4
%40.4
%27.3
%27.3
%97%
Yes
107
2005-0
6-2
9R
örv
ik T
imber
Ab
Ittu
r In
dust
rier
Ab
Dom
esti
cY
esH
ost
ile
Cas
hT
oeh
old
No
Init
ial
162
12
12
Long
37.0
%-1
1.1
%-1
1.1
%-3
.2%
-3.2
%76%
Yes
108
2005-0
7-1
2K
arls
ham
ns
Ab
Bns
Indust
rier
Ab
Dom
esti
cY
esF
rien
dly
Mix
edN
o T
oeh
old
No
Init
ial
2,4
57
117
117
Long
30.9
%n/a
n/a
0.4
%0.4
%96%
Yes
Ou
tcom
eF
un
dam
en
tals
Deal
Ch
arach
teris
tics
Bid
Seq
uen
ce i
n S
EK
Toeh
old
Pre
miu
m t
-42
Pre
miu
m t
-1
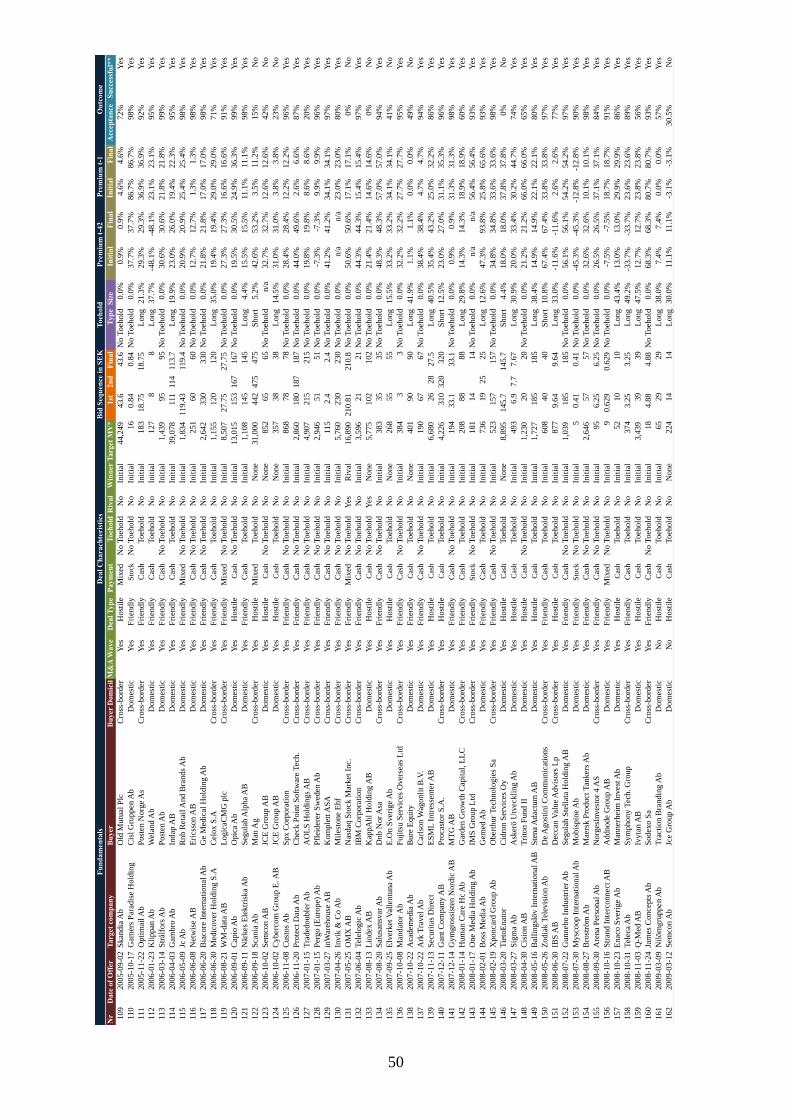
50
Nr
Date
of
Off
erT
arget
com
pan
yB
uyer
Bu
yer
Dom
icil
M&
A W
ave
Dea
l T
yp
eP
aym
en
tT
oeh
old
Riv
al
Win
ner
Target
MV
*1st
2n
dF
inal
Typ
eS
ize
Init
ial
Fin
al
Init
ial
Fin
al
Acc
epta
nce
Su
cces
sfu
l**
109
2005-0
9-0
2S
kan
dia
Ab
Old
Mutu
al P
lcC
ross
-bord
er
Yes
Host
ile
Mix
edN
o T
oeh
old
No
Init
ial
44,2
49
43.6
43.6
No T
oeh
old
0.0
%0.9
%0.9
%4.6
%4.6
%72%
Yes
110
2005-1
0-1
7G
amer
s P
arad
ise
Hold
ing
Cis
l G
ruppen A
bD
om
esti
cY
esF
rien
dly
Sto
ckN
o T
oeh
old
No
Init
ial
16
0.8
40.8
4N
o T
oeh
old
0.0
%37.7
%37.7
%86.7
%86.7
%98%
Yes
111
2005-1
1-2
2O
pti
mai
l A
bP
ost
en N
org
e A
sC
ross
-bord
er
Yes
Fri
endly
Cas
hT
oeh
old
No
Init
ial
183
18.7
518.7
5L
ong
21.3
%29.3
%29.3
%36.9
%36.9
%92%
Yes
112
2006-0
1-2
3K
lippan A
bW
elan
d A
bD
om
esti
cY
esF
rien
dly
Cas
hT
oeh
old
No
Init
ial
127
88
Long
37.7
%-4
8.1
%-4
8.1
%23.1
%23.1
%95%
Yes
113
2006-0
3-1
4S
trål
fors
Ab
Post
en A
bD
om
esti
cY
esF
rien
dly
Cas
hN
o T
oeh
old
No
Init
ial
1,4
39
95
95
No T
oeh
old
0.0
%30.6
%30.6
%21.8
%21.8
%99%
Yes
114
2006-0
4-0
3G
ambro
Ab
Indap A
BD
om
esti
cY
esF
rien
dly
Cas
hT
oeh
old
No
Init
ial
39,0
78
111
114
113.7
Long
19.9
%23.0
%26.0
%19.4
%22.3
%95%
Yes
115
2006-0
5-0
9Jc
Ab
Rnb R
eta
il A
nd B
rands
Ab
Dom
esti
cY
esF
rien
dly
Mix
edN
o T
oeh
old
No
Init
ial
1,8
34
119.4
3119.4
No T
oeh
old
0.0
%20.9
%20.9
%25.4
%25.4
%98%
Yes
116
2006-0
6-0
8N
etw
ise
AB
Eri
csso
n A
BD
om
esti
cY
esF
rien
dly
Cas
hN
o T
oeh
old
No
Init
ial
251
60
60
No T
oeh
old
0.0
%12.7
%12.7
%1.3
%1.3
%98%
Yes
117
2006-0
6-2
0B
iaco
re I
nte
rnat
ional A
bG
e M
edic
al H
old
ing A
bD
om
esti
cY
esF
rien
dly
Cas
hN
o T
oeh
old
No
Init
ial
2,6
42
330
330
No T
oeh
old
0.0
%21.8
%21.8
%17.0
%17.0
%98%
Yes
118
2006-0
6-3
0M
edic
over
Hold
ing S
.AC
elox S
.AC
ross
-bord
er
Yes
Fri
endly
Cas
hT
oeh
old
No
Init
ial
1,1
55
120
120
Long
35.0
%19.4
%19.4
%29.0
%29.0
%71%
Yes
119
2006-0
8-2
1W
M-d
ata
AB
Logic
aCM
G p
lcC
ross
-bord
er
Yes
Fri
endly
Mix
edN
o T
oeh
old
No
Init
ial
8,5
07
27.7
527.7
5N
o T
oeh
old
0.0
%27.3
%27.3
%16.6
%16.6
%91%
Yes
120
2006-0
9-0
1C
apio
Ab
Opic
a A
bD
om
esti
cY
esH
ost
ile
Cas
hN
o T
oeh
old
No
Init
ial
13,0
15
153
167
167
No T
oeh
old
0.0
%19.5
%30.5
%24.9
%36.3
%99%
Yes
121
2006-0
9-1
1N
ärkes
Ele
ktr
iska
Ab
Seg
ula
h A
lpha A
BD
om
esti
cY
esF
rien
dly
Cas
hT
oeh
old
No
Init
ial
1,1
08
145
145
Long
4.4
%15.5
%15.5
%11.1
%11.1
%98%
Yes
122
2006-0
9-1
8S
cania
Ab
Man
Ag
Cro
ss-b
ord
er
Yes
Host
ile
Mix
edT
oeh
old
No
None
31,0
00
442
475
475
Short
5.2
%42.6
%53.2
%3.5
%11.2
%15%
No
123
2006-1
0-0
2S
emco
n A
BJC
E G
roup A
BD
om
esti
cY
esH
ost
ile
Cas
hN
o T
oeh
old
No
None
852
65
65
No T
oeh
old
n/a
32.7
%32.7
%12.6
%12.6
%42%
No
124
2006-1
0-0
2C
yberc
om
Gro
up E
. AB
JCE
Gro
up A
BD
om
esti
cY
esH
ost
ile
Cas
hT
oeh
old
No
None
357
38
38
Long
14.5
%31.0
%31.0
%3.8
%3.8
%23%
No
125
2006-1
1-0
8C
ust
os
Ab
Spx C
orp
ora
tion
Cro
ss-b
ord
er
Yes
Fri
endly
Cas
hN
o T
oeh
old
No
Init
ial
868
78
78
No T
oeh
old
0.0
%28.4
%28.4
%12.2
%12.2
%96%
Yes
126
2006-1
1-2
0P
rote
ct D
ata
Ab
Check
Poin
t S
oft
war
e T
ech.
Cro
ss-b
ord
er
Yes
Fri
endly
Cas
hN
o T
oeh
old
No
Init
ial
2,8
60
180
187
187
No T
oeh
old
0.0
%44.0
%49.6
%2.6
%6.6
%87%
Yes
127
2007-0
1-1
5T
raded
ouble
r A
bA
OL
S H
old
ings
AB
Cro
ss-b
ord
er
Yes
Fri
endly
Cas
hN
o T
oeh
old
No
Init
ial
4,9
07
215
215
No T
oeh
old
0.0
%19.8
%19.8
%8.6
%8.6
%20%
Yes
128
2007-0
1-1
5P
ergo (
Euro
pe)
Ab
Pfl
eider
er S
wed
en A
bC
ross
-bord
er
Yes
Fri
endly
Cas
hN
o T
oeh
old
No
Init
ial
2,9
46
51
51
No T
oeh
old
0.0
%-7
.3%
-7.3
%9.9
%9.9
%96%
Yes
129
2007-0
3-2
7in
War
ehouse
AB
Kom
ple
tt A
SA
Cro
ss-b
ord
er
Yes
Fri
endly
Cas
hN
o T
oeh
old
No
Init
ial
115
2.4
2.4
No T
oeh
old
0.0
%41.2
%41.2
%34.1
%34.1
%97%
Yes
130
2007-0
4-2
6In
vik
& C
o A
bM
iles
tone E
hf
Cro
ss-b
ord
er
Yes
Fri
endly
Cas
hN
o T
oeh
old
No
Init
ial
5,7
60
230
230
No T
oeh
old
0.0
%n/a
n/a
23.0
%23.0
%80%
Yes
131
2007-0
5-2
5O
MX
AB
Nas
daq
Sto
ck M
arket
Inc.
Cro
ss-b
ord
er
Yes
Fri
endly
Mix
edN
o T
oeh
old
Yes
Riv
al16,8
90
210.8
1210.8
No T
oeh
old
0.0
%50.6
%50.6
%17.1
%17.1
%0%
No
132
2007-0
6-0
4T
elel
ogic
Ab
IBM
Corp
ora
tion
Cro
ss-b
ord
er
Yes
Fri
endly
Cas
hN
o T
oeh
old
No
Init
ial
3,5
96
21
21
No T
oeh
old
0.0
%44.3
%44.3
%15.4
%15.4
%97%
Yes
133
2007-0
8-1
3L
index A
BK
appA
hl
Hold
ing A
BD
om
esti
cY
esH
ost
ile
Cas
hN
o T
oeh
old
Yes
None
5,7
75
102
102
No T
oeh
old
0.0
%21.4
%21.4
%14.6
%14.6
%0%
No
134
2007-0
8-2
0S
alusa
nsv
ar A
bD
nb N
or
Asa
Cro
ss-b
ord
er
Yes
Fri
endly
Cas
hN
o T
oeh
old
No
Init
ial
383
35
35
No T
oeh
old
0.0
%48.3
%48.3
%57.0
%57.0
%94%
Yes
135
2007-0
9-2
5E
lver
ket
Val
lentu
na A
bE
.On S
ver
ige
Ab
Dom
esti
cY
esH
ost
ile
Cas
hT
oeh
old
No
None
268
55
55
Long
15.5
%33.2
%33.2
%34.1
%34.1
%41%
No
136
2007-1
0-0
8M
andato
r A
bF
uji
tsu S
ervic
es O
ver
seas
Ltd
Cro
ss-b
ord
er
Yes
Fri
endly
Cas
hN
o T
oeh
old
No
Init
ial
384
33
No T
oeh
old
0.0
%32.2
%32.2
%27.7
%27.7
%95%
Yes
138
2007-1
0-2
2A
cadem
edia
Ab
Bure
Equit
yD
om
esti
cY
esF
rien
dly
Cas
hT
oeh
old
No
None
401
90
90
Long
41.9
%1.1
%1.1
%0.0
%0.0
%49%
No
137
2007-1
0-2
2A
rk T
ravel
Ab
Car
lson W
agonli
t B
.V.
Dom
esti
cY
esF
rien
dly
Cas
hN
o T
oeh
old
No
Init
ial
190
67
67
No T
oeh
old
0.0
%38.4
%38.4
%4.7
%4.7
%94%
Yes
139
2007-1
1-1
3S
ecuri
tas
Dir
ect
ES
ML
Intr
esse
nte
r A
BD
om
esti
cY
esH
ost
ile
Cas
hT
oeh
old
No
Init
ial
6,6
80
26
28
27.5
Long
40.5
%35.4
%43.2
%25.0
%32.2
%86%
Yes
140
2007-1
2-1
1G
ant
Com
pan
y A
BP
roca
stor
S.A
.C
ross
-bord
er
Yes
Host
ile
Cas
hT
oeh
old
No
Init
ial
4,2
26
310
320
320
Short
12.5
%23.0
%27.0
%31.1
%35.3
%96%
Yes
141
2007-1
2-1
4G
ym
gro
ssis
ten N
ord
ic A
BM
TG
AB
Dom
esti
cY
esF
rien
dly
Cas
hN
o T
oeh
old
No
Init
ial
194
33.1
33.1
No T
oeh
old
0.0
%0.9
%0.9
%31.3
%31.3
%98%
Yes
142
2008-0
1-1
4H
um
an C
are
Hc
Ab
Gar
den
Gro
wth
Capit
al, L
LC
Cro
ss-b
ord
er
Yes
Fri
endly
Cas
hT
oeh
old
No
Init
ial
208
88
88
Long
29.8
%14.3
%14.3
%18.9
%18.9
%60%
Yes
143
2008-0
1-1
7O
ne
Med
ia H
old
ing A
bIM
S G
roup L
tdC
ross
-bord
er
Yes
Fri
endly
Sto
ckN
o T
oeh
old
No
Init
ial
181
14
14
No T
oeh
old
0.0
%n/a
n/a
56.4
%56.4
%93%
Yes
144
2008-0
2-0
1B
oss
Med
ia A
bG
emed
Ab
Dom
esti
cY
esF
rien
dly
Cas
hT
oeh
old
No
Init
ial
736
19
25
25
Long
12.6
%47.3
%93.8
%25.8
%65.6
%93%
Yes
145
2008-0
2-1
9X
poncar
d G
roup A
bO
ber
thur
Tec
hnolo
gie
s S
aC
ross
-bord
er
Yes
Fri
endly
Cas
hN
o T
oeh
old
No
Init
ial
523
157
157
No T
oeh
old
0.0
%34.8
%34.8
%33.6
%33.6
%98%
Yes
146
2008-0
3-2
0T
ieto
Enat
or
Cid
ron S
ervic
es O
yD
om
esti
cY
esH
ost
ile
Cas
hT
oeh
old
No
None
8,8
95
145.7
145.7
Short
4.4
%18.0
%18.0
%37.8
%37.8
%0%
No
147
2008-0
3-2
7S
igm
a A
bA
sker
ö U
tvec
kli
ng A
bD
om
esti
cY
esH
ost
ile
Cas
hT
oeh
old
No
Init
ial
493
6.9
7.7
7.6
7L
ong
30.9
%20.0
%33.4
%30.2
%44.7
%74%
Yes
148
2008-0
4-3
0C
isio
n A
BT
rito
n F
und I
ID
om
esti
cY
esH
ost
ile
Cas
hN
o T
oeh
old
No
Init
ial
1,2
30
20
20
No T
oeh
old
0.0
%21.2
%21.2
%66.0
%66.0
%65%
Yes
149
2008-0
5-1
6B
alli
ngsl
öv I
nte
rnat
ional A
BS
tena
Adac
tum
AB
Dom
esti
cY
esH
ost
ile
Cas
hT
oeh
old
No
Init
ial
1,7
27
185
185
Long
38.4
%14.9
%14.9
%22.1
%22.1
%80%
Yes
150
2008-0
5-2
6Z
odia
k T
elev
isio
n A
bD
e A
gost
ini
Com
munic
atio
ns
Cro
ss-b
ord
er
Yes
Fri
endly
Cas
hT
oeh
old
No
Init
ial
608
40
40
Short
10.8
%67.4
%67.4
%33.8
%33.8
%97%
Yes
151
2008-0
6-3
0IB
S A
BD
ecca
n V
alue
Advis
ors
Lp
Cro
ss-b
ord
er
Yes
Host
ile
Cas
hT
oeh
old
No
Init
ial
877
9.6
49.6
4L
ong
33.0
%-1
1.6
%-1
1.6
%2.6
%2.6
%77%
Yes
152
2008-0
7-2
2G
unnebo I
ndust
rier
Ab
Seg
ula
h S
tell
ata
Hold
ing A
BD
om
esti
cY
esF
rien
dly
Cas
hN
o T
oeh
old
No
Init
ial
1,0
39
185
185
No T
oeh
old
0.0
%56.1
%56.1
%54.2
%54.2
%97%
Yes
153
2008-0
7-3
0M
ysc
oop I
nte
rnat
ional A
bM
obis
pin
e A
bD
om
esti
cY
esF
rien
dly
Sto
ckN
o T
oeh
old
No
Init
ial
50.4
10.4
1N
o T
oeh
old
0.0
%-4
5.3
%-4
5.3
%-1
2.8
%-1
2.8
%90%
Yes
154
2008-0
8-2
7B
rost
röm
Ab
Mae
rsk P
roduct
Tan
kers
Ab
Dom
esti
cY
esF
rien
dly
Cas
hN
o T
oeh
old
No
Init
ial
2,6
46
57
57
No T
oeh
old
0.0
%32.6
%32.6
%10.1
%10.1
%98%
Yes
155
2008-0
9-3
0A
rena
Per
sonal A
bN
org
esIn
vest
or
4 A
SC
ross
-bord
er
Yes
Fri
endly
Cas
hN
o T
oeh
old
No
Init
ial
95
6.2
56.2
5N
o T
oeh
old
0.0
%26.5
%26.5
%37.1
%37.1
%84%
Yes
156
2008-1
0-1
6S
tran
d I
nte
rconnect
AB
Addnode G
roup A
BD
om
esti
cY
esF
rien
dly
Mix
edN
o T
oeh
old
No
Init
ial
90.6
29
0.6
29
No T
oeh
old
0.0
%-7
.5%
-7.5
%18.7
%18.7
%91%
Yes
157
2008-1
0-2
3E
nac
o S
ver
ige
Ab
Man
nerh
eim
Invest
Ab
Dom
esti
cY
esH
ost
ile
Cas
hT
oeh
old
No
Init
ial
52
10
10
Long
43.4
%13.0
%13.0
%29.9
%29.9
%86%
Yes
158
2008-1
0-3
1T
elec
a A
bS
ym
phony T
ech. G
roup
Cro
ss-b
ord
er
Yes
Fri
endly
Cas
hT
oeh
old
No
Init
ial
374
3.2
53.2
5L
ong
49.2
%-3
3.7
%-3
3.7
%23.6
%23.6
%89%
Yes
159
2008-1
1-0
3Q
-Med
AB
Ivyta
n A
BD
om
esti
cY
esH
ost
ile
Cas
hT
oeh
old
No
Init
ial
3,4
39
39
39
Long
47.5
%12.7
%12.7
%23.8
%23.8
%56%
Yes
160
2008-1
1-2
4Ja
mes
Concep
ts A
bS
odexo S
aC
ross
-bord
er
Yes
Fri
endly
Cas
hN
o T
oeh
old
No
Init
ial
18
4.8
84.8
8N
o T
oeh
old
0.0
%68.3
%68.3
%80.7
%80.7
%93%
Yes
161
2009-0
3-0
9N
ilörn
gru
ppen A
bT
ract
ion B
randin
g A
bD
om
esti
cN
oH
ost
ile
Cas
hT
oeh
old
No
Init
ial
65
29
29
Long
38.0
%7.4
%7.4
%0.0
%0.0
%57%
Yes
162
2009-0
3-1
2S
emco
n A
bJc
e G
roup A
bD
om
esti
cN
oH
ost
ile
Cas
hT
oeh
old
No
None
224
14
14
Long
30.0
%11.1
%11.1
%-3
.1%
-3.1
%30.5
%N
o
Fu
nd
am
en
tals
Deal
Ch
arach
teris
tics
Bid
Seq
uen
ce i
n S
EK
Toeh
old
Pre
miu
m t
-42
Pre
miu
m t
-1O
utc
om
e

51
Nr
Date
of
Off
erT
arget
com
pan
yB
uyer
Bu
yer
Dom
icil
M&
A W
ave
Dea
l T
yp
eP
aym
en
tT
oeh
old
Riv
al
Win
ner
Target
MV
*1st
2n
dF
inal
Typ
eS
ize
Init
ial
Fin
al
Init
ial
Fin
al
Acc
ep
tan
ceS
ucc
ess
ful*
*
163
2009-0
4-0
3T
echnolo
gy N
exus
Ab
Ponderu
s T
echnolo
gy A
bD
om
esti
cN
oH
ost
ile
Cas
hT
oeh
old
No
Init
ial
33
11
11
Long
48.8
%57.1
%57.1
%1.9
%1.9
%69%
Yes
164
2009-0
4-1
7C
arl
Lam
m H
old
ing A
bR
icoh E
uro
pe H
old
ings
Plc
Cro
ss-b
ord
er
No
Fri
endly
Cas
hN
o T
oeh
old
No
Init
ial
360
37.2
537.2
5N
o T
oeh
old
0.0
%15.7
%15.7
%19.8
%19.8
%97%
Yes
165
2009-0
4-1
7A
nnehem
Fas
tighete
r A
BP
eab A
BD
om
esti
cN
oF
rien
dly
Mix
edT
oeh
old
No
Init
ial
245
21.6
521.6
5L
ong
6.9
%5.6
%5.6
%3.1
%3.1
%98%
Yes
166
2009-0
4-2
8H
emte
x A
bH
akon I
nvest
Ab
Dom
esti
cN
oH
ost
ile
Cas
hT
oeh
old
No
Init
ial
469
27
27
Long
34.6
%68.8
%68.8
%5.9
%5.9
%56%
Yes
167
2009-0
6-2
6D
in B
ost
ad S
ver
ige
Ab
Fas
tighets
Bald
er A
bD
om
esti
cN
oF
rien
dly
Sto
ckN
o T
oeh
old
No
Init
ial
928.1
228.1
2N
o T
oeh
old
0.0
%48.0
%48.0
%51.2
%51.2
%99%
Yes
168
2009-0
9-0
2M
egac
on A
bM
annerh
eim
Invest
Ab
Dom
esti
cN
oF
rien
dly
Cas
hT
oeh
old
No
Init
ial
31
23
23
Long
33.4
%20.4
%20.4
%5.0
%5.0
%5%
Yes
169
2009-1
0-0
1A
ffär
sstr
ateg
erna
AB
Str
ateg
isk H
old
ing S
ver
. AB
Dom
esti
cN
oF
rien
dly
Cas
hT
oeh
old
No
Init
ial
58
2.2
2.2
Long
43.1
%70.5
%70.5
%61.8
%61.8
%91%
Yes
170
2009-1
1-2
4B
BA
H S
wed
en A
BA
lpco
t A
gro
AB
Dom
esti
cN
oF
rien
dly
Sto
ckN
o T
oeh
old
No
Init
ial
11
2.7
69
2.7
69
No T
oeh
old
0.0
%n/a
n/a
18.5
%18.5
%83%
Yes
171
2009-1
1-3
0L
edst
iern
an A
bT
huban A
bD
om
esti
cN
oF
rien
dly
Cas
hT
oeh
old
No
Init
ial
167
36.5
36.5
Long
39.5
%25.0
%25.0
%23.7
%23.7
%81%
Yes
172
2010-0
1-0
5T
icket
Tra
vel
Gro
up A
bB
ragan
za A
sC
ross
-bord
er
No
Fri
endly
Cas
hT
oeh
old
No
Init
ial
161
7.6
7.6
Long
32.0
%-1
6.9
%-1
6.9
%31.0
%31.0
%96%
Yes
173
2010-0
1-1
2H
om
emai
d A
bB
etjä
nte
n H
old
ing A
bD
om
esti
cN
oH
ost
ile
Cas
hT
oeh
old
No
Init
ial
32
2.1
2.1
Long
49.5
%1.4
%1.4
%7.7
%7.7
%52%
Yes
174
2010-0
1-2
5N
eonet A
bO
rc S
oft
war
e A
bD
om
esti
cN
oF
rien
dly
Mix
edN
o T
oeh
old
No
Init
ial
1061
19.6
319.6
3N
o T
oeh
old
0.0
%20.4
%20.4
%21.9
%21.9
%98%
Yes
175
2010-0
2-1
0T
rico
rona A
BO
pco
n A
BD
om
esti
cN
oH
ost
ile
Sto
ckN
o T
oeh
old
Yes
Riv
al1049
7.5
47.5
4N
o T
oeh
old
0.0
%5.4
%5.4
%15.1
%15.1
%3%
No
176
2010-0
4-1
5IC
T N
ord
en F
asti
ghete
r A
bF
undio
r A
bD
om
esti
cN
oH
ost
ile
Sto
ckT
oeh
old
No
None
20
0.6
05
0.6
1L
ong
20.1
%16.3
%16.3
%21.0
%21.0
%32%
No
177
2010-0
4-2
2A
cadem
edia
Ab
Pro
vid
ence
Educat
ion I
nt.
Ab
Dom
esti
cN
oH
ost
ile
Cas
hN
o T
oeh
old
Yes
Riv
al1604
170
190
190
No T
oeh
old
0.0
%27.8
%42.9
%3.0
%15.2
%0%
No
178
2010-0
5-0
5A
+ S
cien
ce H
old
ing A
bV
e-N
-Ve
Intr
esse
nte
r A
bD
om
esti
cN
oF
rien
dly
Cas
hT
oeh
old
No
Init
ial
21
1.7
1.7
Long
44.5
%47.8
%47.8
%30.8
%30.8
%67%
Yes
179
2010-0
9-0
6M
unte
rs A
bA
lfa
Lav
al A
bD
om
esti
cN
oF
rien
dly
Cas
hN
o T
oeh
old
Yes
Riv
al3735
68
75
75
No T
oeh
old
0.0
%36.5
%50.6
%29.5
%42.9
%0%
No
180
2010-0
9-2
0S
canw
orl
d T
ravel
Par
tner
E
uro
pean
Tra
vel
Inte
ract
ive
AB
Dom
esti
cN
oF
rien
dly
Cas
hN
o T
oeh
old
No
Init
ial
192
28
28
No T
oeh
old
0.0
%18.1
%18.1
%16.7
%16.7
%97%
Yes
181
2010-0
9-2
7M
odul
1 D
ata
Ab
Soft
ronic
Ab
Dom
esti
cN
oF
rien
dly
Mix
edN
o T
oeh
old
No
Init
ial
61
0.8
30.8
3N
o T
oeh
old
0.0
%27.7
%27.7
%27.7
%27.7
%90%
Yes
182
2010-1
1-2
9B
ioli
n S
cien
tifi
c A
bR
atos
Dom
esti
cN
oF
rien
dly
Cas
hN
o T
oeh
old
No
Init
ial
229
11.5
11.5
No T
oeh
old
0.0
%21.1
%21.1
%17.9
%17.9
%95%
Yes
184
2010-1
2-1
3Q
-Med
Ab
Gal
der
ma
Hold
ing A
bD
om
esti
cN
oF
rien
dly
Cas
hN
o T
oeh
old
No
Init
ial
7478
75
79
79
No T
oeh
old
0.0
%-0
.3%
5.0
%13.2
%19.2
%94%
Yes
183
2010-1
2-1
3C
ardo A
BA
ssa
Ablo
y A
BD
om
esti
cN
oF
rien
dly
Cas
hN
o T
oeh
old
No
Init
ial
7290
420
420
No T
oeh
old
0.0
%55.6
%55.6
%48.4
%48.4
%98%
Yes
185
2011-0
1-1
4N
etonnet A
bW
aldir
Ab
Dom
esti
cN
oH
ost
ile
Cas
hT
oeh
old
No
Init
ial
328
40.5
40.5
Long
30.2
%-2
5.3
%-2
5.3
%-1
2.1
%-1
2.1
%97%
Yes
186
2011-0
4-1
1B
iophausi
a A
BM
ediv
ir A
bD
om
esti
cN
oF
rien
dly
Mix
edN
o T
oeh
old
No
Init
ial
377
1.6
51.6
5N
o T
oeh
old
0.0
%50.0
%50.0
%44.7
%44.7
%94%
Yes
187
2011-0
4-2
8T
rett
i A
BC
DO
N G
roup A
BD
om
esti
cN
oF
rien
dly
Cas
hN
o T
oeh
old
No
Init
ial
276
67.2
567.2
5N
o T
oeh
old
0.0
%25.1
%25.1
%24.5
%24.5
%97%
Yes
188
2011-0
5-0
5E
ntr
acti
on H
old
ing A
BIn
tern
atio
nal
Gam
e T
echnolo
gy
Cro
ss-b
ord
er
No
Fri
endly
Cas
hN
o T
oeh
old
No
Init
ial
394
67.5
667.5
6N
o T
oeh
old
0.0
%71.5
%71.5
%33.8
%33.8
%93%
Yes
189
2011-0
5-1
6N
isca
yah
Gro
up A
bS
ecuri
tas
Ab
Dom
esti
cN
oH
ost
ile
Sto
ckN
o T
oeh
old
Yes
Riv
al4175
16
16
No T
oeh
old
0.0
%33.3
%33.3
%30.6
%30.6
%0%
No
190
2011-0
5-1
7IB
S A
BS
ym
phony T
echnolo
gy G
roup
Cro
ss-b
ord
er
No
Fri
endly
Cas
hN
o T
oeh
old
No
Init
ial
234
1.8
21.8
2N
o T
oeh
old
0.0
%-5
.2%
-5.2
%-4
.2%
-4.2
%88%
Yes
191
2011-1
1-2
3A
llen
ex A
bX
enel
la H
old
ing A
bD
om
esti
cN
oH
ost
ile
Cas
hT
oeh
old
No
None
194
1.5
1.5
Long
32.3
%-6
.8%
-6.8
%3.4
%3.4
%42%
No
192
2011-1
1-3
0R
esurs
CN
C A
BW
ISE
Gro
up A
BD
om
esti
cN
oF
rien
dly
Mix
edN
o T
oeh
old
No
Init
ial
36
3.2
93.2
9N
o T
oeh
old
0.0
%37.1
%37.1
%60.5
%60.5
%99%
Yes
193
2011-1
2-0
6D
agon A
bK
lövern
AB
Dom
esti
cN
oF
rien
dly
Mix
edN
o T
oeh
old
No
Init
ial
1227
62.5
62.5
No T
oeh
old
0.0
%20.2
%20.2
%24.4
%24.4
%99%
Yes
194
2011-1
2-1
9O
rc G
roup A
BC
idro
n D
elfi
Intr
esse
nte
r A
bD
om
esti
cN
oF
rien
dly
Cas
hN
o T
oeh
old
No
Init
ial
1357
86
86
No T
oeh
old
0.0
%48.9
%48.9
%32.8
%32.8
%96%
Yes
195
2012-0
1-1
2A
spir
o A
BS
chib
sted
AS
AD
om
esti
cN
oF
rien
dly
Cas
hT
oeh
old
No
Init
ial
299
1.6
51.6
5L
ong
18.3
%13.8
%13.8
%33.1
%33.1
%74%
Yes
196
2012-0
2-0
6M
etro
Inte
rnati
onal
S.A
.In
vest
men
t A
B K
innevik
Dom
esti
cN
oF
rien
dly
Cas
hT
oeh
old
No
Init
ial
153
0.9
0.9
Long
42.4
%55.2
%55.2
%20.0
%20.0
%90%
Yes
197
2012-0
2-1
7C
apil
on A
BV
erdan
e C
apit
alC
ross
-bord
er
No
Fri
endly
Cas
hN
o T
oeh
old
No
Init
ial
72
29
29
No T
oeh
old
0.0
%75.8
%75.8
%16.5
%16.5
%96%
Yes
198
2012-0
3-2
1A
dta
il A
bA
dO
per
ator
AB
Dom
esti
cN
oF
rien
dly
Sto
ckN
o T
oeh
old
No
Init
ial
10.1
20.1
2N
o T
oeh
old
0.0
%17.9
%17.9
%-1
.8%
-1.8
%87%
Yes
199
2012-0
3-2
3Je
eves
Info
rmat
ion S
ys.
Bat
tery
Ven
ture
sC
ross
-bord
er
No
Fri
endly
Cas
hN
o T
oeh
old
No
Init
ial
143
83
83
No T
oeh
old
0.0
%65.2
%65.2
%50.9
%50.9
%97%
Yes
200
2012-0
7-0
6F
oll
ow
it H
old
ings
AB
Bro
huvudet A
bD
om
esti
cN
oF
rien
dly
Cas
hT
oeh
old
No
Init
ial
30.2
40.2
4L
ong
49.9
%-2
9.4
%-2
9.4
%33.3
%33.3
%57%
Yes
201
2012-1
0-1
5A
vonova S
ver
ige
Ab
Sta
min
a H
OT
Hel
se A
SC
ross
-bord
er
No
Fri
endly
Cas
hN
o T
oeh
old
No
Init
ial
140
34
34
No T
oeh
old
0.0
%38.8
%38.8
%33.3
%33.3
%99%
Yes
202
2012-1
2-0
3N
ote
Ab
Lif
co A
bD
om
esti
cN
oH
ost
ile
Cas
hN
o T
oeh
old
No
None
189
88
No T
oeh
old
0.0
%22.1
%22.1
%37.9
%37.9
%15%
No
Max.
44249
442
475
-49.9
%100.0
%113.5
%90.0
%134.3
%99.8
%
Avera
ge
2357
79
80
-11.3
%29.8
%31.8
%26.5
%28.4
%79.5
%
*M
arket
valu
e m
easu
red i
n m
illi
ons
of
SE
KM
edia
n398
48
48
-0.0
%27.8
%31.6
%23.8
%25.0
%94.0
%
**T
ota
l ac
cepta
nce
of
init
ial
bid
der'
s off
er e
xce
eds
50%
, se
e "C
onte
st W
inner"
in c
hap
ter
7M
in.
10.1
20.1
18
-0.0
%-4
8.1
%-4
8.1
%-1
5.0
%-1
5.0
%0.0
%Ou
tcom
eF
un
dam
en
tals
Deal
Ch
arach
teris
tics
Bid
Seq
uen
ce
in S
EK
Toeh
old
Pre
miu
m t
-42
Pre
miu
m t
-1

52
11 References
Angblad, J. Berglöf, E., Högfeldt, P. & Svancar, H. (2002). “Ownership and
control in Sweden: Strong Owners, Weak Minorities, and Social Control”, in
Barco, F. & Brecht, M. (ends), The control of corporate Europe. Oxford:
Oxford University Press
Asquith, D and Kieschnick, R (1999). “An Examination of Initial Shareholdings
in Tender Offer Bids”, Review of Quantitative Finance and Accounting, 12
(1999): 171-188
Auerbach, Alan, (1988), “Mergers and Acquisitions”, The University of Chicago
Press, Chicago
Bainbridge, Stephen (2008). Mergers and Acquisitions (University Textbook
Series) - 2nd Edition, Foundation Press
Betton, Sandra and Espen Eckbo, (1997). “State-contingent payoffs in takeovers:
New Structural Estimates”, Working Paper, Tuck School at Dartmouth
Betton, Sandra, Eckbo, Espen & Thorburn, Karin (2009). “Merger negotiation and
the toehold puzzle”, Journal of Financial Economics, No. 01, 58-178
Betton, Sandra, Eckbo, Espen, Thorburn, Karin. (2008c). ” Corporate Takeovers”,
Handbook of Empirical Corporate Finance, Volume 2 Elsevier B.V.
Betton, Sandra & Eckbo, Espen (2000). “Toeholds, Bid jumps and expected
payoffs in takeovers”, Review of Financial Studies Winter 2000, Vol. 13. No.
4, 841-882
Betton, Sandra, Eckbo, Espen and Thorburn, Karin S., (2008b). “Markup Pricing
Revisited”, Tuck School of Business Working Paper No. 2008-45.
Bradley, Michael, Anand Desai, and E. Han Kim, (1988). “Synergistic gains from
corporate acquisitions and their division between the stockholders of target
and acquiring firms”, Journal of Financial Economics 21
Bris, Arturo (2002). “Toeholds, takeover premium, and the probability of being
acquired”, Journal of Corporate Finance, No. 8, 227-253
Bryman, Alan and Bell, Emma (2005). Business Research Methods – 1st edition,
Malmö: Liber Ekonomi
Bulow, Jeremy, Huang, Ming & Klemperer, Paul (1999). “Toeholds and
takeovers”, Journal of Political Economy, Vol. 107, No. 5, 427-454
Burkart, Mike (1995), “Initial shareholdings and overbidding in takeover
contests”, Journal of Finance, Vol. L, No. 5, 1491-1515
Burkart, Mike and Lee, Samuel (2008). “One share – One vote: the theory”,
Review of Finance, Nr. 12, 1-49
Carroll, Carolyn & Griffith, John M. (2010). “Toeholds, rejected offers, and
bidder gains: Do rebuffed bidders out targets in pay to profit from their
toeholds?”, Quarterly Review of Economics and Finance, No. 50, 214-221

53
Chowdry, Bhagran & Jegadeesh, Narashimhan (1994). “Pre-tender offer share
acquisition strategy in takeovers”, Journal of Financial and Quantitative
Analysis, No. 29, 117-129
Danbolt, J. (2004). ” Target company cross-border effects in acquisitions into the
UK”, European Financial Management 10:pp. 83-108.
Dasgupta, Sudipto & Tsui, Kevin (2000). “A matching auction for targets with
heterogeneous bidders”, Journal of Financial Intermediation”, No.12, 331-
364
De, S., Fedenia, M., Triantis, A., (1996). "Effects of competition on bidder
returns", Journal of Corporate Finance, No. 2, 261-282
Dewatripont, M. (1993). “The leading shareholder strategy, takeover contests and
stock price dynamics”, European Economic Review, No. 37, 983-1004
Eckbo, Espen (2009). “Bidding strategies and takeover premiums: a review”,
Journal of Corporate Finance, No. 15, 149-178
Eckbo, E.B & Langohr, H, (1989). " Information disclosure, method of payment,
and takeover premiums: Public and private tender offers in France," Journal of
Financial Economics, Elsevier, vol. 24(2), 363-403
Goergen & Renneboog, (2004). "Shareholder Wealth Effects of European
Domestic and Cross-border Takeover Bids," European Financial Management,
European Financial Management Association, vol. 10(1), 9-45
Goldman, Eitan & Qian, Jun (2005). “Optimal toeholds in takeover contests”,
Journal of Financial Economics, No. 77, 321-346
Grossman, Sanford J. and Oliver D. Hart, (1980). “Takeover bids, the free-rider
problem, and the theory of the corporation”, Bell Journal of Economics 11,
42264.
Gujarati, D. N., & Porter, D. C. (2009). ”Basic econometrics (5th ed.)”. New
York: McGraw-Hill/Irwin.
Haleblian, J., Devers, C. E., McNamara, G., Carpenter, M. A., & Davison, R. B.
(2009). “Taking Stock of What We Know About Merger and Acquisitions: A
Review and Research Agenda”. Journal of Management, 35 (3), 469-502
Harrington, Joseph E, Jr & Prokop, Jacek, (1993). "The Dynamics of the Free-
Rider Problem in Takeovers," Review of Financial Studies, Society for
Financial Studies, vol. 6(4), 851-82.
Henrekson, Magnus & Jacobsson, Ulf, (2012), “The Swedish corporate control
model: Convergence, Persistence or Decline?”, Corporate Governance: An
international Review, 2012, Vol. 20, Nr. 2, 212-227
Herbert Smith LLP, Gleiss Lutz and Stibbe, (2010). ”Regulation of public M&A
in Europe ” Retrieved from:http://www.arthurcox.com/uploadedFiles/
Publications/Publication_List/Arthur%20Cox%20-%20Regulation%20of%20
Public%20MandA%20in%20Europe,%20June%202010.pdf.
Hirshleifer, D., Titman, S., (1990). “Share tendering strategies and the success of
hostile takeover bids”. Journal of Political Economy 98, 295–324
Högfeldt, Peter (2004). “The history and Politics of corporate ownership in
Sweden”, in Randall K. Morck (2005), A history of corporate governance
around the world: family business groups to professional managers,
University of Chicago Press

54
Jarrell, Gregg A., and Annette B. Poulsen, (1989). “Stock trading before the
announcement of tender offers: Insider trading or market anticipation?”,
Journal of Law Economics and Organization 5,225–248.
Jennings, Robert H. & Mazeo, Michael A. (1993). “Competing bids, target
management resistance, and the structure of takeover bids”, Review of
Financial Studies Winter, Vol. 6, No. 4, 883-909
Jensen, M.C., (1986). “Agency costs of free cash flow, corporate finance, and
takeovers”, American Economic Review 76, 323–329.
Jensen, M.C. (1988). “The free cash flow theory of takeovers: A financial
perspective on mergers and acquisitions and the economy”. The Merger
Boom, Federal Reserve Bank of Boston, 31
King and Padalko (2005). “Pre-bid run-ups ahead of Canadian takeovers: how big
is the problem?” Working paper. Bank of Canada. No. 2005-3.
Kyle, Albert S. and Vila, Jean-Luc, (1991). “Noise Trading and Takeovers”, The
RAND Journal of Economics, Vol. 22, No. 1 (Spring, 1991), pp. 54-71
La Porta, Rafael, Lopez-de-Silanes, Florencio & Shleifer, Andrei (1999).
“Corporate ownership around the World”, Journal of Finance, Vol. LIV, No.2
Lang & Walkling, (1991). A test of the free cash flow hypothesis: The case of
bidder returns. Journal of Financial Economics, 29(2), 315-335
Loyola, Gino (2012). “Optimal and efficient takeover contests with toeholds”, J.
Finan. Intermediation, No. 21, 203-216
Meulbroek, L., (1992). “An empirical analysis of illegal insider trading.” Journal
of Finance, 47, 1661–1699.
Nachemson-Ekwall, Sophie (2012). An Institutional Analysis of Cross-border
Hostile Takeovers – Shareholder value, short-termism and regulator arbitrage
on the Swedish stock market during the sixth takeover wave, (Doctoral
Dissertation), SSE, ISBN 978-91-7258-875-2, Göteborg
NasdaqOMX, (2012). “Regler rörande offentliga uppköpserbjudanden på
Aktiemarknaden”, Retrieved from: http://www.nasdaqomx.com/digital
Assets/80/80375_to_regler_2012_07_01_se.pdf
Nyström & Sjöman (2011). ”Den svenska takeover-regleringen, ett samspel
mellan regelmakaren och Aktiemarknadsnämnden”,
Retrieved from: http://www.aktiemarknadsnamnden.se/UserFiles/
AMN25ar_kap07_medKOM_kap07-165x242.pdf
Qian, Jun (2001). “Toehold Acquisitions, Market Reaction and Corporate
Control”, paper based on chapter from Jun Qian, "Managerial compensation
and agency problems in corporate governance and financial intermediation"
(January 1, 2000). Dissertations available from ProQuest. Paper AAI9965549
Ravid, Abraham & Spiegel, Matthew (1999). “Toehold strategies, takeover laws
and rival bidders”, Journal of Banking & Finance, No. 23, 1219-1242
Roll, R. (1986). “The Hubris Hypothesis of Corporate Takeovers”, The Journal of
Business, Vol. 59, No. 2, Part 1 (Apr 1986) p 197-216
Schwert, William. G. (1996). “Markup pricing in mergers and acquisitions”,
Journal of Financial Economics”, No. 41, 154-192
Schwert, William. G. (2000). “Hostility in takeovers – in the eyes of the
beholder?”, Journal of Finance”, Vol. LV, No. 6, Dec 2000, 2599-2640

55
Schoenberg & Thornton. (2006). The Impact of Bid Defences in Hostile
Acquisitions. European Management Journal, 24,142-150
Shleifer, A., Vishny, R.W., (1986). “Large shareholders and corporate control”.
Journal of Political Economy 94, 461–488
Siems & Schouten, (2009). "The Evolution of Ownership Disclosure Rules across
Countries," ESRC Centre for Business Research - Working Papers wp393,
ESRC Centre for Business Research.
Skog, Rolf, (1997). Does Sweden need a Mandatory Bid Rule; a Critical Analysis,
Amsterdam: SUERF Studies 2
Stavlos, Nickolaos (1987). ”Corporate Takeover Bids, Methods of Payment, and
Bidding Firms' Stock Returns”, The Journal of Finance, Vol. 42, No. 4 (Sep.,
1987), pp. 943-963
Stultz, René M., Walkling, Ralph A. & Song, Moon H. (1990). “The distribution
of target ownership and the division of gains in successful takeovers”, Journal
of Finance, Vol. XLV, No. 3, 817-833
SFS 1991:980. ”Lag (1991:980) om handel med finansiella instrument”,
Retrieved from:
http://www.riksdagen.se/sv/DokumentLagar/Lagar/Svenskforfattningssamling
/Lag-1991980-om-handel-med-f_sfs-1991-980/?bet=1991:980#K4
US Securities and Exchange Commission, (2013). ”Schedule 13D”
Retrieved from: http://www.sec.gov/answers/sched13.htm
Varaiya, N. (1987). Determinants of premiums in acquisition transactions.
Managerial and Decision Economics, 8(3), 175-184.
Walkling, Ralph A. (1985). “Predicting tender offer Success: A logistic analysis”,
Journal of Financial and Quantitative Analysis, Vol. 20, No. 4, 461-478
Walkling, Ralph A. & Long, Michael S., (1984). ”Agency Theory, Managerial
Welfare and Takeover Bid Resistance”, The RAND Journal of Economics,
Vol. 15, No.1, 55-68