tokamak research at the ioffe institute - univ-lorraine.fr
TRANSCRIPT

HAL Id: hal-02434462https://hal.univ-lorraine.fr/hal-02434462
Submitted on 10 Jan 2020
HAL is a multi-disciplinary open accessarchive for the deposit and dissemination of sci-entific research documents, whether they are pub-lished or not. The documents may come fromteaching and research institutions in France orabroad, or from public or private research centers.
L’archive ouverte pluridisciplinaire HAL, estdestinée au dépôt et à la diffusion de documentsscientifiques de niveau recherche, publiés ou non,émanant des établissements d’enseignement et derecherche français ou étrangers, des laboratoirespublics ou privés.
Tokamak research at the Ioffe InstituteN Bakharev, G Abdullina, V Afanasyev, A Altukhov, L Askinazi, N Babinov,
A Bazhenov, A Belokurov, M D Blekhshtein, E Bondarchuk, et al.
To cite this version:N Bakharev, G Abdullina, V Afanasyev, A Altukhov, L Askinazi, et al.. Tokamak research at theIoffe Institute. Nuclear Fusion, IOP Publishing, 2019, 59, pp.112022. �10.1088/1741-4326/ab22dc�.�hal-02434462�

Tokamak research at the Ioffe Institute
N.N. Bakharev1, G.I. Abdullina1, V.I. Afanasyev1, A.B. Altukhov1 , L.G. Askinazi1, N.A. Babinov1 , A.N. Bazhenov1, A.A. Belokurov1 ,
M.D. Blekhshtein2, E.N. Bondarchuk3, I.M. Bukreev1, V.V. Bulanin1,2 ,An.P. Chernakov4, F.V. Chernyshev1, I.N. Chugunov1, A.M. Dmitriev1,D.N. Doinikov1, V.V. Dyachenko1, L.A. Esipov1, D.B. Gin1, A.V. Gorbunov5, A.D. Gurchenko1 , E.Z. Gusakov1, V.K. Gusev1, S. Heuraux6, M.V. Iliasova1, M.A. Irzak1, S.N. Kamenshikov3, A.A. Kavin3, E.M. Khilkevitch1,N.A. Khromov1, E.O. Kiselev1, T.P. Kiviniemi7 , A.A. Kobelev2,V.A. Kornev1, A.N. Koval1, D.V. Kouprienko1, S.V. Krikunov1, O.L. Krutkin1, G.S. Kurskiev1, S.I. Lashkul1, S.V. Lebedev1 , C. Lechte8 , S. Leerink7, A.E. Litvinov1, K.M. Lobanov3, S.V. Masyukevich1, A.A. Martynov9,S.Yu. Medvedev9, A.D. Melnik1, V.B. Minaev1, A.B. Mineev3, M.I. Mironov1, I.V. Miroshnikov1, E.E. Mukhin1, V.O. Naidenov1, A.S. Navolotsky1,V.G. Nesenevich1, P. Niskala7 , A.N. Novokhatskii1, K.Yu. Oshuev1,M.I. Patrov1, A.V. Petrov2, M.P. Petrov1, S.Ya. Petrov1, Yu.V. Petrov1,I.A. Polunovsky1, A.Yu. Popov1 , A.G. Razdobarin1, D.V. Razumenko1,V.V. Rozhdestvensky1, N.V. Sakharov1, D.S. Samsonov1, A.N. Saveliev1,V.A. Senichenkov1, P.B. Shchegolev1, A.E. Shevelev1, A.D. Sladkomedova1, A.I. Smirnov1, A.S. Smirnov2, V.V. Solokha1, V.A. Solovei1, A.Yu. Stepanov1, A.Yu. Telnova1 , V.A. Tokarev1, S.Yu. Tolstyakov1, P.V. Tretinnikov1,I.B. Tereschenko1, A.S. Tukachinsky1, E.A. Tukhmeneva1, V.I. Varfolomeev1, L.A. Varshavchick1 , A.Yu. Yashin1,2, E.G. Zhilin10 and N.A. Zhubr1
1 Ioffe Institute, St. Petersburg 194021, Russian Federation2 Peter the Great St. Petersburg Polytechnic University, St. Petersburg, Russian Federation3 JSC «NIIEFA», St. Petersburg, Russian Federation4 JSC «Spectral-Tech», St. Petersburg, Russian Federation5 NRC Kurchatov Institute, Moscow, Russian Federation6 Institute Jean Lamour UMR 7198 CNRS, Université de Lorraine, 54000 Nancy, France7 Aalto University, Espoo, Finland8 Institute of Interfacial Process Engineering and Plasma Technology, 70569 Stuttgart, Germany9 Keldysh Institute of Applied Mathematics RAS, Moscow, Russian Federation10 Ioffe Fusion Technology Ltd, St. Petersburg, Russian Federation
E-mail: [email protected]
Published 30 August 2019
AbstractRecent research at three small tokamaks with different parameters located at the Ioffe Institute —the spherical tokamak Globus-M, the large aspect ratio tokamak FT-2 and the compact tokamak TUMAN-3M— are reviewed. This overview covers energy confinement (Globus-M and FT-2), L–H transition (TUMAN-3M and FT-2), Alfvén waves (Globus-M and TUMAN-3M), ion cyclotron emission (TUMAN-3M), major plasma discharge disruption (Globus-M) and scrape-off layer (Globus-M) studies. A full-f global gyrokinetic modeling benchmark using synthetic diagnostics in FT-2 is described. Anomalous absorption and emission in electron cyclotron resonance heating experiments due to the parametric excitation of localized upper hybrid waves are analyzed theoretically. Progress in the development of the neutral particle analysis, gamma-ray spectrometry and divertor Thomson scattering combined
1
N.N. Bakharev et al
Printed in the UK
112022
NUFUAU
© 2019 IAEA, Vienna
59
Nucl. Fusion
NF
10.1088/1741-4326/ab22dc
Paper
11
Nuclear Fusion
IOP
2019
1741-4326

2
with laser-induced fluorescence diagnostics for ITER is discussed. The status of the new Globus-M2 spherical tokamak is reported.
Keywords: energy confinement, Alfvén eigenmodes, SOL, gyrokinetic modeling, ICE, L–H transition, disruption
1. Introduction
In 2018, the Ioffe Institute celebrated its 100th anniversary. Plasma physics and thermonuclear fusion research at the Ioffe Institute has been going on for more than 60 years. At present, the study of the various tokamak physics aspects is conducted on small tokamaks in a wide range of the experimental con-ditions: R/a = 1.6, BT = 0.5 T, Ip = 250 kA (Globus-M); R/a = 2.4, BT = 1.0 T, Ip = 180 kA (TUMAN-3M); R/a = 7.0, BT = 3.0 T, Ip = 40 kA (FT-2). In addition, there is coopera-tion with other tokamaks all over the world, and three ITER diagnostics—neutral particle analysis, gamma-ray spectrom-etry and divertor Thomson scattering (DTS) combined with laser-induced fluorescence (LIF)—are being developed. Inthis overview recent results of the tokamak research at the Ioffe Institute are described.
Globus M [1, 2], which has recently been replaced by a new Globus-M2, was a compact spherical tokamak (ST) (R ≈ 36 cm, aspect ratio A ≈ 1.5, elongation k < 2) equipped with neutral beam injection (NBI), ion cyclotron resonance (ICR) heating and lower hybrid current drive (LHCD) sys-tems. Its distinguishing features were a high normalized Larmor radius and collisionality, high heating power den-sity and a small plasma–wall distance. In this paper the mainresults, dedicated to the study of energy confinement, Alfvéneigenmodes, discharge disruption and scrape-off layer (SOL) study are described. TUMAN-3M is a compact tokamak with R = 55 cm, a = 22 cm, equipped with the neutral beam injector. The main results of the investigation in Tuman-3M of the high frequency magnetohydrodynamic oscillations in the ion cyclotron and Alfvén frequency ranges and thestudy of the L–H transition, initiated by geodesic acousticmode (GAM) [3] activity and pellet injection, are described. FT-2 is a large aspect ratio machine (R = 55 cm, a = 8 cm, Ip = 40 kA), equipped with the lower hybrid (LH) heating system (f 0 = 920 MHz) for study of LHCD at low density and LH heating of ions at higher plasma densities [4]. FT-2 is equipped with the unique complex of microwave backscat-tering diagnostics. Its discharges are characterized by a good reproducibility and therefore FT-2 is used for research in dif-ferent areas. In this overview the main results of the energy confinement study in hydrogen and deuterium Ohmically heated (OH) plasma and full-f global gyrokinetic modeling benchmark using synthetic diagnostics are described.
The paper is organized as follows. In section 2, energy confinement in the NBI-heated discharges of the Globus-M ST and in the OH discharges of the large aspect ratio FT-2 tokamak are described. In section 3, L–H transitions in
TUMAN-3M, initiated by GAM activity and pellet injection, are studied. Toroidal Alfvén eigenmodes in Globus-M NBI-heated discharges and Alfvén-type activity in TUMAN-3MOH plasma are described in section 4. Ion cyclotron emis-sion in OH and NBI-heated TUMAN-3M plasma is discussed in section 5. Section 6 is devoted to the discharge disruption investigation in Globus-M, followed by the SOL study in sec-tion 7. Benchmarking of the full-f global gyrokinetic mod-eling results against the FT-2 tokamak Doppler reflectometry (DR) data using synthetic diagnostics is presented in section 8. In section 9,anomalous absorption and emission in electron cyclotron resonance heating (ECRH) experiments due to the parametric excitation of localized upper hybrid (UH) waves is described. The ITER neutral particle analyzer, gamma-ray spectrometer and DTS system, combined with LIF, are reviewed in section 10. The status of the new Globus-M2 machine is presented in section 11. Finally, a short summary is given in section 12.
2. Energy confinement
2.1. Energy confinement in the Globus-M spherical tokamak
Thermal energy confinement in STs is one of the key points under investigation, because it significantly differs from the confinement in conventional machines. Relatively low toroidal magnetic fields in STs, together with their good confinement capabilities allow stable operation at significantly high β (the ratio of plasma pressure to magnetic field pressure). High β, a large normalized ion gyroradius (ρ*), a high fraction of trapped particles and strong plasma shaping lead to essential differences in plasma turbulence that determine particle and heat fluxes. The results, obtained on MAST [5] and NSTX [6], have shown the difference between the engineering scaling for energy confinement time (τE) in STs and the conventional IPB98(y ,2) [7]. The main distinction is a strong dependence of τE on the toroidal magnetic field in STs, which is negligible in conventional machines. It is connected with much stronger electron heat diffusivity dependence on collisionality. Further experiments and analysis have confirmed this statement [8, 9].
The Globus-M ST operated in the same range of the toroidal magnetic fields as MAST and NSTX, however other engineering parameters differed significantly (R ≈ 36 cm, aspect ratio A ≈ 1.5, elongation k < 2). In contrast to the previous OH experiments [10, 11], energy confinement was investigated in NBI-heated ELMy H-mode deuterium plasma using 26–28 keV 0.35–0.75 MW deuterium beams [12].The range of the major plasma parameters was as follows:
3
Ip = 0.12–0.25 MA, BT = 0.25–0.5 T, absorbed heatingpower Pabs = 0.2–0.8 MW, and averaged electron den-sity ne = 1.8–5.5 × 10¹⁹ m−3. It was found that IPB98(y ,2) functional dependence is poorly suited for describing the experiment. The H-factor was in the range of 0.5–1.3 witha root mean square error (RMSE) > 60% [13]. The regres-
sion analysis of the database yields following results:
τGLBE ∼ I0.51±0.26
p B1.2±0.1T P−0.54±0.26
abs n0.67±0.04e with RMSE =
25% (figure 1). The confinement time dependence on the toroidal magnetic field is very strong, which is consistent with the ST trend [5, 6]. One of the most important points is the dependence of the dimensionless energy confinement time (BTτE) on collisionality ν* ~ ne/T2. A fusion reactor or fusion neutron source will operate in the range of sufficiently lower collisionality, and therefore extrapolation of the experimental data to the lower ν* values is of great interest. It was found that for conventional tokamaks, thermal energy confinement has
a negligible dependence on collisionality and ITER scaling
predicts BTτE ∼ β−0.9T ν∗−0.01q−3
eng [7], however a differenttrend is observed for STs. The main feature of the thermal energy confinement in an ST is a strong τE dependence on collisionality [8, 9]. For the MAST ELMy H-mode BTτE ~ q−0.85±0.2ν*−0.82±0.1, for the NSTX ELMy H-mode: BTτE ~ ν*−0.79±0.1. A formal regression fit of the Globus-M data in dimensionless space yields BTτE ∼ ρ∗−2.7β1.45
T ν∗−0.45q0.85eng
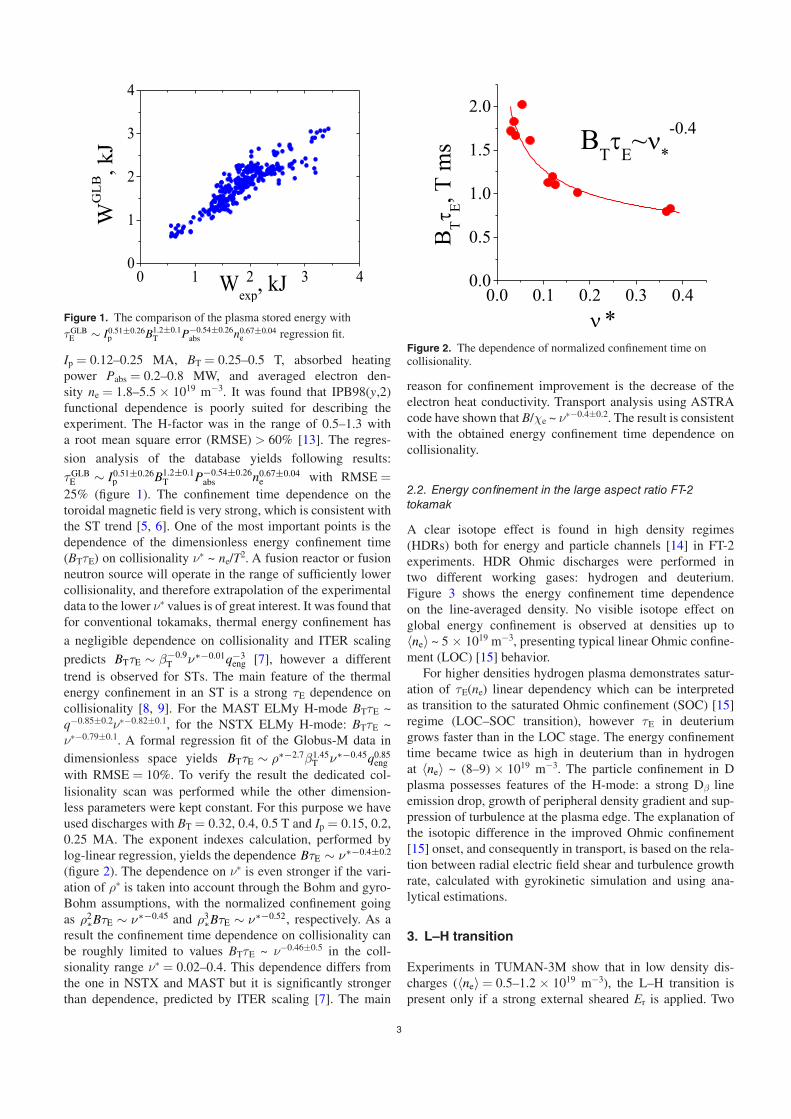
with RMSE = 10%. To verify the result the dedicated col-lisionality scan was performed while the other dimension-less parameters were kept constant. For this purpose we have used discharges with BT = 0.32, 0.4, 0.5 T and Ip = 0.15, 0.2, 0.25 MA. The exponent indexes calculation, performed by log-linear regression, yields the dependence BτE ∼ ν∗−0.4±0.2
(figure 2). The dependence on ν* is even stronger if the vari-ation of ρ* is taken into account through the Bohm and gyro-Bohm assumptions, with the normalized confinement going as ρ2
∗BτE ∼ ν∗−0.45 and ρ3∗BτE ∼ ν∗−0.52, respectively. As a
result the confinement time dependence on collisionality can be roughly limited to values BTτE ~ ν−0.46±0.5 in the coll-sionality range ν* = 0.02–0.4. This dependence differs fromthe one in NSTX and MAST but it is significantly stronger than dependence, predicted by ITER scaling [7]. The main
reason for confinement improvement is the decrease of the electron heat conductivity. Transport analysis using ASTRA code have shown that B/χe ~ ν*−0.4±0.2. The result is consistent with the obtained energy confinement time dependence on collisionality.
2.2. Energy confinement in the large aspect ratio FT-2 tokamak
A clear isotope effect is found in high density regimes (HDRs) both for energy and particle channels [14] in FT-2 experiments. HDR Ohmic discharges were performed in two different working gases: hydrogen and deuterium. Figure 3 shows the energy confinement time dependence on the line-averaged density. No visible isotope effect on global energy confinement is observed at densities up to 〈ne〉 ~ 5 × 10¹⁹ m−3, presenting typical linear Ohmic confine-ment (LOC) [15] behavior.
For higher densities hydrogen plasma demonstrates satur-ation of τE(ne) linear dependency which can be interpreted as transition to the saturated Ohmic confinement (SOC) [15] regime (LOC–SOC transition), however τE in deuteriumgrows faster than in the LOC stage. The energy confinement time became twice as high in deuterium than in hydrogen at 〈ne〉 ~ (8–9) × 1019 m−3. The particle confinement in Dplasma possesses features of the H-mode: a strong Dβ line emission drop, growth of peripheral density gradient and sup-pression of turbulence at the plasma edge. The explanation of the isotopic difference in the improved Ohmic confinement [15] onset, and consequently in transport, is based on the rela-tion between radial electric field shear and turbulence growthrate, calculated with gyrokinetic simulation and using ana-lytical estimations.
3. L–H transition
Experiments in TUMAN-3M show that in low density dis-charges (〈ne〉 = 0.5–1.2 × 10¹⁹ m−3), the L–H transition ispresent only if a strong external sheared Er is applied. Two
Figure 1. The comparison of the plasma stored energy with τGLB
E ∼ I0.51±0.26p B1.2±0.1
T P−0.54±0.26abs n0.67±0.04
e regression fit.Figure 2. The dependence of normalized confinement time on collisionality.

4
scenarios are discussed: discharge with electric field perturba-tions due to the strong geodesic acoustic mode (GAM) oscil-lations (in this scenario the L–H transition is observed after aGAM burst in TUMAN-3M, while in low density discharges in FT-2 (n(0) < 5 × 10¹⁹ m−3) with stronger GAM activity it is absent); and cryogenic pellet injection in TUMAN-3M, which creates strong density and temperature gradients and, therefore, radial electric field gradient, and could lead to the L–H transition, but does not guarantee it. Both scenarios wereconsidered using the model of particle density profile evolution accounting for diffusion coefficient dependence on Er shear [16, 17]. Transport quantities and turbulence parameters were provided by the ELMFIRE gyrokinetic code. The modeling results have shown satisfactory agreement with the experi-ments: (1) in TUMAN-3M the GAM parameters threshold for L–H transition is determined (figure 4), however for FT-2 thetransition was not possible for experimental GAM parameter sets [18]; (2) in the case of the pellet injection, L–H transitionoccurred if a part of the pellet was disintegrated in the pellet-guide, resulting in a gas/‘snow’ puff so that the pellet ablationis peripheral; on the contrary, if the pellet is evaporated deeper in the plasma, there is no L–H transition [19].
Results of the modeling proved the idea about the impor-tance of the particle source for determining L–H transition
possibility. This role is quite similar to the role of the ion heat source (heating power threshold)—if the particle sourceis too low for a certain scenario, a self-sustaining H-mode is not possible. Particle source thresholds could be determined based on the diffusion coefficient dependence on Er shear (and thus ∇n). The analysis of non-linear particle flux dependenceon density gradient:
−Deff
Å∂n (r)∂r
ã· ∂n (r)
∂r= IS (r) , (1)
where Deff is the effective diffusion coefficient and IS the int-egral particle source, helps to reveal possible causes of L–Htransition presence or absence. Due to non-linearity, a dif-fusion equation in the stationary case has either two stable solutions (for the L- and H-mode), or one, for one confine-ment mode only, depending on the integral particle source value compared to the particle flux (see figure 5, where the graphical solutions of equation (1) are shown for the case of
Figure 3. Energy confinement time dependence on chord-averaged density in hydrogen (squares) and deuterium (circles) plasmas.
Figure 4. GAM in TUMAN-3M. GAM burst of sub-threshold duration (а) or amplitude (b) leads to L–H transition initiation.
Figure 6. Localization of the TAE modes, measured with DBS, and q profile in shot #37001, 141.2 ms.
Figure 5. Nonlinear flux curve Γ (∇n for TUMAN-3M beforepellet injection and after peripheral pellet ablation, here the horizontal line indicates the integral source value (right side of equation (1)), the N-curve is the left side of equation (1), intersections show possible stationary solutions. The gas cloud additional source makes the existence of two solutions possible.

5
TUMAN-3M pellet-injection experiments; the curve shows the dependence of particle flux on the density gradient, hori-zontal lines are integral source values). The case when the second stable solution (H-mode) is impossible corresponds to FT-2 low density discharge parameters or TUMAN-3M deep pellet injection scenarios.
4. Alfvén waves
4.1. NBI-induced toroidal Alfvén eigenmodes
Existence of fast particles with velocities in excess of the Alfvén velocity in plasma will lead to excitation of Alfvéninstabilities that can provoke fast particle radial transport and losses. Investigation of the toroidal Alfvén eigenmodes(TAE) identified in earlier experiments with NBI heating on Globus-M [20, 21] were continued at the increased magnetic field and plasma current values of 0.5 T and 240 kA, respec-tively. We observed that the TAE-induced particle losses per burst of equal amplitude decrease with the increase of BT and Ip [22]. The plasma current increase plays a decisive role in reduction of the losses, probably due to a decrease of the fast particle Larmor radius in the poloidal magnetic field [23]. The toroidal magnetic field increase gives a weaker effect, how-ever BT and Ip should be increased simultaneously to conserve the safety factor value. The obtained dependence is promising for a compact fusion neutron source on the base of a spherical tokamak, but should be checked in a wider parameter range, which is one of the tasks for the new Globus-M2 tokamak.
During the last experimental campaign on Globus-M, pro-gress was reached in the investigation of the TAE structure and localization. The multichannel Doppler backscattering reflec-tometry (DBS) was successfully applied for this purpose. As TAEs perturb local magnetic and electrical fields, their influ-ence on the plasma poloidal E × B rotational velocity could be detected from DBS measurements. The description of
the method can be found in [24] and its first application on Globus-M in [25]. Multichannel probing at frequencies of 20, 29, 39 and 48 GHz was applied. It allowed us to observe the TAE fluctuations at four spatially resolved points simultane-ously. Figure 6 demonstrates the radial profiles of the magn-etic fluctuation amplitudes obtained by the described method for the TAE modes n = 1 and n = 2 at 141.2 ms of shot #37001. The dashed line shows the q profile. It was obtained from the EFIT code calculations without plasma current pro-file measurements. We can conclude that TAEs are localized at the periphery of the plasma column, in the region of the normalized minor radii ρ from 0.6–1 and that modes with dif-ferent n have different localization. Modeling of the Alfvéncontinuum and mode structure for the TAE burst with profiles shown in figure 7 were performed with the modified KINX and CAXE codes [26]. Several global n = 1 TAEs were found in the Alfvén continuum gap (the specific heat ratio Γ = 0) assuming a fixed boundary condition. One of them, shown in figure 7, is broadly consistent with the experimental data in terms of mode localization, structure and frequency.
4.2. Alfvén waves (AWs) in OH plasma
Lower-frequency AW-type oscillations are observed in TUMAN-3M at low densities ne < 3 × 10¹⁹ m−3 in both Ohmic and NBI regimes [27, 28] They exhibit a clear Alfvénicdependence on toroidal field and plasma density. Comparison of the experimentally measured frequency evolution with one, calculated using the local plasma density in a discharge with strong perturbation of density profile caused by L–H trans-ition, indicates that AWs are localized in the central region r/a < 0.5 (figure 8(a)) [28, 29] and thus may be identified as a global Alfvén eigenmode rather than a TAE. AW activity inthe TUMAN-3M plasma is usually represented by two types of oscillations: short bursts correlated with sawtooth crashes, and longer ones in between the crashes [30], see figure 8(b).
Figure 7. The structure of the n = 1 TAE mode with a fixed boundary condition in the Alfvén continuum gap, frequency 155 kHz.Harmonics in straight field line coordinates and level lines of normal plasma displacement are shown.

6
These two types have a close frequency and similar poloidal spectrum, but different poloidal localization: short burst oscil-lations are localized predominantly at the top of the torus, whereas long bursts have a maximum amplitude at the bottom [31]. The TUMAN-3M AWs are driven not by NBI-produced fast ions (whose velocity is well below Alfvén velocity) butrather by magnetic field perturbation created by sawtooth crashes [32] or by loss of runaway electrons [33] associated with these crashes. Driving mechanisms for the two types of AWs may be different and require further investigation.
5. Ion cyclotron emission
Emission in the ion–cyclotron frequency range (ICE) inmagn etically confined plasma is usually observed in the experiments where ion velocity distribution function is locally non-monotonic. Non-monotonic distribution is typically caused by NBI or radio frequency heating. In the Ohmic regime, ICE is observed in plasmas with an essential fraction of suprathermal ions that originated due to nuclear fusion reactions [34].
5.1. ICE in NBI-heated plasma
ICE, observed on the TUMAN-3M tokamak in the NBI-heated scenario, is produced mainly by a minority of fast ions (e.g. fast deuterons in hydrogen plasma, and by fast protons in deuterium plasma) [35, 36]. In contrast to other experiments, where ICE was found to originate mostly from the low field side (LFS) periphery, ICE in TUMAN-3M comes from the core plasma region. A rare example of core ICE can be seen in the recent ASDEX Upgrade experiments [37]. ICE frequency in TUMAN-3M was found to follow toroidal magnetic field evolution and to be insensitive to changes in plasma density. An experimentally observed ICE spectral line consists of two to four unevenly spaced very narrow lines, see figure 9.
Most probably, ICE in TUMAN-3M is a result of com-pressional Alfvén eigenmode instability (with the disper-sion relation ω = kvA) excited by stagnation fast ions with narrow drift orbits localized in the vicinity of R ~ R0 and having an average vertical drift velocity close to zero [38]. For these ions, having a velocity vb and ion–cyclotron res-onance frequency ωci, the Doppler-shifted resonance con-dition is ω = lωci + k||vb [39]. Here ω and k|| are the wave
Figure 8. (a) Evolution of measured AW frequency (dots) and one calculated from local density evolution at different minor radii (lines) in a discharge with L–H transition at t = 57.2 ms, (b) correlation between sawtooth oscillations and AW bursts.
Figure 9. (a) Spectrogram of ICE in the TUMAN-3M deuterium plasma. NBI hydrogen ICE: thin bright line at ~12.5 MHz, with second and third harmonics barely seen. Ohmic deuterium ICE: broad line at ~8.5 MHz and its harmonics (up to seventh). (b) Fine structure of NBI ICE spectrum, (c) evolution of spectral components of ICE caused by sawtooth activity.

7
frequency and parallel wave vector. The observed frequency of hydrogen ICE in deuterium plasma is f ≈ 13 MHz. This is slightly lower than the ICR frequency of fast ions, (ω − ωci)/2π = k||vb/2π ≈ −1.5 MHz, meaning the wave is counter-propagating and has the toroidal mode number n = −1. Neutral beam, used on TUMAN-3M, has a non-monoenergetic spectrum, comprising E0, E0/2, E0/3, 2E0/3 and some other components. Fast ions, produced by ioniz-ation of these components, have different parallel velocities vb and locate at slightly different stagnation orbits, resulting in different ICR and ICE frequencies. In this framework, the next experimentally observed characteristic features of TUMAN-3M NBI ICE can be understood: exact harmonics for l = 1, 2, 3…; linear dependence of ICE frequency on toroidal field and virtually absent dependence on plasma den-sity; and fine structure of the ICE frequency line.
5.2. ICE in OH plasma
Oscillations in the ion–cyclotron frequency range (5–100 MHz)were recently detected by fast magnetic probes in OH plasma in the TUMAN-3M tokamak. This phenomenon was called Ohmic ICE (OICE). The distinguishing feature of OICE is that it was not caused by suprathermal fusion products as the ion temperature was too low (Ti ~ 150–300 eV). The following characteristic features of OICE were found.
– The OICE was detected in the hydrogen and deuteriumplasmas by magnetic probes, located inside the vacuumvessel, both in the inner (high magnetic field side) andouter (low field side) parts of the tokamak.
– The spectrum of the OICE typically consisted of manyharmonics with frequencies evolving in time as thetoroidal magnetic field BT(t) (see the spectrogram infigure 9, where the harmonics of OICE are shown together with BT(t)).
– OICE intensity was distributed asymmetrically relative tothe equatorial plane: it was not possible to register OICEbelow the equator.
– The fundamental frequency of OICE, registered by eachof the probes, depends on the probe position; it corre-sponds to the ICR frequency of the main plasma ions inthe close vicinity of the corresponding magnetic probe,regardless of whether hydrogen (H+) or deuterium (D+)was the main ion (figure 10).
– NBI does not influence the fundamental frequency ofOICE regardless of which hydrogen isotope atom isinjected [35]; the injection does influence the intensityand harmonic content of OICE though.
In [40], the possibility of excitation of drift instabilities in inhomogeneous plasma at harmonics of the ion cyclotron fre-quency is shown. The model proposed in this work seems to be the most suitable for describing the phenomenon of OICE observed on the TUMAN-3M tokamak.
6. Discharge disruption
The characterization of plasma current quench during major disruption was studied in the Globus-M spherical tokamak. In contrast with the International Disruption Database for con-ventional tokamaks [41], experiments demonstrate a favor-able, almost linear, dependence of the normalized current
Figure 10. Spectra of OICE on the two magnetic probes: LFS1 and HFS1 (high field side) in D and H plasmas. Dotted lines denote calculated ion–cyclotron frequency f ci and its harmonics.
Figure 11. Current quench time normalized to S and to the dimensionless plasma inductance L versus Ip/S for hydrogen (squares) and deuterium (circles) plasmas. The horizontal dash–dotted line shows the ITER critical value.

8
quench time tCQ/S on the plasma current density Ip/S before the disruption [42], where S is the area of the plasma poloidal cross-section. The minimum normalized disruption time in Globus-M, obtained at a very low plasma current, is shorter by a factor of 2.2 than the critical value adopted for ITER tCQ/S = 1.67 ms m−2. At a higher Globus-M plasma cur-rent the values of tCQ/S exceed ITER critical value several times. The additional division of tCQ/S by the dimensionless inductance L = [ln(8R/aκ1/2)—1.75] (L ~ 1 for conventionaltokamaks, L ~ 0.5 for Globus-M), where κ is the vertical elon-gation of the plasma column before the disruption, brings the Globus-M data closer to the data obtained for conventional tokamaks (figure 11). One can see from the figure that the nor-malized current quench time depends weakly on the ion mass.
The current quench is usually accompanied by the fast vertical displacement of the plasma column and results in a considerable toroidal eddy current in the vessel wall [43]. Interaction of the current with the poloidal magnetic field produces electromagnetic loads. To calculate the distribution of the eddy toroidal currents and electromagnetic pressures, a 2D mathematical model of the vessel wall was developed. In the model the wall is approximated by 64 axisymmetric rings with a certain electric resistance closed along the torus. The voltages, induced during the plasma current quench, were measured with a set of 21 loops, located on the vessel wall. Each loop was associated with a group of the neighboring wall elements. The distribution of the pressure, normal to the vessel wall, in the shot with downward plasma displacement during the disruption is shown in figure 12. In the example the plasma current before the disruption is Ip ≈ 0.2 MA and the current quench time ~0.6 ms. The maximum local pressure
on the lower dome of the vessel is about 17 kPa, which is much lower than the atmospheric pressure. The pressures are directed oppositely over a short vessel section. Such a com-plicated distribution of the electromagnetic loads is connected with a strong inhomogeneity of the poloidal magnetic field in this region. The vacuum vessel is constructed using the mem-brane theory of shells, i.e. twisting and bending moments in the domes caused by the atmospheric pressure are small. However, during the current quench, a bending moment arises.
7. SOL study
A new nine-pin Langmuir probe, which can be moved along the major radius between shots, was installed at the outer midplane of the Globus-M tokamak. The probe head makes it possible to measure the following parameters: the floating potential (Vf), ion saturation current (Iis), electron temper-ature (Te), electron density (ne) and the Mach number (M||). A detailed description of the probe can be found in [44]. One of the main advantages of this probe is its resistance to high thermal loads.
One of the crucial parameters of the edge SOL plasma, determining the heat loads to the divertor plates, is a power decay length λq. A full theoretical model, allowing evalua-tion of this parameter, does not exist yet and empirical scal-ings are usually used for this purpose [45]. According to a simple SOL approach [46] the power flux is proportional to neT3/2
e . Therefore, power decay length at the midplanecould be calculated using the following expression: λq = (1/λne + (3/(2λTe))−1, where λne and λTe are electron density and temper ature scale lengths respectively. Electron tempera-ture and density profiles in SOL were measured for the two
Figure 12. Distribution of the normal pressure on the Globus-M vessel. Circles show magnetic loops. Arrows are proportional to the pressure magnitude.
Table 1. Experimental λq and scaling estimations.
BT, T Ip, kA λq, mm λEich−2011q , mm λEich−2011
q , mm
0.4 180 4.9 ± 0.5 7.0 4.00.5 225 4.1 ± 0.5 5.4 3.4
Figure 13. Globus-M fitting for power decay length via plasma current.

9
series (BT = 0.4 T, Ip = 180 kA and BT = 0.5 T, Ip = 225 kA) of the lower single-null discharges with close q95 values. The results were compared with Eich’s scalings of 2011 [45]and 2013 [47] (see table 1). Like in the previous experiments [48], derived values of λq are closer to the Eich-2013 scaling. The dependence of λq on plasma current was updated using the Globus-M database with plasma current values from
115–250 kA: λq ~ I−(1.3±0.2)p (figure 13) [22]. In figure 14,
estimated λq in Globus-M is compared to λq in other tokamaks. It can be seen that power decay length dependence on Ip in Globus-M is consistent with the Eich-2013 scaling predictions.
8. Benchmarking of full-f global gyrokinetic model-ing results against the FT-2 tokamak DR data usingsynthetic diagnostics
The massively parallelized particle-in-cell simulations of the gyrokinetic (GK) distribution function and the electric field provide an efficient theoretical tool for studying the nonlinear turbulent plasma dynamics, which, however, need validation and comprehensive benchmarking against the experimental data. In this section the results of the global GK particle-in-cell simulations, performed by ELMFIRE code, are quantitatively compared with the X-mode DR experimental data obtained at the high magnetic field side of the FT-2 tokamak [49]. Two versions of the DR synthetic diagnostics, a fast linear version based on the reciprocity theorem [50] and a full-wave version utilizing the IPF-FD3D code [51] are used for this purpose. The experimental data obtained with standard DR, utilizing a variable antenna position, and with the radial correlation DR (RCDR), which was used in the comparison, characterize the tokamak plasma turbulent dynamics at different scales: micro- (density fluctuations of trapped electron mode), macro- (the velocity of global plasma flows) and meso-scale (GAM).
The benchmarking against X-mode DR experimental data has demonstrated a good agreement between the DR spectra
measured and computed using both synthetic diagnostics (see figure 15). For all antennae positions used for comparison, both the spectra frequency shift and width, and in many cases the spectra shape, were similar, thus demonstrating a correct reproduction of the electric field behavior in the FT-2 tokamak by the ELMFIRE GK code. The mean fluctuation velocities, determined by the DR measurements and the synthetic diag-nostics, were close. The GAM frequency and amplitude, pro-vided by the measurements and by the synthetic DR, appear to be close within a 12% accuracy. However, a drastic (factor of three) excess was found in the decay with a growing fre-quency shift in the probing wave channels of the RCDR cross-correlation function (CCF) provided by the fast synthetic diagnostics compared to the experimental one. The quick decrease of the radial correlation observed in the experiment is attributed to the phase modulation of the probing wave due to the long-scale density fluctuations, which is shown to be close to π/3 by both the specially performed measurements
Figure 14. Comparison of the estimated λq in Globus-M and other tokamaks with predictions by Eich-2013 scaling.
Figure 15. Comparison of DR spectra for up-shifted antenna vertical displacement. Circles–experiment; triangles—fast syntheticDR, squares—full-wave synthetic DR.
Figure 16. The RCDR CCF against the channel frequency separation. Stars—fast synthetic DR; squares—full-wave syntheticDR; triangles—fast synthetic DR with phase modulation; circles—experiment.

10
and the Wentzel–Kramers–Brillouin estimation based on the GK modeling results. In spite of the fact that this value indi-cates only the beginning of the transition to the fluctuation reflectometry nonlinear regime [52, 53] (which therefore is not influencing the DR spectra) it already has a strong impact on the RCDR performance. This conclusion is confirmed by the full-wave DR synth etic diagnostics correctly accounting for the perturbation to the probing wave propagation produced by the turbulence, which demonstrates a much better agree-ment with the exper imental CCF, as shown in figure 16. The only pronounced difference between the measurements and synthetic diagnostics is found in the dependence of the DR signal power on the antenna vertical displacement, which is related to the density fluctuation poloidal wavenumber spec-trum (see figure 17). Dependences of the measured and syn-thetic DR signal power on the antenna vertical displacement are well approximated by Gaussian curves. However, the esti-mated ‘spectral width’, corresponding to these dependences,
is different by a factor of 1.5. This difference could be attrib-uted to the fact that GK computations underestimate the small-scale turbulence level in its decay region at the high field side of the torus.
9. Anomalous absorption and emission in ECRHexperiments due to parametric excitationof localized UH waves
In contrast to the standard theory [54] predicting high thresh-olds of anomalous phenomena at ECRH in tokamaks, anoma-lous backscattering was observed a decade ago at TEXTOR in modest power level X2-mode neo-classical magnetic island control experiments [55]. This effect was explained in [56] by the low-threshold parametric excitation of two UH waves trapped in the vicinity of a local maximum of plasma density situated in the magnetic island. However, it should be men-tioned that the anomalous backscattering effect was observed at TEXTOR in a wide range of the plasma densities in the
Figure 17. Dependence of the backscattering power on the fluctuation poloidal wavenumber or vertical antenna displacement y a.
Figure 18. The dispersion curves of primary and secondary daughter waves generated in the cascade of decays; 1—primarynon-trapped UH wave, 2—primary trapped UH wave,1′—secondary IB wave, 2′—secondary trapped UH waves. Thedimensionless UH frequency profile ( f 2
UH/(f0/2)2)—thick solidcurve.
Figure 19. Temporal evolution of the averaged energy density of primary (dashed curve) and secondary (solid curve) UH plasmons. The dash–dotted and dash–double-dotted lines are the analyticalpredictions for the instability exponential growth and saturation stages, respectively.
Figure 20. The anomalous absorption rate versus the pump power.

11
local maximum of the density profile substantially exceeding the UH value for half the pump wave frequency. Under these more general conditions the trapping of both decay UH plas-mons is no longer possible. Nevertheless, one of the pri-mary UH daughter waves can still be localized, which can lead to the excitation of low-threshold absolute parametric two-plasmon decay instability (TPDI) [57]. In this paper we analyze the saturation of the TPDI under the general condi-tions when only one of the parametrically driven plasmons is trapped, whereas the second one can leave the decay region (see figure 18). We consider the secondary decay instability of the localized UH wave producing another UH wave and an ion Bernstein wave (see figure 19) as a moderator of the primary TPDI. The general analytical consideration is accompanied by numerical analysis performed under the experimental condi-tions typical of the off-axis X2-mode ECRH experiments at TEXTOR [55] demonstrating the instability saturation (see figure 19). We also estimate a fraction of the pump power P0 gained anomalously throughout TPDI in this case. As shown in figure 20, well above the TPDI threshold, equal for the TEXTOR parameters to 128 kW, the anomalous absorption rate is equal to 11%.
It should be also underlined that in the case ω0 �2ωUH (xmin) considered in this paper the non-trapped UH wave propagating outward perpendicular to the magnetic field is converted into the X-mode (see figure 18). It crosses the ECR surface and leaves the plasma at the high-field side. Neglecting the ECR absorption of the X-mode, which is small at the perpendicular propagation in the modest temperature plasma of middle scale devices, and taking into account the power balance in the decay by a factor α we can estimate the power of this X-mode radiation at the half-pump frequency as
PXω0/2 = αP0/2. In the case considered in this paper it results
in 0.05 P0. The larger part of this power is reflected from the device wall in the form of the X-mode and finally absorbed after conversion in the UH resonance. However, a smaller part of the power, characterized by the cross-polarization factor βXO, is reflected in the form of an O-mode, which is partly absorbed in the ECR and then leaves the plasma. Taking into account the O-mode absorption rate ΓO1 we obtain the esti-mation for the O-mode emission power at the low field side at the half pump frequency QO ≈ 0.5αβXO exp (−ΓO1)P0.
Considering that for the conditions of the TEXTOR off-axis ECRH experiment ΓO1 = 2, and assuming βXO = 0.01, we get for the case under consideration QO ≈ 8 × 10⁻⁵P0. Thusat the maximal microwave power of 600 kW one can expect to see the O-mode emission of 50 W at the half pump fre-quency at the low field side of the tokamak. This emission is observable only in the narrow density range when the UH density for half the pump frequency is slightly lower than plasma density in the profile local minimum, however the decay with the upper branch of the non-localized UH wave (electron Bernstein wave) is still possible. Out of this den-sity range the intensive emission of sub-harmonic ω0/2 is not possible; nevertheless due to the nonlinear coupling of UH plasmons and the pump wave emission of the 3ω0/2 harmonic it can occur. It happens when the following condi-
tions hold: ωce (xm)√
ne(xmax)δne
< 5ω02 < c
lT
»δne
ne(xmax), where
δne = ne (xmax)− ne (xmin), ne (xmax) and ne (xmin) stand forthe density value in the local maximum and minimum of theprofile, respectively. We get the 3ω0/2 pump harmonic emis-sion power received by the antenna as ps = T3/2P0, where the conversion coefficient at the TEXTOR parameters is
equal to T3/2 = 5 × 10⁻⁵. The maximal power utilized in theTEXTOR magnetic island control experiment results in 30 W of received 3ω0/2 pump harmonic emission. More details on the research described in this paragraph can be found in [58].
10. ITER diagnostics development
Three diagnostics for ITER are being developed at the Ioffe Institute: neutral particle analysis (NPA), gamma-ray spec-trometry and DTS combined with LIF.
10.1.NPA and GRS
Over the past few years, considerable progress has been made in several areas of NPA diagnostic system development. The current 3D design of the NPA system, which consists of low-energy (LENPA) and high-energy (HENPA) neutral particle analyzers and a gamma-ray spectrometer (GRS), is presented in figure 21. A detailed technological analysis of the NPA design was done to conform with French nuclear regulations
Figure 21. 3D design of the ITER NPA diagnostic system. LENPA and HENPA neutral particle analyzers and the GRS are shown.

12
and from the point of view of manufacturing. A lot of effort has been made in integrating LENPA and HENPA analyzers with their supporting subsystems into the ITER environment. At present, the tests of the most critical NPA components are underway [59], and the problems related to NPA neutron and magnetic shield design are being resolved [60]. One of the main goals for the analyzers at ITER is the measurement of the fuel isotope (D/T) ratio [61]. The influence of various plasma phenomena on the NPA ratio measurement has therefore been analyzed. It was shown that NBI [62], pellet injection [63] and sawtooth oscillations [64] may have some effect on NPA signals, which should be taken into account by appropriate modelling to get sufficiently accurate D/T measurements.
A GRS is placed in the neutron dump of the NPA system behind LENPA (figure 21). The spectrometer is intended to diagnose accelerated ions and electrons by the line-integrated
gamma-ray measurements [27, 65]. They will provide comple-mentary signals for NPA data on fuel ratio and energy spectra of confined α- and other energetic particles (p, D, T, 3He). The GRS includes two detectors: a semiconductor high-purity Ge detector and a scintillation detector with a LaBr3(Ce) crystal. For spectrometric measurements under the conditions of a thermonuclear experiment it was necessary to develop an algorithm for digital signal processing, providing stable meas-urements at the counting rate of LaBr3(Ce) up to 5 × 10⁶ s−1 and up to 5 × 10⁵ s−1 for the HPGe detector. The developed data acquisition system based on the NI PXIe architecture makes it possible to record the detector signal for at least 400 s with a sampling rate of 250 MHz. At present, the prototyping and testing of the main components of the GRS are carried out under conditions close to the ITER ones. The LaBr3(Ce) detector mockup was successfully tested for a radiation resist-ance under an integral neutron flux of 1.1 × 1013 cm−2. More details on the GRS development are presented in [66].
To provide energy distributions of fast electrons and ions in tokamak plasmas based on gamma-ray measurements, a spec-trum deconvolution code DeGaSum has been developed at the Ioffe Institute [67]. The code was applied to get the energy distributions of runaway electrons in experiments at FT-2 [68, 69], TUMAN-3M [70], JET [71] and ASDEX-Upgrade [72]. Examples of a hard x-ray spectrum recorded during an Ohmic TUMAN-3M discharge and the runaway electron distribution function reconstructed with the DeGaSum code are shown in figure 22. The gamma-ray spectra deconvolu-tion algorithm, based on the measurement of intensities of peaks from different reactions, involving deuterium, was used for the reconstruction of the ion cyclotron resonance heating (ICRH)-accelerated D+ distribution on JET [73].
10.2.DTS combined with LIF
The ITER DTS and LIF are active laser-aided diagnostics pro-viding local measurements of plasma parameters in the outer divertor leg (see figure 23), i.e. in the area with extremely steep gradients, both parallel and perpendicular to the magn-etic surfaces. The combined DTS/LIF diagnostic provides simultaneous measurement of the local Te, ne, Ti, ni, na along the probing laser paths with a resolution of 25 mm along the probing chords.
SOLPS modeling of detachment in the ITER divertor requires a detailed knowledge of:
– electron processes, including rates of ionization, recom-bination and radiation;
– ion–neutral collisions responsible for: control of effectivepressure in the recycling region, with counter-balancingof the upstream plasma pressure; cooling the plasmadown to ~1 eV and initiating the recombination processes(without recombination each ion reaching the plateswill transfer 13.6 eV in the form of heat); and ‘friction’switching the plasma flow from free streaming to diffu-sion, making the residence time of the electrons and ionssufficient for recombination.
Figure 22. HXR spectrum recorded during an Ohmic TUMAN-3M discharge (squares) and the runaway electron distribution function (solid line) with uncertainties (dotted lines) calculated with the DaGaSum code.
Figure 23. Optical layout of DTS/LIF probing chords in the ITER divertor. Pos. 1, 2 and 3 mark the first laser mirrors launching laser beams in outer leg plasma. Collection FM1 is the centrum of the collection aperture diaphragm.

13
Measuring Te, ne, Ti, ni nHe/H/D/T simultaneously, the fol-lowing important parameters in the respective points of the divertor SOL can be calculated:
– ionization balance: rates of ionization and recombination(Te ne nHe/H/D/T);
– emission intensity (Te ne ni nHe/H/D/T);– frictional forces determined by collisions with neutrals
(Ti ni nHe/H/D/T);– pressure of the incoming plasma flow (Te ne Ti ni).
Challenges of DTS implementation in the ITER divertor were discussed in [74] together with its capability to sat-isfy project requirements, related to the range of the meas-ured Te and ne. The main challenge for DTS is extremely high ne and low Te plasmas in the regions with predominant recombination. The developed approach, based on synthetic experiments, shows that the expected Te and ne measurement accuracy is better than the specified technical requirements, in spite of the pronounced collective effects [75]. Temporal shapes of the atomic helium fluorescence can be also utilized for the measurement of ne in the range of 1018—1020 m−3.The dynamic collision-radiative model, developed for helium, allows for fitting a calculated temporal shape to the measured fluorescence signals. It was verified in Globus-M experi-ments, showing a good agreement between TS and LIF for Te ~ 110 eV ne ~ 2 × 10¹⁹ m−3 [75]. Laser-induced quenching is a new technique [75], proposed for the measurement of H/D/T atomic density in the ITER divertor. The current status of LIF performance of Ti and nHe measurements using HeI and HeII fluorescence was presented in [76]. There have been multiple recent achievements in the hardware development.
The progress in the development of DTS filter polychroma-tors and piezomotors is presented in [77]. The most recent achievements in the development of DTS laser system were presented in [78]. Investigation of laser resistance of plasma-facing diagnostic components was discussed in [79].
11. Globus-M2
Globus-M2 is an upgraded version of the Globus-M tokamak with the same vacuum vessel and an enhanced electro magnetic system and power supplies. Auxiliary plasma heating, cur-rent drive systems and a set of diagnostics were upgraded as well. An increase in the magnetic field (from 0.5 to 1.0 T) together with an increase in the plasma current (from 0.25 to 0.5 MA) in the Globus-M2 tokamak should improve plasma performance and provide enhanced conditions for auxiliary heating and current drive [48, 80–84]. ICRH in the case ofan increased magnetic field (and, as a result, the growth in the resonant frequency up to 15 MHz) become more efficient due to the enhancement of the single-pass absorption and the improvement of the antenna–plasma coupling. An increasein the efficiency of an NBI is expected due to a significant reduction in fast particle losses. Approximately half of the plasma current can be sustained non-inductively by simulta-neous injection of the two 1 MW neutral beams. The use of the lower-hybrid waves (2.45 GHz) with an input power level of 0.5 MW should ensure a completely non-inductive mainte-nance of current in the discharge. Eventually an improvement in the plasma parameters, including an increase in plasma temperature and significant drop in collision frequency, is expected.
Figure 24. The reconstruction of the magnetic flux lines (left) and of the poloidal magnetic field |Bp| = 0.002, 0.005, 0.008, 0.010, 0.012 T (right) at the moment of plasma breakdown.

14
In the frame of preparation for the first plasma experiment [85, 86], the breakdown was optimized. It was possible to pro-vide a significant area with a ‘zero’ value (below 2 mT) of themagnetic field poloidal component in the tokamak discharge vessel (see figure 24). In the subsequent plasma experiment, the breakdown voltage in the discharge was reduced from 7 to 5 V as compared to the Globus-M tokamak. The result indi-rectly indicates a higher quality of manufacture and assembly of the Globus-M2 electromagnetic system. The first plasma in Globus-M2 was achieved on 23 April 2018. During the first campaign, moderate density plasma shot with a current of 200 kA was reproduced (see figure 25), and a 0.6 T toroidal magnetic field was achieved. A full-scale experiment with an increased toroidal magnetic field is planned for the beginning of 2019.
12. Summary
The main results of the recent tokamak-related research at the Ioffe Institute have been reviewed. Major parts of the studies were conducted at three small tokamaks with different param-eters—the spherical tokamak Globus-M, the large aspect ratiotokamak FT-2 and the compact tokamak TUMAN-3M. The main fields of study were energy confinement (Globus-M
and FT-2); the L–H transition (TUMAN-3M and FT-2);Alfvén waves (Globus-M and TUMAN-3M); ion cyclotronemission (TUMAN-3M); major plasma discharge disrup-tion (Globus-M) and the SOL (Globus-M). Benchmarking of the full-f global gyrokinetic modeling results against the DR data using synthetic diagnostics was performed at the FT-2 tokamak. Anomalous emission and absorption due to parametric excitation of localized UH waves in ECRH experiments was also discussed. Three ITER diagnostics are described: NPA, gamma-ray spectrometry and DTS combined with LIF. A majority of the future studies will be concentrated around the recently launched Globus-M2 spherical tokamak. The machine has an electromagnetic system, providing a 1 T toroidal magnetic field, upgraded diagnostics and heating sys-tems. Globus-M2 is considered as the next step on the path to a compact beam–plasma neutron source due to its distin-guishing features such as a high normalized Larmor radius and reactor-scale heating power density (up to 6 MW m−3). It will provide relevant conditions for the studies of new tokamak physics and the testing of new fusion technologies.
Acknowledgment
The experimental investigations were performed on the Unique Scientific Facility ‘Spherical Tokamak Globus-M’, which isincorporated in the Federal Joint Research Center ‘MaterialScience and Characterization in Advanced Technology’, onthe Unique Scientific Facility ‘TUMAN-3M’ and on the FT-2tokamak. The maintenance of tokamaks and of standard diag-nostics was supported by the Ioffe Institute. Auxiliary heat-ing and fast particle confinement studies in section 2.1 were supported by RSF research project No. 17-72-20076. TAE investigation (section 4.1) was supported by RSF research project No. 17-12-01177. Studies of Alfven waves and ICE (sections 4.2 and 5) on the TUMAN-3M tokamak were sup-ported by RSF grant 16-12-10285. Investigations presented in sections 2.2 and 8 were performed under financial support of the RSF grant 17-12-01110. Investigations presented in sec-tion 9 of the paper were performed under financial support of the RSF grant 16-12-10043.
ORCID iDs
A.B. Altukhov https://orcid.org/0000-0002-5913-6004N.A. Babinov https://orcid.org/0000-0002-8695-2701A.A. Belokurov https://orcid.org/0000-0001-8942-6734V.V. Bulanin https://orcid.org/0000-0001-8030-3957A.D. Gurchenko https://orcid.org/0000-0002-2540-2511T.P. Kiviniemi https://orcid.org/0000-0001-9753-3388S.V. Lebedev https://orcid.org/0000-0001-5979-5344C. Lechte https://orcid.org/0000-0003-4171-888XP. Niskala https://orcid.org/0000-0001-7308-9921A.Yu. Popov https://orcid.org/0000-0003-0574-516XA.Yu. Telnova https://orcid.org/0000-0003-0495-7881L.A. Varshavchick https://orcid.org/0000-0002-7042-3469
Figure 25. The evolution of the plasma current, loop voltage, line averaged density, soft x-ray signal and CIII emission intensity in shot #37269 with the 25 keV, 0.6 MW D-NBI (transparent filling).

15
[1] Gusev V.K. et al 2013 Nucl. Fusion 53 093013[2] Gusev V.K. et al 2015 Plasma Phys. Control. Fusion
58 014032[3] Winsor N., Johnson J.L. and Dawson J.M. 1968 Phys. Fluids
11 2448[4] Lashkul S.I. et al 2017 EPJ Web Conf. 149 03012[5] Valovic M. et al 2009 Nucl. Fusion 49 075016[6] Kaye S.M. et al 2006 Nucl. Fusion 46 848–57[7] ITER Physics Basis Expert Group Chapter 2: Plasma
confinement and transport 1999 Nucl. Fusion 39 2175[8] Valovic M. et al 2011 Nucl. Fusion 51 073045[9] Kaye S.M. et al 2013 Nucl. Fusion 53 063005
[10] Kurskiev G.S. et al 2017 Phys. At. Nuclei 80 1313[11] Kurskiev G.S. et al 2017 Plasma Phys. Control. Fusion
59 045010[12] Kurskiev G.S. et al 2019 Nucl. Fusion 59 066032[13] Telnova A.Yu. et al 2017 J. Phys.: Conf. Ser. 907 012014[14] Kouprienko D.V. et al 2018 45th EPS Conf. on Plasma
Phys. (Proc. of 45th EPS Conf. on Plasma Phys.) vol42A (Prague) (ECA) p P4.1097 (http://ocs.ciemat.es/EPS2018PAP/pdf/P4.1097.pdf)
[15] Simmet E.E. and The ASDEX Team 1996 Plasma Phys.Control. Fusion 38 689–704
[16] Staebler G.M. 1998 Plasma Phys. Control. Fusion 40 569–80[17] Malkov M. and Diamond P. 2008 Phys. Plasmas 15 122301[18] Askinazi L.G. et al 2017 Plasma Phys. Control. Fusion
59 014037[19] Belokurov A.A. et al 2018 Nucl. Fusion 58 112007[20] Petrov Yu.V. et al 2014 Tech. Phys. Lett. 40 1136–9[21] Petrov Yu. V. et al 2015 JPP 81 515810601[22] Bakharev N.N. et al 2018 Nucl. Fusion 58 126029[23] Bakharev N.N. et al 2013 Tech. Phys .Lett. 39 1085[24] Yashin A.Y. et al 2015 J. Instrum. 10 10023[25] Bulanin V.V. et al 2017 Tech. Phys. Lett. 43 1067–70[26] Gusev V.K. et al 2018 Tech. Phys. Lett. 44 67–9[27] Askinazi L.G. et al 2015 Nucl. Fusion 55 104013[28] Abdullina G.I. et al 2018 Tech. Phys. Lett. 44 108[29] Abdullina G.I. et al 2018 J. Phys.: Conf. Ser. 1094 012008[30] Lebedev S.V. et al 2016 43rd EPS Conf. on Plasma Physics
(Proc. of 43rd EPS Conf. on Plasma Phys.) vol 41F (ECA)(Leuven) p P5.036 (http://ocs.ciemat.es/EPS2016PAP/pdf/P5.036.pdf)
[31] Abdullina G.I. et al 2018 45th EPS Conf. on Plasma Physics(Proc. of 45th EPS Conf. on Plasma Phys.) (Prague) pP4.1062 (http://ocs.ciemat.es/EPS2018PAP/pdf/P4.1062.pdf)
[32] McClements K.G. et al 2002 Nucl. Fusion 42 1155[33] Tukachinsky A.S. et al 2016 Tech. Phys. Lett. 42 1167[34] Cottrell G.A. 2000 Phys. Rev. Lett. 84 2397[35] Askinazi L.G. et al 2018 Nucl. Fusion 58 082003[36] Lebedev S.V. et al 2017 EPJ Web Conf. 149 03010[37] Ochoukov R. et al 2019 Nucl. Fusion 59 014001[38] Rome J.A. and Peng Y.-K.M. 1979 Nucl. Fusion 19 1193[39] Sharapov S.E. et al 2014 Phys. Plasmas 21 082501[40] Mikhailovsky A. 1971 Nucl. Fusion 11 323[41] Eidietis N.W. et al 2015 Nucl. Fusion 55 063030[42] Sakharov N.V. et al 2017 Plasma Phys. Rep. 43 422[43] Sakharov N.V. et al 2018 Plasma Phys. Rep. 44 335–46[44] Tokarev V.A. et al 2018 J. Phys.: Conf. Series 1094 012003[45] Eich T. et al 2011 Phys. Rev. Lett. 107 215001[46] Stangeby P.C. 2000 The Plasma Boundary of Magnetic Fusion
Devices (Bristol: IOP Publishing Ltd)[47] Eich T. et al 2013 Nucl. Fusion 53 093031[48] Gusev V.K. et al 2015 Nucl. Fusion 55 104016
[49] Krutkin O. et al 2019 Nucl. Fusion 59 096017[50] Altukhov A.B. et al 2018 Phys. Plasmas 25 082305[51] Lechte C. et al 2017 Plasma Phys. Control. Fusion 59 07500[52] Gusakov E.Z. and Popov A.Yu. 2002 Plasma Phys. Control.
Fusion 44 2327[53] Gusakov E.Z. and Popov A.Yu. 2005 Plasma Phys. Control.
Fusion 47 379[54] Cohen B. et al 1991 Rev. Mod. Phys. 63 949[55] Westerhof E. et al 2009 Phys. Rev. Lett. 103 125001[56] Gusakov E.Z. and Popov A.Yu. 2016 Phys. Plasmas
23 082503[57] Popov A.Yu. and Gusakov E.Z. 2016 Europhys. Lett.
116 45002[58] Gusakov E.Z. et al 2018 Preprint: 2018 IAEA Fusion Energy
Conf. (Gandhinagar, India, 22–27 October 2018) TH/P4-10(https://nucleus.iaea.org/sites/fusionportal/Shared%20Documents/FEC%202018/fec2018-preprints/preprint0057.pdf)
[59] Afanasyev V.I. et al 2016 30th Meeting of the ITPA TGD(Novosibirsk, Russian Federation, 21–24 June 2016)
[60] Petrov S.Ya. et al 2017 Phys. At. Nuclei 80 1268–78[61] Afanasyev V.I. et al 2010 Nucl. Instrum. Methods Phys. Res.
A 621 456–67[62] Afanasyev V.I. et al 2015 Plasma Phys. Rep. 41 983–89[63] Petrov M.P. et al 2015 1st EPS Conf. on Plasma Diagnostics
(Frascati, Italy, 14–17 April 2015) p 153 (https://pos.sissa.it/240/153/pdf)
[64] Mironov M. et al 2018 Nucl. Fusion 58 082030[65] Gin D. et al 2014 AIP Conf. Proc. 1612 149[66] Gin D. et al 2018 Preprint: 2018 IAEA Fusion Energy Conf.
(Gandhinagar, India, 22–27 October 2018) FIP/P7-15(https://nucleus.iaea.org/sites/fusionportal/Shared%20Documents/FEC%202018/fec2018-preprints/preprint0479.pdf)
[67] Shevelev A.E. et al 2013 Nucl. Fusion 53 123004[68] Shevelev A.E. et al 2016 Nucl. Instrum. Methods Phys. Res. A
830 102–8[69] Shevelev A.E. et al 2018 Nucl. Fusion 58 016034[70] Shevelev A.E. et al 2018 Plasma Phys. Control. Fusion
60 0750097[71] Reux C. et al 2015 Nucl. Fusion 55 093013[72] Nocente M. et al 2018 Rev. Sci. Instrum. 89 10I124[73] Schneider M. et al 2016 Nucl. Fusion 56 11202210[74] Mukhin E.E. et al 2014 Nucl. Fusion 54 043007[75] Mukhin E.E. et al 2019 Nucl. Fusion 59 086052[76] Gorbunov A. et al 2017 Fusion Eng. Des. 123 695[77] Mukhin E.E. et al 2017 Fusion Eng. Des. 123 686[78] Kornev A. et al 2018 SOFT (Messina, Sicily, 16–21 September
2018) p P2.055 (www.soft2018.eu/?download=Book-of-Abstracts.pdf)
[79] Razdobarin A. 2018 SOFT (Messina, Sicily, 16–21 September2018) p P4.215 (www.soft2018.eu/?download=Book-of-Abstracts.pdf)
[80] Minaev V.B. et al 2017 Nucl. Fusion 57 066047[81] Bakharev N.N. et al 2015 Nucl. Fusion 55 043023[82] Saveliev A. et al 2011 38th EPS Conf. on Plasma Phys.
(Proc. of 38th EPS Conf. on Plasma Phys.) vol 35(ECA) (Strasbourg) p GP-4.103 (http://ocs.ciemat.es/EPS2011PAP/pdf/P4.103.pdf)
[83] Shcherbinin O. et al 2012 Tech. Phys. Lett. 38 869–72[84] Shchegolev P.B. et al 2015 Tech. Phys. 60 1321[85] Minaev V.B. et al 2018 45th EPS Conf. on Plasma Phys.
(Proc. of 45th EPS Conf. on Plasma Phys.) vol 42A (ECA)(Prague) p P4.1065 (http://ocs.ciemat.es/EPS2018PAP/pdf/P4.1065.pdf)
[86] Minaev V.B. et al 2018 J. Phys.: Conf. Ser. 1094 012001
References