too much clinton coverage bush approval on...
TRANSCRIPT

Also Inside ...
w ‘Faith-based’ office raises doubts.w Bush a moderate to moderates.w Bush charm registers, but he’s no Clinton.w Missile defense divide.w Exceptionally low interest in India quake.
FOR RELEASE: THURSDAY, FEBRUARY 22, 2001, 4:00 P.M.
Too Much Clinton CoverageBUSH APPROVAL ON PAR, NO TAX CUT MOMENTUM
FOR FURTHER INFORMATION CONTACT:
Andrew Kohut, DirectorCarroll Doherty, EditorKimberly Parker, Research DirectorMichael Dimock, Survey DirectorNilanthi Samaranayake, Project DirectorPew Research Center for The People & The Press202/293-3126http://www.people-press.org

1 A Newsweek poll conducted at the same time as the Pew Research Center poll found 65% ofAmericans disapproved of Clinton's decision to pardon Rich.
Judging New Presidents
Approve Disapprove DK% % %
George W. Bush 53 21 26=100Bill Clinton (2/93) 56 25 19=100George Bush Sr.* (2/89) 63 13 24=100Ronald Reagan* (2/81) 55 18 27=100Jimmy Carter* (2/77) 71 9 20=100
Judging Their Press Coverage
Fair Unfair DK% % %
George W. Bush 65 19 16=100Bill Clinton (2/93) 72 17 11=100George Bush Sr. (8/89) 82 12 6=100
Clinton since he left office 56 30 14=100
* Gallup polls.
Too Much Clinton CoverageBUSH APPROVAL ON PAR, NO TAX CUT MOMENTUM
The public’s view of George W. Bush’s first month in office is remarkably unremarkable.Despite the extraordinary path he took to the White House, Americans are reacting to Bush in muchthe same way they responded to his predecessors. Bush’s modest February job approval rating (53%)is comparable to ratings accorded Bill Clinton and Ronald Reagan in the first weeks of theiradministrations, but significantly below those given one-term presidents George Bush Sr. and JimmyCarter.
In typical fashion, many Americans arereserving judgment about what they haveheard or seen about the new president in hisfirst month in office. But for now, most areinclined to give him the benefit of the doubt.About six-in-ten could articulate things theylike about Bush, while far fewer (40%) couldcite anything they dislike about him.
Contrary to the widely-articulatedopinion in Washington that the press has beentoo easy on Bush, fewer Americans think thatcoverage of the new president has been fairthan felt that way about Clinton and Bush’sfather early in their terms.
An even smaller percentage thinks thepress has been fair to Clinton since he left office, despite the public’s generally negative view of theformer president’s pardon of financier Marc Rich and Clinton’s other questionable activities on hisway out of the White House.1 It may be a matter of the amount of coverage as much as its tone andsubstance. A 53% majority says there has been too much coverage of the former president’sactivities, and a sizable minority (28%) says there has been too little coverage of the currentoccupant of the White House.

-2-
What They Like About Bush ...
Like most about Bush PercentPersonal traits 22 Honesty/Integrity 8 Character 4 Religious faith 3 Calm, dignified manner 3Policy proposals 14 Tax proposal 7Political traits 13 Keeping campaign promises 3
Nothing/Too early/Don’t know 39
The Pew Research Center’s nationwide survey of 1,513 adults, conducted Feb. 14-19, findslittle movement in opinion on tax cuts, Bush’s signature issue, since he took office, although muchhas been made about the increasing political momentum for his plan. Overall, a modest plurality(43%) backs Bush’s tax cut, although many fewer people favor using the budget surplus for a taxcut than for shoring up Social Security and Medicare. Equally important, a large majority continuesto think the president’s tax cut will benefit some people more than others — and 79% of this groupbelieves that the rich will be advantaged over middle class and poor people. It is probably notsurprising then that more Americans believe that the main goal of tax reduction should be tostimulate the economy, rather than to provide tax relief for people like themselves.
In that regard, more Americans identify economic concerns as the nation's top problem —26% cited such concerns in the new poll, up from 15% in August 1999. In particular, morerespondents volunteered worries about energy costs and the prospects of a recession. The surveyalso found significantly fewer Americans satisfied with national conditions than just a month ago(46% vs. 55%) — but that appears more politically based than economic, as dissatisfaction spikedmostly among Democrats and liberals.
Personality Bush’s Strong SuitJust as during the campaign, Bush’s personal
qualities are clearly serving him well in these first fewweeks of his presidency. When respondents were askedin an open-ended format what they have liked most aboutBush so far, personal traits were named more often thanpolicy positions or political traits.
The top individual responses related to Bush’shonesty and integrity. These traits held the most appealfor Republicans — 18% cited this as what they like mostabout Bush, compared to only 4% of independents and3% of Democrats. Bush’s tax proposal was also namedfrequently as were his character, his religious faith, his willingness to keep his campaign promises,and his calm, dignified manner.

-3-
... And What Turns Them Off
Dislike most about Bush PercentPolicy proposals 16 Tax proposal 6 Abortion position 4Personal traits 11 Not articulate 2 Arrogant/Cocky 2The way he got elected 4Cabinet appointments 3
Nothing/Too early/Don’t know 57
Blacks' Views on Father and Son
Bush Sr. G.W. BushAfrican American 1989 2001opinion ... % %Approve 53 22Disapprove 12 40Don’t know 35 38
100 100
When respondents were asked what they dislikedmost about Bush so far, policy positions trumpedpersonal qualities, although more than half couldn’t comeup with an answer. The president’s tax proposal toppedthe list of complaints. This was followed by criticismsover the way he was elected. Other dislikes included hisstand on abortion and his cabinet appointments, as wellas assertions that he is not a good public speaker and thathe’s arrogant and cocky.
Fully 57% of those asked either gave no answeror said they could think of nothing they dislike about the president — far more than the 39% whodid not offer a positive impression. Even among Democrats a large proportion (38%) couldn’t comeup with a reason for disliking Bush.
Blacks Remain WaryOn balance, every major demographic group
approves of the way Bush is handling his job aspresident, with one exception — non-whites.Overall, non-whites are fairly evenly divided overBush’s job performance: 30% approve, 33%disapprove, 37% have no opinion. Blacks are themost critical: 22% approve, 40% disapprove and38% have no opinion. Hispanics approve of Bushby a margin of 46%-25%. Bush receives muchlower job approval ratings from blacks than his father did in February 1989. Fully 53% of blacksapproved of the job Bush Sr. was doing at that point in time. Bush Jr.’s support among blacks ismuch more comparable to Reagan’s in 1981.
There is a fairly substantial gender gap in approval of Bush, with men approving of the jobhe’s doing by a 59%-19% margin and women approving by a narrower 48%-23%. There are alsolarge religious gaps. While 72% of evangelical Protestants approve of the job Bush is doing, only57% of mainline Protestants agree. Seculars are evenly divided in their evaluations of Bush: 34%approve, 33% disapprove, and another 33% are undecided.

-4-
Bush vs. ClintonEarly Approval Ratings
-- Bush -- -- Clinton --Rep Dem Ind Dem Rep Ind% % % % % %
Approve 85 29 51 81 29 52Disapprove 3 41 20 7 51 24Don’t know 12 30 29 12 20 24
100 100 100 100 100 100
Personal Qualities: Bush vs. Clinton
Clinton BushJan 1993 Feb 2001
% %Warm and friendly 90 67Cold and aloof 7 21Neither/Don’t know 3 12
100 100
Well informed 79 62Not well informed 14 27Neither/Don’t know 7 11
100 100
Trustworthy 63 60Not trustworthy 29 28Neither/Don’t know 8 12
100 100
Among partisan groups, Bush’s ratingsmirror Clinton’s at a comparable point in time. InFebruary 1993, Clinton enjoyed strong supportfrom Democrats (81% approved) and moderatesupport from independents (52% approved).Among Republicans, 29% approved of the job hewas doing. Similarly, Bush enjoys strong supportfrom within his party (85%) and moderate supportfrom independents, while 29% of Democratsapprove of the job he is doing.
Personal Judgments, Partisan DivisionsEven though Bush’s personal traits are working to his advantage, his ratings on several
specific personal and leadership qualities lag behind Clinton’s early ratings. While most Americanssee Bush as warm and friendly rather than cold and aloof (67% vs. 21%), Clinton scored evenhigher on this dimension in January 1993 when fully nine-in-ten Americans said he was warm andfriendly. Today only 51% of Democrats describe Bush as warm and friendly, compared to 81% ofRepublicans who described Clinton that way in 1993.
By a margin of 62%-27%, Americans see Bushas well informed rather than poorly informed. ButClinton was viewed as well informed by nearly eight-in-ten Americans (79%) in 1993. Again, partisanpatterns are much different this year than they wereeight years ago. Today only 42% of Democratsdescribe Bush as well informed. This compares with64% of Republicans who judged Clinton favorably onthis quality at the outset of his presidency.
Bush’s ratings for trustworthiness are on a parwith Clinton’s early ratings. Six-in-ten Americans sayBush is trustworthy, while 28% see him asuntrustworthy. In January 1993, Clinton was seen astrustworthy by 63% of Americans, while 29% saw himas untrustworthy. Republicans were most skeptical ofClinton in this regard; only 36% saw him as trustworthy. This is comparable to the 38% ofDemocrats who now see Bush as trustworthy. Opinions about Bush’s trustworthiness have changedvery little since October 1999 when 59% of the public said the then-Texas governor was trustworthyand 33% said he was not.

-5-
Bush’s Ideology: Conservative or Moderate?
Conserv Mod Mod LiberalRep Rep Dem Dem
Bush best described as ... % % % %Liberal 2 12 8 3Middle of the road 35 51 46 16Conservative 58 33 39 75None/Don’t know 5 4 7 6
100 100 100 100
Two-thirds of Americans perceive Bush as being well organized, while only 22% say he isnot well organized. Bush scores considerably better on this measure than Clinton did in August1993, following some well-publicized early stumbles. Similarly, Bush is widely seen as able to getthings done — 60% choose this over not able to get things done. Democrats are divided on these twoissues. On balance, they see Bush as well organized but not necessarily able to get things done.
Demonstrating that opinions aboutBush have yet to solidify, no consensushas emerged about the president’s politicalideology. A narrow plurality of Americans(44%) see him as a conservative. However,nearly as many (39%) describe him asmiddle of the road. Only 7% think he’s aliberal. Conservative Republicans andliberal Democrats are among the mostlikely to say Bush is a conservative (58% and 75%, respectively). Moderate Republicans as wellas moderate Democrats are more likely to perceive him as middle of the road.
Surplus Views UnchangedBush’s ratings for his handling of the economy are comparable to his overall approval
ratings: 50% approve, 22% disapprove and 28% don’t have an opinion. Support for Bush’s taxproposal, however, is lukewarm at best, with the public favoring the plan by a nine-point margin(43%-34%).
In spite of Bush’s focus on taxes, the idea of tapping the budget surplus to underwrite a taxcut is only slightly more popular than it was a year ago. When asked what should be done with thebudget surplus, a plurality of the public (37%) continues to support shoring up Social Security andMedicare. Roughly one-quarter (23%) favors using the surplus to increase spending on domesticprograms such as health, education and the environment, 19% say the surplus should be spent ona tax cut and 17% choose debt reduction.

-6-
How Should the Surplus be Spent?
-- Feb 2000 -- -- Feb 2001 --Rep Dem Ind Rep Dem Ind
Surplus should used on ... % % % % % %Tax cut 21 6 10 33 8 16National debt 22 14 20 17 16 18Domestic spending 19 28 26 16 28 29Social Security/Medicare 36 50 42 30 45 34Don't know 2 2 2 4 3 3
100 100 100 100 100 100
But Bush has managed to expandGOP support for his plan. A narrowplurality of Republicans now say a taxcut would be the best use of the budgetsurplus, while a year ago Social Securityand Medicare were seen as the topsurplus priorities.
Support for Bush’s tax proposal isstrongest among men, those with annualhousehold incomes over $75,000, white evangelical Protestants, and married people. Support is alsorelatively strong among those who have been closely following news about Bush’s tax plan. Amongthis group 52% approve and 41% disapprove. While Republicans overwhelmingly support Bush’splan (76% approve), independents are evenly divided and Democrats strongly oppose the plan.Even among moderate to conservative Democrats, only 19% approve of Bush’s tax plan.
On balance, the public believes stimulating the economy to avoid a recession is a betterreason for a national tax cut than providing tax relief to average Americans. Even those who supportBush’s tax proposal opt narrowly for economic stimulus over tax relief. Republicans, Democrats andindependents all agree that keeping the economy out of a recession is a better reason for cuttingtaxes than providing tax relief to people like themselves.
Few Believe Cuts Will Be FairThe biggest hurdle Bush may face in gaining support for his tax proposal is the widespread
perception that if his tax bill becomes law, it will benefit some people much more than others.Nearly two-thirds of the public holds this view, while only 26% think the tax bill will be fair toeveryone.
Among those who think the tax cuts will not be fair, the consensus is clearly that they willbenefit the wealthy at the expense of the middle class and the poor. Nearly eight-in-ten of those whothink the tax cuts will benefit some more than others say the wealthy will be the primarybeneficiaries. Only 12% think the middle class will benefit more than others, and 4% think the poorwill benefit.

-7-
Stable Opinion on Tax Cuts
Sept Feb1999* 2001
Proposed Bush tax cuts will ... % %Be fair to all 12 26Benefit some more than others 82 65Other/Don’t know 6 9
100 100Who will benefit most?Wealthy 80 79Middle class 9 12Poor 6 4Other/Don’t know 5 5
100 100
* Sept. 1999 question referred to a recently proposed tax cutand did not reference Bush.
Blacks are among the most likely to think Bush’s current tax plan will be inequitable: 84%vs. 62% of whites. An overwhelming majority of Democrats (87%) believe the Bush plan wouldbenefit some more than others and nearly as manyindependents (71%) agree. ConservativeRepublicans, however, say that Bush’s proposed taxcuts would be fair.
Opinion about these issues has changed onlymodestly over the last year, in spite of Bush’semphasis on the issue and the growing sense that amajor tax cut is inevitable. In September 1999, aPew Research Center survey found the publichighly skeptical about the fairness of a proposedGOP tax cut. Roughly 80% thought a major tax cutwould benefit some more than others, and 80% ofthat group saw the wealthy as the most likelywinners.
Charitable Choice: Some Doubts The public is supportive, in principle, of Bush’s plan to enable religious groups to receive
government funding to provide some social services. Nearly two-thirds (64%) favor allowingreligious organizations to apply, along with other organizations, for government funding to provideservices such as job training or drug treatment, while only 30% oppose such an approach. The ideaattracted similar levels of support during the heat of the presidential campaign in August andSeptember.
However, when the faith-based model is specifically linked to the White House, supportwanes. Just 46% think it is a good idea that Bush created an office in the White House to enlargethe role that religious organizations play in providing social services, and 38% think it is a bad idea.Republicans and evangelical Christians offer the most consistent support for Bush's proposal — bothin theory and in practice. Democrats, independents and mainline Protestants are more conflicted.Each group supports the idea of a religious role in the delivery of social services, while raisingconcerns about White House involvement.

-8-
Split Over Charitable Choice
Favor Good ideaFaith-based to haveApproach W.H. office
% %Total 64 46
Republican 76 66Democrat 56 34Independent 62 41
Evangelical* 72 64Mainline 72 40Catholic 65 47
* Religious classifications based on whites only.
Partisan Split Over Press Bias
Percent "Fair"Total Rep Dem Ind
% % % %Bush 65 58 73 70Clinton (2/93) 72 81 67 73Bush Sr. (9/89) 82 77 86 86
Clinton since leaving office 56 71 42 58
For example, while 56% of Democrats say they likethe idea of religious groups having access to public moneyfor social services, nearly as many (50%) think Bush'sWhite House office is a bad idea. It is the more moderateand conservative Democrats who are most conflicted onthis issue; 64% support a religious role in social services,but only 37% believe Bush's White House office is a goodidea.
The divisions on this issue are most noteworthyacross religious groups. While evangelical Protestantsstrongly support both the faith-based approach and Bush'sWhite House office, mainline Protestants are much moredivided. While nearly three-quarters of mainlineProtestants favor allowing religious organizations to apply for federal money, only 40% approve ofBush's action to create a White House office.
There is a significant generational gap on this issue as well. Older Americans are lesssupportive than their younger counterparts of the idea of allowing religious groups to provide socialservices. They are also more skeptical about the existence of a White House office undertaking suchan effort. Only 55% of those age 65 and older favor the faith-based approach and fewer than four-in-ten support the creation of a White House office.
Partisans See More BiasThe public’s views of whether the press has been fair to Bush, and Clinton for that matter,
are colored by politics and partisanship. Not surprisingly, supporters of a president (or an ex-president) are more likely to regard the media as biased, but this factor has been growing in recentyears.
Today, just 58% of Republicans say newsorganizations are fair to Bush, and 30% believe they areunfair. At the start of Clinton's first term in office, 67% ofDemocrats thought the press was fair to the formerpresident, and 24% thought they were unfair. In 1989, fully77% of Republicans thought the press was being fair toBush Sr., and just 18% saw bias. Partisanship is evident incontemporary views of Clinton as well; just 42% ofDemocrats say press coverage of Clinton’s post-presidencyhas been fair compared to 71% of Republicans.

-9-
The public professes to be growing weary of Clinton and the continuing media interest inhis alleged transgressions. While more than half of Americans say there has been too much coverageof Clinton, just 9% believe there has been too little. Still, nearly six-in-ten say they followed thecontroversy over Clinton’s last-minute presidential pardons very (28%) or fairly (32%) closely.
A slim majority of Americans (52%) are satisfied with the amount of coverage of Bush’s firstweeks in office. But nearly three times as many say the media has been giving Bush’s policyproposals too little attention versus those who say coverage has been excessive (28%-10%). Blacksin particular are dissatisfied with the amount of press coverage of the Bush agenda. Fully 43% ofAfrican-American respondents say there has been too little coverage of Bush's policy proposals,compared to only 27% of white respondents.
On other issues, pluralities of Americans are satisfied with the amount of coverage of signsof a slowing economy (46%) and the rising cost of energy (42%). But more than one-third (36%)believe the media has been giving too little coverage to energy prices.
Missile Defense: Arguments MatterBush’s proposal to build a missile defense system to protect the nation against potential
attack remains popular among the public, though the manner in which the issue is framed makes adifference, particularly to conservative Republicans.
Overall, a solid majority (54%) favors development of a national missile defense system,with just 32% opposed. However, when arguments in favor of and against the missile shield arepresented, the public is more evenly divided. While a plurality of 49% still supports developing amissile defense system, four-in-ten oppose developing such a system.
Perhaps surprisingly, providing the supporting and opposing arguments (the goal ofprotecting the nation against the cost and diplomatic ramifications of proceeding) has a significantimpact on the strongest supporters of missile defense — conservative Republicans. While 81% ofconservative Republicans support missile defense in principle, support drops to 68% when pointsfor and against the plan are provided. By comparison, the attitudes of moderate Republicans andDemocrats are largely unchanged by the arguments.
Men and members of the Cold War generation (born before 1950) are among the mostsupportive of missile defense, regardless of how the issue is framed. Fully 61% of men favor missiledefense in the simple question format, compared to 48% of women. While 63% of Americans age50 and older favor a missile defense system, just half of those under 50 agree.

-10-
International Natural Disasters
News followed very closely ... %Hurricane Mitch (11/98) 36Earthquake in Turkey (9/99) 27Earthquake in Japan (2/95)25Cyclone in Bangladesh (5/91) 23Earthquake in Iran (7/90) 20Earthquake in India 15Floods in Mozambique (3/00) 10
Economy Tops News IndexReflecting Americans’ pocketbook concerns, stories about Bush’s tax plan and the economy
led this month’s news interest index. About three-in-ten Americans paid very close attention toBush’s tax proposal and news on the state of the economy. Nearly two-thirds of Americans paid atleast fairly close attention to these stories (69% economic news, 66% Bush’s tax proposal).
Clinton’s pardons attracted wide public attention, as did the collision between a U.S. Navysubmarine and a Japanese ship. Better than one-quarter of Americans followed news of the collisionvery closely, while 66% followed the story at least fairly closely.
About 60% of the public also followed the California energy crisis closely, with a quarterof Americans paying very close attention. Not surprisingly, people living in the West paid moreattention to this story than did those in other regions by more than a two-to-one margin (43% vs.20%).
The earthquake in India was followed very closelyby 15% of the public. This level is considerably less thanthe attention paid to other international natural disasterssuch as Hurricane Mitch in 1998 (36%) and theearthquake in Turkey in 1999 (27%). Another foreign newsstory, Ariel Sharon's election victory in Israel, ranked atthe bottom of this month's news interest index. Just one-in-ten followed this story very closely and one-quarter of thepublic followed it at least fairly closely.

-11-
PERCENT FOLLOWING EACH NEWS STORY "VERY CLOSELY"
Bush's Reports Navy California Bush's Sharon'sTax cut About U.S. Clinton Submarine Energy Education Earthquake Election
Plan Economy Pardons+ Collision Crisis+ Plan+ In India Victory+ (N)% % % % % % % %
Total 31 30 28 26 25 21 15 9 (1513)
SexMale 33 33 30 25 23 18 15 11 (721)Female 30 27 26 26 27 24 16 7 (792)
RaceWhite 31 29 29 28 26 19 14 8 (1116)Non-white 33 32 27 19 19 28 18 13 (374)Black 39 30 19 22 26 40 21 9 (278)
AgeUnder 30 22 16 20 16 11 14 10 4 (285)30-49 24 26 20 18 26 16 11 6 (618)50+ 42 39 40 38 32 25 22 13 (579)
EducationCollege Grad. 39 43 30 32 34 27 16 16 (476)Some College 32 28 36 32 24 20 11 7 (347)High School Grad. 27 24 24 20 23 18 18 7 (521)<H.S. Grad. 27 24 21 17 17 19 16 6 (168)
RegionEast 37 30 25 24 29 23 20 11 (260)Midwest 28 30 28 25 16 21 15 9 (343)South 33 31 31 25 18 25 15 8 (653)West 26 27 24 28 43 12 12 8 (257)
Party IDRepublican 36 33 42 28 25 23 12 9 (456)Democrat 34 34 24 26 27 24 16 11 (562)Independent 25 25 21 25 25 17 18 6 (373)
Internet UserYes 32 32 27 24 26 22 11 8 (905)No 30 26 29 27 23 19 22 10 (608)
* The designation, Hispanic, is unrelated to the white-black categorization.+ These items are based on split sample; the 'N' does not apply.
Question: Now I will read a list of some stories covered by news organizations this past month. As I read eachitem, tell me if you happened to follow this news story very closely, fairly closely, not too closely, ornot at all closely?

-12-
GEORGE W. BUSH JOB APPROVAL
Approve Disapprove Don't Know (N)% % %
Total 53 21 26=100 (1513)
SexMale 59 19 22 (721)Female 48 23 29 (792)
RaceWhite 59 18 23 (1116)Non-white 30 33 37 (374)Black 22 40 38 (278)Hispanic* 46 25 29 (111)
Race and SexWhite Men 65 16 19 (552)White Women 54 20 26 (564)
AgeUnder 30 52 26 22 (285)30-49 57 17 26 (618)50-64 52 22 26 (335)65+ 49 23 28 (244)
Sex and AgeMen under 50 62 17 21 (460)Women under 50 47 23 30 (443)Men 50+ 56 20 24 (257)Women 50+ 47 23 30 (321)
EducationCollege Grad. 55 24 21 (476)Some College 54 18 28 (347)High School Grad. 55 17 28 (521)<H.S. Grad. 46 28 26 (168)
Family Income$75,000+ 63 22 15 (290)$50,000-$74,999 55 19 26 (204)$30,000-$49,999 57 15 28 (355)$20,000-$29,999 51 24 25 (191)<$20,000 47 24 29 (288)
* The designation Hispanic is unrelated to the white-black categorization.
Question: Do you approve or disapprove of the way George W. Bush is handling his job as president?
Continued ...

-13-
Approve Disapprove Don't Know (N)% % %
Total 53 21 26=100 (1513)
RegionEast 53 24 23 (260)Midwest 53 20 27 (343)South 59 19 22 (653)West 44 23 33 (257)
Religious AffiliationTotal White Protestant 65 14 21 (603)White Protestant Evangelical 72 11 17 (307)White Prot. Non-Evangelical 57 18 25 (296)White Catholic 60 14 26 (257)Secular 34 33 33 (111)
Community SizeLarge City 42 26 32 (372)Suburb 54 25 21 (329)Small City/Town 55 19 26 (529)Rural Area 62 15 23 (267)
Party IDRepublican 85 3 12 (456)Democrat 29 41 30 (562)Independent 52 20 28 (373)
Party and IdeologyConservative Republican 89 2 9 (252)Moderate/Liberal Republican 80 5 15 (194)Conserv./Moderate Democrat 34 37 29 (378)Liberal Democrat 16 53 31 (160)
2000 Presidential VoteBush 90 1 9 (494)Gore 22 45 33 (493)
Marital StatusMarried 61 17 22 (767)Unmarried 46 25 29 (736)
Parental StatusParent 58 15 27 (501)Non-Parent 51 24 25 (1008)
Labor UnionUnion Household 47 28 25 (212)Non-Union Household 54 20 26 (1286)

-14-
WHAT SHOULD BE DONE WITH THE BUDGET SURPLUS?
--------- February 2000 --------- --------- February 2001 ---------Social Social Change
Tax National Domestic Security/ Tax National Domestic Security/ InCut Debt Programs Medicare Cut Debt Programs Medicare Tax Cut% % % % % % % %
Total 12 18 24 44 19 17 23 37 +7
SexMale 14 23 19 42 25 21 18 33 +11Female 10 13 28 47 14 13 29 41 +4
RaceWhite 13 19 22 44 20 18 21 38 +7Non-white 6 9 38 44 12 10 37 37 +6Black 4 7 37 49 14 11 28 41 +10
Race and SexWhite Men 16 25 17 40 26 23 16 33 +10White Women 11 14 26 48 15 13 26 43 +4
AgeUnder 30 12 16 43 30 21 14 36 28 +930-49 15 16 24 43 21 16 29 32 +650-64 11 21 16 49 20 13 16 46 +965+ 6 20 8 62 8 27 9 52 +2
Sex and AgeMen under 50 17 21 25 36 27 19 23 28 +10Women under 50 11 11 36 41 15 11 38 34 +4Men 50+ 10 27 8 52 20 26 8 41 +10Women 50+ 8 15 16 57 11 13 16 56 +3
EducationCollege Grad. 18 28 22 31 22 27 26 22 +4Some College 9 16 31 41 19 16 29 31 +10High School Grad. 11 15 23 50 17 14 19 46 +6<H.S. Grad. 10 10 20 58 19 7 21 50 +9
Family Income$75,000+ 19 29 14 38 25 26 25 21 +6$50,000-$74,999 14 23 20 42 19 12 32 37 +5$30,000-$49,999 11 19 26 42 24 16 24 34 +13$20,000-$29,999 13 12 30 42 15 15 20 42 +2<$20,000 6 10 30 53 11 12 22 54 +5
Question: As you may know, the federal government now has a budget SURPLUS. In your opinion, which ONEof the following should be done with the available money? Should the money be used for a tax cut,to pay off the national debt more quickly, for increased spending on domestic programs such as health,education and the environment -OR- to help make the Social Security AND medicare programsfinancially sound?
Continued ...

-15-
--------- February 2000 --------- --------- February 2001 ---------Social Social Change
Tax National Domestic Security/ Tax National Domestic Security/ InCut Debt Programs Medicare Cut Debt Programs Medicare Tax Cut% % % % % % % %
Total 12 18 24 44 19 17 23 37 +7
RegionEast 11 16 29 43 19 17 28 34 +8Midwest 11 18 22 46 21 21 21 31 +10South 12 17 20 49 19 10 23 44 +7West 14 19 28 37 16 21 23 36 +2
Religious AffiliationTotal White Protestant 14 19 18 47 21 18 18 39 +7White Protestant Evangelical 15 18 16 49 23 14 14 43 +8White Prot. Non-Evangelical 12 20 20 45 18 23 24 34 +6White Catholic 11 19 21 48 25 16 24 32 +14
Community SizeLarge City 14 13 27 45 15 14 30 36 +1Suburb 12 18 28 40 19 21 31 29 +7Small City/Town 12 18 24 44 19 15 21 41 +7Rural Area 10 22 18 48 23 16 15 42 +13
Party IDRepublican 21 22 18 36 33 17 16 30 +12Democrat 6 14 28 50 8 16 28 45 +2Independent 11 20 26 42 16 18 29 34 +5
Party and IdeologyConservative Republican -- -- -- -- 40 16 15 26 --Moderate/Liberal Republican -- -- -- -- 25 20 18 31 --Conserv./Moderate Democrat -- -- -- -- 9 15 28 44 --Liberal Democrat -- -- -- -- 4 21 33 42 --
Bush ApprovalApprove -- -- -- -- 28 15 20 34 --Disapprove -- -- -- -- 8 20 31 40 --
1996/2000 Presidential VoteDole/Bush 24 29 10 36 35 14 14 31 +11Clinton/Gore 6 18 26 48 6 22 26 45 0
Marital StatusMarried 14 20 19 45 22 18 22 36 +8Unmarried 9 15 30 44 15 15 25 39 +6
Parental StatusParent 14 16 29 39 22 14 30 33 +8Non-Parent 11 18 21 47 18 18 20 40 +7
Labor UnionUnion Household 10 16 25 46 13 18 28 40 +3Non-Union Household 12 18 24 44 20 17 23 36 +8

-16-
CHARITABLE CHOICE(Based on Registered Voters)
--- September 2000 --- --- February 2001 --- Change inFavor Oppose DK Favor Oppose DK Favor
% % % % % %Total 67 29 4=100 63 32 5=100 -4
SexMale 60 37 3 59 35 6 -1Female 74 22 4 66 30 4 -8
RaceWhite 64 32 4 64 32 4 0Non-white 84 14 2 56 36 8 -28Black 87 11 2 59 35 6 -28
Race and SexWhite Men 56 41 3 60 35 5 +4White Women 71 25 4 68 29 3 -3
AgeUnder 30 71 27 2 70 25 5 -130-49 75 23 2 64 32 4 -1150-64 64 32 4 63 34 2 -165+ 53 39 8 53 36 11 0
Sex and AgeMen under 50 66 32 2 62 33 5 -4Women under 50 80 18 2 70 27 3 -10Men 50+ 51 44 5 53 39 8 +2Women 50+ 65 28 7 65 31 4 0
EducationCollege Grad. 63 35 2 60 38 2 -3Some College 63 35 2 64 31 4 -1H.S. Grad & Below 72 23 5 63 30 7 -9
Family Income$75,000+ 58 39 3 53 45 2 -5$50,000-$74,999 68 31 1 68 28 4 0$30,000-$49,999 68 29 3 60 37 3 -8<$30,000 76 20 4 72 23 5 -4
Question: Would you say that you strongly favor, favor, oppose, or strongly oppose allowing religiousorganizations to apply, along with other organizations, for government funding to provide socialservices such as job training or drug treatment counseling to people who need them?
Continued ...

-17-
--- September 2000 --- --- February 2001 --- Change inFavor Oppose DK Favor Oppose DK Favor
% % % % % %Total 67 29 4=100 63 32 5=100 -4
RegionEast 71 26 3 61 34 5 -10Midwest 69 27 4 66 29 5 -3South 67 29 4 68 26 6 -1West 64 33 3 52 45 3 -12
Religious AffiliationTotal White Protestant 64 32 4 72 25 3 +8White Protestant Evangelical 66 29 5 72 24 4 +6White Prot. Non-Evangelical 62 35 3 70 27 3 +8White Catholic 71 27 2 64 33 3 -7
Community SizeLarge City 77 21 2 59 40 1 -18Suburb 62 33 5 60 33 7 -2Small City/Town 67 30 3 62 34 4 -5Rural Area 66 29 5 73 22 5 7
Party IDRepublican 63 33 4 75 22 3 +12Democrat 74 23 3 54 40 6 -20Independent 64 33 3 63 33 4 -1
Party and IdeologyConservative Republican 60 36 4 75 22 3 +15Moderate/Liberal Republican 69 28 3 79 18 3 +10Conserv./Moderate Democrat 77 20 3 61 32 7 -16Liberal Democrat 66 30 4 39 58 3 -27
Bush ApprovalApprove -- -- -- 72 25 3 --Disapprove -- -- -- 46 49 5 --
1996/2000 Presidential VoteDole/Bush 57 39 4 71 26 3 +14Clinton/Gore 70 26 4 47 47 6 -23
Marital StatusMarried 65 32 3 66 31 3 +1Unmarried 70 25 5 59 33 8 -11
Parental StatusParent 76 22 2 69 30 1 -7Non-Parent 63 32 5 59 34 7 -4
Labor UnionUnion Household 73 22 5 55 45 * -18Non-Union Household 66 30 4 64 30 6 -2
-18-copyright © 2001 Tides Center
ABOUT THIS SURVEY
Results for the survey are based on telephone interviews conducted under the direction ofPrinceton Survey Research Associates among a nationwide sample of 1,513 adults, 18 years of ageor older, during the period February 14-19, 2001. For results based on the total sample, one can saywith 95% confidence that the error attributable to sampling and other random effects is plus orminus 3 percentage points. For results based on either Form 1 (N=728) or Form 2 (N=785), thesampling error is plus or minus 4.5 percentage points.
In addition to sampling error, one should bear in mind that question wording and practicaldifficulties in conducting surveys can introduce error or bias into the findings of opinion polls.
SURVEY METHODOLOGY IN DETAIL
The sample for this survey was designed to generalize to the U.S. adult population intelephone households, and to allow separate analyses of responses by African-Americans andyounger respondents. To achieve these objectives in a cost effective manner, the design usesstandard list-assisted random digit dialing (RDD) methodology, but telephone numbers are drawndisproportionately from telephone exchanges with higher than average density of African-Americanhouseholds. Weighting adjustments are made in the analysis to ensure the overall representativenessof the sample.
Using RDD methods, every active block of telephone numbers (area code + exchange + two-digit block number) that contains one or more residential directory listings is proportionally likelyto be selected; after selection two more digits are added randomly to complete the number. Thismethod guarantees coverage of every assigned phone number regardless of whether that number isdirectory listed, purposely unlisted, or too new to be listed. After selection, the numbers arecompared against business directories and matching numbers are purged.
The sample was released for interviewing in replicates. Using replicates to control therelease of sample to the field ensures that the complete call procedures are followed for the entiresample. The use of replicates also insures that the regional distribution of numbers called isappropriate. Again, this works to increase the representativeness of the sample.
At least 10 attempts were made to complete an interview at every sampled telephone number.The calls were staggered over times of day and days of the week to maximize the chances of makinga contact with a potential respondent. All interview breakoffs and refusals were re-contacted at leastonce in order to attempt to convert them to completed interviews. In each contacted household,interviewers asked to speak with the "youngest male 18 or older who is at home." If there is noeligible man at home, interviewers asked to speak with "the oldest woman 18 or older who is athome." This systematic respondent selection technique has been shown empirically to producesamples that closely mirror the population in terms of age and gender.
-19-
Non-response in telephone interview surveys produces some known biases in survey-derivedestimates because participation tends to vary for different subgroups of the population, and thesesubgroups are likely to vary also on questions of substantive interest. In order to compensate forthese known biases, the sample data are weighted in analysis.
The demographic weighting parameters are derived from a special analysis of the mostrecently available Census Bureau's Current Population Survey (March 2000). This analysisproduced population parameters for the demographic characteristics of households with adults 18or older, which are then compared with the sample characteristics to construct sample weights. Theanalysis only included households in the continental United States that contain a telephone.
The weights are derived using an iterative technique that simultaneously balances thedistributions of all weighting parameters.

-20-
PEW RESEARCH CENTER FOR THE PEOPLE AND THE PRESSFEBRUARY 2001 NEWS INTEREST INDEX
FINAL TOPLINEFebruary 14-19, 2001
N = 1,513
Q.1 Do you approve or disapprove of the way George W. Bush is handling his job as president? [IF DK ENTERAS DK. IF DEPENDS PROBE ONCE WITH: Overall do you approve or disapprove of the way George W.Bush is handling his job as President? IF STILL DEPENDS ENTER AS DK.
--------- Gallup ----------Clinton Bush Reagan Carter
Feb 1993 Feb 1989 Feb 1981 Feb 197753 Approve 56 63 55 7121 Disapprove 25 13 18 926 Don't know/Refused 19 24 27 20100 100 100 100 100
ASK FORM 1 ONLY [N=728]:Q.2F1 Based on what you've seen or heard so far, what, if anything, would you say you have LIKED most about
George W. Bush? [IF MORE THAN ONE MENTION, RECORD ALL IN ORDER OF MENTION]
22 Personal Traits (NET) 8 Honesty/Integrity/Trustworthy 4 His character/Good man/Wants to do the right thing/Moral 3 A Christian/Man of faith 3 Way he presents himself/Relaxed/Calm/Dignified 5 Other personal traits
14 Policy Positions and Proposals (NET) 7 Tax proposals/Economy 3 Support of the military 2 Stand on abortion/Cutting funds for abortion clinics 2 Education policy 3 Other policy position/proposal
13 Political Traits (NET)Trying to keep campaign promises/Following his campaign agenda/Doing what he said
3 he would 3 Leadership style/Takes charge/No nonsense/Sticks to his guns/Consistent 2 Republican/Conservative 2 Bipartisan/Reaches out/Conciliatory 2 Getting things done/Taken quick action 2 Other political trait
2 He's OK/Good President/Good job 2 Don't like him 2 Appointments 2 Too early to tell/Hasn't been President long enough to judge 2 Everything 8 Other20 Nothing17 Don't know/Refused

-21-
ASK FORM 2 ONLY [N=785]:Q.3F2 Based on what you've seen or heard so far, what, if anything, would you say you have DISliked most about
George W. Bush? [IF MORE THAN ONE MENTION, RECORD ALL IN ORDER OF MENTION]
16 Policy Positions and Proposals (NET) 6 Tax proposals/Economy 4 Stand on abortion/Will take away a woman's right to chose 2 Education policy 6 Other policy position/proposal
11 Personal Traits (NET) 2 Not articulate/Poor public speaker 2 Attitude/Arrogant/Self-righteous/Cocky 1 Deceitful/Don't trust him/Not trustful 1 Stupid/Lack of knowledge 1 His looks/Appearance/Dress 1 Past sins/(cocaine use/DUI)
4 Political Traits (NET) 1 Republican/Not a Democrat 1 Inexperienced 3 Other political traits
4 The way he got the job/Stole the election 3 Too early to tell/Hasn't been President long enough to judge 2 Appointments 2 Everything 1 His not taking action against Clinton (furniture, pardons, pranks) 1 Handling current issues (Iraq, Mexico, Submarine) 1 Like him/The job he's doing 1 Just don't like him 4 Other39 Nothing15 Don't know/Refused
-22-
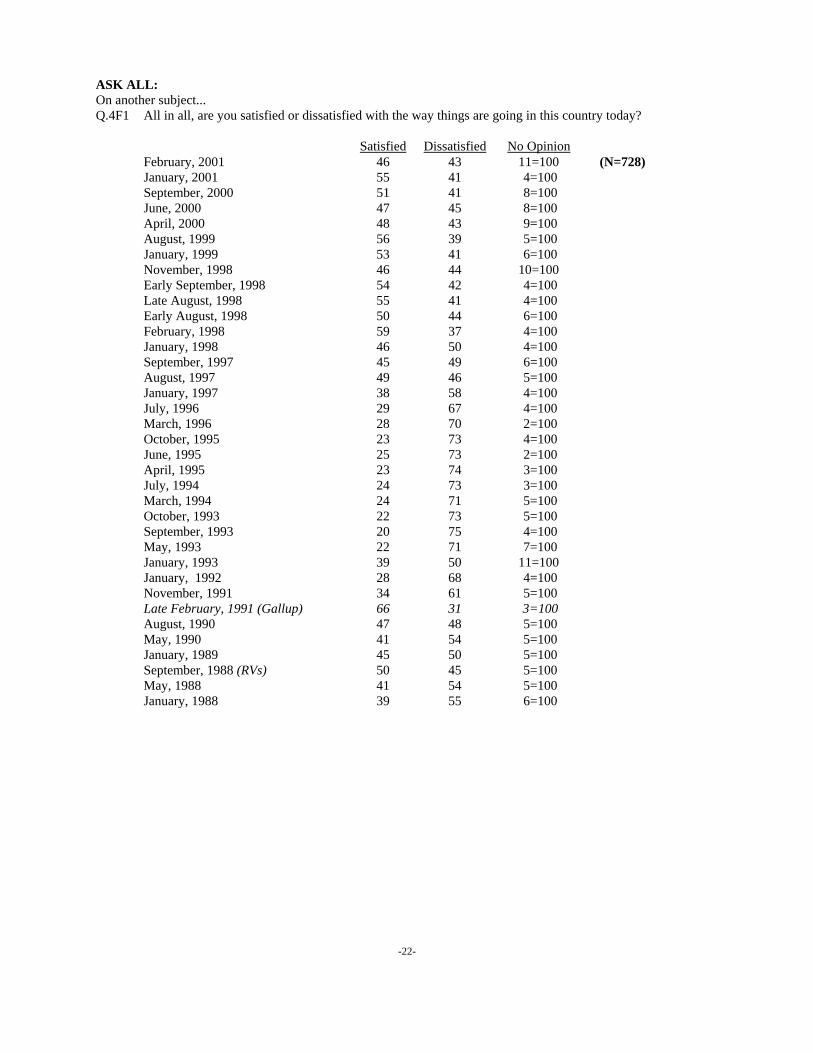
ASK ALL:On another subject...Q.4F1 All in all, are you satisfied or dissatisfied with the way things are going in this country today?
Satisfied Dissatisfied No OpinionFebruary, 2001 46 43 11=100 (N=728)January, 2001 55 41 4=100September, 2000 51 41 8=100June, 2000 47 45 8=100April, 2000 48 43 9=100August, 1999 56 39 5=100January, 1999 53 41 6=100November, 1998 46 44 10=100Early September, 1998 54 42 4=100Late August, 1998 55 41 4=100Early August, 1998 50 44 6=100February, 1998 59 37 4=100January, 1998 46 50 4=100September, 1997 45 49 6=100August, 1997 49 46 5=100January, 1997 38 58 4=100July, 1996 29 67 4=100March, 1996 28 70 2=100October, 1995 23 73 4=100June, 1995 25 73 2=100April, 1995 23 74 3=100July, 1994 24 73 3=100March, 1994 24 71 5=100October, 1993 22 73 5=100September, 1993 20 75 4=100May, 1993 22 71 7=100January, 1993 39 50 11=100January, 1992 28 68 4=100November, 1991 34 61 5=100Late February, 1991 (Gallup) 66 31 3=100August, 1990 47 48 5=100May, 1990 41 54 5=100January, 1989 45 50 5=100September, 1988 (RVs) 50 45 5=100May, 1988 41 54 5=100January, 1988 39 55 6=100

-23-
Q.5F1 What do you think is the most important problem facing the country today? [RECORD VERBATIMRESPONSE. PROBE FOR CLARITY – DO NOT PROBE FOR ADDITIONAL MENTIONS. IF MORETHAN ONE MENTION, RECORD ALL IN ORDER OF MENTION]
Aug June May Nov July June Mar Dec June Jan May Feb April1999 1999 1998 1997 1996 1995 1994 1993 1993 1992 1990 1989 1987
12 Morality/Ethics/Family values 13 11 10 9 13 12 10 6 7 3 5 2 311 Education 8 7 9 5 6 6 5 5 5 2 4 4 0 8 Crime/Gangs/Justice system 12 11 13 12 19 22 31 25 7 3 7 8 3 7 Economy (general) 2 3 4 4 4 5 4 6 17 43 5 4 7 6 Unemployment/Lack of jobs 3 4 6 6 7 10 12 15 19 22 7 9 13 6 Drugs/Alcohol 6 5 7 7 8 5 10 8 5 4 37 23 6 Health care/Cost/ 6 availability of health care 6 3 4 5 4 7 14 14 11 3 3 1 * Energy crisis/rising gas/heating 4 prices -- -- -- -- -- -- -- -- -- -- -- -- -- 4 Dissatisfaction with govt/politics 3 3 5 4 8 6 5 2 5 2 2 1 0 3 Other social issues 4 4 3 -- 2 0 * 3 * * * * * 3 Poverty 4 3 3 3 3 4 2 3 3 1 3 4 6 3 Taxes 3 2 4 3 3 3 3 2 4 1 3 2 0 Inflation/Difference 3 between wages/costs 1 * 2 1 2 3 2 2 2 2 3 2 3 2 Other International issues 2 4 3 -- * 4 1 2 3 4 6 10 22 Youth/Teenage kids 2 not acting responsible 2 3 -- -- -- -- -- -- -- -- -- -- -- 2 Racism 2 1 1 1 2 2 3 1 2 1 2 0 0 2 Homelessness 2 4 2 3 2 4 3 5 5 6 8 10 * 2 Immigration 1 -- -- -- -- -- -- -- -- -- -- -- -- 2 Recession/slowing of the economy -- -- -- --- -- -- -- -- -- -- -- -- -- 2 Issues related to elderly 1 3 3 1 2 * 1 1 2 1 2 2 0 1 Other defense issues -- -- 1 * -- -- -- -- -- -- -- -- --
Deficit/National debt/Balanced 1 budget 3 1 6 5 7 9 5 6 13 4 11 19 12 1 Social Security 4 -- -- -- -- -- -- -- -- -- -- -- -- 1 Welfare abuse 2 1 3 1 7 5 2 * * * * * * 1 Scandal/Corruption in govt 3 2 5 -- -- -- -- -- -- -- -- -- -- 1 Teen violence in school 6 7 -- -- -- -- -- -- -- -- -- -- -- Too much foreign aid/ 1 Spend money at home 2 4 2 1 5 2 2 1 2 1 3 1 0 1 Other economic issues -- -- -- --- -- -- -- -- -- -- -- -- -- 1 Environment/Pollution * * 2 1 1 1 2 1 * 1 8 2 0 1 Too many guns/Gun control 4 6 -- -- -- -- -- -- -- -- -- -- -- 1 Medicare 3 -- -- -- -- -- -- -- -- -- -- -- -- 1 Uneven distribution of wealth -- -- -- --- -- -- -- -- -- -- -- -- -- 1 Other health care mentions -- -- -- --- -- -- -- -- -- -- -- -- -- 1 Other domestic issues 4 1 1 -- 2 5 1 3 2 10 11 10 21

-24-
Q.5F2 CONTINUED ...Aug June May Nov July June Mar Dec June Jan May Feb April1999 1999 1998 1997 1996 1995 1994 1993 1993 1992 1990 1989 1987
* Terrorism * * * * -- -- -- -- -- -- -- -- -- * AIDS -- * -- -- 1 1 2 * * * * * * * HMO Reform 1 -- -- -- -- -- -- -- -- -- -- -- -- 5 Other 1 6 5 6 2 2 2 * 4 1 5 9 1 2 None * 1 * 1 * -- -- -- -- -- -- -- -- 7 Don't know/No answer 11 11 12 7 6 3 4 6 2 3 1 3 326 ECONOMIC (NET) 15 8 16 18 18 28 26 33 53 76 26 28 3510 HEALTHCARE (NET) -- -- -- -- -- -- -- -- -- -- -- -- -- DEFENSE/INTER- 5 NATIONAL (NET) 7 11 5 10 1 9 2 * * * * * * 5 POVERTY/HOMELESS (NET) 6 6 6 6 5 8 6 * * * * * *
Q.6 Now I will read a list of some stories covered by news organizations this past month. As I read each item, tellme if you happened to follow this news story very closely, fairly closely, not too closely, or not at all closely?[INSERT ITEM; ROTATE]
Very Fairly Not too Not at allFORM 1 [N=728]; FORM 2 [N=785]: Closely Closely Closely Closely DK/Refa.F1 George W. Bush's education plan 21 35 23 19 2=100
b. George W. Bush's tax-cut plan 31 35 19 14 1=100
c.F2 The controversy over the pardons Bill Clinton granted as he left office 28 32 20 19 1=100
d. Reports about the condition of the U.S. economy 30 39 18 12 1=100January, 2001 32 38 17 11 2=100June, 1995 26 41 22 11 *=100March, 1995 27 45 19 9 *=100February, 1995 23 41 22 13 1=100December, 1994 28 43 20 9 *=100October, 1994 27 40 20 12 1=100June, 1994 25 42 23 10 *=100May, 1994 33 40 16 10 1=100January, 1994 34 39 16 10 1=100Early January, 1994 36 44 13 7 *=100December, 1993 35 41 15 8 1=100October, 1993 33 38 20 9 *=100September, 1993 37 40 14 8 1=100Early September, 1993 39 39 14 9 *=100August, 1993 41 36 14 9 *=100May, 1993 37 38 18 6 1=100February, 1993 49 36 10 5 *=100January, 1993 42 39 12 7 *=100September, 1992 43 37 13 6 *=100May, 1992 39 39 15 6 1=100March, 1992 47 38 11 4 *=100February, 1992 47 37 10 6 *=100January, 1992 44 40 11 5 *=100October, 1991 36 38 16 9 1=100

-25-
Q.6 CONTINUED ... Very Fairly Not too Not at allFORM 1 [N=728]; FORM 2 [N=785]: Closely Closely Closely Closely DK/Refe.F1 The earthquake in India 15 33 31 20 1=100
f.F1 The California energy crisis 25 36 20 18 1=100
g.F2 Ariel Sharon's election victory in Israel 9 16 29 44 2=100
h.F2 The collision of a U.S. Navy submarinewith a Japanese ship 26 40 19 14 1=100
ASK FORM 1 ONLY [N=728]:Q.7F1 In your opinion, are the news organizations you are familiar with being fair or unfair to [INSERT ITEM;
ROTATE]?Fair Unfair DK/Ref
a. The Bush administration 65 19 16=100Clinton: Feb 1993 72 17 11=100Bush: Aug 1989 82 12 6=100Reagan: June 1985 78 12 10=100
b. Bill Clinton since leaving office 56 30 14=100
ASK FORM 2 ONLY [N=785]:Q.8F2 So far, do you think news organizations are giving too much coverage, too little coverage, or the right amount
of coverage to [INSERT ITEM; ROTATE]? How about…[NEXT ITEM]
Too much Too Little Right amountcoverage coverage of coverage DK/Ref
a. Bill Clinton's activities as hewas leaving office 53 9 31 7=100
b. George W. Bush's policy proposalssince he took office 10 28 52 10=100
c. Signs of an economic slowdown 21 25 46 8=100
d. Rising energy costs 17 36 42 5=100

-26-
ASK ALL:Q.9 As I read some pairs of opposite phrases, tell me which one best reflects your impression of George W. Bush
so far. (First,) does George W. Bush impress you as... [INSERT ITEM; ROTATE]
GW Bush ClintonOct 1999 Jan 1993
a. 60 Trustworthy or 59 6328 NOT trustworthy 33 29 4 Neither particularly (VOL) 2 3 8 Don't know/Refused 6 5100 100 100
b. 67 Warm and friendly or 9021 Cold and aloof 7 6 Neither particularly (VOL) 1 6 Don't know/Refused 2100 100
c. 60 Able to get things done or18 NOT able to get things done 7 Neither particularly (VOL)15 Don't know/Refused100
d. 62 Well informed or 7927 NOT well informed 14 4 Neither particularly (VOL) 2 7 Don't know/Refused 5100 100
e. 66 Well organized or22 NOT well organized 3 Neither particularly (VOL) 9 Don't know/Refused100
f. 7 Liberal,39 Middle of the road or44 Conservative 2 Neither particularly (VOL) 8 Don't know/Refused100

2 In September 1995, question wording did not include "international."
3 Beginning in October 1999, "cable news networks such as CNN and MSNBC" was substituted for "CNN," which was usedpreviously.
4 Beginning in February 2001, "Internet" has been substituted for "computer online sources," which was used previously.
-27-
Q.10 How have you been getting most of your news about national and international issues? From television, fromnewspapers, from radio, from magazines, or from the Internet? [ACCEPT TWO ANSWERS: IF ONLY ONERESPONSE IS GIVEN, PROBE FOR ADDITIONAL RESPONSE]
IF RESPONDENT ANSWERED '1' TELEVISION AS EITHER FIRST OR SECOND RESPONSE IN Q.10 ASK:Q.11 Do you get most of your news about national and international issues from network TV news, from local TV
news, or from cable news networks such as CNN and MSNBC? [ACCEPT TWO ANSWERS BUT DO NOTPROBE]
Oct Jan Jan Sept Jan Sept Jan1999 1999 1996 19952 1994 1993 1993
76 Television 80 82 88 82 83 83 8320 Network TV news 22 -- -- -- -- -- 3925 Local TV news 31 -- -- -- -- -- 3035 Cable news3 35 -- -- -- -- -- 38 1 Other 2 -- -- -- -- -- 2 1 Don't know * -- -- -- -- -- 1
40 Newspapers 48 42 61 63 51 60 5216 Radio 19 18 25 20 15 17 17 4 Magazines 5 4 8 10 10 9 510 Internet4 11 6 -- -- -- -- -- 2 Other (VOL) 2 2 2 1 5 3 1 1 Don't know/Refused * * * 1 1 * 1
On another subject…Q.12 Do you approve or disapprove of the way George W. Bush is handling the economy?
CBS News/NewGallup York TimesClinton Bush Sr.
Feb 1993 April 198950 Approve 45 4522 Disapprove 35 3528 Don't know/Refused 20 20100 100 100

5 In Mid-January 1999, Early August, June and January 1998, the question was worded: "If it turns out that the federalgovernment has a budget SURPLUS this year, in your opinion, which ONE of the following should be done with theavailable money? Should the money be used ..."
-28-
ASK FORM 1 RESPONDENTS ONLY [N=728]:Q.13 As you may know, the federal government now has a budget SURPLUS. In your opinion, which ONE of the
following should be done with the available money? Should the money be used [READ AND ROTATEOPTIONS]... For a tax cut; to pay off the national debt more quickly; for increased spending on domesticprograms such as health, education, and the environment; or to help make the Social Security and Medicareprograms financially sound?
SocialNational Domestic Security/ (VOL)
Tax Cut Debt Programs Medicare DK/RefFebruary, 2001 19 17 23 37 4=100September, 2000 (RVs) 14 21 25 38 2=100February, 2000 12 18 24 44 2=100Mid-January, 19995 14 12 21 50 3=100Early August, 1998 10 19 29 39 3=100June, 1998 9 17 28 44 2=100January, 1998 11 22 33 32 2=100
ASK FORM 2 RESPONDENTS ONLY [N=785]:Now thinking specifically about the debate over taxes, Q.14 Do you approve or disapprove of George W. Bush's tax proposal?
43 Approve34 Disapprove23 Don't know/Refused100
ASK ALL:Q.15 People have differing views on WHY we should cut taxes. In your view, what's the better reason for a national
tax cut? To provide tax relief for people like yourself or to stimulate the economy to prevent a recession?
32 To provide tax relief for people like yourself49 To stimulate the economy to prevent a recession10 Both (VOL) 5 Neither/No good reason for tax cuts (VOL) 4 Don't know/Refused100
6 In September 1999 the question was asked "As you may know, there has been discussion in Washington recently about amajor tax cut that would take place over the next 10 years. If this bill becomes law, do you think the tax cuts will generallybe fair to everyone, OR will the tax cuts mainly benefit some people much more than others?"
7 In September 2000 this question was part of a series, and the figures are based on registered voters.
-29-
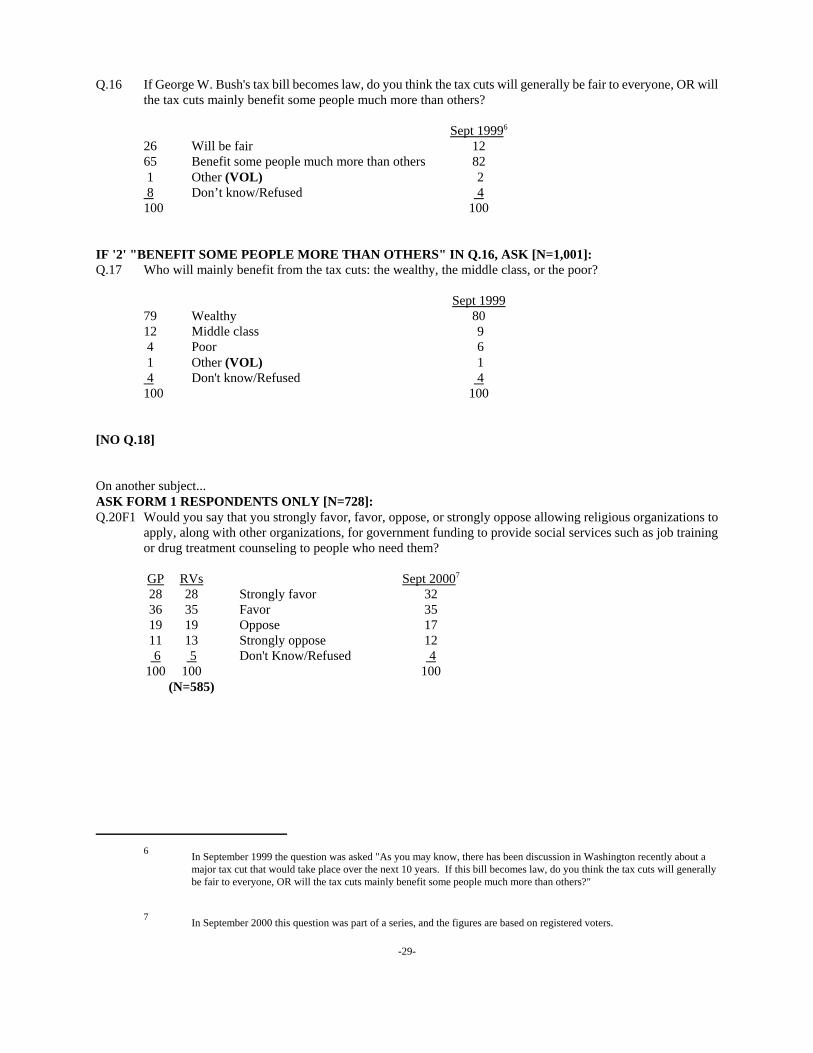
Q.16 If George W. Bush's tax bill becomes law, do you think the tax cuts will generally be fair to everyone, OR willthe tax cuts mainly benefit some people much more than others?
Sept 19996
26 Will be fair 1265 Benefit some people much more than others 82 1 Other (VOL) 2 8 Don’t know/Refused 4100 100
IF '2' "BENEFIT SOME PEOPLE MORE THAN OTHERS" IN Q.16, ASK [N=1,001]:Q.17 Who will mainly benefit from the tax cuts: the wealthy, the middle class, or the poor?
Sept 199979 Wealthy 8012 Middle class 9 4 Poor 6 1 Other (VOL) 1 4 Don't know/Refused 4100 100
[NO Q.18]
On another subject...ASK FORM 1 RESPONDENTS ONLY [N=728]:Q.20F1 Would you say that you strongly favor, favor, oppose, or strongly oppose allowing religious organizations to
apply, along with other organizations, for government funding to provide social services such as job trainingor drug treatment counseling to people who need them?
GP RVs Sept 20007
28 28 Strongly favor 3236 35 Favor 3519 19 Oppose 1711 13 Strongly oppose 12 6 5 Don't Know/Refused 4
100 100 100(N=585)

-30-
ASK FORM 2 RESPONDENTS ONLY [N=785]:Q.21F2 Did you happen to hear about the creation of an office in the White House to enlarge the role that religious
organizations play in providing social services, or haven't you heard about this?
40 Yes59 No 1 Don't know/Refused100
ASK FORM 2 RESPONDENTS ONLY [N=785]:Q.22F2 Do you think it's a good idea or a bad idea to have an office such as this in the White House?
46 Good idea38 Bad idea16 Don't know/Refused100
ASK ALL:On a different subject...Q.23 How much, if anything, have you heard about the recent debate over whether the U.S. should develop a national
missile defense system to protect against missile attacks — a lot, a little or nothing at all?
May 200020 A lot 1047 A little 4331 Nothing at all 47 2 Don't know/Refused *100 100
ASK FORM 1 ONLY [N=728]:Q.24F1 Do you favor or oppose the development of a national missile defense system?
54 Favor32 Oppose14 Don't know/Refused100

8 Early October 2000 figures are based on registered voters.
9 In May 1987, December 1986, and August 1985, question was worded: "Some people feel the U.S. should try to develop aspace-based "Star Wars" system to protect the U.S. from nuclear attack. Others oppose such an effort because they say itwould be too costly and further escalate the arms race. Which position comes closer to your view?"
10 In March 2000, "or anywhere else" was added to the question wording.
-31-
ASK FORM 2 ONLY [N=785]:Q.25F2 Some people feel the U.S. should try to develop a ground- and space-based missile defense system to protect
the U.S. from missile attack. Others oppose such an effort because they say it would be too costly and mightinterfere with existing arms treaties with the Russians. Which position comes closer to your view?
-- Gallup --Early Oct May May Dec Aug
20008 2000 19879 1986 1985Should develop a ground- and space-
49 based missile defense system 47 52 44 52 4540 Oppose developing such a system 35 37 42 40 4711 Don’t know/Refused 18 11 14 8 8100 100 100 100 100 100
Finally, I'd like to ask you a few questions for statistical purposes only...Q.42 Do you use a computer at your workplace, at school, at home or anywhere else on at least an occasional basis?
Yes No Don't KnowFebruary, 2001 72 28 0=100January, 2001 71 29 *=100July, 2000 68 31 1=100June, 2000 68 31 1=100April, 2000 68 32 *=100March, 200010 72 28 0=100February, 2000 67 33 *=100January, 2000 68 32 *=100December, 1999 67 33 *=100October, 1999 67 33 *=100Late September, 1999 68 32 *=100September, 1999 70 30 *=100August, 1999 67 33 *=100July, 1999 68 32 *=100June, 1999 64 35 1=100May, 1999 66 33 1=100April, 1999 71 29 *=100March, 1999 68 32 *=100February, 1999 68 32 *=100January, 1999 69 31 *=100Early December, 1998 64 36 *=100Early September, 1998 64 36 *=100Late August, 1998 66 34 0=100Early August, 1998 66 34 *=100April, 1998 61 39 *=100January, 1998 65 35 *=100November, 1997 66 34 *=100June, 1997 60 40 0=100

11 The 1995 figure combines responses from two separate questions:(1) Do you or anyone in your household ever use a modem to connect to any computer bulletin boards, informationservices such as CompuServe or Prodigy, or other computers at other locations? (IF YES, PROBE: Is that you, someoneelse or both?)(2) Do you, yourself, ever use a computer at (work) (school) (work or school) to connect with computer bulletin boards,information services such as America Online or Prodigy, or other computers over the Internet?
-32-
Q.42 CONTINUED ...Yes No Don't Know
Early September, 1996 56 44 *=100July, 1996 56 44 *=100April, 1996 58 42 *=100March, 1996 61 39 *=100February, 1996 60 40 0=100January, 1996 59 41 0=100
IF “1, YES” (USE A COMPUTER) IN Q.42, ASK:Q.43 Do you ever go online to access the Internet or World Wide Web or to send and receive email?
BASED ON TOTAL RESPONDENTS:Goes Online Doesn't Go Online DK/Ref
February, 2001 60 40 *=100January, 2001 61 39 0=100July, 2000 55 45 *=100June, 2000 56 44 *=100April, 2000 54 46 *=100March, 2000 61 39 0=100February, 2000 52 48 0=100January, 2000 52 48 *=100December, 1999 53 47 0=100October, 1999 50 50 0=100Late September, 1999 52 48 *=100September, 1999 53 47 0=100August, 1999 52 48 0=100July, 1999 49 51 0=100June, 1999 50 50 *=100May, 1999 48 52 0=100April, 1999 51 49 *=100March, 1999 49 51 *=100February, 1999 49 51 *=100January, 1999 47 53 *=100Early December, 1998 42 58 0=100November, 1998 37 63 *=100Early September, 1998 42 58 *=100Late August, 1998 43 57 *=100Early August, 1998 41 59 *=100April, 1998 36 64 0=100January, 1998 37 63 0=100November, 1997 36 63 1=100July, 1996 23 77 0=100April, 1996 21 79 *=100March, 1996 22 78 0=100February, 1996 21 79 *=100January, 1996 21 79 0=100June, 199511 14 86 *=100