top | development planning methodology, 2015
TRANSCRIPT


The Quadrant Territorial Optimization Process
TOP ©
Frameworks
Levels
Parameters
Indicators
Variables

| Ensure Economic [Progress] & Sustainability
Prevent Displacement Risks
Achieve HUMAN NEEDS
assess existing
settlement
geophysical analyses
policy reviews
+HDI reviews
1) Impoverishment risks
prevention probabiliy
2) Wellbeing surveys
3) Human achievements
4) Poverty/deprivations
5) Land potentiality
6) Proximity/Accessibility
7) Promotion of Culture
8) Recognition of Rights
TERRITORIAL
OPTIMIZATION
Prevent Risks (!)
assure future
resettlement
socio-cultural analyses

TOP-Methodology concept…
is to ensure “usability” of
- Sustainable Development -
to assure sustainability of
developments (!)
ASSESSING/ENSURING
SUSTAINABILITY

THE FOUR GENERAL STAGES
Step1- Community System
Analyses
Step2- Conceptual Framework
(re)focusing
Step3- Location Optimization &
Planning
Step4- Support Policy Database
Programming
Work Outputs
Meta-table, Quantitative
calculations (indices, etc)
Integrated Criteria Model
Framework (redirection)
Integrated Database and
Scheme (geologarithm)
Policy Development
Database (Reforms)
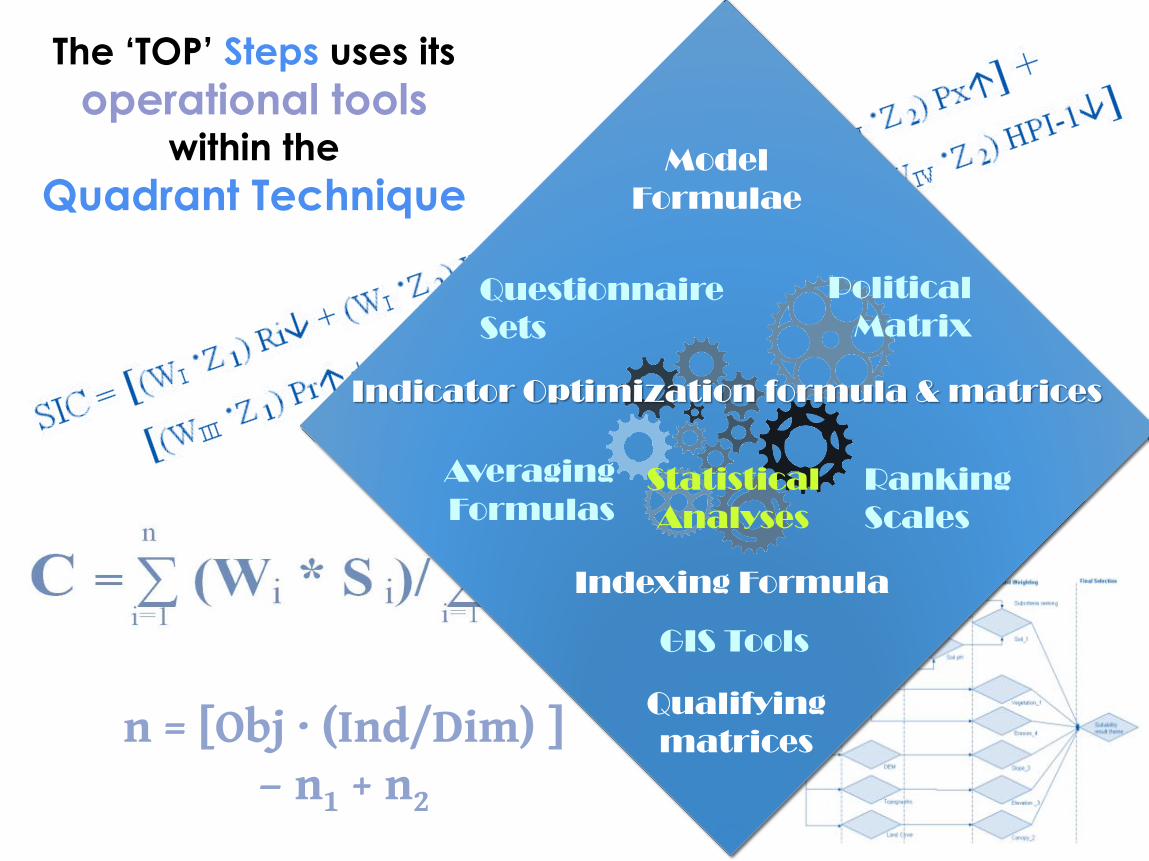
n = [Obj · (Ind/Dim) ] – n1 + n2
The ‘TOP’ Steps uses its
operational tools within the
Quadrant Technique Model
Formulae
Questionnaire
Sets
Ranking
Scales
Averaging
Formulas
Indexing Formula
GIS Tools
Qualifying
matrices
Indicator Optimization formula & matrices
Political
Matrix
Statistical
Analyses

Overall Sustainability
Quantification
TOTAL SD-RATING
= 24.75 %

The Quadrant of
Sustainability Statement
I Regional/
National Level
II
Co
mm
un
ity L
eve
l
IV
Co
mm
un
al L
eve
l
III
Household Level
1 Impoverishment Risks (Ri)
2 Wellbeing & Safety (Wb)
5 Land potentialities (Lp)
6 Proximities (Px)
3 Achievements (HDI)
4 Deprivations (HPI-1)
7 Promotion of Culture (Pr)
8 Recognition of Rights (Re)
Geophysical Analyses: - Land potential (LSSA)
- Proximity & Accessibility
Institutional Reviews - Mission-vision-highlights
- Direction of Responses
Indices Reviews: - Human development
- Human poverty
Community Analyses: - Definition of terms
- Socio-economic risks
& Wellbeing
[Human Aspect]
[Nature Aspect]
[ Existing Indices ]
[Institutional Aspects]
Refocus definition by
investigation area

THE FOUR GENERAL STAGES
Step1- Community System
Analyses
Step2- Conceptual Framework
(re)focusing
Step3- Location Optimization &
Planning
Step4- Support Policy Database
Programming
Work Outputs
Meta-table, Quantitative
calculations (indices, etc)
Integrated Criteria Model
Framework (redefinition)
Integrated Database and
Scheme (geologarithm)
Policy Development
Database (Reforms)

TOP-Methodology concept…
is to ensure “stability” of
sustainable Development-
to assure sustainability of
developments (!)
ASSESSING/ENSURING
SUSTAINABILITY

SAMPLE
CASE 2008
Cultural Displacement
Southern Chile
Rural Community
Indigenous People
Mapuche-Hueliche
Rainy/Winter time
10-day fieldworks
Spanish

SOCIO/CULTURAL COMMUNITY ANALYSIS

Definition of terms
Step 1: Community System Analyses - Phase I
Socio-culturally and geographically focused
interviewees
Two Primary Indirect/Direct Questions
(Q1) <for present state>
(Q2) <for future state>
1 Local folk - individual 2nd question 1st question
2 Local folk - member of an organization(s)
2nd question 1st question
3 Community leaders - NGO Ideally 1st question 2nd question (optional)
4 Community Officials – Government (GO)
Ideally 1st question 2nd question (optional)
5 Community Coordinator, program/project Director(s),
1st question 2nd question 5a - from Municipality
5b - from Provincial
5c - from Region
6 Program/project CO, if any. <Questions can be asked in any order>
7 Project/program
developers <Questions can be asked in any order>
8 Any non-IP respondent/s <Questions can be asked in any order>
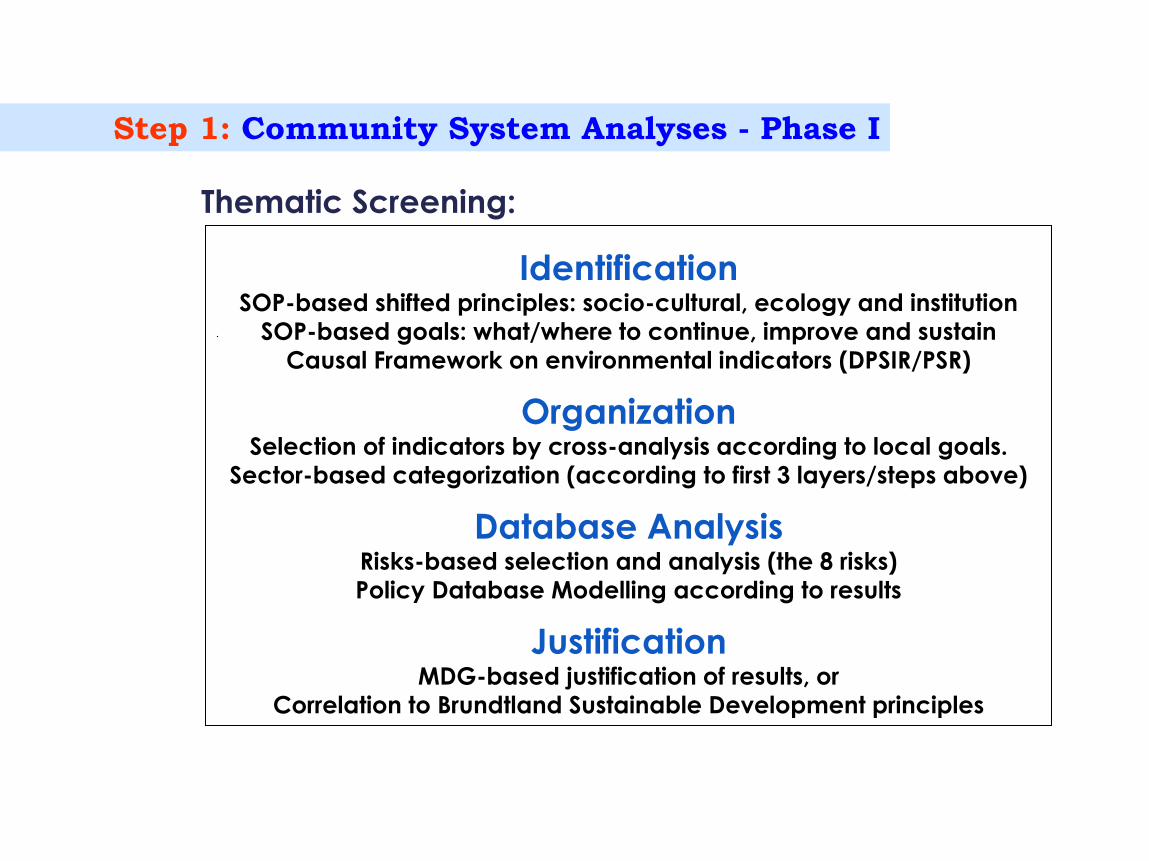
Identification SOP-based shifted principles: socio-cultural, ecology and institution
SOP-based goals: what/where to continue, improve and sustain
Causal Framework on environmental indicators (DPSIR/PSR)
Organization Selection of indicators by cross-analysis according to local goals.
Sector-based categorization (according to first 3 layers/steps above)
Database Analysis Risks-based selection and analysis (the 8 risks)
Policy Database Modelling according to results
Justification MDG-based justification of results, or
Correlation to Brundtland Sustainable Development principles
Step 1: Community System Analyses - Phase I
Thematic Screening:

Indicator
Types
What/
Where to
Sustainability Triad/ Dimensions
Socio-cultural Ecological Institutional
D P S I R D P S I R D P S I R
Continue x
Improve x
Sustain x x
Table-checker for identifying and classifying indicators
Taxo (classification) formula:
n = N – n1 + n2 or
Indicators Optimization – Task 1
Step 1: Community System Analyses - Phase I
n = [Obj · (Ind/Dim) ] – n1 + n2
A-Layer:

The Eight
Impoverishment Risks
to be Prevented
Naming:
Human
Basic Needs
and
demands
SD1
Ranking
SD2
Ranking
What to…?
continue improve sustain
1 Mortality
Living
Survival
Needs
<Socio-cultural,
economy>
<Social,
Economy>
Survival
(DP)
2 Morbidity
3 Joblessness
4 Food Insecurity
5 Homelessness Living
Protection
Needs
<Ecological,
economy>
<Ecology,
Social,
Economy>
Protection
(SI) 6 Landlessness
7 No Access to
common property Inclusion
and
Participatn
Needs
<Institutional,
economy>
<Social,
Ecology,
Economy>
Inclusio
n (R) 8
Social
Disarticulation
Indicators Optimization – Task 2
Step 1: Community System Analyses - Phase I

Socio-Cultural
RESULT:
Step 1: Community System Analyses - Phase I
INDICATORS

Ranking
Value 1 Description
Rating
Value 2 Description
1.0 - 1.5 Significantly Very low Below 12.375
Poorly sustainable 1.6 - 2.4 Low
12.375 - 37.125 2.5 Relatively Low (for goal)
Relatively High (for goal)
2.6 - 3.4 Relatively Fair to Fair 49.50 - 61.875 Fairly sustainable
3.5 - 4.4 Relatively High to High 74.25 - 86.625 Highly sustainable
4.6 - 5.0 Significantly Very High 99 Almost sustainable
Ranking and Rating System
H0

HDI Reviews and Equations
GOAL POSTS Maximum
value
Minimum
value
Life expectancy at birth (years) 85 25
Adult literacy rate (ALR) in %* 100 0
Combined gross enrolment ratio
(GER) in % 100 0
GDP per capita (PPP US$) 40,000 100
Actual value – Minimum
Index = ------------------------------------
Maximum – Minimum
HDI = 1/3 (life expectancy index) + 1/3 (education index)
+ 1/3 (GDP index)
HPI-1 = [1/3 (P1α + P2α + P3α +)]

CONCEPTUAL FRAMEWORK | GUIDE

Step 3: Sustainability Conceptual Framework
Institutional Reviews: (Re)focusing triad
Solving-problem: “how-to-assess”

LE
SE
Institutional Reviews: (Re)focusing triad
Institutional
Socio-
Cultural
Ecological
Economic Progress
Triad of TOP

GEOPHYSICAL ANALYSIS

Land Potentiality (LSSA)
Step 3: Location Optimization and Planning

Result
Ave. 2.2

Criteria Suggested
Radius Objectives
Study Area
Proximities
Operational
Ranking
(5-point
Ranking)
River and
creeks/streams < 300 Water source
Relatively within
300m 3
Political point or rural
center < 1000
Articulation/
Information
Relatively within
1000m 3
Reserves/Parks
Management Area < 1000
Management
Participation More or less 10 kms 1
Built up area and
social facilities < 1500
Services
Access Within 1500m 3
Road Network
including culverts,
caution signs and
bridges
> <1500
Mobility and
transport
access
Within 1500m 3
Average ranking for proximity, accessibility and connectivity
development space suitability 2.6
Step 3: Location Optimization and Planning
Proximity (PA) / Accessibility

Sample Sites
Ranking of Sites
by Accessibility/
Connectivity
(Built
Environment)
Ranking of Sites by
Agro-Ecological
Importance
(Socio-Economic-
Ecological)
Ranking of Sites by
Ethno-institutional
Importance
(Cultural &
Institutional)
main
settlement Moderate (3) Poor (2) High (4)
Other Sectors Poor (2) Moderate (3) Poor (2)
2.7 2.5 2.5 3
Step 3: Location Optimization and Planning
FINAL SITING | Multi-Criteria Decision Making (MCDM)

LAND POTENTIALITY
Average ranking for productivity and living survival
space suitability 2.2
Average rating for human settlement location suitability
2.3
MEAN 2.25 GENERAL PROXIMITY/ACCESSIBILITY
Average ranking for proximity, accessibility to
services and connectivity suitability 2.6
Final Siting Rank 2.7
MEAN 2.65
Step 3: Location Optimization and Planning
SPATIAL ANALYSES SUMMARY

POLICY DEVELOPMENT |RECOMMENDATIONS

Step 4: Development and Management Database
Metatable of all Resulting indicators classified by dimension and
by objectives

Step 4: Support Policy Development and Programming
TOP Aims
SOP Database B (Basic Needs &
Security Demands)
POLICY
GOALS/SUBGOALS KEY
INDICATORS
POLICY INSTRUMENT
(Suggestion)
SOP Database A
(Development Sectors)
CONTINUE
IMPROVE
SUSTAIN e.g. SUSTAIN QUALITY ENVIRONMENT Environment &
Natural Resources
e.g. IMPROVE INCOME & LIVELIHOOD STATUS Income & Livelihood
e.g. CONTINUE BEST PRACTICES Cultural Heritage &
Tourism
Future Development Recommendations

Policy Development
Recommendations
Complete database

SOME
RECOMMENDATIONS

What to do
CONTINUE IMPROVE SUSTAIN

Integrated Resources Management Information System
Integrative Solution after the TOP Analyses Results

CONCLUSION TO SUSTAINABLE DEVELOPMENT FRAMEWORK
…LOCAL DEFINITION of SD really matter!!!
Institutional
Socio-
Cultural
Ecological
Economic Progress
GOVT
Refocus* the triad per region
Institution is indespensable
TOP Method is highly
recommended.
SD is an integrated concept … (Summit 2015)

“The pattern and organization of life embraces the whole
(organism-function-environment)
relation; none of the factors involved cannot be defined or understood
without reference to the others.”
Radhakamal Mukerjee on Philosophy and Phenomenological Research
1966