top-down trends in food analysis: towards nanotechnologies · top-down trends in food analysis:...
TRANSCRIPT

TopTop--downdown trendstrends in food in food analysisanalysis: : towardstowardsnanotechnologiesnanotechnologies
Rosangela Marchelli
Department of Organic and Industrial ChemistryFaculty of AgricultureUniversity of Parma

EU EU WhiteWhite PaperPaper on Food on Food SafetySafety 20002000
•• ““……therethere hashas beenbeen anan enormousenormousdevelopmentdevelopment, in the , in the pastpast decadesdecades, , bothboth in in the the methodsmethods of food production and of food production and processing and the processing and the controlscontrols requiredrequired totoensureensure thatthat acceptableacceptable safetysafety standardsstandards are are beingbeing metmet””

Methods ofanalysis
Food safetyand quality
Regulations

www.nugo.org

Top-down and bottom-up approaches“Top-down” – building something by starting with a larger
piece and carving away material (like a sculpture)
“Bottom-up” – building something by putting together smaller pieces (like building a car engine).
AFM tip, used to manipulate, image and measure atomic scale
features.
DNA “origami”
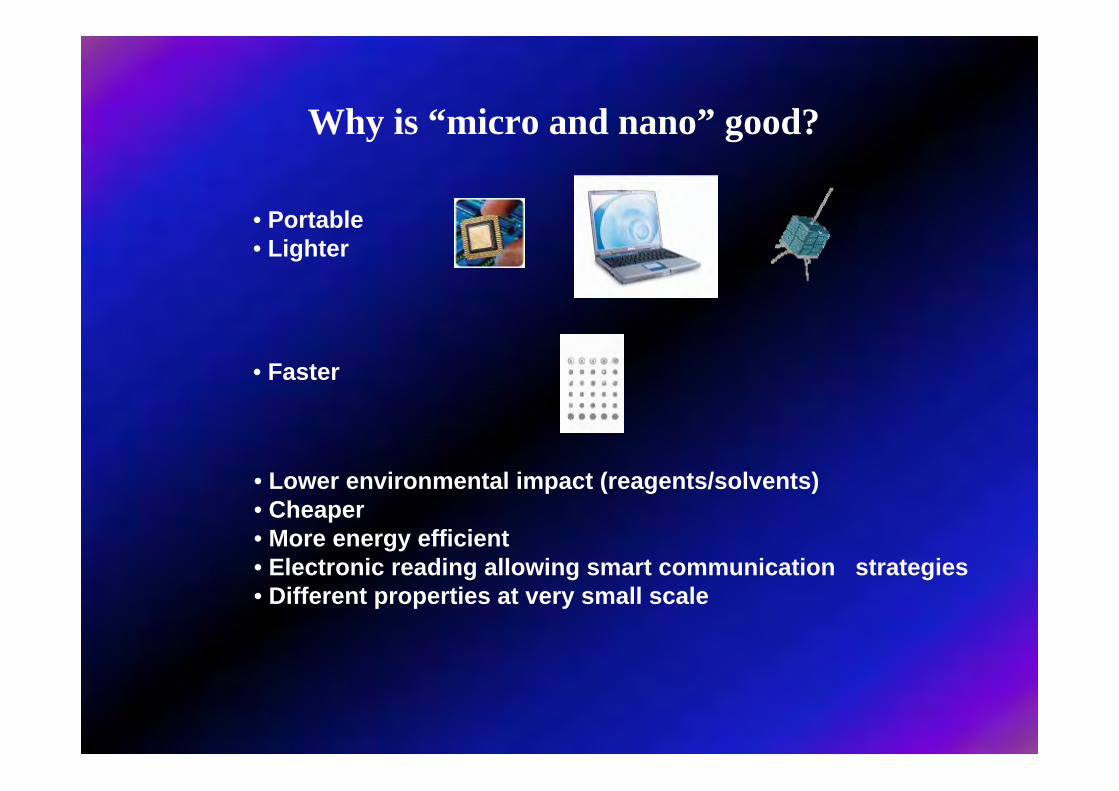
Why is “micro and nano” good?
• Portable• Lighter
• Faster
• Lower environmental impact (reagents/solvents)• Cheaper• More energy efficient• Electronic reading allowing smart communication strategies• Different properties at very small scale

•• MethodsMethods ofofmolecularmolecular biologybiology
•• NanotechnologiesNanotechnologies•• ChromatographyChromatography
•• SpectroscopySpectroscopy
GMOsGMOsFood Food allergensallergens
Food Food AuthenticityAuthenticity
DNADNA
New methods based on genomicsNew methods based on genomics
Food Food MicrobiologyMicrobiology

NH
N
OB
O
n
O OP
O
B
O
O n
** *
*
DNA PNA
Light UpLight UpProbesProbes
SPR SPR
MicroarraysMicroarrays
HPLCHPLCCECE
PNA PNA probesprobes forfor food DNA detectionfood DNA detection
BeaconsBeacons
ColorimetricColorimetricteststests
High High techtech LowLow techtech
CDCD

The microarray The microarray technologytechnology approachapproach
MULTIPLEX PCR ANALYSIS
PNA PROBE LIBRARYDEDICATED TO FOOD
Deposition
Hybridization
MICROARRAY

3. Hybridization with the target DNA3. Hybridization with the target DNA
MICROARRAYSMICROARRAYS1. Probe design and synthesis1. Probe design and synthesis2. Probe deposition2. Probe deposition
PNA array

GMOs: development of a PCR multiplex
Germini A., Zanetti A., Salati C., Rossi S., Forre C., Schmid S., Fogher C., Marchelli, R. Journal of Agricultural and Food Chemistry, 2004, 52, 3275-3280

Specificity Specificity hybridisationhybridisation testtest
Germini A., Rossi S., Zanetti A., Corradini R., Fogher C., Marchelli R. Journal of Agricultural and Food Chemistry, 2005, 53, 3958-3962.
1.8 mm
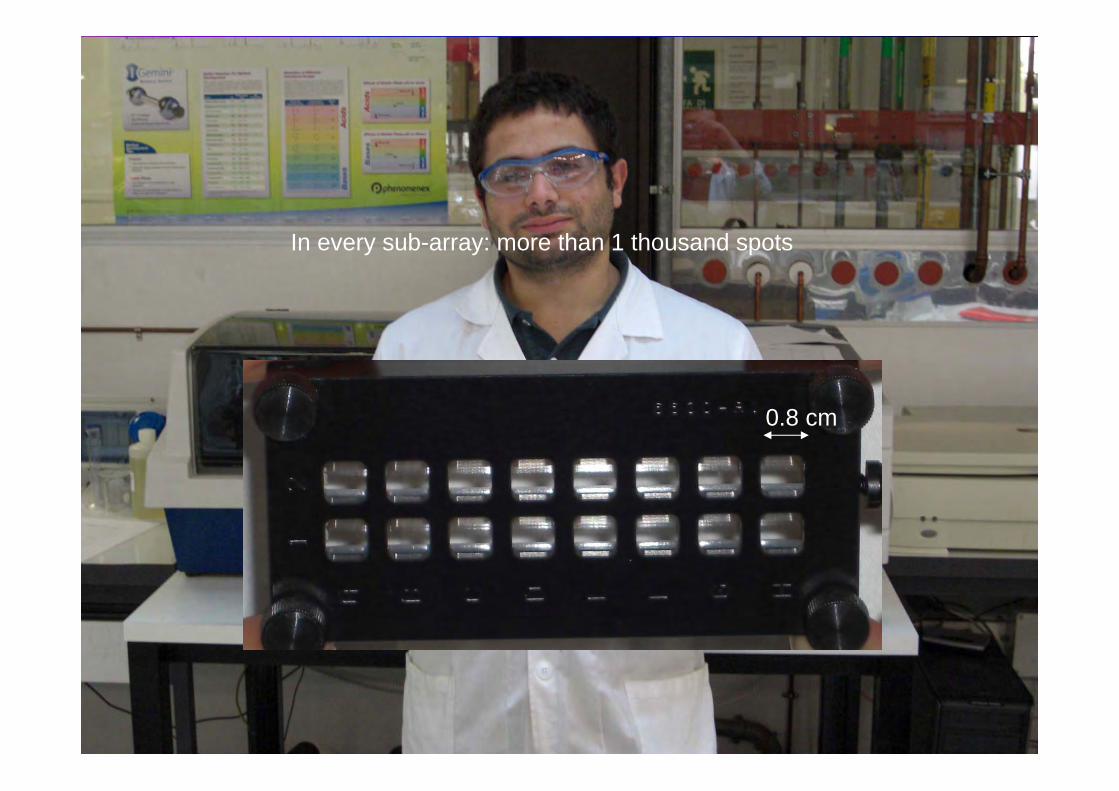
0.8 cm
In every sub-array: more than 1 thousand spots
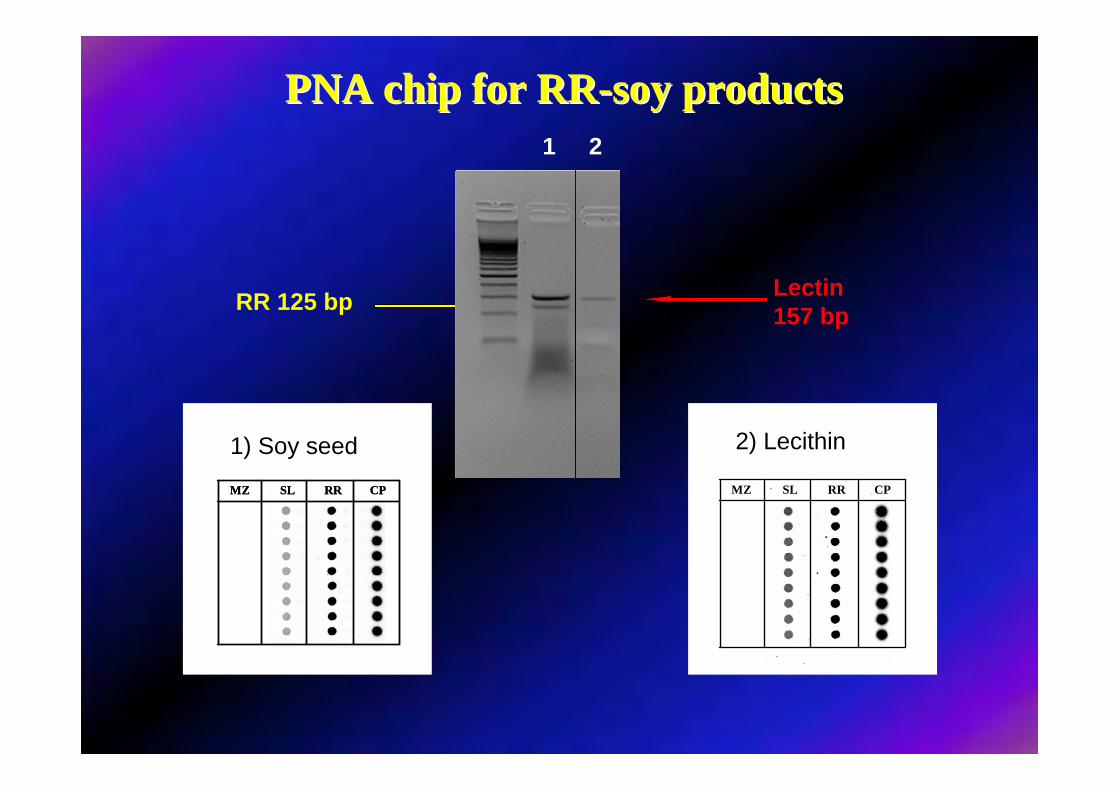
MZ SL RR CPMZ SL RR CP
1) Soy seedMZ SL RR CP
2) Lecithin
1 2
RR 125 bp Lectin157 bp
PNA chip PNA chip forfor RRRR--soysoy productsproducts

Detection of allergens in commercial products:hazelnut (Cor a1) and peanut (Ara h2)
PCR analyses performed on several foodstuff claiming to contain or to not contain hazelnut as ingredient or possible contaminants.
Chocolate cream with hazelnut11
Chocolate for topping10
Milk chocolate9
Biscuit topped with cocoa cream and milk chocolate8
Hazelnut wafer7
Cocoa and vanilla wafer6
Snack with cereals and cocoa5
Müesli snack with cocoa4
Müesli snack with milk chocolate3
Breakfast cereals with chocolate and hazelnut2
Breakfast cereals1
ProductSample
Hazelnut Cor a 1 (156bp) and PeanutAra h 2 (201bp) amplicons.
Limit of detection : 50pg DNA.
50 B 1 2 3 4 5 6 7 8 9 11bp50 B 1 2 3 4 5 6 7 8 9 1150 B 1 2 3 4 5 6 7 8 9 11bp

PNA PNA -- microarraymicroarray detection of hazelnut and detection of hazelnut and peanut DNA in commercial productspeanut DNA in commercial products
CPAPH
Sample 1. Breakfast cereals Sample 1. Breakfast cereals Sample 3. Muesli snackSample 3. Muesli snack
Rossi S., Scaravelli E., Germini A., Corradini R., Fogher C., Marchelli R. European Food Research Technology, 2006, 223, 1-6
CPAPH
50 B 1 2 3 4 5 6 7 8 9 11bp50 B 1 2 3 4 5 6 7 8 9 1150 B 1 2 3 4 5 6 7 8 9 11bp

PNA Cor PNA Ara PNA Pru Control
PNA PNA probesprobesspecificityspecificity
Detection Detection limitlimit50fmol50fmol
• Cor a 1 Hazelnut
• Ara h 2 Peanut
• Pru du 2.1Almond
Detection of hazelnut oil (5%) in extra-virgin olive oil
R
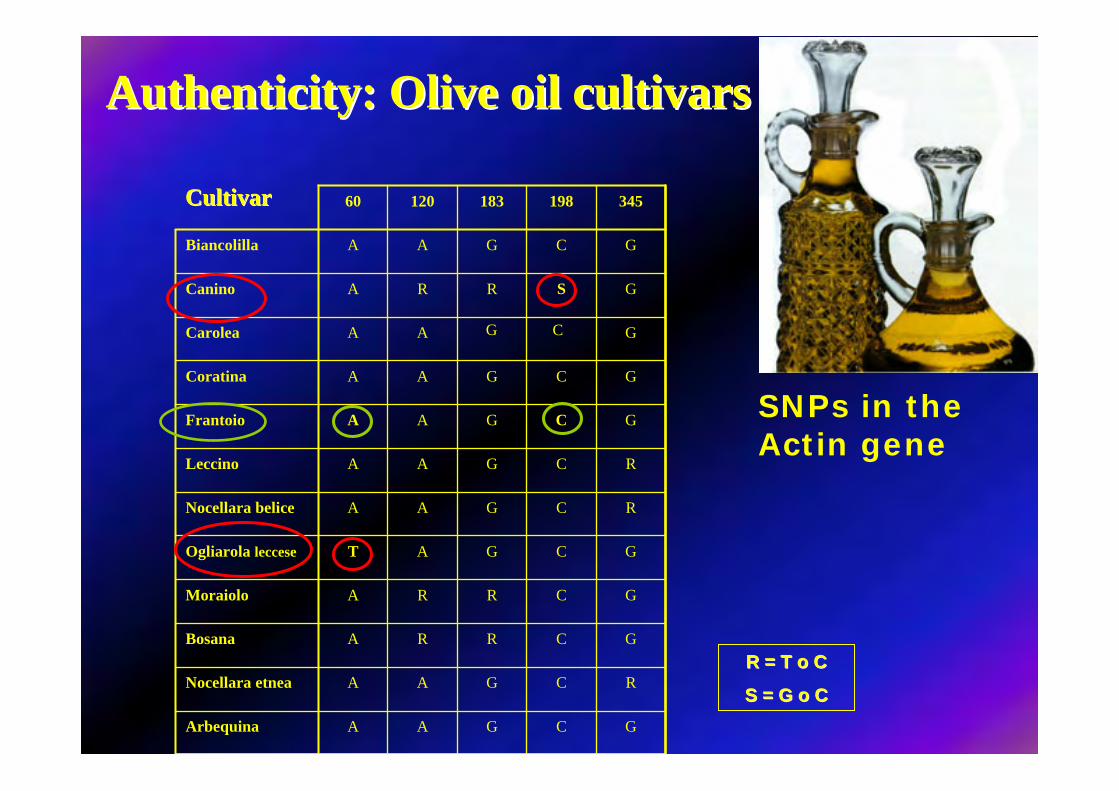
GCGAAArbequina
RCGAANocellara etnea
GCRRABosana
GCRAMoraiolo
GCGATOgliarola leccese
RCGAANocellara belice
RCGAALeccino
GCGAAFrantoio
GCGAACoratina
GCGAACarolea
GSRRACanino
GCGAABiancolilla
34519818312060
R = T o CR = T o C
S = G o CS = G o C
AuthenticityAuthenticity: Olive oil : Olive oil cultivarscultivars
SNPs in the Actin gene
CultivarCultivar

“Ogliarola leccese” “Canino”
Olive variety identification by PNA microarrays
“Frantoio”
DNADNA T A G C CP
PNAPNA A 60 T 60 C198 G198 CP
DNADNA T A G C CP
PNAPNA A 60 T 60 C198 G198 CP
DNADNA T A G C CP
PNAPNA A 60 T 60 C198 G198 CP

NOROVIRUS
Caliciviridae family: single strand RNA virus
23 milion cases per year estimated in USA
40% food-transmitted
water, mytilidae, fruits, vegetables
Main responsible for non bacterial gastroenteritis
Not cultivable in vitro
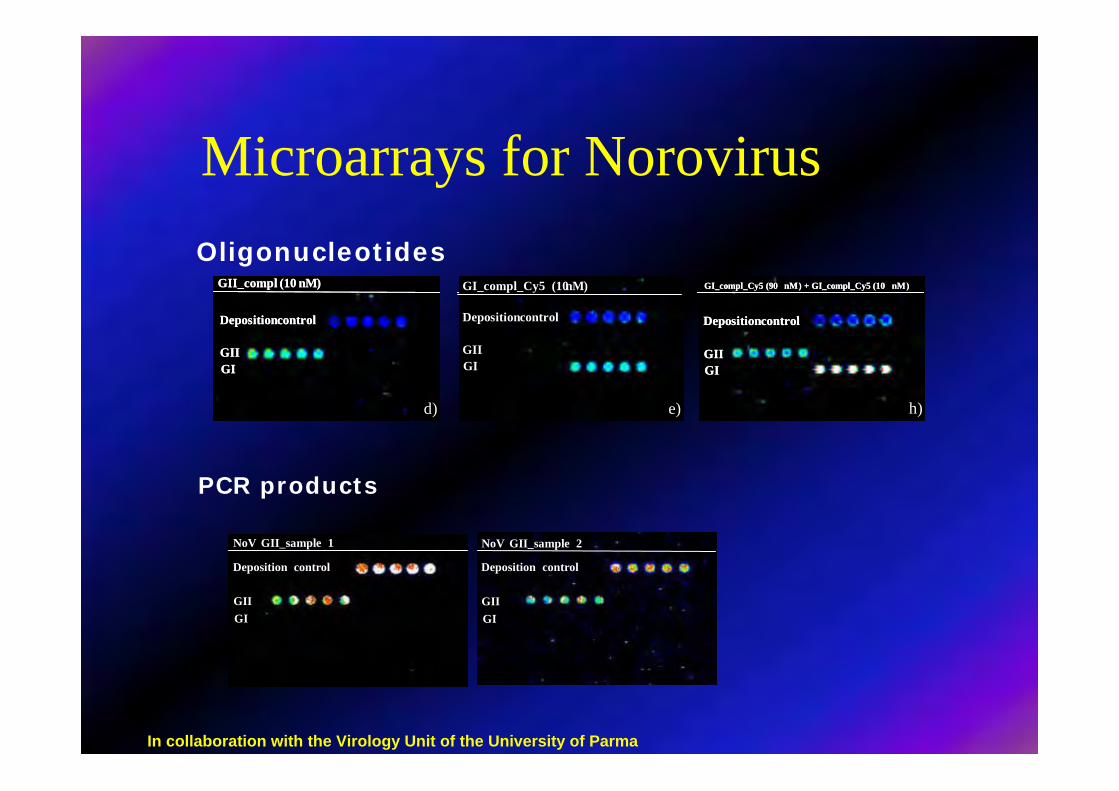
Microarrays for Norovirus
Deposition control
GIGII
NoV GII_sample 1
Deposition control
GIGII
NoV GII_sample 2
GI_compl_Cy5 (10 nM)
Depositioncontrol
GIGII
GI_compl_Cy5 (10 nM)
Depositioncontrol
GIGII
GII_compl (10 nM)
Depositioncontrol
GIGII
GII_compl (10 nM)
Depositioncontrol
GIGII
d) e)
GI_compl_Cy5 (90 nM) + GI_compl_Cy5 (10 nM)
Depositioncontrol
GIGII
GI_compl_Cy5 (90 nM) + GI_compl_Cy5 (10 nM)
Depositioncontrol
GIGII
h)
PCR products
Oligonucleotides
In collaboration with the Virology Unit of the University of Parma
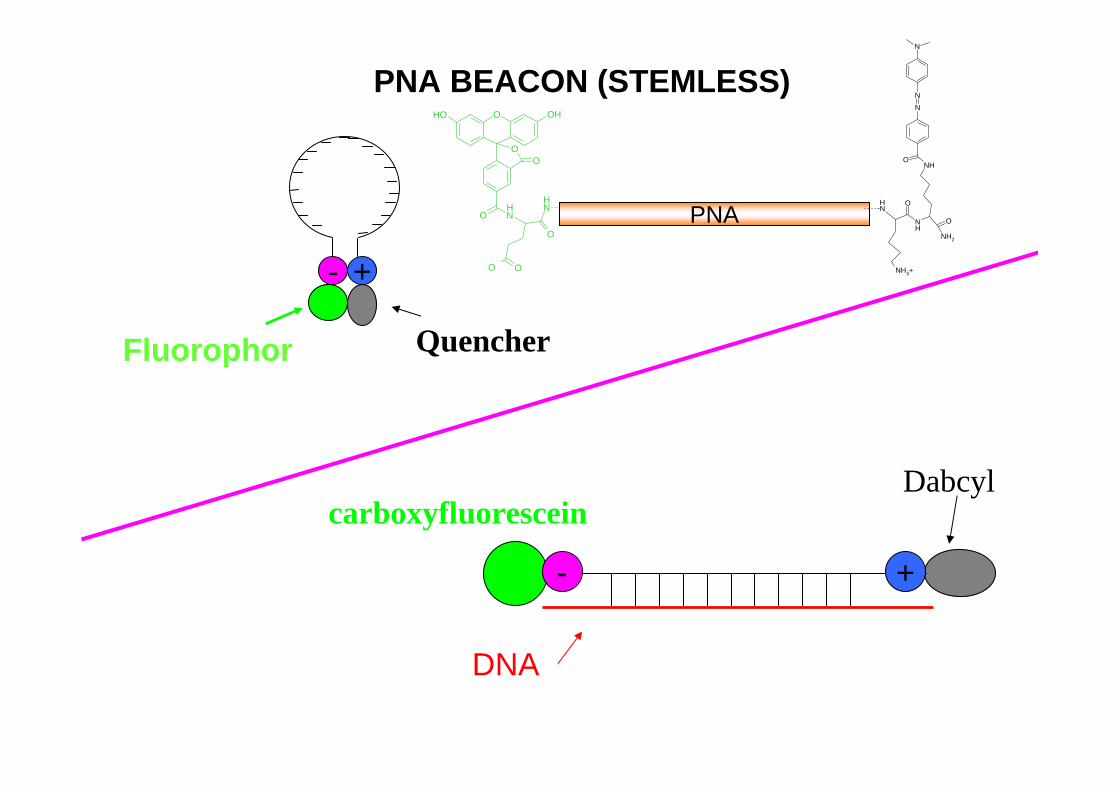
Quencher
- +
Fluorophor
carboxyfluoresceinDabcyl
DNA
- +
PNA BEACON PNA BEACON (STEMLESS)OOH OH
OO
O NH
O
O
NH
O
PNA NH O
NH3+
NH
O
NH
NH2
O
NN
N

PNA BEACON FOR ROUNDUP READY-SOY
400 450 500 550 600 650 700
λ (nm)
100
200
300
400
500
600
700
F (A
.U.)
λEC=497 nm λEM=520 nm
PNA-DNA (FULL MATCH)
PNA BEACON
PNA-DNA (NOT COMPLEMENTARY)
Negative control
Beacon -DNA
(F/F0)max = 6.5

Unlabelled DNAArray with PNA beacon
PNA array
LabelledDNA
# Towards a complete “lab on a chip” system

Amplification Area using PCR
Separation Area
Detection Area
Sample inlet
The “Lab on a chip” system

Surface Plasmon Resonance
Detectorphotodiode
Typical reflectivity scan (R versus incident angle θ) before(full curve) and after the deposition of a thin film (brokencurves).

Scheme of PCR-free detection of genomic DNA using a RNAseHamplification of the SPR signal depletion. Detection limit of 10-15M was attained
T.T. Goodrich, H.J. Lee, R.M. Corn J. AM. CHEM. SOC. 2004, 126, 4086-4087
PCR-free DNA Detection
1fM oligo
Genomic DNA

Au
Lomant
Au Au
Au
PNA
Buffer
SPR microfluidic platform based onPeptide nucleic acids (PNAs)

Au
Lomant
Au Au
Au
PNA
Buffer
0 500 1000 1500
0
2
4
%R
Time (sec.)
PNA1μMPNA 0.5μM
PNA 0.1μMCoverage: 5x10¹² molecule cm-2
250 μm wide80 μm deep
In collaboration with G. Spoto(University of Catania)
SPR microfluidic platform based onPeptide nucleic acids (PNAs)

5’-LL-AAACCCTTAATCCCA-3’ PNA-15mer
3’-TTTGGGAATTAGGGTTTTTTTTTTCGTCGAATAGCA-5’ssDNA-36mer-match
NPs
NPs5’-GCAGCTTATCGT-3’-BiotinssDNA-12merC6Biotin
SPR microfluidic platform based onPeptide nucleic acids (PNAs)

PEG
0 500 1000 1500 2000 2500 3000
0
3
6
9
%R
Time (sec.)
10pM
Control
match
PEG
SPR microfluidic platform based onPeptide nucleic acids (PNAs)

Prion protein detection in attomole amounts
Onisko et al., J.Am.Soc.Mass Spec., 2007, 18, 1070-1079
Prion protein
Reduction, alkylation, digestionnanoLC/MS/MS
Detection of the specific peptideVVEQMCTTQYQK

Zeptomole and attomole detection of biotin-peptides by a dot-blot gold nanoparticle
immunoassayHou S.Y. Et al., Analytical Chemistry, 2007, 79, 980-985
peptide sequence: SGQSWRPQGRFG

Detection of biotin-peptide with silverenhancement.
(A) Dot images for different levels of the biotin-peptide after silver enhancement.
B) Detection curve for the biotin-peptide
100 zeptomoles

Conclusions
• The trend in food analysis is to devise micro(nano) systems, which can provide affordable, portable, fast and user friendly equipments
• Nanotechnologies allow to push down the detection limits almost to “nothing”
• How low should the legal limits be set in food analysis ?

Acknowledgments
Roberto CorradiniStefano SforzaGianni GalavernaArnaldo DossenaTullia TedeschiAndrea GerminiChiara Dall’Asta
Stefano RossiElena ScaravelliAndrea FacciniFilbert TotsinganAlessandro AccettaAlessandro CalabrettaAlessandro TonelliValeria CavatortaMattia Mangia

RR15
RR13
RR11
SPFM image of the array after hybridisation with 1% RR125 GMO target solution
SL15
SL13
SL11
MisRR15
RR15
RR13
RR11
MisRR13
MisRR11
SL15
SL13
SL11
MisRR15
RR15
RR13
RR11
MisRR13
MisRR11
SPM image of Array B against air. All Parma PNAs (1μM probe concentration)
Surface Plasmon Microscopy

-0.1
0
0.1
0.2
0.3
0.4
0.5
0.6
0 5 10 15 20t / min
A 2
60 /m
V
-30
20
70
120
170
220
0 5 10 15 20t/min
F /m
V
(i)
(ii)(iii)
(iv)
(v)
b)
a)
c)
d)
b)
a)
c)
d)
(iv)(i)
Figura 14. Tracciato IE-HPLC con detector a fluorescenza (lex = 497 nm, l em = 520 nm, sinistra) e UV (260 nm, destra) relativo a : a) amplificato di PCR da solo; b) beacon RR-soia (1 mM) solo; c) beacon RR-soia (1 mM) + amplificato di PCR aspecifico; d) beacon RR-soia (1 mM) + amplificato di PCR specifico. I vari picchi sono statiidentificati come: i) beacon e componenti della reazione di PCR; ii) prodotti di amplificazione aspecifici (primer-dimers); iii) prodotto di PCR 79-mer (soia RR) iv) ibrido PNA beacon-DNA; v) prodotto di PCR aspecifico da 201bp (controllo negativo). ). Colonna: TSK-gel DNA NPR; eluenti: A = TRIS 0.02M, pH = 9.0, B = NaCl 1M in eluent A. Gradiente lineare: from 100%A to 100% B in 20 min; flusso: 0.5 mL/min.
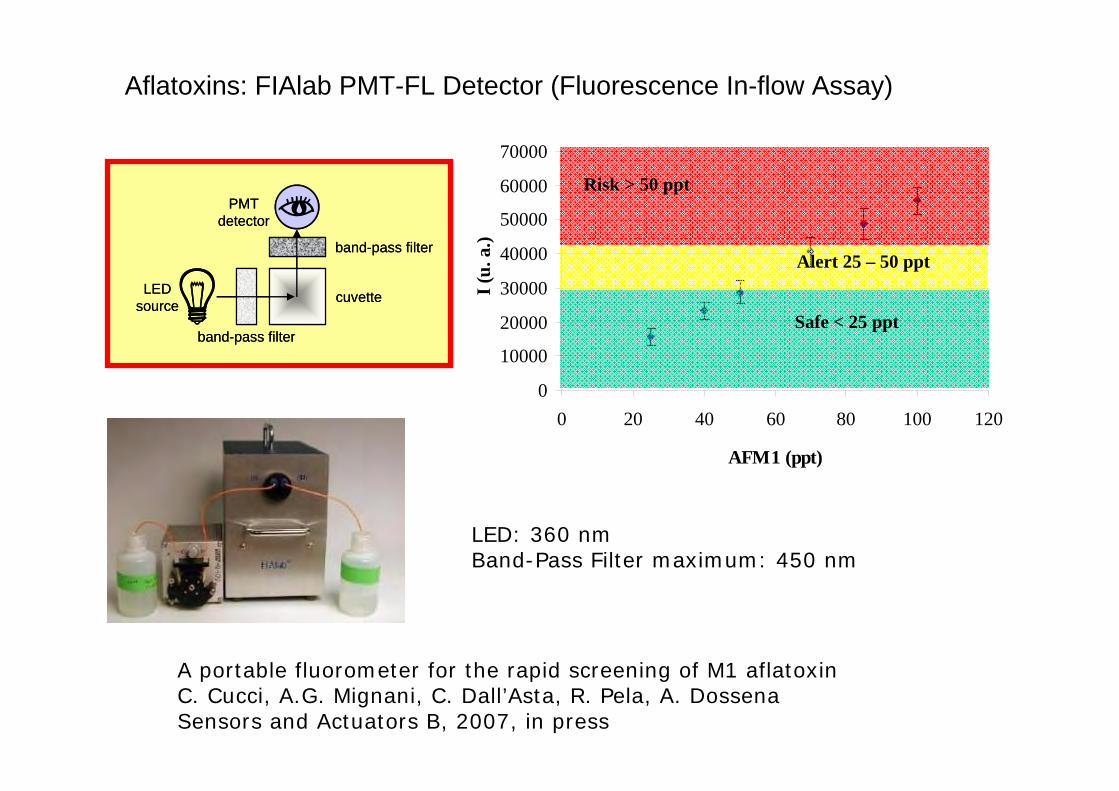
Aflatoxins: FIAlab PMT-FL Detector (Fluorescence In-flow Assay)
0
10000
20000
30000
40000
50000
60000
70000
0 20 40 60 80 100 120
AFM1 (ppt)I (
u. a
.)
Safe < 25 ppt
Alert 25 – 50 ppt
Risk > 50 ppt
cuvette
band-pass filter
band-pass filter
PMT detector
LEDsource cuvette
band-pass filter
band-pass filter
PMT detector
LEDsource
LED: 360 nmBand-Pass Filter maximum: 450 nm
A portable fluorometer for the rapid screening of M1 aflatoxinC. Cucci, A.G. Mignani, C. Dall’Asta, R. Pela, A. DossenaSensors and Actuators B, 2007, in press

Future implementation: fiber optics.

LightUp® ProbesPNA Thiazole Orange (TO)
0
18
36
54
72
90
108
126
144
162
500 550 600 650 700Wavelenght (nm)
Fluo
resc
ence
oligo•NoGII_12mer_TO
79mer•NoGII_12mer_TO
NoGII_12mer_TO
Fluorescence emission spectra of free NoGII_12mer_TO (green line) and PNA_12mer_TO in the presence of non-complementary (blue line) and complementary (red line) DNA oligonucleotide. Samples were analyzed at a concentration of 1 µM. Excitation wavelength: 470 nm. All samples were heated at 95 °C for 3 min and spectra were acquired after 5 min at 45 °C
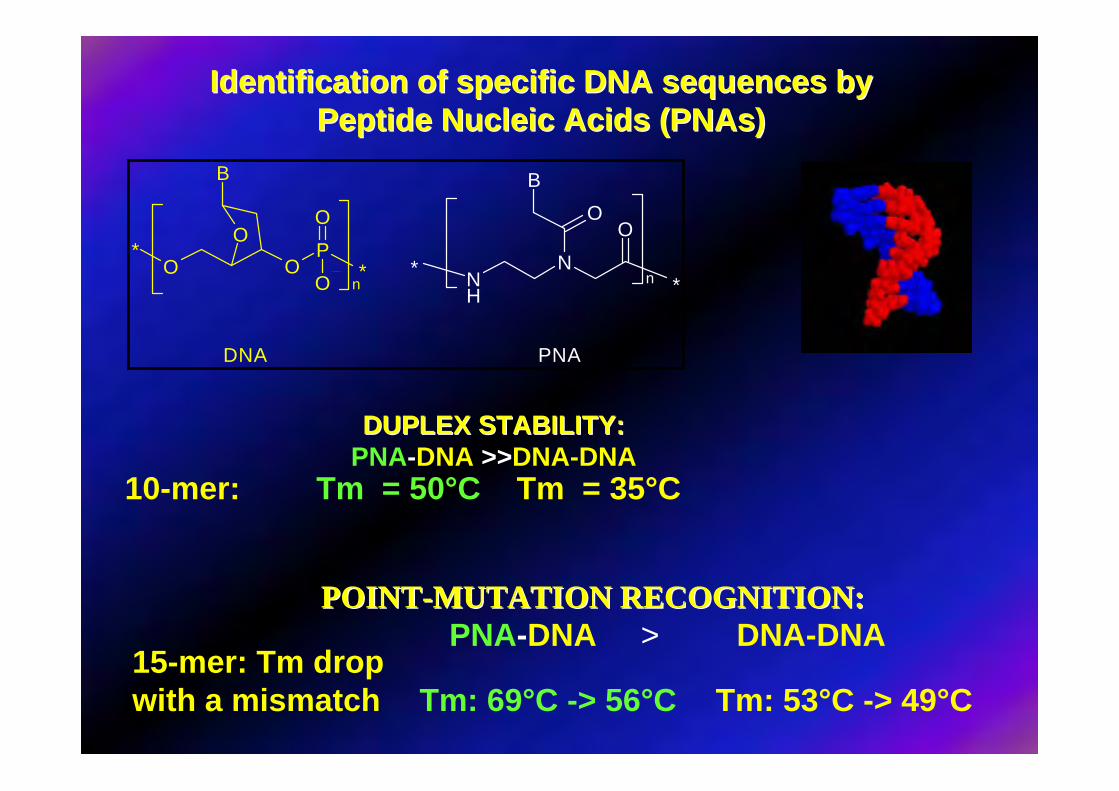
DUPLEX STABILITY:DUPLEX STABILITY:PNA-DNA >>DNA-DNA
POINTPOINT--MUTATION RECOGNITION:MUTATION RECOGNITION:PNA-DNA > DNA-DNA
10-mer: Tm = 50°C Tm = 35°C
15-mer: Tm drop with a mismatch Tm: 69°C -> 56°C Tm: 53°C -> 49°C
IdentificationIdentification of of specificspecific DNA DNA sequencessequences bybyPeptidePeptide NucleicNucleic AcidsAcids ((PNAsPNAs))
NH
N
OB
O
n
O OP
O
B
O
O n
** *
*
DNA PNA

0
50
100
150
200
250
0 2 4 6 8 10 12 14t (min)
F (A
.U.)
y = 42483x + 30291R2 = 0.9997
0
500000
1000000
1500000
2000000
2500000
3000000
3500000
4000000
4500000
0 20 40 60 80 100 120
Conditions: column TSK-gel DEAE-NPR 4.6mm x 7.5cm. Gradient elution from 100%A (tris, pH= 9.0) to 100% B (1M NaCl in eluent A) in 20 min. Fluorescence detector (λex =497 nm λem=520 nm).Flow rate: 0.5 mL/min
Quantitative analysis of unlabelled DNA by RR-beacon/IE HPLC
100 nM
60 nM
10 nM1 nM
GMOs

Minunni M., Tombelli S., Fonti J, Spiriti M.M., Mascini M., Bogani P., Buiatti M.Journal of the American Chemical Society, 2005, 127, 7966-7967
PCR-FREE DNA analysis with DNA probes
35S genomic DNA detection from GM Nicotiana glauca, by piezoelectric sensing

- 1 0
0
1 0
2 0
3 0
4 0
5 0
6 0
7 0
8 0
0 1 0 2 0 3 0
t ( m i n )
F.I.
(mV)
Full match (Ogliarola, 13mer)
Mismatch (Canino e altri, 13mer)
PNA beacon
FluoFluo--GluGlu--xx xxxxxx AA xxxxxx xxxxxx--LysLys--LysLys((DabcylDabcyl))--NHNH22A 60A 60 (11mer)(11mer)

Measures:
AffinityKineticsConcentrationArraying/Imaging ispossible
Bottom-up: building sensorson self-assembled monolayers (SAM)
Surface-PlasmonFluorescence Spectroscopy(SPFS)
Flowcell

Selective detection of RR-soy PCR