top stocks fy 2020
TRANSCRIPT

TOP STOCKS FY 2020A Roller-Coaster Ride of a Year

TOP STOCKS FY 2020A Roller-Coaster Ride of a Year


William O Neil India Investment Adviser division, is one of the divisions of William O Neil India Private Limited, which is a company incorporat- ed under the Companies Act 1956. William O Neil India Investment Adviser division is a registered investment advisor with the Securities and Exchange Board of India and through its online product, MarketSmith India intends to provide quality equity research material and information to its customers. The investments discussed or recommended through MarketSmith India may not be suitable for all investors and hence, you must rely on your own examination and judgment of the stock and company before making investment decisions. Data provided through Mar-ketSmith India is for information purposes only and should not be construed as an offer or solicitation of an offer to buy or sell any securi- ties. Information and discussions made available through MarketSmith India contain forward looking statements that involve risks, uncertainties and assumptions that could cause actual results to differ materially from those contemplated by the relevant forward-looking statement. William O’Neil India Investment Adviser division or its employees / directors or any of its affiliates are not responsible for any losses that may arise to any person who has made investments based on the contents of this document. Past performance never guarantees future results. Investment in equities are subject to market risks and despite the best efforts to provide market leading research, William O’Neil India would like to exhort its users to acknowledge and fully understand the risks involved which might include but not limited to loss of both principal and income. Data and content provided through MarketSmith India is to be consumed only by the intended recipient and must not be redistributed any further.Performance results do not represent actual trading and may not reflect the impact that material, economic, and market factors might have had on the investment-making process if actually managing client money. There is substantial speculative risk in most stocks. Performance com-putations reflect a time-weighted rate of return and includes a brokerage of 0.5%. All holdings are rebalanced to equal rupee amounts daily.Dividends are not considered in computations. Percent gains and losses are calculated for all issues that remain on the “Current Holdings” at the end of the day. For stocks that were added to “Current Holdings”, the basis used to calculate the percent change is the price noted when the issue appeared as a “Current Holdings” in MarketSmith India. For stocks that were removed, the selling price used to calculate the percent is the price noted when the issue appeared as “Removed” in the MarketSmith India.
Disclosure

-5-
TOP STOCKS FY 2020A Roller-Coaster Ride of a Year
Table of Contents
Introduction
FY20 in Review
Featured Stocks
Index
7
8
10
78

-6-
TOP STOCKS FY 2020A Roller-Coaster Ride of a Year

-7-
TOP STOCKS FY 2020A Roller-Coaster Ride of a Year
After a rollercoaster ride in FY19, the first half of FY20 turned out to be difficult to generate returns. Though the market cheered Modi 2.0, it lost the momentum after the finance minister proposed to increase the surcharge on high net-worth individuals (HNIs) and foreign institutional inves-tors (FIIs). Just before the beginning of H2 FY20, the corporate tax cut gave a positive surprise to the market, breaking the downtrend and zig-zag streak of almost four months, and an uptrend began. In January-February, Nifty made a new all-time high. But an unexpected shock from the three C’s (Corona, Crude, and Credit-risk aversion) made a deep crack on a well-paved D-street, and just before the end of FY20, the bulls lost the momentum, and the rally swiftly fizzled out.
Even in a challenging economic growth scenario, the Nifty attempted an ambitious run of almost 17% gain from September to January. The sharp and dramatic correction in the latter half of February and March left the market jammed before the conclusion of FY20. FIIs/FPIs liquidated a record amount from equity markets during this period. In FY20, FIIs sold equities worth Rs 90,043 crore, and DIIs bought equities of Rs 1,28,208 crore. Midcap and Smallcap stocks were the most severely hit. As a result, top stocks in FY 2020 clocked significantly lower gains due to a sharp correction in the last few weeks of FY20.
In a moderating growth environment, the government did not hesitate to digest higher slippages in the fiscal deficit in Budget 2020. Abolition of the dividend distribution tax was a welcome step, and changes in the personal income tax structure will give a boost to the spending power of the middle class. Also, on the sectoral front, the commitment of doubling farmers’ income, strengthening infrastructure sectors, and reforms in the banking sector were all well delivered.
Despite decent uptrend for a good part of the H2 FY20, indices accumulated notable losses. The broader market took a major hit and has deteri-orated technically. For FY20:• Nifty lost 26%• Nifty Midcap dropped 36%• Nifty Smallcap plunged 46%
William J. O’Neil said, “Bear markets are normal and necessary and serve to clean up prior excess. They also allow the market to create a whole new set of chart bases and leaders for the bull market that, in time, always follows.” We were blessed to see some rare action in the market, which provided valuable understanding and helped us overhaul our methods and hone our skills. With a plate full of learning and dramatic experience from last year, let’s begin FY21 with an eye toward sectors that are turning around to lead the market, stocks that are showing traits of a leader, and be disciplined to invest in perfect sync with the market.
Anupam SinghiCEO, William O’Neil India

-8-
April May June July August September
Jet Airways suspended all its domestic and international flights
17th
The merger of Bank of Baro-da, Vijaya Bank, and Dena Bank became effective
1st
RBI cuts rate by 25bps to 6%4th
Cyclone FANI hits Odisha3rd
NDA gets majority in Lok Sabha election
23rd
RBI cuts rate by 25bps to 5.75%
6th
Theresa May steps down as the UK PM
7th
RBI Deputy Governer Viral Acharya resigns
24th
FM Nirmala Sitaraman pres-ents first budget of Modi 2.0
5th
India’s Q1 FY20 GDP growth drops to 5%
30th
Article 370 that gave special status to J&K abolished
5th
RBI cuts rate by 35bps to 5.40%
7th
FM introduced Rs 10,000 crore special window for affordable housing
14th
India bans production, import, and selling of e-cig-arettes
18th
Corporate tax reduced 20th
Boris Johnson elected as the PM of UK
23rd
GST council cuts rate on electric vehicles to 5% from 12%
27th
Modi takes oath as PM for the second term, Nirmala Sitaraman appointed as FM
30th
FY 2020 Year-In-Review
0%
5%
10%
15%
20%
25%
NIFTY50

-9-
0%
5%
10%
15%
20%
25%
October November December January February March
Supreme Court’s decision on AGR case
24th
RBI cuts rate by 25bps to 5.15%
4th
Governement decides to merge MTNL and BSNL
23rdSupreme Court delivers final judgement on Ayodhya land dispute case. Land given to the governement to construct Lord Ram Temple
9th
Nifty hits 12,000 for the first time
6th
Union Cabinet approves IBC Bill 2019
13th
Industrial production for Octo-ber reported at 3.8%
12th
India Services PMI for De-cember was at a five-month high of 53.3
6th
First COVID-19 case outside China reported
13th
Budget Day1st
RBI supresedes Yes Bank board
5th
WHO declares COVID-19 outbreaak as global pan-demic
11th
Sun Pharma announces Rs 1,700 crore buyback
17th
Government announces Rs 1.7 lakh crore relief package
26th
Manufacturing PMI for Janu-ary was 55.3
3rd
January retail inflation reported 7.59%
12th
BSE included Titan, Nestle, and Ultratech Cement
23rd
GDP growth falls to 4.5% for July-September period
29th
Nifty makes an all-time high of 12,430
20th
RBI cuts interest rates by 75bps to 4.4% and allows a 3-month moratorium on payment of installments on term loans
27th

-10-
Featured Stocks

-11-
The record-setting highs in H2 FY20, when Nifty advanced ~15%, was followed by a sharp and dramatic correction. Just before the beginning of H2 FY20, the corporate tax cut gave a positive surprise to the market, breaking the downtrend and zig-zag streak of almost four months, and an uptrend began. However, due to the pandemic, the bulls lost the momentum in February, and the rally swiftly fizzled out.
The top stocks list for FY20 is skewed toward the Basic Materials sector with a majority of them being from specialty chemical space. Also, Financial stocks main-ly related to consumer loans, and asset management make it to the list. For most of the top gainers, the gains were accumulated from September to January. In February, spotting sell signals became equally important following a correction in the general market. Most of the stocks came under pressure during the correc-tion. This time, we have analyzed stocks that were top gainers till February 28.
This book highlights the top stocks that passed the screening criteria listed below. It begins with charts marked up by MarketSmith® Product Coaches to indicate the kind of technical and fundamental analysis crucial to post analysis. Charts for the screened stocks are accompanied by an article laying out the fundamen-tals and growth story of the stock.
Screening Criteria:• Stock Price ≥ Rs 50• Market Cap > Rs 2,000 crore• Stock Price increase by at least 50% till February 28• Average Daily Rupee Volume≥ Rs 1,00,00,000
Featured Stocks — Timely profit booking and cutting loses was crucial


[email protected]©2020 williamoneilindia
Basi
c M
ater
ial Navin Fluorine Intl.
Upward trending RS line
Breached its 21-DMA
Reclaimed all key moving averages
Rally with strong support at its 21-DMA

[email protected]©2020 williamoneilindia
Basi
c M
ater
ial
The company is one of the largest integrated specialty fluorochemical companies in India. It has over 50 years of exper-tise in handling fluorine, with a strong global clientele, which includes global innovators. In 2014, it had formed a JV with Piramal Enterprises to develop, manufacture, and sell specialty fluorochemicals with a focus on healthcare applications. The company’s key business verticals include refrigerant gases, inorganic fluorides, specialty chemicals, and CRAMS.
Key Growth Drivers in FY20:• The company’s specialty chemical business witnessed double-digit revenue growth of 33% and rose to Rs 97 crore in Q3 FY20, from Rs 73 crore in the year-ago period. The strong performance was witnessed across domestic as well as export markets, backed by higher volume. Further, growth momentum is expected to remain intact on account of a robust project pipeline in life science & crop science and expansion in the product portfolio, along with deeper penetration into existing users.
• The company is a pioneer in the manufacturing of refrigerant gases in India with over 45 years of experience in handling fluorine. In Surat, the company has built a specialty chemical manufacturing plant spread over 135 acres. It recently built a GMP compliant pilot plant in Dewas for CRAMS, which is now fully oper-ational.
• The company’s state-of-the-art R&D center (Navin Research Innovation Centre) at Surat has also received DSIR approval. This center supports product addition and process efficiency in all business units. The acquisition of Manchester Organics has further strengthened its R&D process.
• The long-term outlook for its CRAMS business is positive on the backdrop of new projects signed up for CGMP3, which are likely to start contributing in the coming quarters. Further, a strong pipeline from European majors is likely to aid top-line growth.
• In the legacy business of refrigerant gases, overall profitability was scaled up due to better pricing power, lower cost, and strong demand from the non-emis-sive sectors. The company has an aggressive capex plan of more than Rs 4.5B at Dahej over the next three to four years through a wholly-owned subsidiary. Further, the board initially approved ~Rs 0.9B capex for site development and related infrastructure on 74 acres for greenfield projects.
Analyzing from O’Neil Lens:The stock went up 100% in FY20 till February 28. During the beginning of FY20, it formed a cup-with-handle base. However, the stock did not record a decisive breakout and corrected toward the 52-week low of Rs 570. However, the stock staged a reversal and reclaimed all its key moving averages in August. Subse-quently, it fared well and advanced more than 130% with strong support at its 21-DMA and made an all-time high of Rs 1,630. In the third week of March, the stock breached its 21- and 50-DMA, giving a sell signal before the stock corrected more than 20% during the recent market correction.
NAVINFLUOR

[email protected]©2020 williamoneilindia
Basi
c M
ater
ial Alkyl Amines Chemicals
Breakout on heavy volume
Rally after breakout
Fall on lower volume
[email protected]©2020 williamoneilindia
Basi
c M
ater
ial
Alkyl Amines supplies amines and amine-based chemicals, globally, to the agrochemical, pharmaceutical, rubber chem-ical & water treatment industries, among others. The company is the sole manufacturer of ethylene-amines in India, with a significant stake in Di-amines and Chemicals Ltd. As of Q3 FY20, revenue from operations was Rs 256 crore and PAT was Rs 60 crore.
Key Growth Drivers in FY20:• The company mainly caters to the pharma and agrochemical sectors. These two contribute ~65% toward revenue. So, the company’s growth mainly depends on the growth of these two sectors. The company is hopeful that the pharma mar-ket will remain aggressive and has overcome its problems, which were there two years ago, and the agrochemical sector will repeat its last year’s performance due to good monsoons.
• In terms of producing methylamines, Alkyl Amines is one of the three major players in the market. The company is expecting volume in methylamines would at least grow with a CAGR of 20% for the next two years. Further, there is more headroom for expansion in methylamines as the company has received an environ-mental clearance of 45,000 TPA, while the current capacity is at 30,000 TPA.
• The company is aggressively looking for expansion and has a capex plan of Rs 100 crore in FY20 and Rs 150 crore in FY21. For the current year, the com-pany is targeting debottlenecking, and for the next year, it will deploy more capital in the amines space. Moreover, the company is adding one-two derivative products that were previously outsourced, but currently, the company is planning to produce in-house.
• The company’s gross revenue has been growing at a decent pace over the last nine years, both domestically and internationally. It has clocked a CAGR of 18% in domestic and 17% internationally. The ROCE over the defined period has clocked 16%+ and RONW at 13%+.
Analyzing from O’Neil Lens:The stock has gained 81% till February 28. It broke out of a 25-week flat base in October and rallied over ~97% from its pivot. Though the base had spread more than the ideal base length, other parameters of the base formation were ideal. 50-DMA is a key support level. However, due to the global pandemic, it pared some of its gains. It lost around ~43% from its peak and found support at its 200-DMA, during the ongoing crisis. Institutional sponsorship for the stock increased ~58%, indicating strong demand for the stock.
ALKYLAMINE

[email protected]©2020 williamoneilindia
Basi
c M
ater
ial Mas Financial Services
Breakout on heavy volume
Good support at 200-DMA
During base formation,volume was lower

[email protected]©2020 williamoneilindia
Basi
c M
ater
ial
MAS financial has specialized in retail financing for over two decades. It caters to the needs of mid- and low-income groups of the society. With a network of 78 branches (as of March 2019), it caters to over 500,000 clients spread across the nation. The company’s product portfolio includes micro-enterprise loans (MEL), SME loans, two-wheeler loans, and commercial vehicle loans. At the end of Q3FY20, the company had AUM of Rs 59.6B, GNPA at 1.29%, and NNPA at 1.06%.
Key Growth Drivers in FY20:• MAS serves the underserved credit needs of mid- and low-income groups. In the MEL segment, it provides loans to retailers, traders, small manufacturers, and service providers, with tenures of up to 36 months. More than Rs 36B AUM of the company is in this category. Overall, AUM has steadily grown at a CAGR of 30% in the last three years.
• While issuing a loan, MAS focusses on both qualitative and quantitative checks such as income profile, stability, track record, end-use of loan, and asset pro-file. This ensures less probability of an asset falling under NPA.
• The company started a partnership with one NBFC in 2008 and currently has relationships with more than 100 partners. There is a huge potential for growth along with these partner NBFCs. With their retail presence, these partners help in delivering last-mile credit to consumers.
• Efficient asset-liability management ensured that there was no mismatch between assets and liabilities. The company has good tie-ups with major banks and fund houses. As of Q3 end, 50% of borrowing was from direct assignment, 26% from cash credit, 23% term loan, and 1% from subordinated debt. Capital ade-quacy ratio was at 30.1% against regulatory requirement of 15%.
Analyzing from O’Neil Lens:The stock has advanced 75% in FY20 till February 28. It formed a cup and flat base patterns spread across May and July. It broke out in September and rallied over 20% before forming another flat base in October and November. The base formation was ideal as the volume dried up. After breaking out in December, it gave a superior return of 66% in the next three months. Later global sell-off crumbled the stock price. It lost over 65% during the sell-off. Key moving average to watch out for the stock is 50-DMA.
MASFIN

[email protected]©2020 williamoneilindia
Basi
c M
ater
ial Berger Paints India
Breakout on heavy volume
Good support at 50-DMA

[email protected]©2020 williamoneilindia
Basi
c M
ater
ial
Berger Paints is the second-largest paint company in India and the fifteenth largest in the world. It has 20 manufacturing factories spread across eight countries. Its revenue from operations grew at a CAGR of 11.6% for the past five years. EPS grew 14.8% in the same period. The company offers products in various categories, including interior wall coatings, exte-rior wall coatings, Berger metal and wood paints, protective coating, undercoats, and construction chemicals.
Key Growth Drivers in FY20:• Paint consumption tends to grow at 1.5–2x of a country’s GDP growth rate. Berger Paints, being a major company in India’s paints space, grew above the industry average.
• According to a major survey, India’s urban population is likely to be 41% by 2030, up from 32% currently. Urbanization helps in the consumption of paints as people tend to choose different paint styles compared to rural areas.
• As disposable income grows, people spend more on a better lifestyle. They upgrade to higher-value products. In the paints industry space, people have started upgrading from distemper to an emulsion, cement paint to exterior emulsions, regular to premium emulsions, etc.
• Consolidated revenue was up 4.9% y/y in Q3 FY20. The company has cut prices of enamels by 2.5-4% and has not raised prices of other products. Despite headwinds, such as prolonged monsoon and political uncertainty in Jammu & Kashmir and North East, the company has reported strong results for Q3 FY20. Standalone revenue was up 2.9%, y/y.
Analyzing from O’Neil Lens:The stock gave a 72% return in FY20 till February 28. It broke out of a cup-with-handle base in July and rallied over 58% before forming another cup-with-handle base pattern. The base formation was ideal as volumes dropped during the base formation. Even the breakout was strong as the volume on the day of breakout was 4x the average volume. The second breakout gave a 16% return as well; however, a global pandemic in February triggered a sell-off in the stock price. It fell around 35% in the sell-off. The number of funds invested in the stock surged 83% to 428 funds, indicating a strong demand for the stock.
BERGEPAINT

[email protected]©2020 williamoneilindia
Basi
c M
ater
ial Deepak Nitrite
Breakout on heavy volume
Rally after a breakout
Fall on lower volume

[email protected]©2020 williamoneilindia
Basi
c M
ater
ial
Deepak Nitrite is one of the country’s fastest-growing chemical intermediate companies. It is ranked among Fortune Next 500 and recognized among the top 25 wealth creators by Fortune Magazine, India. It caters to the pharmaceutical, agrochemical, plastics, textiles, dyes & pigments paper, and home & personal care segments in India and overseas. The company has five manufacturing plants.
Key Growth Drivers in FY20:• Double-digit growth in the basic chemicals (BC) segment amid a challenging macro environment: The BC segment’s revenue stood at INR 236 crore in Q2 FY20 versus INR 202 crore in Q2 FY19, thereby registering 17% y/y growth. On the volume front, this segment posted a 10% growth as a result of higher realizations after the company leveraged its cost leadership position in serving the demand for its products.
• Performance products (PP) segment continued its outstanding performance: The PP segment delivered a superb quarter yet again, with revenue growth of 119%. This segment covers newer, high-performance products in optical brightening agents (OBA), which has gained customer satisfaction. In OBA, the compa-ny is focusing on doing business with quality customers rather than improving capacity utilization, which will, in turn, increase customer retention. This helped the company in maximizing realizations, keeping utilization in the range of 50–60%. Further, DSDA (di-amino stilbene disulphate acid) prices are expected to remain the same in the future as per management. The significant performance in this segment has generated free cash flows for the company, which is essential for future growth.
• Good progress on plans to launch acetone downstream products: The company’s plan of entering the downstream product of Isopropanol (IPA) is progressing well, and production is expected to commence from the next financial year. IPA will be made from acetone and lead to around 25–30% consumption of acetone. The company is expecting a total capex of INR 60–65 crore for the product. Margins for the product are expected to be around 20–24%.
Analyzing from O’Neil Lens:The stock has gained 70% till February 28. It formed a six-week cup-base pattern after trading in a flat base for ~19 weeks. Since the breakout, it rallied ~44% and made an all-time high of Rs 542 on March 4. During the recent global pandemic, it corrected around 42% and gave up its 200-DMA. 50-DMA acted as a good support during the uptrend and 200-DMA gave support during consolidation from June to September 2019. Number of institutional funds invested in the stock increased around 20%, indicating a strong demand for the stock.
DEEPAKNTR

[email protected]©2020 williamoneilindia
Basi
c M
ater
ial Srf (Nse)
Consolidation base formed on low volume
Rally after breakout froma consolidation base
Breached its 21- and 50-DMAon high volume
[email protected]©2020 williamoneilindia
Basi
c M
ater
ial
SRF is a chemical-based business entity with a diverse product portfolio. It is mainly engaged in the manufacturing of industrial and specialty intermediates. The company’s business is divided into three divisions: technical textiles, chemical & polymers, and packaging films. Its portfolio covers technical textiles, fluorochemicals, chloromethanes, specialty chemi-cals, engineering plastics, and packaging films.
Key Growth Drivers in FY20:• The major rally that began in October 2019 was mainly due to the strong performance in H1 FY20 and a positive outlook for the rest of the year. Management maintained its growth guidance of more than 40% growth in specialty chemicals for FY20. During Q3 FY20, the company announced an additional capex of Rs 65 crore to debottleneck HFC capacity at Dahej and Rs 238 crore to set up a series of dedicated facilities to produce intermediates catering to the agro-chemicals segment.
• For 9M FY20, overall margins improved despite margin pressure in the refrigerator gas business. This shows a good product mix of the company. EBITDA margins have improved to 20% in 9M FY20 from ~18% in 9M FY19. It has helped the company grow the bottom line, despite weak top-line growth. Consensus expects EBITDA margin to be around 21% in Q4 FY20, mainly due to higher margins, growth in specialty chemical business, and superior product portfolio with more than 70% revenue from value-added products in the packaging film business.
• The company has planned capex of Rs 800 crore in FY21. It has received the board’s approval for capex of ~Rs 350 crore for setting up a new 45ktpa BOPP film line in Thailand and capex of Rs 400 crore to set up an integrated PTFE (polytetrafluoroethylene) plant.
• The growth of India’s specialty chemical industry due to the disruption in China has increased fund flow in stocks like SRF. The Chinese government has made it compulsory to build effluent treatment plants and levied a green tax on the chemicals industry to keep pollution at bay. This is likely to hit the margin on ac-count of a scaled-up cost of production, driven by capital expenses incurred towards building these plants and increased cost of compliance.
Analyzing from O’Neil Lens:The stock went up 65% in FY20 till February 28. It formed a stage-two consolidation in July-October, and after the breakout, it progressed more than 30% in less than three months. After a breakout, the RS line was trending upward, the stock continuously traded above its 21- and 50-DMA and A/D Rating remained high, showing good accumulation. However, in the second half of February, the stock was stalling near its all-time high and failed to hold the intraday gain. Further, it breached 21- and 50-DMA on high volume. It was a strong sell signal before the stock corrected more than 40% during the recent market correction. EPS Rank of 97 is strong, and with the upside reversal, technical ratings have started improving.
SRF

[email protected]©2020 williamoneilindia
Basi
c M
ater
ial Bharat Rasayan
Cup base formation
Rally after breakout froma consolidation base
Breached its 21- and 50-DMAon high volume

[email protected]©2020 williamoneilindia
Basi
c M
ater
ial
Bharat Rasayan is engaged in manufacturing technical grade pesticides, pesticide formulations, and intermediates. The company primarily offers Metaphenoxy Benzaldehyde. Its product portfolio includes insecticides (Acetamiprid, Bifenthrin, Chlorpyrifos, Cypermethrin, Imidacloprid, Permethrin and Thiamethoxam), herbicides (Clodinafop Propargyl, Cloquinto-cet Mexyl (Safener), Diuron and Metsulfuron Methyl), fungicides (Tricyclazole and Myclobutanil; Acaricide, which include Fenpyroximate) and intermediates (Meta Phenoxy Benzaldehyde and Para Chloro Benzyl Cyanide). These chemicals have an application in irrigation water, seeds, soils, and crops.
Key Growth Drivers in FY20:• Strong quarterly performance triggered a rally in the stock. During Q2 FY20, the company’s net profit jumped 52% y/y to Rs 54.6 crore, while the revenue increased 28% y/y to Rs 365 crore. During Q3 FY20, the company’s net profit rose 17.5% y/y to Rs 25 crore, while the revenue increased 18% y/y to Rs 223 crore.
• Above-average monsoon last year kept the stock momentum intact as the agriculture sector was showing signs of improvement. Better prospects of the rabi season and an increase in crop output prices were the other positive factors for the stock. Early indications of the standing rabi crop augur well for the agricul-ture gross value added (GVA) in 2020–2021. Price of rice and wheat increased to Rs 3,000 and Rs 2,500, respectively, in November 2019 from Rs 2,700 and Rs 2,200 in the year-ago period. In addition, water storage in the majority of water bodies was at a comfortable level and the overall storage position in the country was also better.
• Chemicals stocks in India have seen an increased fund flow and growth due to stringent environment regulations in China. The Chinese government has made it compulsory for chemicals industries to build effluent treatment plants and levied a green tax on them to keep pollution under control. This has increased production and compliance cost in China. In addition, the government of India is helping the industry by allowing 100% FDI under the automatic route in the chemicals sector (excluding certain hazardous chemicals). India also has relatively advanced pesticide technical and formulation research capabilities. Currently, manufacturing capacity of Bharat Rasayan is not getting fully utilized. The company has great opportunity to increase its export business.
Analyzing from O’Neil Lens:The stock advanced 65% in FY20 till February 28. It made a stage-one consolidation base from June-August 2019. After the breakout, it advanced more than 40% in three months. During the base formation, volume on the down days was very low and tight area was formed before the breakout. From November 2019 to January, it formed a stage-two cup base. The depth of a cup was ~20% and volume dried up during the formation of a bottom of the cup, indicating a good base formation. After the breakout, the stock breached its 21- and 50-DMA, thereby giving a sell signal. It declined more than 40% in the recent market correc-tion. Though its technical ratings have deteriorated, the fundamental profile with an EPS Rank of 97 remains strong.
BHARATRAS

[email protected]©2020 williamoneilindia
Basi
c M
ater
ial Fine Organic Inds
Hits power to pivot after breakoutfrom a cup-with-handle base
Progressed well afterbreakout from a cup base
Decline from top on high volume

[email protected]©2020 williamoneilindia
Basi
c M
ater
ial
Fine Organic Industries is the largest Indian manufacturer of oleochemical-based additives. The company also has a strong presence in the global market. Its products primarily fall in the plastic and food segment, which contributes more than 80% to revenue. In addition, the company produces a wide range of specialty plant-based additives used in the polymer, cosmetics, paint, ink, coatings, and other specialty application industries. Exports revenue accounted for ~55% of total FY19 revenue.
Key Growth Drivers in FY20:• Strong quarterly performance triggered a rally in the stock. In Q1 and Q2 FY20, revenue growth was in line with con-sensus. EBITDA margin beat consensus in both the quarters. In Q1 FY20, EBITDA margin expanded 160bps y/y to 23.8% whereas it expanded 140bps to 23.7% in Q2 FY20.
• In H1 FY20, the company operated at 90–92% utilization level. Also, the capacity expansion plans were in place. Hence, additional capacity would directly lead to volume growth, aided by higher realizations. The company commenced production at 32,000MT Ambernath facility (50% of existing capacity) in Q2 FY20, which helped address the capacity constraint issue and better product mix (high margin products like non-food, feed additives, etc.). As a result, margin expanded 360bps y/y in Q3 FY20. The company had plans to incur a capex of Rs 1,500 crore for expansion in FY20.
• Specialty chemicals stocks in India have seen an increased fund flow and growth due to stringent environment regulations in China. The Chinese government has made it compulsory for chemicals industries to build effluent treatment plants and levied a green tax on them to keep pollution under control. The measures taken in China led to an increase in production cost, driven by capital expenses incurred toward building these plants and increased cost of compliance. In addition, the government of India is helping the industry by allowing 100% FDI under the automatic route in the chemicals sector (excluding certain hazardous chemicals) and mandating BIS-like certification for imported chemicals to prevent dumping of cheap and substandard chemicals into the country.
Analyzing from O’Neil Lens:The stock advanced 65% in FY20 till February 28. It formed a stage-three cup-with-handle base from May to September 2019. It hit power to pivot after the breakout. From November 2019 to January this year, the stock consolidated and formed a cup base. After the breakout, it progressed well and made higher highs. In Q3 FY20, a 25% y/y increase in the number of funds holding the stock indicated a large investment from institutional investors. However, in February, it made higher highs on low volume. It has been backtested that most of the times, a new high on low volume indicates the end of a rally. After downside reversal, it breached its 21- and 50-DMA and declined more than 40% during the recent market correction. The good part is that the stock retook its 50- and 200-DMA. The stock has an EPS Rank of 95. With the upside reversal, technical ratings have also improved.
FINEORG

[email protected]©2020 williamoneilindia
Basi
c M
ater
ial Jk Cement
Failed breakout after acup-with-handle base formation
Rally after a breakout
Formed a rear ascending base pattern
[email protected]©2020 williamoneilindia
Basi
c M
ater
ial
JK Cement is one of the leading cement manufacturers in India. The company has grey cement installed capacity of 11.5mtpa with manufacturing plants at Nimbahera, Mangrol, and Gotan in Rajasthan and Muddapur in Karnataka. It is the second largest producer of white cement in India with a capacity of 0.6mtpa and is a leading manufacturer of putty with an installed capacity of 0.9mtpa. The company also has an overseas subsidiary which operates a 0.6mtpa white cement plant in the UAE.
Key Growth Drivers in FY20:• Strong quarterly performance triggered a rally in the stock. Q1 and Q2 FY20 results beat consensus on all fronts mainly due to higher realization. In Q1 FY20, net sales grew 19% y/y to Rs 1,310 crore, while EBITDA grew 102% y/y to Rs 300 crore. In Q2 FY20, net sales grew 14% y/y to INR 1,240 crore, while EBITDA improved 50% y/y to Rs 250 crore.
• The stock progressed well after Q3 FY20 results as out of the 4.2mtpa capacity expansion project announced by management, 3.5mtpa was already commis-sioned and the remaining would start by the end of Q4 FY20. Realizations were higher on account of higher prices in south and north India. Also, management informed that the new product (premium cement) did receive an encouraging response and premium cement sales can be ~10% of its overall trade volumes, thereby fetching better margins to the company.
• The company commissioned its 8,000TPD clinker kiln at Mangrol and 1mtpa grinding unit at Nimbahera in Q2 FY20. The other grinding unit is expected to be completed by Q4 FY20. This will improve efficiency and margin.
Analyzing from O’Neil Lens:The stock advanced 63% in FY20 till February 28. It formed a stage-one cup-with-handle base from June to August 2019. However, the breakout failed and the stock formed an ascending base (which is very rare). After breakout, it increased more than 35% and made an all-time high in February. During the rally, volume on the gain days was higher and managed to close in the top half of the day’s range. Its RS line was trending upward and A/D Rating remained high, showing good accumulation. After breakout, it continuously traded above its 50-DMA.
However, in March, it had an intraday downside reversal, which was the first indication that a rally may take a pause. The stock breached its 21- and 50-DMA and gave a strong sell signal before correcting more than 40% in the recent market correction. The fundamental profile remains strong with EPS Rank of 97. Also, the stock had an upside reversal and technical profile is improving.
JKCEMENT

[email protected]©2020 williamoneilindia
Cap
ital E
quip
men
t
Gmm Pfaudler Ltd
Rally after breakout
Breached its 21-DMA
Cup base formation Cup base formation

[email protected]©2020 williamoneilindia
Cap
ital E
quip
men
t
GMM Pfaudler (GMMP) is a leading supplier of process equipment for the pharmaceutical and chemical industries. The company has occupied a leading position in the market with more than five decades of experience in manufacturing glass-lined equipment. The company has kept a diversified product portfolio that includes mixing systems, filtration & drying equipment, engineered systems, and heavy engineering equipment and is today a one-stop-shop for the chemical process industry. The company has a long-standing track record of consistent dividends.
Key Growth Drivers in FY20:• During FY20, the company continued to deliver a very strong quarter. Massive growth has come from the agrochemi-cals and specialty chemicals sectors. Because of the slowdown in China, a lot of production has moved to India.
• During 9M FY20, the company reported a 26% y/y surge in operating revenue, which rose to Rs 459.3 crore, versus Rs 363.5 crore in 9M FY19. EBITDA increased 55% y/y to Rs 88.7 crore, compared with Rs 57.2 crore for the same period, a year ago. The company reported a PAT of Rs 59.5 crore, as against Rs 37.3 crore for the same period, a year ago. PBT was up 41%.
• EBITDA margin improved to 19% in 9M FY20, versus 16% in 9M of last year. EBITDA had witnessed a significant improvement, especially in Q2 FY20. This improvement came from a few different areas. Firstly, the company was able to pass on a definite price increase to the customers due to the increase in de-mand. Also, there was a greater order flow to absorb the company’s fixed cost, resulting in increased profitability. Lastly, there was a large export order, which also contributed to better margins.
• The company’s glass lining business is the biggest chunk of its business and is the most profitable one. The company continued to maintain a market share of about 60%. Further, the glass line was continuously growing during FY20 as there was a surge in demand from industries, basically chemical, pharmaceutical, etc. The demand is still very strong.
Analyzing from O’Neil Lens:The stock went up 126% in FY20 till February 28. During the June-August of FY20, the stock had formed a cup base. However, the stock did not record a con-vincing breakout and moved sideways to form another cup base. The stock broke out from that base on above average volume. The stock gained more than 100% after the breakout with strong support at its 21-DMA. In the first week of March, the stock decisively breached its 21-DMA, giving a sell signal before the stock corrected more than 30% during the recent market correction.
GMMPFAUDLR
[email protected]©2020 williamoneilindia
Cap
ital E
quip
men
t
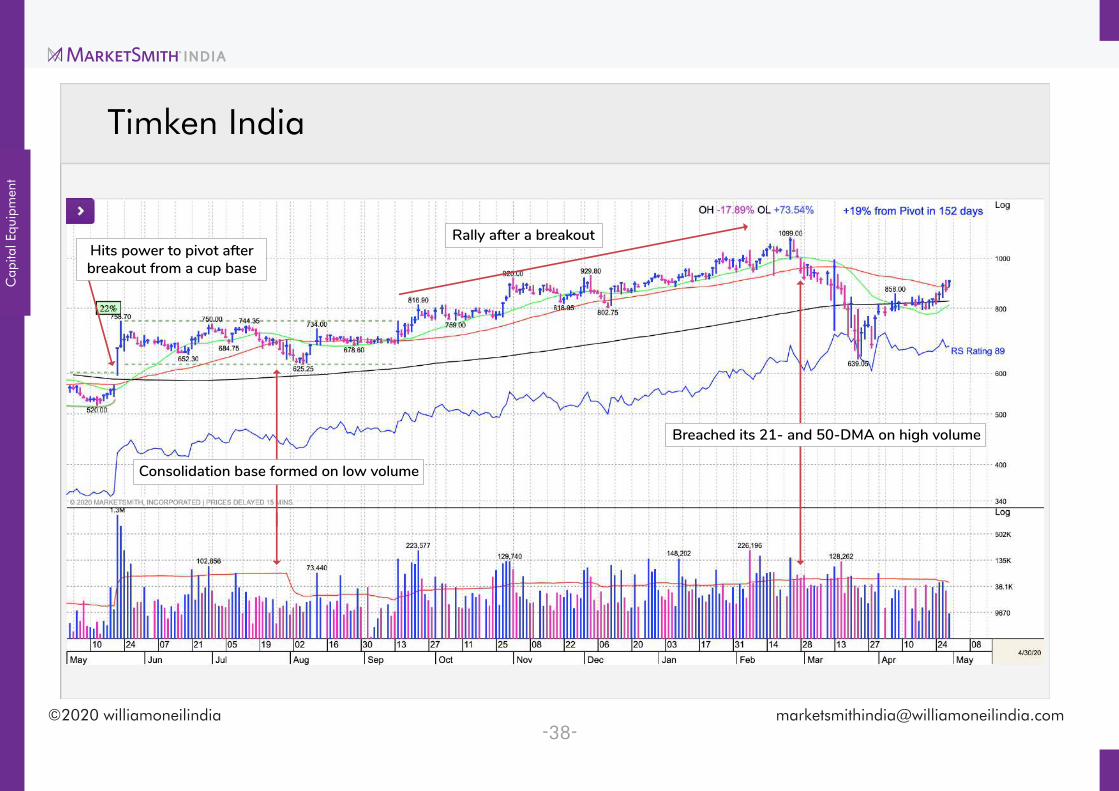
Timken India
Hits power to pivot afterbreakout from a cup base
Breached its 21- and 50-DMA on high volume
Rally after a breakout
Consolidation base formed on low volume

[email protected]©2020 williamoneilindia
Cap
ital E
quip
men
t
Timken India is a manufacturer of tapered roller bearings, components, and accessories for the automotive and railway industries. It is the subsidiary of The Timken Company, which is the world leader in tapered roller bearing and is head-quartered in Canton, Ohio. The company also provides maintenance contract services and refurbishment services.
Key Growth Drivers in FY20:• The acquisition of ABC Bearings was a key positive for the stock as it opened the wheel-end bearings market both domestically (ABC is a dominant player in India) and in the export market, as Timken has a large global presence. Also, ABC’s acquisition opens the possibility of import substitution of industrial bearings for the company, which can result in higher margins.
• The stock started to rally in H2 FY20 as consensus expected margin expansion and the company was able to deliver well. In Q2 FY20, gross margin improved 258bps y/y and was up 93bps q/q on the back of softening commodity prices and better cost alignment to the pre-vailing volume. In Q3 FY20, EBITDA grew 52.10% y/y to Rs 89.0 crore from Rs 58.8 crore.
• The company announced a capex of Rs 80 crore to set up a brownfield facility for exports of bearing components, which would start commercial production in FY 21E. This is also in-line with Timken’s group level strategy to cease operations in high-cost countries and increase sourcing from Timken India.
• Railways showed stable performance, both on freight and passenger bearings. Growth visibility is also high due to the new order from the railways in Q3 FY20 and contracts bagged for maintenance of bearings.
Analyzing from O’Neil Lens:The stock went up 62% in FY20 till February 28. It formed a stage-two consolidation from May to August, and after the breakout, it progressed more than 35%. Generally, volume on the gain days was higher and managed to close in the top half of the day’s range. Its RS line was trending upward and A/D Rating re-mained high, showing good accumulation. It is notable that the number of funds holding the stock is down 25% q/q in Q3 FY20, but the number of shares held by the funds has increased 5% in the same period. After breakout, it continuously traded above its 50-DMA.
However, in the second half of February, it breached its 21- and 50-DMA within a week on high volume. The stock gave a strong sell signal before correcting more than 40% during the recent market correction. Though its fundamental profile with EPS Rank of 94 remains strong, the stock is facing strong resistance near its 200-DMA and A/D Rating has dropped significantly.
TIMKEN

[email protected]©2020 williamoneilindia
Ener
gy
Adani Enterprises
Rally after breakout
Upward trending RS line
Breached its 21- and 50-DMA
Flat base formation on lower volume
Cup-with-handle base formation

[email protected]©2020 williamoneilindia
Ener
gy
Adani Green Energy Ltd. is a renewable energy company in India, with a project portfolio of 5,290 MW. It is owned by the Indian conglomerate Adani Group. The company’s business includes solar power (2,198MW in operation, 425MW under construction), wind power (397MW in operation, 1,280MW under construction), and hybrid power (1,690 MW under construction). The company operates the Kamuthi solar power project, which is one of the largest solar photovoltaic plants in the world.
Key Growth Drivers in FY20:• For 9M FY20, the company reported a 2% y/y increase in operational EBITDA to Rs 1,266 crore as against Rs 1,240 crore in 9M FY19. Revenue from energy sales increased 6% y/y to Rs 1,464 crore as compared with Rs 1,371 crore for the same period a year ago. The company reported EBITDA margin of 89% from power sales. Cash profit stood at Rs 544 crore.
• During FY20, the company was also involved in the commissioning of new units such as 75MW Wind at Dayapar, Gujarat, in December; 200 MW Solar at Rawara, Rajasthan in August; 100 MW1 Wind in July & 50 MW1 Wind in August at Gujarat; 50 MW Solar at Jhansi in May 2019; and 50 MW Wind (AGMPL) in October. Further, the company won 700MW of hybrid projects from AEML at a fixed tariff of Rs 3.24/unit. Also, the company made an announcement regarding the acquisition of 205MW operating solar assets from the Essel Group.
• The company’s wind portfolio witnessed strong performance during 9M FY20. Plant availability increased to 90.5% as against 80.8% in 9M FY19. Similarly, CUF-Achieved ascended to 28.8% as compared with 22.23% for the same period a year ago. 9M grid availability stood at 99.85%.
• The company reported stable performance for 2.1GW solar portfolios. The portfolio achieved over P90 performance in 9M FY20. 9M plant availability stood at 98.72% and 9M grid availability stood at 98.00%. However, in Q3, generation was lower on account of extended monsoon in India and lower gridavailability.
Analyzing from O’Neil Lens:The stock went up 300% in FY20 till February 28. The stock broke out in mid-September after forming a stage 1(b) consolidation base for 48 days. This base followed immediately after a cup-with-handle base pattern of depth 26% resulting in a base-on-base formation, which is considered a very positive sign from the O’Neil perspective. Post the breakout, the stock advanced more than 330% with strong support at its 21-DMA. Then, in January-February, it corrected toward its 21-DMA and hovered around its 21-DMA. In the last week of February, the stock decisively breached its 50-DMA, giving a sell signal before correcting more than 30% during the recent market correction.
ADANIGREEN

[email protected]©2020 williamoneilindia
Hea
lth C
are
Abbott India Ltd.
Rally after breakout
Breached its 21-DMA
Flat base formation
Rally after breakoutFlat base formation

[email protected]©2020 williamoneilindia
Hea
lth C
are
ABBOTINDIA
Abbott India is a subsidiary of Abbott Laboratories, which operates in the pharmaceutical space. The company offers high-quality medicines in multiple therapeutic categories, such as women’s health, gastroenterology, cardiology, metabol-ic disorders, and primary care. The company has successfully introduced over 100 new products in the last 10 years. The company has a robust and reliable distribution network of 70,000 retailers, 4,400 stockists, and 24 distribution points.
Key Growth Drivers in FY20:• During 9M FY20, total income from operation increased 13.3% y/y to Rs 3218.2 crore compared with Rs 2,856.2 crore for the same period a year ago. The company reported a 38% y/y surge in PBT, which rose to Rs 653.7 crore versus Rs 522.2 crore in 9M FY19.The company reported PAT of Rs 482 crore versus Rs 337 crore for the same period a year ago.
• The company has zero debt on its balance sheet. Further, the company operates with low working capital requirements. Its capital expenditure is also negligible as most of its products are made by third-party manufacturers. Apart from this, the company witnessed improvement in its core RoEs at an accelerated rate. EBITDA margins witnessed noteworthy recovery from lows of 11.8% in FY14 to 19.7% in 9MFY20.
• During September of FY20, the government announced its decision to lower the corporate tax to 22% if companies choose not to avail exemptions and in-centives. This meant that the effective tax rate was lowered to 25.2%, including all surcharges. The company was a beneficiary of this announcement as it was paying around 36% toward the corporate tax.
• The company has outperformed the industry consistently in women’s health, GI, metabolic, pain, CNS, and vaccines. Further, the company’s new launches and line extension (more than 100 product launches recorded in 10 years) in existing as well as new segments continue to remain the key growth drivers during FY20.
Analyzing from O’Neil Lens:The stock went up 115% in FY20 till February 28. During July-August of FY20, the stock had formed a stage-two flat base. It was created following a flat base of 79 days resulting in a base on base formation, which is considered as a very positive sign from O’Neil methodology’s perspective. Following the breakout, the stock advanced more than 35% with strong support at its 21-DMA. Then, during the December-January, the stock formed another flat base. The depth of the base was about 10%. The stock gained around 22% after the breakout before correcting toward its 21-DMA. In the first week of March, the stock decisively breached its 21-DMA, giving a sell signal before the stock corrected more than 18% during the recent market correction.

[email protected]©2020 williamoneilindia
Reta
il
Trent Ltd.
Rally after breakout
Breached its 21- and 50-DMA
Flat base formation
Cup-with-handle base formation
Rallied with support at its 21- and 50-DMA

[email protected]©2020 williamoneilindia
Reta
il
TRENT
Trent operates in the branded retail industry in India. The company operates stores across four concepts: Westside, Zudio, Star, and Landmark. Westside offers an exclusive range of its own branded fashion apparel and holds the flagship part in the retailing business of the company. The company has 143 Westside stores and 20 Zudio stores that offer fashion. Star is a fresh food and grocery retail chain, operating 26 supermarkets and 10 hypermarkets. The company operates 39 Star grocery retail stores under Trent Hypermarkets (THPL), which is a JV with Tesco Plc, and five more Star stores under Fiora (100% owned entity by Trent). Landmark, a family entertainment concept, operates through five independent stores and retails through selected Westside locations.
Key Growth Drivers in FY20:• During 9M FY20, revenue from operations increased 38% y/y to Rs 2,643 crore compared with Rs 1,935.9 crore for the same period, a year ago. The company reported a 38% y/y surge in PBT to Rs 201.6 crore compared with Rs 168.4 crore
in 9M FY19.The company reported PAT of Rs 102 crore as against Rs 89 crore for the same period, a year ago. Total expenses for 9M FY20 stood at Rs 2,547 crore compared with Rs 1,799 crore for the same period last year.
• In September 2019, the company agreed to acquire 51% of the share capital of Booker India Pvt. Ltd. for a cash consideration of Rs 22 crore. Booker India is part of a Booker Group, which works on the cash & carry model and offers branded and private label goods that are sold to provision stores, foods stalls, restaurants, and hotels worldwide. Booker India operates through six stores in India, of which five are in Maharashtra and one is in Gujarat. This acquisition helped the company grow inorganically and expand business through the addition of six stores.
Analysis from O’Neil Lens:The stock advanced 106% in FY20 till February 28. In July-August 2019, the stock formed a stage-one consolidation base. Post the breakout, the stock advanced more than 17% with strong support at its 21-DMA. Then, in November-December, the stock formed a stage-two cup-with-handle base. The depth of the base was about 15%. The stock gained 45% after the breakout before correcting toward its 21-DMA. In the first two weeks of March, the stock decisively breached its 21- and 50-DMA, giving a sell signal. It declined more than 30% in the recent market correction.

[email protected]©2020 williamoneilindia
Reta
il
Vaibhav Global
Breakout on heavy volume
Re-breakout

[email protected]©2020 williamoneilindia
Reta
il
Vaibhav Global is a leading fashion retailer on electric platforms. Its products include lifestyle products in the U.S. and U.K. on its TV shopping channels – ShopLC, USA, and The Jewellery Channel (TJC), the U.K. It reaches almost 100M households through its TV channels in the U.S. and U.K. The company’s diamond jewelry manufacturing and sourcing fa-cility is located at Mumbai. Its fashion jewelry offerings include bracelets, bangles, earrings, studded jewelry, etc. Fashion accessories that it retails include watches, handbags, scarves, etc. Its range of lifestyle products includes home decor, bed linens, pillow covers, and beauty products. Revenue breakdown as of 9M FY20: Shop LC, $143M; TJC UK, GBP 46.1M.
Key Growth Drivers in FY20:• Shop LC (the U.S.) has commenced broadcasting shows on Amazon Live in Q3 FY20. Integrated Pixlee on its Shop LC website for the sharing of user-generated content. Rented an additional warehouse, to cater to the growing lifestyle seg-ment at Shop LC, U.S. in H1 FY20. Shop LC, U.S., launched new brands across product categories – Hate Stain, Nemo,
EZ-Yogurt, in the home products category, Hollywood Browzer in the beauty products category, etc.
• TJC (the U.K.) shopping app launched on the Apple store for iPad. TJC HD channel launched on the Freeview platform in the U.K. TJC, U.K., launched new brands across product categories – Isabella Liu (jewelry), La Roc (beauty products), Banana Republic Fragrances (perfumes), etc. It expanded product offerings under kitchen collection and garden tools categories.
Analyzing from O’Neil Lens:The stock advanced 66% in FY20 till February 28. In the last session of May, it broke out of its 26-week cup-base pattern and rallied 18% to form a long con-solidation base pattern. After breaking out of a flat base, it gained 26% before losing momentum due to the global pandemic. The base formation was ideal, as the volume dried up during the base formation and there was accumulation before the breakout. During the selloff period, the stock declined 54%. The stock retook its 200-DMA in May and found support at it on two occasions, one in October and another in December. During the selloff, it breached its 200-DMA and declined further to make a low of Rs 551.
VAIBHAVGBL

[email protected]©2020 williamoneilindia
Con
sum
er S
tapl
e
Tata Consumer Products
Breakout on heavy volume Good support at 200-DMA

[email protected]©2020 williamoneilindia
Con
sum
er S
tapl
e
Tata Consumer Products is the second-largest player in branded tea in the world, with over 330M servings everyday across the world. Key brands include Tata Tea, Tetley, Vitax, Eight O’Clock Coffee, Himalayan Natural Mineral Water, Tata Coffee Grand, and Joekels. The company has a joint venture with PepsiCo in India, called NaurishCo. It produces and markets Tata Water Plus, Tata Gluco Plus. Consolidated revenue in Q3 FY20 was Rs 19.6B, and PAT was Rs 1.2B. In FY19, branded sales from Tea was 80.8%, coffee was 18.7%, and others 0.5%.
Key Growth Drivers in FY20:• The company opened 28 new Starbucks stores, increasing the total count to 174 and expanded to 10 cities. Tata Star-bucks’ revenue grew 27% y/y in Q3 FY20.
• The company has grown through innovation, strategic alliances and acquisitions, and organic growth. The joint venture it formed with Starbucks in 2012 has spread to 10 cities and aims at many more in the coming quarters. Income levels are steadily increasing in India, and mid-dle-income and high-income households will transform the consumption profile of India.
• According to its management’s conference call for Q3, the merger with Tata Chemicals was in the final stages. It will foray the company into an additional addressable staples market, which has a market size of Rs 770B.
• Himalayan brand grew in terms of both value and volume in Q3 FY20. Tata Water Plus continued to grow with distribution expansion, focus on a betterproduct mix.
• In International markets, it has launched new products aimed at revitalizing the black tea market. Tetley, with its master brand refresh campaign, is aiming to revitalize the tea market in the U.K. In the U.S., its tea brand Good Earth Tea, introduced a range of Ayurveda teas for wellness proposition.
Analyzing from O’Neil Lens:The stock has gained 66% in FY20 till February 28. It had lost heavily in 2018 and retook its 200-DMA in May 2019. Since then, there has been an upward trend in the stock price movement. It formed an eight-week cup-with-handle base pattern in July-August. During the base formation, volumes dried up. After breaking out of the base pattern, it rallied nearly 50% before succumbing to a global sell-off. During the sell-off, it corrected ~48%. 50-DMA is a crucial level for the stock. It advanced with the uptrending 50-DMA. The stock had a 63% increase in the number of funds holding the stock.
TATACONSUM

[email protected]©2020 williamoneilindia
Con
sum
er C
yclic
al
Relaxo Footwear
Breakout on heavy volume
Rally after a breakout
[email protected]©2020 williamoneilindia
Con
sum
er C
yclic
al
Relaxo footwear is the largest footwear manufacturing company in India with nine brands and more than 10,000 SKUs. As of December 2019, it had eight manufacturing plants and 385 exclusive brand outlets. It has nine brands, major brands include sparx, boston, flite, Bahamas, and Mary Jane. As of Q3 FY20 end, its revenue from operations was Rs 600 crore and PAT came in at Rs 54 crore. It set up its eighth plant in Rajasthan and merged with ‘RRPL’ and ‘MPPL’ com-panies.
Key Growth Drivers in FY20:• There is a strong growth potential for the footwear industry in India. India is the second largest manufacturer, and accounts for 9% of the global market. However, India exports only 10% of its production, and forms only 2% of global exports, versus China’s share of 40%. India is an underpenetrated market, as per capita consumption is at ~1.7 pairs per annum, against a global average of three pairs. Thus, there is ample room for growth of footwear companies in India.
• Footwear evolved from being a necessity to a fashion accessory as growing urbanization and increased brand awareness among consumers contributed to changing consumer preferences. Relaxo took the lead to bring out innovative models to meet such changes in consumer demand and buying behavior.
• Relaxo is the market leader in the value segment. It has a structured market research program to evaluate the ever-changing consumer behavior and innovate its products accordingly. Of its product portfolio, ~20% is restyled every year.
• The company has eight robust in-house manufacturing facilities in India with a combined capacity of ~7.5lakh pair/day. It primarily focuses on optimizing operations without compromising on productivity. Its facilities have a dedicated line for manufacturing fast moving SKUs. Its focus on cost optimization helps in better pricing.
Analyzing from O’Neil Lens:The stock gained 71% in FY20 till February 28. It then formed two back-to-back cup base patterns spread across ~19 weeks. After its breakout in September, it rallied 26% and formed an uptrend cup-with-handle base pattern. The base formation was ideal, as volume dried up during the formation. Prior to breakout, there was accumulation as well, again a strong indicator of bullishness. It advanced 33% from the breakout before succumbing to global sell-off caused by the COVID-19 pandemic. It had corrected about 40% during the selloff period.
RELAXO

[email protected]©2020 williamoneilindia
Con
sum
er C
yclic
al
Orient Electric
Breakout on heavy volume
Power-to-Pivot
Good support at 200-DMA

[email protected]©2020 williamoneilindia
Con
sum
er C
yclic
al
Orient Electric is a leading consumer durable company in India. It is a part of the CK Birla group. Its products include fans, home appliances, lighting, and switchgear. It has operations spread out across 35 countries. It is the leading man-ufacturer and exporter of fans in India, with a share of more than 60% in exports. As of Q3 FY20 end, the company’s revenue by segments: electric consumer durables, 65%; lightings & switchgear, 35%.
Key Growth Drivers in FY20:• Orient’s EBITDA for 9M FY20 grew at 68% y/y. Gross margins for Q3 expanded 270bps. Sales strategy includes a favorable sales mix of premium and decorative fans, and increased demand for room heaters and water heaters enabled an expansion in its gross margins.
• Despite sluggish economic weather, Orient Electric grew at an aggregate growth of 18% y/y during the third quarter, and 22% on a year-to-date basis. The initial part of the quarter was affected by the demand contraction; however, strong seasonal pull for water heaters, chan-nel fill-up pre-season on fans & coolers, and P-Lum businesses, including street lighting, fueled growth momentum during the quarter.
• The company has come up with new launches, such as the luxury series of fans with the launch of the “Eleganza” brand, Smart Plugs, and Salus Bloom Switches.
• Profitability improved in Q3 as gross margins expanded and increase in operating efficiency. In addition, there was an interest reduction in the quarter, thus net profit grew 64% y/y for Q3.
• It launched “e-wings” a digitization project to migrate to SAP S4 HANA in a record time of four months. This is aimed to improve work culture and has set benchmark for other digital projects.
Analyzing from O’Neil Lens:Orient Electric had gained 68% in FY20 till February 28. For most of the year, it traded in a flat base. Following a brief rally after a breakout, it formed a cup base pattern. It hit the power to pivot and rallied 32% from the cup base before a global sell-off hit the stock price. The base formation was ideal, as the volume dried up during the base formation and there was accumulation before the breakout. It corrected almost 50% of its share price. 200-DMA is a critical level to watch out for the stock. It has given good support for the stock throughout the year. However, due to a global selloff, the stock breached its support levels.
ORIENTELEC

[email protected]©2020 williamoneilindia
Con
sum
er C
yclic
al
Amber Enterprises India
Rally after a breakout
Formed a stage-one flat base onlow volume and tight range Closed in the bottom half after making
a new high and breaching its 50-DMA

[email protected]©2020 williamoneilindia
Con
sum
er C
yclic
al
Amber Enterprises provides solutions for the original equipment manufacturer (OEM) and original design manufacturer (ODM) industries in India. It manufactures a comprehensive range of solutions for room air conditioners (RACs), indoor units (IDUs), outdoor units (ODUs), split and window air conditioners (SAC and WAC) industries. The company manufac-tures components like heat exchangers, sheet metal components, injection molding components, and system tubing and motors. It has 10 manufacturing facilities across India, focusing on various product segments. The company’s customers include market leaders in the cooling segment like Blue Star, Daikin, Hitachi, Godrej, LG, and Carrier.
Key Growth Drivers in FY20:• The stock price had a decent uptrend in Q3 FY20 after the company reported robust consolidated business with a strong 89% y/y revenue growth in H1 FY20. Volume grew 127% y/y in H1 FY20, driven by customer additions and higher demand from existing players. Also, increasing trend shift to domestic sourcing has been a booster to the company.
• During H1 FY20, the company added new clients like Samsung, Toshiba, Livpure and ramped up its production for Flipkart and Amazon. This improved inves-tor sentiment for the stock as the consensus indicated high growth over the next three-four quarters.
• Sidwal, a subsidiary of Amber that provides solutions for AC’s for Indian Railways and Metros, has very good growth opportunities due to new metro rail proj-ects and increasing AC coaches in Indian Railways. In Q2 FY20, the company bagged an order worth Rs 170 crore from BEML for Mumbai Metro. The execution of this order is likely in FY21 and FY22.
• Higher overall industry growth has attracted investment in Amber. In H1 FY20, the cooling industry grew 15–17% y/y. Leading customers of Amber like Pana-sonic grew ~40% y/y in H1 FY20. Panasonic is among the top three customers and contributes ~15% to revenue.
• In H1 FY20, the company started supply of components to various export markets like Sri Lanka, Bangladesh, the U.S., and Nigeria. Management is optimis-tic that export can be a huge potential market going forward on a long-term basis due to a shift in customer preference from China to other places to reduce dependency.
Analyzing from O’Neil Lens:The stock went up 63% in FY20 till February 28. It moved sideways for most of H1 FY20 and made a flat base. The stock advanced 70% after the breakout. The flat base formation was very constructive. The depth was less than 15%, with tighter areas and declining volume. After progressing well, the stock was not able to hold gains on an intraday basis in the first half of February and started closing in the lower half of the day’s range. Later, the stock breached its 21- and 50-DMA, giving a sell signal before the stock corrected more than 35% during the recent market correction.
AMBER

[email protected]©2020 williamoneilindia
Con
sum
er C
yclic
al
Dixon Technologies
Failed breakout afterdouble-bottom formation
Breached its 21- and 50-DMA on high volume
Rally after a breakout
Consolidation base formed on low volume

[email protected]©2020 williamoneilindia
Con
sum
er C
yclic
al
Dixon Technologies is the leading player in electronic services manufacturing (EMS) space in India with diversified prod-ucts in various sub-segments of the electronics vertical. The company offers cost-effective consumer products in India through leading domestic as well as global retail brands. The six main divisions are Consumer Electronics, Home appli-ances, Lighting Solution, Mobile phones, Security Devices, and reverse logistics. Consumer electronics contribute 48% of total revenue (in 9M FY20), while lighting products contribute 25%. Dixon produces various products from Voltas, Sam-sung, Xiaomi, Wipro, Croma, and many others.
Key Growth Drivers in FY20:• In FY20, investors took the new tie-ups positively. The company started the production of Samsung’s feature mobile phones, LED TV’s, semi-automatic washing machines for Voltas, and the entire range of lighting products of HPL Electric & Power. Also, in addition to an order worth Rs 50 crore toward set-top boxes from Reliance Jio, Dixon received an order
to manufacture inhouse white goods brands for Flipkart and Croma. Along with good visibility of growth, the company envisages incurring capex of more than Rs 90 crore in Q4 FY20 and FY21 through its internal accruals.
• The major rally that began in August 2019 was mainly due to the strong performance in Q1 FY20 and a positive outlook for the rest of the year. For H1 FY20, the company had registered a strong revenue growth of 90% y/y. The growth was driven majorly by new customers, including large players such as Xiao-mi, Samsung. Higher growth in H1 FY20 was due to the consumer electronics segment (+114% y/y), mobile phones (146% y/y), and lighting (+60% y/y).
• The company can produce 2 crore LED bulbs every year, which is ~50% of the domestic market. It is also developing smart LED and emergency bulbs for large brands like Havells and Wipro Lightening. In 9M FY20, it has increased the capacity for battens to 8 lakh per month from 2.5 lakh per month y/y. The domestic market demand is ~50 lakh per month, and Dixon has plans to increase capacity to 15 lakh per month in FY21.
Analyzing from O’Neil Lens:The stock went up 60% in FY20 till February 28. It formed a stage-one consolidation in May-August, and after the breakout, it progressed more than 70% in four months. The RS line was trending upward, and A/D Rating remained high, showing good accumulation. Also, in Q3 FY20, a 40% y/y increase in the number of funds holding the stock indicated a large investment from institutional investors. It continuously traded above its 21- and 50-DMA. However, in the second half of February, it breached 21- and 50-DMA within a week on high volume. It was a strong sell signal before the stock corrected more than 40% during the recent market correction. The good part is that the stock is holding its 200-DMA and the pivot of its previous base. EPS Rank of 97 is strong, and with the upside rever-sal, technical ratings have also improved.
DIXON

[email protected]©2020 williamoneilindia
Fina
ncia
l
HDFC Asset Management
Rally after breakout
Breached its 10-WMA
Cup-with-handle base formation
Lower volume in the handle
[email protected]©2020 williamoneilindia
Fina
ncia
l
HDFC Asset Management Company Limited (HDFC AMC) is the investment manager to HDFC Mutual Fund, the largest mutual fund in the country. HDFC AMC has a diversified asset class mix across equity and fixed income/others. It also has a countrywide network of branches along with a diversified distribution network comprising banks, independent financial advisors, and national distributors
Key Growth Drivers in FY20:• During 9M FY20, the company reported a 38% y/y surge in PBT to Rs 1,323.4 crore as against Rs 960.1 crore in 9M FY19. Operating profit increased 38% y/y to Rs 1,156.7 crore compared with Rs 839.7 crore for the same period, a year ago. The company reported a PAT of Rs 1,012.5 crore as against Rs 654.4 crore for the same period, a year ago.
• The company reported a QAAUM of Rs 3,825B as of December 31, 2019 as against Rs 3,350B on December 31, 2018. Further, the company acquired 14.3% market share in QAAUM of the mutual fund industry. QAAUM in actively managed equity oriented funds, excluding arbitrage funds and index funds, stood at Rs 1,666B as on December 31, 2019 with a market share of 15.8%. The AMC is the largest actively managed equity-oriented mutual fund manager in the country.
• As of December 31, 2019, individual investors contributed 59.5% of the company’s total monthly average AUM as compared with 53.4% for the industry. Total live accounts stood at 9.4M as on December 31, 2019. Unique customers as identified by PAN or PEKRN stood at 5.5M as on December 31, 2019 compared with 20.3M for the industry. March 2018.
• The ratio of equity oriented AUM and non-equity oriented AUM is 46:54 compared with the industry ratio of 41:59. Further, the company reported 3.42M systematic transactions with a value of Rs 12.2B processed in December 2019. The company has a strong online presence with dedicated separate digital plat-forms distribution partners and customers. Its electronic transactions as a percentage of total transactions stood at 69.1% in 9M FY20 compared with 66.4% for the same period, a year ago.
O’Neil Methodology:The stock advanced 102% in FY20 till February 28. The stock broke out of a cup-with-handle base on the weekly chart in May 2019. It advanced more than 115% after the breakout. The cup-with-handle base formation was very constructive and volume dried up during the handle formation. After progressing well, the stock corrected ~25% and was trading sideways. In the first week of March, the stock decisively breached its 21- and 50-DMA on above average volume. In the recent market correction, the stock has declined more than 35%.
HDFCAMC

[email protected]©2020 williamoneilindia
Fina
ncia
l
ICICI Securities
Upward trending RS line
Breached its 21- and 50-DMA
Flat base formation on lower volume
Rally after breakout

[email protected]©2020 williamoneilindia
Fina
ncia
l
ICICI Securities Ltd. is a technology-based firm offering a wide range of financial services including institutional brok-ing, investment banking, retail broking, financial product distribution, and private wealth management. The company is a subsidiary of ICICI Bank Ltd. and is a market leader in the broking segment, with over 46 lakh trusted customers and more than 8,400 business partners. The company is spread across India through 180+ branches.
Key Growth Drivers in FY20:• During Q3 FY20, the company reported a 4% y/y surge in revenue to Rs 422.7 crore as against Rs 404.7 crore in Q3 FY19. PBT increased 17% y/y to Rs 185.1 crore as compared with Rs 158.1 crore for the same period a year ago. The company reported PAT of Rs 137.2 crore as against Rs 101.2 crore for the same period a year ago.
• The company has been able to generate operational leverage through cost efficiency. Its overall cost was down 4%, driven by 6% decrease in employee cost and 8% decline in non-finance cost.
• ICICI Securities made noteworthy progress in the digital space. The company launched API architecture in September 2019. Further, its digital team evaluat-ed 76 projects and launched an automated portfolio evaluation with held-away assets for clients to view the complete portfolio. The company’s secure, stable technology platform has the capability of withstanding up to 48K peak concurrent users and has an average response time of 24 milliseconds.
• The company has made significant progress in enhancing engagement for client retention and penetration. It recently launched SIP Protect, which made the company figure among the first online distributors to offer such a product. Through this product, investors can get free life insurance cover up to 120x of their SIP investments under 70 Mutual Fund schemes.
• The company witnessed strong growth in margin trading facility and ESOP funding. MTF & ESOP book size as of December 31, 2019 was increased to Rs 11.53B from Rs 6.80B on September 30, 2019 and Rs 4.03B as of March 31, 2019.
Analyzing from O’Neil Lens:The stock went up 97% in FY20 till February 28. During the beginning of FY20, the stock formed a stage-one consolidation base. The base formation was constructive with a depth of 34%. Volume was dried up during the formation of a consolidation base. The stock broke out in September on above average volume. Post the break out, the stock advanced more than 68% with strong support at its 21-DMA. In the first week of March, the stock decisively breached its 21- and 50-DMA, giving a sell signal before correcting more than 50% during the recent market correction.
ISEC

[email protected]©2020 williamoneilindia
Fina
ncia
l
AU Small Finance Bank
Flat base formation
Breached its 21- and 50-DMA
Flat base formation on lower volume
Rally after breakout
[email protected]©2020 williamoneilindia
Fina
ncia
l
AU Small Finance Bank, which started in 1996, is a scheduled commercial bank that successfully transited from an asset financing NBFC to a small finance bank. The bank is retail-focused with a diversified bouquet of products and services. Its target customers include low-and-middle income individuals and micro/small businesses, which are creditworthy and have a business potential but are unable to avail financing from formal channels. The bank currently has 13 lakh active customers. Its distribution network covers 11 states, with 62% of the branches situated in rural and semi-urban areas (tier 2 to tier 6).
Key Growth Drivers in FY20:• During 9M FY20, net interest income grew 42% y/y to Rs 1,748 crore versus Rs 956 crore in 9M FY19. PBT rose 85% y/y to Rs 749 crore whereas PAT grew 110% y/y to Rs 552 crore. Loan AUM grew 37% y/y to Rs 29,867 Crore. Total de-posits book stood at Rs 23,865 crore, up 63% y/y with CASA ratio (excluding Certificate of Deposits)maintained at ~17%.
• Disbursements in the first nine months of FY20 increased 23% y/y, mainly led by all retail assets including used vehicles, SBL MSME, small ticket business banking, agri SME loans, and de-growth in small and mid-corporate assets. Share of retail loans in the loans disbursed increased ~11% to ~82% in 9M FY20 from 71% in 9M FY19.
• The company is adequately capitalized with a CRAR of 19.3% and Tier 1 Ratio of 16.5%. Net worth advanced ~40% y/y to Rs 4,237 crore. Further, the com-pany’s liquidity position continued to remain strong with higher LCR at ~95% in Q3 FY20 as against regulatory requirement of 80% for SFBs.
• The bank has been able to keep gross NPA around 2% historically, which is a testament to the company’s stable asset quality. Gross NPA in Q3 FY20 im-proved to 1.88% as against 2.01% on September 30, 2019 and 2.09% on December 31, 2018. Similarly, net NPA improved to 1.01% as of December 31, 2019 as against 1.14% on September 30, 2019. Provision Coverage Ratio is higher at 46.8%. The bank has more than 95% secured book, a key factor for a contained overall credit cost.
Analysis from O’Neil Lens:The stock rose 97% in FY20 till February 28. It moved sideways during H1 FY20 and made a flat base. After breaking out from this base, it again moved side-ways. In December-January, it formed a base-on-base. The stock advanced more than 35% after the breakout. After progressing well, it was seen that in the first and second week of March, the stock breached its 21- and 50-DMA. In the recent market correction, the stock has declined more than 50%.
AUBANK

[email protected]©2020 williamoneilindia
Fina
ncia
l
Nippon Life India Asset Management
Cup base formation
Breached its 21- and 50-DMA
Flat base formation on lower volume
Rally after breakout

[email protected]©2020 williamoneilindia
Fina
ncia
l
Nippon Life Asset Management is one of the largest asset managers in India, with 24 years of track record. The company covers 270 locations, with around 1,050 employees and 76,000 distributors. On October 7, 2019, the company was re-named as Nippon Indian Mutual Fund, which was named earlier as Reliance Mutual Fund. Following the transaction, over 170 institutional investors were activated in Q3 FY20. The company’s AUM as of December 2019 stood at Rs 3.10T.
Key Growth Drivers in FY20:• During 9M FY20, the company reported a 9% y/y surge in PBT, which rose to Rs 532.5 crore versus Rs 488.2 crore in 9M FY19. Core operating profit increased 12.4% y/y to Rs 417.3 crore, compared with Rs 371.1 crore in the year-ago period. The company reported a PAT of Rs 411.5 crore versus Rs 335 crore in the year-ago period.
• SIP book as of December 2019 stood at Rs 8.98B, compared with Rs 8.42B as of December 2018. The average tick-et size stood at Rs 2,580, compared with the industry average of Rs 2,850. Further, more than 80% of incremental SIPs have a tenure of 5+ years. Further, the company’s retail AAUM stood at Rs 546B in Q3 FY20. The company’s NIMF Equity Assets (including ETF) grew 9% y/y to Rs 1,119B during Q3 FY20, versus Rs 1,027B for the same period, a year ago.
• The company has a strong distribution network and impaneled more than 600 new distributors in Q3 FY20 with a total base of ~76,000. Further, the compa-ny has more than 75,000 independent financial advisors (IFA). In the distribution mix, IFA contributes the highest of 55%, followed by banking distributors and national distributors, which account for 25% and 20%, respectively. Moreover, the company has de-risked a distribution model with no single distributor contrib-uting more than 5.3% of AUM.
• The company’s digital purchase posted a double-digit growth of 38% to 1.1M in FYTD 19–20, versus 0.8M in FYTD 18–19. Digital lump-sum purchase transactions grew 32% y/y, whereas the digital contribution toward total NIMF business transactions crossed more than 40%. Further, new digital SIP registrations advanced 27% y/y.
Analyzing from O’Neil Lens:The stock went up 93% in FY20 till February 28. During the June-July of FY20, the stock had formed a stage-two cup base. Following the breakout, the stock advanced more than 54% with strong support at the 21-DMA. Then, it moved sideways during the December-January and formed a flat base. The depth of the base was about 16%. The stock gained 17% after the breakout before correcting toward the 21-DMA. In the first week of March, the stock decisively breached its 21- and 50-DMA, giving a sell signal before the stock corrected more than 40% during the recent market correction.
NAM-INDIA

[email protected]©2020 williamoneilindia
Con
sum
er C
yclic
al
Mishra Dhatu Nigam
Breakout on heavy volume
Power-to-Pivot
Trading in a narrow range,fall on lower volumes

[email protected]©2020 williamoneilindia
Fina
ncia
l
The production unit of Mishra Dhatu Nigam Limited (MIDHANI), located at Kanchanbagh, Hyderabad, was commissioned in 1982. It produces and supplies various super alloys, special steels, and materials to strategic sectors.
Products: Special steel (Ferritic, Austenitic, Martensitic, Maraging, and Armour steel), super alloys (Iron/Cobalt/Nick-el-based), and titanium alloys in the form of melted, forged, rolled, and drawn products. Special steels and titanium alloy grades constitute a major portion of production tonnage.
Key Growth Drivers in FY20:• MIDHANI is likely to evolve into a multi-unit organization from a single-unit organization. The Armour Manufacturing facility at Rohtak is expected to be commissioned by the end of FY20. MIDHANI’s JV proposal with NALCO, to set up Alu-minum Alloy Plant at Nellore, is also moving on the right track with respect to government approvals. It is also exploring
to set up Tungsten and Tungsten Carbide Powder Production Facility to produce 500TPA tungsten powder.
• India’s GDP has been consistently growing at a rate of 6–8%, which poses ample opportunities in power and industrial sectors and advancements in the space sector. To cater to the needs of enhanced demands, MIDHANI has been formulating new strategies and augmenting its facilities.
• Over 70% of MIDHANI’s products (value wise) cater to strategic customers and operates mainly in defense, space, energy, and commercial sectors. About 50% of orders come from the defense sector. The space sector has shown cyclical nature in terms of order positions.
Analysis from O’Neil Lens:The stock advanced 73% in FY20 till February 28. Till October 2019, it traded in a narrow range near its 50- and 200-DMA. It formed a 14-week flat base starting from November 2019 and hit power-to-pivot after the breakout in February. The breakout was aided by the volume at 8.9x the average volume on the day of breakout. However, due to the global selloff, the stock succumbed to selling pressure and lost ~52%. Owing to its price-volume action, it has a strong RS Rating of 97. Number of funds invested in the stock increased 20%, which is a good indicator of strong demand.
MIDHANI

[email protected]©2020 williamoneilindia
Fina
ncia
l
CreditAccess Grameen
Hits power to pivot afterbreakout from a flat base
Consolidation base formation
Breached its 50-DMA on high volume

[email protected]©2020 williamoneilindia
Fina
ncia
l
CreditAccess Grameen is a microfinance institution that caters to the evolving financial needs of low-income households in India. The company serves around 2.47M women borrowers through 670 branches across eight states and one union territory, with 8,000+ employees. The company provides loans primarily under the joint liability group (JLG) model. It also provides other categories of loans, such as family welfare loans, home improvement loans, and emergency loans to the existing customers.
Key Growth Drivers in FY20:• The stock progressed well after the acquisition of Madura Micro Finance Limited (MMFL), as it can strengthen the com-pany’s leadership position in the microfinance market. In H1 FY20, the company had announced its plan to acquire a 76.2% stake in MMFL. It focuses on providing microfinance loans to rural women with a customer base of 11.1 Lakh, GLP of Rs 2,053 crores. The amalgamation would lead to a geographical diversification of the company’s portfolio and will
strengthen its leadership position in the microfinance market. The company will have a combined portfolio of approximately Rs. 10,000 crores.
• The company has witnessed a continuous uptrend in loan disbursements over the last three financial years and has clocked a CAGR of 44.3% for the period FY15–FY19. Further, the company has shown a robust sustained operational performance. The opex/GLP ratio has witnessed a consistent decline over the last five financial years. The opex/GLP ratio stood at 5% in FY19 versus 6.9% in FY15. Similarly, the cost/income ratio has improved significantly to 33.9% in FY19 from 46% in FY15.
• A healthy liquidity position was positive for the stock as it can easily meet its obligation and cater to growth requirements. The company is sitting with cash and cash equivalents of Rs 973.2 crores as of Q3 FY20. Further, the company has diversified funding sources with a balanced mix of domestic and foreign sources (all are term loans). Also, there are no commercial papers as well as no bonds/NCDs from mutual funds. There is a ~2% exposure to NBFCs. Moreover, the company has Rs. 2,354 crores (Banks and FIs) month on month positive static liquidity gap funds in the pipeline.
Analyzing from O’Neil Lens:The stock went up 60% in FY20 till February 28. It formed four base patterns during FY20. The breakout from a stage-2(a) consolidation in June failed, and it formed a stage-2(b) consolidation base in July-August. After the breakout, it moved sideways and formed a base-on-base flat base. This type of base is consid-ered constructive, and the stock hit the power-to-pivot after the breakout. In December-January, a cup base was formed, and after the breakout, it progressed well. However, in March, it breached 21- and 50-DMA on high volume. It was a strong sell signal before the stock corrected more than 60% during the recent market correction. Though EPS Rank of 91 is strong, technical damage is severe and can take time to repair.
CREDITACC

[email protected]©2020 williamoneilindia
Fina
ncia
l
Aavas Financiers
Moved sideways after breakoutfrom a stage-three flat base
Breached its 50-DMA on high volume

[email protected]©2020 williamoneilindia
Fina
ncia
l
Aavas Financiers, regulated by the National Housing Bank, focuses on providing housing loans to customers belonging to the low- and middle-income segments in semi-urban and rural areas. It operates in ten states in India with a retail network of 245 branches. Of its two key products, home loans contribute 75% and other mortgage loans 25% to the total product category. The average ticket size for non-housing loans is about Rs 7.5 lakhs, which is significantly lower com-pared with other industry players.
Key Growth Drivers in FY20:• The company operates in a niche segment without any threat from big players. It caters to the informal income segment and the majority of its customers are from low- and middle-income groups with limited access to a formal credit system.
• The company had a robust liquidity position. Before showing a decent uptrend in its stock price during Q3 FY20, it reported Rs 1,050 crore in cash & cash equivalents and another Rs 902 crore of unavailed sanctions, as of September 30. Further, collection from assets was much higher than the repayment obligation, with zero ALM gaps. Moreover, the company holds Rs 2,316 crore of surplus funds without including any incremen-tal borrowings.
• Support from the government and the regulator had boosted demand and this is expected to continue in the future. The National Housing Bank has an-nounced additional liquidity support of Rs 0.3 lakh crore to HFCs to make fund flow easier in the housing sector. In addition, the RBI has doubled the limit of bank lending for on-lending by both NBFCs and HFCs to Rs 20 lakh per borrower from the Rs 10 lakh set earlier. In the last fiscal, the government has subsi-dized interest (between Rs 2.2 lakh and Rs 2.7 lakh) for first-time homebuyers with annual income up to Rs 18 lakh.
• Healthy asset quality has helped the company attract investors. GNPAs have been consistently maintained below 1% over the last eight quarters. It stood at 0.62% and 0.57% in Q2 and Q3 FY20, respectively. Apart from that, the company, over the years, has been able to maintain the spread between yield and cost of borrowing at about 5% and is hopeful of keeping this spread on futures too.
Analyzing from O’Neil Lens:The stock went up 62% in FY20 till February 28. It made a flat base in April and hit power to pivot after the breakout. After progressing well, it made a stage-three flat base in July and gave decent returns. The stock was added to the MSI portfolio in Q3 FY20 and we booked a profit of 25% in less than two months. In February, the stock breached its 50-DMA, followed by an upside reversal on low volume. This was a strong sell signal before the stock corrected more than 50% during the recent market correction. Though its technical ratings have deteriorated, the stock still has the best EPS Rank of 99.
AAVAS

[email protected]©2020 williamoneilindia
Fina
ncia
l
Multi Cmod.Ex.Of India
Cup-with-handle base formation
Breached its 21- and 50-DMA
Rally after a breakout
Flat base formation on low volume

[email protected]©2020 williamoneilindia
Fina
ncia
l
Multi Commodity Exchange of India Ltd. (MCX) is a commodity derivatives exchange that facilitates the online trading of commodities. The exchange started operations in 2003 and offers trading in commodity derivative contracts, including bullion, industrial metals, energy, and agricultural commodities. It also provides clearance services through its subsidiary, Multi Commodity Exchange Clearing Corporation Ltd. MCX is the market leader with more than 90% share in the com-modity derivatives markets.
Key Growth Drivers in FY20:• The stock progressed well after its stellar performance across segments in Q1 and Q2 FY20. The half-yearly average daily turnover (ADT) stood at Rs 31,055 crore, surpassing the Rs 30,000 crore mark in FY13–FY14. Gold contracts made a new record with 5.2MT (valued at Rs 1,821 crore) delivery in August 2019 contracts, breaking the previous record of 5.05MT in October 2009. Crude oil futures contract sales made a life-time high of Rs 26,622 crore on September 17,
2019. Further, cotton contracts ended the crop season (October 2018–August 2019) with record delivery of 3.98 lakh bales, which was 119% higher compared with 1.82 lakh bales for the same period last year.
• The company’s market share is increasing and is unaffected by increasing competition from leading exchanges such as NSE and BSE. Last year, NSE and BSE also started facilitating the trading of commodities. In H1 FY20, its market share increased to 92.87%.
• Regulatory reforms acted as a key tailwind for investors’ interest in the stock. SEBI had given a green signal to institutional investors such as portfolio manag-ers (PMS) and mutual funds to participate in exchange-traded commodity derivatives. PMS can take part in exchange-traded commodity derivatives on behalf of their clients. This increased the trading volume, provided liquidity, and increased the depth of the far month’s contract. This may continue to benefit MCX.
• EBIDTA margin, excluding other income, started ascending to 47% in H1 FY20 from 34% y/y. This is mainly due to reduced expenses on account of a license fee that the company used to pay to the London Metal Exchange. The license fee was eliminated when the metal contract matured in Q2 FY20. Growth in EBIT-DA margins resulted in good operating leverage for the company.
Analyzing from O’Neil Lens:The stock went up 60% in FY20 till February 28. It progressed more than 40% after breaking out from a cup-with-handle base in June 2019. The stock consoli-dated gains in November–December 2019, forming a flat base. Volume dried during base formation and its 50-DMA was not breached. This is an ideal forma-tion. After making an all-time high in January, the stock moved sideways and breached its 50-DMA, giving a sell signal before correcting more than 40% during the recent market correction. The stock still has good EPS Rank of 84 and its RS Rating has improved to 85 after an upside reversal in the last couple of weeks.
MCX

[email protected]©2020 williamoneilindia
Tech
nolo
gy
Bharti Airtel
Breakout on heavy volume
During base formation,volume was lower
Good support at 200-DMA

[email protected]©2020 williamoneilindia
Tech
nolo
gy
Bharti Airtel is a global telecom company with operations across 18 countries in Asia and Africa. It ranks third in the list of mobile service providers worldwide. In India, the company’s product offerings include 2G, 3G, and 4G wireless services, mobile commerce, fixed line services, high-speed home broadband, DTH, and enterprise services including national and international long-distance services to carriers. As of Q3 end, it had a worldwide customer base of 418M. Its customer base by region: India, 308M; Africa, 107M; South Asia, 3M.
Key Growth Drivers in FY20:• ARPU may rise to Rs 200 in the next few months, which will help recover the cost of capital. ARPU of Rs 300 is needed for reasonable RoCE of 15%. The rise is mainly on the back of increased tariff on both prepaid and postpaid plans. The company believes that its customers are fine with the tariff hike.
• Customers upgrading to 4G has also helped increase the company’s revenue. 4G ARPU is typically Rs 65–70 higher than that of 2G.
• To gain market share and cater to the ever-growing demand for data, Airtel plans to increase its capex to enhance coverage and capacity.
• Airtel added 12K towers in 9M FY20. The company is planning to add some more towers in FY21, especially in rural areas. It has a total of ~190K towers and almost all are enabled with 4G.
• In Q3 FY20, mobile data consumption grew 72% y/y to 5,166 PBs. The quarter also saw the highest ever net additions (~21M) of 4G data users. Its competi-tor Vodafone Idea is under pressure due to debt and AGR dues. Airtel and Jio stand to gain from Vodafone’s crisis.
Analyzing from O’Neil Lens:The stock advanced 67% in FY20 till February 28. It traded in a flat base for most part of H1. Its gains were observed post breakout in October. It advanced 28% post breakout from a flat base and formed a cup base pattern. Breaking out from the cup pattern yielded another 16% in gains. Later, it succumbed to the global selloff. It corrected about 36% in the selloff period. 200-DMA is a crucial level for the stock. It never closed below its 200-DMA in FY20 before the global selloff. Even during the selloff, it quickly retook that level. Institutional sponsorship for the stock improved ~17% in terms of the number of funds invested in the stock.
BHARTIARTL

[email protected]©2020 williamoneilindia
Leis
ure-
Prod
ucts
Gujarat Gas
Cup-with-handle base formation
Breached its 21- and 50-DMA
Volume dried up during handle formation
Rally after breakout

[email protected]©2020 williamoneilindia
Util
ity
Gujarat Gas holds the leadership position as the largest city gas distribution (CGD) company in the country catering to more than 13.5 lakh residential consumers and over 12,300 commercial customers. It has 344 CNG stations for vehicu-lar consumers and provides clean energy solutions to over 3,500 industrial units through its widespread operations with around 23,200 kilometers of Natural Gas pipeline network.
Key Growth Drivers in FY20:• During 9M FY20, the company reported a 130% y/y surge in PBT to Rs 884.7 crore. Revenue increased 27.93% y/y to Rs 7,804 crore. The company reported a PAT of Rs 948 crore as against Rs 305 crore for the same period, a year ago. Total volume grew 40% y/y to 9.34mmscmd in Q2 FY20, largely led by a boom in the industrial volume that grew 56% y/y to 7.21mmscmd.
• The National Green Tribunal ordered the closure of all coal using ceramic units in Morbi, the largest tiles manufacturing zone in India. Gujarat Gas, being the sole supplier of the natural gas in the area, benefited from this move. The industrial sales volume in Morbi started increasing from mid-March and continued to increase later during FY20.
• Indian government has set an aggressive target to elevate the contribution of natural gas in the overall consumption mix to 15% by 2022. Being a market leader, Gujarat Gas is expected to gain the most from it. The company was able to acquire seven new geographical areas in the 9th and 10th CGD Bid round. This has helped the company expand its network in Rajasthan, Punjab, Haryana, and Madhya Pradesh.
• Capex for H1 FY20 was Rs 275 crore, reflecting management’s positive outlook on expansion and growth in various projects. Its free cash flow till H1 FY20 was Rs 420 crore.
• The company enjoys double-digit market share across all its segments in the Indian CGD market. It has the highest market share of about 47% in commercial connections followed by industrial connections where the company accounts for about 44% market share in industrial connections. Further, management has always kept an aggressive stance on penetrating in the comparatively stable PNG (domestic), PNG (commercial), and CNG (transport) sectors.
Analysis from O’Neil Lens:The stock advanced 90% in FY20 till February 28. In June-July 2019, it formed a cup-with-handle base. The stock advanced more than 65% after the breakout. The cup-with-handle base formation was very constructive but volume dried up during handle formation. The stock hovered around its 21-DMA during the last half of February. In the second week of March, the stock decisively breached its 50-DMA on above average volume and corrected more than 20% in the recent market correction.
GUJGASLTD

[email protected]©2020 williamoneilindia
IndexSector NameFY20 gain (till Feb 28)Company Industry Group
Energy
Capital Equipment
Health Care
Retail
Financial
Basic Material
Financial
Financial
Financial
Utility
Basic Material
Basic Material
Financial
Basic Material
Consumer Cyclical
Basic Material
Consumer Cyclical
Technology
Retail
Consumer Staple
Adani Green Energy
Gmm Pfaudler Ltd
Abbott India Ltd.
Trent Ltd.
Hdfc Amc
Navin Fluorine Inter
Icici Securities
Au Small Finance Ban
Nippon Lifeam Ltd.
Gujarat Gas
Alkyl Amines Che
Mas Financial Servic
Mishra Dhatu Nig
Berger Paints
Relaxo Footwears
Deepak Nitrite
Orient Electric
Bharti Airtel
Vaibhav Global
Tata Consumer Produc
Energy-Alternative/Other
Machinery-Gen Industrial
Medical-Diversified
Retail-Department Stores
Finance-Investment Mgmt
Chemicals-Specialty
Finance-Invest Bnk/Bkrs
Banks-Money Center
Finance-ETF / ETN
Utility-Gas Distribution
Chemicals-Specialty
Steel-Producers
Finance-Consumer Loans
Chemicals-Paints
Apparel-Shoes & Rel Mfg
Chemicals-Specialty
Hsehold-Appliances/Wares
Telecom Svcs-Wireless
Retail/Whlsle-Jewelry
Beverages-Non-Alcoholic
300%
126%
115%
106%
102%
100%
97%
97%
93%
90%
81%
75%
73%
72%
71%
70%
68%
67%
66%
66%
FY 20 gain (Full year)
296%
105%
112%
35%
36%
71%
14%
-14%
23%
59%
44%
-7%
27%
54%
55%
40%
29%
44%
20%
45%

[email protected]©2020 williamoneilindia
Sector NameFY20 gain % (till Feb 28)Company Industry Group
Basic Material
Basic Material
Basic Material
Basic Material
Financial
Consumer Cyclical
Financial
Capital Equipment
Consumer Cyclical
Financial
Srf Ltd.
Bharat Rasayan
Fine Organic Indus
Jk Cement
Creditaccess Grameen
Amber Enterprises
Aavas Financiers
Timken India Ltd
Dixon Technologies
Mcx
Chemicals-Specialty
Chemicals-Agricultural
Chemicals-Specialty
Bldg-Cement/Concrt/Ag
Finance-Consumer Loans
Hsehold-Appliances/Wares
Finance-Consumer Loans
Machinery-Tools & Rel
Hsehold-Appliances/Wares
Financial Svcs-Specialty
65%
65%
65%
63%
63%
63%
62%
62%
61%
59%
FY 20 gain Full year
16%
255%
54%
6%
-32%
50%
3%
31%
52%
40%

[email protected]©2020 williamoneilindia
World’s Most PreferredStock research AppMarketSmith India is a comprehensive stock research platform tailored for Indian Markets, that gives you a powerful combination of data, tools and education you need to uncover the market’s best-performing stocks.
MarketSmith India is a comprehensive stock research platform tailored for Indian Markets, that gives you a powerful combination of data, tools and education you need to uncover the market’s best-performing stocks.
It uses CAN SLIM Investing System a proven seven step process for minimizing risks and maximising gains. It is based on William O’Neil’s major study of market winners in every market cycle and top performing stocks since 1880s.
A blend of fundamental, behavioural and technical analysis. CAN SLIM has been successful across the globe. as per American Association of Individual Investors, it has delivered CAGR returns of 22.5% since 1963. The App uses Big Data and Artificial Intelligence to provide Stock Recommendations.
Over the past 30 years, O’Neil has shared stock market wisdom through his best-seller “How to Make Money in Stocks”, financial newspaper Investor’s Business Daily (IBD), and stock market tool MarketSmith.
www.marketsmithindia.com

[email protected]©2020 williamoneilindia
SWINGTraderIndia
SWINGTrader India is a product that applies the rules of William O Neil’s CAN SLIM Investing System in a swing trading environment to help you take advantage of short term trends.
SwingTrader India combines fundamental analysis with technical analysis to increase your potential for success.
You can scan the list in a couple of minutes to determine if action is required. height.
With your subscription, you’ll get email alerts and push notifications to keep you up to speed on the action.
We go for quick hits. Most trades will have a goal of about 7% on the upside and limit risk on the downside with a stop loss around 3%.
Best Platform for Short Term Trading Calls
www.swingtraderindia.com

[email protected]©2020 williamoneilindia
The Most Preferred Institutional Stock Research ToolThe most efficient tool used by Fund Managers, Globally for track-ing Stock markets, with visual features that simplify your equity and sector analysis and streamline your research
PANARAY is designed to think like you do, using your unique investing style to cut through market noise and focus in on the best ideas. PANARAY’s visual dis-play brings together all the relevant stock information you need to make smart investing decisions so you can discover alpha-generating ideas, analyze stocks efficiently, easily monitor your watch lists and portfolio, or make your team more productive and efficient. PANARAY is available for your desktop and iOS mobile device, and user content is synced across platforms.
Clear and dynamic visual display of fundamental and technical data for 70k global equities, funds, and indices across over 70 countries
Sector rotation graphic zeros in on emerging trends
Filter on fundamental or technical criteria
Preset lists based on trending themes and our proprietary factors
www.panaray.com

[email protected]©2020 williamoneilindia
AI powered Smart Investment & Trading Ideas
Provides algorithmic dynamics to find the right market pattern
It uses both Fundamental and Technical information to give you an intelligent investment advice
It uses years of stock market expertise and technology to understand the market and advise
AlgoSmith, an investing service from William O’Neil India, is designed to help Inves-tors to invest in Indian Stock Market by providing the right set of investment advises based on our proprietary algorithm.
AlgoSmith opens the door for everyone to trade and invest better than professional money managers.
It creates dynamics for finding the right pattern to give you the right set of advisory. Our algorithms and robots have crunched data of over 100 years of various market cycles in all the markets across the globe, and are now equipped to help you find the most accurate ideas in the stock market.
All you need to do is give an investing mandate to AlgoSmith and it will do the rest to help you make more money in the stock market. It truly is the future!
www.algosmith.in

https://marketsmithindia.com/mstool/#/Secure
MarketSmith India
https://marketsmithindia.com/mstool/#/Secure
MarketSmith India
100%9:00 AM
100%09:00 AM
CONFIRMED UPTREND
The market’s current condition is positive for new buys. Perfect time to buy quality stocks coming out of sound chart patterns.
IDEA LISTSScreen best Stocks
EVALUATIONAnalyze a Stock
MARKET OUTLOOKAnalyze the Market
MODEL PORTFOLIOFollow our Lead
BAJA FINANCE IIFL
BHARATFORGE
COFFEEDAY
TATAELXSI
ESCORTSMore
INDIGO
KOTAKBANK
i
Buy Zone Sell Zone
Buy Watchlist Sell Watchlist
New
View Report
MODEL PORTFOLIO ALERT
View History
Download the App
www.marketsmithindia.com
William O’Neil IndiaA4, 1st Floor, NGEF Industrial Estate, Graphite India Road, Mahadevapura, Bengaluru, Karnataka 560048Phone: 080674 53820/3809www.williamoneilindia.com
/c/MarketSmithIndia
/MSIndiaOfficial
/company/marketsmith-india
/marketsmithind
Follow us on