topic 1: ireland’s long-run economic performance
DESCRIPTION
Topic 1: Ireland’s long-run economic performance. Readings Abel & Bernanke or other macro textbook Chapter on long-run economic growth Solow model and convergence Honohan and Walsh (2002) Blanchard (2002). The Solow Growth Model. Also known as the “neoclassical” growth model - PowerPoint PPT PresentationTRANSCRIPT

Topic 1: Ireland’s long-run Topic 1: Ireland’s long-run economic performanceeconomic performance
ReadingsReadings Abel & Bernanke or other macro Abel & Bernanke or other macro
textbooktextbook Chapter on long-run economic growthChapter on long-run economic growth
Solow model and convergenceSolow model and convergence
Honohan and Walsh (2002)Honohan and Walsh (2002)
Blanchard (2002)Blanchard (2002)

The Solow Growth ModelThe Solow Growth Model
Also known as the “neoclassical” growth modelAlso known as the “neoclassical” growth model
Interactive experiments available at:Interactive experiments available at:
http://www.fgn.unisg.ch/eurmacro/tutor/http://www.fgn.unisg.ch/eurmacro/tutor/solow_index.htmlsolow_index.html
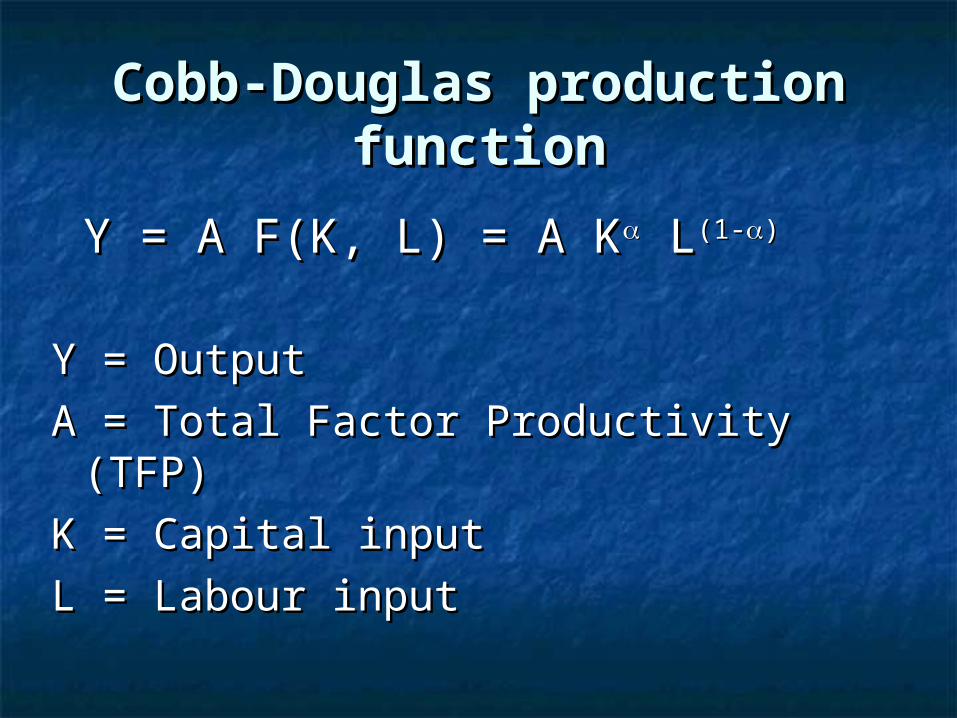
Cobb-Douglas production Cobb-Douglas production functionfunction
Y = A F(K, L) = A KY = A F(K, L) = A K L L(1-(1-))
Y = OutputY = Output
A = Total Factor Productivity (TFP)A = Total Factor Productivity (TFP)
K = Capital inputK = Capital input
L = Labour inputL = Labour input
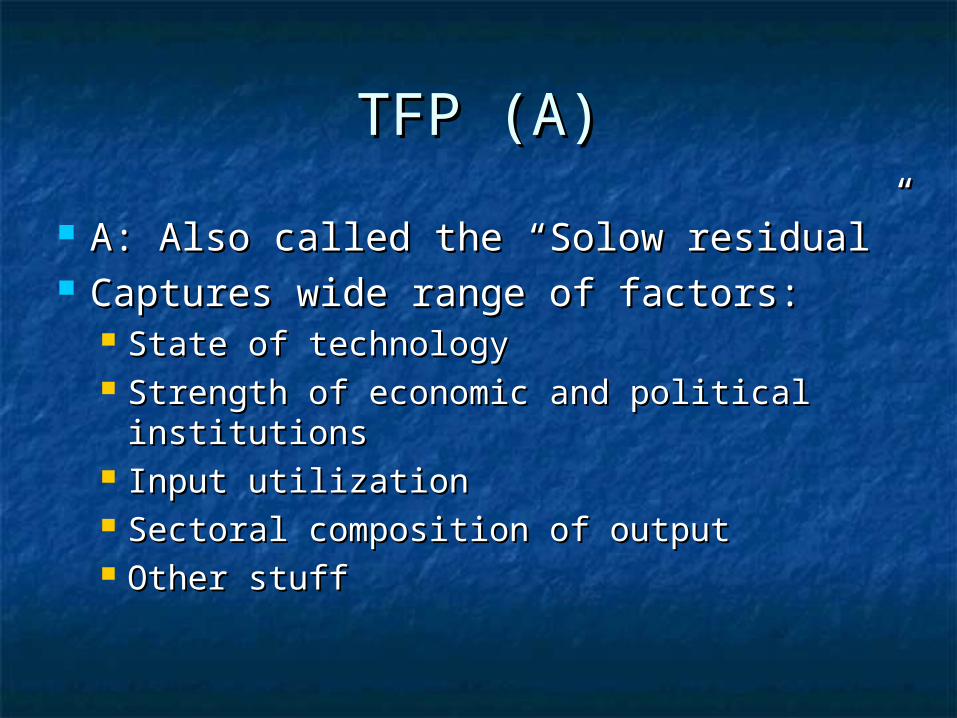
TFP (A)TFP (A)
A: Also called the “Solow residual”A: Also called the “Solow residual” Captures wide range of factors:Captures wide range of factors:
State of technologyState of technology Strength of economic and political Strength of economic and political
institutionsinstitutions Input utilizationInput utilization Sectoral composition of outputSectoral composition of output Other stuffOther stuff
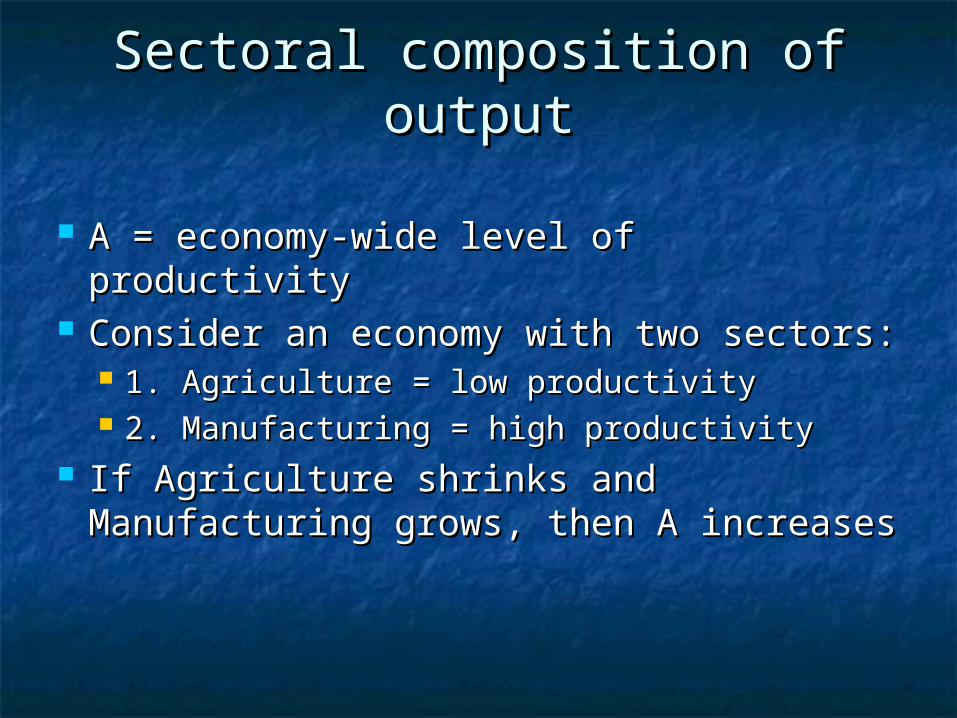
Sectoral composition of outputSectoral composition of output
A = economy-wide level of productivityA = economy-wide level of productivity Consider an economy with two sectors:Consider an economy with two sectors:
1. Agriculture = low productivity1. Agriculture = low productivity 2. Manufacturing = high productivity2. Manufacturing = high productivity
If Agriculture shrinks and Manufacturing If Agriculture shrinks and Manufacturing grows, then A increasesgrows, then A increases

= elasticity of Y w.r.t. K= elasticity of Y w.r.t. K
Exercise 1: Prove it!Exercise 1: Prove it!
Also:Also: = capital’s share of output (1<= capital’s share of output (1<<0)<0)
Exercise 2: Prove it!Exercise 2: Prove it!
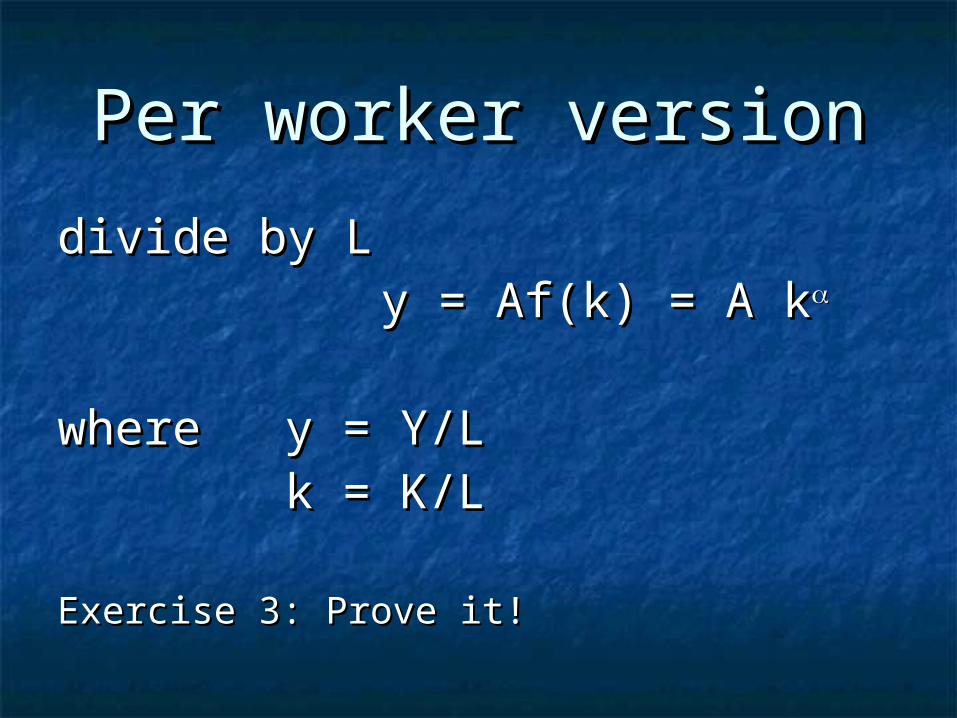
Per worker versionPer worker version
divide by Ldivide by L y = Af(k) = A ky = Af(k) = A k
where where y = Y/Ly = Y/Lk = K/Lk = K/L
Exercise 3: Prove it!Exercise 3: Prove it!
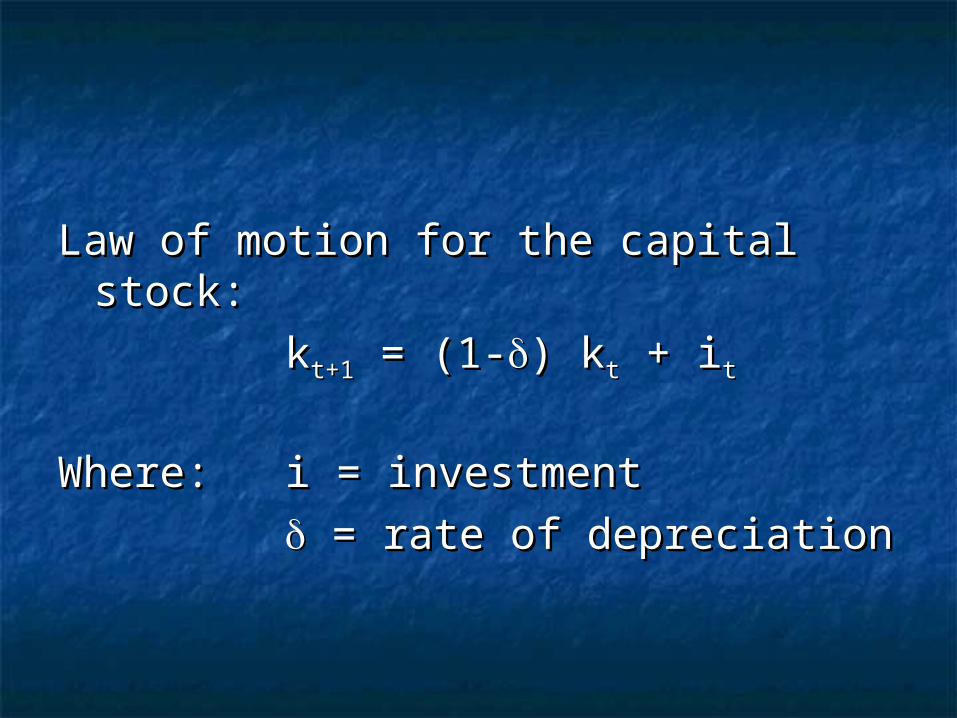
Law of motion for the capital stock:Law of motion for the capital stock:
kkt+1t+1 = (1- = (1-) k) ktt + i + itt
Where: Where: i = investmenti = investment
= rate of depreciation= rate of depreciation
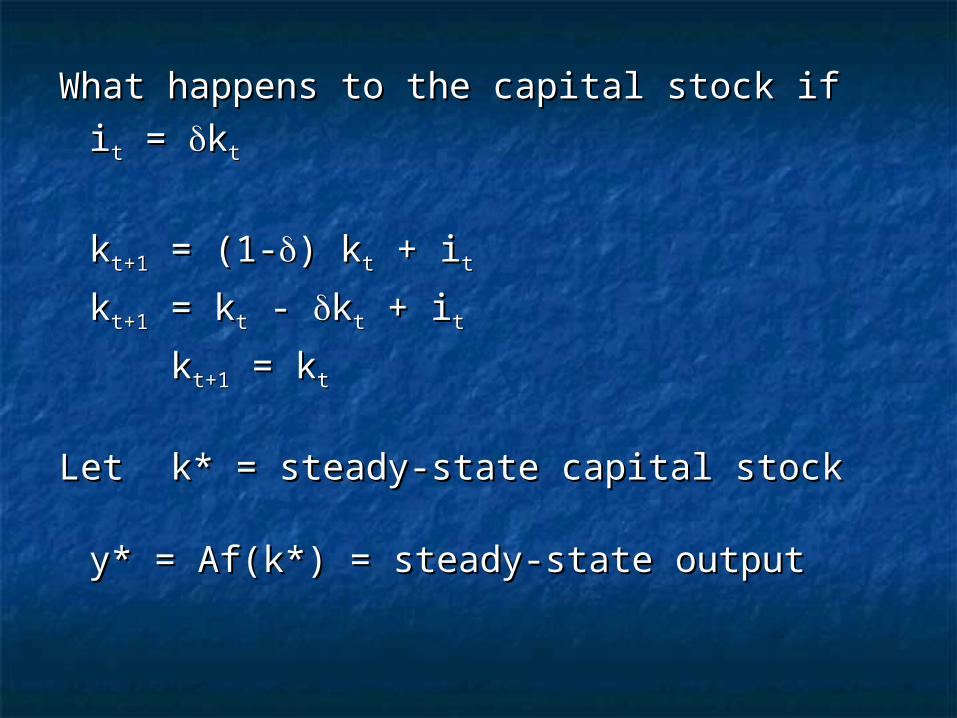
What happens to the capital stock ifWhat happens to the capital stock if
iitt = = kktt
kkt+1t+1 = (1- = (1-) k) ktt + i + ittkkt+1t+1 = k = ktt - - kktt + i + itt
kkt+1t+1 = k = ktt
Let Let k* = steady-state capital stockk* = steady-state capital stock
y* = Af(k*) = steady-state outputy* = Af(k*) = steady-state output

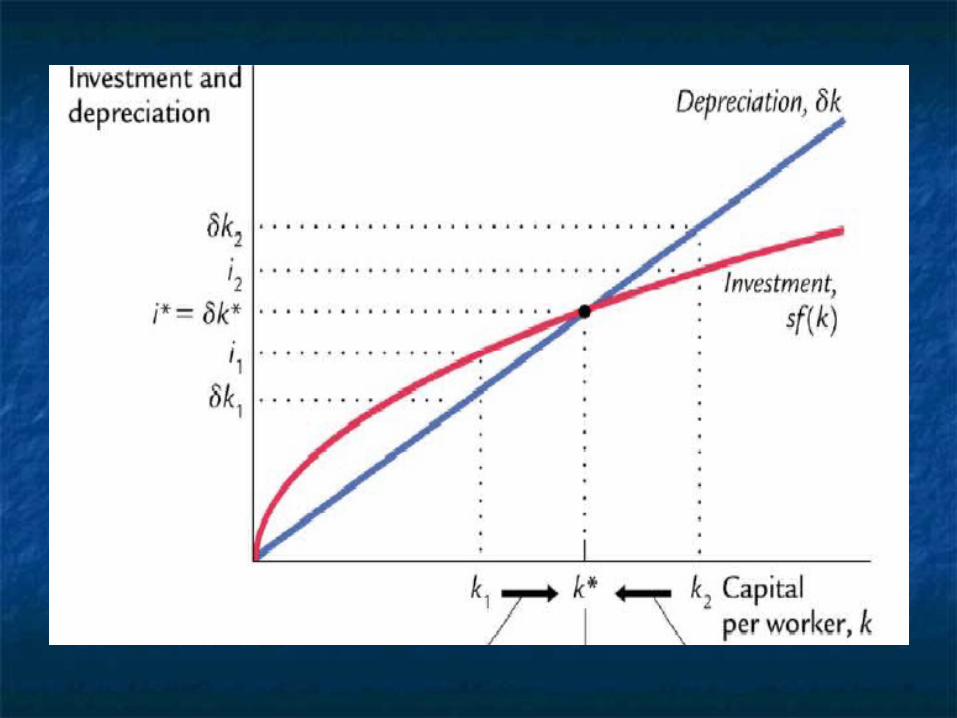
If iIf itt > > kkt t then capital stock is then capital stock is growinggrowing
If iIf itt < < kkt t then capital stock is then capital stock is shrinkingshrinking
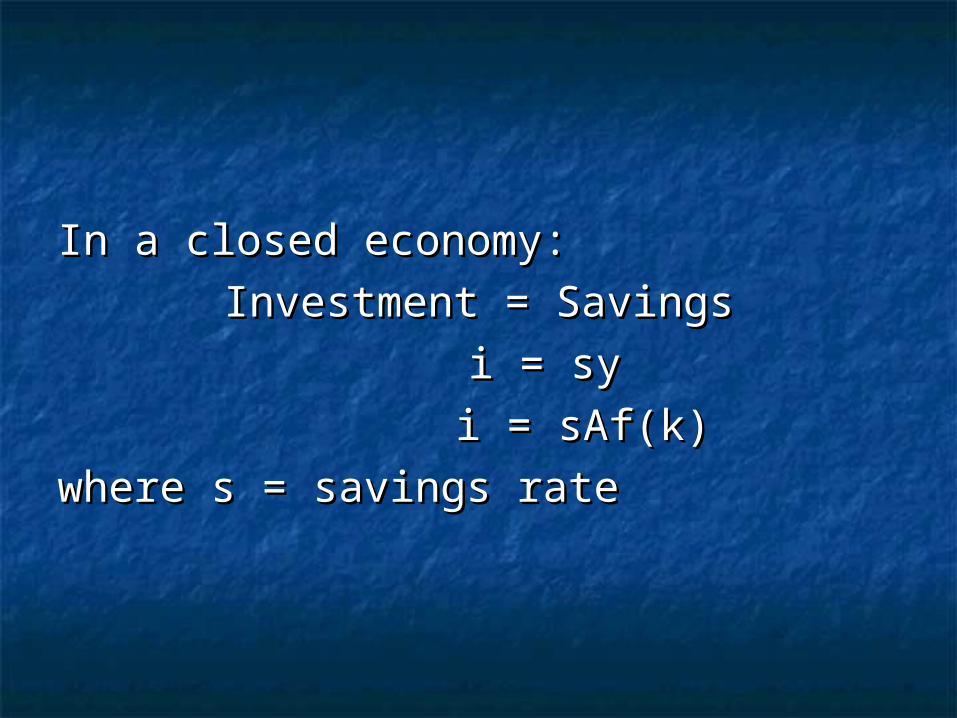
In a closed economy:In a closed economy:
Investment = SavingsInvestment = Savings
i = syi = sy
i = sAf(k)i = sAf(k)
where s = savings ratewhere s = savings rate
ConvergenceConvergence
Conditional convergenceConditional convergence If two countries have the similar A and s, If two countries have the similar A and s,
but different initial k, then they will but different initial k, then they will converge converge
If a SOE, then s not importantIf a SOE, then s not important Absent obstacles, A’s shouldn’t be very Absent obstacles, A’s shouldn’t be very
different across advanced economiesdifferent across advanced economies Evidence of conditional convergence Evidence of conditional convergence
among advanced economiesamong advanced economies
Honohan and Walsh (2002)Honohan and Walsh (2002)
1990s boom was a convergence story1990s boom was a convergence story Convergence telescoped into one decadeConvergence telescoped into one decade
No single factor accounts for 1990s No single factor accounts for 1990s boomboom
Why didn’t Ireland converge sooner?Why didn’t Ireland converge sooner? Institutional preconditions for such Institutional preconditions for such
convergence already present in 1973, but convergence already present in 1973, but fiscal policy errors in the 1970s derailed fiscal policy errors in the 1970s derailed convergenceconvergence
Honohan and Walsh (2002)Honohan and Walsh (2002)
Why was convergence in the 1990s Why was convergence in the 1990s so rapid?so rapid? How do we explain the employment How do we explain the employment
boom? boom?
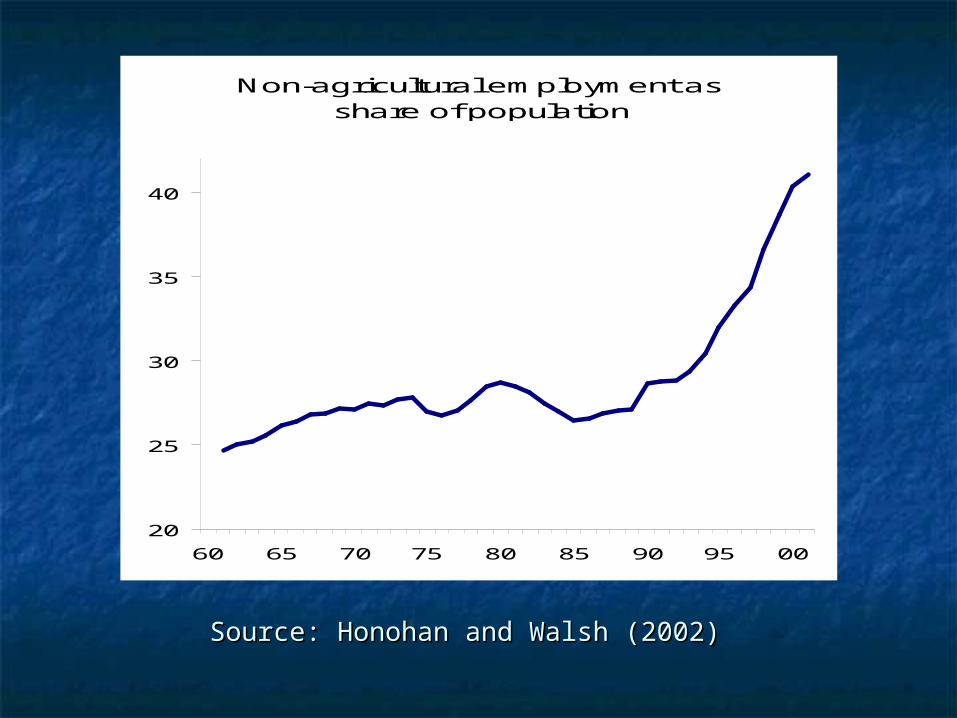
Non-agricultural employment as share of population
20
25
30
35
40
60 65 70 75 80 85 90 95 00
Source: Honohan and Walsh (2002)Source: Honohan and Walsh (2002)
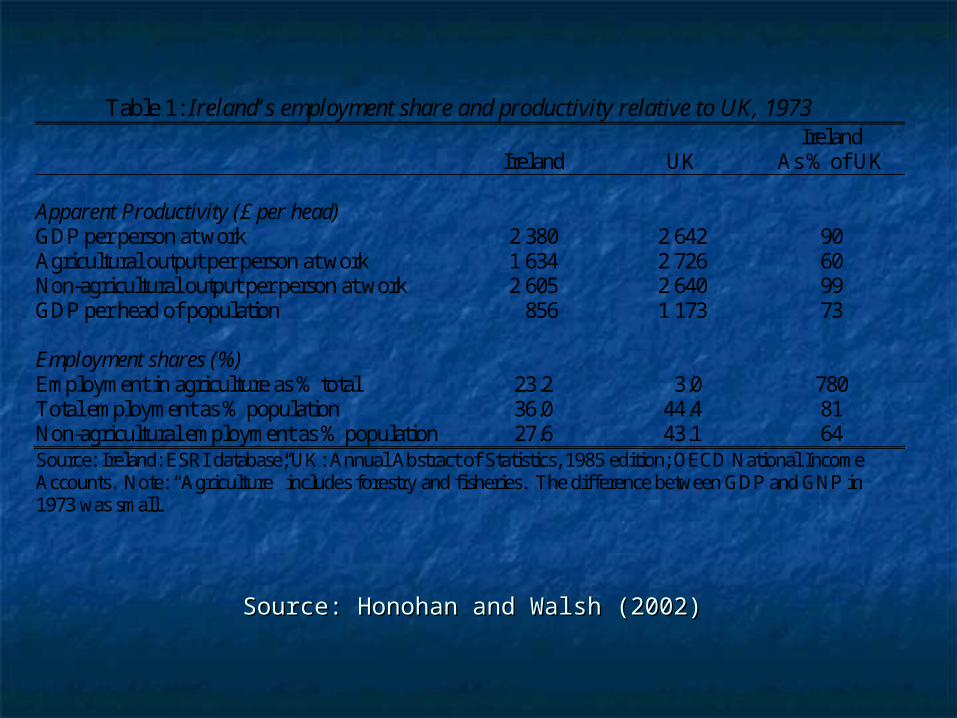
Table 1: Ireland’s employment share and productivity relative to UK, 1973
Ireland UK Ireland
As % of UK Apparent Productivity (£ per head) GDP per person at work 2 380 2 642 90 Agricultural output per person at work 1 634 2 726 60 Non-agricultural output per person at work 2 605 2 640 99 GDP per head of population 856 1 173 73 Employment shares (%) Employment in agriculture as % total 23.2 3.0 780 Total employment as % population 36.0 44.4 81 Non-agricultural employment as % population 27.6 43.1 64 Source: Ireland: ESRI database; UK: Annual Abstract of Statistics, 1985 edition; OECD National Income Accounts. Note: “Agriculture” includes forestry and fisheries. The difference between GDP and GNP in 1973 was small.
Source: Honohan and Walsh (2002)Source: Honohan and Walsh (2002)
Fiscal ErrorsFiscal Errors
See Figure 3: Budgetary Aggregates See Figure 3: Budgetary Aggregates
See Figure 4: Marginal and Average See Figure 4: Marginal and Average Income Tax Rates, 1979-2002Income Tax Rates, 1979-2002
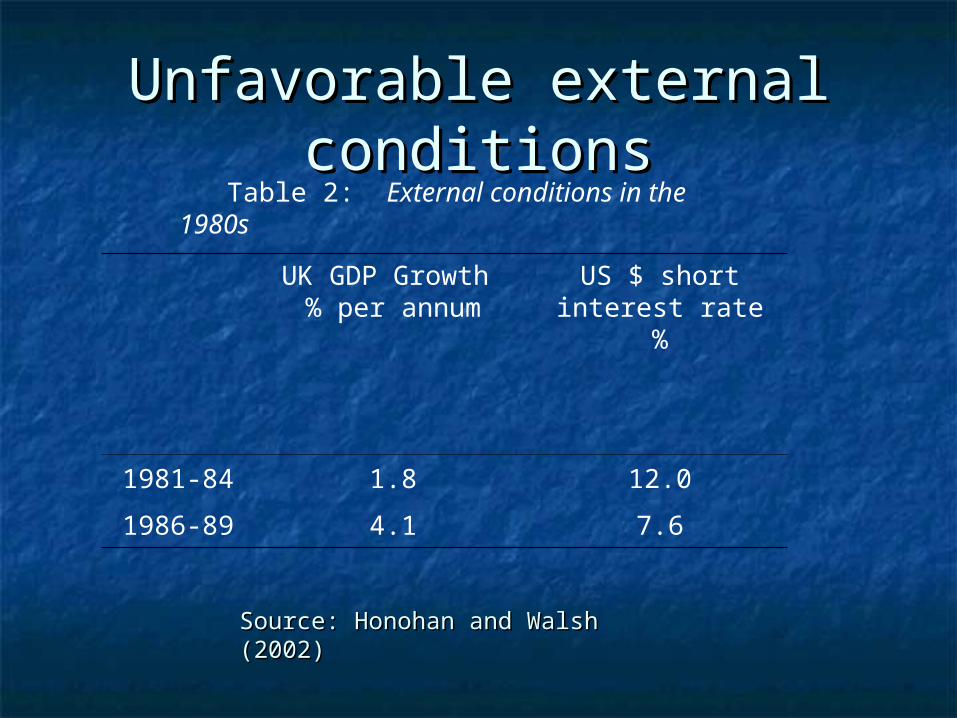
Unfavorable external Unfavorable external conditionsconditions
Table 2: External conditions in the 1980s
UK GDP Growth % per annum
US $ short interest rate
%
1981-84 1.8 12.0
1986-89 4.1 7.6
Source: Honohan and Walsh (2002)Source: Honohan and Walsh (2002)
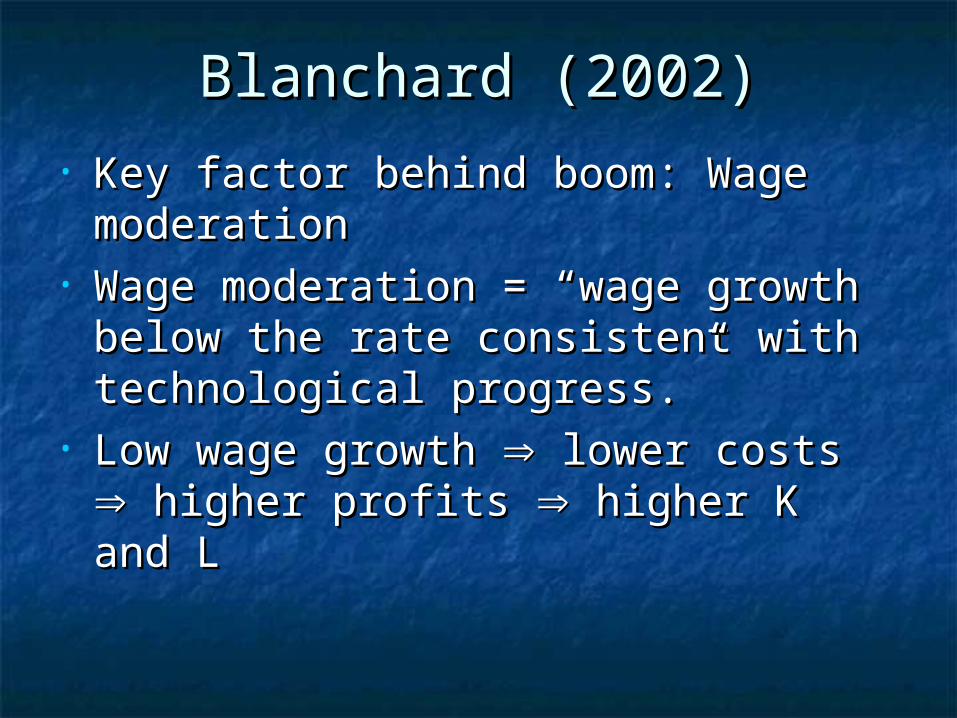
Blanchard (2002)Blanchard (2002)• Key factor behind boom: Wage Key factor behind boom: Wage
moderationmoderation• Wage moderation = “wage growth Wage moderation = “wage growth
below the rate consistent with below the rate consistent with technological progress.”technological progress.”
• Low wage growth Low wage growth lower costs lower costs higher profits higher profits higher K and L higher K and L
Blanchard (2002)Blanchard (2002)
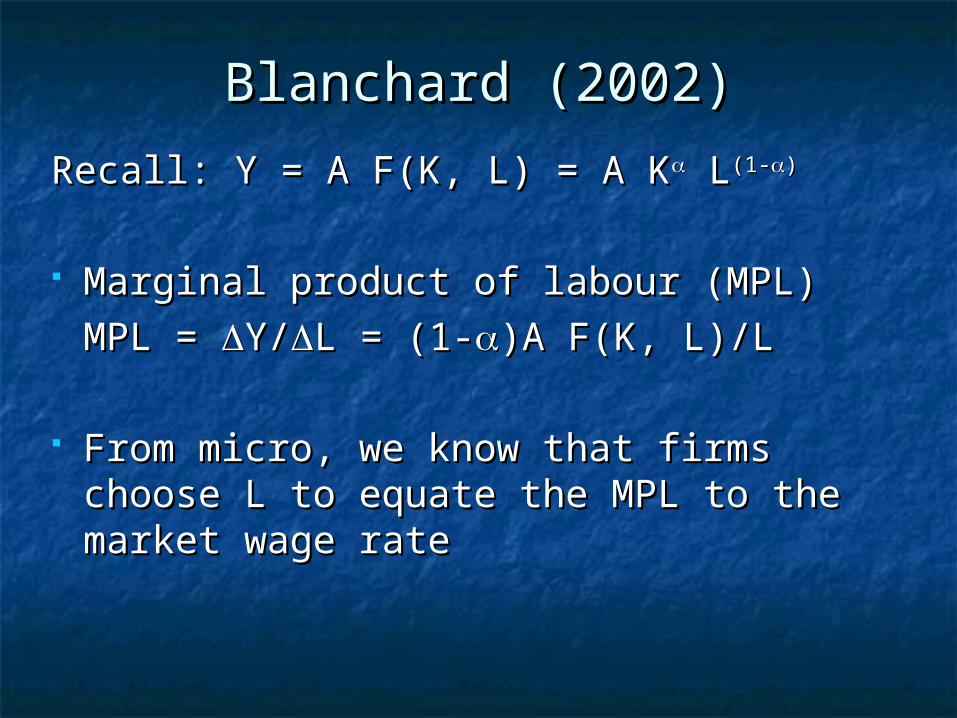
Recall: Y = A F(K, L) = A KRecall: Y = A F(K, L) = A K L L(1-(1-))
Marginal product of labour (MPL)Marginal product of labour (MPL)
MPL = MPL = Y/Y/L = (1-L = (1-)A F(K, L)/L)A F(K, L)/L
From micro, we know that firms choose From micro, we know that firms choose L to equate the MPL to the market wage L to equate the MPL to the market wage raterate
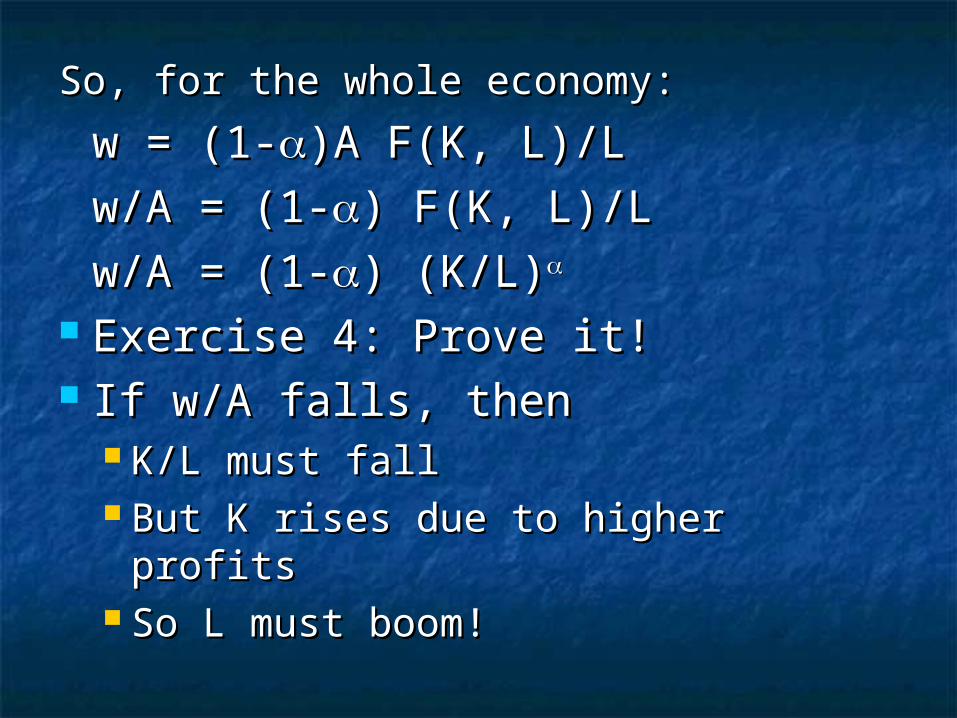
So, for the whole economy:So, for the whole economy:
w = (1-w = (1-)A F(K, L)/L)A F(K, L)/L
w/A = (1-w/A = (1-) F(K, L)/L) F(K, L)/L
w/A = (1-w/A = (1-) (K/L)) (K/L)
Exercise 4: Prove it!Exercise 4: Prove it! If w/A falls, thenIf w/A falls, then
K/L must fallK/L must fall But K rises due to higher profitsBut K rises due to higher profits So L must boom!So L must boom!
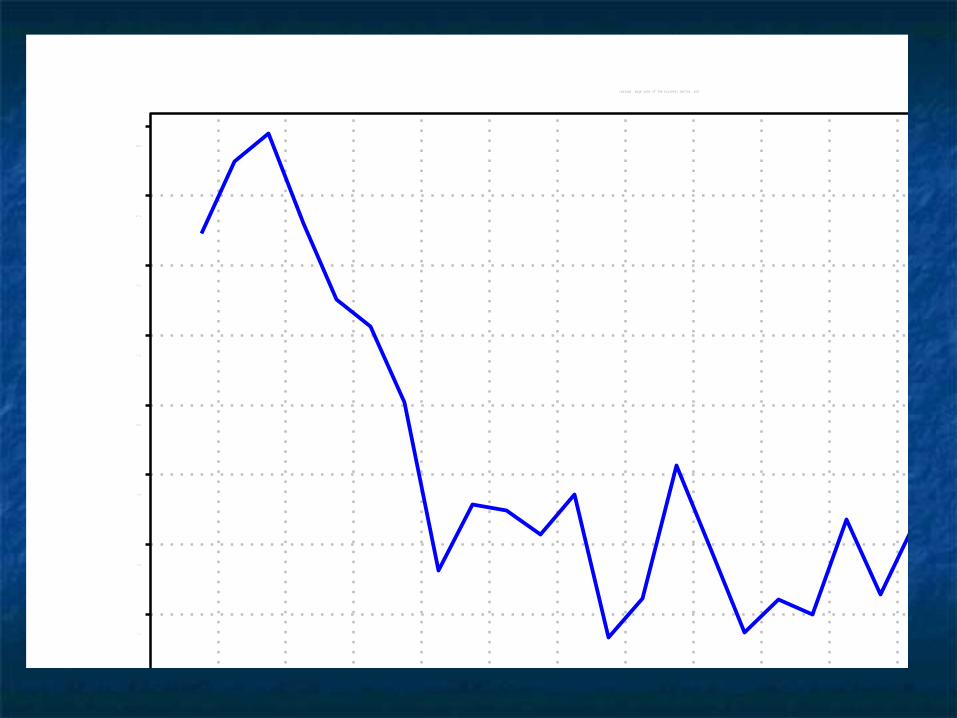
Ireland, Wage rate of the business sector, EUR
c.o.p 1 year
Source: EcoWin
78 80 82 84 86 88 90 92 94 96 98 00 02 04 06
Perc
en
t
0.0
2.5
5.0
7.5
10.0
12.5
15.0
17.5
20.0
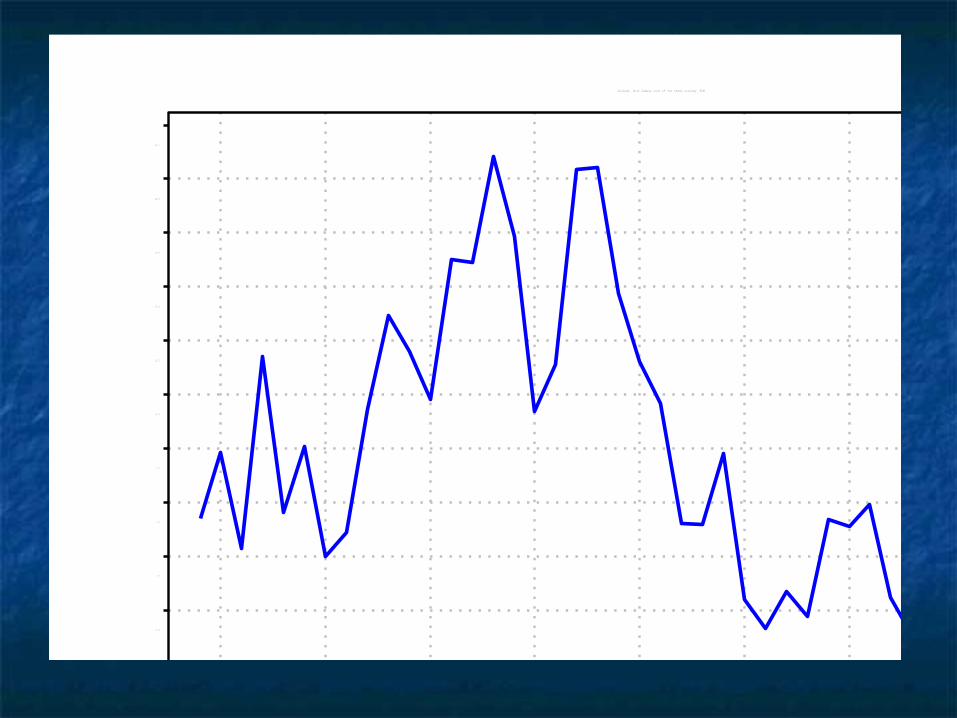
Ireland, Unit labour cost of the total economy, EUR
c.o.p 1 year
Source: EcoWin
60 65 70 75 80 85 90 95 00 05
Pe
rce
nt
-2.5
0.0
2.5
5.0
7.5
10.0
12.5
15.0
17.5
20.0
22.5
So wage restraint boosts So wage restraint boosts investment and especially investment and especially employmentemployment
Sources of wage restraintSources of wage restraint Social partnership agreementsSocial partnership agreements High unemploymentHigh unemployment Natural demographicsNatural demographics ImmigrationImmigration Income tax cutsIncome tax cuts
Why did wage moderation have Why did wage moderation have such a large effect in Ireland?such a large effect in Ireland? Openness of economyOpenness of economy
Notable amount of Notable amount of K took the K took the form of Foreign Direct Investment form of Foreign Direct Investment (FDI)(FDI)
Migration flows Migration flows Available export marketsAvailable export markets
No “crowding out”No “crowding out”

Reading for next lectureReading for next lecture Ahearne, Kydland, and Wynne Ahearne, Kydland, and Wynne
(2005)(2005) Barry (2002)Barry (2002) Fitz Gerald (2004)Fitz Gerald (2004)