topological vulnerability analysis: a powerful new
TRANSCRIPT

1
Topological Vulnerability Analysis: A Powerful New Approach
For Network Attack Prevention, Detection, and Response
Sushil Jajodia and Steven Noel
Center for Secure Information Systems, George Mason University
4400 University Drive, S-113 85 Fairfax, Virginia, USA
E-mail: {jajodia, snoel}@gmu.edu
This chapter examines issues and methods for survivability of systems under
malicious penetrating attacks. To protect from such attacks, it is necessary to
take steps to prevent them from succeeding. At the same time, it is important to
recognize that not all attacks can be averted at the outset; those that are partially
successful may be unavoidable, and comprehensive support is required for
identifying and responding to such attacks. We describe our Topological
Vulnerability Analysis (TVA) system, which analyzes vulnerability to multi-
step network penetration. At the core of the TVA system are graphs that
represent known exploit sequences that attackers can use to penetrate computer
networks. We show how TVA attack graphs can be used to compute actual sets
of hardening measures that guarantee the safety of given critical resources.
TVA can also correlate received alerts, hypothesize missing alerts, and predict
future alerts. Thus, TVA offers a promising solution for administrators to
monitor and predict the progress of an intrusion, and take quick appropriate
countermeasures.
1.1. Introduction
Computer networks are inherently difficult to secure against attack. They are
often connected to the Internet, for which security was not an original design
goal. Default configurations for many software components are insecure, and
these configurations often remain unchanged by the user. There is generally little
economic incentive to develop secure software, so vulnerabilities are
commonplace.
Moreover, network security concerns are highly interdependent, so that a
machine’s susceptibility to attack can depend on vulnerabilities across the
network. Attackers can combine vulnerabilities in unexpected ways, allowing
them to incrementally penetrate a network and compromise critical systems. We
can reduce the impact of attacks by knowing the paths of vulnerability through
our networks. To do so, we need to transform raw security data into topological
maps that let us prepare for attacks, manage risks, and have real-time situational
awareness.
Traditional tools for network vulnerability assessment simply scan individual
machines on a network and report their known vulnerabilities. Security
conscious organizations may then employ Red Teams of network penetration
testers, who attempt to combine vulnerabilities in ways that real attackers might.
But penetration-testing experts are expensive, changes to the network

S. Jajodia and S. Noel
2
configuration render the test results obsolete, and the only attack paths reported
are those found within the allotted test time.
The processes for tracking network vulnerabilities are labor-intensive,
require a great deal of expertise, and are error prone because of the complexity,
volume, and frequent changes in security data and network configurations. But
through automated simulation of possible attack paths, we can understand our
overall security posture in the face of actual attacks.
Our innovative approach to network attack survivability is termed
Topological Vulnerability Analysis (TVA)1. TVA simulates incremental network
penetration, building complete maps of multi-step attacks showing all possible
paths into a network. It maintains models of the network configuration and
potential threats. From these models, it discovers attack graphs that convey the
impact of combined vulnerabilities on overall security. TVA technology
includes recursive attack graph aggregation with interactive drill down of
scenarios in the cyber domain. It incorporates a variety of types of network scan
data, providing the ability to easily model and analyze even large networks.
Currently available tools generally give few clues as to how attackers might
exploit combinations of vulnerabilities among multiple hosts to advance an attack
on a network. The security analyst is left with just a set of known vulnerabilities.
It can be difficult even for experienced analysts to recognize how an attacker
might combine individual vulnerabilities to seriously compromise a network.
For larger networks, the number of possible vulnerability combinations to
consider can be overwhelming.
In this chapter, we describe a mature system that implements TVA. This tool
considers combinations of modeled attacker exploits on a network and then
discovers attack paths (sequences of exploits) leading to specific network targets.
The discovered attack paths allow an assessment of the true vulnerability of
critical network resources. TVA automates the type of labor-intensive analysis
usually performed by penetration-testing experts. It encourages inexpensive
“what-if” analyses, in which candidate network configurations are tested for
overall impact on network security. It also allows for the computation of
network-hardening options that protect given critical resources while requiring
minimal network changes.
To meet network availability requirements, there must usually remain some
residual vulnerability after all protective measures have been applied. In such
cases, we must then rely on the detect/react phases of security. While we cannot
predict the origin and timing of attacks, TVA can reduce their impact by
providing knowledge of the possible attack paths through the network. For
example, TVA attack graphs can be used to correlate and aggregate network

Topological Vulnerability Analysis
3
attack events, across platforms as well as across the network. TVA attack graphs
can also provide the necessary context for optimal reaction to attacks.
1.2. Topological Analysis of Network Vulnerability
Because of the interdependencies of exploits across the network, a topological
approach is necessary for full understanding of attack vulnerability. The
traditional approach of considering network components in isolation and
reporting vulnerabilities independent of one another is clearly insufficient. TVA
models vulnerabilities and combines them in ways that real network attackers
might do. The result is the discovery of all attack paths through a network.
Figure 1.1 shows the overall flow of processing in TVA. There are three
inward flows of information: a model of the network configuration, a knowledge
base of modeled attacker exploits, and a desired attack simulation scenario.
From these, TVA then simulates incremental attacks through the network,
thereby discovering all possible attack paths (organized as a graph) to the given
critical network resources. Various innovative visualization capabilities support
interactive analysis of resulting attack graphs, while keeping visual complexity
manageable. TVA can also use the attack graphs to compute optimal network
protection measures.
To model the various elements of the network and network attack events, our
TVA system automatically processes the output of various network scanning and
ExploitModelingExploit
Modeling
Attack
Scenario
Simulation Engine
Workstation
Bridge HubHub
ServerComputer Computer
Laptop NetworkWorkstation
Bridge HubHub
ServerComputer Computer
Laptop
Workstation
Bridge HubHub
ServerComputer Computer
Laptop Network
ThreatReporting
ThreatReporting
NetworkModeling
AttackGraph
Visualization
Network
Protection
Network
Protection
Fig. 1.1. Topological Vulnerability Analysis (TVA). From the network configuration and modeled
attacker exploits, multi-step attacks are simulated, analyzed through interactive visualization, and
used to formulate optimal network protection.
S. Jajodia and S. Noel
4
logging tools. It can combine scans from various network locations, building a
complete map of connectivity to vulnerable services throughout the network, and
can map actual intrusion events to elements of the resulting attack graph.
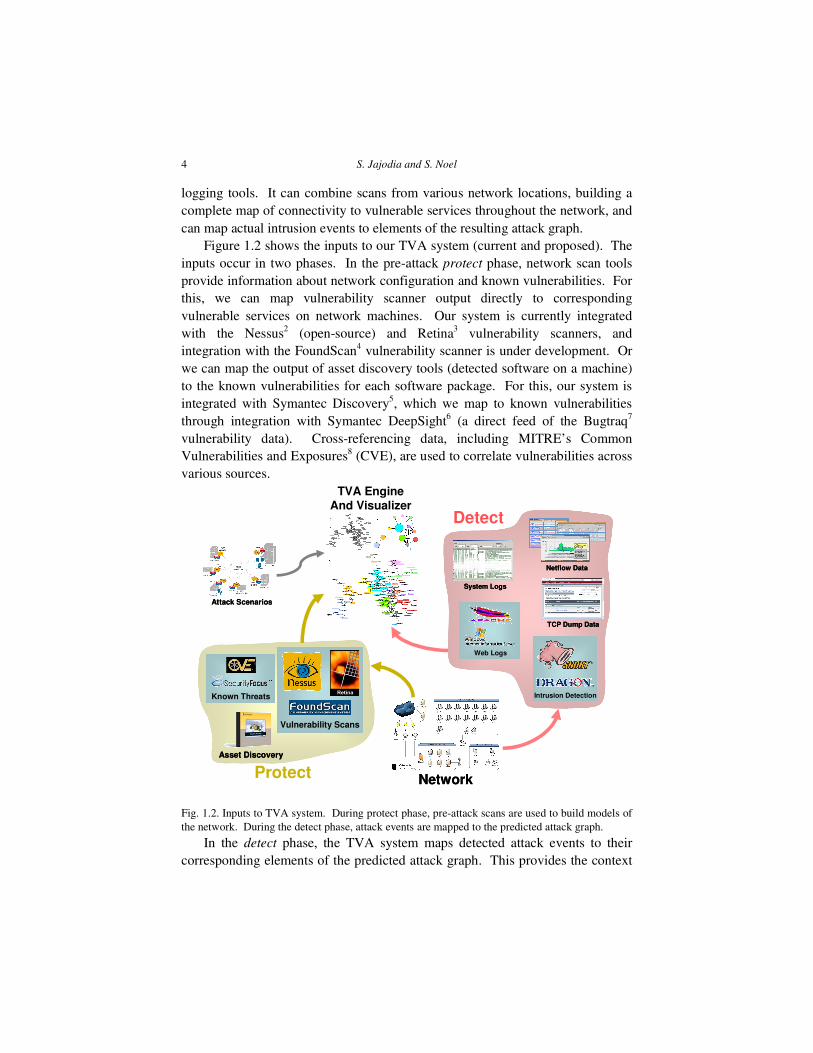
Figure 1.2 shows the inputs to our TVA system (current and proposed). The
inputs occur in two phases. In the pre-attack protect phase, network scan tools
provide information about network configuration and known vulnerabilities. For
this, we can map vulnerability scanner output directly to corresponding
vulnerable services on network machines. Our system is currently integrated
with the Nessus2 (open-source) and Retina
3 vulnerability scanners, and
integration with the FoundScan4 vulnerability scanner is under development. Or
we can map the output of asset discovery tools (detected software on a machine)
to the known vulnerabilities for each software package. For this, our system is
integrated with Symantec Discovery5, which we map to known vulnerabilities
through integration with Symantec DeepSight6 (a direct feed of the Bugtraq
7
vulnerability data). Cross-referencing data, including MITRE’s Common
Vulnerabilities and Exposures8 (CVE), are used to correlate vulnerabilities across
various sources.
In the detect phase, the TVA system maps detected attack events to their
corresponding elements of the predicted attack graph. This provides the context
Attack ScenariosAttack Scenarios
Asset DiscoveryAsset Discovery
TVA EngineAnd Visualizer
NetworkNetwork
Intrusion Detection
Web LogsWeb Logs
Netflow DataNetflow Data
TCP Dump DataTCP Dump Data
System LogsSystem Logs
Intrusion Detection
Web LogsWeb Logs
Netflow DataNetflow Data
TCP Dump DataTCP Dump Data
System LogsSystem Logs
Detect
Protect
Known Threats
Vulnerability Scans
Fig. 1.2. Inputs to TVA system. During protect phase, pre-attack scans are used to build models of
the network. During the detect phase, attack events are mapped to the predicted attack graph.

Topological Vulnerability Analysis
5
for correlating events, predicting the next possible attack steps, and responding in
the best way. It also helps remove clutter by prioritizing those predicted exploits
that are correlated with recent real-time data. Our TVA system is currently
integrated with the Snort9 intrusion detection system. Integration with other
intrusion detection systems (e.g., Dragon) is also possible, as well as with other
sources of real-time data, such as web server logs (e.g., Apache and Microsoft
IIS), operating system logs, and network traffic data (e.g., Netflow and TCP
Dump).
To keep our TVA input exploit model current, we monitor emerging cyber
threats, in the form of vulnerabilities that are discovered for particular software
and the ways in which attackers can exploit these vulnerabilities. From this
threat information, we model individual attacker exploits in terms of
preconditions and postconditions. The modeled exploits are in terms of generic
attacker/victim machines, which the simulation engine maps to a particular target
network.
Because of all this pre-populated data, when using our TVA system the
security analyst need not be burdened with all the details of the network and
exploit data. All that is needed is to define the attack scenario, e.g., the starting
point, the attack goal, and any what-if changes to the network configuration. The
attack scenario could also be less constrained, such as finding all possible attack
starts leading to one or more goals, or finding all possible paths from particular
starting points.
1.3. A Motivating Example
As a motivating example, we demonstrate how TVA combines vulnerabilities in
a network to find all attack paths from a particular starting point to a given goal.
We then show how TVA determines optimal ways of hardening the network
against these attacks.
Consider the small example network shown in Fig. 1.3. Here, a restrictive
firewall protects the machines that support public web and email services. TVA
shows how vulnerable services on a network can still be exploited through multi-
step attacks, when the attacker cannot access them directly.
The firewall implements the following policy to restrict access to the network
from the outside:
• Incoming web traffic is permitted only to the web server, which is running
Microsoft IIS.
• Incoming email traffic is permitted to the mail server.

S. Jajodia and S. Noel
6
• Incoming FTP is blocked because the mail server is running wu_ftpd, which
has a history of vulnerabilities.
• All other incoming traffic is blocked.
For this example, we populate the TVA network model through Nessus
scans. In particular, we scan the web server and mail server from outside the
firewall, to obtain vulnerable connectivity from the initial attack vantage point.
We also scan these two servers behind the firewall, showing any subsequent
vulnerable connectivity once the attacker gains entry into the network. These
scan results are merged to form an overall model of the network for TVA.
The attack goal for this example is to obtain super user (root) access on the
mail server, starting from outside the network. This is not directly possible
because (1) there are no known vulnerabilities for the version of sendmail
running on the mail server, and (2) the firewall blocks access to the vulnerable
wu_ftpd service from the attack machine. TVA analyzes whether the attack goal
can be realized indirectly, i.e., through a sequence of multiple exploits.
Figure 1.4 shows the resulting TVA attack graph for the example network in
Fig. 1.3. Here, shaded ovals are simulated attacker exploits. For each exploit,
incoming edges represent preconditions, all of which must be met for the exploit
to be successful. Then for each exploit, outgoing edges represent postconditions,
i.e., the conditions induced when the exploit is successful. Preconditions with the
5-digit Nessus identifiers represent connections to vulnerable network services
detected by Nessus.
Firewall
Attacker
Web Server Mail ServerHub
NT4.0
IIS
NT4.0
IIS
Linuxattack tools
Linuxattack tools
10.10.100.10
10.10.101.10
10.10.100.20
Linux
wu_ftpd
Linux
wu_ftpd
Fig. 1.3. Small example network for illustrating TVA. The firewall allows web traffic to the web
server, allows email traffic to the mail server, and blocks all other incoming traffic.

Topological Vulnerability Analysis
7
The initial condition execute(attack) represents the fact that the attacker can
execute arbitrary code on his own machine. This enables three separate exploits
from attack to the web server (machine m20). Each of these exploits provides
the ability to execute arbitrary code on the web server. This subsequently
enables four new exploits from the web server to the mail server (machine m10),
each yielding the ability to execute arbitrary code on the mail server. Two of
these exploits provide access at a super user level of privilege. The other two
exploits provide user-level privilege only, but two subsequent local privilege
escalation exploits on the mail server provide other paths to super user.
Finding such attack paths is a unique TVA capability. Vulnerability
scanning tools connected outside the firewall report only the IIS vulnerabilities
on the web server. Such scans from inside the firewall would report the
vulnerable wu_ftpd service, but TVA is required to build an attack path from the
outside through the web server to the mail server. While easy enough for an
experienced penetration tester on such a small network, it becomes
unmanageable for networks where voluminous outputs must be analyzed for
large numbers of machines.
Solution 1
Solution 2
Solution 1 Solution 1
Solution 2
Solution 2 Solution 2
No Impact No Impact
Fig. 1.4. Attack graph illustrating TVA. This graph shows all possible ways an outside attacker can
obtain the ability to execute arbitrary code as a super user on the mail server.

S. Jajodia and S. Noel
8
TVA can not only find attack graphs, but can also use these graphs for
finding optimal solutions for hardening the network. In particular, though TVA
we can find combinations of network-hardening measures that prevent a given
attack scenario, while requiring a minimal number of changes to the network
configuration. Figure 1.4 illustrates this. For this network, one such solution is
to remediate (e.g., patches or firewall blocking) the three vulnerabilities from
attack to m20. Hardening these three vulnerabilities is necessary and sufficient
for preventing the attack goal. The other solution is to harden the two
vulnerabilities on m10 that enable the four exploits yielding super user access.
Interestingly, TVA shows that hardening the other two vulnerabilities on m10
(yielding user-level access only) has no impact on blocking access to the goal,
i.e., hardening them is neither necessary nor sufficient.
The next section describes the TVA process for optimal network hardening
in more detail.
1.4. Minimal-Cost Network Hardening
Attack graphs reveal threats by predicting combinations of attacker exploits that
compromise given critical resources. But alone, they do not directly provide a
solution to remove the threat. Finding such solutions manually can be tedious
and error prone, especially for larger and less secure networks.
TVA automates the task of hardening a network against multi-step attacks.
Unlike previous approaches whose solutions are in terms of attacker
exploits10,11,12, our solutions are in terms of network configuration elements.
These solutions are therefore more enforceable, because the configuration
elements can be independently hardened, whereas exploits are usually
consequences of other exploits and cannot be disabled without removing the root
causes. Also, our solutions are optimal in the sense that they incur minimal cost
in terms of changes to the network.
Consider the network in Fig. 1.5, which we model using multiple layers of
the TCP/IP stack. This example shows how complicated interdependencies
among exploits can be resolved to an optimal set of hardening measures. It also
demonstrates how purely exploit-based hardening approaches are insufficient for
network hardening, i.e., that solutions in terms of network configuration elements
are needed.

Topological Vulnerability Analysis
9
In Fig. 1.5, an Ethernet switch provides connectivity at the link layer. At the
transport layer, unused services have been removed, secure shell replaces FTP,
telnet and other cleartext password-based services, and there is tcpwrapper
protection on RPC services. Application-layer trust relationships further restrict
NFS and NIS domain access. The exploits and network configuration elements
(exploit conditions) for this example are described in Table 1.1 and Table 1.2,
respectively.
Ethernetswitch
attack
bart
NIS client
ssh (password auth)
homer:/home autofs
homer
NIS server
ssh (RSA key auth)
/home nfs export to bart
/home/root/.ssh for RSA keys
Ethernetswitch
attack
bart
NIS client
ssh (password auth)
homer:/home autofs
homer
NIS server
ssh (RSA key auth)
/home nfs export to bart
/home/root/.ssh for RSA keys
Fig. 1.5. Network illustrating TVA minimal-cost network hardening. Complicated
interdependencies among exploits are to be resolved to optimal hardening measures.
Table 1.1. Exploits for network shown in Fig. 1.5.
Exploit Description
arp_spoof Spoof (impersonate) machine identity via ARP poison
attack
ypcat_passwd Dump encrypted NIS password file
crack_passwd Crack encrypted user password(s)
scp_upload_pw Secure shell copy, upload direction, using password
authentication
scp_download_pw Secure shell copy, download direction, using password
authentication
ssh_login_pw Secure shell login using password authentication
rh62_glibc_bof Red Hat 6.2 buffer overflow in glibc library
create_nfs_home_ssh_pk_su Exploit NFS home share to create secure shell key pair
used for superuser authentication
ssh_login_pk_su Secure shell login using public key authentication

S. Jajodia and S. Noel
10
Figure 1.6 shows the attack graph for the network in Fig. 1.5 modeled via the
exploits and network conditions in Table 1.1 and Table 1.2. Using our
previously described algorithm for minimal-cost hardening13, 14, we traverse the
attack graph to construct a logical expression for the attack goal g (execute code
as superuser on machine homer) in terms of the initial network conditions:
( ) ( ) ( )αβχφγη
ηαβχφγαβχδεαβχ
=
⋅⋅⋅+=g
The attack graph has been reduced to an expression that leads to simple
choices for network hardening. Note that two initial conditions in the graph do
not appear in the expression for goal g:
(i) ( )attackbartpwsshtrans ,__≡δ , and
(ii) ( )attackbartpwauthapp ,_≡ε .
These drop out in this fashion:
( )( )
αβχ
δεαβχ
αβχδεαβχ
=
+=
+=
1
,__62 bartbartbofglibcrh
Table 1.2. Configuration elements for network shown in Fig. 1.5.
Network Condition Description
link_arp Attacker shares link-level connectivity with victim (both on
same LAN)
trans_yp Transport layer connectivity to NIS server
trans_ssh_pw Transport layer connectivity to secure shell server that
supports password authentication
trans_ssh_pk Transport layer connectivity to secure shell server that
supports public key authentication
trans_nfs Transport layer connectivity to NFS server
app_nfs_home_su Application “connection” representing sharing superuser’s
home directory
app_yp_domain Application “connection” representing NIS domain
membership
app_yp_passwd Application “connection” representing acquisition of
encrypted NIS password database
app_pwauth Application “connection” representing acquisition of
unencrypted user password
app_ssh_pk_su Application “connection” representing acquisition/creation
of key pair used for superuser authentication
pgm_glibc_bof Program used to exploit glibc library buffer overflow
vulnerability
execute Ability to execute arbitrary code
superuser Super user privilege

Topological Vulnerability Analysis
11
Through our approach, such irrelevant conditions as δ and ε do not get
considered for network hardening. Overall, our goal expression contains initial
conditions that are both necessary and sufficient for network-hardening
decisions.
This kind of sufficiency is not present in previous approaches to network
hardening via exploit set minimization. These approaches search for minimal
sets of exploits, in which every exploit is needed in reaching the goal. In this
example, there are two such minimal exploit sets:
• All exploits except scp_upload_pw(attack,bart), and
• All exploits except scp_download_pw(bart, attack).
For network hardening using these minimal exploit sets, we must assume that
all exploits in the union of the minimal exploit sets must be stopped. In this
example, we would therefore conclude that scp_download_pw(bart,attack) must
be stopped, even though stopping it has no effect on the attacker reaching the
goal.
δ
α
β
χ
ε
χ
φ γ
η
g
δ
α
β
χ
ε
χ
φ γ
η
g
Fig. 1.6. Attack graph illustrating TVA minimal-cost network hardening. A logical expression is
formed for the attack goal g in terms of initial network conditions.

S. Jajodia and S. Noel
12
Also, hardening initial condition trans_ssh_pw(attack,bart) simultaneously
stops two exploits, i.e., scp_upload(attack,bart) and ssh_login_pw(attack, bart).
This would not be apparent by considering minimal exploit sets only. In other
words, a single initial condition could control many exploits. In general,
relationships among initial conditions and exploits can be many-to-many and
complex. To solve the network-hardening problem, analysis must be at the level
of network elements rather than exploits.
Our TVA network-hardening solutions not only prevent attacks against given
critical resources, but also allow choices with minimal cost in network changes.
In Fig. 1.6, the expression αβχφγη=g implies that hardening any one of these
will protect the goal:
1. link_arp(attack,bart),
2. trans_yp(attack,homer),
3. trans_ssh_pw(attack,bart),
4. app_nfs_home_su(bart,homer),
5. trans_nfs(bart,homer), or
6. trans_ssh_pk(bart,homer).
Implementing Solutions 2, 5, or 6 would require shutting down critical network
services. Solution 1 requires hard-coding IP/MAC address relationships.
Solution 4 requires removing the super user home directory file share. Solution 3
requires using public-key authentication rather than password authentication.
Among all these options, Solution 3 is the best (lowest-cost) choice.
1.5. Attack Graph Visualization
One of the greatest challenges in TVA is managing the complexity of the
resulting attack graphs, particularly for larger and less secure networks.
Visualization is a natural choice for conveying complex graph relationships to
the user. Still, attack graphs in their raw form often yield overly cluttered views
that are difficult to understand, as in Fig. 1.7. Therefore, in developing our TVA
system, we have devoted considerable effort in managing attack graph visual
complexity.
Our TVA attack graphs scale quadratically rather than exponentially15, so
that graphs such as Fig. 1.7 can be computed in a fraction of a second. However,
when shown in their full complexity, such graphs are too complicated for easy
comprehension.

Topological Vulnerability Analysis
13
To manage visual complexity of attack graphs, our TVA system employs
sophisticated methods of graph clustering16. This is illustrated in Fig. 1.8.
Fig. 1.7. Attack graph visual complexity. In their raw form, such graphs can overwhelm an analyst.
(a) (b)
(c)(d)
Fig. 1.8. Recursively clustered attack graphs. At each level of clustering, the attack graph view
becomes progressively summarized and simplified.

S. Jajodia and S. Noel
14
Fig. 1.8(a) is the original attack graph in its full complexity. Figure 1.8(b)
shows the same attack graph, this time aggregated to the level of machines and
the sets of exploits between each pair of them. In Figure 1.8(c), this is further
aggregated to sets of machines with unlimited connectivity to one another’s
vulnerabilities (e.g., subnets). In Figure 1.8(d), subnets are collapsed to single
vertices, as are the exploits between them. Thus each level of aggregation
provides a progressively summarized (less complicated) view of the attack graph.
In our TVA system, analysts can start with high-level overviews, and drill
down through successive levels of detail as desired. The system begins with the
graph automatically aggregated based on known network attributes. The analyst
can also interactively aggregate graph elements as desired. Graph visualization
and interaction is done through our custom Visio-style user interface.
In this way, arbitrarily large and complex attack graphs can be explored
through manageable, meaningful interactive displays. Figure 1.9 shows such
interactive attack graph visualization, showing how the analyst can show
arbitrary levels of detail across the graph all within a single view. In this
example, several hundred host machines are included in the attack graph.
Fig. 1.9. Interactive TVA attack graph visualization. Arbitrarily complex attack graphs can be
explored through interactive displays, with mixed levels of detail within a single graph view.

Topological Vulnerability Analysis
15
1.6. Real-Time Event Correlation
Once actual attacks are detected, the TVA attack graph provides the necessary
context for correlating intrusion detection events and predicting next possible
attack steps. In other words, we embed incoming intrusion alarms in the TVA
attack graph, which is based on known vulnerabilities across the network. While
multi-step intrusion alarm correlation has been proposed in the past17
, it lacks
predictive power without the context provided by our vulnerability-based attack
graphs. Further, using our pre-computed attack graphs, we can correlate alarms
faster than typical intrusion detection systems can generate them18, 19, 20.
From the TVA attack graph predicting all possible attacks, incoming
intrusion alarms are assigned to their corresponding predicted exploits. We then
visualize the joint predicted/observed attack graph, as shown in Fig. 1.10. Here,
red ovals are detection events placed in the predicted attack graph. In this
example, one red event immediately follows another in the graph, thus
correlating these as a possible two-step attack. In this way, isolated detection
events can be quickly assessed as possible multi-step attacks. Such predictive
graphs also reduce false alarms, i.e., they contain only those attacks that the
network is actually vulnerable against.
Detected
Response
Vulnerable
Fig. 1.10. Graph of predicted and actual attacks. Attack events detected in real time are embedded
in TVA graph of predicted attacks, providing context for event correlation and attack response.

S. Jajodia and S. Noel
16
With TVA attack graphs, we can also provide recommendations in response
to detected attacks. For example, in Fig. 1.10 the orange ovals are predicted
exploits that immediately follow intrusion alarms in the attack graph. Since these
are the next possible exploits an attacker could take (based on known
vulnerabilities), stopping them is a high-priority for containing the attack. The
blue ovals in this figure are predicted exploits that are further away from the
detected attacks, and are therefore less time-critical. Without the predictive
power of our vulnerability-based TVA attack graphs, we could perform alarm
correlation (red ovals) only.
Our attack response recommendations are optimal in the sense that they
address the exact next-step vulnerabilities in the network – no more and no less.
For example, rather than blocking traffic from an entire subnet (an overly
cautious and disruptive response based on limited information), our responses
could give precise blocking rules down to a single vulnerable host port.
With TVA attack graphs, we can also predict missed events (false negatives)
when correlating detection events into multi-step attacks. In this way, we
account for uncertainty in the accuracy of our intrusion detection systems. For
example, we can use attack graph distances as measures of causal correlation
between detection events18
. This is illustrated in Fig. 1.11. Here, real-time
intrusion events are assigned to their corresponding predicted exploits.
Correlation scores are then computed as the inverse of event distance in the graph
(higher correlation for shorter distances).
Exploit 1machine1->machine2
vulnerability1
Exploit 2machine2->machine3
vulnerability2
Exploit 3machine3->machine4
vulnerability3
Event 1machine1->machine2
signature1
Event 2machine2->machine3
signature2
Distance = 1
Correlation = 1
Exploit 1machine1->machine2
vulnerability1
Exploit 2machine2->machine3
vulnerability2
Exploit 3machine3->machine4
vulnerability3
Event 1machine1->machine2
signature1
Event 2machine2->machine3
signature2
Distance = 1
Correlation = 1
Exploit 2machine2->machine3
vulnerability2
Exploit 3machine3->machine4
vulnerability3
Event 2’machine3->machine4
signature3
Distance = 2
Correlation = 1/2
Exploit 1machine1->machine2
vulnerability1
Event 1machine1->machine2
signature1
Exploit 2machine2->machine3
vulnerability2
Exploit 3machine3->machine4
vulnerability3
Event 2’machine3->machine4
signature3
Distance = 2
Correlation = 1/2
Exploit 1machine1->machine2
vulnerability1
Event 1machine1->machine2
signature1
(a)
(b)
Fig. 1.11. TVA attack graph for intrusion event correlation. Distance between incoming alarms in
predicted attack graph provides a measure of correlation.

Topological Vulnerability Analysis
17
In the case of Fig. 1.11(a), the two intrusion events are directly connected in
the graph (unity distance), giving the maximum possible correlation score (unity)
between the events. In Fig. 1.11(b), rather than being directly connected, there is
an intervening predicted exploit between the two events, i.e., they are separated
by a distance of 2. For this pair of events we compute the lower correlation score
of 0.5 (the inverse of distance 2).
We thus have a numerical score that measures how strongly events are
connected in the attack graph. We can then select a threshold value of
correlation to form multi-step attack attacks from isolated alarms. That is, event
pairs that are sufficiently well correlated can be combined into a single multi-step
attack. This is an extension of the idea shown in Fig. 1.10, now taking into
account missed detections.
We can further refine this analysis by including recent event history when
computing correlations. The idea is that occasional missed detections should be
scored higher than isolated events that happen to occur nearby. For example, a
missed detection (distance of 2) within a series of unity-distance events should be
scored higher than a pair of distance-2 events among unrelated (large-distance)
ones. As shown in Fig. 1.12, we can apply local signal averaging operations to
enhance the contrast between regions of higher and lower correlation. In this
way, we detect multi-step attacks with greater confidence, to address the
uncertainty of our intrusion detection systems.
5 10 15 20 25 30 35 40 450
5Event Distances
5 10 15 20 25 30 35 40 450
5Event Distances
5 10 15 20 25 30 35 40 450
0.5
1
Correlation
Scores
TrackTrack Track
Threshold
Fig. 1.12. Signal averaging to improve event correlation scores. Averaging attack-graph distances
for recent events provides robust event correlation in the face of intrusion detection uncertainties.

S. Jajodia and S. Noel
18
1.7. Conclusions and Outlook
To protect our critical networks, we must understand not only individual system
vulnerabilities, but also their interdependencies. The TVA approach places
vulnerabilities and their protective measures within the context of overall
network security by modeling their interdependencies via attack graphs. The
analysis of attack graphs provides alternative sets of protective measures that
guarantee safety of critical systems, ranked by cost, e.g., maximum service
availability and/or minimum number of required protective measures. Through
this unique new capability, administrators are able to determine the best sets of
protective measures that should be applied in their environment.
Our TVA system monitors the state of network assets, maintains models of
network vulnerabilities and residual risk, and combines these to produce models
that convey the impact of individual and combined vulnerabilities on overall
security posture. The central product of this system is a graph-based model
showing all the ways an attacker can penetrate a network, built from models of
network vulnerabilities and attacker exploits.
TVA is not a mere cross-referencing of security data – it is a framework for
general-purpose modeling, analysis, and visualization of network penetration.
Our TVA system provides a unique new capability, transforming raw security
data into a roadmap that lets one proactively prepare for attacks, manage
vulnerability risks, and have real-time situational awareness. It supports both
offensive (e.g., penetration testing) and defensive (e.g., network hardening)
applications, across all phases (protect, detect, react) of the information security
lifecycle.
The portrayal of attack paths through a network via TVA provides a concrete
understanding of how individual and combined vulnerabilities impact overall
network security. For example, it is possible to
• Compare possible expenditures of resources to determine which will have the
greatest impact on overall security,
• Graphically determine how much a new vulnerability will impact overall
security,
• Determine whether risk-mitigating efforts have a significant impact on
overall security, or
• Immediately observe any changes to individual machine configurations that
increase the overall risk to the enterprise.
Our TVA system transforms raw security data into a model of all possible
attack paths into a network. In providing this new capability, we have met key
technical challenges, including the design of appropriate models, efficient model

Topological Vulnerability Analysis
19
population, effective visualizations and decision support tools, and the
development of scalable mathematical representations and algorithms. Our
system addresses all these challenges, and delivers a product that offers truly
unique capabilities among security tools.
Acknowledgments
This material is based upon work supported by Homeland Security Advanced
Research Projects Agency under the contract FA8750-05-C-0212 administered
by the Air Force Research Laboratory/Rome; by Air Force Research
Laboratory/Rome under the contract FA8750-06-C-0246; by Army Research
Office under the grant W911NF-05-1-0374; by Federal Aviation Administration
under the contract DTFAWA-04-P-00278/0001; and by the National Science
Foundation under grants CT-0627493, IIS-0242237, and IIS-0430402. Any
opinions, findings, and conclusions or recommendations expressed in this
material are those of the authors and do not necessarily reflect the views of the
sponsoring organizations.
References
1. S. Jajodia, S. Noel, B. O’Berry, “Topological Analysis of Network Attack Vulnerability,” in
Managing Cyber Threats: Issues, Approaches and Challenges, V. Kumar, J. Srivastava, A.
Lazarevic (eds.), Kluwer Academic Publisher, 2005.
2. R. Deraison, Nessus, http://www.nessus.org, last retrieved April 2007.
3. eEye Digital Security, Retina® Network Security Scanner,
http://www.eeye.com/html/Products/Retina/index.html, last retrieved April 2007.
4. Foundstone, FoundScan Frequently Asked Questions,
http://www.foundstone.com/pdf/foundscan_general_faq.pdf, last retrieved April 2007.
5. Symantec Corporation, Symantec Discovery Overview,
http://www.symantec.com/enterprise/products/overview.jsp?pcid=1025&pvid=923_1, last
retrieved April 2007.
6. Symantec Corporation, Symantec DeepSight Threat Management System,
https://tms.symantec.com/Default.aspx, last retrieved April 2007.
7. Security Focus, Bugtraq Vulnerabilities, http://www.securityfocus.com/vulnerabilities, last
retrieved April 2007.
8. MITRE, CVE – Common Vulnerabilities and Exposures, http://cve.mitre.org/, last retrieved
April 2007.
9. Sourcefire, Snort – The De Facto Standard for Intrusion Detection/Prevention,
http://www.snort.org/, last retrieved April 2007.
10. O. Sheyner, J. Haines, S. Jha, R. Lippmann, J. Wing, “Automated Generation and Analysis of
Attack Graphs,” in Proceedings of the 2002 IEEE Symposium on Security and Privacy,
Oakland, CA, 2002.

S. Jajodia and S. Noel
20
11. S. Jha, O. Sheyner, J. Wing, “Two Formal Analyses of Attack Graphs,” in Proceedings of the
15th Computer Security Foundation Workshop, Nova Scotia, Canada, 2002.
12. P. Ammann, D. Wijesekera, S. Kaushik, “Scalable, Graph-Based Network Vulnerability
Analysis,” in Proceedings of the 9th ACM Conference on Computer and Communications
Security, Washington, DC, 2002.
13. S. Noel, S. Jajodia, B. O’Berry, M. Jacobs, “Efficient Minimum-Cost Network Hardening via
Exploit Dependency Graphs,” in Proceedings of the 19th Annual Computer Security
Applications Conference, Las Vegas, Nevada, 2003.
14. L. Wang, S. Noel, S. Jajodia, “Minimum-Cost Network Hardening Using Attack Graphs,”
Computer Communications, 29(18), 3812-3824, 2006.
15. S. Noel, S. Jajodia, “Managing Attack Graph Complexity through Visual Hierarchical
Aggregation,” in Proceedings of the ACM CCS Workshop on Visualization and Data Mining
for Computer Security, Fairfax, Virginia, 2004.
16. S. Noel, M. Jacobs, P. Kalapa. S. Jajodia, “Multiple Coordinated Views for Network Attack
Graphs,” in Proceedings of the 2nd International Workshop on Visualization for Computer
Security, Minneapolis, Minnesota, 2005.
17. P. Ning, Y. Cui, D. Reeves, “Constructing Attack Scenarios through Correlation of Intrusion
Alerts,” in Proceedings of the 9th ACM Conference on Computer and Communications
Security, Washington, D.C., 2002.
18. S. Noel, E. Robertson, S. Jajodia, “Correlating Intrusion Events and Building Attack
Scenarios through Attack Graph Distances,” in Proceedings of the 20th Annual Computer
Security Applications Conference, Tucson, Arizona, December 2004.
19. L. Wang, A. Liu, S. Jajodia, “An Efficient and Unified Approach to Correlating,
Hypothesizing, and Predicting Network Intrusion Alerts,” in Proceedings of the 10th
European Symposium on Research in Computer Security, Milan, Italy, September 2005.
20. L. Wang, A. Liu, S. Jajodia, “Using Attack Graphs for Correlating, Hypothesizing, and
Predicting Network Intrusion Alerts,” Computer Communications, 29(15), 2006.