total cost of ownership: economics of emerging … · ! © ricardo plc 2013 total cost of...
TRANSCRIPT

www.ricardo.com!
© Ricardo plc 2013
Total Cost of Ownership: Economics of Emerging Fleet Technologies
Alternative Powertrain Technology: Session 4 - Fuel Efficient Truck
June 11, 2013
Kenworth HEV Bucket Truck
Mark Kuhn Principal Ricardo Strategic Consulting
Volvo Technology Demonstrator
Freightliner NG and Hybrid Technology
Virtual Summit: Fuel Efficient Truck USA 2013
Examples of advanced technology applications

© Ricardo plc 2013 2 Project # 20130522
Contents
l Scope of study: technologies/segments
l Analysis methodology
l Analysis results – Diesel vs. NG, Diesel HEV, NG HEV, EV
l Conclusions / next steps
Diesel
NG
EV
Diesel HEV
NG HEV

© Ricardo plc 2013 3 Project # 20130522
Model Summary – Included Technologies and Segments
Six technologies and 22 technology / vehicle segment combinations were included in the model
CV Market: Based on Project Segments

© Ricardo plc 2013 4 Project # 20130522
Representative vehicles were selected to characterize each fleet segment and each technology; diesel used as baseline
Baseline Diesel Vehicle Inputs – Representative Vehicles
Source: U-Haul, Kenworth of Florida, HT&T Truck Centre, Rock& Dirt, Peterbilt, Kenworth, Ford, NREL, Fleet Equipment Magazine, TRB, Calstart Diesel HEV reference: HEV Express Cargo Van with Duramax 6.6L V8 Turbo Diesel with 260 hp, 525 lb.-ft. torque and B20-Diesel compatibility

© Ricardo plc 2013 5 Project # 20130522
Vehicle TCO is modeled as the PV of the sum of both CAPEX and OPEX for that vehicle within its first ownership period
Vehicle TCO
Maintenance Cost
Model Summary – Model Structure
Vehicle OPEX (PV over vehicle life) Vehicle CAPEX
Vehicle Purchase Cost
Per Vehicle Infrastructure
Cost* Fuel Cost
Engine
Transmission
Brakes
Emission Control Installation
Permits PV of Maintenance
Fuel Consumption Fuel Price Purchase
Price Incentives
PV of Salvage
Proportional Use of
Capacity
Total Infrastructure
Cost
Vehicle Fuel Consumption
Total Capacity
Fuel Economy
Idle Time
Driving Distance
+
+
x x
+
* Infrastructure costs assumed to be $0 for diesel

© Ricardo plc 2013 6 Project # 20130522
Class 3 Class 4-6 Class 7-8 Class 6 Class 8 Delivery Delivery Delivery Work Truck Intercity Truck 2012 2015 2020 2012 2015 2020 2012 2015 2020 2012 2015 2020 2012 2015 2020 Per Vehicle OPEX $ Diesel 39,864 41,774 46,354 91,556 95,282 105,687 156,911 158,043 168,206 163,600 171,119 192,759 251,418 250,992 263,456 Natural Gas 29,765 33,342 36,625 69,274 77,762 85,333 115,637 127,720 134,810 131,327 148,501 165,576 186,266 199,232 205,072 Electric 11,950 12,723 14,016 56,812 56,916 57,594 3,750 3,986 4,388 2,107 2,231 2,444 6,138 6,601 7,374 HEV 37,067 37,252 39,284 80,351 76,143 80,092 137,160 130,611 131,202 51,730 76,143 1,409 231,651 224,555 226,267 HEV+NG 21,985 24,040 24,863 46,073 50,188 51,734 87,443 93,363 92,800 35,689 41,024 9,601 158,496 166,720 164,210 PHEV #REF! #REF! #REF! #REF! #REF! #REF! 100,377 94,849 89,253 68,391 65,673 64,579 #REF! #REF! #REF! Net CAPEX - Vehicle* Diesel 29,149 30,401 32,604 53,856 56,086 60,008 58,016 60,489 64,841 133,460 138,793 148,158 90,637 95,258 102,172 Natural Gas 31,550 32,528 34,329 72,020 73,016 75,167 82,766 82,900 83,836 142,523 145,398 151,065 160,924 161,750 151,703 Electric 108,688 105,272 82,790 98,527 104,551 92,622 62,572 64,947 69,142 116,268 120,752 128,652 90,936 94,428 100,583 HEV 48,149 50,032 49,152 76,756 79,348 79,821 82,916 88,544 89,123 137,367 79,348 151,735 156,800 164,751 170,767 HEV+NG 52,924 54,485 53,127 93,056 94,238 92,641 109,666 112,896 109,963 159,267 162,367 168,543 213,537 217,478 205,636 PHEV 42,749 45,163 45,030 71,796 74,896 76,088 146,016 135,285 122,246 155,360 157,481 162,595 102,577 111,068 115,252 CAPEX - Per Vehicle Infrastructure Diesel - - - - - - - - - - - - - - - Natural Gas - - - - - - - - - - - - - - - Electric 1,850 1,906 2,003 1,850 1,906 2,003 - - - - - - - - - HEV - - - - - - - - - - - - - - - HEV+NG - - - - - - - - - - - - - - - PHEV - - - - - - - - - - - - - - - TCO (dollars for year of purchase) Diesel 69,013 72,175 78,958 145,412 151,368 165,695 214,927 218,531 233,047 297,060 309,913 340,918 342,054 346,251 365,629 Natural Gas 61,315 65,870 70,954 141,294 150,778 160,500 198,403 210,620 218,646 273,849 293,899 316,641 347,189 360,982 356,775 Electric 122,487 119,901 98,809 157,188 163,374 152,219 66,321 68,933 73,530 118,375 122,984 131,096 97,074 101,029 107,956 HEV 85,216 87,284 88,436 157,107 155,491 159,913 220,077 219,155 220,325 189,097 155,491 153,144 388,451 389,306 397,034 HEV+NG 74,910 78,526 77,990 139,129 144,425 144,375 197,109 206,259 202,764 194,956 203,391 178,144 372,033 384,197 369,847 PHEV #REF! #REF! #REF! #REF! #REF! #REF! 246,393 230,134 211,499 223,751 223,154 227,175 #REF! #REF! #REF! Payback Period (Excluding Infrastructure) Diesel - - - - - - - - - - - - - - - Natural Gas 1 1 <1 9 11 7 5 7 5 2 2 1 5 6 4 Electric 22 19 9 9 9 5 <1 <1 <1 <1 <1 <1 HEV 14 12 9 12 9 7 8 7 5 8 7 6 HEV+NG 7 7 5 10 10 6 7 9 6 6 6 4 PHEV >30 >30 >30 >30 >30 >30 21 15 6 2 2 1 #REF! #REF! #REF!
Vehicle level TCO and Payback Periods vary with each vehicle class and duty cycle combination: NG best for Class 3 vehicles; Diesel for Class 8 trucks
Model Summary – Vehicle TCO Output
TCO Summary Table
Source: Diesel Tab
TCO Summary
Notes: 1. CAPEX weighted based on proportion of total capacity used
by an individual vehicle. For example if a truck used 10DGE /year of an available 100 DGE infrastructure that cost $100, then the per vehicle infrastructure CAPEX for that truck would be $10
2. The payback period listed in this table excludes infrastructure and battery replacements. Other payback periods including both of these costs can be found at the bottom of the individual Technology Worksheets
3. All costs are in present value $ for the year stated at the column head
Class 3 Delivery
Class 8 Intercity
TCO: Lowest
NG 13% lower than diesel; followed by diesel and HEV+NG
Diesel 2% lower than, NG, followed by HEV+NG & HEV
Payback Period: Lowest
NG (~ 1 year) followed by HEV+NG (5-7 years), and HEV (9-14 years)
NG (4-6 yrs), followed by HEV+NG (4-6 yrs) and HEV (6-8 yrs)
OPEX: Lowest
EV HEV+NG
CAPEX: Lowest
Diesel Diesel
= Best in vehicle class/duty cycle

© Ricardo plc 2013 7 Project # 20130522
69
145
215
297 342
61
141
198
273
347
123 159
85
157
220
388
75
139
197
372
246 223
Diesel best: Class 8; NG best: Class 3 delivery; NG+HEV best: Class 4-6 & 7-8 delivery; PHEV best: Class 6 work truck
TCO by Segment and Technology
Source: Ricardo Fleet TCO Model
TCO Model Output – Segment, Technology and Year Comparison
Diesel Natural Gas Electric Vehicle
72
151
218
310 346
66
151
211
293
361
120 164
87
155
219
389
78
144
206
384
230 223
79
166
233
340 365
71
161
219
317 356
99
154
88
160
220
397
79
144
202
369
215 227
Class 3 Delivery Class 4-6 Delivery
Class 7-8 Delivery
Class 6 Work Truck
Class 8 Intercity
2012
2015
2020
Key Takeaways
l Class 3: NG and diesel are lowest TCO. – NG +HEV is slightly higher than
diesel vehicle – EV is consistently the highest
driven by large CAPEX.
l Relatively small range for TCO except for Class 6 work truck – Driven by high initial vehicle price
(relatively smaller percent change for the addition of new technologies)
– Majority idle fuel usage – Longest period of ownership
l Class 8 Intercity has very low relative variation in TCO – Driven by short ownership period
assumption – Mid range annual mileage
assumption
$ 1,
000s
$
1,00
0s
$ 1,
000s
6 year TCO
12 year TCO 12 year TCO 15 year TCO
5 year TCO
HEV NG-HEV PHEV Die
sel
Nat
ural
Gas
Nat
ural
Gas
NG
-HEV
PHEV
Nat
ural
Gas
NG
-HEV
NG
-HEV
PHEV
NG
Nat
ural
Gas
NG
-HEV
NG
-HEV
PHEV
Die
sel
Best-in-sector shown in green frame
1st owner useful life:

© Ricardo plc 2013 8 Project # 20130522
Class 3: For all but diesel, CAPEX exceeds OPEX. For highest cost vehicles, CAPEX is 1.5-9X higher than OPEX
Class 3 Delivery TCO Net CAPEX and OPEX Contributors
$29,149 $31,550
$108,688
$48,149 $52,924
$30,400 $32,528
$119,860
$50,030 $54,485
$32,604 $34,328
$108,152
$49,152 $53,127
$1,850
$1,906
$2,003
$39,134 $27,581
$12,480
$31,067 $21,985 $55,220
$30,533
$12,938
$37,252 $24,040 $61,011
$33,420
$14,601
$39,294 $24,863
$68,283
$59,131
$123,018
$79,216 $74,909
$85,620
$63,061
$134,704
$87,282
$78,525
$93,615
$67,748
$124,756
$88,446
$77,990
Diesel Natural Gas
Electric HEV NG+HEV Diesel Natural Gas
Electric HEV NG+HEV Diesel Natural Gas
Electric HEV NG+HEV
Source: Ricardo Fleet TCO Model
Example TCO Model Output – Class 3 Delivery
Diesel Vehicle Net CAPEX
Diesel OPEX
CNG Vehicle Net CAPEX
CNG OPEX
EV Vehicle Net CAPEX
EV OPEX
EV Infrastructure CAPEX
2012 2015 2020
Key Takeaways
l Lowest OPEX by far is with EV, but highest CAPEX
l Lowest OPEX+CAPEX is CNG, followed by diesel
l Shorter ownership periods (6 years vs. 12-15 for other classes) lead to higher % contribution of Net CAPEX to overall TCO.
l Start-stop drive cycle favors electric vehicles in OPEX, but the high initial price significantly affects the TCO
HEV Vehicle Net CAPEX
HEV OPEX
NG+HEV Vehicle Net CAPEX
NG+HEV OPEX
OPEX
CAPEX

© Ricardo plc 2013 9 Project # 20130522
$50,000
$55,000
$60,000
$65,000
$70,000
$75,000
$80,000
$85,000
$90,000
$95,000
$100,000
2012 2015 2020 CNG - Public Station CNG - Private Station CNG - In house 50 vehicles CNG - In house 100 vehicles CNG - In house 300 vehicles Nominal Diesel High Diesel Low Diesel
Small fleets (<50) see little financial benefit from installing their own CNG infrastructure; may have few other options available
Class 3 Delivery TCO: Multiple Pricing Cases
TCO Comparison – Sensitivity to Assumptions C
lass
3 D
eliv
ery
Vehi
cle
TCO
Key Takeaways l Use of private fueling stations
leads to savings over public fueling stations; depending on fleet size and fuel costs
l Small and medium fleets (100 vehicle or less) see little financial benefit from installing on-site infrastructure
l Fleets >300 vehicles will justify infrastructure investment even with low diesel fuel costs
l 50 vehicle fleets can only justify infrastructure investment if diesel fuel cost is high
l The financial benefit of natural gas class 3 delivery vehicles diminishes in areas where there is a lack of public and private refueling infrastructure
Assumptions: • Phoenix Urban Drive Cycle • No Natural Gas Incentives • No additional maintenance facility upgrades • Land costs not included in infrastructure costs
Source: Ricardo Fleet TCO Model
High Diesel $6.43/gal
Nominal Diesel $4.67/gal
Low Diesel $2.94/gal
50 v
ehic
les
100
vehi
cles
30
0 ve
hicl
es
50 v
ehic
les
100
vehi
cles
30
0 ve
hicl
es
50 v
ehic
les
100
vehi
cles
30
0 ve
hicl
es
High Diesel $4.37/gal
Nominal Diesel $3.90/gal
Low Diesel $3.01/gal

© Ricardo plc 2013 10 Project # 20130522
Class 8: OPEX >> CAPEX for diesel, OPEX is smaller % of total costs for LNG. LNG expected to outperform diesel in out years as diesel $ continues to rise, and LNG technology cost matures
2 scenarios for LNG Class 8 Intercity are compared to a diesel baseline
$90,637
$135,924 $160,924
$95,258
$137,749 $161,750
$102,172 $132,132
$151,703
$251,418 $146,136
$191,808
$250,992 $140,978
$183,785
$263,456
$133,728
$172,153
$342,055
$282,060
$352,732 $346,250
$278,727
$345,535 $365,628
$265,860
$323,856
Diesel NG Case1 NG Case2 Diesel NG Case1 NG Case2 Diesel NG Case1 NG Case2
Source: Ricardo Fleet TCO Model
TCO Model Output – Sensitivity to Assumptions
Diesel Vehicle Net CAPEX Diesel OPEX LNG Vehicle Net CAPEX LNG OPEX
2012 2015 2020
Case Descriptions / Key Takeaways l Liquefied Natural Gas Case 1:
– In-house fuel cost – 120 DGE tank (~300 mile
range) l Liquefied Natural Gas Case 2:
– Public Pump fuel Price – 240 DGE tank (~600 mile
range)
l 2020 Cost advantage of LNG Case #1 due to lower pump price than in-house price, (~$35K) and lower cost of smaller fuel tank (~$25K)
l Downward cost trend of LNG due to increasing forecast of diesel price, and decreasing cost of LNG technology as technology matures and incremental cost penalty decreases
OPEX
CAPEX
Diesel TCO trends upward LNG TCO trends downward
© Ricardo plc 2013 11 Project # 20130522
$200,000
$250,000
$300,000
$350,000
$400,000
$450,000
$500,000
2012 2015 2020 LNG - Public Station LNG - Private Station LNG - In house 50 vehicles LNG - In house 100 vehicles LNG - In house 300 vehicles Nominal Diesel High Diesel Low Diesel
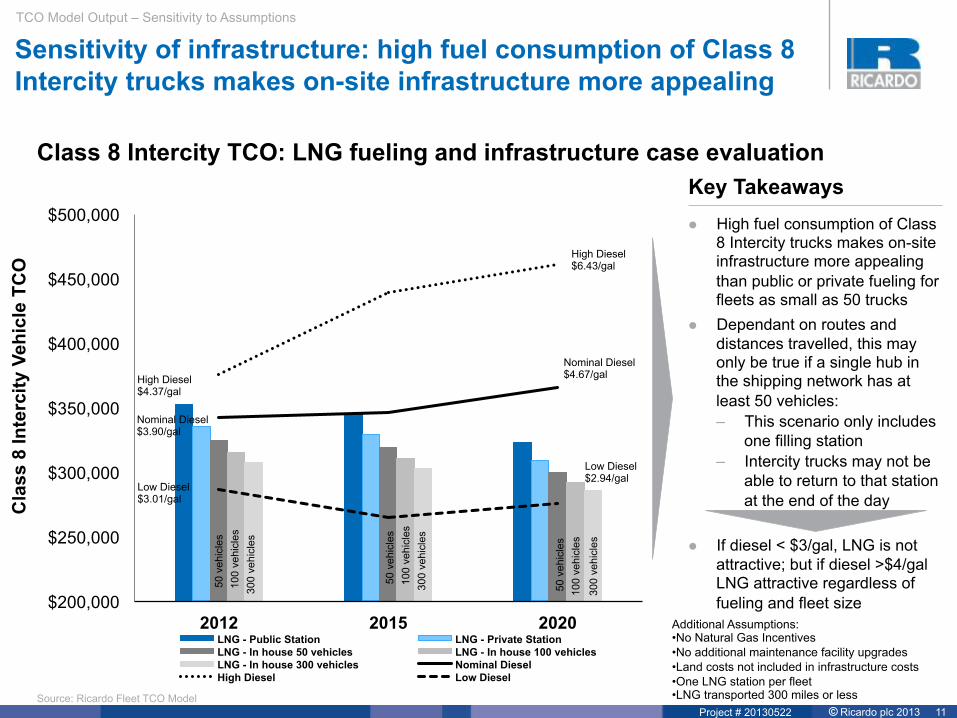
Sensitivity of infrastructure: high fuel consumption of Class 8 Intercity trucks makes on-site infrastructure more appealing
Class 8 Intercity TCO: LNG fueling and infrastructure case evaluation
TCO Model Output – Sensitivity to Assumptions C
lass
8 In
terc
ity V
ehic
le T
CO
Key Takeaways l High fuel consumption of Class
8 Intercity trucks makes on-site infrastructure more appealing than public or private fueling for fleets as small as 50 trucks
l Dependant on routes and distances travelled, this may only be true if a single hub in the shipping network has at least 50 vehicles: – This scenario only includes
one filling station – Intercity trucks may not be
able to return to that station at the end of the day
l If diesel < $3/gal, LNG is not attractive; but if diesel >$4/gal LNG attractive regardless of fueling and fleet size Additional Assumptions:
• No Natural Gas Incentives • No additional maintenance facility upgrades • Land costs not included in infrastructure costs • One LNG station per fleet • LNG transported 300 miles or less Source: Ricardo Fleet TCO Model
High Diesel $6.43/gal
Nominal Diesel $4.67/gal
Low Diesel $2.94/gal
High Diesel $4.37/gal
Nominal Diesel $3.90/gal
Low Diesel $3.01/gal
50 v
ehic
les
100
vehi
cles
300
vehi
cles
50 v
ehic
les
100
vehi
cles
30
0 ve
hicl
es
50 v
ehic
les
100
vehi
cles
30
0 ve
hicl
es

© Ricardo plc 2013 12 Project # 20130522
Class 6 Work Truck: PHEV option allows engine-off operation at work site, significantly reducing fuel costs
Class 6 Delivery TCO Net CAPEX and OPEX Contributors
$133,460 $142,523 $155,360 $138,793 $145,398 $157,481 $148,158 $151,065 $162,595
$163,600 $131,327 $68,391
$171,119 $148,501
$65,673
$192,759 $165,576
$64,579
$297,060
$273,850
$223,751
$309,912 $293,899
$223,154
$340,917
$316,641
$227,174
Diesel Natural Gas PHEV Diesel Natural Gas PHEV Diesel Natural Gas PHEV
Source: Ricardo Fleet TCO Model
TCO Model Output – Class 6 Delivery
Diesel Vehicle Net CAPEX
Diesel OPEX
CNG Vehicle Net CAPEX
CNG OPEX
2012 2015 2020
Key Takeaways l Lowest OPEX by far is with
PHEV, but highest CAPEX l Lowest OPEX+CAPEX is
PHEV, followed by natural gas l Longer ownership periods
(12-15 years vs. 6 for other classes) lead to higher % contribution of Net OPEX to overall TCO.
l Best for high PTO utilization duty cycles
PHEV Vehicle Net CAPEX
PHEV OPEX
OPEX
CAPEX
2012 Annual Fuel Cost
$3,273 $4,104
$5,660
$4,104
$5,074
Idle
Propulsion
$10,734
$7,377
$357 $4,461
Natural Gas PHEV Diesel

© Ricardo plc 2013 13 Project # 20130522
Operating cost variables are effected by brake life, battery life, oil change intervals, filter replacements and oil cost
HEV: Key observations 1. Hybrid systems significantly reduce brake replacement frequency, significantly reducing maintenance costs for high
mileage duty cycles. HEV brake maintenance savings more than offsets battery replacement costs for vehicles kept longer than the estimated 8 year battery life
2. NG: shorter oil change intervals, tank inspections, and more frequent filter replacements lead to slightly higher maintenance costs for natural gas vehicles. SI engines also require that natural gas engine oil be used.
3. NG HEV: maintenance costs offer significant reductions over conventional diesel vehicles
Source: Peterbilt Hybrid System Maintenance Manual, NREL/TP-5400-53503, NREL Merit Review - Coca Cola, NREL/TP-540-44314, NREL/CR-540-42534
OPEX: Maintenance Costs
Notes: 1. This study does not take into account increased diagnostic time involved in introducing a new technology into your shop. In several NREL hybrid fleet studies, the troubleshooting of problems with HEV systems offset maintenance cost advantages. 2. Battery replacement PV is used for all model calculations. Annualized battery replacement is used only for illustrative comparisons between baseline and HEV maintenance. 3. New technology troubleshooting and low volume part scarcity potential with this technology are not considered in the model 4. Additional diagnostic costs associated with the repairs to new technologies are not included
Class 3 Class 4-6 Class 7-8 Class 6 Class 8Delivery Delivery Delivery Work Truck Intercity Truck
HEV Maintenance and Overhead 693$ 1,234$ 854$ #VALUE! 2,598$ HEV Brake Maintenance 161$ 250$ 282$ -$ 589$ HEV Other Maintenance and Overhead 533$ 743$ 494$ #VALUE! 2,010$ HEV Battery Replacement (annualized) -$ 241$ 79$ #VALUE! -$ HEV Battery Replacement (PV) -$ 2,896$ 945$ #VALUE! -$ Diesel Maintenance and Overhead 1,255$ 1,877$ 1,949$ 3,425$ 4,360$ Diesel Brake Maintenance 804$ 1,248$ 1,472$ 2,944$ 2,944$ Diesel Other Maintenance and Overhead 451$ 629$ 477$ 481$ 1,416$ Class 3 Class 4-6 Class 7-8 Class 6 Class 8
Delivery Delivery Delivery Work Truck Intercity Truck
Natural Gas Maintenance and Overhead 1,748$ 2,155$ 2,606$ 3,653$ 5,831$ Diesel Maintenance and Overhead 1,500$ 1,877$ 2,181$ 3,425$ 4,360$
Class 3 Class 4-6 Class 7-8 Class 6 Class 8Delivery Delivery Delivery Work Truck Intercity Truck
NG-HEV Maintenance and Overhead 779$ 1,318$ 1,423$ -$ 2,532$ Baseline Diesel Maintenance and Overhead 1,255$ 1,877$ 1,949$ 3,425$ 4,360$
Class 3 Class 4-6 Class 7-8 Class 6 Class 8Delivery Delivery Delivery Work Truck Intercity Truck
HEV Maintenance and Overhead 693$ 1,234$ 854$ #VALUE! 2,598$ HEV Brake Maintenance 161$ 250$ 282$ -$ 589$ HEV Other Maintenance and Overhead 533$ 743$ 494$ #VALUE! 2,010$ HEV Battery Replacement (annualized) -$ 241$ 79$ #VALUE! -$ HEV Battery Replacement (PV) -$ 2,896$ 945$ #VALUE! -$ Diesel Maintenance and Overhead 1,255$ 1,877$ 1,949$ 3,425$ 4,360$ Diesel Brake Maintenance 804$ 1,248$ 1,472$ 2,944$ 2,944$ Diesel Other Maintenance and Overhead 451$ 629$ 477$ 481$ 1,416$
3,425 2,944
481 $ $
$

© Ricardo plc 2013 14 Project # 20130522
PHEV batteries need to be sized to balance the maintenance impact of battery replacement with improved fuel consumption
PHEV: Battery size and replacement impact maintenance costs significantly
Source: Hybrid and Natural Gas Sections
Diesel PHEV Vehicle Inputs – OPEX: Maintenance
● The hybrid impact on reducing brake replacement frequency has a significant effect on the maintenance costs for vehicles with high mileage duty cycles.
● New technology troubleshooting and low volume part scarcity potential with this technology are not considered in the model
● Class 6 work truck assumes 100% operation on battery power if at work site; under ~40 mph uses battery assist depending on range
Battery replacement PV is used for all model calculations. Annualized battery replacement is used only for illustrative comparisons between baseline and HEV maintenance.
Class 3 Class 4-6 Class 7-8 Class 6 Class 8Delivery Delivery Delivery Work Truck Intercity Truck
HEV Maintenance and Overhead #REF! #REF! 3,202$ 1,108$ #REF! HEV Brake Maintenance 161$ 250$ 282$ 294$ 589$ HEV Other Maintenance and Overhead #REF! #REF! 488$ 520$ #REF! HEV Battery Replacement (annualized PV) #REF! #REF! 2,432$ 294$ #REF! HEV Battery Replacement (PV) 29,185$ 4,404$ Diesel Maintenance and Overhead 1,255$ 1,877$ 1,949$ 3,425$ 4,360$ Diesel Brake Maintenance 804$ 1,248$ 1,472$ 2,944$ 2,944$ Diesel Other Maintenance and Overhead 451$ 629$ 477$ 481$ 1,416$
Battery pack size (Kw-hrs) 90 13

© Ricardo plc 2013 15 Project # 20130522
Conclusions
l Commercial vehicles were modeled with 6 powertrain technology configurations, including diesel as the baseline powertrain, and 22 combinations of powertrain & vehicle/duty cycle
l TCO: – TCO can be reduced by 14% or increase by as much as 80% depending on technology, duty cycle,
infrastructure and fuel costs – Operating cost variation is effected by brake life, battery life, oil change intervals, filter replacements
and oil cost
l Payback period: – Payback period for introducing new technology ranges from 1 to 23 years
• 1 year: Class 3 delivery NG, and Class 6 work truck NG and PHEV • 23 years: Class 3 delivery EV, driven by CAPEX: battery pack, motor and power electronics,
charging infrastructure and low volumes associated with new technology – Payback period is sensitive to infrastructure requirements paced by fleet size, the rate of diesel fuel
cost increase and desired vehicle range (battery or tank size)
l Technology choice for lowest TCO: – Diesel best: Class 8 – NG best: Class 3 delivery
l Next steps: expand to more technologies, and more applications: off highway, agriculture, mining, marine, power generation…
– NG+HEV best: Class 4-6 delivery & 7-8 delivery – PHEV best: Class 6 work truck

www.ricardo.com!
© Ricardo plc 2013
Total Cost of Ownership: Economics of Emerging Fleet Technologies
Thank you!
Links: American Gas Association Natural Gas Fleet Savings Calculator http://www.aga.org/our-issues/natural-gas-vehicles/Pages/Natural-Gas-Fleet-Savings-Calculator.aspx Or Google: Ricardo Fleet Savings Calculator
Ricardo Strategic Consulting • Ricardo Inc. Detroit Technology Campus, 40000 Ricardo Drive Van Buren Twp., Michigan 48111 USA
Christopher Yee Manager
Telephone: +1 734.306.5055 Facsimile: +1 734.397.6677
Ricardo Strategic Consulting • Ricardo Inc. Detroit Technology Campus, 40000 Ricardo Drive Van Buren Twp., Michigan 48111 USA
Mark S. Kuhn, P.E. Principal
Mobile: +1 248 819 5744 Recption: +1 734 397 6666 Facsimile: +1 734 397 6677
www.ricardo.com

© Ricardo plc 2013 17 Project # 20130522
Additional backup slides for Q&A

© Ricardo plc 2013 18 Project # 20130522
The TCO analysis is a spreadsheet-based model which can be used for conducting further scenario analysis
Analysis Spreadsheet
Fleet SegmentClass 3 Class 4-6 Class 7-8 Class 6 Class 8 Other Weight Class
Units Delivery Delivery Delivery Work Truck Intercity Truck Other Duty CycleMarket Characteristics
Typical Operating Mode Shorter routeMultiple stopsSignificant idling
Shorter routeMultiple stopsSignificant idling
Shorter routeMultiple stopsSignificant idling
Larger RangeFewer StopsSignificant Idling
Large RangeFew StopsIdling for hotel load
Example Operators FEDEX USPS UPS Coca Cola
Duty Cycle Description
Urban Delivery140 Stops per dayAvg 17mph
Urban Delivery140 Stops per dayAvg Speed 17mph
Rural Delivery80 Stops per dayAvg Speed 34 mph
Duty Cycle SelectionDuty Cycle LA Urban Phoenix Urban Minneapolis Urban CustomDuty Cycle Inputs Days Used/year 280 280 280 280 292 Days Used/year 280 280 280
Operating Time (vehicle on) hours/day 4 4 4 8 14 Operating Time (vehicle on) 3 4 3.5Percent Time @ Idle % Operating Time 13% 13% 13% 60% 43% Percent Time @ Idle 0% 13% 0%2-10 mph % Operating Time 20% 20% 20% 5% 10% 2-10 mph 35% 20% 37%11-20 mph % Operating Time 30% 30% 30% 10% 11-20 mph 30% 30% 35%21-30 mph % Operating Time 15% 15% 15% 5% 10% 21-30 mph 20% 15% 16%31-40 mph % Operating Time 6% 6% 6% 10% 31-40 mph 15% 6% 6%41-50 mph % Operating Time 7% 7% 7% 30% 10% 10% 41-50 mph 0% 7% 3%51-60 mph % Operating Time 5% 5% 5% 2% 20% 51-60 mph 0% 5% 2%61-70 mph % Operating Time 4% 4% 4% 5% 35% 30% 61-70 mph 0% 4% 1%
Total Operating Check Total Operating Time Mix 100% 100% 100% 95% 100% 100% 100% 100% 100% 0%Total Annual Miles Miles Driven - Yearly miles/year 19,751 19,751 19,751 37,912 122,783 - Idle Time Calculations Idle Time - Daily hours/day 0.52 0.52 0.52 4.8 6.0 0 LA Urban 2
Idle Time - Yearly hours/year 146 146 146 1,344 1,758 - Phoenix Urban 3Duty Cycle WeightedMiles @ Speed Calculations 2-10 mph miles/day 2.8 2.8 2.8 0.0 2.5 0.0 Minneapolis Urban 4
11-20 mph miles/day 9.6 9.6 9.6 0.0 0.0 0.0 Custom 521-30 mph miles/day 15.3 15.3 15.3 0.0 17.9 0.031-40 mph miles/day 8.5 8.5 8.5 0.0 0.0 0.0 Class 3 Class 4-6 Class 7-841-50 mph miles/day 12.7 12.7 12.7 109.2 63.7 0.0 Phoenix UrbanPhoenix Urban Phoenix Urban51-60 mph miles/day 11.1 11.1 11.1 0.0 15.5 0.0 3 3 361-70 mph miles/day 10.5 10.5 10.5 26.2 321.0 0.0Total Miles per day miles/day 70.5 70.5 70.5 135.4 420.5 0.0Average Operating Speed mph 23 23 23 48 53 44
2012 2013 2014 2015 2016 2017 2018 2019 2020 2021 2022Fuel PricesDiesel High Estimate $/gallon 4.370$ 4.816$ 5.063$ 5.628$ 5.559$ 5.806$ 6.054$ 6.301$ 6.430$ 6.590$ 6.751$ Tax (Rebate) $/gallon -$ -$ -$ -$ -$ -$ -$ -$ -$ -$ -$ Nominal Nominal $/gallon 3.900$ 3.950$ 4.049$ 4.069$ 4.246$ 4.345$ 4.443$ 4.542$ 4.670$ 4.7902 4.9104High Estimate High Estimate $/gallon 4.370$ 4.816$ 5.063$ 5.628$ 5.559$ 5.806$ 6.054$ 6.301$ 6.430$ 6.5904 6.7508Low Estimate Low Estimate $/gallon 3.012$ 2.874$ 2.872$ 2.653$ 2.869$ 2.867$ 2.866$ 2.864$ 2.944$ 3.0022 3.0604Custom Custom $/gallon 0 0 0 0 0 0 0 0 0 0 0CNG In-House Cost $/DGE 0.73$ 1.64$ 1.10$ 1.01$ 1.10$ 1.17$ 1.22$ 1.28$ 1.33$ 1.38$ 1.43$ LNG In-House Cost $/DGE 1.34$ 2.47$ 1.94$ 1.85$ 1.95$ 2.03$ 2.10$ 2.16$ 2.22$ 2.27$ 2.33$ Henry Hub Gas Price Price at the Pump $/DGE 0.32$ 0.39$ 0.48$ 0.59$ 0.62$ 0.65$ 0.68$ 0.71$ 0.74$ 0.77$ 0.81$ Basis and Delivery $/DGE 0.20$ 0.20$ 0.21$ 0.21$ 0.22$ 0.22$ 0.23$ 0.23$ 0.23$ 0.24$ 0.24$ 2% annual increaseSite Operating Costs, Capital Recovery, and Profit $/DGE 1.60$ 1.63$ 1.66$ 1.70$ 1.73$ 1.77$ 1.80$ 1.84$ 1.87$ 1.91$ 1.95$ 2%LNG cost increase over CNG $/DGE 0.40$ 0.41$ 0.42$ 0.42$ 0.43$ 0.44$ 0.45$ 0.46$ 0.47$ 0.48$ 0.49$ 2%CNG Taxes (Federal Excise Tax) $/DGE 0.21$ 0.21$ 0.21$ 0.21$ 0.21$ 0.21$ 0.21$ 0.21$ 0.21$ 0.21$ 0.21$ LNG Taxed (Federal Excise Tax) $/DGE 0.42$ 0.42$ 0.42$ 0.42$ 0.42$ 0.42$ 0.42$ 0.42$ 0.42$ 0.42$ 0.42$ In-House CNG OPEX $/DGE -$ 0.84$ 0.21$ -$ 0.06$ 0.09$ 0.12$ 0.13$ 0.15$ 0.16$ 0.17$ In-house CNG cost $/DGE 0.73$ 1.64$ 1.10$ 1.01$ 1.10$ 1.17$ 1.22$ 1.28$ 1.33$ 1.38$ 1.43$ CNG Price at the Pump $/DGE 2.33$ 2.44$ 2.56$ 2.71$ 2.77$ 2.84$ 2.91$ 2.98$ 3.06$ 3.13$ 3.21$ Electricity $/DGE 3.72$ 3.81$ 3.90$ 4.00$ 4.09$ 4.18$ 4.28$ 4.37$ 4.46$ 4.56$ 4.65$ Electricity $/kWhr 0.099$ 0.101$ 0.104$ 0.106$ 0.109$ 0.111$ 0.114$ 0.116$ 0.119$ 0.121$ 0.124$ Fuel PricesDEF Prices 2.9 2.958 3.01716 3.0775032 3.139053264 3.201834329 3.265871016 3.331188436 3.397812205 3.465768449 3.535083818DEF Price E.R. 2012-2015 2%DEF Price E.R. 2015-2020 2%
Return To FleetManagement Dashboard
High Estimate
In-House Cost
Phoenix Urban Phoenix Urban Phoenix Urban
Fleet CompositionFleet Size vehicles 100Fleet growth rate 2012-2015 % 1%Fleet growth rate 2015-2022 % 1%Discount Rate % 6%
Fleet Structure (percentage)
Tool Navigation - InputsVehicle Duty Cycle LinkFuel Pricing Link 2012 2015 2020 2012 2015 2020 2012 2015 2020 2012 2015 2020 2012 2015 2020 2012 2015 2020 2012 2015 2020Infrastructure Link Diesel 20% 10% 5% 40% 30% 10% 40% 30% 10% 100% 70% 25%Diesel Vehicle Link Natural Gas 0% 5% 10% 0% 10% 20% 0% 10% 30% 0% 25% 60%Natural Gas Vehicle Link Electric 0% 5% 5% 0% 0% 10% 0% 5% 15%Electric Vehicle Link HEV 0% 0% 0%Diesel HEV Link HEV+NG 0% 0% 0%Natural Gas HEV Link PHEV 0% 0% 0%PHEV Link Other 0% 0% 0%Other Technology Vehicle Link 100% 100% 100%
Number Of Vehicles per Segment by Year TotalTool Navigation - Outputs 2012 2015 2020 2012 2015 2020 2012 2015 2020 2012 2015 2020 2012 2015 2020 2012 2015 2020 2012 2015 2020Total Cost of Ownership Tables Link Diesel 20 10 5 40 30 10 40 30 10 0 0 0 0 0 0 0 0 0 100 70 25Vehicle CAPEX and OPEX Link Natural Gas 0 5 10 0 10 21 0 10 32 0 0 0 0 0 0 0 0 0 0 25 63TCO by Vehicle Segment Link Electric 0 5 5 0 0 10 0 0 0 0 5 15
HEV 0 0 0 0 0 0 0 0 0 0 0 0 0 0 0 0 0 0HEV+NG 0 0 0 0 0 0 0 0 0 0 0 0 0 0 0 0 0 0PHEV 0 0 0 0 0 0 0 0 0 0 0 0
Tool Navigation - Information Other 0 0 0 0 0 0 0 0 0 0 0 0 0 0 0 0 0 0 0 0 0Acronyms Link 100 100 103 References Link
Legendentry carryover from dieselomitted not functionalcalculation interpolatedoutput estimated w. refinformation estimated
2012-2015 Fleet Total Cost Of Ownership
DieselNatural GasElectricHEVHEV+NGPHEVOther
2012-2020 Fleet Total Cost Of Ownership
DieselNatural GasElectricHEVHEV+NGPHEVOther
2012-2022 Fleet Total Cost Of Ownership
DieselNatural GasElectricHEV -$ HEV+NGPHEVOther
2012 DollarsDollars in Time
OPEX2012
Diesel 10722.23524
Natural Gas4003.554146
Electric 3803.619328
2012 2015 2020 2012 2015 2020 2012 2015 2020 2012 2015 2020 2012 2015 2020 2012 2015 2020 HEV 8742.714378
Per Vehicle OPEX $ HEV+NG5242.45538
Diesel 9,260 11,159 12,277 10,722 13,049 14,350 18,891 22,771 24,012 25,077 30,848 34,147 89,361 107,554 111,873 - - - PHEV 0
Natural Gas 3,494 4,133 4,789 4,004 4,668 5,426 6,066 7,184 8,294 7,764 9,346 11,161 35,085 44,052 47,966 - - - Other 15877.93951
Electric 3,447 4,352 4,916 3,804 4,807 5,431 - - -
HEV 7,056 8,634 9,474 8,743 10,717 11,737 16,244 19,640 20,592 79,588 95,414 98,136 - - -
HEV+NG 4,419 5,517 6,294 5,242 6,400 7,310 8,531 10,742 12,417 35,085 45,977 53,754 - - - Class 4-6 Delivery4PHEV 18,527 22,311 22,824 28,492 35,377 37,903 - - - Class 3 Delivery1Other 12,830 15,648 17,205 15,878 19,532 21,468 18,891 22,771 24,012 30,200 37,291 41,220 100,945 121,530 126,194 - - - Class 4-6 Delivery4CAPEX - Vehicle Class 7-8 Delivery7Diesel 35,520 36,965 39,503 57,720 60,068 64,193 90,400 94,152 100,750 71,585 74,703 80,194 80,024 81,229 87,520 - - - Class 6 Work Truck10Natural Gas 51,730 50,462 46,293 96,530 94,100 86,162 182,350 178,110 163,968 167,915 164,813 153,739 275,476 273,821 255,680 2 2 2 Class 8 Intercity Truck13Electric 122,150 118,151 111,838 134,225 128,781 120,088 - - - Other 16HEV 55,701 57,484 60,577 89,390 92,194 97,058 162,820 167,944 176,833 237,756 240,197 252,770 2 2 2
HEV+NG 56,259 55,129 51,198 103,890 101,683 94,132 202,166 198,526 185,425 294,028 292,558 278,627 2 2 2
PHEV 141,656 145,156 157,542 139,131 142,408 154,005 2 2 2
Other 49,009 50,863 54,110 79,640 82,652 87,929 149,416 154,956 164,656 145,016 150,358 159,709 208,528 211,018 223,930 - - -
2012 2015 2020 2012 2015 2020 2012 2015 2020 2012 2015 2020 2012 2015 2020 2012 2015 2020TCO in 2012 DollarsDiesel 113,155 109,584 89,363 147,614 142,290 115,758 248,780 239,345 189,517 177,217 171,825 140,561 456,446 448,596 350,580 - - -
Natural Gas 95,307 86,547 68,776 149,356 130,704 100,746 271,433 236,418 179,823 248,119 218,067 171,188 612,166 563,755 448,644 2 2 1
Electric 151,051 129,838 96,028 166,114 141,967 103,912 - - -
HEV 114,860 109,043 87,844 162,688 152,847 122,632 299,009 279,262 219,265 450,497 415,812 323,173 2 2 1
HEV+NG 93,306 85,121 65,230 147,842 130,423 97,512 273,692 242,300 181,651 441,817 408,249 314,839 2 2 1
PHEV 296,987 308,925 290,195 259,151 244,691 196,797 2 2 1
Other 156,575 152,852 124,452 212,758 206,887 168,090 307,796 290,397 229,613 272,230 258,133 209,143 633,745 606,998 474,014 - - -
Delivery Delivery Delivery Work Truck Intercity Truck OtherClass 3 Class 4-6 Class 7-8 Class 6 Class 8 Other
Total PercentageClass 6
Work TruckClass 8
Intercity TruckOtherOtherDelivery
Class 3 Class 4-6Delivery
Class 7-8Delivery
-$ -$
(447,139)$ 2,390,271$
525,013$ -$ -$ -$ -$
4,747,516$ 243,432$ 32,367$
-$ -$
-$ -$
4,300,378$ 4,483,832$
557,380$ -$ -$ -$ -$
-$ 1,850,129$
-$ -$ -$
OPEX CAPEX - Vehicles CAPEX - InfrastructureTotal Cost of Ownership
OPEX CAPEX - InfrastructureTotal Cost of OwnershipCAPEX - Vehicles
1,295,499$ 5,477,382$ 2,191,504$ 8,964,385$ 7,527,537$ (1,363,744)$ -$ 6,163,793$
-$ -$ -$ -$ 220,470$ 1,400,218$ -$ 1,620,689$
-$ -$ -$ -$ -$ -$ -$ -$
16,748,867$
OPEX CAPEX - Vehicles CAPEX - InfrastructureTotal Cost of Ownership
-$ -$ -$ -$
1,909,632$ 6,488,066$ 2,320,129$ 10,717,827$ 10,717,827$ 7,760,206$ (1,410,091)$ -$ 6,350,115$ 6,350,115$
-$ -$ -$ -$ -$ -$ -$ -$
340,010$ 1,740,841$ -$ 2,080,852$ 2,080,852$
9,341,589$ Total Fleet
Total Fleet
Total Fleet -$ -$ -$ -$ -$ -$ -$ -$ -$ -$ -$ -$ -$
Class 3 Class 4-6 Class 7-8 Class 6 Class 8 0Delivery Delivery Delivery Work Truck Intercity Truck 0
0
5000
10000
15000
20000
25000
OPE
X$/
Vehi
cle/
Year
2012
2015
2020
0
20000
40000
60000
80000
100000
120000
140000
160000
CAPE
X$/
Vehi
cle/
Year
2012
2015
2020
Diesel
Natural Gas
Electric
HEV
HEV+NG
PHEV
Other
Diesel
Natural Gas
Electric
HEV
HEV+NG
PHEV
Other
Class 4-6 Delivery
Diesel Vehicle Calculations2012
Class 3 Class 4-6 Class 7-8 Class 6Units Delivery Delivery Delivery Work Truck
Application InformationVehicle Supplier Ford Kenworth Peterbilt PeterbiltVehicle Model F350-XL T170 337 320Fuel Tank gallons 26 30 45 56Engine Supplier Ford PACCAR PACCAR Cummins
Engine Model
Power Stroke ® V8 Turbo Diesel PX-6 PX-8 ISL-9
Displacement Liters 6.7 6.7 8.3 6.7Horsepower hp 400 200-235 260-350 345-380Governed Speed RPM 2600 2200 1100Torque ft-lb 800 350 600-1000 1150-1300Cyliners 8 6 6 6Oil Spec API CJ-4 CES20078 CES20078 CES20078
OPEX Model InputsVehicle Characteristics Oil Capacity gallons 2.0 4.5 6.3 7.3
Coolant Capacity gallons 7.3 3.0 3.3 3.0 Transmission Fluid Capacity gallons 2.4 2.4 2.6 2.4 Fuel Consumption at idle gallons/hour 0.79 0.81 0.94 0.81 DEF Consumption mpg 333 350 350 350 Number of 12 V Batteries batteries/vehicle 2 2 2 2
Fluid Pricing Oil Price $/gallon 15.00$ 18.00$ 18.00$ 18.00$ Coolant Price $/gallon 10.00$ 8.00$ 8.00$ 8.00$ Transmission Fluid $/gallon 50.00$ 50.00$ 50.00$ 50.00$
Maintenance Parts Oil Filter $ 15.00$ 12.00$ 40.00$ 12.00$ Fuel Filter $ 60.00$ 60.00$ 40.00$ 60.00$ DEF Filter $ -$ 100.00$ 100.00$ 100.00$ Diesel Particulate Filter (DPF) $ 1,700.00$ -$ -$ -$ Air Filter Price $ 27.00$ 40.00$ 35.00$ 40.00$ Overhead Adjustment Parts $ -$ -$ -$ -$ Coolant Filter $ -$ 10.00$ 15.00$ 10.00$ Batter Price $ 100.00$ 180.00$ 180.00$ 180.00$ Brakes/Pads Parts $ 800.00$ 800.00$ 800.00$ 800.00$ Transmission Filter $ 15.00$ 70.00$ 60.00$ 70.00$ Engine Overhaul Parts $ -$ -$ -$ -$ Transmission Overhaul Parts $ -$ -$ -$ -$ Other Maintenance A Parts $ -$ -$ -$ -$ Other Maintenance B Parts $ -$ -$ -$ -$ Other Maintenance C Parts $ -$ -$ -$ -$ Other Maintenance D Parts $ -$ -$ -$ -$ Other Maintenance E Parts $ -$ -$ -$ -$ Other Service Part Costs $ -$ -$ -$ -$
Maintenance Labor Oil Change Labor hours 2 2 2 2Fuel Filter Replacement Labor hours 2 2 2 2DEF Filter Replacement Labor hours 0 4 4 4DPF Cleaning Labor hours 4 4 4 4DPF Replacement Labor hours 4 0 0 0Air Filter Replacement Labor hours 0.5 0.5 0.5 0.5Overhead Adjustment Labor hours 4 4 4 4Coolant Filter Labor hours 0.5 0.5 0.5 0.5Coolant Fluid Replacement Labor hours 8 8 8 8Brakes Labor hours 4 4 4 4Battery Labor hours 0.5 0.5 0.5 0.5Transmission Fluid Replacement Labor hours 2 2 2 2 Engine Overhaul Labor hours 16 16 16 16
Return To FleetManagement Dashboard
Vehicle technology composition
Selection of vehicle segment composition
Duty cycle segment
Fuel type: OPEX and CAPEX
Fuel pricing scenarios
OPEX inputs
Application information
TCO Output by vehicle and fuel type, in 2013
dollars
Fleet TCO by year
Tool navigation

© Ricardo plc 2013 19 Project # 20130522
Fuelpath: reduce fuel consumption and emissions by changing the way your drivers drive

© Ricardo plc 2013 20 Project # 20130522
Actual savings from fleet implementation…
Example fleet: ● 300 vans ● 24,000 annual miles per van
● 100 large goods vehicles ● 45,000 annual miles per vehicle
● Annual fuel bill reduced by over $600,000
● Annual CO2 emissions reduced by 890 tonnes
● Fuel consumption reduced by 16% for vans and 10% for large goods vehicles
● Annual fuel savings of $988/van and $3040 per LGV
● Plus ● Fewer gear changes ● Reduced accidents ● Reduced insurance premiums

© Ricardo plc 2013 21 Project # 20130522
Fuelpath includes training, behavioral change, fleet performance measurement, data monitoring and sustainability programs
http://www.ricardo-aea.com/cms/