total non-methane organic carbon christophe maris, myeong chung, udo krischke, richard meller and...
TRANSCRIPT
Total Non-Methane Organic Carbon
Christophe Maris, Myeong Chung, Udo Krischke, Richard Meller
and Suzanne Paulson
Department of Atmospheric SciencesUniversity of California at Los Angeles
Funding Provided by • California Air Resources Board • UC Campus-Laboratory
Collaboration • California Space Institute
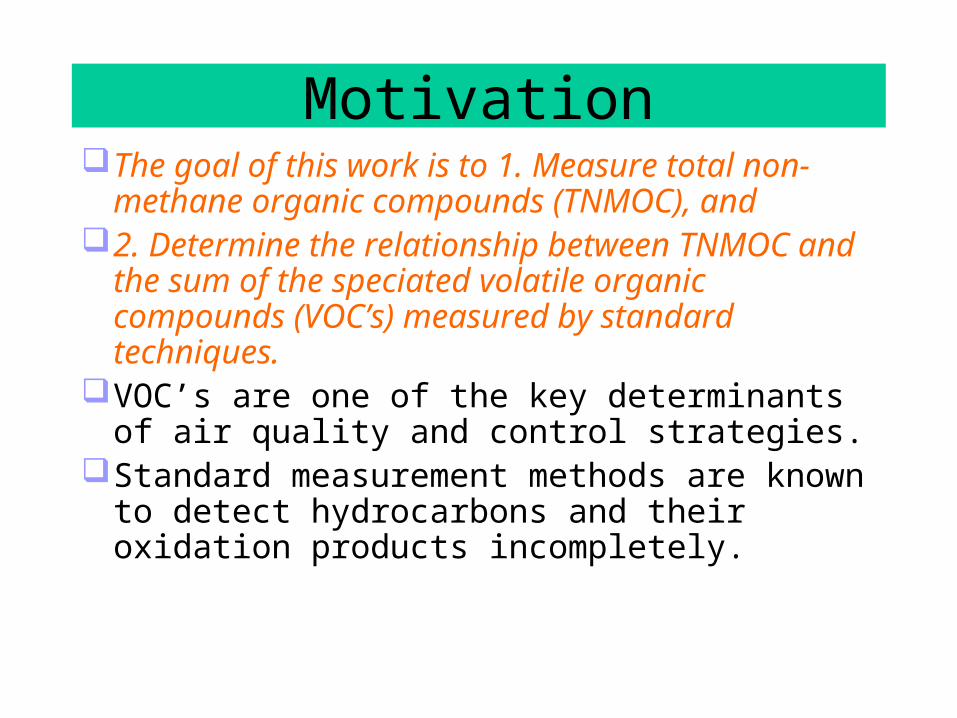
MotivationThe goal of this work is to 1. Measure total non-
methane organic compounds (TNMOC), and 2. Determine the relationship between TNMOC
and the sum of the speciated volatile organic compounds (VOC’s) measured by standard techniques.
VOC’s are one of the key determinants of air quality and control strategies.
Standard measurement methods are known to detect hydrocarbons and their oxidation products incompletely.

Possible Sources of Excess TNMOC compared to the Sum of
Speciated VOC’s
(Standard VOC Measurement)
Compounds that are lost in the inlet or column (polars, semi-volatiles).
Compounds that are obscured in the GC baseline (hydrocarbons).
Heteroatom compounds that have a reduced response in an FID.

Method1. Trap VOC’s from 2 ambient air samples
simultaneously in a cryogenically cooled trap. Allow CO, CO2, and CH4 to pass through.
2. Desorb both VOC samples.
Speciated VOC’s: analyze directly with DB-1 Column, GC/FID. = Standard Measurement
TNMOC: oxidize CO2, analyze as methane w/ GC/FID. = True total of VOC’s
3. Compare TNMOC with the standard measurement of VOC’s.
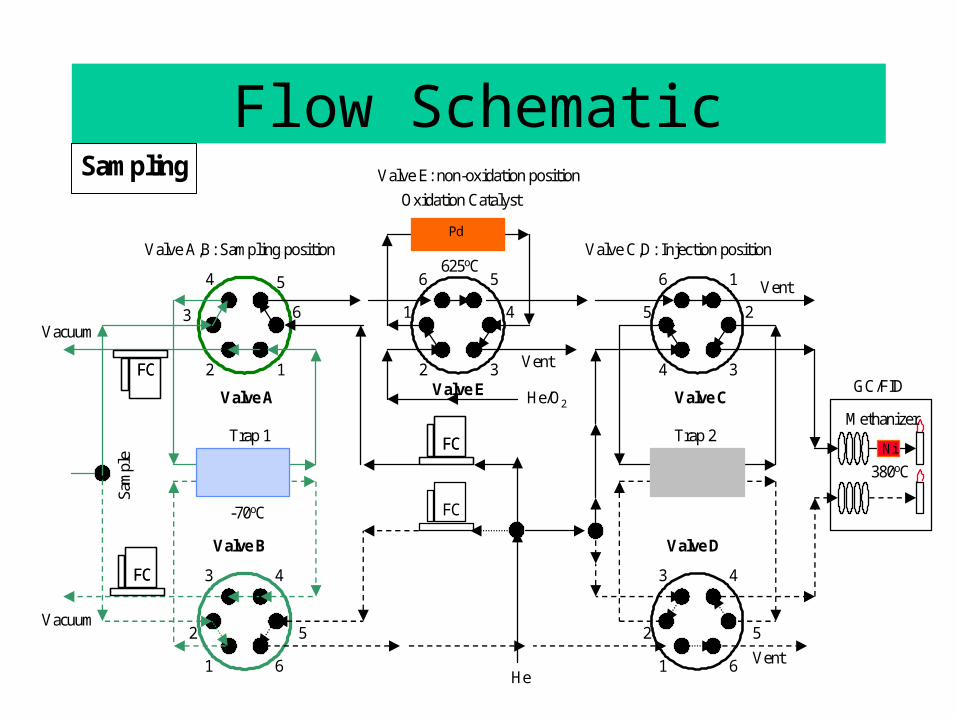
Flow Schematic
FCFC
FC
4
Trap 1
2 1
6
5 6 5
1
2 3
4
Oxidation Catalyst
Vent
Sam
ple
6
5
4 3
2
1 Vent
Trap 2Ni
GC/FID
Methanizer
1
2
3 4
5
6 1
2
3 4
5
6 Vent
FCFC
FCFC
He/O2
He
Vacuum
Vacuum
-70oC
625oC
380oC
Pd
Sampling
3
Valve A
Valve B
Valve C
Valve D
Valve E
Valve A,B: Sampling position Valve C,D: Injection position
Valve E: non-oxidation position

of Speciated VOC’s = 450 ppbC
TNMOC = 620 ppbC
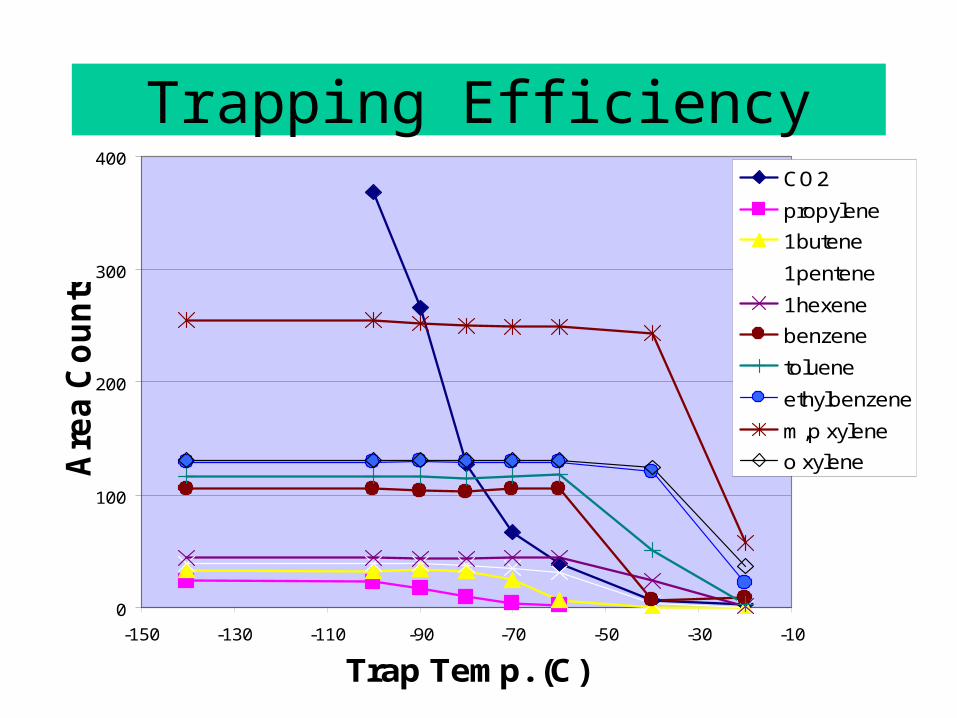
Trapping Efficiency
0
100
200
300
400
-150 -130 -110 -90 -70 -50 -30 -10
Trap Temp. (C)
Are
a C
ou
nts
CO2
propylene
1butene
1pentene
1hexene
benzene
toluene
ethylbenzene
m,p xylene
o xylene
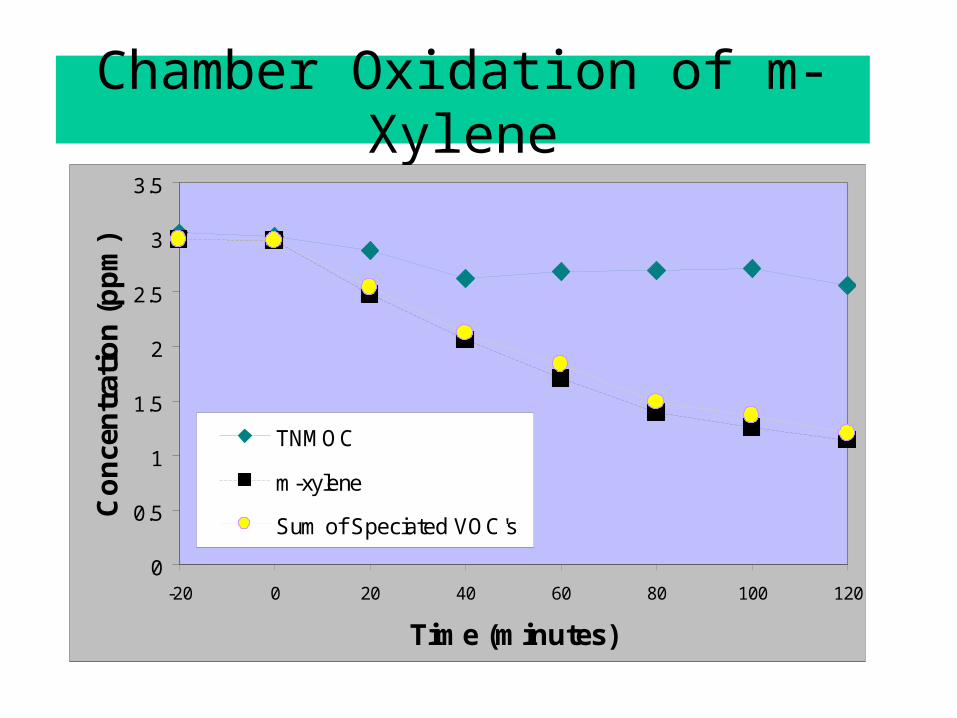
Chamber Oxidation of m-Xylene
0
0.5
1
1.5
2
2.5
3
3.5
-20 0 20 40 60 80 100 120
Time (minutes)
Co
nce
ntr
atio
n (
pp
m)
TNMOC
m-xylene
Sum of Speciated VOC's
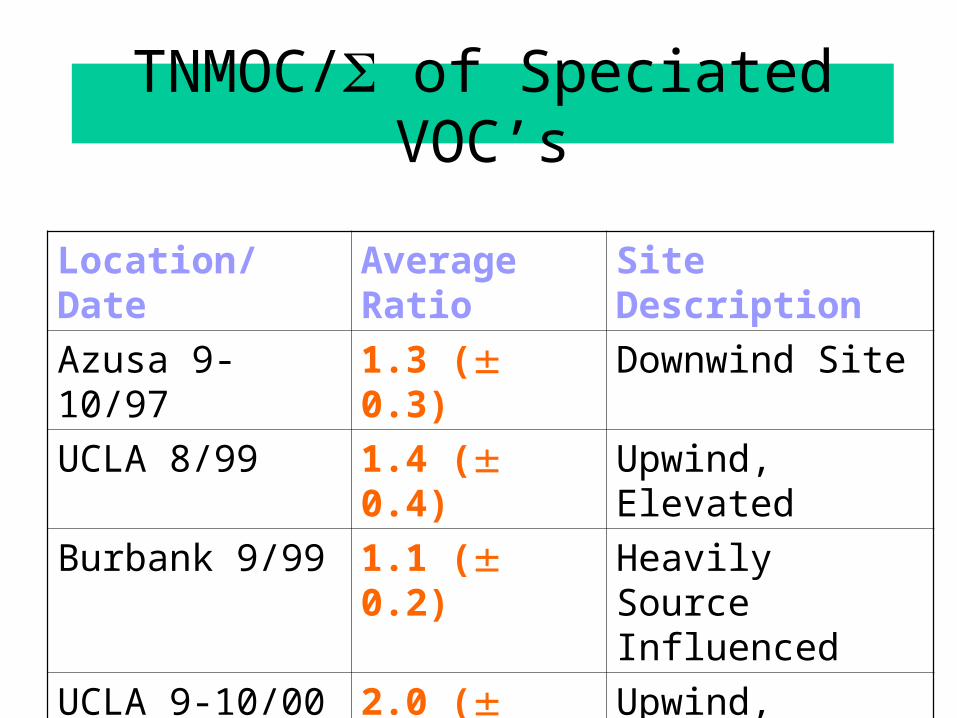
TNMOC/ of Speciated VOC’s
Location/Date Average Ratio Site Description
Azusa 9-10/97 1.3 ( 0.3) Downwind Site
UCLA 8/99 1.4 ( 0.4) Upwind, Elevated
Burbank 9/99 1.1 ( 0.2) Heavily Source Influenced
UCLA 9-10/00 2.0 ( 0.7) Upwind, Elevated
UCLA 12/00 1.2 ( 0.15) Upwind, Elevated
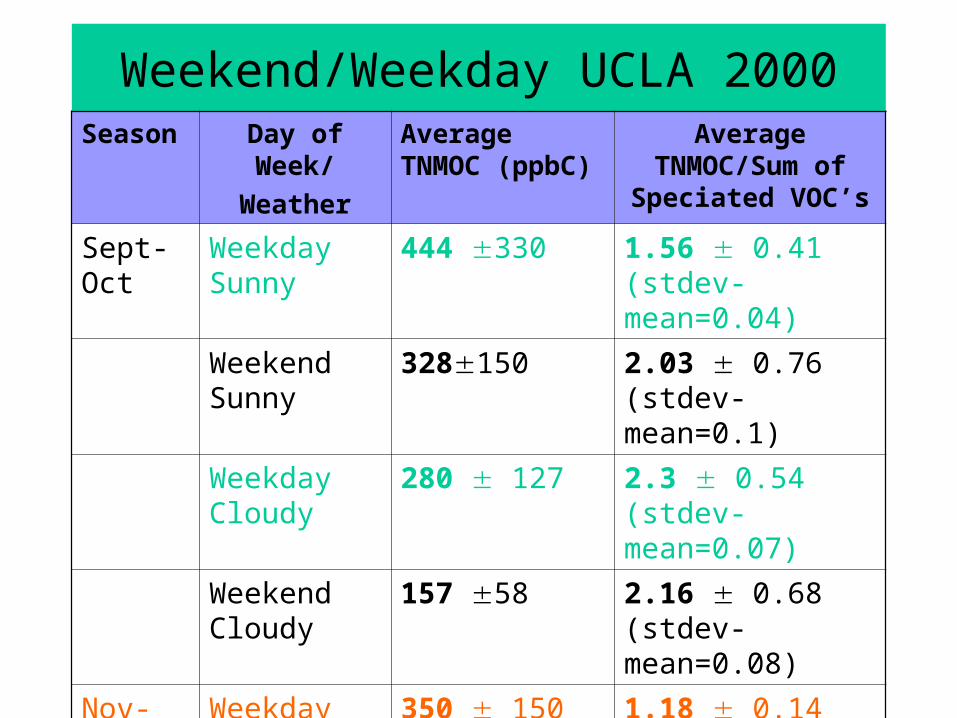
Weekend/Weekday UCLA 2000Season Day of Week/
Weather
Average TNMOC (ppbC)
Average TNMOC/Sum of Speciated VOC’s
Sept-Oct WeekdaySunny
444 330 1.56 0.41(stdev-mean=0.04)
WeekendSunny
328150 2.03 0.76(stdev-mean=0.1)
WeekdayCloudy
280 127 2.3 0.54(stdev-mean=0.07)
WeekendCloudy
157 58 2.16 0.68(stdev-mean=0.08)
Nov-Dec Weekday 350 150 1.18 0.14(stdev-mean=0.02)
Weekend 175 120 1.26 0.3(stdev-mean=0.05)
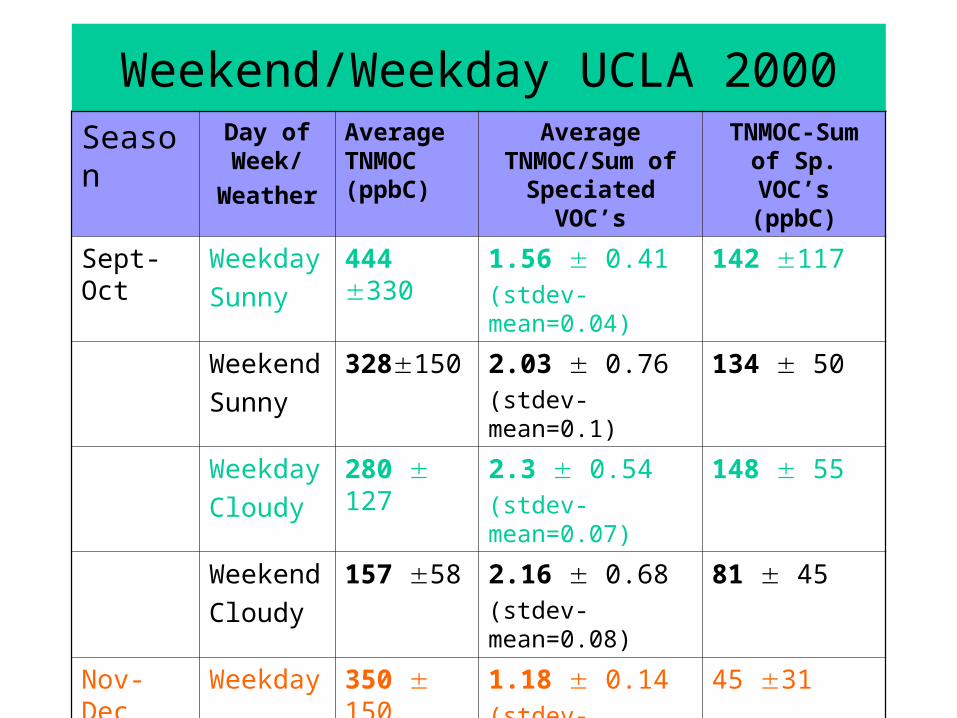
Weekend/Weekday UCLA 2000Season Day of
Week/
Weather
Average TNMOC (ppbC)
Average TNMOC/Sum of
Speciated VOC’s
TNMOC-Sum of Sp. VOC’s
(ppbC)
Sept-Oct Weekday
Sunny
444 330 1.56 0.41(stdev-mean=0.04)
142 117
Weekend
Sunny
328150 2.03 0.76(stdev-mean=0.1)
134 50
Weekday
Cloudy
280 127
2.3 0.54(stdev-mean=0.07)
148 55
Weekend
Cloudy
157 58 2.16 0.68(stdev-mean=0.08)
81 45
Nov-Dec Weekday 350 150
1.18 0.14(stdev-mean=0.02)
45 31
Weekend 175 120
1.26 0.3(stdev-mean=0.05)
2722
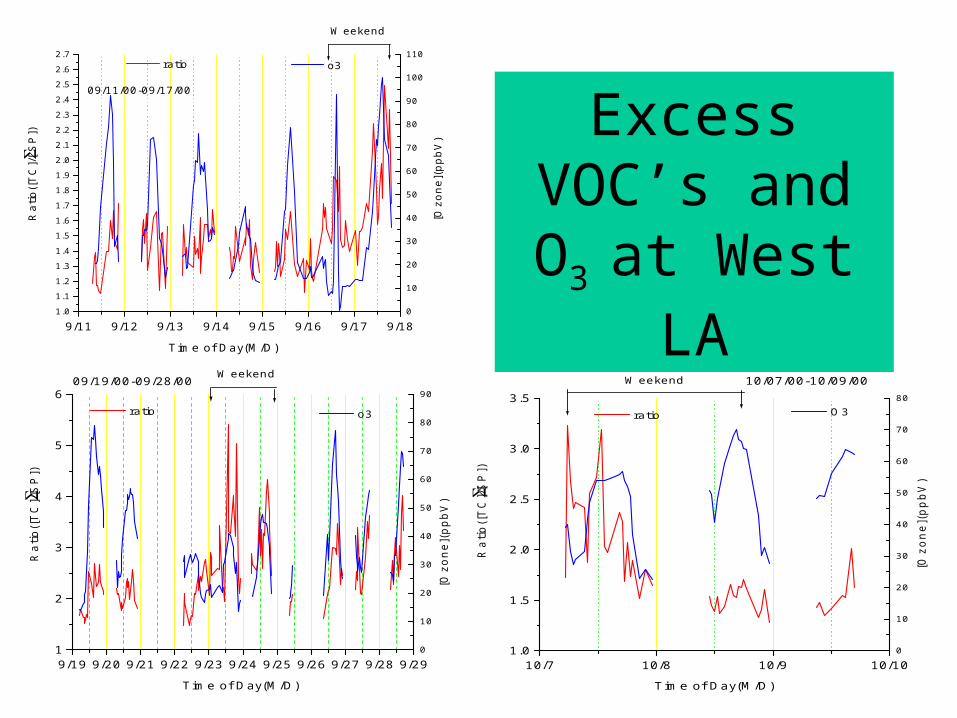
9/11 9/12 9/13 9/14 9/15 9/16 9/17 9/181.0
1.1
1.2
1.3
1.4
1.5
1.6
1.7
1.8
1.9
2.0
2.1
2.2
2.3
2.4
2.5
2.6
2.7 ratio
[O
zon
e](
pp
bV
)
09/11/00-09/17/00
Weekend
Time of Day(M/D)
Ra
tio([
TC
]/[S
P])
0
10
20
30
40
50
60
70
80
90
100
110 o3
9/19 9/20 9/21 9/22 9/23 9/24 9/25 9/26 9/27 9/28 9/291
2
3
4
5
6 ratio
Weekend09/19/00-09/28/00
Time of Day(M/D)
Ra
tio([
TC
]/[S
P])
0
10
20
30
40
50
60
70
80
90
o3
[O
zone](
ppbV
)
10/7 10/8 10/9 10/101.0
1.5
2.0
2.5
3.0
3.5 ratio
10/07/00-10/09/00Weekend
Time of Day(M/D)
Ratio([
TC
]/[S
P])
0
10
20
30
40
50
60
70
80
O3
[O
zone](
ppbV
)
Excess VOC’s and O3 at West LA
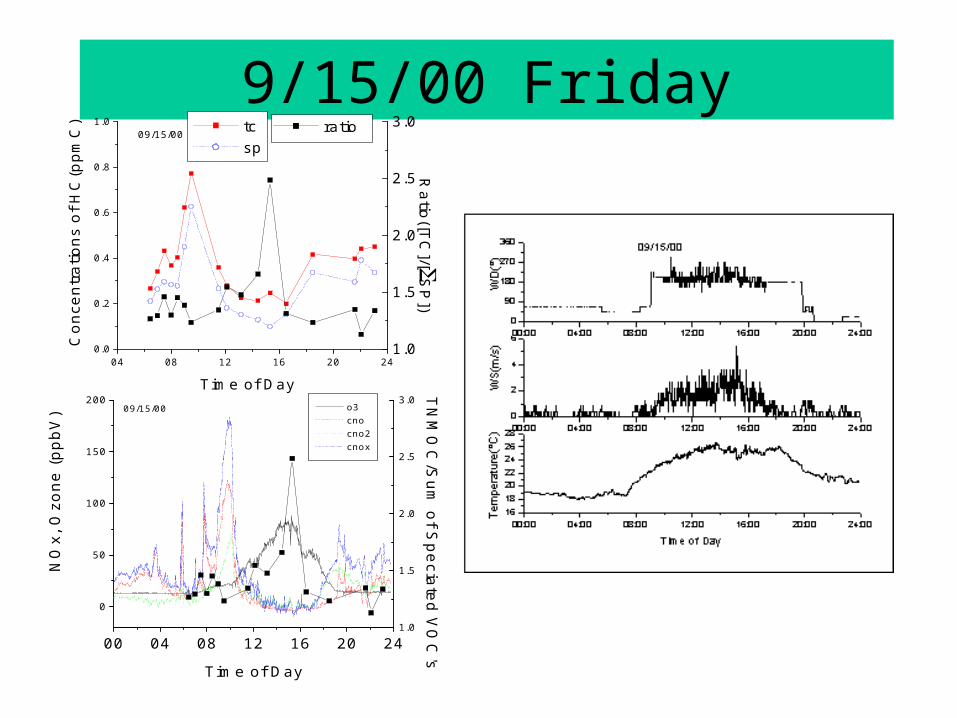
9/15/00 Friday
04 08 12 16 20 240.0
0.2
0.4
0.6
0.8
1.009/15/00
Ratio([T
C]/[
SP
])
Con
cent
ratio
ns o
f HC
(ppm
C)
Time of Day
tc sp
1.0
1.5
2.0
2.5
3.0 ratio
00 04 08 12 16 20 24
0
50
100
150
20009/15/00
NO
x, O
zone (
ppbV
)
Time of Day
o3 cno cno2 cnox
1.0
1.5
2.0
2.5
3.0
TN
MO
C/S
um
of S
pe
ciate
d V
OC
's
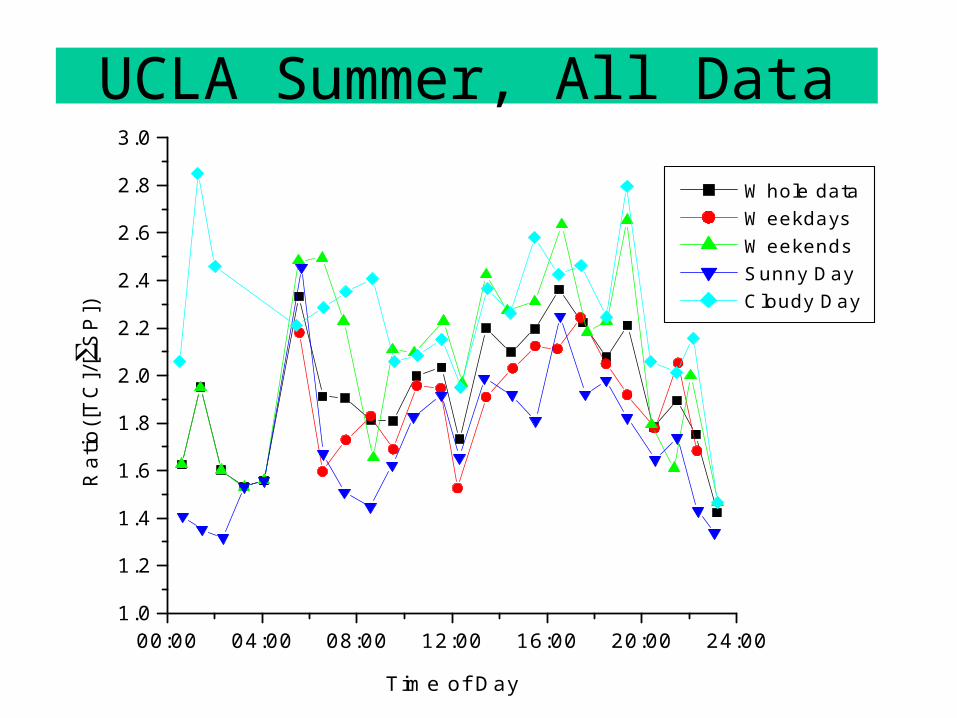
UCLA Summer, All Data
00:00 04:00 08:00 12:00 16:00 20:00 24:001.0
1.2
1.4
1.6
1.8
2.0
2.2
2.4
2.6
2.8
3.0
Ra
tio([
TC
]/[S
P])
Time of Day
Whole data Weekdays Weekends Sunny Day Cloudy Day
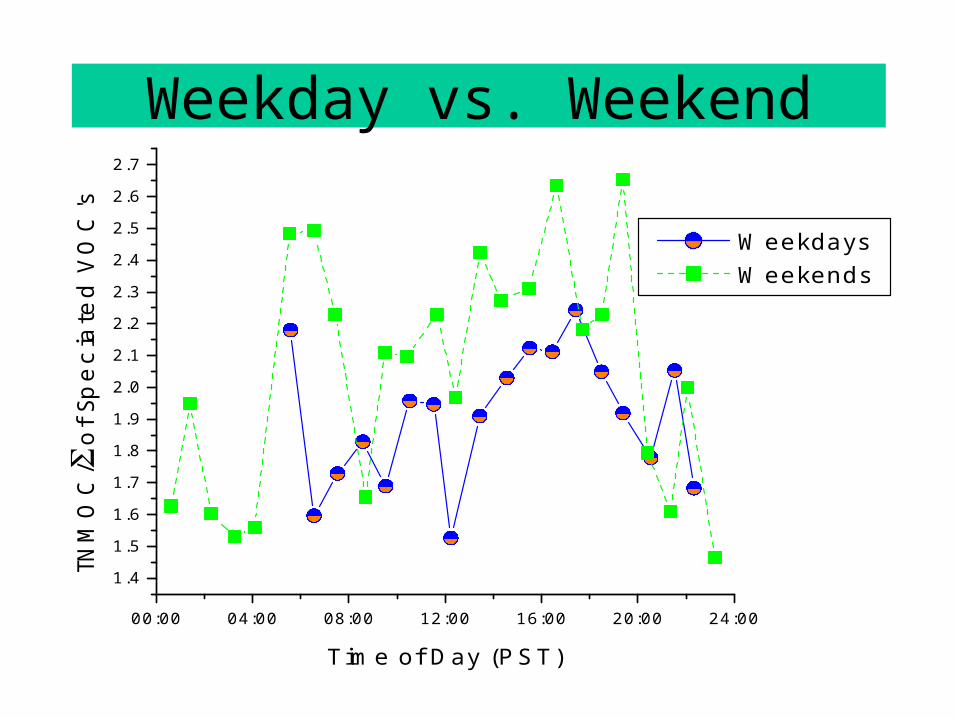
Weekday vs. Weekend
00:00 04:00 08:00 12:00 16:00 20:00 24:00
1.4
1.5
1.6
1.7
1.8
1.9
2.0
2.1
2.2
2.3
2.4
2.5
2.6
2.7
TNM
OC
/ o
f Sp
ecia
ted
VO
C's
Time of Day (PST)
Weekdays Weekends
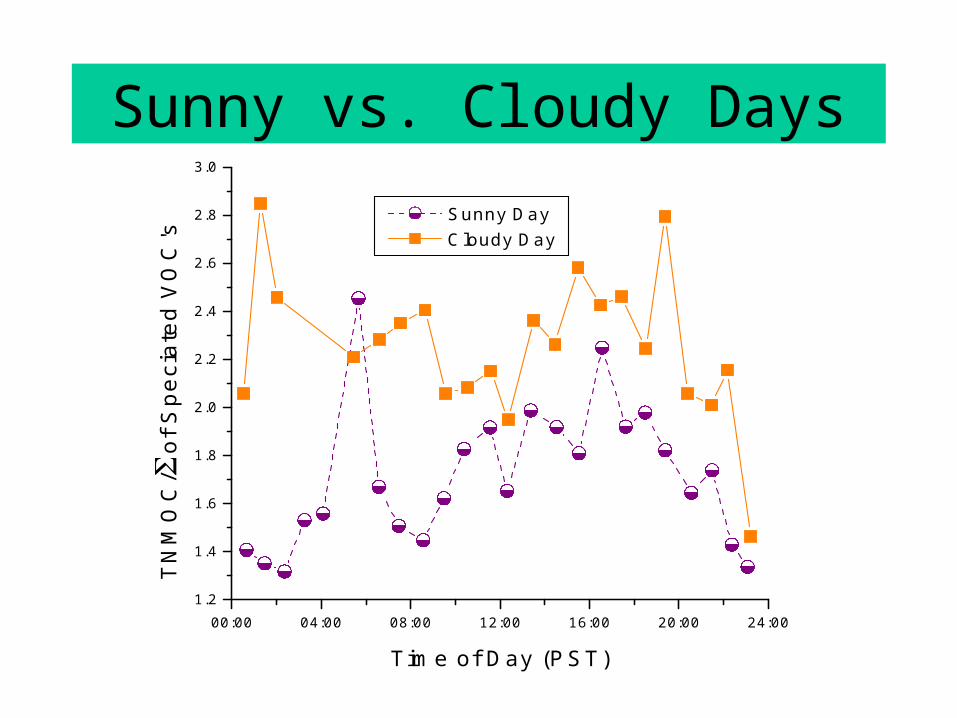
Sunny vs. Cloudy Days
00:00 04:00 08:00 12:00 16:00 20:00 24:001.2
1.4
1.6
1.8
2.0
2.2
2.4
2.6
2.8
3.0T
NM
OC
/ o
f S
pe
cia
ted
VO
C's
Time of Day (PST)
Sunny Day Cloudy Day
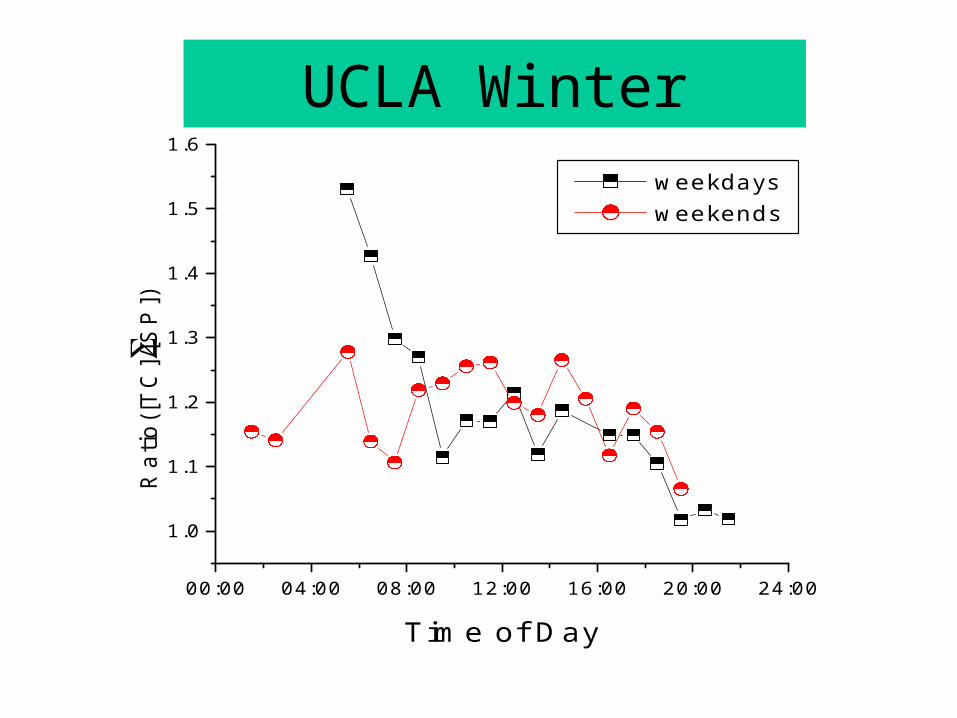
UCLA Winter
00:00 04:00 08:00 12:00 16:00 20:00 24:00
1.0
1.1
1.2
1.3
1.4
1.5
1.6 R
atio
([T
C]/
[SP
])
Time of Day
weekdays weekends

Excess VOC’s vs. VOC
Concentration
0.0 0.2 0.4 0.6 0.8 1.0 1.20
1
2
3
4
5T
NM
OC
/Sum
of S
peci
ated
VO
C's
of Speciated VOC's (ppmC)
UCLA Sept/Oct 2000
0 1 2 30
1
2
3
TN
MO
C/S
of
Sp
ecia
ted
VO
C's
of Speciated VOC's (ppmC)
Burbank 9/99
0.0 0.2 0.4 0.6 0.8 1.00
1
2
3
TN
MO
C/
of S
peci
ated
VO
C's
of Speciated VOC's
Azusa 9-10/97

0 20 40 60 80 1000.5
1.0
1.5
2.0
2.5
3.0
3.5
4.0
4.5
TN
MO
C/S
um o
f Spe
ciat
ed V
OC
's
Ozone (ppb)
I Linear Fit of Data1_I
-20 -10 0 10 20 30 40 50 60 700.5
1.0
1.5
2.0
2.5
3.0
3.5
4.0
4.5
TN
MO
C/S
um o
f Spe
ciat
ed V
OC
's
NO2
I
0 50 100 150 200 2500.5
1.0
1.5
2.0
2.5
3.0
3.5
4.0
4.5
TN
MO
C/S
um o
f Spe
ciat
ed V
OC
's
NO (ppb)
I
0 50 100 150 200 250
0.0
0.2
0.4
0.6
0.8
1.0
1.2
Sum
of S
peci
ated
VO
C's
NO (ppb)
C Linear Fit of Data1_CUCLA Weekday Summer 2000
R=0.5
R=0.3
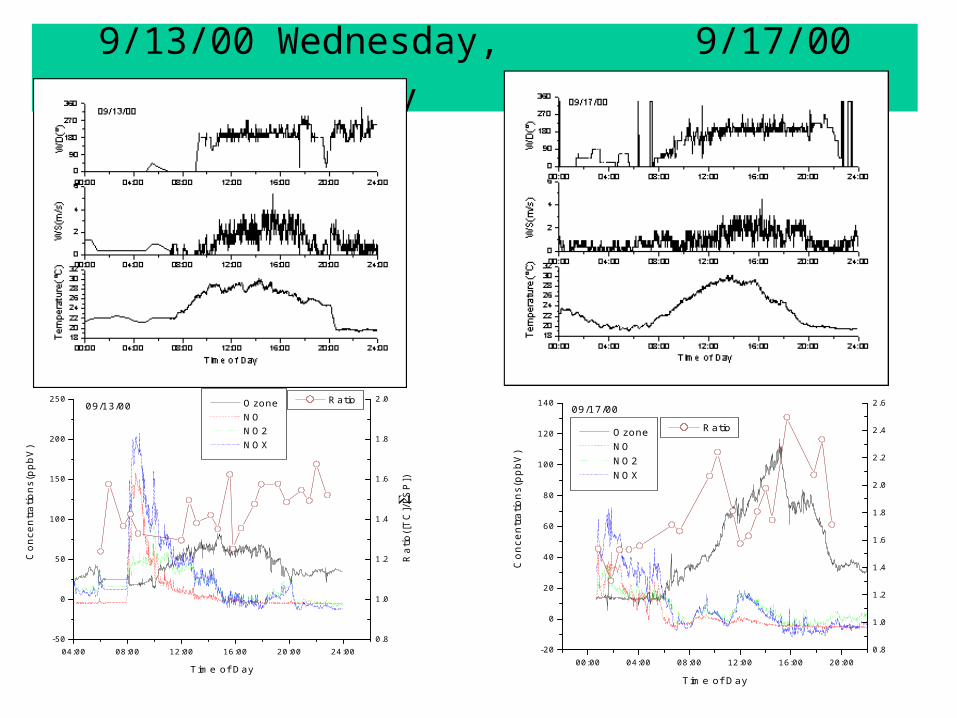
9/13/00 Wednesday, 9/17/00 Sunday
04:00 08:00 12:00 16:00 20:00 24:00-50
0
50
100
150
200
25009/13/00
Co
nce
ntr
atio
ns(
pp
bV
)
Time of Day
Ozone NO NO2 NOX
0.8
1.0
1.2
1.4
1.6
1.8
2.0 Ratio R
atio
([T
C]/
[SP
])
00:00 04:00 08:00 12:00 16:00 20:00-20
0
20
40
60
80
100
120
14009/17/00
Conce
ntr
atio
ns(
ppbV
)
Time of Day
Ozone NO NO2 NOX
0.8
1.0
1.2
1.4
1.6
1.8
2.0
2.2
2.4
2.6
Ratio
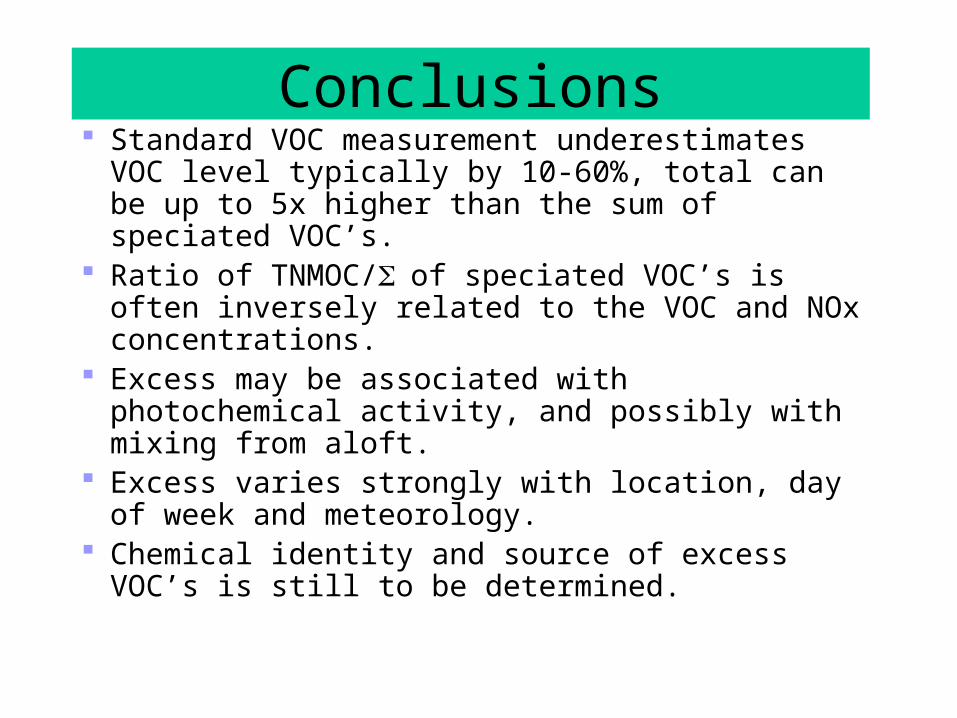
Conclusions Standard VOC measurement underestimates VOC
level typically by 10-60%, total can be up to 5x higher than the sum of speciated VOC’s.
Ratio of TNMOC/of speciated VOC’s is often inversely related to the VOC and NOx concentrations.
Excess may be associated with photochemical activity, and possibly with mixing from aloft.
Excess varies strongly with location, day of week and meteorology.
Chemical identity and source of excess VOC’s is still to be determined.