tourism snapshot - december 2017 - destination canada · 2 | tourism snapshot december 2017 • in...
TRANSCRIPT

Tourism Snapshot December 2017 | 1
December 2017Volume 13, Issue 12
www.destinationcanada.com
Tourism SnapshotA Monthly Monitor of the Performance of Canada’s Tourism Industry

2 | Tourism Snapshot December 2017
• In 2017, international arrivals to Canada reached a new all-time high of 20.85 million (+4.4% over 2016), surpassing the record high of 20.06 million previously set in 2002 by 3.9%.
• US visitors (14.33 million, +3.1%) continued to make up the majority of tourist arrivals to Canada in 2017. Among Destination Canada’s core markets, the Asia-Pacific region (1.90 million, +11.4%) led 2017 arrivals, followed by Europe (1.76 million, +0.7%), and Latin America (498,000, +39.3%).
• Overnight arrivals from non-US (overseas) origins (+7.2%) expanded at a pace slightly ahead of global international arrivals as reported by the UNWTO (+6.7%) in 2017, with Destination Canada’s ten overseas markets (+9.1%) expanding at twice the rate of non-Destination Canada markets (+4.0%).
• These results reflect a shifting landscape for the Canadian tourism industry when compared with the previous peak in 2002, when just 19.4% of visitors
to Canada came from overseas origins (vs. 31.3% in 2017). Destination Canada’s emerging Asia-Pacific and Latin America markets are also playing a larger role in overseas visitation, ahead of the historically strong European markets, with Destination Canada’s target markets in Latin America leading year-over-year growth and Asia-Pacific now overtaking Europe as Destination Canada’s largest overseas region in 2017.
• Much of the growth recorded in 2017 was driven by increased direct air arrivals, both from the US (+6.6%) and from overseas (+9.5%). This progress was particularly evident in direct air arrivals from Destination Canada’s Latin American markets (+60.3%) and Asia-Pacific markets (+16.6%). The ongoing expansion of air access to Canada in 2017 was closely linked with this growth, with seat capacity increasing significantly overall (+7.0%) and in particular in Destination Canada’s core markets – Latin America (+45.7%), Asia-Pacific (+22.2%), Europe (+4.4%), and the US (+3.8%).
KEY HIGHLIGHTS
QUICK LINKS
Note the following caveat from Statistics Canada associated with the December 2017 data: Data for Statistics Canada’s Frontier Counts program are produced using administrative data received from the Canada Border Services Agency (CBSA) on all international travellers who have been cleared for entry or re-entry into Canada. This includes residents of Canada, the United States and overseas entering Canada from abroad.
In 2017, the CBSA began introducing the electronic Primary Inspection Kiosk (PIK) system at airports in Canada. The PIK system replaces the E-311 Declaration Cards that are completed by international travellers to Canada. As of the end of November, the PIK system was deployed at the following airports: Macdonald-Cartier, Ottawa (March 2017), Vancouver (April 2017), Toronto International Airport T3 (June 2017), Edmonton (September 2017), Halifax (October 2017), and Pierre-Elliot Trudeau, Montréal (November 2017).
While awaiting receipt of PIK data, Statistics Canada has prepared preliminary estimates for airports at which PIK has been deployed. These estimates are based on CBSA reports of total international travellers by airport, while the distribution between Canadian, US and travellers from individual overseas countries are modelled estimates based on historical data and trends, using methods similar to those used to do seasonal adjustment.
Statistics Canada recently reached an agreement with CBSA on access to this data, and the estimates for these airports, as well as the provincial and national totals to which they contribute, will be revised in the near future.
Note also that figures reported at the Douglas (Peace Arch) land port in BC were partly estimated and will be revised at a future date.

Tourism Snapshot December 2017 | 3
Industry Performance Dashboard
December 2017
YTD
Overnight Arrivals1
Total International 4.3% 4.4%
11 DC Markets** 4.4% 4.4%
United States 3.7% 3.1%
10 Overseas Markets 7.1% 9.1%
Non-DC Markets 3.0% 4.0%
Air Seat Capacity2
Total International 7.6% 7.0%
11 DC Markets** 5.9% 6.5%
Non-DC Markets 11.2% 8.1%
National Hotel Indicators3
Occupancy Rate* 1.6 1.8
Revenue Per Available Room (Revpar) 3.8% 4.8%
Average Daily Rate (ADR) 7.3% 7.8%
Notes:The Industry Performance Dashboard figures are year-on-year variations. * Percentage point variations.** The 11 DC markets are US, France, Germany, UK, Australia, China, India, Japan, South Korea, Brazil and Mexico.
Sources:1. Statistics Canada, Frontier counts, custom tabulations2. IATA-Diio SRS Analyser3. CBRE Hotels with reproduction and use of information subject to CBRE Disclaimer / Terms of Use as detailed at www.cbre.ca.

4 | Tourism Snapshot December 2017
Overnight Arrivalsi Arrival YOY
Variations (%)Air Seat
capacityii Local currency
vs. CADiii
Market Dec. 2017 YTD 2017 Dec. 2017 YTD 2017 Dec. 2017 YTD 2017 Dec. 2017 Average
YTD Average
United States
United States 944,412 14,328,645 3.7% 3.1% 4.2% 3.8% -4.2% -2.1%
DC Europe
France 38,450 570,803 2.2% 4.6% 2.8% 2.7% 7.5% -0.1%
Germany 15,455 388,320 -6.3% 5.2% -6.6% 8.9% 7.5% -0.1%
United Kingdom 53,306 801,339 -6.0% -3.8% 2.6% 3.0% 2.8% -6.9%
DC Asia-Pacific
Australia 37,225 375,395 10.0% 12.6% 17.8% 28.6% -0.4% 0.9%
China 43,330 682,415 20.8% 11.8% 9.2% 24.8% 0.5% -3.8%
India 18,620 254,072 15.9% 17.8% 43.7% 52.7% 1.1% 1.1%
Japan 16,692 304,318 0.5% 0.2% 2.5% 7.0% -1.7% -5.2%
South Korea 17,485 286,052 24.1% 17.0% 11.2% 17.0% 4.5% 0.6%
DC Latin America
Brazil 13,980 139,385 22.1% 22.0% 61.5% -16.4% -2.3% 6.6%
Mexico 32,623 358,916 10.6% 47.4% 76.0% 70.6% 2.6% -3.3%
Total 11 DC Markets 1,231,578 18,489,660 4.4% 4.4%
Rest of the World 164,027 2,356,448 3.0% 4.0%
Total International 1,395,605 20,846,108 4.3% 4.4%
Sources:i. Statistics Canada, Frontier counts, custom tabulationsii. IATA-Diio SRS Analyseriii. Bank of Canada
Notes: i. Arrival figures are preliminary estimates and are subject to change.ii. Air seat capacity is the variation in the total number of seats on direct commercial scheduled flights during the current month and YTD relative to the same periods
in the previous year.iii. The exchange rate variation is calculated on the average value of the Canadian dollar during during the current month and YTD relative to the same periods in the
previous year.
MARKET MONITOR SUMMARY

Tourism Snapshot December 2017 | 5
UNITED STATES
JAN FEB MAR APR MAY JUN JUL AUG SEP OCT NOV DEC
OVER
NIG
HT A
RRIV
ALS
(000
s)
20172016
PEAK: DECEMBER 2017
0
500
1,000
1,500
2,000
2,500
3,000
United States: Key Indicators
Air Seat CapacityiDecember 2017 4.2%
YTD 3.8%
Exchange RateiiDecember 2017 -4.2%
YTD -2.1%
Consumer Confidence Index (1985=100)iii
December 2017 123.1
Previous Month 128.6
YTD Arrival Peakiv
Previous Peak Year 2002
Current % of Previous Peak
88.6%
Source:i. IATA-Diio SRS Analyser, Year-on-year % variance.ii. Bank of Canada, Year on year % variance.iii. Consumer Confidence Index, the Conference Board (USA).iv. Statistics Canada, Frontier counts, custom tabulations.
Trend Plot: Total United States Arrivals
Overnight Arrivals
Dec. 2017 YTD 2017
Arrivals % YOY Variance Arrivals % YOY
Variance
Automobile 531,727 -0.3 7,988,126 0.0
Air 368,257 10.0 4,811,474 6.6
Other 44,428 4.4 1,529,045 9.9
US Total 944,412 3.7 14,328,645 3.1
Source: Statistics Canada, Frontier counts, custom tabulations.Note: The figures are preliminary estimates and are subject to change.
US Arrivals to Canada
CURRENT MONTH:
+3.7% YOY
YTD:
+3.1% YOY

6 | Tourism Snapshot December 2017
• After a somewhat rocky start to the year, US overnight arrivals to Canada rounded off the latter half of 2017 with a fifth consecutive month of strong growth in December 2017 (+3.7%), bringing the annual 2017 total to 14.3 million (+3.1% over 2016). Even with the weaker purchasing power of the US dollar in Canada in 2017 (-4.2% in December, -2.1% total 2017), US tourists visited Canada in the highest numbers since 2005.
• Supported by the steady expansion of air capacity between Canada and the US (+4.2% in December, +3.8% total 2017), arrivals by air were a driving force behind the growth in US visitation, up 10.0% in December and 6.6% annually compared to 2016. In 2017, the number of US tourists arriving in Canada by air reached a new peak for the third consecutive year and represented 33.6% of total US overnight arrivals, up more than 10 percentage-points compared to the share of air arrivals in 2002 (23.4%). Arrivals by other modes of transportation, such as bus, train, and cruise, also recorded strong growth (+4.4% in December, +9.9% total 2017). While auto arrivals were generally on par with 2016 levels, they still continued to make up the largest proportion of US visitors (56.3% in December, 55.7% total 2017).
1 States of origin information is based on Integrated Primary Inspection Lane (IPIL) data collected from US residents entering Canada in automobiles with license plate registered in the United States.
2 The US state of departure for overseas resident entering Canada by automobile is based on IPIL information. Some automobiles driven by overseas resident by be rental vehicles. Rented vehicles in one US state may be registered in different state. The state of car registration may not necessarily be indicative of distance driven.
• In 2017, the largest share of US overnight arrivals by vehicle1 originated from New York (18.0%), Washington (15.1%), and Michigan (11.4%). Among states further from the US-Canada border, the largest proportion of vehicle traffic arrived from California (2.4%) and Florida (2.1%). While the same three states make up the largest share of vehicle arrivals among both US residents and overseas residents driving across the Canada-US border, the data suggest that overseas residents may be more likely than US residents to drive the longer distances from California and Florida2.
• Following two months of strong increases, the consumer confidence index published by the US Conference Board dropped 5.5 points to 123.1 in December 2017.
UNITED STATES
Tourism Snapshot December 2017 | 7
EUROPE
JAN FEB MAR APR MAY JUN JUL AUG SEP OCT NOV DEC
OVER
NIG
HT A
RRIV
ALS
(000
s)
20172016
0
50
100
150
200
250
300
PEAK: DECEMBER2016
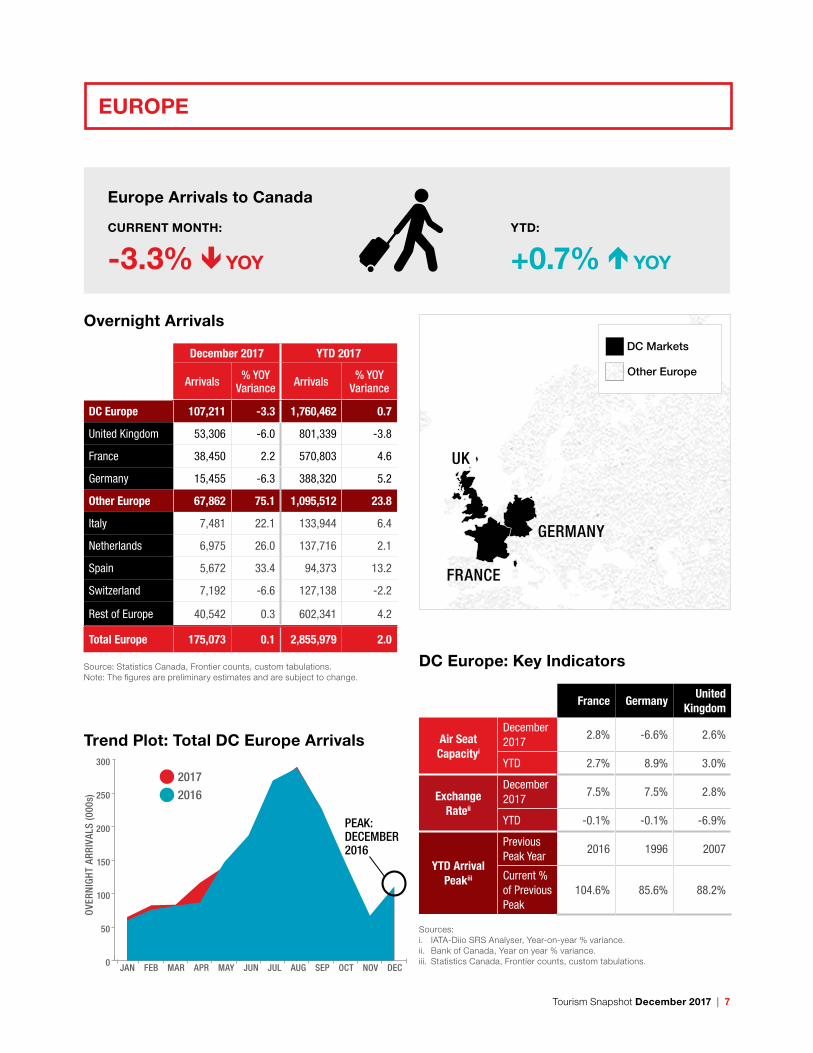
Trend Plot: Total DC Europe Arrivals
DC Europe: Key Indicators
France GermanyUnited
Kingdom
Air Seat Capacityi
December 2017
2.8% -6.6% 2.6%
YTD 2.7% 8.9% 3.0%
Exchange Rateii
December 2017
7.5% 7.5% 2.8%
YTD -0.1% -0.1% -6.9%
YTD Arrival Peakiii
Previous Peak Year
2016 1996 2007
Current % of Previous Peak
104.6% 85.6% 88.2%
Sources:i. IATA-Diio SRS Analyser, Year-on-year % variance.ii. Bank of Canada, Year on year % variance.iii. Statistics Canada, Frontier counts, custom tabulations.
Overnight Arrivals
December 2017 YTD 2017
Arrivals % YOY Variance Arrivals % YOY
Variance
DC Europe 107,211 -3.3 1,760,462 0.7
United Kingdom 53,306 -6.0 801,339 -3.8
France 38,450 2.2 570,803 4.6
Germany 15,455 -6.3 388,320 5.2
Other Europe 67,862 75.1 1,095,512 23.8
Italy 7,481 22.1 133,944 6.4
Netherlands 6,975 26.0 137,716 2.1
Spain 5,672 33.4 94,373 13.2
Switzerland 7,192 -6.6 127,138 -2.2
Rest of Europe 40,542 0.3 602,341 4.2
Total Europe 175,073 0.1 2,855,979 2.0
Source: Statistics Canada, Frontier counts, custom tabulations.Note: The figures are preliminary estimates and are subject to change.
UK
FRANCE
GERMANY
DC Markets
ASIA-PACIFIC
DC EUROPEUS
DC LATIN-AMERICA
Other Europe
Europe Arrivals to Canada
CURRENT MONTH:
-3.3% YOY
YTD:
+0.7% YOY

8 | Tourism Snapshot December 2017
• In December 2017, Canada welcomed just over 107,000 visitors from Destination Canada’s Europe region (-3.3% vs. December 2016), just bringing the 2017 total up to a new annual record of 1.76 million visitors (+0.7% vs. 2016).
• The muted performance from this region in 2017 was mainly due to a consistent decline in arrivals from the UK (-3.8% vs. 2016), which faced a deteriorating consumer mood since May 2017 in the midst of growing concerns over the economy ahead of Brexit and a weakened British pound in Canada (-6.9% vs. 2016). December (-6.0% vs. December 2016) marked eight consecutive months of declining arrivals to Canada from the UK, with outbound British travel to destinations outside of Europe also trending downward in the latter half of 2017.
• Steady gains in arrivals from Germany (+5.2%) and France (+4.6%) over the course of the year compensated for the losses from the UK, resulting in an overall positive trend in arrivals from the region. France was the only Europe market to hit new arrivals records for both the month of December (+2.2%) and annually in 2017, while Germany observed its best year for arrivals to Canada since 1999, despite finishing the year with a downturn in December (-6.3%).
DC Europe Arrivals by Port of Entry
• With overall air capacity for the region up 4.4% year-over-year in 2017, direct air arrivals from Destination Canada’s three Europe markets were up slightly compared to 2016 (+0.8%). In 2017, 69.9% of visitors from Destination Canada’s three European markets arrived by air directly from overseas, mainly via YYZ (36.3%) and YUL (31.7%).
• Most of the annual decline from the region was in arrivals via the US, both by land (-2.7%) and by air (-1.5%), while arrivals by sea increased significantly (+16.6%) – particularly from Germany (+47.9%).
France Germany UK
Air Arrivals
from Overseas
YYZ
Arrivals 68,834 103,446 274,917
YOY% 10.0% 1.2% -6.3%
% of Total 12.1% 26.6% 34.3%
YVR
Arrivals 19,473 65,336 143,184
YOY% 6.6% 13.7% 5.3%
% of Total 3.4% 16.8% 17.9%
YUL
Arrivals 293,382 43,618 52,752
YOY% 9.6% 2.4% -3.4%
% of Total 51.4% 11.2% 6.6%
YYC
Arrivals 3,643 22,939 70,709
YOY% -34.8% -14.6% -3.0%
% of Total 0.6% 5.9% 8.8%
All other airports
Arrivals 5,066 21,104 42,324
YOY% 1.4% 9.2% 7.8%
% of Total 0.9% 5.4% 5.3%
Subtotal
Arrivals 390,398 256,443 583,886
YOY% 6.7% 2.3% -3.4%
% of Total 68.4% 66.0% 72.9%
Air Arrivals via the
US
All airports
Arrivals 146,877 58,635 114,423
YOY% 3.8% 4.9% -10.2%
% of Total 25.7% 15.1% 14.3%
Sea Arrivals
All sea borders
Arrivals 2,041 31,154 45,140
YOY% -40.4% 47.9% 5.7%
% of Total 0.4% 8.0% 5.6%
Land Arrivals via US
All land borders
Arrivals 31,620 41,904 57,878
YOY% -9.1% 1.6% -1.9%
% of Total 5.5% 10.8% 7.2%
Total Overnight Arrivals 570,803 388,320 801,339
Source: International Travel Survey, Table C, Statistics Canada.Note: The figures are preliminary estimates and are subject to change.
EUROPE

Tourism Snapshot December 2017 | 9
ASIA-PACIFIC
JAN FEB MAR APR MAY JUN JUL AUG SEP OCT NOV DEC
OVER
NIG
HT A
RRIV
ALS
(000
s)
20172016
0
50
100
150
200
250
PEAK: DECEMBER2017
Trend Plot: Total DC Asia-Pacific Arrivals
CHINA
INDIA
AUSTRALIA
JAPAN
SOUTHKOREA
Asia-Pacific: Key Indicators
Australia China India JapanSouth Korea
Air Seat Capacityi
December 2017
17.8% 9.2% 43.7% 2.5% 11.2%
YTD 28.6% 24.8% 52.7% 7.0% 17.0%
Exchange Rateii
December 2017
-0.4% 0.5% 1.1% -1.7% 4.5%
YTD 0.9% -3.8% 1.1% -5.2% 0.6%
YTD Arrival Peakiii
Previous Peak Year
2016 2016 2016 1996 2016
Current % of Previous Peak
112.6% 111.8% 117.8% 46.8% 117.0%
Sources:i. IATA-Diio SRS Analyser, Year-on-year % variance.ii. Bank of Canada, Year on year % variance.iii. Statistics Canada, Frontier counts, custom tabulations.
Overnight Arrivals
December 2017 YTD 2017
Arrivals % YOY Variance Arrivals % YOY
Variance
DC Asia-Pacific 133,352 14.5 1,902,252 11.4
Australia 37,225 10.0 375,395 12.6
China 43,330 20.8 682,415 11.8
India 18,620 15.9 254,072 17.8
Japan 16,692 0.5 304,318 0.2
South Korea 17,485 24.1 286,052 17.0
Other Asia-Pacific 52,676 9.7 747,959 -0.3
Hong Kong 10,859 -17.8 147,335 -5.0
Taiwan 5,308 19.3 101,659 0.7
Rest of Asia-Pacific 36,509 8.2 498,965 3.9
Total Asia-Pacific 186,028 10.8 2,650,211 8.5
Source: Statistics Canada, Frontier counts, custom tabulations.Note: The figures are preliminary estimates and are subject to change.
DC Markets
ASIA-PACIFIC
DC EUROPEUS
DC LATIN-AMERICA
Other Asia-Pacific
DC Asia-Pacific Arrivals to Canada
CURRENT MONTH:
+14.5% YOY
YTD:
+11.4% YOY

10 | Tourism Snapshot December 2017
• With just over 133,000 arrivals in December 2017 (+14.5%), total 2017 visitation from Destination Canada’s Asia-Pacific region reached 1.90 million (+11.4%), setting new monthly and annual peaks for the region. This year’s strong performance moved the Asia-Pacific region ahead of Europe as Destination Canada’s largest overseas regional market for the first time in 2017.
• Individually, double-digit gains were recorded from all of Destination Canada’s Asia-Pacific markets except Japan in 2017 (+0.2%). Arrivals from India (+17.8%) posted the strongest growth, followed by South Korea (+17.0%), Australia, (+12.6%), and China (+11.8%). All but Japan also reached new arrivals records in 2017, both for the month of December and annually.
• The performance from this region in 2017 is especially notable given that the five Asia-Pacific markets saw relatively weak currency exchange rates with Canada this year. The strength of the Yen compared to the Canadian dollar was particularly poor (-5.2% in 2017), which may have contributed to the muted performance from Japan.
• Direct air capacity to Canada from the Asia-Pacific region expanded +22.2% in 2017, led by India (+52.7%), Australia (+28.6%), and China (+24.8%), supporting the particularly strong growth in direct air arrivals (+16.6%).
ASIA-PACIFIC
DC Asia-Pacific Arrivals by Port of Entry
• Direct air arrivals from Destination Canada’s Asia-Pacific region soared by an average of +16.6%, while arrivals via the US averaged +3.6% (+3.8% by land and +2.1% by air), despite contractions from China (-0.2%), India (-6.2%), and Japan (-9.7%).
• The majority of direct air arrivals from Destination Canada’s Asia-Pacific markets in 2017 entered the country via YVR (50.3% share of direct air arrivals) and YYZ (41.1% share of direct air arrivals). However, YUL and YYC also saw significant growth this year in arrivals from China.
Australia China India Japan South Korea
Air Arrivals
from Overseas
YYZ
Arrivals 17,545 210,466 129,742 74,618 62,667
YOY% 3.2% 10.7% 42.2% 3.4% 28.6%
% of Total 4.7% 30.8% 51.1% 24.5% 21.9%
YVR
Arrivals 124,986 252,929 28,908 122,743 76,193
YOY% 34.2% 10.4% 9.4% 11.3% -2.0%
% of Total 33.3% 37.1% 11.4% 40.3% 26.6%
YUL
Arrivals 2,743 40,573 9,996 1,704 993
YOY% 5.3% 121.3% 10.8% -16.3% 50.7%
% of Total 0.7% 5.9% 3.9% 0.6% 0.3%
YYC
Arrivals 1,526 13,114 9,038 16,332 1,782
YOY% -1.7% 94.6% 9.2% -18.9% -19.8%
% of Total 0.4% 1.9% 3.6% 5.4% 0.6%
All other airports
Arrivals 995 734 3,681 277 217
YOY% 0.9% 0.2% 2.7% 0.1% 0.2%
% of Total 0.3% 0.1% 1.4% 0.1% 0.1%
Subtotal
Arrivals 147,795 517,816 181,365 215,674 141,852
YOY% 28.2% 16.3% 31.1% 5.3% 9.5%
% of Total 39.4% 75.9% 71.4% 70.9% 49.6%
Air Arrivals via the
US
All airports
Arrivals 141,872 93,113 34,389 62,715 39,447
YOY% 5.1% -1.6% 10.0% -7.5% 12.6%
% of Total 37.8% 13.6% 13.5% 20.6% 13.8%
Sea Arrivals
All sea borders
Arrivals 47,652 15,247 9,636 4,387 5,513
YOY% 18.9% -2.4% 4.2% -8.7% 23.7%
% of Total 12.7% 2.2% 3.8% 1.4% 1.9%
Land Arrivals via US
All land borders
Arrivals 38,003 56,294 28,711 21,569 99,259
YOY% -11.3% 2.9% -22.4% -15.1% 32.5%
% of Total 10.1% 8.2% 11.3% 7.1% 34.7%
Total Overnight Arrivals 375,395 682,415 254,072 304,318 286,052
Source: International Travel Survey, Table C, Statistics Canada.Note: The figures are preliminary estimates and are subject to change.

Tourism Snapshot December 2017 | 11
LATIN AMERICA
JAN FEB MAR APR MAY JUN JUL AUG SEP OCT NOV DEC
OVER
NIG
HT A
RRIV
ALS
(000
s)
20172016
0
10
20
30
40
50
70
60PEAK: DECEMBER2017
Arrival Trend Plot – Total DC Latin America
BRAZIL
MEXICO
DC Latin America: Key Indicators
Brazil Mexico
Air Seat Capacityi
December 2017 61.5% 76.0%
YTD -16.4% 70.6%
Exchange RateiiDecember 2017 -2.3% 2.6%
YTD 6.6% -3.3%
YTD Arrival Peakiii
Previous Peak Year
2016 2008
Current % of Previous Peak
122.0% 134.8%
Sources:i. IATA-Diio SRS Analyser, Year-on-year % variance.ii. Bank of Canada, Year on year % variance.iii. Statistics Canada, Frontier counts, custom tabulations.
Overnight Arrivals
December 2017 YTD 2017
Arrivals % YOY Variance Arrivals % YOY
Variance
DC Latin America 46,603 13.8 498,301 39.3
Brazil 13,980 22.1 139,385 22.0
Mexico 32,623 10.6 358,916 47.4
Other Latin America
31,177 -2.4 366,226 8.3
Total Latin America
77,780 6.7 864,527 24.2
Source: Statistics Canada, Frontier counts, custom tabulations.Note: The figures are preliminary estimates and are subject to change.
DC Markets
ASIA-PACIFIC
DC EUROPEUS
DC LATIN-AMERICA
Rest of Latin America
DC Latin America Arrivals to Canada
CURRENT MONTH:
+13.8% YOY
YTD:
+39.3% YOY

12 | Tourism Snapshot December 2017
• Close to 47,000 arrivals in December 2017 (+13.8%) brought annual 2017 total arrivals from Destination Canada’s Latin America region to almost half a million (498,000, +39.3% over 2016). Setting new records for both the month of December and annually, growth from this region was well ahead of all other Destination Canada regions. Both Mexico (+47.4%) and Brazil (+22.0%) also hit new arrivals records individually in 2017.
• Both of Destination Canada’s Latin America markets benefitted from the replacement of the visa requirement with the eTA over the last year. This was introduced for Mexican citizens on December 1st, 2016 and for some Brazilian citizens in May 2017. After averaging an increase in arrivals of 52.5% over the first 11 months of 2017, tourist arrivals from Mexico expanded by 10.6% in December 2017, which still represented a robust performance given the 69.1% jump in December 2016 following the eTA implementation.
• This region’s stellar performance in 2017 was mainly driven by strong gains in air arrivals, primarily direct to Canada (+60.3%), but also by air via the US (+27.3%). Meanwhile, arrivals via the US by land were down (-12.1%), due to a decline from Mexico (-15.3%).
• Supporting this performance, Mexico saw the largest expansion of air capacity to Canada of all Destination Canada’s key international markets in 2017 (+70.6%). From Brazil, air capacity was down overall in 2017 (-16.4%) but saw an increase over the last three months of the year (+61.5% in December).
• While the purchasing power of the Mexican Peso in Canada fell overall in 2017 (-3.3%), the Real remained strong compared to 2016 (+6.6%).
DC Latin America Arrivals by Port of Entry
• Overall in 2017, 63.1% of visitors from Destination Canada’s two Latin America markets arrived by air directly from overseas. Visitors from Brazil arriving direct by air entered the country almost exclusively at YYZ (92.7%), while those from Mexico primarily crossed the border at YYZ (45.1%), YVR (25.8%), or YUL (24.2%).
Brazil Mexico
Air Arrivals from Overseas
YYZ
Arrivals 68,796 108,308
YOY% 22.4% 72.9%
% of Total 49.4% 30.2%
YVR
Arrivals 2,063 61,942
YOY% 24.8% 40.2%
% of Total 1.5% 17.3%
YUL
Arrivals 2,787 58,192
YOY% 50.3% 141.8%
% of Total 2.0% 16.2%
YYC
Arrivals 241 10,063
YOY% 65.1% 196.7%
% of Total 0.2% 2.8%
All other airports
Arrivals 253 1,770
YOY% 0.4% 1.3%
% of Total 0.2% 0.5%
Subtotal
Arrivals 74,140 240,275
YOY% 23.4% 76.5%
% of Total 53.2% 66.9%
Air Arrivals via the US All airports
Arrivals 57,394 62,982
YOY% 20.9% 33.8%
% of Total 41.2% 17.5%
Sea ArrivalsAll sea borders
Arrivals 2,555 12,893
YOY% 3.6% 33.3%
% of Total 1.8% 3.6%
Land Arrivals via US
All land borders
Arrivals 5,301 42,775
YOY% 25.9% -15.3%
% of Total 3.8% 11.9%
Total Overnight Arrivals 139,385 358,916
Source: Statistics Canada, Frontier counts, custom tabulations, Table C.Note: The figures are preliminary estimates and are subject to change.
LATIN AMERICA

Tourism Snapshot December 2017 | 13
COMPETITIVE REVIEW
January to December 2017 Trips To:
Canada Australia
Trips From: YOY Change YOY Change
Total International 20,846,108 4.4% 8,810,200 6.5%
United States 14,328,645 3.1% 781,000 9.0%
Canada … … 167,300 10.0%
Europe
United Kingdom 801,339 -3.8% 731,900 2.3%
France 570,803 4.6% 129,700 0.5%
Germany 388,320 5.2% 208,200 4.4%
Asia-Pacific
Australia 375,395 12.6% … …
Japan 304,318 0.2% 434,600 4.0%
South Korea 286,052 17.0% 301,800 7.7%
China 682,415 11.8% 1,355,500 12.2%
India 254,072 17.8% 302,200 15.2%
Latin AmericaMexico 358,916 47.4% 11,300 22.8%
Brazil 139,385 22.0% 55,600 17.5%
Total DC Key Markets 18,489,660 4.4% 4,479,100 8.2%
Sources: Statistics Canada, Frontier counts, custom tabulations.Australian Bureau of Statistics, Overseas Arrivals and Departures, cat. no. 3401.0.
• With just over 20.85 million international arrivals in 2017, Canada welcomed approximately 12 million more international tourists than Australia (8.81 million) this year, while Australia continued to make good progress with slightly faster year-over-year growth (+6.5% vs. Canada’s +4.4%).
• Canada welcomed more than four times more visitors than Australia from Destination Canada’s 11 core international markets (18.49 million to Canada vs. 4.48 million to Australia). These markets made up 89% of Canada’s visitors and 49% of Australia’s visitors in 2017, despite Australia’s stronger year-over-year growth from these markets (8.4% vs. 4.4% for Canada).
• For Canada’s primary market of the United States, this trend was particularly apparent. Canada welcomed US tourists in much higher numbers in 2017 (14.33 million to Canada vs. 781,000 to Australia), but compared to 2016 this market grew at three times the pace in Australia (+9.0%) than in Canada (+3.1%).
• In 2017, Canada welcomed more visitors from Destination Canada’s core markets in Europe and Latin America, while Australia received more visitors from Destination Canada’s Asia-Pacific markets, including nearly twice as many arrivals from Australia’s primary market of China (1.36 million to Australia, vs. 682,415 to Canada).
• Well over double the number of Australian tourists visited Canada (375,395, +12.6%) than Canadian tourists visited Australia (167,300, +10.0%) overall in 2017.

14 | Tourism Snapshot December 2017
Overnight Arrivals by Province of Entry January to December 2017
Newfo
undl
and
and
Labr
ador
Prin
ce E
dwad
Isla
nd
Nova
Sco
tia
New B
runs
wick
Québ
ec
Onta
rio
Tota
l One
or
mor
e ni
ghts
2017 68,821 2,518 249,915 353,253 3,141,261 9,774,194
Variance YOY% 10.6% -59.8% 12.5% -2.3% 7.0% 4.2%
Change YOY 6,619 (3,744) 27,799 (8,399) 205,011 396,209
US R
esid
ents
by
Auto
mob
ile
2017 0 0 14,463 251,201 1,096,586 4,286,040
Variance YOY% 0.0% 0.0% 22.9% 0.1% 0.9% 0.4%
Change YOY - - 2,692 233 10,089 15,845
US R
esid
ents
by
No
n-Au
tom
obile 2017 14,136 1,958 151,717 88,408 863,818 2,689,280
Variance YOY% 28.8% -52.5% 12.7% -8.5% 10.3% 7.0%
Change YOY 3,158 (2,168) 17,096 (8,160) 80,350 175,654
Resi
dent
s fr
om
Othe
r Cou
ntrie
s 2017 54,685 560 83,735 13,644 1,180,857 2,798,874
Variance YOY% 6.8% -73.8% 10.6% -3.3% 10.7% 7.9%
Change YOY 3,461 (1,576) 8,011 (472) 114,572 204,710
Source: Statistics Canada, Frontier counts, custom tabulations. Preliminary estimates subject to change.
INTERNATIONAL ARRIVALS BY PROVINCE OF ENTRY

Tourism Snapshot December 2017 | 15
Overnight Arrivals by Province of Entry January to December 2017
Man
itoba
Sask
atch
ewan
Albe
rta
Briti
sh C
olum
bia
Yuko
n
CANA
DA
Tota
l One
or
mor
e ni
ghts
2017 221,227 78,962 1,076,401 5,713,926 165,630 20,846,108
Variance YOY% 4.0% -5.9% 6.1% 3.3% 2.8% 4.4%
Change YOY 8,485 (4,942) 61,578 181,700 4,472 874,553
US R
esid
ents
by
Auto
mob
ile
2017 143,518 58,001 158,333 1,890,463 89,521 7,988,126
Variance YOY% 5.9% 6.9% 1.2% -2.5% 8.4% 0.0%
Change YOY 7,994 3,764 1,933 (49,180) 6,972 342
US R
esid
ents
by
No
n-Au
tom
obile 2017 68,628 18,537 589,037 1,800,611 54,389 6,340,519
Variance YOY% 0.5% -31.5% 11.9% 7.1% -4.9% 7.4%
Change YOY 330 (8,510) 62,427 119,118 (2,792) 436,503
Resi
dent
s fr
om
Othe
r Cou
ntrie
s 2017 9,081 2,424 329,031 2,022,852 21,720 6,517,463
Variance YOY% 1.8% -7.5% -0.8% 5.8% 1.4% 7.2%
Change YOY 161 (196) (2,782) 111,762 292 437,943
• In 2017, the top provinces of entry to Canada were Ontario (46.9%), followed by British Columbia (27.4%) and Quebec (15.1%). The same provinces also saw the greatest total increase in international arrivals compared to 2016: Ontario (+396,000 arrivals), Quebec (+205,000), and British Columbia (+182,000). Proportionally, strong year-over-year growth was also recorded in Nova Scotia (+12.5%), Newfoundland (+10.6%), and Alberta (+6.1%).
• Overall 2017 auto arrivals to British Columbia fell below 2016 levels (-2.5%), following severe wildfires over the summer of 2017; however, total international arrivals to the province were still up +3.3% year-over-year due to increased non-auto US visitors and overseas visitors. US auto arrivals to all other provinces in 2017 were on par or ahead of 2016 levels.
• For those provinces that saw a decrease in total international arrivals in 2017 – New Brunswick, Saskatchewan, and Prince Edward Island – the declines were attributable to a combination of fewer non-auto US arrivals and overseas arrivals.

16 | Tourism Snapshot December 2017
Overnight Trips by Canadians
December 2017 YOY % Variance Jan.- Dec. 2017 YOY % Variance
United States 1,368,266 7.7 20,205,839 4.8
Other Countries 1,012,207 6.4 12,849,820 7.2
Total Trips from Canada 2,380,473 7.2 33,055,659 5.7
Source: Statistics Canada, International Travel Survey.Note: The figures are preliminary estimates and are subject to change.
• Overnight trips by Canadians to international destinations continued to trend upward in December 2017, reaching 2.4 million (+7.2%), with more outbound trips recorded to the US (+7.7%) and to other international destinations (+6.4%).
• Overall in 2017, Canadians travelled more internationally than they did in 2016 (33.1 million trips, +5.7%). In particular, Canadians took more trips to the US (+4.8%) and especially to overseas destinations (+7.2%) this year.
• While the majority of Canadian residents’ trips to the US were taken by automobile (53%), the biggest year-over-year growth was recorded in trips by air (+9.1%).
• The Canadian Consumer Confidence Index (published by the Conference Board of Canada) improved for a third consecutive month in December 2017, climbing a notable 7.3 points to reach 128.4 at the end of the year.
CANADIAN OUTBOUND TRAVEL

Tourism Snapshot December 2017 | 17
Hotel Performance Indicators by Province
Occupancy Rates Average Daily Rate (ADR) Revenue Per Available Room (RevPAR)
Dec. 2017 YOY^ Variance
Jan.- Dec.
YOY^ Variance Dec. 2017 YOY %
VarianceJan.- Dec.
YOY % Variance Dec. 2017 YOY %
VarianceJan.- Dec.
YOY % Variance
Alberta1 41.3% 2.6 53.7% 1.5 $122.46 -0.4% $130.03 -0.9% $50.62 6.3% $69.84 2.0%
British Columbia 54.4% 0.9 70.1% 2.0 $173.11 6.3% $172.51 6.5% $94.10 8.1% $121.01 9.6%
Saskatchewan 41.5% 1.4 54.0% 0.4 $113.55 -4.6% $119.35 -4.7% $47.17 -1.3% $64.42 -4.0%
Manitoba 53.3% 1.4 68.5% 5.3 $118.43 2.1% $123.39 1.8% $63.09 4.9% $84.48 10.3%
Ontario 53.2% 1.8 69.3% 1.6 $141.56 5.2% $154.75 6.3% $75.34 8.8% $107.19 8.8%
Quebec 55.3% 0.9 70.3% 2.3 $163.27 3.4% $167.99 5.9% $90.29 5.2% $118.16 9.5%
New Brunswick 39.2% 1.3 60.7% 2.5 $111.43 3.7% $121.43 4.3% $43.65 7.4% $73.68 8.7%
Nova Scotia 43.4% 1.7 67.2% 2.7 $122.11 2.5% $141.20 7.8% $53.01 6.6% $94.82 12.4%
Newfoundland 36.2% -3.2 62.4% 0.6 $129.86 1.1% $144.97 -1.0% $47.00 -7.2% $90.50 0.1%
Prince Edward Island 31.7% -3.6 57.9% 0.7 $107.18 11.3% $144.91 7.2% $33.96 -0.1% $83.96 8.4%
Northwest Territories 70.7% 4.7 71.7% 2.7 $147.45 0.2% $142.40 -5.5% $104.32 7.2% $102.16 -1.8%
Yukon 44.6% -0.3 67.6% 0.3 $119.42 5.0% $133.11 6.9% $53.30 4.3% $89.97 7.4%
Canada 50.0% 1.6 65.6% 1.8 $147.29 3.8% $155.10 4.8% $73.67 7.3% $101.69 7.8%
Note: Based on the operating results of 247,228 rooms (unweighted data).^ Percentage points. 1 Excluding Alberta resorts.
Source: CBRE Hotels with reproduction and use of information subject to CBRE Disclaimer / Terms of Use as detailed at www.cbre.ca.Users of this information are advised that CBRE Hotels does not represent the information contained herein to be definitive or all-inclusive. CBRE Hotels believes the information to be reliable, but is not responsible for errors or omissions.
ACCOMMODATION
• In December 2017, the National Occupancy Rate was at 50.0%, up 1.6 points over December 2016, bringing the annual 2017 rate to 65.6%, up 1.8 points over 2016. Both for the month of December and overall in 2017, the highest occupancy rates were recorded in Northwest Territories (70.7% in December, 71.7% total 2017), Quebec (55.3% in December, 70.3% total 2017), and British Columbia (54.4% in December, 70.1% total 2017). Overall in 2017, Manitoba (up 5.3 points), Nova Scotia (up 2.7 points), and Northwest Territories (up 2.7 points) posted the strongest year-over-year growth in occupancy rate.
• Overall in 2017 the national average daily rate (ADR) reached $155.10, up 4.8% over 2016. Provincially, the highest ADR in 2017 was recorded in the three provinces with the highest international arrivals for the year – British Columbia ($172.51), Quebec ($167.99), and Ontario ($154.75). While year-over-year growth in ADR was
strong in these three provinces, the strongest growth was observed in Nova Scotia (+7.8%), Prince Edward Island (+7.2%), and Yukon (+6.9%).
• At the national level, the revenue per available room (RevPar) also climbed significantly in 2017, reaching $101.69 (up 7.8% over 2016). Once again, the strongest annual performance on this metric was observed in British Columbia ($121.01), Quebec ($118.16), and Ontario ($107.19). However, the biggest gains compared to 2016 were posted in Nova Scotia (+12.4%), Manitoba (+10.3%), and British Columbia (+9.6%).
• While a handful of provinces and territories registered overall annual declines in ADR and RevPar compared to 2016, occupancy rates were up year-over-year across Canada in 2017.

18 | Tourism Snapshot December 2017
ACCOMMODATION
Hotel Performance Indicators by Property Type
Occupancy Rates Average Daily Rate (ADR)
Dec. 2017 YOY^ Change Jan.- Dec. YOY^ Variance Dec. 2017 YOY Variance Jan.- Dec. YOY Variance
Property Size Under 50 rooms 37.0% 1.1 52.5% 2.8 $109.99 3.3% $113.30 4.2%
50-75 rooms 44.8% 2.1 59.8% 2.5 $108.62 3.4% $117.78 2.9%
76-125 rooms 48.0% 1.5 63.6% 2.3 $122.83 1.8% $130.79 2.6%
126-200 rooms 49.4% 1.0 66.1% 1.4 $133.09 4.7% $141.79 5.4%
201-500 rooms 54.6% 2.8 69.0% 1.6 $176.04 4.4% $183.39 6.1%
Over 500 rooms 57.6% -0.5 74.2% 0.3 $217.58 5.3% $231.28 7.6%
Total 50.0% 1.6 65.6% 1.8 $147.29 3.8% $155.10 4.8%
Property Type Limited Service 45.4% 1.7 60.6% 2.5 $110.28 2.4% $118.11 3.4%
Full Service 51.8% 1.5 68.2% 1.4 $149.78 4.6% $167.81 5.9%
Suite Hotel 58.6% 2.2 74.2% 1.1 $154.97 3.4% $159.77 3.1%
Resort 52.7% 1.6 63.5% 1.9 $314.07 5.3% $244.72 6.4%
Total 50.0% 1.6 65.6% 1.8 $147.29 3.8% $155.10 4.8%
Price Level Budget 44.7% 1.0 59.7% 2.7 $95.51 6.0% $103.16 7.2%
Mid-Price 50.0% 1.8 66.2% 1.5 $134.00 2.3% $146.39 3.8%
Upscale 57.2% 1.2 71.1% 1.5 $255.48 4.6% $254.66 5.7%
Total 50.0% 1.6 65.6% 1.8 $147.29 3.8% $155.10 4.8%
Note: Based on the operating results of 237,545 rooms (unweighted data).^ Percentage points.
• In 2017, occupancy rate generally increased by property size, ranging from 52.5% for the smallest properties (<50 rooms) to 74.2% for the largest properties (500+ rooms). However, those smaller properties (+2.8 percentage points) saw larger year-over-year increases in occupancy rate than larger properties (+0.3 percentage points).
• ADR also increased by property size in 2017, ranging from $113.30 to $231.28; however, larger properties (500+ rooms) also recorded stronger year-over-year growth in ADR than smaller properties.
• Suite hotels recorded the highest occupancy rates in 2017 (74.2%), though Limited service hotels saw the biggest increase over 2016 occupancy rates (+2.5 percentage points).The highest ADR in 2017 was found
at resorts ($244.17), which also saw the biggest increase over 2016 (+6.4%).
• Upscale properties reported the highest occupancy rate (71.1%) and ADR ($254.66) in 2017, but budget properties posted the biggest increases compared to 2016 for both occupancy (+2.7 percentage points) and ADR (+7.2%).
• These general trends in 2017 may suggest that as room rates climb and room availability falls at larger, more high-end properties, travellers are turning toward smaller, more budget-friendly accommodations characterized by lower occupancy rates and average daily rate, but benefitting from larger increases in both rates.
DC CONSUMER AND MARKET INTELLIGENCE