tourism snapshot - destination canada snapshot...6 | tourism snapshot may 2019 • canada welcomed...
TRANSCRIPT

Tourism Snapshot May 2019 | 1
© D
estin
atio
n C
harlo
ttet
own
May 2019Volume 15, Issue 5
www.destinationcanada.com
A Monthly Monitor of the Performance of Canada’s Tourism Industry
Tourism Snapshot
2 | Tourism Snapshot May 2019
IMPORTANT NOTE REGARDING THE FRONTIER COUNTS DATA:
Land port data: There have been significant changes in how country of residence data is collected and established for non-US visitors entering Canada by land ports, starting in August 2018. As a result of these changes, monthly arrival levels by land are not comparable to data collected before August 2018. Year-over-year arrival performance results should only be evaluated for non-land arrival modes of transportation for non-US arrivals. This does not apply to US Auto arrivals.
Air arrivals data: Destination Canada advises caution in interpreting air arrival data with previous years as air arrivals include same-day and international passengers connecting through Canada between other international origins and destinations. Connecting traffic may have been subjected to material fluctuations in recent months.
Starting with January 2019 data, Statistics Canada updated the method of determining trip durations for US residents travelling to Canada and Canadian residents returning from the United States for non-automobile modes of transportation. This change affects the relative proportions of same-day/overnight travellers. Caution is therefore advised when comparing 2019 data with earlier time periods for these modes of transportation.
• In May 2019, Canada welcomed 1.91 million international overnight arrivals, up 7.6% year-over-year. This brought year-to-date overnight arrivals to 6.29 million, up 5.3%, based on gains from the US (+4.6%) and rest of the world (+6.8%), including Destination Canada’s nine key long-haul markets (+5.9%).
• Over the first five months of 2019, expanded air arrivals direct from overseas from Destination Canada’s long-haul markets (+4.6%) effectively offset continued declines in air arrivals via the US (-7.6%).
• With the start the school summer vacation period in India, May 2019 overnight arrivals from India reached 47,000, up 26.8% year-over-year. Among Destination Canada’s long-haul markets, India ranked fourth in May 2019 and fifth year-to-date in total arrivals.
• Overnight arrivals from the UK increased year-over-year for a second consecutive month in May 2019 (81,000, +18.0%). This included more direct air arrivals (52,000, +4.0%), despite a retraction in direct air capacity between
Canada and the UK. However, while total overnight arrivals from the UK from January to May 2019 remained ahead of the same period in 2018 (+6.7%), year-to-date air arrivals from the UK remained at a three-year low as a result of contractions by air direct from overseas and via the US.
• Overnight arrivals from Mexico continued to leap ahead of 2018 levels, both in May 2019 (40,000, +28.1%) and year-to-date (165,000, +29.7%). Increased arrivals by air via the US are of particular note, following steep contractions in 2018.
• Amid a slowing economic outlook and global trade tension jitters, Chinese travel agencies reported a decline in outbound travel from Beijing (-28.1%) over the first quarter of 2019 and from Shanghai (-3.2) over the first two months of 2019. For example, outbound travel to the North America from Beijing fell 20%.2 This trend was reflected in decreased overnight arrivals to Canada (-4.7% in May 2019, -0.7% YTD), including declining air arrivals via the US.
KEY HIGHLIGHTS
QUICK LINKS
1Note the caveat from Statistics Canada associated with the May 2019 data, available here: https://www150.statcan.gc.ca/n1/daily-quotidien/190723/dq190723a-eng.htm
2Source: https://www.travelchinaguide.com/tourism/2019statistics/
Tourism Snapshot May 2019 | 3
Industry Performance Dashboard
May 2019 Year-to-date
Overnight Arrivals1
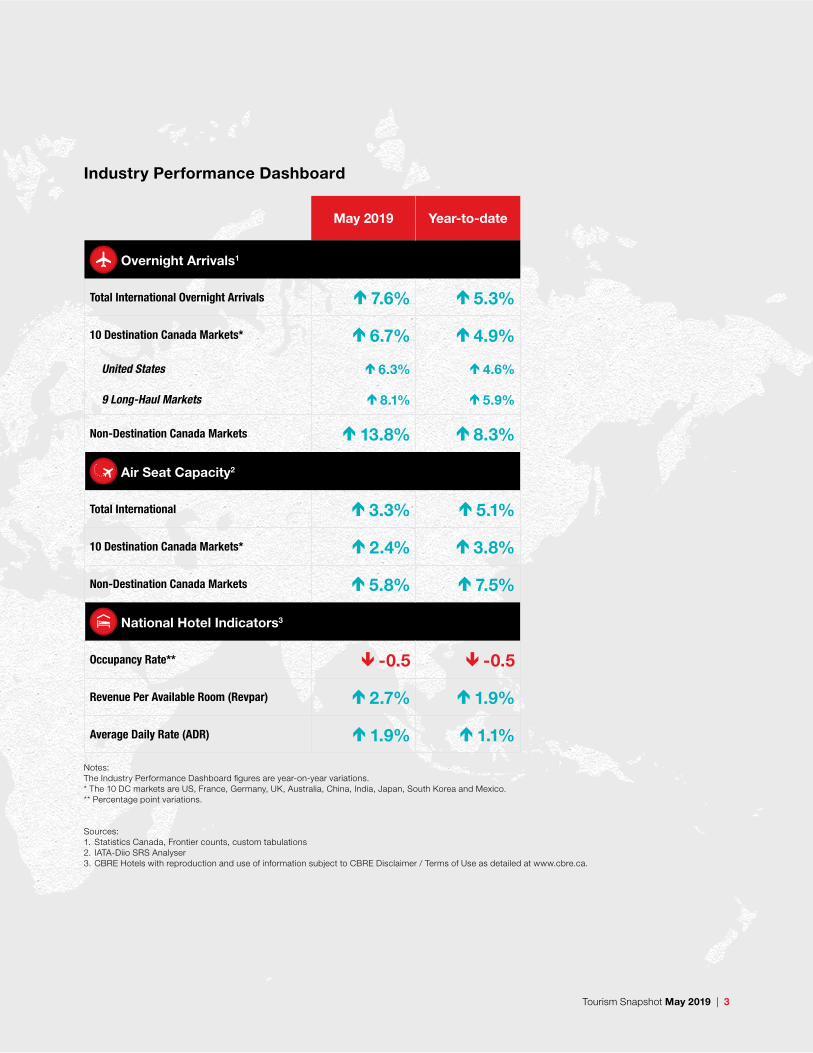
Total International Overnight Arrivals 7.6% 5.3%
10 Destination Canada Markets* 6.7% 4.9%
United States 6.3% 4.6%
9 Long-Haul Markets 8.1% 5.9%
Non-Destination Canada Markets 13.8% 8.3%
Air Seat Capacity2
Total International 3.3% 5.1%
10 Destination Canada Markets* 2.4% 3.8%
Non-Destination Canada Markets 5.8% 7.5%
National Hotel Indicators3
Occupancy Rate** -0.5 -0.5
Revenue Per Available Room (Revpar) 2.7% 1.9%
Average Daily Rate (ADR) 1.9% 1.1%
Notes:The Industry Performance Dashboard figures are year-on-year variations. * The 10 DC markets are US, France, Germany, UK, Australia, China, India, Japan, South Korea and Mexico.** Percentage point variations.
Sources:1. Statistics Canada, Frontier counts, custom tabulations2. IATA-Diio SRS Analyser3. CBRE Hotels with reproduction and use of information subject to CBRE Disclaimer / Terms of Use as detailed at www.cbre.ca.

4 | Tourism Snapshot May 2019
Overnight Arrivalsi Arrival YOY
Variations (%)Air Seat
capacityii Local currency
vs. CADiii
Market May 2019 YTD 2019 May 2019 YTD 2019 May 2019 YTD 2019 May 2019 Average
YTD Average
North America
United States 1,270,137 4,194,068 6.3% 4.6% 3.0% 4.9% 4.6% 5.0%
Mexico 39,938 165,188 28.1% 29.7% -6.8% -1.0% 6.8% 3.2%
Europe
France 48,973 179,416 8.3% 8.3% 11.0% 6.3% -1.0% -2.7%
Germany 36,405 97,077 -0.2% -5.0% 3.1% 4.0% -1.0% -2.7%
United Kingdom 81,017 234,091 18.0% 6.7% -5.6% -5.9% -0.2% -1.6%
Asia-Pacific
Australia 40,334 111,704 5.0% 5.0% 22.9% 16.8% -3.5% -4.1%
China 58,432 229,483 -4.7% -0.7% 6.6% 3.1% -2.8% -1.4%
India 47,076 117,360 26.8% 21.1% -38.4% -6.8% 1.1% -2.3%
Japan 17,414 77,584 2.3% 0.2% 8.2% 9.2% 4.2% 3.0%
South Korea 19,274 63,833 -21.0% -18.8% 1.8% -3.1% -4.8% -1.2%
Total 10 Destination Canada Markets
1,659,000 5,469,804 6.7% 4.9%
Rest of the World 249,580 822,356 13.8% 8.3%
Total International 1,908,580 6,292,160 7.6% 5.3%
Sources:i. Statistics Canada, Frontier counts, custom tabulationsii. IATA-Diio SRS Analyseriii. Bank of Canada
Notes: i. Overnight arrivals are preliminary estimates and are subject to changes. Overnight arrivals are defined as tourist estimates equal to total travellers entering Canada
(by land, air and sea) less same-day land arrivals. The topline statistics published by Statistics Canada are based on total travellers (including same-day), while the topline statistics published by Destination Canada are based on overnight arrivals to Canada.
ii. Air seat capacity is the variation in the total number of seats on direct commercial scheduled flights during the current month and YTD relative to the same periods in the previous year.
iii. The exchange rate variation is calculated on the average value of the Canadian Dollar during during the current month and YTD relative to the same periods in the previous year.
MARKET MONITOR SUMMARY
Tourism Snapshot May 2019 | 5
UNITED STATES
JAN FEB MAR APR MAY JUN JUL AUG SEP OCT NOV DEC
OVER
NIG
HT A
RRIV
ALS
(000
s)
20192018
0
500
1,000
1,500
2,000
2,500
3,000
PEAK: MAY 2002
United States: Key Indicators
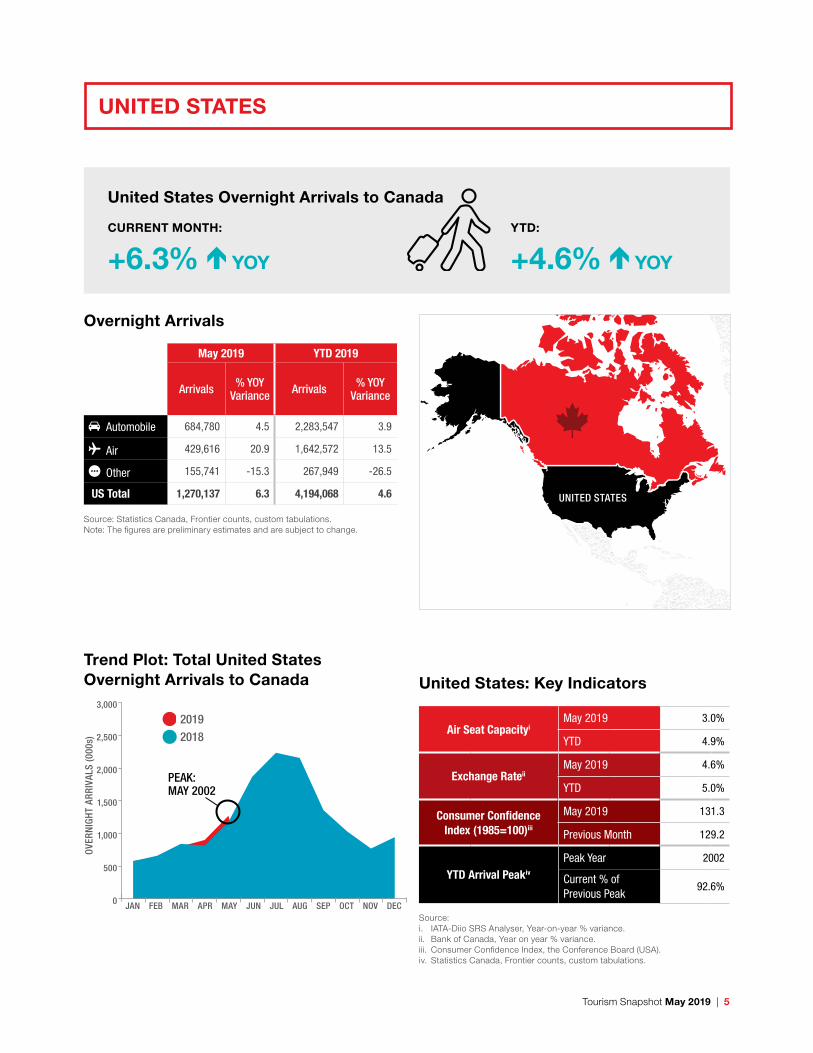
Air Seat CapacityiMay 2019 3.0%
YTD 4.9%
Exchange RateiiMay 2019 4.6%
YTD 5.0%
Consumer Confidence Index (1985=100)iii
May 2019 131.3
Previous Month 129.2
YTD Arrival Peakiv
Peak Year 2002
Current % of Previous Peak
92.6%
Source:i. IATA-Diio SRS Analyser, Year-on-year % variance.ii. Bank of Canada, Year on year % variance.iii. Consumer Confidence Index, the Conference Board (USA).iv. Statistics Canada, Frontier counts, custom tabulations.
Trend Plot: Total United States Overnight Arrivals to Canada
Overnight Arrivals
May 2019 YTD 2019
Arrivals % YOY Variance Arrivals % YOY
Variance
Automobile 684,780 4.5 2,283,547 3.9
Air 429,616 20.9 1,642,572 13.5
Other 155,741 -15.3 267,949 -26.5
US Total 1,270,137 6.3 4,194,068 4.6
Source: Statistics Canada, Frontier counts, custom tabulations.Note: The figures are preliminary estimates and are subject to change.
UNITED STATES
United States Overnight Arrivals to Canada
CURRENT MONTH:
+6.3% YOY
YTD:
+4.6% YOY
6 | Tourism Snapshot May 2019
• Canada welcomed 1.27 million overnight visitors from the US in May 2019, up 6.3% compared to May 2018, continuing the positive trend observed last month. This brought total US overnight arrivals over the first five months of 2019 to 4.19 million, up 4.6% over the same period in 2018.
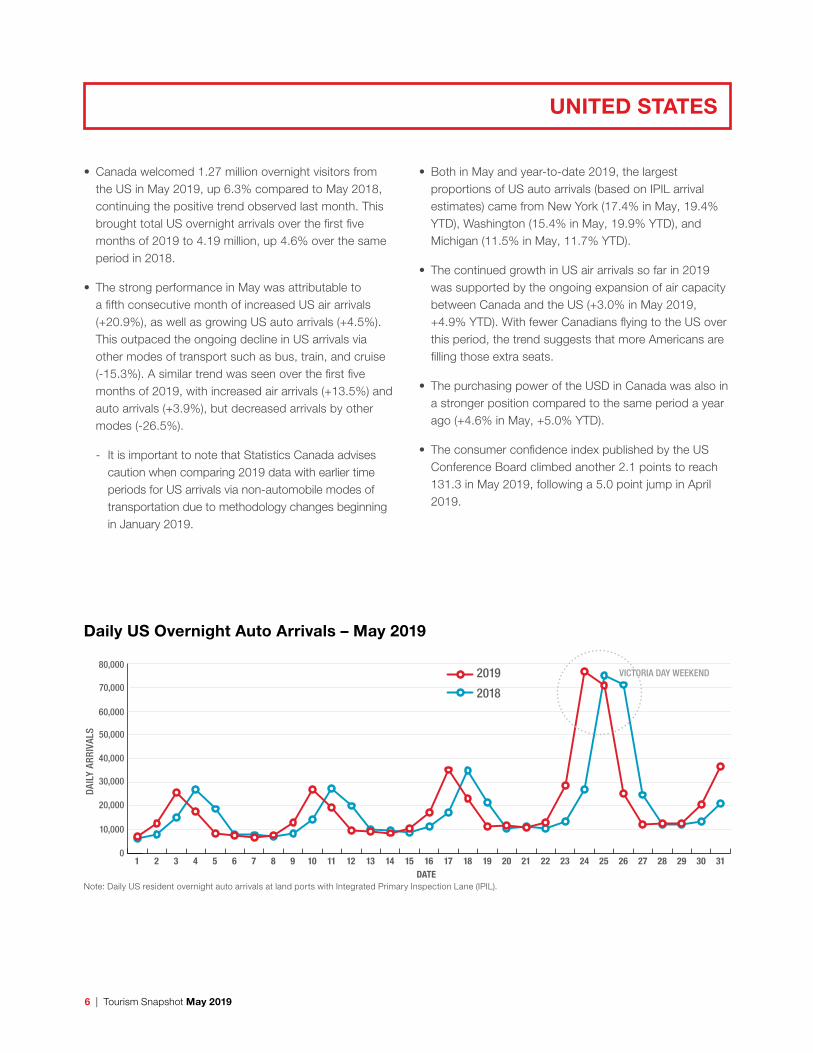
• The strong performance in May was attributable to a fifth consecutive month of increased US air arrivals (+20.9%), as well as growing US auto arrivals (+4.5%). This outpaced the ongoing decline in US arrivals via other modes of transport such as bus, train, and cruise (-15.3%). A similar trend was seen over the first five months of 2019, with increased air arrivals (+13.5%) and auto arrivals (+3.9%), but decreased arrivals by other modes (-26.5%).
- It is important to note that Statistics Canada advises caution when comparing 2019 data with earlier time periods for US arrivals via non-automobile modes of transportation due to methodology changes beginning in January 2019.
• Both in May and year-to-date 2019, the largest proportions of US auto arrivals (based on IPIL arrival estimates) came from New York (17.4% in May, 19.4% YTD), Washington (15.4% in May, 19.9% YTD), and Michigan (11.5% in May, 11.7% YTD).
• The continued growth in US air arrivals so far in 2019 was supported by the ongoing expansion of air capacity between Canada and the US (+3.0% in May 2019, +4.9% YTD). With fewer Canadians flying to the US over this period, the trend suggests that more Americans are filling those extra seats.
• The purchasing power of the USD in Canada was also in a stronger position compared to the same period a year ago (+4.6% in May, +5.0% YTD).
• The consumer confidence index published by the US Conference Board climbed another 2.1 points to reach 131.3 in May 2019, following a 5.0 point jump in April 2019.
UNITED STATES
1 2 3 4 5 6 7 8 9 10 11 12 13 14 15 16 17 18 19 20 21 22 23 24 25 26 27 28 29 3130
DAIL
Y AR
RIVA
LS
DATE
0
10,000
20,000
30,000
40,000
50,000
60,000
70,000
80,0002019
2018
VICTORIA DAY WEEKEND
Daily US Overnight Auto Arrivals – May 2019
Note: Daily US resident overnight auto arrivals at land ports with Integrated Primary Inspection Lane (IPIL).
Tourism Snapshot May 2019 | 7
MEXICO
JAN FEB MAR APR MAY JUN JUL AUG SEP OCT NOV DEC
OVER
NIG
HT A
RRIV
ALS
(000
s)
0
10
20
30
40
50
6020192018
PEAK: MAY 2019
Trend Plot: Total Mexico Overnight Arrivals to Canada
MEXICO
Mexico: Key Indicators
Mexico
Air Seat Capacityi
May 2019 -6.8%
YTD -1.0%
Exchange RateiiMay 2019 6.8%
YTD 3.2%
YTD Arrival Peakiii
Peak Year 2018
Current % of Previous Peak
129.7%
Sources:i. IATA-Diio SRS Analyser, Year-on-year % variance.ii. Bank of Canada, Year on year % variance.iii. Statistics Canada, Frontier counts, custom tabulations.
Overnight Arrivals
May 2019 YTD 2019
Arrivals % YOY Variance Arrivals % YOY
Variance
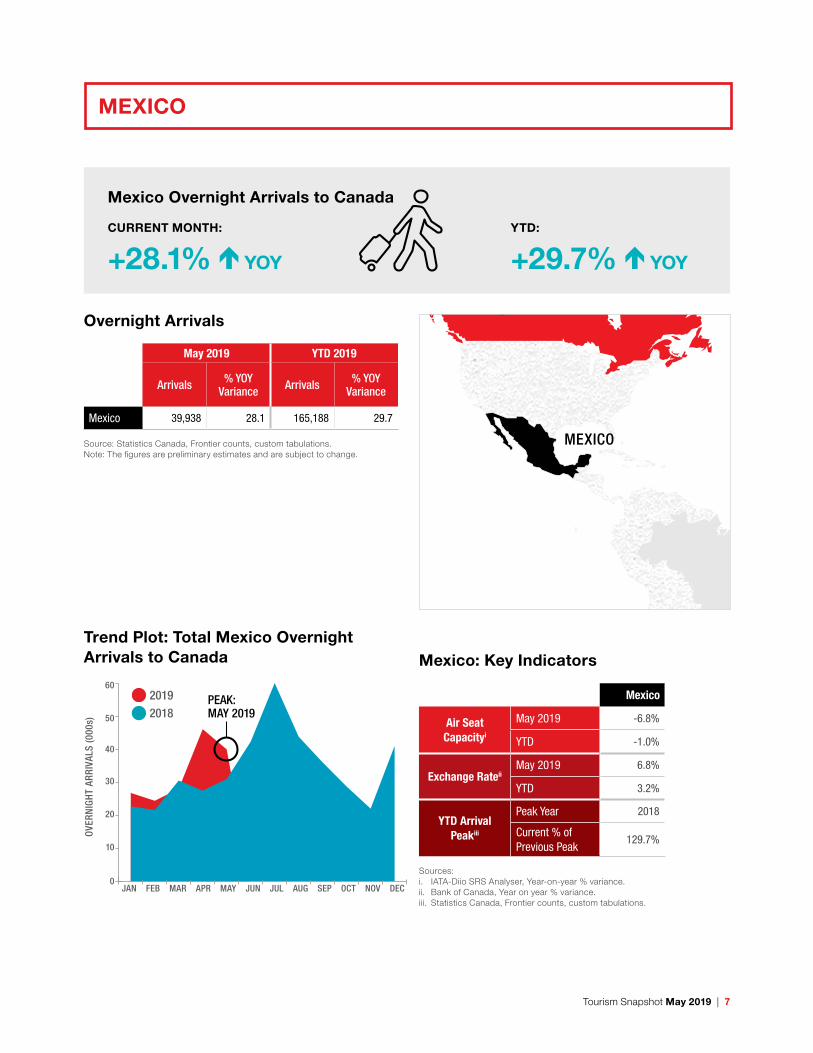
Mexico 39,938 28.1 165,188 29.7
Source: Statistics Canada, Frontier counts, custom tabulations.Note: The figures are preliminary estimates and are subject to change.
Mexico Overnight Arrivals to Canada
CURRENT MONTH:
+28.1% YOY
YTD:
+29.7% YOY
8 | Tourism Snapshot May 2019
• Overnight arrivals from Mexico maintained positive momentum in May 2019, following the big Easter-related jump in April 2019. Overnight arrivals reached nearly 40,000 in May 2019, up 28.1% year-over-year and a new record for May overnight arrivals from Mexico. Non-land arrivals (primarily via air) accounted for close 34,000 of those May 2019 visitors and were up +12.4% year-over-year.
• From January to May 2019, overnight arrivals from Mexico also reached a new record peak for the first five months of the year (165,000, +29.7%), continuing the long-term positive trend observed since the replacement of the visa requirement for Mexican citizens with the eTA in December 2016. About 143,000 of those were non-land arrivals, up 18.5% year-over-year.
• Mexico was Destination Canada’s sixth largest long-haul market in May 2019, and fourth year-to-date in 2019.
• The strength of the Mexican Peso in Canada so far in 2019 remained ahead of the same period last year (+6.8% in May, +3.2% YTD).
• Following a long period of expansion, air capacity between Mexico City and Canada retracted for a third consecutive month in May 2019 (-6.8%), bringing it slightly behind 2018 levels year-to-date (-1.0%).
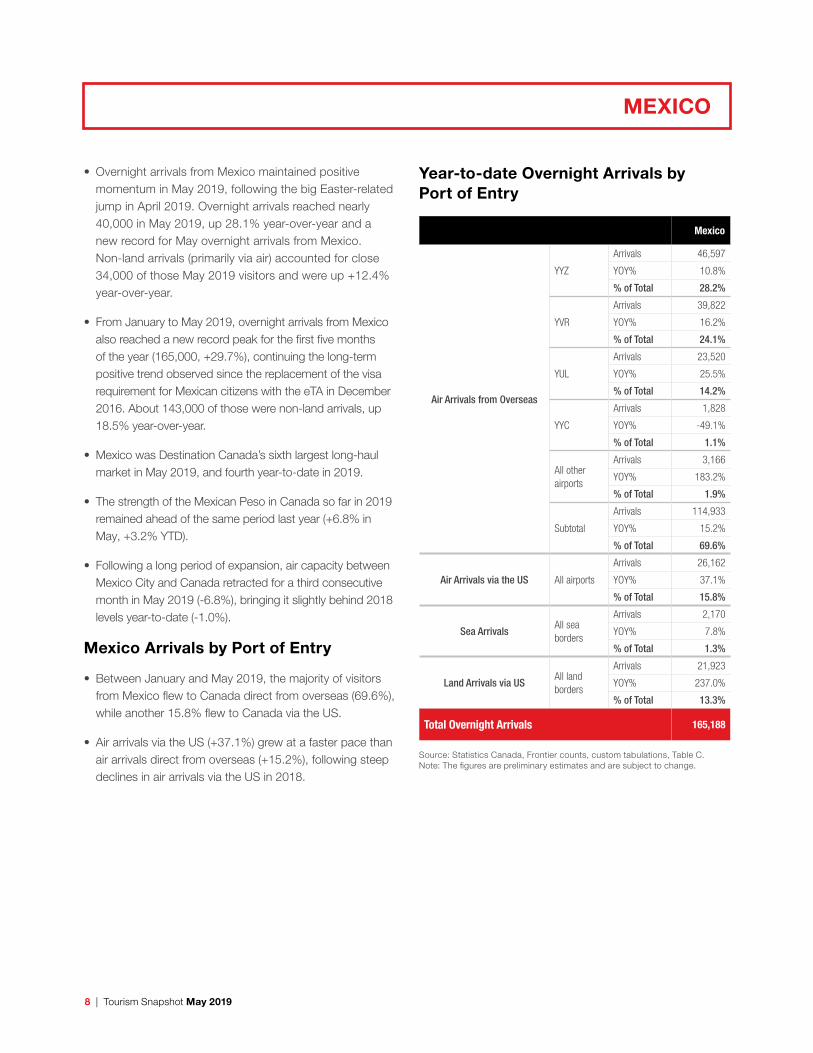
Mexico Arrivals by Port of Entry
• Between January and May 2019, the majority of visitors from Mexico flew to Canada direct from overseas (69.6%), while another 15.8% flew to Canada via the US.
• Air arrivals via the US (+37.1%) grew at a faster pace than air arrivals direct from overseas (+15.2%), following steep declines in air arrivals via the US in 2018.
Year-to-date Overnight Arrivals by Port of Entry
Mexico
Air Arrivals from Overseas
YYZ
Arrivals 46,597
YOY% 10.8%
% of Total 28.2%
YVR
Arrivals 39,822
YOY% 16.2%
% of Total 24.1%
YUL
Arrivals 23,520
YOY% 25.5%
% of Total 14.2%
YYC
Arrivals 1,828
YOY% -49.1%
% of Total 1.1%
All other airports
Arrivals 3,166
YOY% 183.2%
% of Total 1.9%
Subtotal
Arrivals 114,933
YOY% 15.2%
% of Total 69.6%
Air Arrivals via the US All airports
Arrivals 26,162
YOY% 37.1%
% of Total 15.8%
Sea ArrivalsAll sea borders
Arrivals 2,170
YOY% 7.8%
% of Total 1.3%
Land Arrivals via USAll land borders
Arrivals 21,923
YOY% 237.0%
% of Total 13.3%
Total Overnight Arrivals 165,188
Source: Statistics Canada, Frontier counts, custom tabulations, Table C.Note: The figures are preliminary estimates and are subject to change.
MEXICO
Tourism Snapshot May 2019 | 9
EUROPE
JAN FEB MAR APR MAY JUN JUL AUG SEP OCT NOV DEC
OVER
NIG
HT A
RRIV
ALS
(000
s)
20192018
0
50
100
150
200
250
300
PEAK: MAY 2019
Trend Plot: Total Destination Canada Europe Overnight Arrivals to Canada
Europe: Key Indicators
France GermanyUnited
Kingdom
Air Seat Capacityi
May 2019 11.0% 3.1% -5.6%
YTD 6.3% 4.0% -5.9%
Exchange Rateii
May 2019 -1.0% -1.0% -0.2%
YTD -2.7% -2.7% -1.6%
YTD Arrival Peakiii
Peak Year 2018 1996 2008
Current % of Previous Peak
108.3% 90.2% 84.6%
Sources:i. IATA-Diio SRS Analyser, Year-on-year % variance.ii. Bank of Canada, Year on year % variance.iii. Statistics Canada, Frontier counts, custom tabulations.
Overnight Arrivals
May 2019 YTD 2019
Arrivals % YOY Variance Arrivals % YOY
Variance
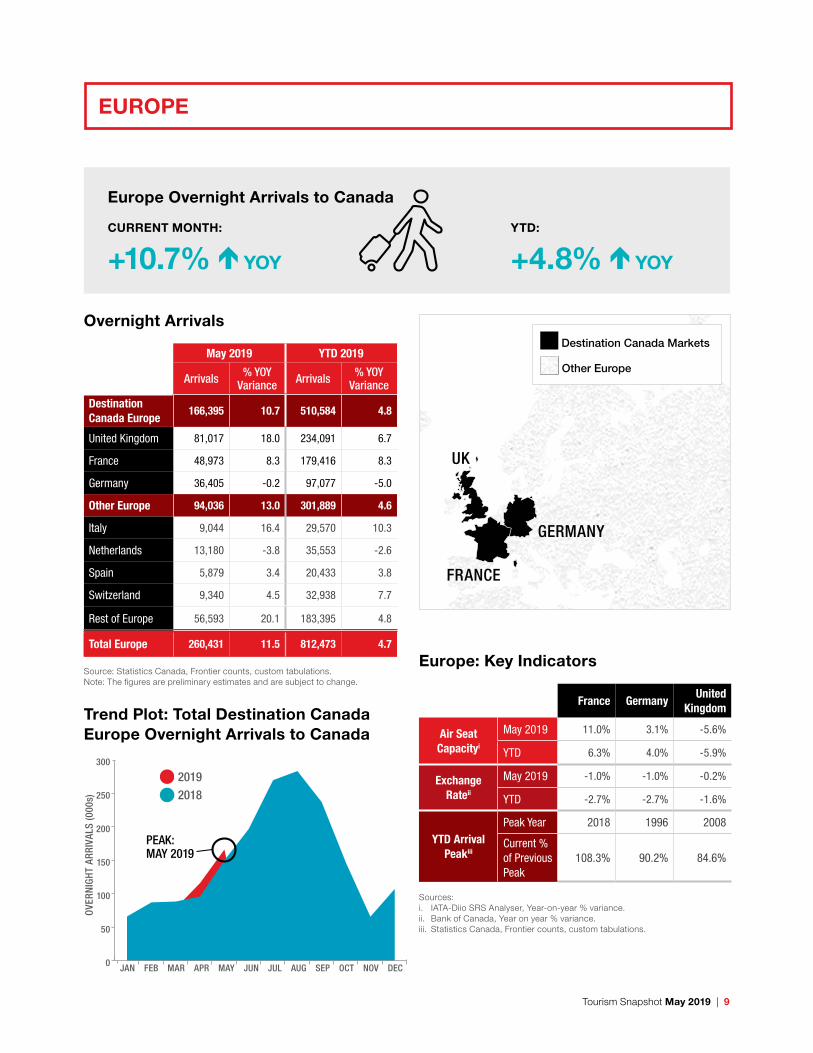
Destination Canada Europe
166,395 10.7 510,584 4.8
United Kingdom 81,017 18.0 234,091 6.7
France 48,973 8.3 179,416 8.3
Germany 36,405 -0.2 97,077 -5.0
Other Europe 94,036 13.0 301,889 4.6
Italy 9,044 16.4 29,570 10.3
Netherlands 13,180 -3.8 35,553 -2.6
Spain 5,879 3.4 20,433 3.8
Switzerland 9,340 4.5 32,938 7.7
Rest of Europe 56,593 20.1 183,395 4.8
Total Europe 260,431 11.5 812,473 4.7
Source: Statistics Canada, Frontier counts, custom tabulations.Note: The figures are preliminary estimates and are subject to change.
UK
FRANCE
GERMANY
Destination Canada Markets
ASIA-PACIFIC
DC EUROPEUS
DC LATIN-AMERICA
Other Europe
Europe Overnight Arrivals to Canada
CURRENT MONTH:
+10.7% YOY
YTD:
+4.8% YOY
10 | Tourism Snapshot May 2019
• In May 2019, overnight arrivals from Destination Canada’s Europe region reached 166,000, up 10.7% over May 2018. This brought year-to-date overnight arrivals over the first five months of 2019 to nearly 511,000, up 4.8% compared to the same period last year. This region also reached new records for overnight arrivals in the month of May and for the first five months of the year.
• Leading this region in both total arrivals and year-over-year growth, the UK recorded increased overnight arrivals to Canada for a second consecutive month in May 2019 (81,000, +18.0%). May 2019 non-land arrivals from the UK were also ahead of May 2018 (+5.3%), including air arrivals direct from overseas (+4.0%), but were down year-to-date. With this performance, the UK firmly held its spot as Destination Canada’s largest long-haul market in May 2019, and also regained the top position in year-to-date arrivals.
• Overnight arrivals from France continued to set new records, with new monthly peaks in May 2019 (49,000, +8.3%) and year-to-date (179,000, +8.3%).
• While overnight arrivals from Germany were marginally down year-over-year in May 2019 (36,000, -0.2%), non-land arrivals were up slightly, particularly by air direct from overseas (+1.9%) and by cruise (+33.0%). However, year-to-date overnight arrivals continued to fall below 2018 levels overall (-5.0%) and across modes of entry.
• Direct air seat capacity to Canada expanded over this period from France (+11.0% in May, +6.3% YTD) and Germany (+3.1% in May, +4.0% YTD), but retracted from the UK (-5.6% in May, -5.9% YTD).
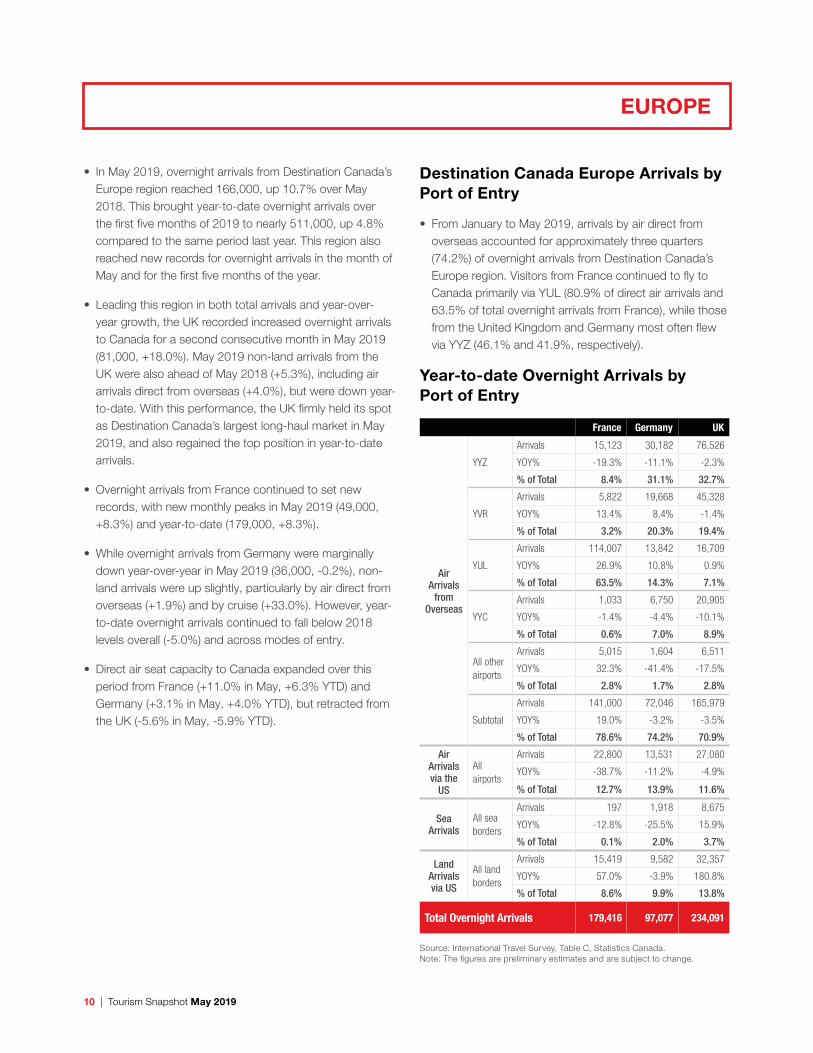
Destination Canada Europe Arrivals by Port of Entry
• From January to May 2019, arrivals by air direct from overseas accounted for approximately three quarters (74.2%) of overnight arrivals from Destination Canada’s Europe region. Visitors from France continued to fly to Canada primarily via YUL (80.9% of direct air arrivals and 63.5% of total overnight arrivals from France), while those from the United Kingdom and Germany most often flew via YYZ (46.1% and 41.9%, respectively).
Year-to-date Overnight Arrivals by Port of Entry
France Germany UK
Air Arrivals
from Overseas
YYZ
Arrivals 15,123 30,182 76,526
YOY% -19.3% -11.1% -2.3%
% of Total 8.4% 31.1% 32.7%
YVR
Arrivals 5,822 19,668 45,328
YOY% 13.4% 8.4% -1.4%
% of Total 3.2% 20.3% 19.4%
YUL
Arrivals 114,007 13,842 16,709
YOY% 26.9% 10.8% 0.9%
% of Total 63.5% 14.3% 7.1%
YYC
Arrivals 1,033 6,750 20,905
YOY% -1.4% -4.4% -10.1%
% of Total 0.6% 7.0% 8.9%
All other airports
Arrivals 5,015 1,604 6,511
YOY% 32.3% -41.4% -17.5%
% of Total 2.8% 1.7% 2.8%
Subtotal
Arrivals 141,000 72,046 165,979
YOY% 19.0% -3.2% -3.5%
% of Total 78.6% 74.2% 70.9%
Air Arrivals via the
US
All airports
Arrivals 22,800 13,531 27,080
YOY% -38.7% -11.2% -4.9%
% of Total 12.7% 13.9% 11.6%
Sea Arrivals
All sea borders
Arrivals 197 1,918 8,675
YOY% -12.8% -25.5% 15.9%
% of Total 0.1% 2.0% 3.7%
Land Arrivals via US
All land borders
Arrivals 15,419 9,582 32,357
YOY% 57.0% -3.9% 180.8%
% of Total 8.6% 9.9% 13.8%
Total Overnight Arrivals 179,416 97,077 234,091
Source: International Travel Survey, Table C, Statistics Canada.Note: The figures are preliminary estimates and are subject to change.
EUROPE
Tourism Snapshot May 2019 | 11
ASIA-PACIFIC
JAN FEB MAR APR MAY JUN JUL AUG SEP OCT NOV DEC
OVER
NIG
HT A
RRIV
ALS
(000
s)
20192018
0
50
100
150
200
250
PEAK: MAY 2019
Trend Plot: Total Destination Canada Asia-Pacific Overnight Arrivals to Canada
CHINA
INDIA
AUSTRALIA
JAPAN
SOUTHKOREA
Asia-Pacific: Key Indicators
Australia China India JapanSouth Korea
Air Seat Capacityi
May 2019
22.9% 6.6% -38.4% 8.2% 1.8%
YTD 16.8% 3.1% -6.8% 9.2% -3.1%
Exchange Rateii
May 2019
-3.5% -2.8% 1.1% 4.2% -4.8%
YTD -4.1% -1.4% -2.3% 3.0% -1.2%
YTD Arrival Peakiii
Peak Year
2017 2018 2018 1996 2017
Current % of Previous Peak
100.7% 99.3% 121.1% 42.2% 74.6%
Sources:i. IATA-Diio SRS Analyser, Year-on-year % variance.ii. Bank of Canada, Year on year % variance.iii. Statistics Canada, Frontier counts, custom tabulations.
Overnight Arrivals
May 2019 YTD 2019
Arrivals % YOY Variance Arrivals % YOY
Variance
Destination Canada Asia-Pacific
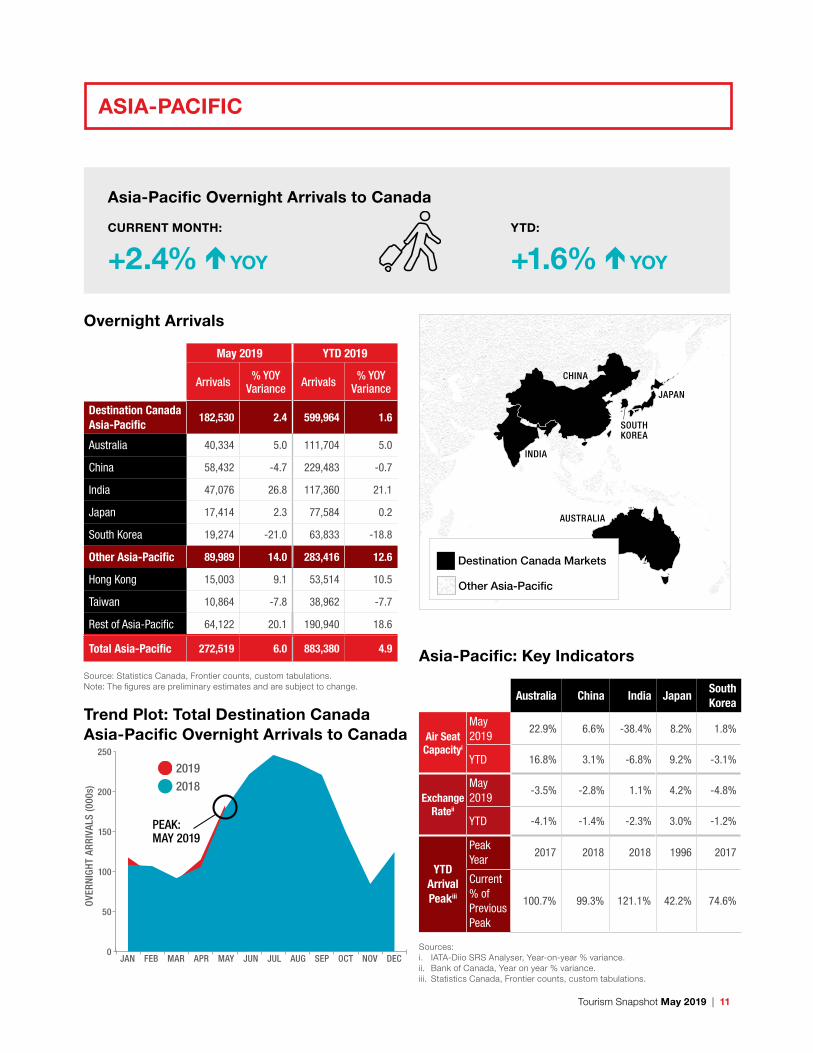
182,530 2.4 599,964 1.6
Australia 40,334 5.0 111,704 5.0
China 58,432 -4.7 229,483 -0.7
India 47,076 26.8 117,360 21.1
Japan 17,414 2.3 77,584 0.2
South Korea 19,274 -21.0 63,833 -18.8
Other Asia-Pacific 89,989 14.0 283,416 12.6
Hong Kong 15,003 9.1 53,514 10.5
Taiwan 10,864 -7.8 38,962 -7.7
Rest of Asia-Pacific 64,122 20.1 190,940 18.6
Total Asia-Pacific 272,519 6.0 883,380 4.9
Source: Statistics Canada, Frontier counts, custom tabulations.Note: The figures are preliminary estimates and are subject to change.
Destination Canada Markets
ASIA-PACIFIC
DC EUROPEUS
DC LATIN-AMERICA
Other Asia-Pacific
Asia-Pacific Overnight Arrivals to Canada
CURRENT MONTH:
+2.4% YOY
YTD:
+1.6% YOY

12 | Tourism Snapshot May 2019
• Canada welcomed close to 183,000 overnight visitors from Destination Canada’s Asia-Pacific region in May 2019, up 2.4% over May 2018. This brought overnight arrivals from January to May 2019 up to nearly 600,000, just ahead of the same period last year (+1.6%). This region also reached new records for overnight arrivals in the month of May and for the first five months of the year.
• India led this region in year-over-year growth, both in May 2019 (+26.8%) and year-to-date (+21.1%). With the start of the Indian school summer holiday period, India was the second largest market for overnight arrivals from this region (after China). Australia also saw strong growth in May 2019 (+5.0%) and year-to-date (+5.0%). Both markets also hit new peaks for monthly and year-to-date overnight arrivals.
• Canada welcome more than 17,000 overnight visitors from Japan in May 2019, increasing year-over-year for a second consecutive month (+2.3%). In particular, non-land (mostly air) arrivals were up for a second consecutive month (+4.7%). This brought year-to-date overnight arrivals marginally ahead of 2018 levels for the first time this year, at nearly 78,000 (+0.2%).
• Overnight arrivals from China fell year-over-year in May 2019 (-4.7%) and year-to-date (-0.7%). This may be a reflection of slowing outbound Chinese travel, as Chinese travel agencies reported a decline in outbound travel from Beijing (-28.1%) over the first quarter of 2019 and from Shanghai (-3.2) over the first two months of 2019, including slowing travel to North America.
ASIA-PACIFIC
• As a result of changes in land arrival data processing procedures implemented by Statistics Canada mid-way in 2018, total arrivals from South Korea continued to show a decline (-21.0% in May 2019, -18.8% YTD). In contrast, non-land (mostly air) arrivals were still slightly ahead of 2018 levels (+2.5% in May, +1.8% YTD), indicating a continued growth momentum from this market since the beginning of the year.
Destination Canada Asia-Pacific Arrivals by Port of Entry
• From January to May 2019, two-thirds of visitors from Destination Canada’s Asia-Pacific region flew to Canada direct from overseas (67.6%), primarily flying into YVR and YYZ.
Year-to-date Overnight Arrivals by Port of Entry
Australia China India Japan South Korea
Air Arrivals
from Overseas
YYZ
Arrivals 4,487 68,756 49,154 12,997 16,936
YOY% -6.1% -4.0% 2.9% -23.0% -1.6%
% of Total 4.0% 30.0% 41.9% 16.8% 26.5%
YVR
Arrivals 45,599 87,064 32,601 35,277 22,499
YOY% 12.6% -2.6% 52.2% 4.5% 0.7%
% of Total 40.8% 37.9% 27.8% 45.5% 35.2%
YUL
Arrivals 846 12,464 3,325 2,930 402
YOY% 19.8% 1.1% -6.4% 1,105.8% 15.5%
% of Total 0.8% 5.4% 2.8% 3.8% 0.6%
YYC
Arrivals 599 2,927 3,643 1,597 177
YOY% 15.9% -16.4% -11.9% -46.9% 43.9%
% of Total 0.5% 1.3% 3.1% 2.1% 0.3%
All other airports
Arrivals 308 202 715 198 67
YOY% 91.3% -20.5% -4.9% 360.5% 21.8%
% of Total 0.3% 0.1% 0.6% 0.3% 0.1%
Subtotal
Arrivals 51,839 171,413 89,438 52,999 40,081
YOY% 11.1% -3.2% 15.2% -1.8% 0.0%
% of Total 46.4% 74.7% 76.2% 68.3% 62.8%
Air Arrivals via the
US
All airports
Arrivals 38,419 22,283 11,852 14,902 9,927
YOY% -4.2% -17.9% 6.0% 1.2% 6.5%
% of Total 34.4% 9.7% 10.1% 19.2% 15.6%
Sea Arrivals
All sea borders
Arrivals 9,964 2,547 1,977 1,119 1,249
YOY% 3.0% 32.4% 31.2% -31.3% 27.7%
% of Total 8.9% 1.1% 1.7% 1.4% 2.0%
Land Arrivals via US
All land borders
Arrivals 11,482 33,240 14,093 8,564 12,576
YOY% 15.2% 33.3% 114.3% 20.3% -55.5%
% of Total 10.3% 14.5% 12.0% 11.0% 19.7%
Total Overnight Arrivals 111,704 229,483 117,360 77,584 63,833
Source: International Travel Survey, Table C, Statistics Canada.Note: The figures are preliminary estimates and are subject to change.
Tourism Snapshot May 2019 | 13
Overnight Trips by Canadians
May 2019 YOY % Variance Jan. - May 2019 YOY^ % Variance
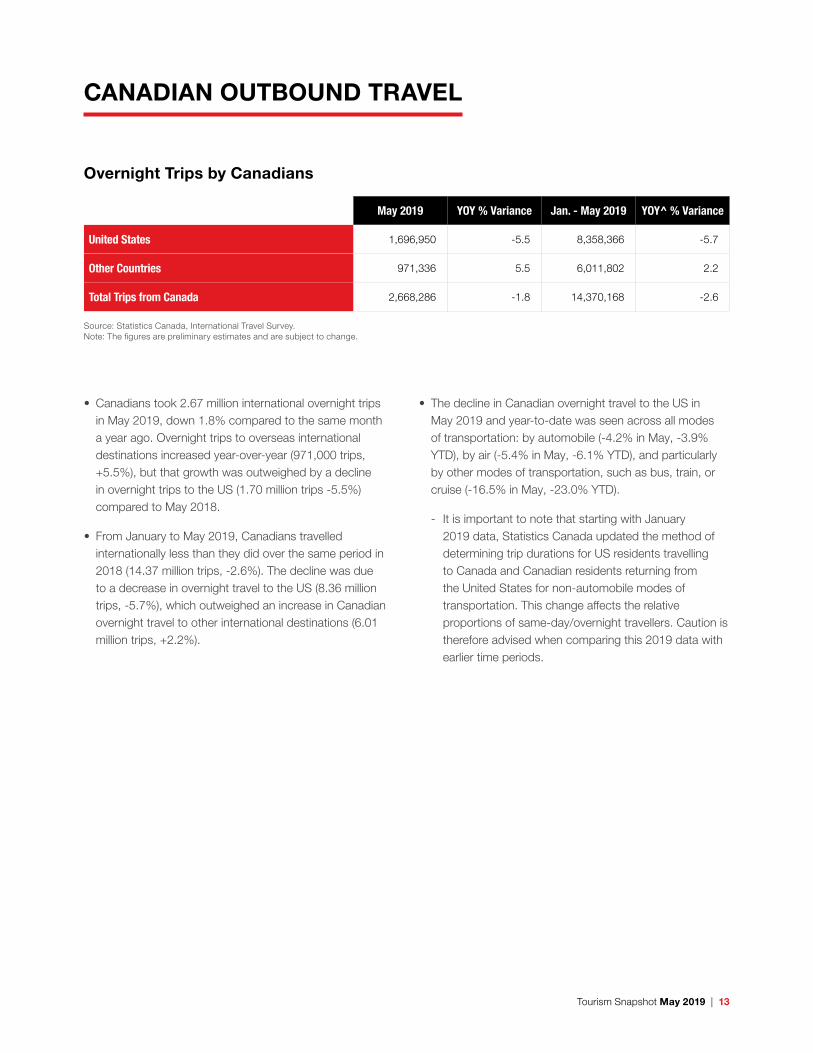
United States 1,696,950 -5.5 8,358,366 -5.7
Other Countries 971,336 5.5 6,011,802 2.2
Total Trips from Canada 2,668,286 -1.8 14,370,168 -2.6
Source: Statistics Canada, International Travel Survey.Note: The figures are preliminary estimates and are subject to change.
• Canadians took 2.67 million international overnight trips in May 2019, down 1.8% compared to the same month a year ago. Overnight trips to overseas international destinations increased year-over-year (971,000 trips, +5.5%), but that growth was outweighed by a decline in overnight trips to the US (1.70 million trips -5.5%) compared to May 2018.
• From January to May 2019, Canadians travelled internationally less than they did over the same period in 2018 (14.37 million trips, -2.6%). The decline was due to a decrease in overnight travel to the US (8.36 million trips, -5.7%), which outweighed an increase in Canadian overnight travel to other international destinations (6.01 million trips, +2.2%).
• The decline in Canadian overnight travel to the US in May 2019 and year-to-date was seen across all modes of transportation: by automobile (-4.2% in May, -3.9% YTD), by air (-5.4% in May, -6.1% YTD), and particularly by other modes of transportation, such as bus, train, or cruise (-16.5% in May, -23.0% YTD).
- It is important to note that starting with January 2019 data, Statistics Canada updated the method of determining trip durations for US residents travelling to Canada and Canadian residents returning from the United States for non-automobile modes of transportation. This change affects the relative proportions of same-day/overnight travellers. Caution is therefore advised when comparing this 2019 data with earlier time periods.
CANADIAN OUTBOUND TRAVEL
14 | Tourism Snapshot May 2019
Year-to-date Overnight Arrivals by Province of Entry
Newfo
undl
and
and
Labr
ador
Prin
ce E
dwad
Isla
nd
Nova
Sco
tia
New B
runs
wick
Queb
ec
Onta
rio
Tota
l One
or
mor
e ni
ghts
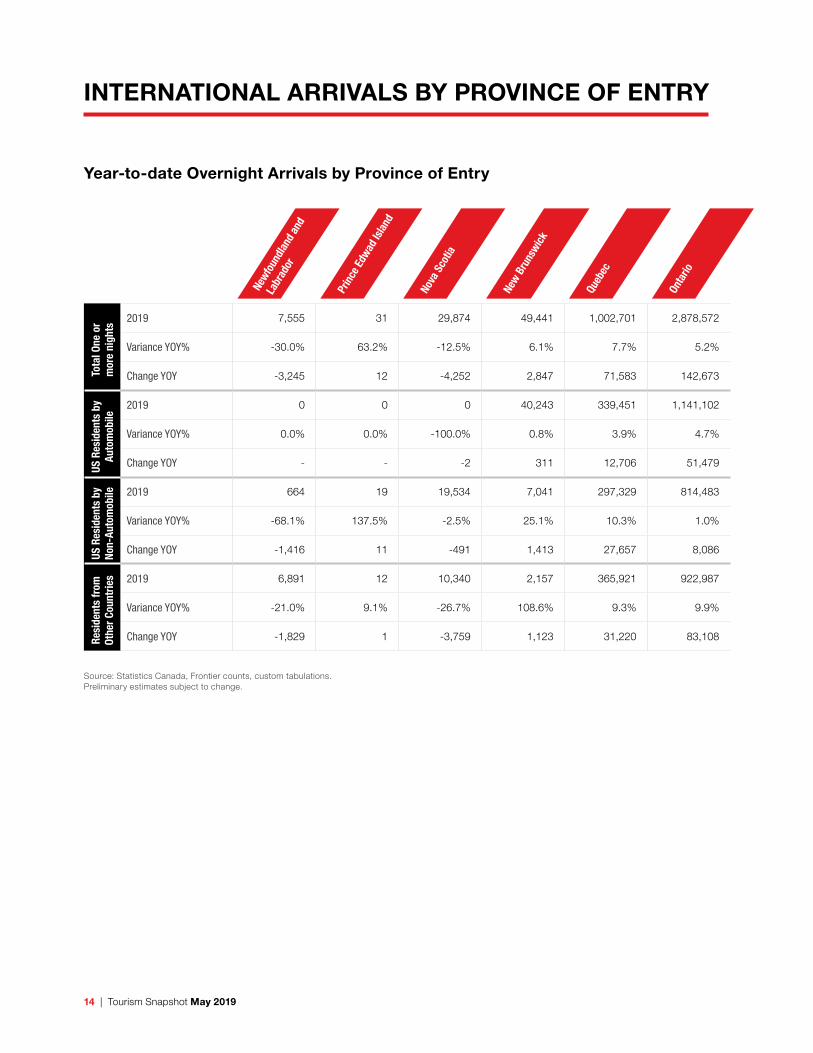
2019 7,555 31 29,874 49,441 1,002,701 2,878,572
Variance YOY% -30.0% 63.2% -12.5% 6.1% 7.7% 5.2%
Change YOY -3,245 12 -4,252 2,847 71,583 142,673
US R
esid
ents
by
Auto
mob
ile
2019 0 0 0 40,243 339,451 1,141,102
Variance YOY% 0.0% 0.0% -100.0% 0.8% 3.9% 4.7%
Change YOY - - -2 311 12,706 51,479
US R
esid
ents
by
No
n-Au
tom
obile 2019 664 19 19,534 7,041 297,329 814,483
Variance YOY% -68.1% 137.5% -2.5% 25.1% 10.3% 1.0%
Change YOY -1,416 11 -491 1,413 27,657 8,086
Resi
dent
s fr
om
Othe
r Cou
ntrie
s 2019 6,891 12 10,340 2,157 365,921 922,987
Variance YOY% -21.0% 9.1% -26.7% 108.6% 9.3% 9.9%
Change YOY -1,829 1 -3,759 1,123 31,220 83,108
Source: Statistics Canada, Frontier counts, custom tabulations. Preliminary estimates subject to change.
INTERNATIONAL ARRIVALS BY PROVINCE OF ENTRY
Tourism Snapshot May 2019 | 15
Year-to-date Overnight Arrivals by Province of Entry
Man
itoba
Sask
atch
ewan
Albe
rta
Briti
sh C
olum
bia
Yuko
n
Nuna
vut
CANA
DA
Tota
l One
or
mor
e ni
ghts
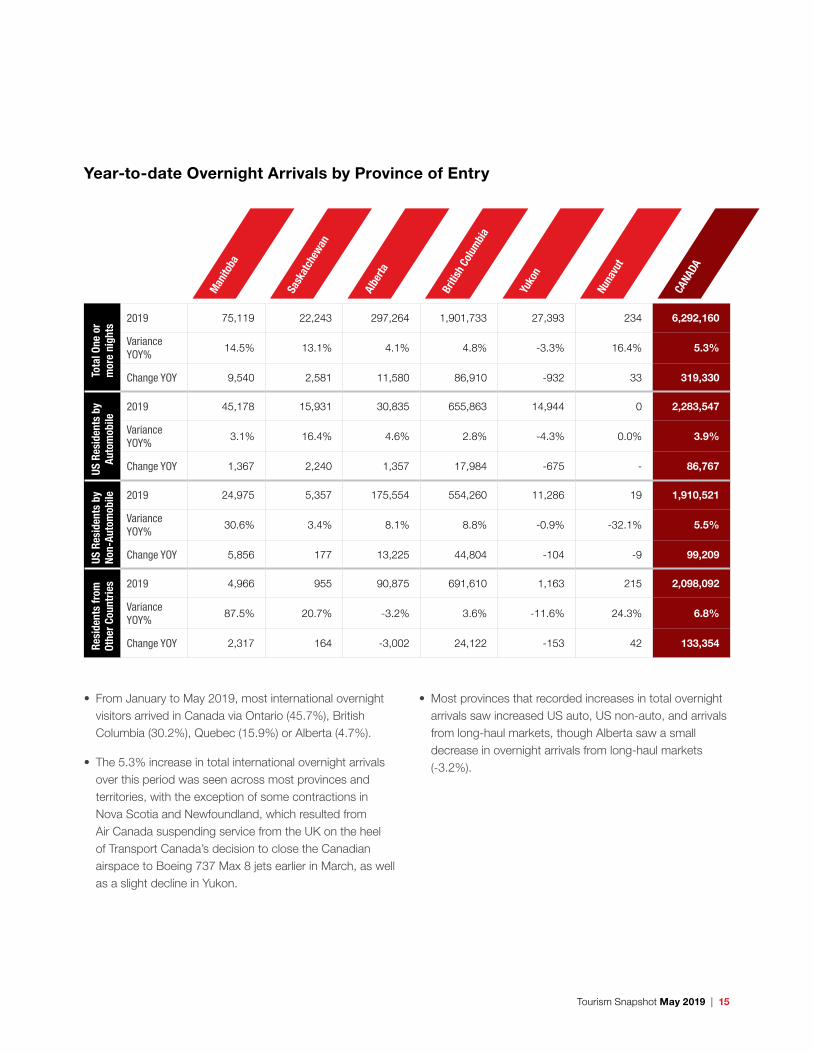
2019 75,119 22,243 297,264 1,901,733 27,393 234 6,292,160
Variance YOY%
14.5% 13.1% 4.1% 4.8% -3.3% 16.4% 5.3%
Change YOY 9,540 2,581 11,580 86,910 -932 33 319,330
US R
esid
ents
by
Auto
mob
ile
2019 45,178 15,931 30,835 655,863 14,944 0 2,283,547
Variance YOY%
3.1% 16.4% 4.6% 2.8% -4.3% 0.0% 3.9%
Change YOY 1,367 2,240 1,357 17,984 -675 - 86,767
US R
esid
ents
by
No
n-Au
tom
obile 2019 24,975 5,357 175,554 554,260 11,286 19 1,910,521
Variance YOY%
30.6% 3.4% 8.1% 8.8% -0.9% -32.1% 5.5%
Change YOY 5,856 177 13,225 44,804 -104 -9 99,209
Resi
dent
s fr
om
Othe
r Cou
ntrie
s 2019 4,966 955 90,875 691,610 1,163 215 2,098,092
Variance YOY%
87.5% 20.7% -3.2% 3.6% -11.6% 24.3% 6.8%
Change YOY 2,317 164 -3,002 24,122 -153 42 133,354
• From January to May 2019, most international overnight visitors arrived in Canada via Ontario (45.7%), British Columbia (30.2%), Quebec (15.9%) or Alberta (4.7%).
• The 5.3% increase in total international overnight arrivals over this period was seen across most provinces and territories, with the exception of some contractions in Nova Scotia and Newfoundland, which resulted from Air Canada suspending service from the UK on the heel of Transport Canada’s decision to close the Canadian airspace to Boeing 737 Max 8 jets earlier in March, as well as a slight decline in Yukon.
• Most provinces that recorded increases in total overnight arrivals saw increased US auto, US non-auto, and arrivals from long-haul markets, though Alberta saw a small decrease in overnight arrivals from long-haul markets (-3.2%).
16 | Tourism Snapshot May 2019
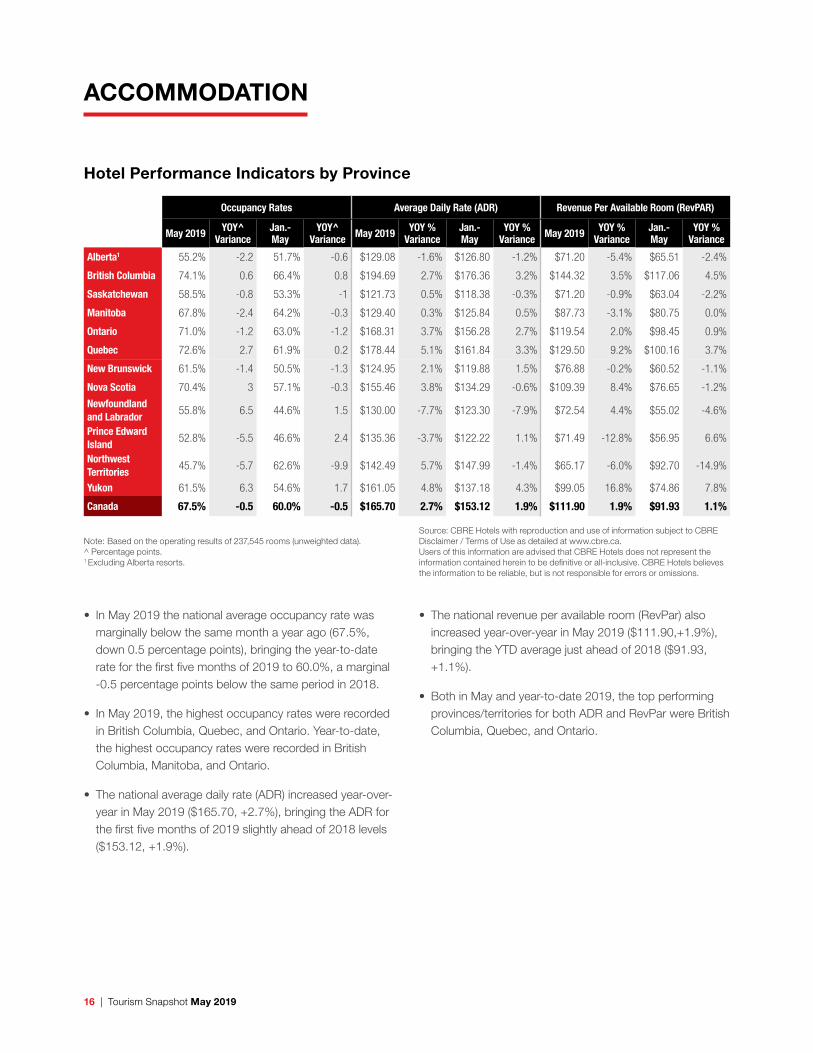
Hotel Performance Indicators by Province
Occupancy Rates Average Daily Rate (ADR) Revenue Per Available Room (RevPAR)
May 2019 YOY^ Variance
Jan.- May
YOY^ Variance May 2019 YOY %
VarianceJan.- May
YOY % Variance May 2019 YOY %
VarianceJan.- May
YOY % Variance
Alberta1 55.2% -2.2 51.7% -0.6 $129.08 -1.6% $126.80 -1.2% $71.20 -5.4% $65.51 -2.4%
British Columbia 74.1% 0.6 66.4% 0.8 $194.69 2.7% $176.36 3.2% $144.32 3.5% $117.06 4.5%
Saskatchewan 58.5% -0.8 53.3% -1 $121.73 0.5% $118.38 -0.3% $71.20 -0.9% $63.04 -2.2%
Manitoba 67.8% -2.4 64.2% -0.3 $129.40 0.3% $125.84 0.5% $87.73 -3.1% $80.75 0.0%
Ontario 71.0% -1.2 63.0% -1.2 $168.31 3.7% $156.28 2.7% $119.54 2.0% $98.45 0.9%
Quebec 72.6% 2.7 61.9% 0.2 $178.44 5.1% $161.84 3.3% $129.50 9.2% $100.16 3.7%
New Brunswick 61.5% -1.4 50.5% -1.3 $124.95 2.1% $119.88 1.5% $76.88 -0.2% $60.52 -1.1%
Nova Scotia 70.4% 3 57.1% -0.3 $155.46 3.8% $134.29 -0.6% $109.39 8.4% $76.65 -1.2%
Newfoundland and Labrador 55.8% 6.5 44.6% 1.5 $130.00 -7.7% $123.30 -7.9% $72.54 4.4% $55.02 -4.6%
Prince Edward Island 52.8% -5.5 46.6% 2.4 $135.36 -3.7% $122.22 1.1% $71.49 -12.8% $56.95 6.6%
Northwest Territories 45.7% -5.7 62.6% -9.9 $142.49 5.7% $147.99 -1.4% $65.17 -6.0% $92.70 -14.9%
Yukon 61.5% 6.3 54.6% 1.7 $161.05 4.8% $137.18 4.3% $99.05 16.8% $74.86 7.8%
Canada 67.5% -0.5 60.0% -0.5 $165.70 2.7% $153.12 1.9% $111.90 1.9% $91.93 1.1%
Note: Based on the operating results of 237,545 rooms (unweighted data).^ Percentage points. 1 Excluding Alberta resorts.
Source: CBRE Hotels with reproduction and use of information subject to CBRE Disclaimer / Terms of Use as detailed at www.cbre.ca.Users of this information are advised that CBRE Hotels does not represent the information contained herein to be definitive or all-inclusive. CBRE Hotels believes the information to be reliable, but is not responsible for errors or omissions.
ACCOMMODATION
• In May 2019 the national average occupancy rate was marginally below the same month a year ago (67.5%, down 0.5 percentage points), bringing the year-to-date rate for the first five months of 2019 to 60.0%, a marginal -0.5 percentage points below the same period in 2018.
• In May 2019, the highest occupancy rates were recorded in British Columbia, Quebec, and Ontario. Year-to-date, the highest occupancy rates were recorded in British Columbia, Manitoba, and Ontario.
• The national average daily rate (ADR) increased year-over-year in May 2019 ($165.70, +2.7%), bringing the ADR for the first five months of 2019 slightly ahead of 2018 levels ($153.12, +1.9%).
• The national revenue per available room (RevPar) also increased year-over-year in May 2019 ($111.90,+1.9%), bringing the YTD average just ahead of 2018 ($91.93, +1.1%).
• Both in May and year-to-date 2019, the top performing provinces/territories for both ADR and RevPar were British Columbia, Quebec, and Ontario.

Tourism Snapshot May 2019 | 17
ACCOMMODATION
Hotel Performance Indicators by Property Type
Occupancy Rates Average Daily Rate (ADR)
May 2019 YOY^ Change Jan.- May YOY^ Variance May 2019 YOY Variance Jan.- May YOY Variance
Property Size Under 50 rooms 55.2% 0.4 47.3% 1.5 $118.54 5.6% $113.28 4.5%
50-75 rooms 60.0% -0.9 53.2% -0.1 $121.08 2.0% $113.21 1.0%
76-125 rooms 65.1% -1.3 58.1% -0.9 $135.17 1.8% $128.35 1.5%
126-200 rooms 68.7% -0.2 60.8% -0.4 $152.69 1.8% $141.30 1.6%
201-500 rooms 71.8% 0.5 64.1% -0.3 $198.10 2.7% $182.87 2.2%
Over 500 rooms 74.9% -1.4 66.7% -1.6 $256.54 5.7% $225.38 3.9%
Total 67.5% -0.5 60.0% -0.5 $165.70 2.7% $153.12 1.9%
Property Type Limited Service 61.6% -0.7 55.3% -0.2 $123.72 2.8% $117.57 1.9%
Full Service 72.3% -0.2 62.7% -0.7 $186.43 3.1% $166.24 2.5%
Suite Hotel 73.3% -2.2 68.0% -1 $168.60 1.5% $157.27 0.3%
Resort 57.7% -0.4 57.6% 0.3 $227.23 2.1% $238.61 2.8%
Total 67.5% -0.5 60.0% -0.5 $165.70 2.7% $153.12 1.9%
Price Level Budget 59.3% -1.3 54.1% 0.4 $110.09 3.5% $103.92 3.1%
Mid-Price 68.7% -0.5 60.4% -0.8 $155.89 2.5% $143.09 1.7%
Upscale 73.4% 0.3 65.7% -0.3 $269.86 2.6% $246.54 1.7%
Total 67.5% -0.5 60.0% -0.5 $165.70 2.7% $153.12 1.9%
Note: Based on the operating results of 237,545 rooms (unweighted data).^ Percentage points.
• Consistent with historical trends, occupancy rates generally increased by property size, ranging from 55.2% for properties with under 50 rooms to 74.9% for properties with over 500 rooms in May 2019, and from 47.3% to 66.7% year-to-date. ADR also increased by property size, ranging from $118.54 to $256.54 in May 2019, and from $113.28 to $225.38 year-to-date.
• In May and year-to-date 2019, suite properties (73.3% in May, 68.0% YTD) reported the highest occupancy rates, followed by full service properties (72.3% in May, 62.7% YTD). Resorts reported the highest ADR ($227.23 in May, $238.61 YTD), followed by full service properties ($186.43 in May, $166.24 YTD).
• Both metrics also increased by price level, with upscale properties reporting the highest occupancy rates and ADR, but budget properties reporting strong growth in ADR year-over-year.
DESTINATION CANADA CONSUMER AND MARKET INTELLIGENCE