toward a multi-analyst, collaborative framework for visual ... · toward a multi-analyst,...
TRANSCRIPT

Toward a Multi-Analyst, Collaborative Framework for Visual Analytics
Susan E. Brennan*, Klaus Mueller+, Greg Zelinsky*, IV Ramakrishnan+, David S. Warren+, and Arie Kaufman+
Stony Brook University
ABSTRACT We describe a framework for the display of complex, multidimensional data, designed to facilitate exploration, analysis, and collaboration among multiple analysts. This framework aims to support human collaboration by making it easier to share representations, to translate from one point of view to another, to explain arguments, to update conclusions when underlying assumptions change, and to justify or account for decisions or actions. Multidimensional visualization techniques are used with interactive, context-sensitive, and tunable graphs. Visual representations are flexibly generated using a knowledge representation scheme based on annotated logic; this enables not only tracking and fusing different viewpoints, but also unpacking them. Fusing representations supports the creation of multidimensional meta-displays as well as the translation or mapping from one point of view to another. At the same time, analysts also need to be able to unpack one another’s complex chains of reasoning, especially if they have reached different conclusions, and to determine the implications, if any, when underlying assumptions or evidence turn out to be false. The framework enables us to support a variety of scenarios as well as to systematically generate and test experimental hypotheses about the impact of different kinds of visual representations upon interactive collaboration by teams of distributed analysts. Keywords: Visual Analytics, Collaborative and distributed visualization, Data management and knowledge representation, Visual knowledge discovery Index Terms: Categories: H. INFORMATION SYSTEMS H.5 INFORMATION INTERFACES AND PRESENTATION H.5.3 Group and Organization Interfaces Subject descriptor: Computer-supported cooperative work
1 INTRODUCTION Many real-world visualization problems involve sources of information and streams of data that (1) change more or less rapidly over time, (2) vary widely in their scope, relevance, reliability, and relationships to one another, and (3) are better understood when a user can explore or navigate them interactively (e.g., [15]). Such situations are often characterized by a high degree of uncertainty, so that the input to human decision-making processes is non-monotonic – the evidence may be contradictory and may not readily converge on a solution. Visualization technology encounters another layer of complexity when it is to be used collaboratively by multiple analysts with different expertise, knowledge, cultural or language backgrounds, biases, goals, and levels of authority. In order to
understand the situation and determine appropriate action, each collaborating analyst must be able to share complex, dynamic, and ambiguous information, reason about it, and communicate the consequences to others. Cognitive approaches to analyst technology acknowledge the importance of supporting these processes (e.g., [9, 12, 14, 22, 24]). However, many sophisticated forms of visualization technology actually conceal rather than highlight the source and reliability of what is represented. So it is usually left up to each analyst to mentally keep track of the history, context, and uncertainty surrounding not only their own reasoning, but also that of other analysts, as expressed during collaborative problem-solving. Our goal is to help take complex visualization to the next level. Not only is there is a need for visual analytic tools that support the kind of exploration, avoidance of bias, and flexible thinking about alternatives described by Wright and colleagues [24], but these tools need to explicitly support the needs of multiple analysts working together. Very often, human perception, reasoning, and decision-making are done in collaborating groups. The framework we are developing supports not only the fusion of representations and the creation of multidimensional meta-displays, but also the translation or mapping from one point of view to another. At the same time, it supports analysts’ needs to unpack their own and one another’s complex chains of reasoning, especially if they have reached different conclusions, and to determine the implications, if any, when underlying assumptions or evidence previously thought to be true turn out to be false. Finally, it supports the use of “what-if” reasoning, where an analyst can make temporary changes to data and see the inferences that result, in order to understand the consequences that may follow from different assumptions and to communicate about them with others.
2 A MULTI-ANALYST FRAMEWORK FOR COLLABORATIVE VISUAL ANALYTICS
Human collaboration frequently involves the sharing of visual artifacts, whether in systematic or ad hoc ways. Having visual evidence about what another person is referring to or about the state of a joint task makes communication more efficient across many kinds of domains [1, 3, 10, 11, 18]. Our theoretical approach to collaboration is based on the idea that in successful communication, not only must utterances or messages be formulated, expressed, and interpreted, but they also must be grounded, that is, the communicators continually seek and provide evidence that their messages have been received, understood, and appropriately integrated or acted upon [6, 7]. As such, we propose a visualization framework that explicitly represents individual viewpoints as distinct from shared viewpoints, with the goal of providing explicit logical and graphical support for sharing information, reasoning about it, and negotiating its meaning. The architecture underlying this framework is shown in Figure 1. In this framework, the knowledge base extracts and reasons about information collected from a variety of sources. Once information is in the knowledge base, it carries source information as well as confidence ratings (either explicitly attached by analysts or computed automatically) that can be updated as a
∗ [email protected], [email protected]. Psychology Department, Stony Brook University, Stony Brook, NY 11794-3300, + {mueller, ram, warren, ari}@cs.sunysb.edu. Computer Science Department, Stony Brook University, Stony Brook, NY 11794-4400.

Figure 1: An Architecture for Multi-Analyst, Collaborative Visualization.
situation unfolds; these confidence annotations are displayed and used in reasoning. Each agent has his or her own private perspective; these are displayed as flexible, logically annotated representations that the agent can manipulate, explore, or add to the shared knowledge base. The channel between a private perspective and the knowledge base may contain security filters tailored to an analyst’s security clearance. Whether analysts are permitted to write to the knowledge base depends on their authority and expertise. At the same time, there are also different aspects to a piece of evidence or an established or postulated relationship. Some of these aspects may not be relevant under a certain viewpoint or working hypothesis, but may become relevant in an instant, should the hypothesis change as the analysis effort is underway. An analyst’s perspective must be able to adapt quickly to these
types of changes, which often occur in what-if scenarios or when new information surfaces or is discovered Private perspectives can be shared via a flexible, joint perspective known as common ground (dotted lines), into which an analyst may push a private perspective in order to show it to another analyst. Alternatively, analysts may decide to use their common ground to dynamically morph one person’s private perspective into the other’s, in order to highlight commonalities, mappings, or the differences between them, or else to fuse one or more perspectives to show an aggregate representation. Each element in the knowledge base or within a perspective keeps track of its source as well as relevant temporal and spatial information, so that this information can be unpacked or updated as needed.
Look at this!
B
A’s Private Perspective
Inference Engine
Knowledge Base
Common Ground
C’s Private Perspective
B’s Private Perspective
Source 1
Source 5 Source
2
Source 3
Source 4
WHY?
A
But wait . . .
C

3 SCENARIO-BASED APPROACH To develop this general-purpose architecture for a collaborative visualization system, we adopted a scenario-based approach that enables us to identify important dimensions that visualization technology should support. This approach has been used successfully to drive user-interface design (e.g., [4, 5, 8, 16]). The rationale is that if a collaborative visual analytic system can handle a range of scenarios in a principled way, it should be an improvement over a system that has been optimized for a single type of scenario. Because each scenario involves multiple analysts reasoning with uncertain knowledge, and because there may or may not be a single “correct” solution, we take as our goals to minimize uncertainty and to support analysts’ attempts to reach consensus, while still considering all relevant viewpoints, including (and perhaps even highlighting) conflicting ones. The scenario-based approach also enables us to exploit synergies that may emerge from considering important classes of problems at different scales and across different domains. Such problems include representing uncertainty, recreating or updating of a chain of reasoning, flexibly mapping between two related representations, and fusing multiple points of view. Consider these three scenarios that vary in their spatial and logical characteristics, types of knowledge inputs, sources of information, grain of analysis, and time criticality. Scenario 1 – Negotiating meaning and identity. Multiple analysts in several countries (spanning several time zones) are mulling over the meaning of various streams of information and discussing whether one analyst’s suspicions about a threat are justified, and if so, what course of action should be followed. The precise nature of the threat is not clear, and there is additional uncertainty, such as disagreement about which of the known pieces of evidence are reliable (the reliability problem—e.g., a caller to a radio program warns of an imminent attack—is this reliable, or could it turn out to be an intentional distraction?). It is also unclear whether the evidence all concerns the same individual or group of individuals (the identity problem). Here the analysts try to reach consensus and agree on a plan of action; there is no one simple “correct solution,” but there are better and worse ones. Scenario 2 – Monitoring a known individual. In this scenario, there is likely to be an actual “correct answer”. Multiple analysts focus on detecting and tracking the location, contacts, and recent activities of a target person of interest. Some of the information to be considered has widely varying confidence ratings, including records of alleged sightings, meetings, or transactions over the past several weeks; from these a set of links between the person of interest and other agents can be drawn, along with inferences about their whereabouts and affiliations. For example, intercepted emails suggest that someone who might be the target person will be in a particular village on a particular date; others warn individuals to stay away from this location. A law enforcement official reports a disturbance in which strangers—perhaps bodyguards or associates of the target?—shot a local official who had witnessed a petty crime. There are records of cell phone calls made to individuals who are known associates of the target person, as well as a trail of financial transactions such as records of car rentals. A less dynamic (but still relevant) kind of information includes what is known about the target person’s habits, needs, and cultural practices. Scenario 3 – Resolving and tracking an immediate physical threat. A gunman is shooting from the window of a building. Analysts (law enforcement officers) are physically co-located in the same city block and are moving independently through the scene. They each view the scene from a different vantage point, are in voice contact, and can transmit their displays (physical viewpoints) to one another. This scenario is like the
previous two in that it requires integrating, transforming, and highlighting information from multiple sources; however the sources of information are perceptual as well as logical, and time is more critical. The important ambiguity lies in the precise location of the target rather than in its identity or meaning, which is assumed to be known (with high probability). These three scenarios, while different, all involve autonomous or semi-autonomous agents with distinct points of view and potentially, shared or overlapping goals. The points of view, whether based on perceptual data or logical data or both, are subject to change. In order to minimize uncertainty and to communicate about it, the agents all need to translate among their points of view, fuse their points of view in order to better reason about them, and dynamically reallocate their resources to optimize the quality of their decisions and reach a correct or good solution (consensus). The scenarios differ in their temporal grain, in how they lend themselves to using space either literally or conceptually for visualizing relevant data and potential solutions, in the kinds of sources the evidence is drawn from (perceptual or logical), and the confidence in these sources. The analysts themselves who are reasoning about a scenario may also differ in experience or authority (although we will not address that here).
4 MULTI-ANALYST COLLABORATION A principal contribution of our framework is that individual analysts will be able to visualize their data in the manner that they find most useful, by means of representations that we refer to here as private perspectives. We believe that flexible private perspectives are an essential part of any practical visualization scheme. People have strong preferences with regard to data visualization, perhaps even choosing to abandon a visualization scheme if it forces them to see their data in a way they find unnatural [14]. To acknowledge the practical necessity of user preferences, our framework enables analysts to customize their data visualization along multiple dimensions. To create a private perspective, an analyst will experiment with an assortment of visualization tools and conduct exploratory analyses in order to find the representation that she or he personally finds most useful. But the concept of a private perspective, critical from the standpoint of independent data analysis, can create an impediment to efficient collaboration. Efficient collaboration requires establishing common ground, including a shared language enabling people to jointly refer to things [6, 2]. The necessity for common ground on the one hand and private perspectives on the other, therefore poses a basic problem for collaboration. Assume, as in Scenario 2, that nodes represent persons of interest, and the links between them represent contacts (meetings, telephone calls, emails). Analyst A may be representing the uncertainty attached to various pieces of information by dotted, solid, or wide lines connecting various nodes, whereas Analyst B may be representing the same uncertainty using different colors. Analyst A may have dragged various nodes along with their connections to one side to keep track of which ones she has already analyzed or thinks are irrelevant (in other words, using spatial layout for bookkeeping purposes), whereas Analyst B’s representation may be using layout and the distance between linked nodes (for a set that overlaps with Analyst A’s) to represent how frequently each pair of persons of interest has communicated. In order for them to discuss the situation, they need to reconcile these differences in perspective. In order to communicate, either one analyst has to learn and adopt the other’s perspective (something that he or she may be reluctant or unable to do), or else during their discussion, one analyst has to continually mentally transform the other’s perspective into his or her own. Given human cognitive limitations (and assuming that such transformation is even possible), as the difficulty of a transformation increases, so will
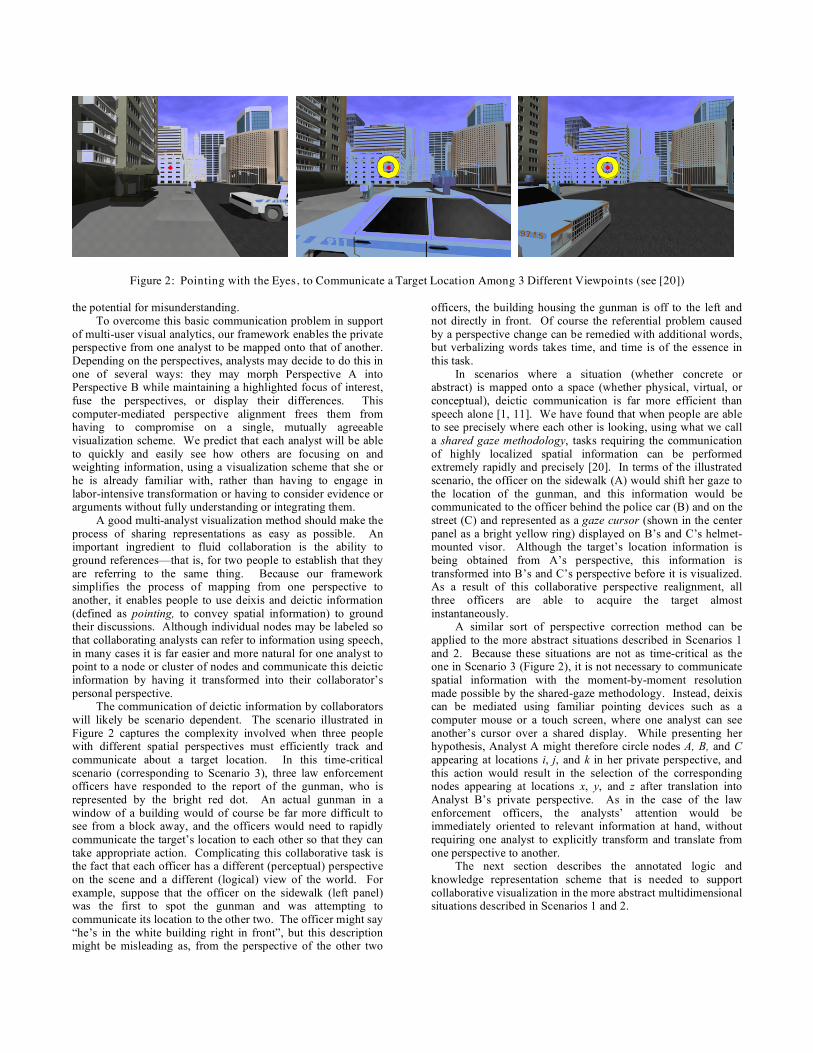
Figure 2: Pointing with the Eyes, to Communicate a Target Location Among 3 Different Viewpoints (see [20])
the potential for misunderstanding. To overcome this basic communication problem in support of multi-user visual analytics, our framework enables the private perspective from one analyst to be mapped onto that of another. Depending on the perspectives, analysts may decide to do this in one of several ways: they may morph Perspective A into Perspective B while maintaining a highlighted focus of interest, fuse the perspectives, or display their differences. This computer-mediated perspective alignment frees them from having to compromise on a single, mutually agreeable visualization scheme. We predict that each analyst will be able to quickly and easily see how others are focusing on and weighting information, using a visualization scheme that she or he is already familiar with, rather than having to engage in labor-intensive transformation or having to consider evidence or arguments without fully understanding or integrating them. A good multi-analyst visualization method should make the process of sharing representations as easy as possible. An important ingredient to fluid collaboration is the ability to ground references—that is, for two people to establish that they are referring to the same thing. Because our framework simplifies the process of mapping from one perspective to another, it enables people to use deixis and deictic information (defined as pointing, to convey spatial information) to ground their discussions. Although individual nodes may be labeled so that collaborating analysts can refer to information using speech, in many cases it is far easier and more natural for one analyst to point to a node or cluster of nodes and communicate this deictic information by having it transformed into their collaborator’s personal perspective. The communication of deictic information by collaborators will likely be scenario dependent. The scenario illustrated in Figure 2 captures the complexity involved when three people with different spatial perspectives must efficiently track and communicate about a target location. In this time-critical scenario (corresponding to Scenario 3), three law enforcement officers have responded to the report of the gunman, who is represented by the bright red dot. An actual gunman in a window of a building would of course be far more difficult to see from a block away, and the officers would need to rapidly communicate the target’s location to each other so that they can take appropriate action. Complicating this collaborative task is the fact that each officer has a different (perceptual) perspective on the scene and a different (logical) view of the world. For example, suppose that the officer on the sidewalk (left panel) was the first to spot the gunman and was attempting to communicate its location to the other two. The officer might say “he’s in the white building right in front”, but this description might be misleading as, from the perspective of the other two
officers, the building housing the gunman is off to the left and not directly in front. Of course the referential problem caused by a perspective change can be remedied with additional words, but verbalizing words takes time, and time is of the essence in this task. In scenarios where a situation (whether concrete or abstract) is mapped onto a space (whether physical, virtual, or conceptual), deictic communication is far more efficient than speech alone [1, 11]. We have found that when people are able to see precisely where each other is looking, using what we call a shared gaze methodology, tasks requiring the communication of highly localized spatial information can be performed extremely rapidly and precisely [20]. In terms of the illustrated scenario, the officer on the sidewalk (A) would shift her gaze to the location of the gunman, and this information would be communicated to the officer behind the police car (B) and on the street (C) and represented as a gaze cursor (shown in the center panel as a bright yellow ring) displayed on B’s and C’s helmet-mounted visor. Although the target’s location information is being obtained from A’s perspective, this information is transformed into B’s and C’s perspective before it is visualized. As a result of this collaborative perspective realignment, all three officers are able to acquire the target almost instantaneously. A similar sort of perspective correction method can be applied to the more abstract situations described in Scenarios 1 and 2. Because these situations are not as time-critical as the one in Scenario 3 (Figure 2), it is not necessary to communicate spatial information with the moment-by-moment resolution made possible by the shared-gaze methodology. Instead, deixis can be mediated using familiar pointing devices such as a computer mouse or a touch screen, where one analyst can see another’s cursor over a shared display. While presenting her hypothesis, Analyst A might therefore circle nodes A, B, and C appearing at locations i, j, and k in her private perspective, and this action would result in the selection of the corresponding nodes appearing at locations x, y, and z after translation into Analyst B’s private perspective. As in the case of the law enforcement officers, the analysts’ attention would be immediately oriented to relevant information at hand, without requiring one analyst to explicitly transform and translate from one perspective to another. The next section describes the annotated logic and knowledge representation scheme that is needed to support collaborative visualization in the more abstract multidimensional situations described in Scenarios 1 and 2.

5 KNOWLEDGE REPRESENTATION FOR ANALYSIS, DISPLAY, REASONING, AND COLLABORATION
Consider the architecture of the reasoning subsystem of our collaborative visualization system, as shown previously in Figure 1. It consists of: 1. A common knowledge base capturing the factual aspects of
the application domain (note that “facts” are not presumed to be true, but are associated with confidence estimates).
2. A knowledge base local to an analyst containing cached facts from the common knowledge-base and additional or modified facts generated during analysis.
3. Inference engines for deriving conclusions based on the factual information present in the local knowledge base.
Information in the common knowledge base is extracted from incoming data sources and formatted using rules specific to each source. This information is represented as a set of facts, and the analysis algorithms are encoded as rules. The inference engine runs these rules over the facts in the knowledge base to draw conclusions, represented in the form of new relationships. Analysts view and explore the facts and derived conclusions to develop new hypotheses, generate new questions, make decisions, and raise alerts. We use Prolog – a rule-based programming language rooted in logic – to specify the rules and facts. Rules are used to define new relationships among entities. An analyst can query such a defined relationship, and these rules are then evaluated on demand to find solutions using a theorem-proving approach. Prolog extends standard relational database technology by supporting a richer set of queries, making more powerful and flexible inferences. In particular we use annotated logic [17] an extension of traditional Prolog’s representation and inference mechanism, SLD resolution [19], to support reasoning with uncertainty. As we describe below, adaptation of the reasoning system to visual analytics is influenced by the particular characteristics of this problem domain and the supported scenarios. Specifically we need to capture information about where and when events take place, the confidence associated with such assertions and whether an assertion is made by an analyst or derived by the inference engine. Hence we associate different kinds of attributes with facts in the knowledge base including spatial (“where did it happen”), temporal (“when did it happen”), confidence measures (“how confident are we that this fact is correct”), are they “extensional” facts i.e. asserted by the analyst or extracted from the source or “intensional” facts derived by the inference engine. Suppose analysis of data from a source (either manual or automated) indicates that a certain person of interest was most likely sighted at a certain place during a certain time period. We capture this by the annotated Prolog fact:
sighting(person,where,when,asserted):c.
c is the confidence measure associated with the sighting. This is a quantity that ranges from 0 to 1. asserted indicates that this information came from a particular data source. In addition to these spatial and temporal attributes there could be other kinds of attributes associated with facts. We can also store and reason with “constrained” facts. For example, if the person in the above fact was seen during a certain time period then this information is captured by the constrained fact: sighting(person,where,When,asserted):c :-
t1<=When<=t2.
This constrained fact asserts that the person was sighted for some time range. For a given scenario, we provide rules to define relationships of interest to analysts. Analysts will then be able to explore those relationships (implicitly generating queries) to find interesting configurations of events. For example, suppose for Scenario 2, an analyst wishes to flag a meeting between two individuals. First we define a rule for meetings in Prolog as:
meeting(X,Y) :- sighting(X,City,Time1), sighting(Y,City,Time2), within_2_days(Time1,Time2).
This rule asserts that there is a possible meeting of person X with person Y if there were sightings of X and Y in the same city within 2 days. Other rules could easily be added to define other configurations of facts (and defined relationships) as implying the existence of possible meetings. The underlying common knowledge base might well change as new surveillance information is integrated, and an analyst may want to be alerted if a meeting including a particular individual of interest occurs. A rule can be used to define such an alert:
alert(X,Y):- meeting(person123,Y). Observe that a Prolog rule is of the form: P(..) :- P1(..),P2(..),..,Pn(..). P1,P2,Pn on the right hand side of :- are the antecedent (or body) literals while the P on the left hand side is the consequent (or head), and in this case defines the predicate P. Predicates take arguments (e.g. X,Y) and are either true or false. Operationally, the truth of a predicate in the rule-head is determined by the truths of the body literals. So for alert to become true in the above rule all the three body literals must evaluate to true. Otherwise alert fails. Rules define predicates. In general a definition can have multiple cases, so a definition can be made up of several rules, each rule corresponding to a case. A query is a request to obtain the contents of a defined predicate. The results of the query are computed on demand by evaluating each rule that makes up the definition, through the process of backtracking. The truth/falsity of the evaluated query along with its explanation may be stored in the knowledge base. This information would be supplied to the visualization component when the analyst requests the conclusion be unpacked. We have developed several techniques for generating explanations for the conclusions inferred by logic program evaluation engines [21]. It is straightforward to evaluate annotated logic programs [17] in which rule literals are annotated with confidence measures. In particular. suppose P(..):c :- P1(..):c1, P2(..):c2,..,Pn(..):cn is such an annotated rule. The confidence c associated with a head of a rule is a function computed over c1,c2,..,cn,(often min). Furthermore if the definition of a predicate P is made up of several rules then the confidence assigned to a query ?-P is a function (often max) computed over the confidences of rules that evaluate to true. Query evaluations are done by our XSB tabled logic programming system which has a relatively more complete rule evaluation strategy than traditional Prolog evaluators (see http://xsb.sourceforge.net). Predicates annotated with confidence measures are readily handled via an additional argument to the

predicates. Constrained predicates are evaluated using our recently developed CHR (constraint handling rules) techniques [23]. The visualization component takes the facts (evaluated and asserted) and generates a graphical representation along spatial, temporal and confidence dimensions. Suppose for instance we want a graphical visualization depicting the spatial and temporal aspects of meetings between individuals of interest to analysts. We create appropriate predicates that when called by the visualization component will supply it with the parameters to drive the visualization. For example we can define the node properties of such a graph by the facts:
node_prop(n1,name,'John Doe'). node_prop(n2,name,'Jane Doe'). node_prop(n3,name,'Joe Smith').
To associate confidence measures, we annotate the predicates meeting and sighting with confidence measures. Note that the confidence associated with the meeting predicate will be computed as a function of the confidences associated with the sighting predicates. With these annotations we define a link between two nodes in the graph by the rule:
link(X,Y):C :- meeting(X,Y):C This rule says that we want a link from n1 to n2 labeled with the confidence value C if there was a meeting of n1 with n2 with confidence C. This is just one possible choice of nodes and links for visualization purposes. There are many other possibilities. For instance we might have nodes represent cities and links represent travel of a person between them (constrained by time). Then by seeing a sequence of links with a gap, we could infer that the person traveled between those unlinked cities in a particular time frame.
6 VISUALIZATION Our framework for multi-analyst, collaborative visual analytics is intended to be flexible and support a variety of visualization techniques and representational styles. The requirements are that the displays be interactive in real time, that there should be ways to display uncertainty, that multiple perspectives can be integrated, and that analysts should be able to unpack the evidence supporting a chain of reasoning, for accountability or in order to explain their conclusions to one another. The approach we are initially exploring provides a flexible interface that allows each analyst to develop a private perspective and to interact with the reasoning infrastructure. At the same time this interface must form the synchronizing medium for establishing as well as maintaining common ground among two or more analysts in support of their collaborative reasoning and decision-making efforts. We have implemented a prototype that is geared to addressing these needs. It captures the reasoning chain in form of a graph or a tree, which can be visualized using established graph-drawing techniques (for instance, see [13] for an overview and further references). Consider a scenario in which Analysts A and B analyze the activities of a particular target of interest. Their activities include cycles of foraging and sense-making (in the sense described by Pirolli and Card [22]). Each has created a private perspective that helps them (individually) look for hypothesized patterns. Figure 3 shows four screen shots from our interface. The left-hand and right-hand screens represent the private perspectives of Analysts A and B, respectively. Nodes and links are illustrated with suitable icons for more intuitive visual story telling. The
nodes map to people, locations and events, while the links represent activities such as meetings (the handshake icon), phone calls and emails (phone and e-letter), sightings (eye), criminal acts (gun, bomb, theft), preferences (heart), and so on. The flexible aspect to this graph interface is that links and nodes may be overloaded – there may be cultural, temporal, religious, importance, certainty, confidence, and many other attributes, predicates, and conditions associated with a link (as well as with a node). To furnish analysts with a way to explore and illuminate the graph nodes and links under these different viewpoints, with a means to control their visual appearance as a function of the possible numerical or qualitative values attached to them, we have implemented a curve editing interface for each mapping (the dark panels to the left in each screen shot). Analysts A and B can each associate different visual attributes (such as width, size, density of dashes, hue, saturation, brightness, or opacity) to the properties or predicates of the links. In this version of the mapping interface, the x-axis is formed by the attribute’s assigned value, and the y-axis selects the amount of visual strength assigned to each possible value. In this example, “confidence” has been assigned to the “opacity” visual attribute. Using the mapping editor, only links and nodes with predicates of high confidence appear with high opacity, while those with low confidence are rendered with zero opacity, i.e., full transparency, to make them invisible. In this scenario, the two upper screens of Figure 3 display initial results from Analysts A’s and B’s independent foraging (from sifting through various databases and sources). (To simplify this illustration, we assume that elements common to both private perspectives are laid out in the same spatial configuration, although in reality each analyst will probably have used space to organize the elements differently.) Each individual analyst can privately explore the impact of confidence assumptions by using a continuous slider control that dynamically varies the opacity mapped to this parameter in her private perspective. At time 1 (the two top screens), both analysts have used ramp functions for value mappings. Here, they both mapped line width to link “importance”. Dashed lines, in general, denote hypothesized links. At time 2 (bottom screens), both analysts have independently set the “confidence” mapping curve to a step function. This means only links, including hypothesized links, with high confidence will appear in the display. Observe that this leads to the elimination of many of the links Observe also that, apart from the different weighting of common regular and hypothesized links, some nodes and links exist only in one or the other analyst’s view. The latter are due to one analyst’s facts or beliefs that the other does not know about (yet). After developing and considering their private perspectives, Analysts A and B now need to jointly make sense of the data. To this end, Analyst A could undertake the rather complex task of describing her findings to B (and vice versa). Better still, she could push her private perspective into the common ground display area she shares with B (and vice versa); however, there is still be the challenge of determining which elements overlap and which are distinct, so that A and B can discuss and evaluate these elements together. To facilitate this, our system also provides an even better alternative for the common ground display: a representation in which both graphs are merged. This is shown in Figure 4. Common nodes and links are combined in one of several ways, chosen by the analysts: as an average of the link and node values, a weighted average of these, the difference between them, or their intersection, on a shared portion of the display. Using these displays, the analysts can view a fused version of their private perspectives, as well as map explicitly from one’s
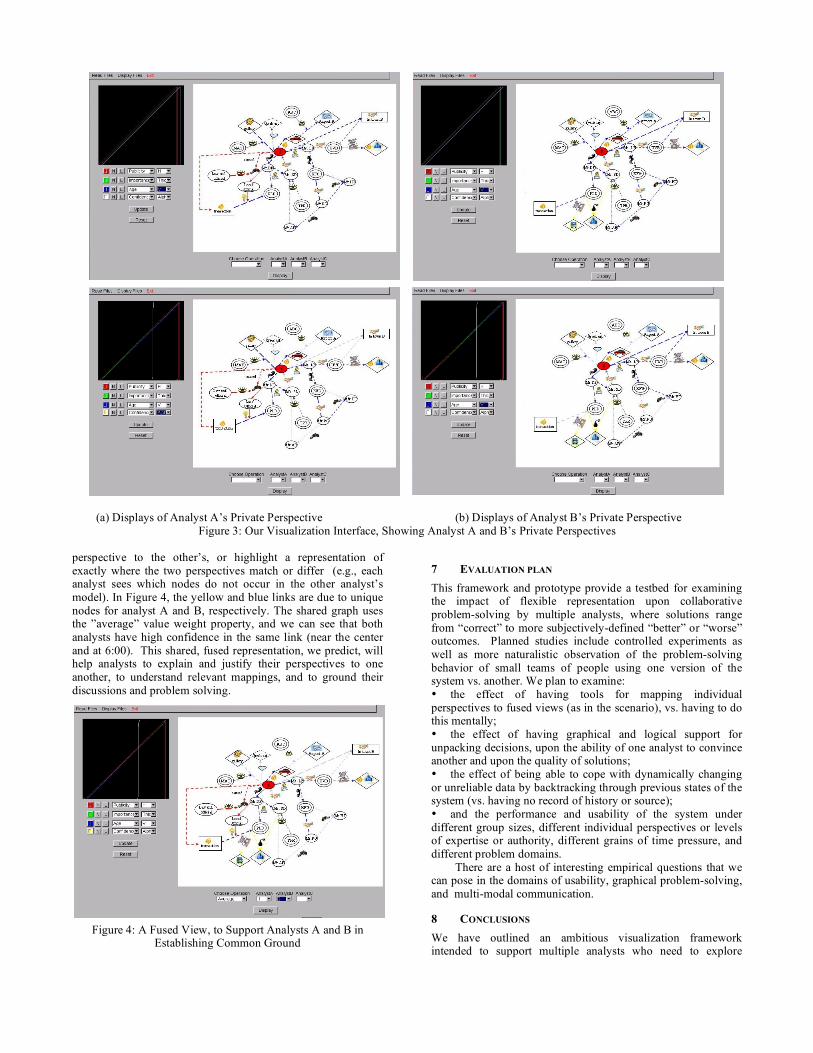
(a) Displays of Analyst A’s Private Perspective (b) Displays of Analyst B’s Private Perspective
Figure 3: Our Visualization Interface, Showing Analyst A and B’s Private Perspectives perspective to the other’s, or highlight a representation of exactly where the two perspectives match or differ (e.g., each analyst sees which nodes do not occur in the other analyst’s model). In Figure 4, the yellow and blue links are due to unique nodes for analyst A and B, respectively. The shared graph uses the ”average” value weight property, and we can see that both analysts have high confidence in the same link (near the center and at 6:00). This shared, fused representation, we predict, will help analysts to explain and justify their perspectives to one another, to understand relevant mappings, and to ground their discussions and problem solving.
Figure 4: A Fused View, to Support Analysts A and B in Establishing Common Ground
7 EVALUATION PLAN This framework and prototype provide a testbed for examining the impact of flexible representation upon collaborative problem-solving by multiple analysts, where solutions range from “correct” to more subjectively-defined “better” or “worse” outcomes. Planned studies include controlled experiments as well as more naturalistic observation of the problem-solving behavior of small teams of people using one version of the system vs. another. We plan to examine: • the effect of having tools for mapping individual perspectives to fused views (as in the scenario), vs. having to do this mentally; • the effect of having graphical and logical support for unpacking decisions, upon the ability of one analyst to convince another and upon the quality of solutions; • the effect of being able to cope with dynamically changing or unreliable data by backtracking through previous states of the system (vs. having no record of history or source); • and the performance and usability of the system under different group sizes, different individual perspectives or levels of expertise or authority, different grains of time pressure, and different problem domains. There are a host of interesting empirical questions that we can pose in the domains of usability, graphical problem-solving, and multi-modal communication.
8 CONCLUSIONS We have outlined an ambitious visualization framework intended to support multiple analysts who need to explore

multidimensional data, analyze and reason about it, and collaborate with one another to solve problems in dynamically unfolding scenarios. In this framework, analysts can maintain private perspectives customized in whatever ways they find most intuitive for reasoning (under uncertainty). The framework supports sharing, translating between, and fusing representations while keeping track of source information, so that perspectives can be easily unpacked or updated when underlying assumptions change. Our existing prototype presumes that analysts will share and refer to perspective representations while concurrently using voice channels (which currently exist outside of the visualization architecture), in order to communicate with one another about analyses, decisions, and actions. In order to further develop and expand the current prototype, we are addressing many unsolved or underspecified issues. These include how to enable analysts with diverse backgrounds and technical expertise to most easily specify the desired rules (to the inference engine) and parameters (to the visualization interface), so that they can customize their private perspectives. For instance, while the parameters for mapping visual attributes to links in the graph interfaces shown in Figures 3 and 4 are easy to set, it is not so clear that they are broadly intuitive. In addition, there is the issue of how to intuitively represent fusion, morphing, or differences between more than two displays. To address this issue, we are currently exploring additional kinds of representations such as segmented circles, where each slice represents the parameter space (perspective) of a single analyst and a single perspective can be selected to re-sort the others in order to display similarity among private perspectives. In closing, by designing an architecture and tools to handle multiple scenarios involving both conceptual and perceptual data, we hope to push the system to be as general and flexible as possible. We predict that the visual analytic framework described here will improve visualization, communication, and problem-solving by teams of distributed analysts.
9 ACKNOWLEDGMENTS This material is based upon work supported by NSF Grant Nos. ISS-0527585, CCR-0306438, ACI-0093157, HSD-0527585, CCR-0205376, CCR-031152, and IIS-0534419, and from the Center of Excellence in Wireless and Information Technology (CEWIT). We are grateful to Supriya Garg for her input and assistance implementing the software for Figures 3 and 4.
REFERERENCES [1] Brennan, S. E., “How conversation is shaped by visual and spoken
evidence”, In Approaches to studying world-situated language use: Bridging the language-as-product and language-as-action traditions, J. C. Trueswell and M. K. Tanenhaus (Eds.), MIT Press, Cambridge, MA, pages 95–129, 2005.
[2] Brennan, S. E., and Clark, H. H ., “Conceptual pacts and lexical choice in conversation”, Journal of Experimental Psychology: Learning, Memory and Cognition, 6:1482-1493, 1996.
[3] Brennan, S. E., and Lockridge, C. B., “Computer-mediated communication: A cognitive science approach”, ELL2, Encyclopedia of Language and Linguistics, 2nd Edition, K. Brown (Ed.), Elsevier Ltd., Oxford, UK, pages 775–780, 2006.
[4] Carroll, J. M., Scenario-Based Design: Envisioning Work and Technology in System Development, John Wiley & Sons, Inc., New York, 1995.
[5] Carroll, J. M. and Rosson, M. B., “Getting around the task-artifact cycle: How to make claims and design by scenario”, ACM Transactions on Information Systems, 10:181–212, 1992.
[6] Clark, H.H., Using language, Cambridge University Press, Cambridge, MA, 1996.
[7] Clark, H. H. and Brennan, S. E., “Grounding in communication”, In Perspectives on socially shared cognition, L. B. Resnick, J. Levine, and S. D. Teasley (Eds.), APA, Washington, DC, pages 127–149, 1991. Reprinted in Groupware and computer-supported cooperative work: Assisting human-human collaboration, R. M. Baecker (Ed.), Morgan Kaufman Publishers, Inc., San Mateo, CA, pages 222–233, 1992.
[8] Clarke, L., “The use of scenarios by user interface designers”, In HCI ’91 Conference on People and Computers VI, D. Diaper and N. Hammnd (Eds.). Cambridge University Press, Cambridge, pages 103–115, 1991.
[9] Coffman, T., Greenblatt, S., and Marcus, S. “Graph-based technologies for intelligence analysis”, In Communications of the ACM, 47(3):45–47, March 2004.
[10] Fussell, S. R., Setlock, L. D., and Kraut, R. E., “Effects of head-mounted and scene-oriented video systems on remote collaboration on physical tasks”, In Proc., Human Factors in Computing Systems (CHI '03), ACM Press, pages 513–520, 2003.
[11] Gergle, D., Kraut, R. E., and Fussell, S. R., “Language efficiency and visual technology: Minimizing collaborative effort with visual information”, Journal of Language & Social Psychology, 23(4):491–517, 2004.
[12] Gersh, J., Lewis, B., Montemayor, J., Piatko, C., and Turner, R. “Supporting insight-based information exploration in intelligence analysis, Communications of the ACM, 49(4):63–68, April 2006.
[13] Herman, I., Melancon, G., and Marshall, M. S., “Graph visualization and navigation in information visualization: A survey”, In IEEE Transactions on Visualization and Computer Graphics, 6(1):24–43, 2000.
[14] Heuer, R. J. Psychology of Intelligence Analysis, Center for the Study of Intelligence, U.S. Central Intelligence Agency, www.cia.gov/books/19104/, 1999.
[15] Hong, L., Muraki, S., Kaufman, A., Bartz, D., and He, T., “Virtual Voyage: Interactive Navigation in the Human Colon”, In Computer Graphics, Proc. SIGGRAPH, pages 27–34, 1997.
[16] Karat, J. and Bennett, J. B., “Using scenarios in design meetings: A case study example”, In Taking Design Seriously: Practical Techniques for Human Computer Interaction Design, J. Karat (Ed.), Academic Press, pages 63–94.
[17] Kifer, M. and Subrahmanian, V. S., “Theory of generalized annotated logic programming and its applications”, Journal of Logic Programming, 12(4), pp. 335–368, 1992.
[18] Kraut, R. E., Fussell, S. R., and Siegel, J., “Visual information as a conversational resource in collaborative physical tasks”, Human Computer Interaction, 18:13–49, 2003.
[19] Lloyd, J. W., Foundations of Logic Programming (2nd Edition), Springer Verlag, 1987.
[20] Neider, M., Chen, X., Dickinson, C., Brennan, S. E., and Zelinsky, G., “Sharing eyegaze is better than speaking in a time-critical consensus task”, In Abstracts of the 46th Annual Meeting of the Psychonomic Society, 10, page 72, 2005.
[21] Pemmasani, G., Guo, H., Dong, Y., C. R. Ramakrishnan, C. R., and Ramakrishnan, I. V., “Online justification for tabled logic programs”, In Proc., 7th International Symposium on Functional and Logic Programming (FLOPS'04), pages 24–38, April, 2004.
[22] Pirolli, P. and Card, S., “The sensemaking process and leverage points for analyst technology as identified through cognitive task analysis”, In Proc., International Conference on Intelligence Analysis, 2005.
[23] Schrijvers, T. and Warren, D. S., “Constraint Handling Rules and Tabled Execution”, In Proc., 20th International Conference on Logic Programming (ICLP), pages 120–136, 2004.
[24] Wright, W., Schroh, D., Proulx, P., Skaburskis, A., and Cort, B. “The sandbox for analysis – concepts and methods”, In Proc., Human Factors in Computing Systems (CHI '06), ACM Press, Montreal, Quebec, Canada, pages 801–810, 2006.