toward an international stormwatch using wide … hopkins apl technical digest, volume 21, number 1...
TRANSCRIPT

R. C. BEAL
Toward an International StormWatchUsing Wide Swath SAR
Robert C. Beal
12
Wide swath synthetic aperture radar (SAR), exemplified by the multibeamScanSAR modes of Radarsat, can potentially deliver global near–real-time coastal windfields with nearly 2 orders of magnitude greater spatial resolution (�300 m) thanconventional (active or passive) scatterometers (�25 km). But this superior resolutioncomes with caveats. An understanding of the small-scale ocean scattering physics,necessary to fully describe the complex relationship between wind and radarbackscatter, remains incomplete. End-to-end calibration of multibeam SARs is difficultand still largely undemonstrated. And methods for nesting the intrinsically high-resolution SAR wind estimates within those of the coarser numerical models,scatterometers, radiometers, and surface buoys are still in their infancy. Despite thesecaveats, ScanSAR offers a unique new tool for probing the wind field over the ocean.To illustrate, one especially compelling example from a Radarsat ScanSAR pass overthe U.S. East Coast is described. (Keywords: Radarsat, SAR wind fields, ScanSAR,synthetic aperture radar.)
INTRODUCTIONThe synthesis of long apertures to obtain very high
resolution from aircraft using radar technology was firstdemonstrated by Carl Wiley at Goodyear Aerospace in1951.1 Early synthetic aperture radars (SARs) lackedthe advantage of today’s rapid computer processing andlarge digital memories for signal correlation. TheseSARs initially relied on electronic delay lines and lateron coherent optical processing.2 Although early pro-cessing was slow and cumbersome, the fundamentalprinciples of radar aperture synthesis were well estab-lished by the early 1960s. High-resolution aircraft SAR
JOH
systems provided all-weather, 24-h military reconnais-sance. Raney3 provides a comprehensive review of boththe history and technology of SAR.
In the early 1970s, the U.S. National Aeronauticsand Space Administration (NASA) Jet PropulsionLaboratory proposed a spacecraft SAR to map theperpetually cloud-covered surface of Venus. The VenusOrbiter Imaging Radar (VOIR), as it was initiallynamed, languished unrealized until it became the (moresophisticated) Magellan Venus Mapping Mission of the1990s. Meanwhile, the original VOIR design evolved
NS HOPKINS APL TECHNICAL DIGEST, VOLUME 21, NUMBER 1 (2000)

AN INTERNATIONAL STORMWATCH USING WIDE SWATH SAR
into the 1978 Earth-oriented L-band Seasat SAR,4
which sent back hundreds of provocative ocean imagesduring its abbreviated 98-day lifetime. Nothing compa-rable was launched —except for the short-term ShuttleImaging Radar (SIR) series, most notably the NASA/German/Italian SIR-C/X SAR5—until the EuropeanSpace Agency’s well-calibrated C-band European Re-mote Sensing satellite (ERS-1) SAR in 1991.6 Since1991, the scientific community has always had accessto at least one SAR, with data routinely available toapproved investigators. The ERS-1 SAR was followedby the L-band Japanese Earth Resources Satellite(JERS-1) SAR in 1992, another C-band ERS-2 SARin April 1995, and finally the Canadian C-band Radar-sat7 in November 1995.
Until Radarsat, the maximum swath width of anypreviously orbiting SAR had been 100 km, a parametertightly constrained by the need to (1) “fill the aperture”and (2) receive all the returned energy between trans-mitter pulses. To bypass these constraints, Radarsatemployed the ScanSAR8,9 technique. Through the useof multiple electronically steered antenna beams andcarefully synchronized transmitter pulse timing, Radar-sat can achieve 525-km swaths (at an altitude of 800km) using four beams. Even wider swaths may be pos-sible using up to eight beams (see the article by Holtand Hilland, this issue). Calibration is more difficult forthese wide multibeam swaths, however, than for a sin-gle beam. Even 4 years after the launch of Radarsat(80% of its planned 5-year lifetime), some of its Scan-SAR modes still lacked adequate calibration and sta-bility for satisfactory backscatter-to-wind-speed inver-sion (see, e.g., articles in this issue by Vachon et al.,Gower and Skey, and Horstmann et al.). But inversionis only partially an engineering problem. Althoughradar backscatter increases monotonically with windspeed (all other parameters being constant), the rate ofincrease is very low for high winds and near-nadirangles,10 making the inversion process unstable withnoise. Moreover, other parameters are not constant, noris their influence on the resulting wind estimate alwaysunderstood.
In spite of all these complications, substantialprogress has been made in the retrieval of high-resolu-tion wind fields from SAR image data. One such ex-ample is illustrated here; several other (more or lesssuccessful) examples are given elsewhere in this issue.
STORMWATCHScanSAR imagery obtained under a Radarsat Appli-
cations Development and Research Opportunity(ADRO) project was acquired during the 1996–1997northern winter off the U.S. East Coast (see the insideback cover). The ADRO products clearly illustratedthe wealth of atmospheric expressions manifest in even
JOHNS HOPKINS APL TECHNICAL DIGEST, VOLUME 21, NUMBER 1 (20
relatively narrow swath (300-km) ocean images. Manyof these expressions had been seen in Seasat, but thewider swaths of Radarsat were able to capture muchlarger views of the synoptic patterns. For example, thecold air outbreak displayed on the easternmost swathon 14 January 1997 (inside back cover) shows a surpris-ingly coherent spatial evolution of the marine atmo-spheric boundary layer (MABL), beginning at the coastand extending well southeast past the Gulf Stream (seeSikora et al., this issue). Such a detailed evolution ofthe MABL at the surface would be impossible to ob-serve with any other technique.
These early but limited observations of an oftenhighly structured and evolving surface wind field werequite remarkable and spurred a plan for a more system-atic collection program for the following winter. Thismore intense acquisition plan was devised by APL incooperation with the U.S. National Oceanic and At-mospheric Administration’s National Environmen-tal Satellite, Data, and Information Service (NOAA/NESDIS), which fortunately had data acquisition allot-ments from the Canadian Space Agency through aNASA agreement. The plan, spanning November 1997through March 1998, specified sets of ascending wideScanSAR passes at a 440-km width and �1500-kmlength to be collected every third day off the U.S./Canadian East Coast (Fig. 1). The coverage patternbegan in the east and continued westward, with adja-cent (overlapping) swaths at 3-day intervals. The pat-tern repeated every 24 days. (Similar sets of descendingpasses also occurred, but those normally were not
50
40
30
Nor
th la
titud
e (d
eg)
West longitude (deg)
8070 60
50
Figure 1. The region of interest for StormWatch coverage. A set of10 Radarsat (440-km) passes is shown. Coverage accumulatesfrom east to west at intervals of 3 days. Pass 10710, whichoccurred at 2230 GMT on 22 November 1997, is the subject ofinterest in this article and is bordered in orange. Also shown arethe 200-m depth contours (yellow) and the positions of U.S. andCanadian buoys (red) useful for calibrating the SAR.
00) 13

R. C. BEAL
acquired.) This collection area contains many U.S. andCanadian buoys that are essential in the wind calibra-tion strategy, as described by Thompson and Beal, thisissue. Moreover, all the westernmost passes crossed overthe Gulf Stream, which often creates an unstableboundary layer (warmer water provides buoyancy to thecolder air). An unstable boundary layer can increasebackscatter, giving the false impression of an increasedsurface wind speed.
Although originally conceived as an operationaldemonstration, the East Coast StormWatch coverageand data delivery for the winters of 1997–1998 and1998–1999 did not approach the performance neces-sary for an operational product. There were many rea-sons for this shortfall: lack of priority in acquisitionrequests (i.e., conflicts with higher-priority users),months of delay in data transfer from the Canadianreceiving station (Gatineau, Quebec) to the U.S. Alas-ka SAR Facility (ASF), similar delays at ASF in pro-cessing and delivery, and, as already mentioned,inadequate calibration in the wide swath modes. Nev-ertheless, progress has been substantial, as results in thefollowing section will attest.
The 22 November Event in the Gulf of MaineThe first wide (440-km) ScanSAR pass in the
StormWatch sequence for the 1997–1998 fall–winterseries was acquired at 2230 GMT on 22 November(highlighted in Fig. 1). A high-resolution SAR-derived wind fieldfrom the northern end of the passis shown on the outside cover ofthis issue. To better understand thefeatures and to put the results inperspective, we examine here themeteorological events leading upto and occurring just after overpasstime, as well as some of the otherpotentially relevant data aroundthat time. We used model param-eter fields produced by the U.S.Navy Fleet Numerical Meteorolo-gy and Oceanography Center inMonterey, California. This choice,although only one of several pos-sible models, is especially conve-nient since it is routinely availabletwice a day. (Other options in-clude models from the U.S. Na-tional Centers for EnvironmentalPrediction, Suitland, Maryland;the British Meteorological Office,Bracknell, U.K.; and the EuropeanCenter for Medium Range Weath-er Forecasting, Reading, U.K.)
Figure 2. A set of fotime (2230 GMT), shmoving rapidly to theidentical to that in Fig
Pressu
Pressu
(a)
(c)
14 JOHN
The time sequence of pressure fields in Fig. 2 showsa deepening low-pressure system moving rapidlythrough the overpass region and toward the northeast.Ninety minutes after overpass time (2400 GMT) thelow was moving south of Nova Scotia. Six hours later(0600 GMT, 23 November), it deepened further as itpassed south of Newfoundland. A second set of sixadditional parameter fields, all 1.5 h after overpass time,is shown in Fig. 3. Model wind vectors (Fig. 3a) showedmaximum winds around 20 m/s well to the east of theoverpass, with counterclockwise circulation aroundthe low pressure center producing northeasterly (fromthe northeast) winds at 15 m/s in the Gulf of Maine(northern portion of the overpass). Meanwhile,southeasterly winds in the south of the pass, workingover a long fetch, produced waves as high as 5 m(Fig. 3b).
From the combination of wind and wave vectors,one can derive the “inverse wave age,” which is pro-portional to the local wind–wave slope. The inversewave age is the ratio of the component of wind velocitytraveling in the direction of the dominant waves to thedominant wave velocity. An inverse wave age of �1implies equilibrium (wave growth rate = decay rate).Younger waves are steep and growing; older waves aresmooth and decaying. For the same wind speed, young,steep, growing waves produce a higher radar return thanold, smooth, decaying waves. Thus, wave age is another“contaminating” factor in the backscatter-to-wind
ur sequential model pressure fields around pass 10710 overpassowing a deepening low pressure developing off Cape Hatteras and northeast. Overpass occurred 90 min before (c). Region shown is. 1.
re (mbar) Pressure (mbar)
re (mbar) Pressure (mbar)
(b)
(d)
22 Nov, 1200 GMT 22 Nov, 1800 GMT
23 Nov, 0000 GMT 23 Nov, 0600 GMT
S HOPKINS APL TECHNICAL DIGEST, VOLUME 21, NUMBER 1 (2000)

AN INTERNATIONAL STORMWATCH USING WIDE SWATH SAR
Surface wind speed (m/s) Surface waveheight (m)
Inverse (dominant) wave age Air temperature (°C)
Sea surface temperature (°C) Air minus sea temperature (°C)
(a)
(e)
(c)
(b)
(f)
(d)
Figure 3. A set of six model parameter fields on 23 November at 0000 GMT illustrating (a) wind speed, (b) waveheight, (c) inverse waveage, (d) air temperature, (e) sea surface temperature, and (f) air-minus-sea temperature. Region shown is identical to that in Fig. 1.
JOHNS HOPKINS APL TECHNICAL DIGEST, VOLUME 21, NUMBER 1 (2000) 15
R. C. BEAL
relationship. Figure 3c shows the model inverse waveage field near overpass time. As expected, it was max-imum where the wind was highest (where the waveswere growing, but not necessarily the highest), but italso reached a secondary maximum in the Gulf of Mainenear the northeastern corner of the SAR overpass. Herethe wind opposed the waves, increased their slope (forthe same wind speed), and so increased the backscatter,falsely indicating a higher than actual wind speed.
Figures 3d and 3e show model air and sea surfacetemperature, respectively, and Fig. 3f shows the differ-ence between air and sea temperature (air minus sea),which is a measure of boundary-layer stability. Boundary-layer stability, as noted earlier, can also influence surfaceroughness, and therefore radar backscatter. An unstableboundary layer can lead to increased backscatter for the
16 JO
same wind speed. The reverse condition is even moreinfluential, however: an increasingly stable boundarylayer (colder water below warmer air) can significantlysuppress the surface roughness, indeed even quench theroughness for sufficiently high stability at low windspeeds. Figure 3f shows how the cold northeasterly windsproduce an unstable boundary layer over the warmerGulf of Maine. Although this instability does not signif-icantly alter the mean backscatter, it does manifest itselfin other ways in the SAR imagery. Roll vortices are themost obvious evidence of the instability. These vorticesappear as patterns of order of kilometer scale, roughlyaligned with the local wind vector (see, e.g., the articlesby Brown and by Mourad et al., this issue).
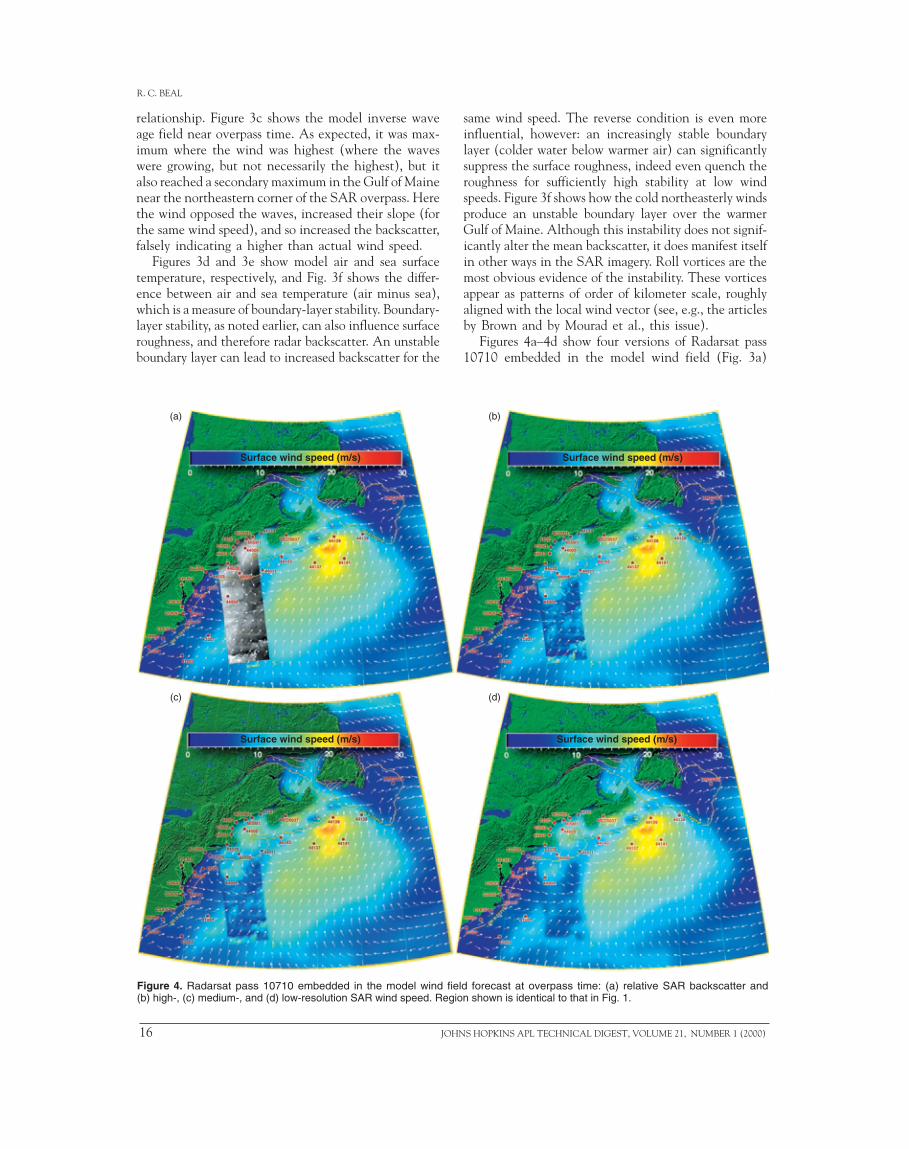
Figures 4a–4d show four versions of Radarsat pass10710 embedded in the model wind field (Fig. 3a)
Surface wind speed (m/s) Surface wind speed (m/s)
Surface wind speed (m/s) Surface wind speed (m/s)
(a) (b)
(c) (d)
Figure 4. Radarsat pass 10710 embedded in the model wind field forecast at overpass time: (a) relative SAR backscatter and(b) high-, (c) medium-, and (d) low-resolution SAR wind speed. Region shown is identical to that in Fig. 1.
HNS HOPKINS APL TECHNICAL DIGEST, VOLUME 21, NUMBER 1 (2000)
closest to the overpass time: (Fig.4a) uncorrected (relative) radarbackscatter, with the higher back-scatter at the steeper radar inci-dence angles (satellite track isascending to near-north, and theradar is right-looking); (4b) high-resolution (�300-m) SAR-derivedwind speed (see Thompson andBeal, this issue); (4c) medium-resolution (smoothed to �3 km)SAR-derived wind field; and (4d)low-resolution (smoothed to �30km) SAR-derived wind field. Thislow-resolution version approachesthe resolution of the wind model(�100 km) and is also quite similarto the resolution of conventionalscatterometers. Without dwellingon the finer details for the mo-ment, it is clear that the SAR windestimates were lower than those ofthe model throughout the south-ern two-thirds of the pass. Un-fortunately, there is no way todetermine in this case which wasmore correct, the model or theSAR. All the working buoys arelocated in the northern third ofthe pass. The model may haveoverestimated the magnitude ofthe wind in the wake of the storm.On the other hand, the SAR es-timates in the northern third ofthe pass agree nicely with themodel, at least on the large scale.In this region, model, buoy, andSAR patterns of wind direction allagreed remarkably well, so we areconfident that the finer features ofthe SAR wind field are also realand accurately depicted.
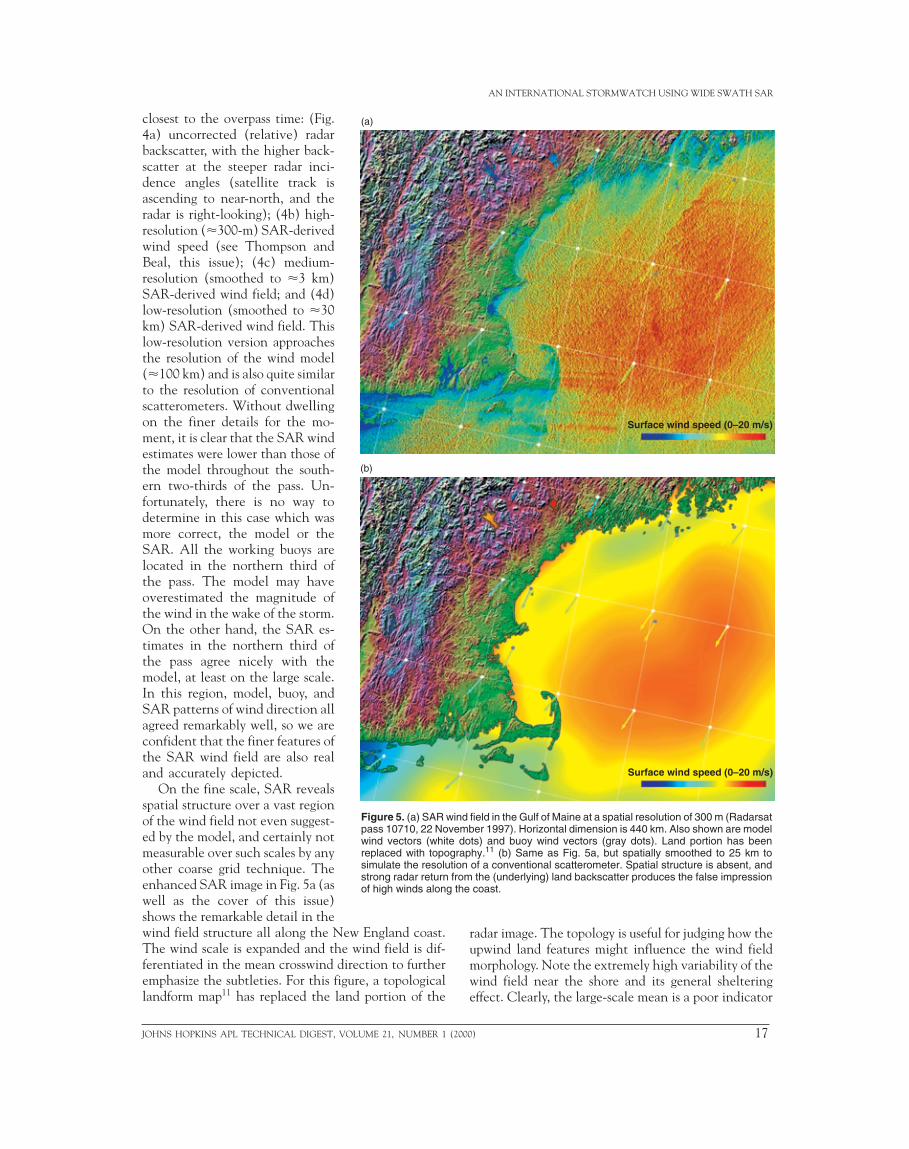
On the fine scale, SAR revealsspatial structure over a vast regionof the wind field not even suggest-ed by the model, and certainly notmeasurable over such scales by anyother coarse grid technique. Theenhanced SAR image in Fig. 5a (aswell as the cover of this issue)shows the remarkable detail in thewind field structure all along the New England coast.The wind scale is expanded and the wind field is dif-ferentiated in the mean crosswind direction to furtheremphasize the subtleties. For this figure, a topologicallandform map11 has replaced the land portion of the
Figure 5. (a) SAR wpass 10710, 22 Novwind vectors (whitereplaced with topogsimulate the resolutstrong radar return fof high winds along
(a)
(b)
JOHNS HOPKINS APL TECHNICAL DIGEST, V
AN INTERNATIONAL STORMWATCH USING WIDE SWATH SAR
ind field in the Gulf of Maine at a spatial resolution of 300 m (Radarsatember 1997). Horizontal dimension is 440 km. Also shown are model dots) and buoy wind vectors (gray dots). Land portion has beenraphy.11 (b) Same as Fig. 5a, but spatially smoothed to 25 km toion of a conventional scatterometer. Spatial structure is absent, androm the (underlying) land backscatter produces the false impressionthe coast.
Surface wind speed (0–20 m/s)
Surface wind speed (0–20 m/s)
OLUME 21, NUMBER 1 (2
radar image. The topology is useful for judging how theupwind land features might influence the wind fieldmorphology. Note the extremely high variability of thewind field near the shore and its general shelteringeffect. Clearly, the large-scale mean is a poor indicator
000) 17

R. C. BEAL
of the wind speed at any given point along the coast.Often the stronger wind features appear to be associ-ated with longer fetches available from the inland baysand estuaries. Obvious signs of atmospheric instabilityare also evident in the overall streakiness roughlyaligned with the wind field direction. These instabil-ities appear to produce large crosswind gradients inwind magnitude. Independent validation of many ofthese phenomena is difficult if not impossible, simplybecause no other sensor has both the resolution andperspective of the SAR. The best that can be done isto compare relevant spatial averages from the SARwith corresponding resolutions from other sensors, or,through a Taylor-like hypothesis, to associate elongat-ed areas of the SAR wind map with time-averagedbuoy estimates.
To further emphasize the unique spatial resolution ofthe SAR, especially its superiority in coastal areas, Fig.5b shows a smoothed version of Fig. 5a that simulatesa conventional scatterometer product with a typicalspatial resolution of 25 km. The spatial structure hasdisappeared, of course, but more significantly the coast-al regions and lakes now show much higher winds thanactually existed. Contamination arising in a scatterom-eter from the adjoining land, for off-nadir angles higherthan about 30˚, completely overwhelms the lower back-scatter of the nearby water. This is a major limitationof conventional wind scatterometry, rendering its re-sults unreliable within about 50 to 100 km of the coast.It is also a reminder of another limitation of both scat-terometers and numerical models, even in noncoastalregions: the actual wind field at a particular point isoften poorly represented by an average over many tensof kilometers. This limitation is especially acute aroundcoasts, fronts, cold air outbreaks, and polar and tropicalstorms, where the spatial (and, by implication, the tem-poral) fluctuations of the true wind field may oftenexceed the mean.
Problems and ProspectsThere is no question that wide swath SAR can,
under favorable conditions, deliver a unique and valu-able perspective of the true wind field that wouldotherwise remain obscured in the best numericalmodel and conventional sensor estimates. However,this uniquely superior aspect of SAR must be weighedagainst several limitations, especially if the goal is aroutine, global, near–real-time operational wind prod-uct. These limitations can be categorized as scientific,technical (or engineering), and organizational (orpolitical).
Scientifically, as mentioned earlier, the physics ofradar ocean scattering is far from simple on the largescale sampled by conventional scatterometers and radi-ometers. Scattering physics is even more complicated
18 JO
on the small scales representative of SAR imagery.Many potentially relevant variables exist, including the
• Wind vector and its three-dimensional spectrum• Wave vector and its two-dimensional spectrum• Wind vector height profile as a function of boundary-
layer stability• Water surface tension and dielectric constant as a
function of impurity concentration• Extent of wave breaking as a function of both wind
and waves• Radar frequency and polarization• Nonlinear interaction of all of these with one another
on spatial scales of only a few hundred meters
Many of the interactions are significant but only par-tially understood, and field experiments to probe theirrelationships are often difficult and expensive or im-practical.
The problem seems intractable, yet some progress ispossible. The motivation is strong. Wind estimatesfrom SAR, if they can be produced on spatial scales ofonly a few hundred meters, even if only approximatelycorrect, will greatly exceed the capabilities of any othertechnique.
The most acute and intolerable error source in SARwind estimates comes from the uncertainty in a prioriestimates of local wind direction with which to enterthe backscatter-to-wind conversion equation. Thisproblem is discussed extensively by many authors inthis issue (e.g., Vachon et al.; Gower and Skey; Thomp-son and Beal; Horstmann et al.). No satisfactorysolution for the problem has yet been proposed that willwork under all circumstances. The problem ismost severe in rapidly changing winds, fronts, andstorms. Needed is some kind of optimum blending ofinformation within the SAR image itself with modelforecasts and coarser-resolution sensors. Although someprogress has been made on this front, much more isstill required.
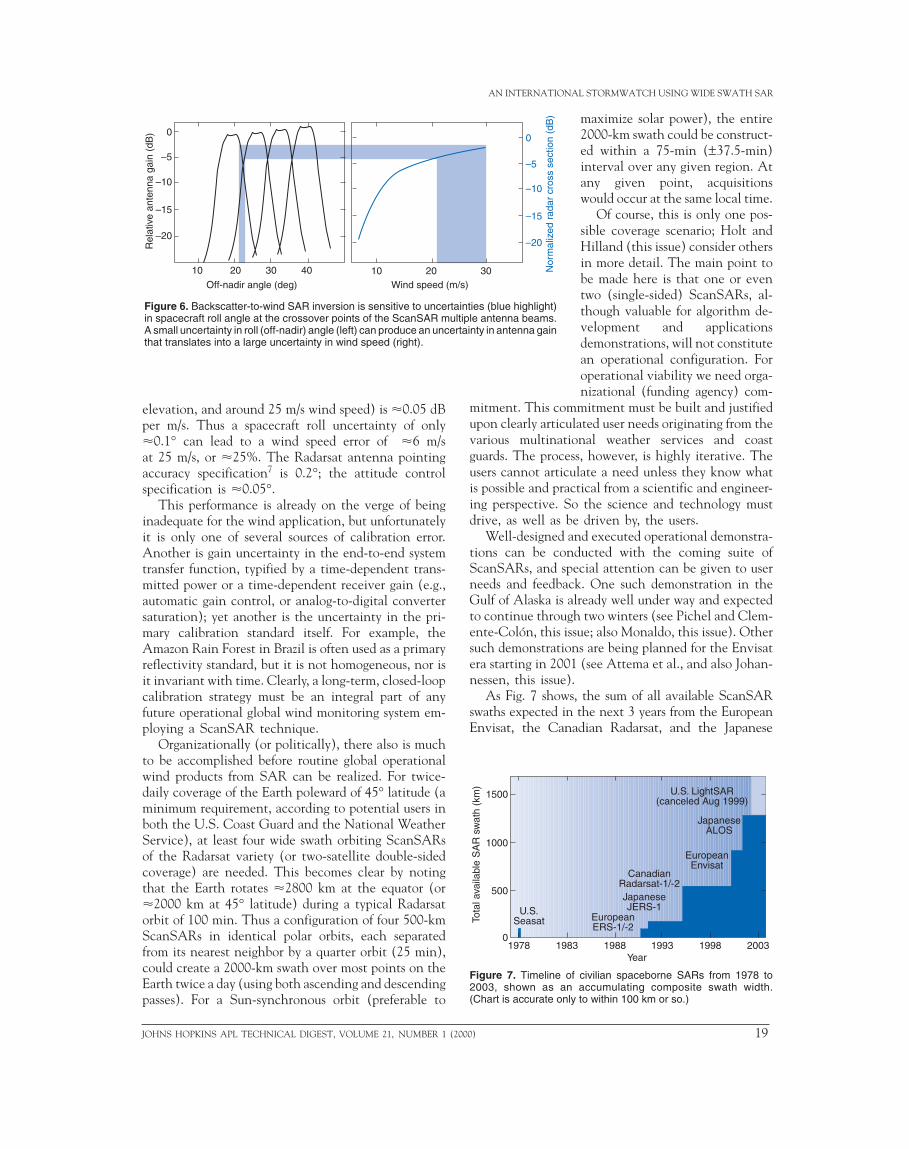
From an engineering (technical) perspective, prob-ably the largest obstacle to a reliable operational windproduct is inadequate system calibration. System stabil-ity is required both in the long- and short-term. Al-though elegant in concept, the ScanSAR multibeamtechnique severely constrains, in particular, spacecraftattitude control for radiometrically calibrated products.As Fig. 6 illustrates, a seamless correction for themultibeam antenna pattern is especially limited byspacecraft attitude uncertainty at the beam crossoverpoints, where the antenna gain derivative with respectto off-nadir angle is highest. The effect is exacerbatedat high winds by the decreasing slope of the radarbackscatter-to-wind relationship. For example, a typi-cal gain slope at the ScanSAR antenna beam crossoverpoints is �3 dB per degree of elevation angle change;a typical backscatter-to-wind-speed change (at 22°
HNS HOPKINS APL TECHNICAL DIGEST, VOLUME 21, NUMBER 1 (2000)
AL STORMWATCH USING WIDE SWATH SAR
AN INTERNATIONOff-nadir angle (deg)
Rel
ativ
e an
tenn
a ga
in (
dB)
Wind speed (m/s)
Nor
mal
ized
rad
ar c
ross
sec
tion
(dB
)
10 20 30 40 10 20 30
0
–5
–10
–15
–20
–5
–10
–15
–20
0
Figure 6. Backscatter-to-wind SAR inversion is sensitive to uncertainties (blue highlight)in spacecraft roll angle at the crossover points of the ScanSAR multiple antenna beams.A small uncertainty in roll (off-nadir) angle (left) can produce an uncertainty in antenna gainthat translates into a large uncertainty in wind speed (right).
elevation, and around 25 m/s wind speed) is �0.05 dBper m/s. Thus a spacecraft roll uncertainty of only�0.1° can lead to a wind speed error of �6 m/sat 25 m/s, or �25%. The Radarsat antenna pointingaccuracy specification7 is 0.2°; the attitude controlspecification is �0.05°.
This performance is already on the verge of beinginadequate for the wind application, but unfortunatelyit is only one of several sources of calibration error.Another is gain uncertainty in the end-to-end systemtransfer function, typified by a time-dependent trans-mitted power or a time-dependent receiver gain (e.g.,automatic gain control, or analog-to-digital convertersaturation); yet another is the uncertainty in the pri-mary calibration standard itself. For example, theAmazon Rain Forest in Brazil is often used as a primaryreflectivity standard, but it is not homogeneous, nor isit invariant with time. Clearly, a long-term, closed-loopcalibration strategy must be an integral part of anyfuture operational global wind monitoring system em-ploying a ScanSAR technique.
Organizationally (or politically), there also is muchto be accomplished before routine global operationalwind products from SAR can be realized. For twice-daily coverage of the Earth poleward of 45° latitude (aminimum requirement, according to potential users inboth the U.S. Coast Guard and the National WeatherService), at least four wide swath orbiting ScanSARsof the Radarsat variety (or two-satellite double-sidedcoverage) are needed. This becomes clear by notingthat the Earth rotates �2800 km at the equator (or�2000 km at 45° latitude) during a typical Radarsatorbit of 100 min. Thus a configuration of four 500-kmScanSARs in identical polar orbits, each separatedfrom its nearest neighbor by a quarter orbit (25 min),could create a 2000-km swath over most points on theEarth twice a day (using both ascending and descendingpasses). For a Sun-synchronous orbit (preferable to
JOHNS HOPKINS APL TECHNICAL DIGEST, VOLUME 21, NUMBER 1 (2000)
maximize solar power), the entire2000-km swath could be construct-ed within a 75-min (±37.5-min)interval over any given region. Atany given point, acquisitionswould occur at the same local time.
Of course, this is only one pos-sible coverage scenario; Holt andHilland (this issue) consider othersin more detail. The main point tobe made here is that one or eventwo (single-sided) ScanSARs, al-though valuable for algorithm de-velopment and applicationsdemonstrations, will not constitutean operational configuration. Foroperational viability we need orga-nizational (funding agency) com-
mitment. This commitment must be built and justifiedupon clearly articulated user needs originating from thevarious multinational weather services and coastguards. The process, however, is highly iterative. Theusers cannot articulate a need unless they know whatis possible and practical from a scientific and engineer-ing perspective. So the science and technology mustdrive, as well as be driven by, the users.
Well-designed and executed operational demonstra-tions can be conducted with the coming suite ofScanSARs, and special attention can be given to userneeds and feedback. One such demonstration in theGulf of Alaska is already well under way and expectedto continue through two winters (see Pichel and Clem-ente-Colón, this issue; also Monaldo, this issue). Othersuch demonstrations are being planned for the Envisatera starting in 2001 (see Attema et al., and also Johan-nessen, this issue).
As Fig. 7 shows, the sum of all available ScanSARswaths expected in the next 3 years from the EuropeanEnvisat, the Canadian Radarsat, and the Japanese
Figure 7. Timeline of civilian spaceborne SARs from 1978 to2003, shown as an accumulating composite swath width.(Chart is accurate only to within 100 km or so.)
1500
Tota
l ava
ilabl
e S
AR
sw
ath
(km
)
500
1000
01978 1983 1988 1993 1998 2003
Year
U.S.Seasat European
ERS-1/-2
JapaneseJERS-1
EuropeanEnvisat
JapaneseALOS
U.S. LightSAR(canceled Aug 1999)
CanadianRadarsat-1/-2
19
R. C. BEAL
Advanced Land Observing System (ALOS) will prob-ably exceed 1200 km. With the addition of the U.S.LightSAR (recently canceled), it might have exceeded1500 km. Coordination of these multinational platforms,accompanied by an enlightened data distribution policy,could go far toward providing an operational and afford-able global SAR wind product.
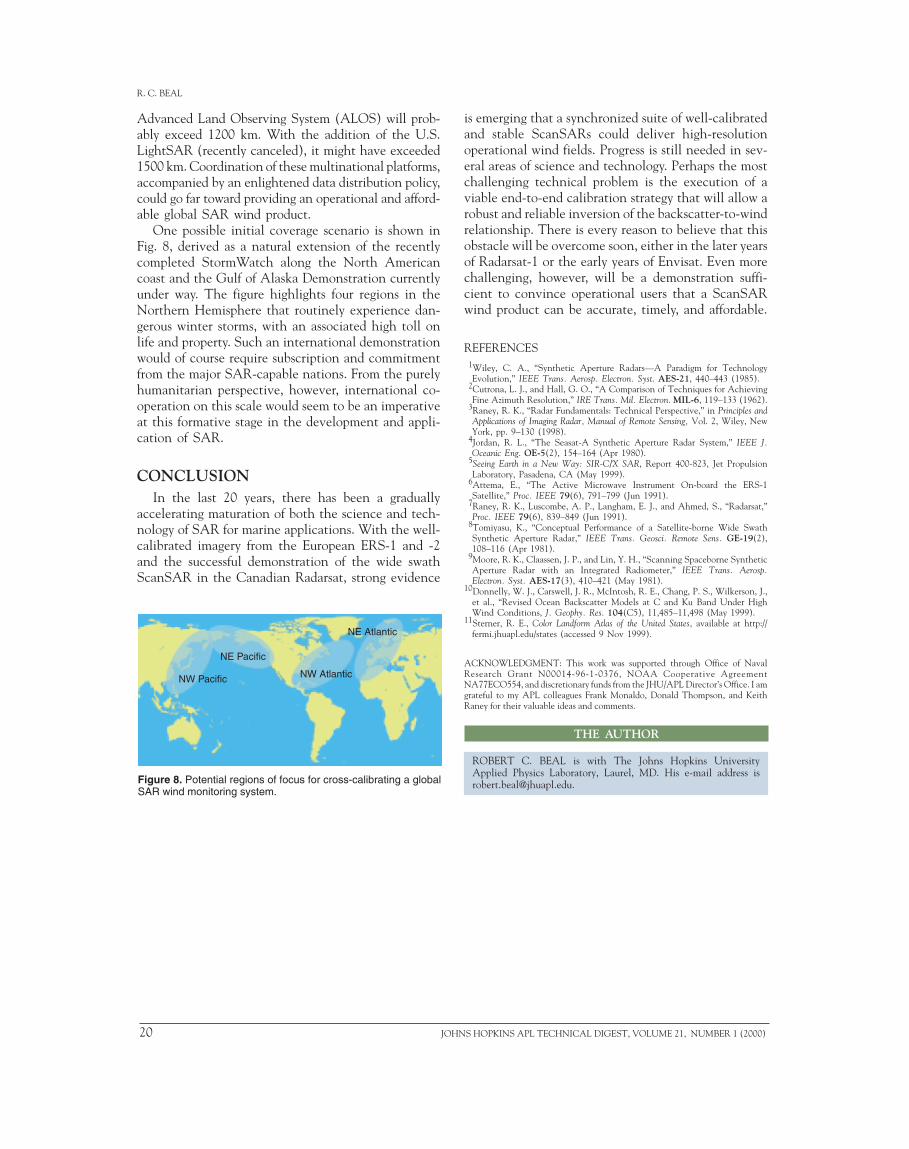
One possible initial coverage scenario is shown inFig. 8, derived as a natural extension of the recentlycompleted StormWatch along the North Americancoast and the Gulf of Alaska Demonstration currentlyunder way. The figure highlights four regions in theNorthern Hemisphere that routinely experience dan-gerous winter storms, with an associated high toll onlife and property. Such an international demonstrationwould of course require subscription and commitmentfrom the major SAR-capable nations. From the purelyhumanitarian perspective, however, international co-operation on this scale would seem to be an imperativeat this formative stage in the development and appli-cation of SAR.
CONCLUSIONIn the last 20 years, there has been a gradually
accelerating maturation of both the science and tech-nology of SAR for marine applications. With the well-calibrated imagery from the European ERS-1 and -2and the successful demonstration of the wide swathScanSAR in the Canadian Radarsat, strong evidence
Figure 8. Potential regions of focus for cross-calibrating a globalSAR wind monitoring system.
NE Pacific
NW Pacific
NE Atlantic
NW Atlantic
20 JO
is emerging that a synchronized suite of well-calibratedand stable ScanSARs could deliver high-resolutionoperational wind fields. Progress is still needed in sev-eral areas of science and technology. Perhaps the mostchallenging technical problem is the execution of aviable end-to-end calibration strategy that will allow arobust and reliable inversion of the backscatter-to-windrelationship. There is every reason to believe that thisobstacle will be overcome soon, either in the later yearsof Radarsat-1 or the early years of Envisat. Even morechallenging, however, will be a demonstration suffi-cient to convince operational users that a ScanSARwind product can be accurate, timely, and affordable.
REFERENCES1Wiley, C. A., “Synthetic Aperture Radars—A Paradigm for TechnologyEvolution,” IEEE Trans. Aerosp. Electron. Syst. AES-21, 440–443 (1985).
2Cutrona, L. J., and Hall, G. O., “A Comparison of Techniques for AchievingFine Azimuth Resolution,” IRE Trans. Mil. Electron. MIL-6, 119–133 (1962).
3Raney, R. K., “Radar Fundamentals: Technical Perspective,” in Principles andApplications of Imaging Radar, Manual of Remote Sensing, Vol. 2, Wiley, NewYork, pp. 9–130 (1998).
4Jordan, R. L., “The Seasat-A Synthetic Aperture Radar System,” IEEE J.Oceanic Eng. OE-5(2), 154–164 (Apr 1980).
5Seeing Earth in a New Way: SIR-C/X SAR, Report 400-823, Jet PropulsionLaboratory, Pasadena, CA (May 1999).
6Attema, E., “The Active Microwave Instrument On-board the ERS-1Satellite,” Proc. IEEE 79(6), 791–799 (Jun 1991).
7Raney, R. K., Luscombe, A. P., Langham, E. J., and Ahmed, S., “Radarsat,”Proc. IEEE 79(6), 839–849 (Jun 1991).
8Tomiyasu, K., “Conceptual Performance of a Satellite-borne Wide SwathSynthetic Aperture Radar,” IEEE Trans. Geosci. Remote Sens. GE-19(2),108–116 (Apr 1981).
9Moore, R. K., Claassen, J. P., and Lin, Y. H., “Scanning Spaceborne SyntheticAperture Radar with an Integrated Radiometer,” IEEE Trans. Aerosp.Electron. Syst. AES-17(3), 410–421 (May 1981).
10Donnelly, W. J., Carswell, J. R., McIntosh, R. E., Chang, P. S., Wilkerson, J.,et al., “Revised Ocean Backscatter Models at C and Ku Band Under HighWind Conditions, J. Geophy. Res. 104(C5), 11,485–11,498 (May 1999).
11Sterner, R. E., Color Landform Atlas of the United States, available at http://fermi.jhuapl.edu/states (accessed 9 Nov 1999).
ACKNOWLEDGMENT: This work was supported through Office of NavalResearch Grant N00014-96-1-0376, NOAA Cooperative AgreementNA77ECO554, and discretionary funds from the JHU/APL Director’s Office. I amgrateful to my APL colleagues Frank Monaldo, Donald Thompson, and KeithRaney for their valuable ideas and comments.
ROBERT C. BEAL is with The Johns Hopkins UniversityApplied Physics Laboratory, Laurel, MD. His e-mail address [email protected].
THE AUTHOR
HNS HOPKINS APL TECHNICAL DIGEST, VOLUME 21, NUMBER 1 (2000)