toward healthy balance sheets: are savings …...in writing about the optimal portfolio arrangement,...
TRANSCRIPT

Federal Reserve Bank of St. Louis REVIEW Fourth Quarter 2014 359
Toward Healthy Balance Sheets:Are Savings Accounts a Gateway to Young Adults’
Asset Diversification and Accumulation?
Terri Friedline, Paul Johnson, and Robert Hughes
Y oung adulthood is a period often characterized by financial fragility. Young adultsearn the lowest incomes of their careers while making decisions about obtainingpostsecondary education, living independently, finding and changing employment,
and repaying educational debt (Bell et al., 2007, and Mishel et al., 2012). They may also havelimited assets on which to draw during times of financial need, given that half of youngadults through age 40 lack sufficient accumulated assets to sustain themselves above thepoverty line for three months without regular income (Rank and Hirschl, 2010). One studyfinds that the average savings account balance of young adults is generally low, from $639 to$1,881 between 16 and 35 years of age (Friedline and Nam, 2014). This low average suggests
Understanding the balance sheets of today’s young adults—particularly the factors that set them ona path to financial security through asset diversification and accumulation—lends some insight intothe balance sheets they will have when they are older. This study uses panel data from the CensusBureau’s 1996 Survey of Income and Program Participation to investigate the acquisition of a savingsaccount as a gateway to asset diversification and accumulation for young adults. Two avenues wereconsidered: The first emphasized ownership of a diverse portfolio of financial products, and the secondemphasized the accumulated value of liquid assets. Almost half of the surveyed young adults owned asavings account (43 percent) and approximately 3 percent acquired a savings account over the courseof the panel. (Older, nonwhite, or unemployed participants were significantly less likely to acquire anaccount.) Those who owned or acquired a savings account also had more diverse asset portfolios. Evi -dence suggests that young adults who acquire a savings account and diversify their asset portfoliosmay also accumulate more liquid assets over time, which can be leveraged in the future to strengthentheir balance sheets. (JEL D1, D3, D140)
Federal Reserve Bank of St. Louis Review, Fourth Quarter 2014, 96(4), pp. 359-89.
Terri Friedline is an assistant professor at the School of Social Welfare and faculty associate with the Assets and Education Initiative; Paul Johnsonis a professor of political science and associate director of the Center for Research Methods and Data Analysis; and Robert Hughes is a doctoralstudent in the department of sociology, University of Kansas. This paper was prepared for the symposium “The Balance Sheets of YoungerAmericans: Is the American Dream at Risk?” presented May 8 and 9, 2014, by the Center for Household Financial Stability and the ResearchDivision at the Federal Reserve Bank of St. Louis and the Center for Social Development at Washington University in St. Louis.
© 2014, The Federal Reserve Bank of St. Louis. The views expressed in this article are those of the author(s) and do not necessarily reflect the viewsof the Federal Reserve System, the Board of Governors, or the regional Federal Reserve Banks. Articles may be reprinted, reproduced, published,distributed, displayed, and transmitted in their entirety if copyright notice, author name(s), and full citation are included. Abstracts, synopses, andother derivative works may be made only with prior written permission of the Federal Reserve Bank of St. Louis.

young adults may have limited savings for even daily, lower-level financial needs such asgroceries, bills, rent, or auto repairs, let alone needs arising from educational debt or inde-pendent living that persist for several months or years.
It is generally agreed that balance sheets consist of assets, debt, and net worth (Boshara,2012; Key, 2014; Mishkin, 1978), with an underlying assumption that saving, diversifying, andaccumulating assets lead to healthier balance sheets (Carasso and McKernan, 2007). Youngadults with lower accumulated liquid assets may have fragile balance sheets when healthybalance sheets are most needed. If young adults enter this period of life by accumulatingreserves and liquid assets through financial products such as savings, stock, and retirementaccounts, they may have the financial resources to better weather unexpected changes inemployment or living situations or to further invest in their futures. Their savings and liquidassets help to create a healthy balance sheet that likely sets them on a path to financial securityfrom which they can benefit throughout life. Understanding the savings and liquid assets oftoday’s young adults as part of their balance sheets lends some insight into their balance sheetswhen they are older, particularly with regard to factors that set them on a path to financialsecurity and, eventually, mobility.
In this article, we attempt to provide an understanding of assets as one component of thebalance sheets of today’s young adults—that is, understanding the starting point for youngadults to acquire lifetime financial security. Given that savings accounts are one of the mostbasic products available from mainstream financial institutions and are hypothesized as astarting place or gateway to asset diversification and accumulation (Friedline and Elliott, 2013;Hogarth and O’Donnell, 2000; Sherraden, 1991; Xiao and Noring, 1994), this articles seeks toprovide a better understanding of the role of savings accounts in young adults’ balance sheets,particularly with regard to a diverse portfolio and the accumulation of liquid assets.
A SAVINGS ACCOUNT AND THE FINANCIAL HIERARCHY OF ADIVERSE PORTFOLIO
Xiao and Anderson (1997) draw on Maslow’s (1948, 1954) human needs theory to showhow the financial products acquired by young adults may ascend a hierarchy based on theneeds the products are designed to meet. Human needs are assumed to be hierarchical, withthe achievement of higher-level needs conditional on the achievement of lower-level needs(Maslow, 1948, 1954). These assumptions have been applied to the acquisition and use offinancial products as they relate to lower- and higher-level needs (Xiao and Anderson, 1997;Xiao and Noring, 1994; Xiao and Olson, 1993). Notably, lower-level needs are referred to as“survival” and higher-level needs are referred to as “growth” (Xiao and Anderson, 1997),1 labelsthat also provide some indication of the achievement of financial security. From this perspec-tive, a savings account is one of the first and most common financial products acquired becauseit is lower risk, easily liquidated, and designed for the achievement of daily, lower-level needs.Financial products such as stock and retirement accounts entail higher risk, have liquidityconstraints, and are designed for long-term investments and higher-level needs.
Friedline, Johnson, Hughes
360 Fourth Quarter 2014 Federal Reserve Bank of St. Louis REVIEW
Young adults may ascend a financial hierarchy by acquiring a savings account that facili-tates their achievement of daily, lower-level needs such as buying groceries or paying utilitybills. Once acquired, young adults’ maintenance of their savings account to continue to meetlower-level needs may be guided in part by the inertia of behaviors regarding financial products(Benartzi and Thaler, 2007, and Madrian and Shea, 2001). As young adults transition to achiev-ing long-term, higher-level needs, such as affording college tuition, the down payment on anew home, or inheritances they can provide to future generations, they may acquire stock andretirement accounts. A diverse portfolio, then, potentially indicates that young adults haveascended the financial hierarchy (De Brouwer, 2009; Canova, Rattazzi, and Webley, 2005; Xiaoand Anderson, 1997). This trend toward diversification is consistent with an optimal portfolioarrangement that spreads potential risk across multiple assets (Fabozzi, Gupta, and Markowitz,2002, and Markowitz, 1952), although the extent of diversification of most asset portfolios isgenerally limited (King and Leape, 1998).
A GATEWAY TO HEALTHY BALANCE SHEETSThe financial products acquired by young adults as they ascend the financial hierarchy
may serve as a gateway to diversifying and accumulating assets, nudging them toward healthybalance sheets. Young adults can leverage the assets accumulated in a diverse asset portfolioto their advantage for generating additional wealth throughout life (Friedline, Despard, andChowa, forthcoming; Friedline and Song, 2013; King and Leape, 1998). As such, a diverseportfolio may be an indicator of the ascension of the financial hierarchy to achieve higher-levelneeds, and the contribution of accumulated assets across the portfolio may be an indicator offinancial security (Beutler and Dickson, 2008; Canova, Rattazzi, and Webley, 2005; Xiao andAnderson, 1997). Holding a majority of liquid assets in a savings account might indicate theneed for easily liquidated assets, which might allude to inadequate funds to afford daily, lower-level needs. A majority of assets in stock or retirement accounts would be more complicated toliquidate and might indicate the existence of adequate funds to meet daily expenses and there-fore represent investment in higher-level needs.
Research confirms a decrease in accumulated amounts in savings accounts as assetsincrease (Xiao and Anderson, 1997); this suggests the contributions of the portfolio to assetaccumulation change with ascending the financial hierarchy. From this perspective, a savingsaccount may serve as a gateway for ascending the financial hierarchy as demonstrated by thedistribution of accumulated assets across the portfolio. For example, the amount held in a sav-ings account contributes the most to accumulated liquid assets for households at the bottom10 percent of the asset distribution compared with the amounts held in stock and retirementaccounts for households at the top 10 percent of the distribution (Xiao and Anderson, 1997).Likewise, the most common trajectory from asset diversification to accumulation is to beginby accumulating assets in savings and checking accounts in early young adulthood and progressby accumulating assets through homeownership and stocks (Keister, 2003). It is much lesscommon for young adults to begin by accumulating assets in homes and stocks.
The ascension of the financial hierarchy and distribution of accumulated assets could beinterpreted to mean that asset diversification must always precede accumulation. However,
Friedline, Johnson, Hughes
Federal Reserve Bank of St. Louis REVIEW Fourth Quarter 2014 361

the relationship between diversification and accumulation is likely more nuanced. In writingabout the optimal portfolio arrangement, Sherraden (1990, p. 589) states “With greater assets,a household can more effectively diversify its holdings,” suggesting instead that asset accumu-lation precedes diversification. The question of “Which came first, a diverse portfolio oraccumulated assets?” is somewhat less perceptive than the question of “How does a diverseportfolio contribute to the value of accumulated assets?” Whereas the first question focuseson determining the causal direction of the relationship, the latter explores the correlation orpattern and composition of assets accumulated within the context of a diverse portfolio. Inother words, compared with young adults with either no account or only a savings account,young adults who own both savings and retirement accounts may be more financially secureand have a healthier balance sheet based on their accumulated liquid assets. This is because asavings account may represent lower-level needs, whereas savings and retirement accountsrepresent lower- and higher-level needs. If young adults acquire financial products contingenton a financial hierarchy that eventually develops into a diverse portfolio that can be leveragedto generate additional assets, then it is worth knowing how a diverse portfolio contributes tothe balance sheet.
RESEARCH QUESTIONSThis article addresses the following questions to better understand how young adults
acquire a savings account and the role account acquisition plays in diversifying and accumu-lating assets:
(i) What relates to the acquisition, or take-up, of a savings account by young adults after controlling for relevant factors?
(ii) Once a saving account is acquired, what fraction of young adults acquire other financial products such as CDs, stock, and retirement accounts? In other words, is the acquisition of a savings account a gateway to a diverse asset portfolio for young adults?
(iii) How much do the acquisition of a savings account and a diverse asset portfolio by young adults contribute to the value of their accumulated liquid assets after control-ling for relevant factors?
METHODSData
A large sample providing information at multiple and frequent time points was neededto analyze the acquisition of a savings account, asset diversification, and asset accumulationamong a young adult population over time. The Panel Study of Income Dynamics (PSID)and Survey of Consumer Finances (SCF) are often used to explore questions about wealth(including savings and assets; Curtin, Juster, and Morgan, 1989; Czajka, Jacobson, and Cody,2003; Wolff, 1999). However, these surveys have smaller sample sizes and an analysis can
Friedline, Johnson, Hughes
362 Fourth Quarter 2014 Federal Reserve Bank of St. Louis REVIEW
measure savings and assets only every other year at most, potentially missing sensitive changesthat occur monthly or quarterly. This study used data from the 1996 panel of the Survey ofIncome and Program Participation (SIPP) that were collected and made publicly availableby the Census Bureau. The 1996 SIPP data were collected during the 1990s, a decade of U.S.economic growth (Jorgenson, Ho, and Stiroh, 2008). Thus, the questions and data exploredin this article reflected balance sheets during generally favorable economic conditions (whenthe balance sheets of young adults might appear the most optimistic).2
Between December 1995 and February 2000, the 1996 SIPP drew a random sample ofhouseholds grouped within geographic regions based on population counts from the mostrecent Census (U.S. Census Bureau, 2011), oversampling those with lower incomes (N = 380,609individual respondents from 40,188 eligible households; n = 1,634,357 number of rows). Eachhousehold member 15 years of age and older participated in data collection, which occurredeither quarterly or three times per year. During each interview, respondents recalled theirexperiences over the previous four months, thus resulting in 12 observations per year for a48-month time span on many variables. This allowed construction of monthly and quarterlyhistories of savings and asset diversification accounts of young adults for up to 48 months, whichwas ideal for addressing the research questions. Quarterly information was drawn from thefourth month in the reference period when respondents were interviewed in person, allowingexamination of changes in responses from one quarter to the next. The 1996 SIPP also collectedannual information in topical modules on special topics, including health, education, childcare, and accumulated assets. Annual information on liquid assets was collected in topicalmodules during waves 3, 6, 9, and 12 over the 48-month panel.
Sample selection criteria included young adults between 18 and 40 years of age who pro-vided reference month and topical module information and participated in at least two years’worth of data collection. Separate samples were produced from these two sources of informa-tion. Thus, a young adult who entered the sample at age 16 was included when he or she pro-vided at least two years’ worth of information, making him or her age 18 at some time duringthe sampling frame. Likewise, two years’ worth of information was retained for a young adultwho entered the sample at age 40, making him or her age 42 at some time during the samplingframe. In other words, young adult respondents were included when age 18 would not be theirlast year of eligibility and when age 40 would not be their first year of eligibility. This restric-tion minimized the inclusion of young adults who cycled in or out of the 1996 SIPP within ashorter time, ensured more equal sample sizes across age groups, and reduced the number ofavailable rows in the data to 1,245,689 (a reduction of 24 percent). Based on these selectioncriteria, a total of 311,446 person-month observations for young adults were included in thereference month sample (n = 30,601 individuals). There were 36,415 individuals included inthe topical module sample and 100,998 rows of data. This reduction in rows of data for thetopical module sample was expected given that the sample was followed on an annual basis asopposed to monthly or quarterly.
The average age of young adults was 30; 48 percent of respondents were female and 82percent were white. Smaller percentages of Asians (4 percent) and other nonwhite groups(14 percent; blacks, Native Americans/First Peoples) were represented. Forty-three percent of
Friedline, Johnson, Hughes
Federal Reserve Bank of St. Louis REVIEW Fourth Quarter 2014 363

Friedline, Johnson, Hughes
364 Fourth Quarter 2014 Federal Reserve Bank of St. Louis REVIEW
Table 1
Sample Characteristics
Reference month sample Topical module sample (n = 30,601) (n = 36,415)
Covariates Mean (SD)/percent Mean (SD)/percent
SexMale 52 54Female 48 46
RaceWhite 82 82Nonwhite 14 14Asian 4 4
Marital status 50 50Married 50 50Not married
College enrollmentFull-time enrollment 13 13Part-time enrollment 5 5Not enrolled 82 82
Education levelPrimary school 3 3Some high school 11 10High school diploma 33 33Some college 32 33College degree or more 21 21
EmploymentEmployed 72 65Partially employed 6 21Not employed 22 14
Household relationshipReference person 43 47Child 22 20Relative 31 29Nonrelative 4 4
New reference personYes 3 3No 97 97
HomeownershipHomeowner 59 56Not a homeowner 31 44
Geographic regionNortheast 18 18West 22 22North Central 25 25South 35 35
Monthly earned income $1,695 ($2,278) $2,194 ($2,644)Age (yr) 31.889 (5.600) 29.760 (6.626)
NOTE: The sample characteristics in this table are drawn from reference month data (n = 311,446 person-monthobservations; n = 30,601 individuals) and topical module data (n = 36,415 individuals). Means and standard deviations(SDs; shown in parentheses) are reported for continuous variables and percentages are reported for categorical variables.
SOURCE: Unweighted data from the 1996 SIPP.

young adults had a savings account. Among those who accumulated liquid assets, the meanvalue totaled $6,328 (standard deviation [SD] = $79,498).3 Samples from reference monthand topical module data were similar on all characteristics; however, young adults from thetopical module earned an average of $500 more per month. See Tables 1 and 2 for additionalsample characteristics.
Measures
The main analyses examined savings account acquisition, a diverse asset portfolio, andaccumulation of liquid assets as outcome variables.
Savings account acquisition.Account ownership by young adults was tracked to deter-mine whether or not, and when, they acquired a savings account (SIPP category EAST2B).This measure was used to model the acquisition of a savings account over the course of thepanel. This tracking used quarterly histories and occurred retrospectively over one previouscalendar year. For instance, a young adult who originally said he or she did not own a savingsaccount during one quarter and then said yes during the next quarter was considered to haveacquired a savings account. Thus, this dependent variable measured young adults’ “no-to-yes”change in account ownership compared with those who consistently reported owning a savings
Friedline, Johnson, Hughes
Federal Reserve Bank of St. Louis REVIEW Fourth Quarter 2014 365
Table 2
Savings Account, Asset Diversification, and Accumulation Characteristics
Reference month sample Topical module sample (n = 30,601) (n = 36,415)
Covariates Mean (SD)/percent Mean (SD)/percent
Percentage of savings account and financial products that comprise a diverse portfolio*
Savings account 43 46
Checking account 24 24
CD account 5 5
Money market account 5 5
Savings bond account 11 11
Stock account 15 15
Retirement account 24 25
Value of accumulated liquid assets† — $6,328 ($79,498)
NOTE: The characteristics reported in this table are drawn from the reference month data (n = 311,446 person-monthobservations; n = 30,601 individuals) and topical module data (n = 36,415 individuals). Percentages are reported forcategorical variables and medians and SDs (shown in parentheses) are reported for continuous variables. *Percentagesfor savings account and asset diversification strategies are presented for young adults who ever reported owning theseaccount types during the course of the panel using monthly level information. †Accumulated liquid assets are presentedfor young adults based on annual-level information. The accumulated mean value of liquid assets is reported only foryoung adults who held liquid assets greater than $0 and after the value was winsorized.
SOURCE: Unweighted data from the 1996 SIPP.

account, closing their account, or not acquiring a savings account (savings account closure“yes-to-no”; savings account acquisition “no-to-yes”; savings account ownership “yes-yes”; nosavings account ownership “no-no”). Approximately 43 percent of young adults consistentlyhad a savings account and 52 percent consistently did not have a savings account. About 3 per-cent of young adults acquired an account between quarters and 2 percent closed their account.Acquisition and closure were the most commonly reported savings account transitions. Wewere also interested in other variations of account acquisition and closure; however, fewerthan 1 percent of young adults made multiple transitions throughout the panel. Only oneyoung adult reported vacillating between acquisition and closure at every time point.
Diverse asset portfolio.Aside from a savings account, young adults reported whetherthey owned other types of financial products that represented additional strategies for assetdiversification (yes; no). These included checking (EAST2A), CDs (EAST2D), savings bond(EAST1A, EAST3C), money market (EAST2C), stock (EAST3B, EAST3A), and retirementaccounts (EAST1B, EAST1C). Ownership of these financial products was reported quarterlyand occurred retrospectively over one previous calendar year. Twenty-four percent of youngadults owned checking accounts, 5 percent owned CDs, 11 percent owned savings bonds, 5 percent owned money market accounts, 15 percent owned stock accounts, and 24 percentowned retirement accounts. The asset diversity of portfolios of young adults was exploreddescriptively rather than as outcomes in prediction models given that (i) the acquisition of asavings account was found to precede or coincide with other financial products that comprisedthe portfolio and (ii) the acquisition of a savings account was a dominant predictor in prelimi-nary models.
Liquid assets. Young adults were asked to sum the value of liquid assets held in interest-earning accounts, including savings and checking accounts, CDs, and money market accounts(TIAITA). Young adults also reported amounts held in bond (TALSBV), stock (ESMIV), andretirement (TALRB, TALTB, TALKB) accounts. These amounts were available from topicalmodules in waves 3, 6, 9, and 12 of the 1996 SIPP and were summed to create a measure ofcombined liquid assets.
Liquid assets—an outcome variable whose value had the potential to cross or include $0—was winsorized at the 99th percentile to censor extreme values (Cox, 2006) and transformedusing the inverse hyperbolic sine (IHS; Friedline, Masa, and Chowa, 2015; Pence, 2006). TheIHS transformation has been found to more accurately adjust for skewness in distribution ofwealth variables compared with other transformations (Pence, 2006). After the analyses, theIHS-transformed outcome variables were back transformed into real dollars using predictedvalues that accounted for control variables in the models.
The following 11 variables were included as controls in the analyses:
• age, • gender (female; male), • race (nonwhite; Asian; white), • marital status (married; not married), • college enrollment (not enrolled; enrolled part-time; enrolled full-time),
Friedline, Johnson, Hughes
366 Fourth Quarter 2014 Federal Reserve Bank of St. Louis REVIEW

• education level (primary school; partial high school; high school diploma; some college;college degree or more),
• employment (not employed; partially employed; employed), • quarterly earned income, • household relationship ([reference person; child; relative; nonrelative] and [new refer-
ence person; not a new reference person]), • homeownership ([owned; rented or occupied] and [owned; purchased; sold; not a
homeowner]), and• geographic region (South; North Central; West; Northeast).
Savings account ownership and owning financial products within a diverse asset portfolio(yes; no) were also used as controls in models predicting liquid assets. Descriptions of thesecontrol variables are provided in Appendix A.
Control variables were constructed using information from the preceding months leadingup to the fourth reference month in the quarter and averaging across the months. Thus, con-trol variables were coded at the quarterly level for analyses. The quarterly measurements couldbe used to predict savings account acquisition or measure a diverse asset portfolio given thatall were on the same quarterly scale. However, the liquid assets variable was measured at theannual level and the control variables (measured quarterly) needed to be compressed to thesame annual time scale as the asset accumulation outcomes. To do so, the control variableswere recoded to examine changes between quarters across the year preceding liquid assetaccumulation. This meant that a young adult could report not owning a home in the first twoquarters and purchasing a home in the third quarter, changing from not owning a home tohaving purchased a home over the course of the year.
Analysis Plan
The analysis plan leveraged the quarterly and longitudinal variation in savings accountacquisition by young adults to measure associations with a diverse asset portfolio, includingownership of diverse financial products and the accumulation of liquid assets. Three analytictechniques were used. Multinomial logit regression was used to predict account acquisition,and multilevel and censored tobit regressions with individual random effects were used topredict the accumulated liquid assets of young adults. The multinomial logit regression wasaccomplished using Stata (StataCorp., 2011) and the multilevel and tobit regressions withrandom effects were accomplished using R (R Core Team, 2014).
Multinomial logit regression was used to compare quarterly changes in savings accountownership, acquisition, and closure with no savings account ownership after controlling forrelevant factors. This technique was ideal because it allowed comparison of multiple accounttypes. Robust standard errors (SEs) and individual clustering were used in the multinomialmodels to predict savings account acquisition (Hosmer and Lemeshow, 2000). Control vari-ables measured at the quarterly level were included in the model and lagged by one quarter.This meant the previous quarter was used to predict acquisition in the quarter in which thesavings account was measured.
Friedline, Johnson, Hughes
Federal Reserve Bank of St. Louis REVIEW Fourth Quarter 2014 367

Multilevel (hierarchical linear) modeling was used as the primary analytic technique topredict liquid assets given the technique’s ability to (i) model random effects accounting forunobserved individual heterogeneity and (ii) control for categorical and continuous variables(Raudenbush and Bryk, 2002). In other words, multilevel modeling was used to account fordifferences among individuals that existed within the data. The nonlinear mixed effects (nlme)add-on package in R was used for multilevel modeling (Pinheiro et al., 2009) and robust SEswere produced using a Huber-White correction (Huber, 1967; Maas and Hox, 2004;Raudenbush and Bryk, 2002; White, 1982).
As a comparison with the multilevel modeling, tobit regression analysis with individualrandom effects was used to predict liquid assets (Honoré, Kyriazidou, and Powell, 2000, andTobin, 1958).4 Tobit regression was used given that the liquid assets variable was left-censored,meaning that many values were recorded as $0. This analytic technique depicted these cen-sored outcomes as information from a continuously distributed latent variable and avoidedintroducing bias in the estimates by omitting this information (Angrist, 2001). In other words,censored tobit regression attempted to minimize the $0 liquid asset amounts from young adultswho did not have savings or other accounts or any liquid assets.5 The censReg (censored regres-sion) add-on package in R was used to conduct the censored tobit regressions with randomeffects (Henningsen, 2010, 2013) and was dependent on the maxLik package in R for produc-ing maximum likelihood (ML) estimates (Henningsen and Toomet, 2011) (Table 3). Theresults reported in the text focus on the multilevel model with individual random effects, asresults from the censored tobit regression were provided as a type of sensitivity analysis.
RESULTSAcquiring a Savings Account
Small percentages of young adults acquired or closed accounts between quarters. About3 percent of young adults acquired an account and 2 percent closed an account. The predomi-nant behaviors with regard to a savings account were consistently having owned or never hav-ing owned a savings account, with respective percentages of 43 and 52. Figure 1 graphs youngadults’ savings account ownership, acquisition, and closure by age. However, Figure 1 alsoshows the likelihood of owning a savings account increased with age, which suggests that whileyoung adults were not sensitive to acquisition between quarters, they increasingly acquiredaccounts through their mid- to late 20s before the percentage leveled off in their 30s.6
Multinomial logit models predicted young adults’ acquisition of a savings account betweenquarters, comparing savings account ownership (“yes-yes”), acquisition (“no-to-yes”), andclosure (“yes-to-no”) with no savings account ownership (“no-no”; see Table 2). The modelsof primary interest compared acquisition and closure with no savings account ownership(Models 2 and 3).
Savings Account Ownership (Model 1). Females were more likely than males to own asavings account. By race, young adults who were nonwhite or Asian were both less likely toown accounts compared with whites. Young adults were also more likely to own accounts
Friedline, Johnson, Hughes
368 Fourth Quarter 2014 Federal Reserve Bank of St. Louis REVIEW

Friedline, Johnson, Hughes
Federal Reserve Bank of St. Louis REVIEW Fourth Quarter 2014 369
Table 3
Multinomial Logit Regression Models of Quarterly Change in Savings Ownership, Acquisition, and ClosureCompared with No Savings Account Ownership†
Model 1 Model 2 Model 3
No account ownership No account ownership No account ownership vs. account ownership vs. account acquisition vs. account closure
Covariates b SE b SE b SE
Sex: MaleFemale 0.101*** (0.008) 0.005 (0.022) 0.022 (0.022)
Race: WhiteNonwhite –0.925*** (0.013) –0.349*** (0.033) –0.404*** (0.033)Asian –0.133*** (0.021) 0.132** (0.054) 0.079 (0.055)
Marital status: Not marriedMarried 0.010 (0.009) 0.009 (0.024) 0.064*** (0.024)
School enrollment: Full-timeEnrolled part-time 0.006 (0.021) –0.015 (0.059) 0.020 (0.060)Not enrolled –0.005 (0.014) –0.022 (0.037) 0.015 (0.038)
Education level: Primary schoolSome high school –0.019 (0.025) –0.048 (0.068) –0.000 (0.070)High school diploma –0.015 (0.023) –0.020 (0.062) 0.013 (0.064)Some college –0.022 (0.023) –0.081 (0.063) 0.013 (0.065)College degree or more –0.017 (0.024) –0.071 (0.066) –0.025 (0.067)
Employment status: EmployedPartially employed 0.025 (0.018) 0.011 (0.048) 0.064 (0.050)Not employed 0.026 (0.027) –0.155** (0.071) 0.187** (0.077)
New reference person: NoYes 0.011 (0.009) –0.005 (0.023) 0.005 (0.023)
Homeownership: Not a homeownerHomeowner 0.138*** (0.025) –0.663*** (0.046) –0.571*** (0.049)
Geographic region: NortheastWest –0.277*** (0.013) –0.047 (0.034) –0.008 (0.035)North Central 0.019 (0.012) –0.044 (0.034) 0.045 (0.035)South –0.419*** (0.012) –0.287*** (0.032) –0.204*** (0.033)
Quarterly mean income spline 1 –12.464 (6.451) 10.960 (19.520) 90.076 (73.601)Quarterly mean income spline 2 –11.984 (6.428) 11.093 (19.463) 90.891 (73.507)Quarterly mean income spline 3 –12.048 (6.434) 10.892 (19.479) 90.958 (73.537)Quarterly mean income spline 4 –11.962 (6.386) 11.233 (19.350) 90.491 (73.264)Quarterly mean income spline 5 –13.322 (7.128) 10.924 (21.381) 98.168 (78.896)Age spline 1 1.130*** (0.375) –4.700*** (1.040) –2.648** (1.036)Age spline 2 –1.948*** (0.205) –1.507** (0.595) –0.261 (0.599)Age spline 3 –0.523** (0.231) –1.304** (0.665) –0.232 (0.672)Age spline 4 –0.228 (0.199) –1.314 (0.580) –0.041 (0.586)Age spline 5 –0.079 (0.259) –1.671** (0.751) –0.195 (0.756)Constant 12.638*** –12.089 –93.451
–0.277*** –0.047 –0.008Log pseudo-likelihood –248,450.850Wald chi-square 18,224.530Degrees of freedom 81N = Person-month observations 280,845N = Individual clusters 29,585
NOTE: Listwise deletion of missing data was used and reduced the original sample of 311,446 person-month observations to 280,845 and 30,601individuals to 29,585, respective reductions of 10 percent and 3 percent. Robust SEs, clustered by individual, are reported in parentheses. †Nosavings account ownership “no-no”; savings account ownership “yes-yes”; savings account acquisition “no-to-yes”; savings account closure “yes-to-no.” b, regression coefficient; SE, robust SE. ** and *** indicate significance at the 5 percent and 1 percent levels, respectively.
SOURCE: Unweighted data from the 1996 SIPP.

compared with not owning a savings account when they owned their own homes. Living inthe West and South was negatively related to account ownership compared with living in theNortheast. Splines for age indicated that young adults’ savings account ownership declined asthey grew older, with the exception that adults in the youngest age spline were more likely toown an account.
Savings Account Acquisition (Model 2).Asian young adults were more likely to acquirea savings account than their white counterparts, and nonwhite young adults were less likelyto acquire an account. Being unemployed and living in the South were negatively related tothe acquisition of a savings account. Young adults were less likely to acquire an account if theywere homeowners. Given that young adults were more likely to own an account initially ifthey were a homeowner (see Model 1), this negative relationship was not surprising.
Savings Account Closure (Model 3).Nonwhite young adults were less likely to close asavings account compared with whites, although they were also less likely to own accountsinitially (Model 1). Those who were unemployed were more likely to close an account. Youngadults who owned a home were also less likely to close a savings account compared with non-homeowners. Young adults who were married were more likely to close an account than tonot own one.
370 Fourth Quarter 2014 Federal Reserve Bank of St. Louis REVIEW
Elliott, Lewis, Grinstein-Weiss, Nam
20 25 30 35 400
20
40
60
80
100
Age (yr)
Percentage
No savings account in any quarterly report for indicated age
Savings account in each quarterly report
Savings account ownership changed from “no” to “yes”
Savings account ownership changed from “yes” to “no”
Other change patterns
Figure 1
Percentage of Savings Account Ownership, Acquisition, and Closure by Age of Young Adults
NOTE: This figure was produced with person-month and individual observations (n = 311,446 person-month observa-tions; n = 30,601 individuals).
SOURCE: Unweighted data from the 1996 SIPP.

In sum, young adults’ race, employment status, homeownership, geographic region, andage were consistently related to account ownership, acquisition, and closure across the models.The findings from the multinomial logit models can be interpreted as follows. Given that non-white young adults were less likely to own an account initially compared with whites, they werealso less likely to exhibit quarterly changes in account acquisition and closure. However, eventhough Asians were less likely to own an account compared with whites, they were more likelyto acquire one between quarters. There were no differences in ownership and acquisition basedon marital status; however, those who were married were more likely to close an account—anobservation that was perhaps an artifact of joint account-holding behavior between maritalpartners. There was no difference in account ownership between young adults who wereemployed versus unemployed, but those who were unemployed were less likely to acquire anaccount between quarters and more likely to close an account. This suggests employmentstatus may have played a role in facilitating the use of a savings account. Homeowners weremore likely to own an account initially, which perhaps explains why they were also less likelyto acquire or close accounts between quarters. Notably, education level and quarterly earnedincome were not significant in any of the models.
Diversifying Asset Portfolios
Compared with the percentage of young adults who owned and acquired a savings account,far fewer owned a diverse portfolio. As mentioned earlier, 24 percent of young adults ownedchecking accounts, 5 percent owned CDs, 5 percent owned money market accounts, 11 percentowned savings bond accounts, 15 percent owned stock accounts, and 24 percent owned retire-ment accounts. However, if the acquisition of a savings account serves as a gateway throughwhich young adults can diversify their asset portfolios, savings accounts should consistentlyprecede or occur simultaneously with the ownership or acquisition of these financial products.Figures 2 through 4 display young adults’ portfolios as they relate to a savings account.
In most cases, young adults owned a savings account at or before the acquisition of check-ing, CD, money market, savings bond, stock, and retirement accounts (see Figures 2 and 3).Figure 2 presents the percentage of young adults with a savings account who also owned otherfinancial products. Figure 3 presents the percentage of acquired financial products that werepreceded by or coincided with owning a savings account, which required determining thepoint in the 1996 SIPP at which young adults first acquired these products and identifying ifthey owned a savings account at that time or in any preceding month. For instance, 44 percentof young adults with a savings account also owned a checking account (see Figure 2), and formost young adults the acquisition of a checking account was preceded by or coincided withowning a savings account (23 percent; see Figure 3). Forty-two percent of young adults with asavings account also owned a retirement account (see Figure 2), and for most young adultsthe acquisition of a retirement account was preceded by or coincided with a savings account(21 percent; see Figure 3). Far fewer financial products were owned or acquired in the absenceof a savings account.
Young adults also acquired savings accounts in combination with other financial productsas they grew older (see Figure 4). The most common combinations were savings accounts
Federal Reserve Bank of St. Louis REVIEW Fourth Quarter 2014 371
Friedline, Johnson, Hughes

Friedline, Johnson, Hughes
372 Fourth Quarter 2014 Federal Reserve Bank of St. Louis REVIEW
Checking CD MoneyMarket
SavingsBond
Stock/Mutual Fund
Retirement
100
80
60
40
20
0
Savings account holders who created account
Accounts created not preceded by savings account
Percentage
Figure 2
Percentage of Young Adults with a Savings Account Who Also Owned Other FinancialProducts
100
80
60
40
20
0
Percentage
Checking CD MoneyMarket
SavingsBond
Stock/Mutual Fund
Retirement
Savings account when or before account created
No savings account at any time
Figure 3
Percentage of Young Adults Who Acquired Financial Products Coincident With or Precededby a Savings Account
NOTE: Figures 2 and 3 were produced with person-month and individual observations (n = 311,446 person-monthobservations; n = 30,601 individuals).
SOURCE: Unweighted data from the 1996 SIPP.

plus checking, stock, and/or retirement accounts. Similar to the scenario in Figure 1, youngadults may have increasingly acquired accounts and diversified their asset portfolios throughtheir mid- to late 20s before the trend leveled off in their 30s.
In sum, young adults who owned a savings account appeared to own other financialproducts more often. Furthermore, savings account ownership consistently preceded or coin-cided with the acquisition of other financial products.
Friedline, Johnson, Hughes
Federal Reserve Bank of St. Louis REVIEW Fourth Quarter 2014 373
18 21 24 27 30 33 36 39
No account of any type
Savings only
Miscellaneous others,no savings
Savings accountholders withother typesof accounts
Checking
Retirement
Stocks
Other combinations
0
20
40
60
80
100
Age (yr)
Percentage
Figure 4
Percentage of Savings Account Ownership by Young Adults Combined with Ownershipof Other Financial Products by Age
NOTE: This figure was produced with person-month and individual observations (n = 311,446 person-month observa-tions; n = 30,601 individuals).
SOURCE: Unweighted data from the 1996 SIPP.

Accumulating Liquid Assets
Information on the accumulated liquid assets of young adults was provided from annualtopical modules and analyzed using multilevel and censored tobit regression modeling withindividual random effects (see Table 4, Models 4 through 6). Random effects accounted forunobserved individual heterogeneity. The intraclass correlation (Raudenbush and Bryk, 2002)—defined as the between-individual variance divided by the total variance of liquid assets—ranged from 0.305 (Model 5) to 0.540 (Model 6), indicating that significant differences in theindividual characteristics of young adults explained between 30 percent and 54 percent of thevariability in liquid assets. The results reported below focus on the multilevel analyses fromModels 4 and 5. The relationships between financial products and liquid assets are reportedfirst before a discussion of the relationships between control variables and liquid assets.
As a first step, the financial products representing a diverse portfolio were used to predictliquid assets in Model 4, absent control variables. It was previously determined that a savingsaccount was a gateway to a diverse asset portfolio and almost always coincided with or pre-ceded the acquisition of other types of financial products. As such, the relationships betweenliquid assets and checking, stock, and retirement accounts can be interpreted as the addedcontribution of a diverse portfolio over and above a savings account. As expected, young adultswith no account of any kind accumulated significantly fewer liquid assets, whereas thosewith other account types accumulated significantly more. In particular, the relationships werestrongest between stock and retirement accounts and liquid assets, although the combinationof these accounts was negatively related to liquid assets.
While some variation in the size or strength of the estimates exists between Models 4 and 5,the direction of the relationships remained fairly consistent once control variables were added.With controls, savings and stock accounts had the strongest relationships with liquid assetsbased on regression coefficients. However, using predicted values (Table 5), a savings accountcontributed $49.68 and stocks contributed $329.50 to accumulated liquid assets. In terms ofdollar values, the combination of stock and retirement accounts contributed the most, $5,283.05,to liquid asset accumulation by young adults. Results also indicated that retirement accountsand the combination of stock and retirement accounts contributed negatively to young adults’liquid assets.
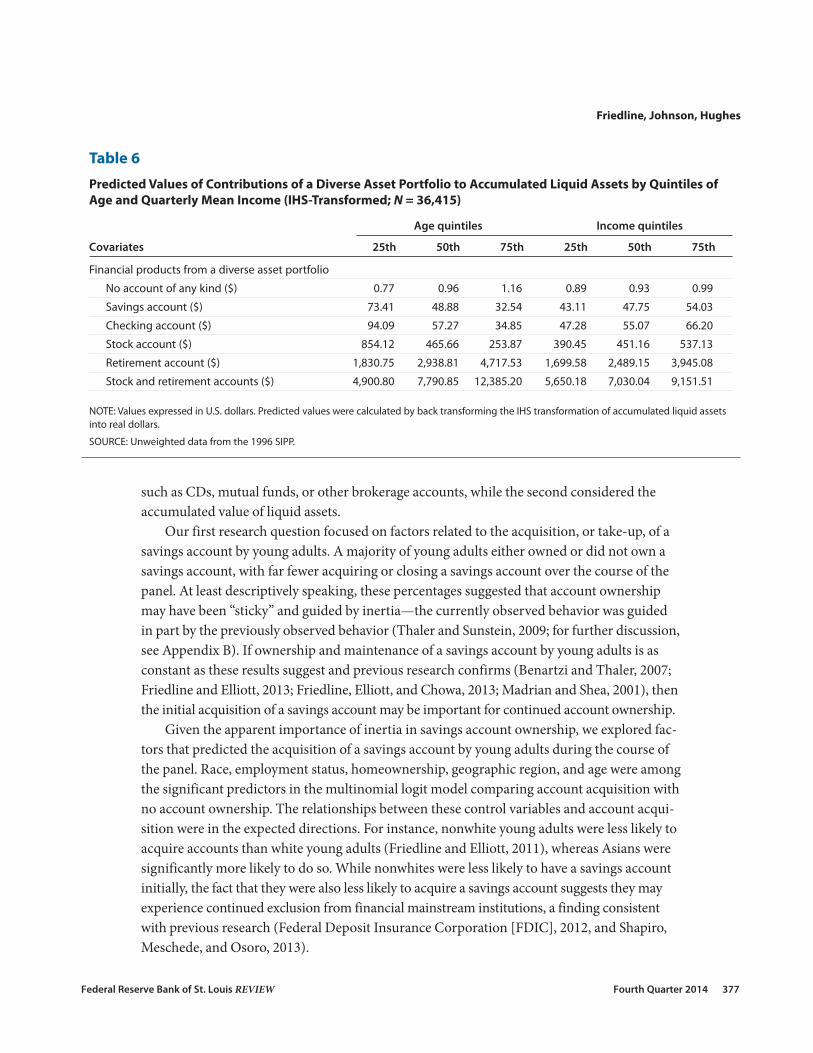
Given that the acquisition of financial products could be determined in part by age andincome, interaction effects were incorporated. There were significant, positive interactionsbetween the age of young adults and their retirement and combined stock and retirementaccounts for predicting liquid assets. Predicted values based on these interactions indicatedthat as young adults ascended age quintiles, their contributions to liquid assets by combinedstock and retirement accounts ranged from $4,900.80 to $12,385.20 (Table 6). Also consistentwith the interaction terms between age and financial products from Model 5, the amountscontributed to liquid assets by savings, checking, and stocks declined across the 25th, 50th,and 75th age quintiles.
There was a significant, positive interaction between ownership of stock and retirementaccounts and quarterly mean income; however, the interaction between the combined accountsand liquid assets was negative. Predicted values indicated that the contributions to liquid
Friedline, Johnson, Hughes
374 Fourth Quarter 2014 Federal Reserve Bank of St. Louis REVIEW

Federal Reserve Bank of St. Louis REVIEW Fourth Quarter 2014 375
Table 4
Models Predicting Liquid Assets (IHS-Transformed; N = 36,415)
Model 4 Model 5 Model 6
Multilevel model with Multilevel model with Multilevel model with individual random effects individual random effects individual random effects
Covariates b SE b SE b SE
Financial products from a diverse asset portfolioNo account of any kind –3.479*** (0.035) –3.382*** (0.035) –8.852*** (0.074)Savings account 0.272*** (0.030) 2.956*** (0.098) 2.274*** (0.185)Checking account 0.093*** (0.026) 0.517*** (0.122) 0.499** (0.193)Stock/mutual fund account 2.102*** (0.043) 3.178*** (0.188) 2.259*** (0.293)Retirement account 4.576*** (0.031) –0.808*** (0.161) –1.225*** (0.248)Stock and retirement accounts –1.094*** (0.057) –1.859*** (0.313) –1.043** (0.460)
Age 0.023*** (0.002) –0.013** (0.006)Sex: Male
Female –0.082*** (0.022) –0.230*** (0.045)Race: White
Nonwhite –0.266*** (0.031) –0.409*** (0.073)Asian –0.037 (0.055) –0.011 (0.112)
Marital status: Not marriedMarried –1.437*** (0.022) –3.008*** (0.045)
College enrollment: Not enrolledPart-time enrollment 0.140*** (0.036) 0.248*** (0.061)Full-time enrollment 0.319*** (0.030) 0.660*** (0.059)
Education level: Primary schoolSome high school –0.113 (0.064) 0.568*** (0.209)High school diploma –0.067 (0.060) 0.987*** (0.197)Some college 0.067 (0.061) 1.289*** (0.197)College degree or more 0.476*** (0.064) 1.890*** (0.199)
Employment status: Not employedPartially employed 0.107*** (0.030) 0.289*** (0.067)Employed 0.206*** (0.032) 0.493*** (0.070)
Quarterly mean income/1,000 0.039*** (0.013) 0.238*** (0.028)New reference person: False
True 0.113** (0.044) 0.170** (0.079)Change in homeownership: Not a homeowner
Owned 0.150*** (0.021) 0.407*** (0.043)Purchased 0.022 (0.039) 0.167** (0.068)Sold 0.032 (0.046) 0.084 (0.085)
Geographic region: NortheastWest –0.214*** (0.032) –0.430*** (0.066)North Central –0.141*** (0.032) –0.262*** (0.063)South –0.218*** (0.030) –0.465*** (0.061)
Interactions of financial products with age Savings account –0.091*** (0.003) –0.056*** (0.006)Checking account –0.015*** (0.004) –0.010 (0.006)Stock account –0.033*** (0.006) –0.021** (0.010)Retirement account 0.147*** (0.005) 0.197*** (0.008)Stock and retirement accounts 0.032*** (0.010) –0.021*** (0.014)
Interactions of financial products with quarterly mean income/1,000Savings account 0.076*** (0.014) –0.044 (0.023)Checking account 0.057*** (0.014) 0.024 (0.022)Stock account 0.048** (0.024) –0.082** (0.037)Retirement account 0.315*** (0.019) 0.163*** (0.029)Stock and retirement accounts –0.231*** (0.031) –0.077 (0.046)
Constant 3.686*** (0.033) 1.915*** (0.103) 0.580** (0.285)Random effects (s )
Residual 2.15 2.13 2.13Individual effect 1.69 1.41 1.41Intraclass correlation 0.381 0.305 0.540
NOTE: b, regression coefficient; SE, robust SE. ** and *** indicate significance at the 5 percent and 1 percent levels, respectively.
SOURCE: Unweighted data from the 1996 SIPP.

assets made by stock and retirement accounts were sensitive to income (see Table 6). At the25th quintile of income, the predicted value of a retirement account was $1,699.58; however,at the 75th quintile, the predicated value was $3,945.08. Likewise, the combined stock andretirement accounts at the 25th income quintile were $5,650.18 compared with $9,151.51 atthe 75th income quintile.
The relationships between control variables and liquid assets were also examined (seeTable 4 and Model 5). As expected, young adults who were older, enrolled in college, had acollege degree or more, earned a higher quarterly income, recently became a new head ofhousehold, and owned their own homes accumulated significantly more liquid assets thantheir counterparts. Young adults who were female, nonwhite, married, and lived in geographicregions other than the Northeast accumulated significantly fewer liquid assets.
In sum, the financial products from a diverse portfolio were significantly related to theaccumulated liquid assets of young adults. Significant, negative interactions between age andsavings, checking, and stock accounts suggested that the effects of these financial products onliquid asset accumulation diminished as young adults grew older. Conversely, as young adultsearned more income, the effects of these financial products on liquid asset accumulationincreased. Likewise, as young adults grew older and earned more income, the effects increased.
DISCUSSION Our research attempted to understand young adults’ balance sheets through two avenues
with 1996 SIPP data, with particular attention to the acquisition and role of a savings account.The first avenue emphasized the ownership of a diverse asset portfolio with financial products,
Friedline, Johnson, Hughes
376 Fourth Quarter 2014 Federal Reserve Bank of St. Louis REVIEW
Table 5
Predicted Values of Contributions of a Diverse Asset Portfolio to Accumulated Liquid Assets (IHS-Transformed;N = 36,415)
Model 4 Model 5
Multilevel model with Multilevel model with individual random effects individual random effects
Covariates (financial-products-only model) (full model)
Financial products from a diverse asset portfolio
No account of any kind ($) 0.21 0.95
Savings account ($) 26.15 49.68
Checking account ($) 21.86 40.34
Stock account ($) 163.04 329.50
Retirement account ($) 1,937.09 1,992.07
Stock and retirement account ($) 5,302.87 5,283.05
NOTES: Values expressed in U.S. dollars. Predicted values were calculated by back transforming the IHS transformation of accumulated liquid assetsinto real dollars.
SOURCE: Unweighted data from the 1996 SIPP.
such as CDs, mutual funds, or other brokerage accounts, while the second considered theaccumulated value of liquid assets.
Our first research question focused on factors related to the acquisition, or take-up, of asavings account by young adults. A majority of young adults either owned or did not own asavings account, with far fewer acquiring or closing a savings account over the course of thepanel. At least descriptively speaking, these percentages suggested that account ownershipmay have been “sticky” and guided by inertia—the currently observed behavior was guidedin part by the previously observed behavior (Thaler and Sunstein, 2009; for further discussion,see Appendix B). If ownership and maintenance of a savings account by young adults is asconstant as these results suggest and previous research confirms (Benartzi and Thaler, 2007;Friedline and Elliott, 2013; Friedline, Elliott, and Chowa, 2013; Madrian and Shea, 2001), thenthe initial acquisition of a savings account may be important for continued account ownership.
Given the apparent importance of inertia in savings account ownership, we explored fac-tors that predicted the acquisition of a savings account by young adults during the course ofthe panel. Race, employment status, homeownership, geographic region, and age were amongthe significant predictors in the multinomial logit model comparing account acquisition withno account ownership. The relationships between these control variables and account acqui-sition were in the expected directions. For instance, nonwhite young adults were less likely toacquire accounts than white young adults (Friedline and Elliott, 2011), whereas Asians weresignificantly more likely to do so. While nonwhites were less likely to have a savings accountinitially, the fact that they were also less likely to acquire a savings account suggests they mayexperience continued exclusion from financial mainstream institutions, a finding consistentwith previous research (Federal Deposit Insurance Corporation [FDIC], 2012, and Shapiro,Meschede, and Osoro, 2013).
Friedline, Johnson, Hughes
Federal Reserve Bank of St. Louis REVIEW Fourth Quarter 2014 377
Table 6
Predicted Values of Contributions of a Diverse Asset Portfolio to Accumulated Liquid Assets by Quintiles ofAge and Quarterly Mean Income (IHS-Transformed; N = 36,415)
Age quintiles Income quintiles
Covariates 25th 50th 75th 25th 50th 75th
Financial products from a diverse asset portfolio
No account of any kind ($) 0.77 0.96 1.16 0.89 0.93 0.99
Savings account ($) 73.41 48.88 32.54 43.11 47.75 54.03
Checking account ($) 94.09 57.27 34.85 47.28 55.07 66.20
Stock account ($) 854.12 465.66 253.87 390.45 451.16 537.13
Retirement account ($) 1,830.75 2,938.81 4,717.53 1,699.58 2,489.15 3,945.08
Stock and retirement accounts ($) 4,900.80 7,790.85 12,385.20 5,650.18 7,030.04 9,151.51
NOTE: Values expressed in U.S. dollars. Predicted values were calculated by back transforming the IHS transformation of accumulated liquid assetsinto real dollars.
SOURCE: Unweighted data from the 1996 SIPP.

Unemployed young adults were less likely than those who were employed to acquire anaccount, suggesting employment may be one path to account acquisition (Rhine and Greene,2013). One explanation for the link between young adult employment and the acquisition ofa savings account may be that employers offer—if not mandate—direct deposit for paychecks.Employment thus may have helped to ensure that young adults acquired accounts, whereasunemployment may have made this acquisition less likely.
Our second research question asked whether ownership or acquisition of a savings accountwas a gateway to a diverse asset portfolio. Consistently, young adults who owned a savingsaccount appeared to also own other financial products more often, and their savings accountownership preceded or coincided with the acquisition of other financial products. While fewyoung adults had a diverse portfolio—meaning that few young adults owned a savings accountin combination with other financial products (see Figure 4; Cooper, 2013, and King and Leape,1998)—checking, stock, and retirement accounts were among the most commonly acquiredproducts as part of a diverse portfolio. Taken together, it appears that a savings account maybe one of the first financial products acquired as young adults ascend the financial hierarchyand may almost be considered a prerequisite for—not simply a gateway to—a diverse assetportfolio (Xiao and Anderson, 1997), which is one measure of a healthy balance sheet (Fabozzi,Gupta, and Markowitz, 2002).
Our third research question explored the extent to which a savings account and a diverseasset portfolio contributed to the value of young adults’ accumulated liquid assets. In additionto a savings account, we focused on the financial products most commonly owned by youngadults—checking, stock, and retirement accounts. Given that a savings account was almost aprerequisite for the financial products that comprised a diverse portfolio, their relationshipsto liquid assets were seen as additive. That is, these financial products represented the addedeffects on liquid assets when combined with a savings account. Indeed, as young adults ascendedthe financial hierarchy and acquired stock and retirement accounts that represented long-term,higher-level needs, they also accumulated significantly more liquid assets. A savings or check-ing account alone contributed small amounts—respectively, $49.68 and $40.34. Initially, itappeared that a retirement account was negatively related to accumulated liquid assets; how-ever, considered in light of increasing quarterly mean income, a retirement account contributedsubstantially to accumulated liquid assets. A retirement account contributed $1,699.58 at the25th income quintile and $3,945.08 at the 75th income quintile. When combined with stocks,young adults accumulated $5,650.18 at the 25th income quintile compared with $9,151.51 atthe 75th income quintile. This suggests that the financial hierarchy that young adults ascend,in addition to helping diversify their portfolios (Xiao and Anderson, 1997; Xiao and Noring,1994), may contribute to accumulated liquid assets.
Limitations
Findings from this research should be considered in light of several limitations. Themeasures included in this research were limited to those available from the 1996 SIPP, andmany contextual factors with potential relevance to young adults’ balance sheets were not
Friedline, Johnson, Hughes
378 Fourth Quarter 2014 Federal Reserve Bank of St. Louis REVIEW

incorporated into the analyses. These factors include family history of financial socialization,availability of banks within a community, U.S. economic growth during the 1990s, and thebanking mergers and closures during the late 1980s and early 1990s preceding the 1996 SIPPdata collection (FDIC, 1997, and Serido et al., 2010). While this research cannot rule out therelationships between these contextual factors and the balance sheets of young adults, measur-ing the changes in employment, education level, income, or household relationship providedsome context. The 1996 SIPP data itself had some complexities, including oversampling oflower-income young adults, resulting in less frequent ownership of a savings account or otherdiverse financial products and fewer accumulated assets compared with other surveys (Czajka,Jacobson, and Cody, 2003).
In addition, imprecise reporting of retrospective monthly or quarterly information mayhave resulted in excessive transitions between reference periods (also known as “seam bias”;see Moore et al., 2009). While this research focused on the balance sheets of all young adults,those from lower-income backgrounds are arguably at greater risk for financial fragility and,thus, an important subgroup of interest, mitigating concerns about the 1996 SIPP’s oversam-pling. The concern about excessive transitions between reference periods—an artifact of the1996 SIPP survey design—has been mitigated by using information from the fourth and lastreference month of the quarter, a recommendation by previous researchers (Ham, Li, andShore-Sheppard, 2009, and Moore et al., 2009). This meant using information from 12 quartersacross the 4-year panel (the last reference month in the quarter), as opposed to all 48 months.In other words, young adults appeared to more precisely report life events such as the monththey were married, but their recollection at the monthly level was “fuzzier” about seeminglyminor life events such as opening a savings account until they were asked in person by theSIPP interviewers in the fourth reference month.
Another limitation is that the large sample sizes in the 1996 panel were useful to modelthe occurrence of rare events such as account acquisition and closure, but such large samplesizes also unexpectedly ruled out many estimation methods. For example, we considered usingmedian regression as an analytic technique to model IHS-transformed liquid assets amongthe topical module sample (Pence, 2006); however, after one week of processing, R still hadnot returned output on our preliminary model. To test whether median regression was possiblewith a smaller sample size, we reran the preliminary model with a reduced sample and, indeed,results were produced. Given the lengthy time to produce output with such large samples,median regression was ruled out as a possible analytic technique and we instead used linearmodels with multilevel modeling and censored tobit regressions.
CONCLUSION AND POLICY CONSIDERATIONSAutomatic enrollment into a savings account is one consideration in terms of policy con-
cerns regarding acquisition of savings accounts by young adults. Absent some external forcesuch as homeownership or employment that requires an account, some young adults maynever own a savings account (Benartzi and Thaler, 2007). Previous research has identifiedautomatic enrollment as an important default: Nearly all participants open a savings account
Friedline, Johnson, Hughes
Federal Reserve Bank of St. Louis REVIEW Fourth Quarter 2014 379

in research studies in which the default leverages inertia and requires participants to opt outof account acquisition (Huang et al., 2013, and Nam et al., 2013).
Given that a savings account appears to be a gateway—and perhaps even a prerequisite—to asset diversification and accumulation, a related and second consideration is encouragingaccount acquisition by young adults to facilitate their development of a healthy balance sheet.Efforts to “bank the unbanked,” so to speak, have focused on the importance of savings accountacquisition in facilitating entry into the financial mainstream (FDIC, 2012). These effortspromote the use of safe and affordable financial products available from mainstream banksand credit unions as opposed to products from predatory payday lenders that may jeopardizebalance sheets by charging excessive fees (FDIC, 2012, and Rhine and Greene, 2013). However,entry into the financial mainstream should not be the end in and of itself, particularly foryoung adults who are financially disadvantaged. Policies that promote transparency in savingsaccount fees and lower barriers to acquisition, such as reduced or eliminated minimum balancerequirements or maintenance fees, may indeed help young adults gain entry into the financialmainstream. Importantly, policies such as these may also serve to set young adults on a pathto asset diversification and accumulation and to strengthen their balance sheets.
A third consideration relates to policies that encourage asset accumulation. All of the fol-lowing contribute to the health of the balance sheet: a postsecondary education system builton debt (Assets and Education Initiative [AEDI], 2013); predatory mortgage lending practices(Agarwal et al., 2013); an economic recession that reduced net worth and raised unemploy-ment rates (Kochhar, Fry, and Taylor, 2011, and Mishel et al., 2012); an expanding retail andservice economy paying only minimum wage with few benefits (Aaronson, Agarwal, andFrench, 2012, and Carré and Tilly, 2012); and regressive tax policies that penalize individualsfor accumulating assets (Cramer and Schreur, 2013). The tax code represents one of the mostextensive and publicly accepted policies for asset diversification and accumulation, with amajority of the president’s $536 billion 2015 budget for saving and asset accumulation allocatedthrough the tax code (Black, 2014). However, the tax code disproportionately benefits thosefrom upper-income groups through subsidies on homeownership and retirement savingswhile neglecting certain groups who often lack such assets, such as young adults (Cramer,Black, and King, 2012). In part, this may be why a retirement account contributes such largepredicted values to liquid asset accumulation as income quartiles increase. This “upside-down”asset policy in the tax code incentivizes and helps to maintain positions of financial advantagewithout necessarily helping young adults build assets (Woo, Rademacher, and Meier, 2010).
Real and substantial policy change is needed to stimulate asset diversification and pro-mote accumulation among young adults, particularly since their current balance sheets maybe an indicator of their lifetime financial security. While policy programs such as IndividualDevelopment Accounts and Child Development Accounts have been found to play importantroles in the acquisition of a savings account and accumulation of assets (Boshara, 2012, andSherraden, 1991), policies are also needed that are broader in scope and simultaneously addressother vulnerabilities to young adults’ balance sheets, such as student loans, predatory lending,income, and unemployment.
A final consideration relates to the implications of these results for young adults’ balancesheets that also include debt and net worth. An underlying assumption of this research is that
Friedline, Johnson, Hughes
380 Fourth Quarter 2014 Federal Reserve Bank of St. Louis REVIEW

asset diversification and accumulation are desirable—and perhaps even reliable—indicatorsof a healthy balance sheet. While it is desirable for young adults to have opportunities to diver-sify their assets, diversification is not the only indicator of a healthy balance sheet, nor is itnecessarily the outcome for which all young adults should strive. The composition of assetdiversification and accumulated assets, debt, and net worth helps to determine the health ofthe balance sheet. Balance sheets by their very nature are complex: They incorporate debtthat includes credit cards, vehicle loans, and mortgages of varying interest rates and policyterms plus assets that include money market, stock, and retirement accounts of varying restric-tions and returns. As such, it is not enough to simply say that diversification and accumulationin and of themselves are indicators of a healthy balance sheet; where and how these diverseassets accumulate compared with debt also matter. �
Friedline, Johnson, Hughes
Federal Reserve Bank of St. Louis REVIEW Fourth Quarter 2014 381

APPENDIXESAppendix A: Descriptions of Control Variables
Age. Young adults’ age was a continuous variable ranging from 18 to 40 (TAGE).
Gender. Young adults’ gender was measured based on their reports of being male or female(ESEX; female; male).
Race. Young adults’ race included those who were white, black, Asian (including PacificIslander), and Native American/First Peoples (ERACE). Given the low percentage in thesample who were Native American/First Peoples and their very similar estimates in themodels compared with blacks, Native American/First Peoples were combined with blacksand identified as nonwhite (nonwhite; Asian; white).
Marital status. Marital status (EMS) was measured by asking young adults to report monthlywhether they were married, widowed, divorced, separated, or never married. Responseswere collapsed into married or not married categories (married; not married).
College enrollment. Young adults’ college enrollment status (RENROLL) was measured byasking whether they were enrolled in school in the previous quarter. Young adults whowere enrolled full- or part-time during the quarter were considered to have been enrolledin college, whereas those who were not enrolled in the quarter were considered to havenot been enrolled (enrolled full-time; enrolled part-time; not enrolled).
Education level. Young adults were asked to report the highest grade completed or degreereceived each month, ranging from less than first grade to doctorate degree (EEDUCATE).Responses were collapsed to indicate having a primary school education through gradeeight, some high school education through grade 12, a high school diploma, some college,or a four-year college degree or more (primary school; some high school; high schooldiploma; some college; college degree or more).
Employment status. Young adults were asked whether they were employed during the month(RMESR). Those who responded that they had a job for the entire month were coded asemployed. Young adults who reported having a job for part of the month were coded aspartially employed. Those without a job, including being absent without pay, laid off, orlooking for work, were coded as unemployed (not employed; partially employed; employed).The change in young adults’ employment status was tracked by using monthly informa-tion retrospectively over one previous calendar year. Young adults who were employed orunemployed without change between months were considered to be consistently employedor unemployed, respectively. Changes in status were observed when young adults movedfrom employed to unemployed or unemployed to employed.
Quarterly mean income. Young adults’ total earned income was available for a given month(TPEARN), which was averaged across the months leading up to the fourth referencemonth in the quarter, winsorized (Cox, 2006), and transformed using the natural log toaccount for skewness. In the analyses predicting liquid assets, quarterly mean income wasdivided by 1,000.
Friedline, Johnson, Hughes
382 Fourth Quarter 2014 Federal Reserve Bank of St. Louis REVIEW

Household relationship. Each quarter young adults were asked their relationship to the house-hold reference person (ERRP)—the person for the household whose name appeared onthe lease or mortgage and who was identified by the 1996 SIPP as the household head orperson of reference. The 1996 SIPP recorded a range of relationship statuses, from a spouseor relative of the reference person to a housemate or other nonrelative. The range of rela-tionships was categorized into young adults listed as the reference person, child of thereference person, relative, or nonrelative (reference person; child; relative; nonrelative).Forty-three percent of young adults were listed as the reference person, potentially indi-cating they were responsible for households of their own. Twenty-two percent of youngadults reported they were the child of the reference person, potentially indicating theycontinued to reside with their families of origin. The remaining 35 percent reported theywere relatives or nonrelatives of the household reference person. The change in householdrelationship status tracked young adults quarterly and retrospectively over one previouscalendar year, identifying whether the status of young adults changed from being listedas a child, relative, or nonrelative to a household reference. Approximately 3 percent of thesample reported becoming a new reference person at some point during the panel. Thischange in household relationship status served as a proxy for young adults who becameheads of households during the course of the panel (new reference person “yes”; not a newreference person “no”).
Homeownership. Young adults were asked whether they lived in a home being purchased orcurrently owned or whether they rented or otherwise occupied the residence in which theylived (ETENURE; owned = 1; rented or occupied = 0). Their responses were measuredmonthly. However, we also expected the purchase or selling of a home could affect theamount of liquid assets available to young adults apart from simply being a homeowner.If they recently purchased a home, young adults may have spent down their liquid assetsto make a down payment or repairs. As such, we modeled whether the quarterly changein young adults’ homeownership over the previous preceding year related to their accu-mulated liquid assets (owned; purchased; sold; not a homeowner).
Geographic region. The 1996 SIPP asked young adults in which state their household resided(TFIPSST). States were recoded into geographic regions (South; North Central; West;Northeast; Elliott, 2013). Southern states included Alabama, Arkansas, Delaware, Florida,Georgia, Kentucky, Louisiana, Maryland, Mississippi, North Carolina, Oklahoma, SouthCarolina, Tennessee, Texas, Virginia, and West Virginia and Washington, DC. NorthCentral states included Illinois, Indiana, Iowa, Kansas, Michigan, Minnesota, Missouri,Nebraska, Ohio, North Dakota, South Dakota, Wisconsin, and Wyoming. Western statesincluded Alaska, Arizona, California, Colorado, Hawaii, Idaho, Montana, Nevada, NewMexico, Oregon, Utah, and Washington. Northeastern states included Connecticut, Maine,Vermont, Massachusetts, New Hampshire, New Jersey, New York, Pennsylvania, andRhode Island.
Friedline, Johnson, Hughes
Federal Reserve Bank of St. Louis REVIEW Fourth Quarter 2014 383

Friedline, Johnson, Hughes
384 Fourth Quarter 2014 Federal Reserve Bank of St. Louis REVIEW
Appendix BGeneralized Additive Models Predicting Savings Account Ownership
Model A Model B
Covariates b SE b SE
Sex: MaleFemale 0.265*** (0.009) 0.161*** (0.065)
Race: WhiteNonwhite –0.480*** (0.013) –0.223*** (0.025)Asian –0.158*** (0.021) –0.045*** (0.042)
Marital status: Not marriedMarried 0.610*** (0.011) 0.387*** (0.021)
College enrollment: Full-time enrollment Part-time enrollment –0.061*** (0.022) 0.054 (0.044)Not enrolled –0.436*** (0.015) –0.208*** (0.031)
Education level: Primary schoolSome high school 0.209*** (0.031) –0.029 (0.058)High school diploma 0.965*** (0.028) 0.408*** (0.052)Some college 1.362*** (0.028) 0.630*** (0.052)College degree or more 1.743*** (0.029) 0.815*** (0.054)
Employment status: EmployedPartially employed –0.237*** (0.018) –0.230*** (0.036)Not employed –0.522*** (0.021) –0.382*** (0.038)
Household relationship to reference personChild –0.681*** (0.015) –0.285*** (0.030)Relative –0.044*** (0.010) 0.060*** (0.020)Nonrelative –0.412*** (0.022) –0.053 (0.048)
New reference person: FalseTrue –0.119*** (0.024) 0.052 (0.045)
Change in homeownership: Not a homeownerHomeowner –0.593*** (0.009) –0.286*** (0.018)
Geographic region: NortheastWest –0.161*** (0.013) –0.112*** (0.025)North Central –0.088*** (0.012) –0.094*** (0.024)South –0.457*** (0.012) –0.295*** (0.023)
Quarterly mean income spline 1 8.157*** (8.957) 5.124*** (6.206)Age spline 1 8.612*** (8.788) 8.079*** (8.772)Savings account (lagged) 5.081*** (0.016)Constant –0.026*** (0.034) –2.464 (0.065)R2 0.203 0.764
NOTE: The results in this table are from the reference month sample (n = 311,446 person-month observations; n = 30,601 individuals). Generalized additive models (GAMs) were performed on savings account ownership (regardlessof whether young adults had an account during the fourth reference month) with and without a lagged account variable(Wood, 2004, 2006, 2011). The lagged account variable measured whether young adults owned a savings account in apreceding quarter. These models were used to determine how young adults first acquired an account, as opposed to themore sensitive “no-to-yes” transition measured by the multinomial logit models in Table 3. The question of predictorsof account ownership logically preceded the question of account acquisition; however, account ownership was not aprimary focus of our article. Thus, the GAM results are provided here. As shown, for the differences in estimates betweenModels A and B, the lagged savings account was a dominant predictor that depressed all other estimates and contrib -uted an additional 56 percent to the variance in Model B. This finding provided some evidence to support the “sticki-ness” of savings account ownership across time. Young adults who had a savings account in one quarter were signifi-cantly more likely to maintain that account in the following quarter. *** indicates significance at the 1 percent level.
SOURCE: Unweighted data from the 1996 SIPP.

NOTES1 Xiao and Anderson (1997) also identify a third category of needs—“security”—or middle-level needs such as
saving for a home or investing in human capital. Certificates of deposit, bonds, and money market accounts arefinancial products theorized to be consistent with meeting these middle-level needs.
2 While the United States as a whole experienced macroeconomic growth evidenced in part by expanded produc-tivity (Jorgenson, Ho, and Stiroh, 2008), this growth did not necessarily translate into healthy balance sheets for allAmericans. For instance, in the late 1990s, younger households headed by individuals 42 years of age or youngerhad about 29 percent of the median net worth held by older households; female heads of households had about9 percent of the median net worth of male heads of households; black households had about 14 percent of themedian net worth held by white households; and heads of households with high school educations had about19 percent of the median net worth held by heads of households with college degrees (Friedline, Nam, and Loke,2014).
3 The median value presented here for liquid assets was provided after the value was winsorized (Cox, 2006).
4 Censored median regression was considered to analyze liquid assets, debt, and net worth at the annual level(Koenker, 2008); however, running the model in a reasonable amount of time given the large number of observa-tions was difficult with the R software. Censored median regression was abandoned as an analytic strategy after asingle model was not produced within five days.
5 The effect of the censored tobit regression on the prediction of liquid assets can be seen by comparing estimatesof “no account of any kind” from Model 6 with estimates from Models 4 and 5. The estimate for “no account of anykind” takes into consideration young adults who have no accounts and, thus, few to no accumulated liquid assets.In the censored tobit regression (Model 6), the estimate was steeper with a lower intercept or constant value (b = 0.580; SE = 0.285), indicating the technique’s attempt to minimize the effects of these values.
6 Notably, when we examined the relationship between age and savings account ownership using a predictedprobability scale from the generalized additive models (GAMs) that controlled for relevant factors, the age trenddisappeared. In other words, using this method, young adults at age 40 or 30 were no more likely to own a savingsaccount than young adults at age 20. These figures are available from the authors upon request.
REFERENCESAaronson, Daniel; Agarwal, Sumit and French, Eric. “The Spending and Debt Response to Minimum Wage Hikes.”American Economic Review, December 2012, 102(7), pp. 3111-39; doi:10.1257/aer.102.7.3111.
Agarwal, Sumit; Amromin, Gene; Ben-David, Itzhak; Chomsisengphet, Souphala and Evanoff, Douglas C. “PredatoryLending and the Subprime Crisis.” NBER Working Paper No. 19550, National Bureau of Economic Research,October 2013; http://www.nber.org/papers/w19550.pdf.
Angrist, Joshua D. “Estimation of Limited Dependent Variable Models with Dummy Endogenous Regressors: SimpleStrategies for Empirical Practice.” Journal of Business and Economic Statistics, January 2001, 19(1), pp. 2-28.
Assets and Education Initiative. “Building Expectations, Delivering Results: Asset-Based Financial Aid and the Futureof Higher Education,” in William Elliott, ed., Biannual Report on the Assets and Education Field. Lawrence, KS:Assets and Education Initiative, 2013; http://save4ed.com/wp-content/uploads/2013/11/Full-Report.pdf.
Bell, Lisa; Burtless, Gary; Gornick, Janet and Smeeding, Timothy M. “Failure to Launch: Cross-National Trends in theTransition to Economic Independence,” in Sheldon Danziger and Cecilia E. Rouse, eds., The Price of Independence:The Economics of Early Adulthood. Chap. 2. New York: Russell Sage Foundation, 2007, pp. 27-55.
Benartzi, Shlomo and Thaler, Richard. “Heuristics and Biases in Retirement Savings Behavior.” Journal of EconomicPerspectives, Summer 2007, 21(3), pp. 81-104.
Beutler, Ivan and Dickson, Lori. “Consumer Economic Socialization,” in Jing Jian Xiao, ed., Handbook of ConsumerFinance Research. Chap. 6. New York: Springer, 2008, pp. 83-102.
Black, Rachel. “Rebalancing the Scales: The 2015 Assets Budget.” Washington, DC: New America Foundation, March2014; http://newamerica.org/downloads/The_Assets_Budget_FY_2015.pdf.
Friedline, Johnson, Hughes
Federal Reserve Bank of St. Louis REVIEW Fourth Quarter 2014 385

Boshara, Ray. “From Asset Building to Balance Sheets: A Reflection on the First and Next 20 Years of Federal AssetsPolicy.” CSD Perspective 12-24. Center for Social Development, Washington University in St. Louis, June 2012,http://csd.wustl.edu/Publications/Documents/P12-24.pdf.
Canova, Luigiana; Rattazzi, Anna Maria Mangenelli and Webley, Paul. “The Hierarchical Structure of Saving Motives.”Journal of Economic Psychology, February 2005, 26(1), pp. 21-34; doi:10.1016/j.joep.2003.08.007.
Carasso, Adam and McKernan, Signe-Mary. “The Balance Sheets of Low-Income Households: What We Know aboutTheir Assets and Liabilities.” The Urban Institute, November 2007;http://aspe.dhhs.gov/hsp/07/PoorFinances/balance/report.pdf.
Carré, Françoise and Tilly, Chris. “Work Hours in Retail: Room for Improvement.” Policy Paper No. 2012-012, W.E.Upjohn Institute for Employment Research, 2012; http://research.upjohn.org/up_policypapers/12/.
Cooper, Daniel. “Changes in U.S. Household Balance Sheet Behavior after the Housing Bust and Great Recession:Evidence from Panel Data.” Public Policy Discussion Paper No. 13-6, Federal Reserve Bank of Boston, September 6,2013; http://bostonfed.org/economic/ppdp/2013/ppdp1306.pdf.
Cox, Nicholas J. “WINSOR: Stata module to Winsorize a Variable.” Boston College, Department of Economics, 2006;http://ideas.repec.org/c/boc/bocode/s361402.html#related.
Cramer, Reid; Black, Rachel and King, Justin. “The Assets Report 2012: An Assessment of the Federal ‘Asset-Building’Budget.” Washington, DC: New America Foundation, April 2012; http://assets.newamerica.net/sites/newamerica.net/files/policydocs/AssetsReport2012.pdf.
Cramer, Reid and Schreur, Elliot. “Personal Savings and Tax Reform: Principles and Policy Proposals for Reformingthe Tax Code.” Washington, DC: New America Foundation, July 2013; http://assets.newamerica.net/sites/newamerica.net/files/policydocs/Personal%20Savings%20and%20Tax%20Reform%207-19-13-formatted.pdf.
Curtin, Richard T.; Juster, F. Thomas and Morgan, James N. “Survey Estimates of Wealth: An Assessment of Quality,”in Robert E. Lipsey and Helen Stone Tice, eds., The Measurement of Saving, Investing, and Wealth. Chicago:University of Chicago Press, 1989, pp. 473-552; http://www.nber.org/chapters/c8126.pdf.
Czajka, John L.; Jacobson, Jonathan E. and Cody, Scott. Survey Estimates of Wealth: A Comparative Analysis and Reviewof the Survey of Income and Program Participation. Washington, DC: Mathematica Policy Research, August 22,2003; http://www.ssa.gov/policy/docs/contractreports/SurveyEstimatesWealth.pdf.
De Brouwer, Philippe J.S. “Maslowian Portfolio Theory: An Alternative Formulation of the Behavioral PortfolioTheory.” Journal of Asset Management, 2009, 9(6), pp. 359-65.
Fabozzi, Frank; Gupta, Francis and Markowitz, Harry M. “The Legacy of Modern Portfolio Theory.” Journal ofInvesting, Fall 2002, 11(3), pp. 7-22; doi:10.3905/joi.2002.319510.
Federal Deposit Insurance Corporation. History of the 80s: An Examination of the Banking Crises of the 1980s andEarly 1990s. Washington, DC: FDIC, 2007; https://www.fdic.gov/bank/historical/history/vol1.html.
Federal Deposit Insurance Corporation. 2011 FDIC National Survey of Unbanked and Underbanked Households.Washington, DC: Federal Deposit Insurance Corporation, September 2012; http://www.fdic.gov/householdsurvey/2012_unbankedreport.pdf.
Friedline, Terri; Despard, Mathieu R. and Chowa, Gina A.N. “Preventive Policy Strategy for Banking the Unbanked:Savings Accounts for Teenagers?” (Forthcoming in Journal of Poverty).
Friedline, Terri L. and Elliott, William. “Predicting Savings for White and Black Young Adults: An Early Look at RacialDisparities in Savings and the Potential Role of Children’s Development Accounts (CDAs).” Race and SocialProblems, July 2011, 3(2), pp. 99-118; doi:10.1007/s12552-011-9046-2.
Friedline, Terri and Elliott, William. “Connections with Banking Institutions and Diverse Asset Portfolios in YoungAdulthood: Children as Potential Future Investors.” Children and Youth Services Review, June 2013, 35(6), pp. 994-1006; doi:10.1016/j.childyouth.2013.03.008.
Friedline, Terri; Elliott, William and Chowa, Gina A.N. “Testing an Asset-Building Approach for Young People: EarlyAccess to Savings Predicts Later Savings.” Economics of Education Review, Special Issue: Assets and EducationalAttainment: Theory and Evidence, April 2013, 33, pp. 31-51; doi:10.1016/j.econedurev.2012.10.004.
Friedline, Johnson, Hughes
386 Fourth Quarter 2014 Federal Reserve Bank of St. Louis REVIEW

Friedline, Terri; Masa, Rainier D. and Chowa, Gina A.N. “Transforming Wealth: Using the Inverse Hyperbolic Sine(IHS) and Splines To Predict Youth’s Math Achievement.” Social Science Research, January 2015, 49, pp. 264-287;doi:10.1016/j.ssresearch.2014.08.018.
Friedline, Terri and Nam, IlSung. “Savings from Ages 16 to 35: A Test To Inform Child Development Account Policy.”Poverty and Public Policy, March 2014, 6(1), pp. 46-70.
Friedline, Terri; Nam, IlSung and Loke, Vernon. “Households’ Net Worth Accumulation Patterns and Young Adults'Financial Well-Being: Ripple Effects of the Great Recession?” Journal of Family and Economic Issues, September2014, 35(3), pp. 390-410; doi:10.1007/s10834-013-9379-7.
Friedline, Terri and Song, Hyun-a. “Accumulating Assets, Debts in Young Adulthood: Children as Potential FutureInvestors.” Children and Youth Services Review, September 2013, 35(9), pp. 1486-502. doi:10.1016/j.childyouth.2013.05.013.
Ham, John C.; Li, Xianghong and Shore-Sheppard, Lara. “Seam Bias, Multiple-State, Multiple-Spell Duration Modelsand the Employment Dynamics of Disadvantaged Women.” NBER Working Paper No. 15151. National Bureau ofEconomic Research, July 2009; http://www.nber.org/papers/w15151.pdf.
Henningsen, Arne. “Estimating Censored Regression Models in R Using the censReg Package.” University ofCopenhagen, 2010; http://cran.r-project.org/web/packages/censReg/vignettes/censReg.pdf.
Henningsen Arne. “censReg: Censored Regression (Tobit) Models.” R package version 0.5-20, August 20, 2013;http://CRAN.R-project.org/package=censReg.
Henningsen, Arne and Toomet, O. “maxLik: A package for maximum likelihood estimation in R.” ComputationalStatistics, 2011, 26(3), pp. 443-58; doi:10.1007/s00180-010-0217-1.
Hogarth, Jeanne M. and O’Donnell, Kevin H. “If You Build It, Will They Come? A Simulation of Financial ProductHoldings Among Low-to-Moderate Income Households.” Journal of Consumer Policy, December 2000, 23(4), pp. 409-44; doi:10.1023/A:1007222700931.
Honoré, Bo E.; Kyriazidou, Ekaterini and Powell, J.L. “Estimation of Tobit-Type Models with Individual Specific Effects.”Econometric Reviews, 2000, 19(3), pp. 341-66; doi:10.1080/07474930008800476.
Hosmer, David W. and Lemeshow, Stanley. Applied Logistic Regression. Second Edition. Hoboken, NJ: John Wileyand Sons, 2000.
Huang, Jin; Beverly, Sondra; Clancy, Margaret; Lassar, Terry and Sherraden, Michael. “Early Program Enrollment in aStatewide Child Development Account Program.” Journal of Policy Practice, 2013, 12(1), 62-81;doi:10.1080/15588742.2012.739124.
Huber, Peter J. “The Behavior of Maximum Likelihood Estimates Under Non-Standard Conditions,” in Proceedings ofthe Fifth Berkeley Symposium on Mathematical Statistics and Probability. Berkeley, CA: University of CaliforniaPress, 1967, pp. 221-33.
Jorgenson, Dale W.; Ho, Mun S. and Stiroh, Kevin J. “A Retrospective Look at the U.S. Productivity GrowthResurgence.” Journal of Economic Perspectives, Winter 2008, 22(1), pp. 3-24.
Keister, L. “Religion and Wealth: The Role of Religious Affiliation and Participation in Early Adult Asset Accumulation.”Social Forces, September 2003, 82(1), pp. 173-205.
Key, Clinton. “The Finances of Typical Households after the Great Recession,” in Reid Cramer and T. Williams Shanks,eds., The Assets Perspective: The Rise of Asset Building and Its Impact on Social Policy. New York: PalgraveMacmillan, 2014, pp. 33-66.
King, Mervyn A. and Leape, Jonathan I. “Wealth and Portfolio Composition: Theory and Evidence.” Journal of PublicEconomics, 1998, 69, pp. 155-93.
Koenker, Roger. “Censored Quantile Regression Redux.” Journal of Statistical Software, July 2008, 27(6), pp. 1-25.
Kochhar, Rakesh; Fry, Richard and Taylor, Paul. “Wealth Gaps Rise to Record Highs between Whites, Blacks, Hispanics:Twenty-to-One.” Washington, DC: Pew Charitable Trusts, Social and Demographic Trends, July 26, 2011; http://www.pewsocialtrends.org/2011/07/26/wealth-gaps-rise-to-record-highs-between-whites-blacks-hispanics/.
Maas, Cora J.M. and Hox, Joop J. “Robustness Issues in Multilevel Regression Analysis.” Statistica Neerlandica, May2004, 58(2), pp. 127-37.
Friedline, Johnson, Hughes
Federal Reserve Bank of St. Louis REVIEW Fourth Quarter 2014 387

Madrian, Brigitte C. and Shea, Dennis F. “The Power of Suggestion: Inertia in 401(k) Participation and SavingBehavior.” Quarterly Journal of Economics, 2001, 116(4), pp. 1149-87.
Markowitz, Harry. “Portfolio Selection.” Journal of Finance, December 1952, 7(1), pp. 77-91; doi:10.1111/j.1540-6261.1952.tb01525.x.
Maslow, Abraham H. “Some Theoretical Consequences of Basic Need-Gratification.” Journal of Personality, June 1948,16(4), pp. 402-16.
Maslow, Abraham H. Motivation and Personality. New York: Harper and Row, 1954.
Mishel, Lawrence; Bivens, Josh; Gould, Elise and Shierholz, Heidi. The State of Working America. Twelfth Edition.Ithaca, NY: Cornell University Press, 2012.
Mishkin, Frederic S. “The Household Balance Sheet and the Great Depression.” Journal of Economic History,December 1978, 38(4), pp. 918-37.
Moore, Jeffrey; Bates, Nancy; Pascale, Joanne and Okon, Aniekan. “Tackling Seam Bias through QuestionnaireDesign,” in Peter Lynn, ed., Methodology of Longitudinal Surveys. West Sussex, UK: John Wiley and Sons, Ltd.,2009, pp. 73-92.
Nam, Yunju; Kim, Youngmi; Clancy, Margaret; Zager, Robert and Sherraden, Michael. “Do Child DevelopmentAccounts Promote Account Holding, Saving, and Asset Accumulation for Children’s Future? Evidence from aStatewide Randomized Experiment.” Journal of Policy Analysis and Management, Winter 2013; 32(1), pp. 6-33;doi:10.1002/pam.21652.
Pence, Karen M. “The Role of Wealth Transformations: An Application to Estimating the Effect of Tax Incentives onSaving.” Contributions to Economic Analysis and Policy, July 2006, 5(1), pp. 1-24.
Pinheiro, José; Bates, Douglas; DebRoy, Saikat; Sarkar, Deepayan and R Core Team. nlme: Linear and NonlinearMixed Effects Models: Version 3.1-118. Vienna, Austria: R Foundation for Statistical Computing, October 7, 2014;http://cran.r-project.org/web/packages/nlme/index.html.
R Core Team. R: A Language and Environment for Statistical Computing. Vienna, Austria: R Foundation forStatistical Computing, 2014; http://www.R-project.org.
Rank, Mark R. and Hirschl, Thomas A. “Estimating the Life Course Dynamics of Asset Poverty.” CSD Working PaperNo. 10-25. Center for Social Development, Washington University in St. Louis, 2010;http://csd.wustl.edu/Publications/Documents/WP10-25.pdf.
Raudenbush, Stephen W. and Bryk, Anthony S. Hierarchical Linear Models: Applications and Data Analysis Methods.Second Edition. London: Sage, 2002.
Rhine, Sherrie L.W. and Greene, William H. “Factors That Contribute to Becoming Unbanked.” Journal of ConsumerAffairs, Spring 2013, 47(1), pp. 27-45.
Serido, Joyce; Shim, Soyeon; Mishra, Anabhu and Tang, Chuanyi. “Financial Parenting, Financial Coping Behaviors,and Well-Being of Emerging Adults.” Family Relations, October 2010, 59(4), pp. 453-64.
Shapiro, Thomas; Meschede, Tatjana and Osoro, Sam. “The Roots of the Widening Racial Wealth Gap: Explaining theBlack-White Economic Divide.” Research and Policy Brief February 2013. Institute on Assets and Social Policy,Brandeis University; http://iasp.brandeis.edu/pdfs/Author/shapiro-thomas-m/racialwealthgapbrief.pdf.
Sherraden, Michael. “Stakeholding: Notes on a Theory of Welfare Based Assets.” Social Service Review, December1990, 64(4), pp. 580-601.
Sherraden, Michael. Assets and the Poor: A New American Welfare Policy. Armonk, NY: M.E. Sharpe, 1991.
StataCorp. Stata Statistical Software: Release 12. College Station, TX: StataCorp LP, 2011.
Thaler, Richard H. and Sunstein, Cass R. Nudge: Improving Decisions about Health, Wealth, and Happiness. New York:Penguin Books, 2009.
Tobin, James. “Estimation of Relationships for Limited Dependent Variables.” Econometrica, January 1958, 26, pp. 24-36.
U.S. Census Bureau. SIPP Users’ Guide. Washington, DC: U.S. Census Bureau, Survey of Income and ProgramParticipation, 2011; http://www.census.gov/programs-surveys/sipp/methodology/users-guide.html#.
Friedline, Johnson, Hughes
388 Fourth Quarter 2014 Federal Reserve Bank of St. Louis REVIEW

White, Halbert. “Maximum Likelihood Estimation of Misspecified Models.” Econometrica, January 1982, 50(1), pp. 1-25.
Wolff, Edward. “Recent Trends in the Size Distribution of Household Wealth.” Journal of Economic Perspectives,Summer 1999, 12(3), pp. 131-50.
Woo, Beadsie; Rademacher, Ida and Meier, Jillien. “Upside Down: The $400 Billion Federal Asset-Building Budget.”Washington, DC: Corporation for Enterprise Development and the Annie E. Casey Foundation, 2010;http://cfed.org/assets/pdfs/UpsideDown_final.pdf.
Wood, Simon N. “Stable and Efficient Multiple Smoothing Parameter Estimation for Generalized Additive Models.”Journal of the American Statistical Association, 2004, 99(467), pp. 673-86.
Wood, Simon N. Generalized Additive Models: An Introduction with R. Boca Raton, FL: Chapman and Hall/CRC, 2006.
Wood, Simon N. “Fast Stable Restricted Maximum Likelihood and Marginal Likelihood Estimation ofSemiparametric Generalized Linear Models.” Journal of the Royal Statistical Society B, January 2011, 73(1), pp. 3-36.
Xiao, Jing J. and Anderson, Joan Gray. “Hierarchical Financial Needs Reflected by Household Financial AssetShares.” Journal of Family and Economic Issues, Winter 1997, 18(4), pp. 333-55.
Xiao, Jing J. and Noring, Franziska, E. “Perceived Saving Motives and Hierarchical Financial Needs.” Journal ofFinancial Counseling and Planning, 1994, 5, pp. 25-44.
Xiao, Jing J. and Olson, Geraldine I. “Mental Accounting and Saving Behavior.” Home Economics Research Journal,September 1993, 22(1), pp. 92-109; doi:10.1177/004677749302200105.
Friedline, Johnson, Hughes
Federal Reserve Bank of St. Louis REVIEW Fourth Quarter 2014 389

390 Fourth Quarter 2014 Federal Reserve Bank of St. Louis REVIEW