towards a fourth generation of pavement management - john
TRANSCRIPT

Towards a fourth generation of Pavement Management (Strains and Temperature)
Dr John Yeaman, [email protected] FTSE, F.I.E. (Aust), CPEng, RPEQ – Director Queensland Pavement Centre, University of the
Sunshine Coast, Queensland, Australia
Abstract
The University of the Sunshine Coast in association with Sunshine Coast Council has established a permanent pavement monitoring station on Sippy Downs Drive adjacent to the University campus. Pavement and weather is monitored minute by minute 24/7. After 500 days, results are showing us the way towards a fourth generation Pavement Management and a new look at pavement engineering. This paper details our conclusions after 500 days and how they may affect pavement operation and renewal technology in the future.
Take home message:
• Critical Strains are a function of pavement tempera ture at the depth of asphalt.
• The case of a single temperature for pavement desi gn is bound to overestimate pavement design thicknesses
• Pavements cool slower than they heat thus critical strains may occur after sunset
Introduction
“All Mechanistic-Empirical methods are simplifications of reality and must be validated/calibrated against the behaviour of real pavement. This should be done before implementing, models in design methods to ensure that designs will be reasonable” ref 1.
The Queensland Pavement Centre of the University of the Sunshine Coast (USC) has taken up this challenge and in 2012 and in association with the Sunshine Coast Council (SCC) and Pavement Management Services (PMS) constructed a pavement monitoring site on Sippy Downs Drive adjacent to the University campus, during the upgrade of the road to an Arterial Road.
For six weeks after installation, and a period of hot dry weather, data relating to temperatures, moisture contents, surface layer and subgrade strains was transmitted minute by minute 24 hours per day seven days per week to this researchers desk. On 26th January 2013, the remnants of tropical cyclone “Oswald” dumped in excess of 500mm of rain on the site over a period of 3 days. The outcomes from this event have been reported separately by Fairweather (ref 2) and Azawi (ref 3), from which it was concluded that we needed to understand more about the climatic conditions impacting on gathering such site information.
Accordingly, in April 2013 further equipment was added to the site by PMS including:

Page | 2
• A camera to monitor high strain impacts at both the underside of the bound layer and top of the subgrade.
• A composite weather station including: o Rain Gauge - hourly o Wind Speed and Direction - minute o Humidity - minute o Air Pressure - minute o Air Temperature – minute o Road Surface Temperature – minute o Solar Radiation – minute
• This supplemented the data already being monitored: o Surface Layer Temperature o Strain at the underside of the bound layer (AC) o Strain at the top of the subgrade layer (Granular material) o Moisture contents at the underside of the surface layer o Moisture contents at the top of the subgrade layer
The system has now been in operation for 500 days and patterns are developing and being studied by Final year and Higher Degree by Research (HDR) students with a view to incorporating the outcomes into a pavement operation and renewal method which can be undertaken using the University’s new “3D Immersive Environment Learning Hub to be commissioned early 2015”.
This paper describes the findings to date and discusses one aspect of the study; that of the variation in strains with temperature changes and time.
The paper postulates how these results may become the base method for future pavement operation and renewal methods.
What do we assume?
The deterioration of a pavement in service is predicated on three fundamental assumptions:
1. Damage to a flexible pavement is a function of the dual wheels of a single axle truck (loaded to 9.2 tonnes on the rear axle), with the dual tyres separated a distance of 300mm and inflated to a tyre pressure of 760 KPa.
2. Permanent deformation of the subgrade is a function of accumulated vertical compression strain(εc), caused by passage of the standard vehicle, where the number of cycles to failure is given by:
a. Where i. N= the number of cycles to failure ii. µε is the vertical compressive strain on the subgrade, derived by a
mathematical model based on theory proposed by Boussinesq in the 19th Century and calculated by specialist software such as CIRCLY™
3. Fatigue Cracking of a bound layer is a function of the accumulated horizontal tensile strain (εt) at the underside of the bound layer (either asphalt or cement treated), caused by the passage of the standard vehicle, where the number of cycles to failure
is given by:
Equation 1
Equation 2

Page | 3
a. Where: i. N= the number of cycles to failure ii. RF is a reliability factor, chosen by the designer iii. Vb = The Voids filled by bitumen in the specified Asphalt Mix iv. S mix = The Stiffness of the specified Asphalt Mix (in MPa)
1. Smix may be calculated using the Shell Method (ref 7) or by measurement using such devices as repeat load triaxial testing or indirect tensile strength tests such as the Matta.
This implies that for 1,000,000 Standard Axle Repetitions (SAR) the endurance limit for subgrade Compression Strain is 1293 µε and for Asphalt surface layer fatigue (12% Voids filled by Bitumen and 4500 MPa Stiffness) the Horizontal Tensile Strain is 217 µε
• Whereas if the Voids filled by bitumen rises to 13% and the stiffness drops to 3,500 MPa the critical strain is 257 µε for Examples vide Figures 1 and 2.
• For the nominated Design Traffic Intensity for Sippy Downs Drive of 4.2 *10^E7 Equivalent Standard Axles (personally communicated by Greg Gregoriou at SCC) the endurance limits are 112 µε for fatigue and 750 µε for permanent deformation of the subgrade respectively.
Figure 1, Critical Strain for Asphalt Concrete Fati gue

Page | 4
Figure 2, Critical Strains for Subgrade Rutting
There are, however other important parameters that are rarely given much thought by some pavement designers:
1. Asphalt is a viscoelastic material with stiffness (Smix in equation 2) changing as temperature changes. One number (known as the Mean Monthly Average Pavement Temperature – MMAPT) is adopted for a location. For example, when designing a pavement for Sippy Downs Drive the MMAPT for the site is that for Nambour and Caloundra (31°C).
2. The value for stiffness used within the calculation for remaining life. Calculations can vary from a nomograph (Shell Method), by measurement; Indirect methods such as Indirect Tensile Test or repeat load triaxial test. In the case of the measurement, what is the appropriate time of loading (frequency)?
The Pavement Monitoring Station on Sippy Downs Driv e
During our first CPD seminar at USC in May 2012, hosted by Prof Susan Tighe of the University of Waterloo, Canada, the writer was approached by an officer of the Sunshine Coast Council (SCC) with a suggestion that it may be appropriate for the University to instrument Sippy Downs Drive adjacent to the University’s entrance during the construction of an upgrade to the facility from a two lane collector to a four lane sub-arterial. Council would provide the instrumentation and the University would provide the installation, calibration and ongoing monitoring for the life of the instrumentation. The proposal was immediately accepted by the author and a final year student tasked to sourcing equipment, installing and commissioning it. Calibration was outsourced to Pavement Management Services (PMS) a consulting business attached to the Innovation Centre of USC.
Initially the site comprised of Strain Gauges, thermocouples and moisture gauges at the underside of the bound layer, and top of the subgrade. The system was commissioned simultaneously with the opening of the road to traffic (22 December, 2012). An extreme weather event six weeks, later, over the Australia Day weekend dumped in excess of 500mm of rain on the site over three days but we had little idea of the overall climatic parameters at that time.

Page | 5
Calibration of Instrumentation
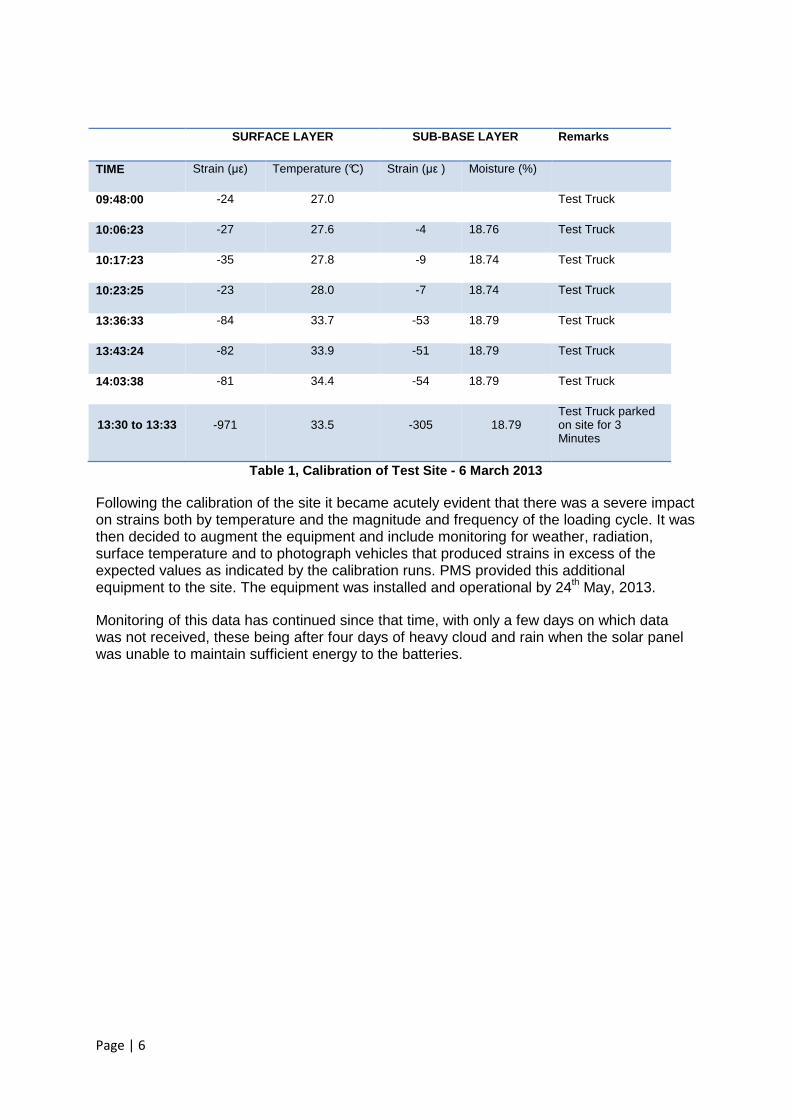
On the 6th March, 2013 SCC provided a test truck that was loaded with 9.2 tonnes on the rear axle, of dual wheels and tyres inflated to 760 KPa i.e. a Standard Axle Loading.
This vehicle made seven passes over the test instruments (four in the morning and three in the afternoon); data was recorded from each pass.
In addition, the truck was held stationary over the site for three minutes between 13:30 and 13:33 and the strains measured and recorded with the following results.
Page | 6
SURFACE LAYER SUB-BASE LAYER Remarks
TIME Strain (µε) Temperature (°C) Strain (µε ) Moisture (%)
09:48:00 -24 27.0 Test Truck
10:06:23 -27 27.6 -4 18.76 Test Truck
10:17:23 -35 27.8 -9 18.74 Test Truck
10:23:25 -23 28.0 -7 18.74 Test Truck
13:36:33 -84 33.7 -53 18.79 Test Truck
13:43:24 -82 33.9 -51 18.79 Test Truck
14:03:38 -81 34.4 -54 18.79 Test Truck
13:30 to 13:33 -971 33.5 -305 18.79 Test Truck parked on site for 3 Minutes
Table 1, Calibration of Test Site - 6 March 2013
Following the calibration of the site it became acutely evident that there was a severe impact on strains both by temperature and the magnitude and frequency of the loading cycle. It was then decided to augment the equipment and include monitoring for weather, radiation, surface temperature and to photograph vehicles that produced strains in excess of the expected values as indicated by the calibration runs. PMS provided this additional equipment to the site. The equipment was installed and operational by 24th May, 2013.
Monitoring of this data has continued since that time, with only a few days on which data was not received, these being after four days of heavy cloud and rain when the solar panel was unable to maintain sufficient energy to the batteries.

Page | 7
Typical Daily Data
Data is delivered to the writer’s desk at 06:00 daily. It is also available instantaneously via an internet connection on his iPod (figure 3). The data is 15 Columns wide and 1441 rows – an example follows in Appendix A.
Each day this data is consolidated into a Daily Report.
Figure 3, Data Mimics - instantaneous results via i nternet
Figure 4, 24 Hour Strain Data

Page | 8
Figure 5, Road Surface Temperature and Solar Radiat ion - 24 hours

Page | 9
Sippy Downs Drive Monitoring Station
Result Sheet
Parameter Time Temperature Remarks
Tension to Compression
All in Tension
Compression to Tension
All in Tension
Maximum Strain 15:56 30.7°C -40 µε
Minimum Strain 09:02 19.1°C -101
Maximum S. L. Temperature
15:48 30.8°C -58 µε
10:00am data
SL Temp (°C) SL Strain ( µε) SL Moisture (volts) Sub Base Strain (µε) Sub Base Moisture (volts)
21.4 -89 2.64 -30 2.35
Air Temp
(°C)
Road Surface Temp- (°C)
Radiation (w/m2) Humidity (%) Rainfall (mm)**
16.1 22.8 713 39.8 0
• ** Current 24 hours 3:30pm data
SL Temp (°C) SL Strain ( µε) SL Moisture (volts) Sub Base Strain (µε) Sub Base Moisture (volts)
30.9 -55 2.65 -42 2.35
Air Temp
(°C)
Road Surface Temp- (°C)
Radiation (w/m2) Humidity (%) Rainfall
10:00 to 15:30
19.5 25.0 10` 33.7 0
Strain / Temperature relationship
Item From To Total time Temp change
Rate of Change
dε/dϴ offset R2 Hrs. °C Hrs. °C hr min
°C °C per hour
Time Temp Time Temp
COOLING 15:48 30.8 06:00 17.5 14 12 13.3 0.94 3.41 -152 0.93
HEATING 07:03 17.2 15:48 30.8 8 45 13.6 1.55 3.26 -154 0.88
DAY 500
5 May 14

Page | 10
Radiation
Maximum Radiation of 847 Watts / m2 occurs at 11:54
From To Hrs. Min Minutes Total Radiation
06:01 17:36 11 35 695 322,363
Average radiation = 463 watts /m2/min or 27.8 KWH /m2
Figure 6, Daily Result Sheet
Figure 7, Strain v Temperature - Daily results
Figure 8, Strain Profile Trend lines

Page | 11
Figure 9, Radiation & Temperatures
Figure 10, Temperature as a function of Cumulative Radiation

Page | 12
Figure 11, Surface Layer Temperature as a function of Temperature
Figure 12, Road Surface Temperature as a function o f Accumulated Radiation

Page | 13
Discussion – The First 500 days
Accumulating Strain
Critical strains (horizontal tensile strain at the underside of the bound layer and vertical compressive strain at the top of the subgrade have been monitored every day at 10:00am at which time a photograph of the pavement is also acquired. The photograph is correlated with the complete condition data to ascertain changes in the condition which may signal advanced deterioration.
More recently, a second set of data is being acquired at 3:30pm as it has been established that this is around the time of maximum surface layer temperature, maximum surface layer strain and minimum sub base layer strain.
After 500 days, there is clear evidence that both strains are accumulating (in accordance with the theory) but faster than may be predicted by Equations 1 and 2 (above).
Figure 13, Accumulated Strains as a function of age
Based on the Standard Axle Repetitions computed to data we have seen above that the endurance limits for 40 million SAR would be -112 µε and + 750 µε for surface layer and sub base layer strains respectively. Therefore for 400,000 SAR (about 1%) we can see that in this case that the traffic to date (subject to temperature correction) has consumed about half of the theoretical endurance limit. This has been confirmed by the identification of minor cracking on 18th April, 2014. Clearly a Sub Base strain is not yet an issue.
Weighted Mean Average Pavement Temperature (WMAPT)
Page 185 of the Austroads design guide (ref 7) gives the WMAPT for Nambour and Caloundra as 31°C. This is the single number that i s used for designing a pavement at Sippy Downs Drive.
One thousand four hundred and forty one (1441) results per day for Air temperature, Road surface temperature and Surface layer temperature have been obtained between 24 May 2013 and 5 May, 2014. These have been analysed statistically by Dr Aaron Wiegand – Senior Lecturer in Mathematics USC with the following results:

Page | 14
Data Base Mean 5th Percentile 95th Percentile
All data 30.26 17.8 44.8
May 2013 21.7 16.6 28.5
June 2013 20.1 15.1 26.2
July 2013 20.8 16.5 26.8
August 2013 24.6 17.5 33.2
September 2013 29.2 21.8 38.9
October 2013 34.3 26.6 44.3
November 35.0 26.2 46.3
December 2013 37.8 29.1 48.9
January 2014 37.6 29.8 48.8
February 2014 36.2 28.5 47.2
March 2014 33.0 26.1 42.8
April 2014 29.9 23.9 37.9
Table II, Seasonal values for WMAPT - Sippy Downs
Clearly, it is not competent engineering to use one only temperature (i.e. 31°C) for pavement designs. All designs should be adjusted for critical strains on a seasonal basis. This is one of the major conclusions of this study to date.
Effect of Surface Layer Temperature on Critical Str ains
This was first observed in the calibration study of the site. A test truck loaded to a standard axle configuration made passes over the test site which was recorded by the instrumentation both during the morning and afternoon. What can be seen here is a considerable difference between surface layer temperatures at both periods (which is to be expected) but with a corresponding difference between critical strains as well (Table 1).
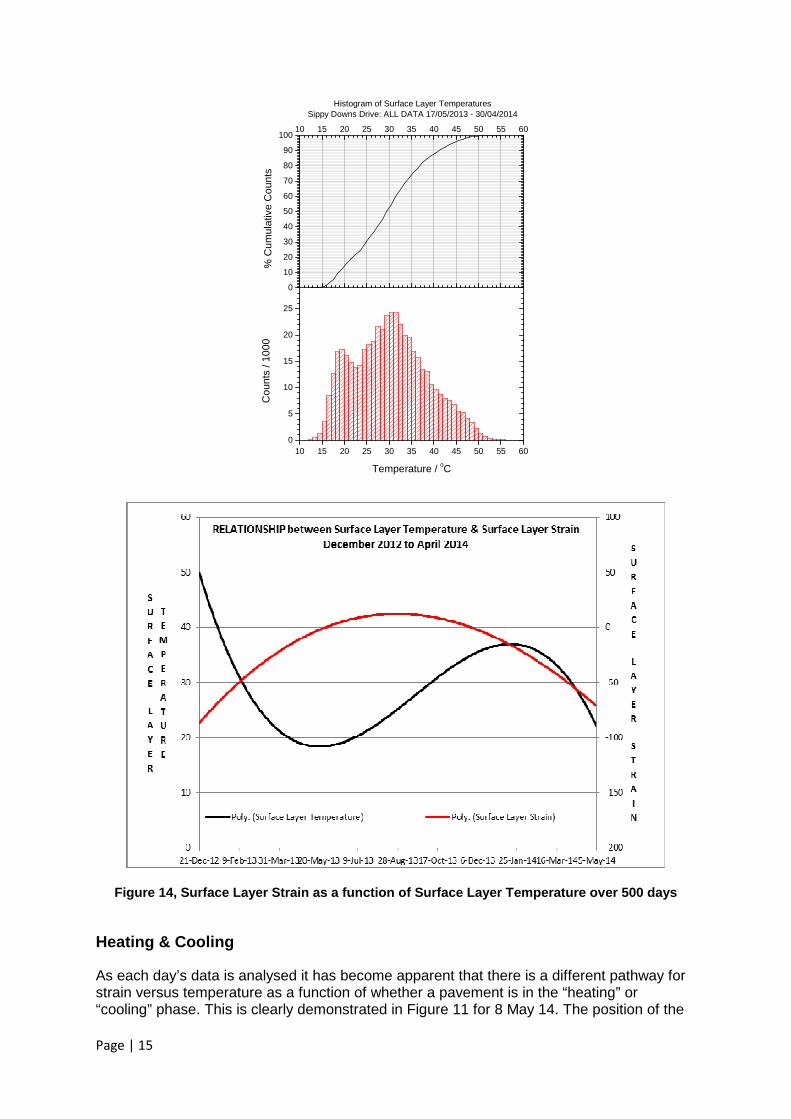
Data has been reconciled between surface layer temperature and surface layer strain at the test site since Day 1. In figure 14, following it can be seen from the Strain Profile that there is an anomaly above 40°C where the nature of the st rain changes from Tension to compression. This has been noted in the daily data analysis and is a prominent feature of the data in the hotter months of October through February. Clearly, increasing surface layer temperature reflects decreasing value for critical strains. 63,599 out of 484,036 data points (13%) exceed the 40°C critical value.
Page | 15
0
10
20
30
40
50
60
70
80
90
10010 15 20 25 30 35 40 45 50 55 60
10 15 20 25 30 35 40 45 50 55 600
5
10
15
20
25
Histogram of Surface Layer TemperaturesSippy Downs Drive: ALL DATA 17/05/2013 - 30/04/2014
Cou
nts
/ 100
0
Temperature / oC
% C
umul
ativ
e C
ount
s
Figure 14, Surface Layer Strain as a function of Su rface Layer Temperature over 500 days
Heating & Cooling
As each day’s data is analysed it has become apparent that there is a different pathway for strain versus temperature as a function of whether a pavement is in the “heating” or “cooling” phase. This is clearly demonstrated in Figure 11 for 8 May 14. The position of the

Page | 16
curves moves according to the seasonal temperature range (Table 2). This information has stimulated a further study into the Thermal Properties of Asphalt, including, thermal conductivity, emissivity and albedo.
Since February 2014, we have been tracking the quantum of heat developed in the pavement on a daily basis together with the ratio of heating to cooling with the following results, from which it can be seen that a pavement heats at about twice the rate that it cools.
Month Mean Daily Cooling °C
Mean Daily Heating °C
Ratio
Rate of Heating to rate of Cooling
February 2014 13.5 11.8 2.02
March 2014 13.1 11.8 2.21
April 2014 11.8 11.7 1.73
May 2014 10.1 10.3 1.92
Table 3, Range of Heating and Cooling temperatures measured for Sippy Downs Drive
The following demonstrates a calorimeter box that has been developed to validate the temperature of an asphaltic material at depth as a function of the transfer of heat from the surface of the pavement on Sippy Downs Drive. This is part of a final year capstone project and will include two separate mixes from Brisbane City Council. A second group will determine the Asphalt Master curves under different types of compaction for the same materials.

Page | 17
Thermocouple holes & depth Gauge Thermocouple depth
Calorimeter Box INFRARED Heating element
Hypotheses
The following hypotheses will be tested over the next two years and with four more monitoring sites:
1. Surface layer strain is controlled by surface layer temperature and will vary between the heating and cooling cycles of a road pavement.
2. Surface Layer Strain accumulates in a road pavement as a function of aging (i.e. Traffic volumes) and temperature. Actual strain needs to be normalised to a seasonal temperature relevant to the site conditions.
3. Surface Layer temperatures are a function of the accumulated radiation during daylight hours. Pavements appear to heat at twice the speed of cooling, irrespective of the quantum of heat absorbed by the pavement, in the daily cycle.
4. Operating temperatures for asphalt pavements vary with the season and pavement designs should be bases on the linear summation of cycle ratios for each season such
that

Page | 18
References
1 Ullidtz P, Harvey J, Kanekanti V, Tsai , B. Monismith C “Calibration of mechanistic- Empirical Models Using the California Heavy Vehicle Simulators” International Society for Asphalt Pavements 10th International conference on Asphalt Pavements – 2006 – Quebec City
2 Fairweather H “a study of the parameters affecting the performance of roads under an extreme rainfall event” 3rd International Conference on Geotechnique, Construction, Materials & Environment – Nagoya, Japan, 2012
3 Azawi K –“Intelligent pavements through instrumentation – Early results following an extreme rainfall event” paper submitted to ARRB 26 Conference Sydney 2014
4 Pearson D “Deterioration and Maintenance of Pavements“ ICE publishing 2012
5 Brown S – 1972 “Computations of Stresses and Strains for the Design of Flexible Pavements” publ Transportation Research Board
6 Ullidtz P , Harvey J, Kanekanti V, Tsai BW, Monismith C – 2006 “Calibration of Mechanistic- Empirical Models Using the California Heavy Vehicle Simulators. Transportation Research Board Vol 2 pp 454-465
7 Austroads “A guide to Pavement Technology Pert 2: Pavement Structural Design” 2010 p 185
Author Biography
Dr John Yeaman is a Fellow of the Australian Academy of Technological Scientists and Engineers (FTSE), a fellow of Engineers Australia, a Chartered Professional Engineer and a Registered Professional Engineer Queensland.
He currently is Professor of Engineering Construction at the University of the Sunshine Coast following 50 years in industry, including 30 years as Principal Engineer of his own consulting practice which he sold to an International consultancy in 2008.
John has served on numerous Australian Standards committees; 24 years’ service on Engineers Australia – Universities Accreditation Board, the NSW committee of ATSE. He was a founding member of the International Society for Asphalt Pavements and is a life member of the Association of Asphalt Paving Technologists.
Within excess of 10 years working in foreign countries John is passionate about Engineering Education and the necessity for the registration of Engineers to practice.
Postal Address : Professor John Yeaman, University of the Sunshine Coast, Faculty of Science, Health, Education and Engineering, Locked Bag 4, MAROOCHYDORE DC QLD 4558. E-mail : [email protected]

Page | 19