towards biophysical mapping of major ecosystems 1 · pdf file1 towards biophysical mapping of...
TRANSCRIPT
Towards biophysical mapping of ecosystems – 15.08.2012 1
Towards biophysical mapping of major ecosystems Draft proposal
1
Key objective
Developing a European approach for spatial representation of main
biophysical complexes providing quantitative aspect of ‘state of ecosystems’.
Specific objectives
Providing response to policy requirement ‘mapping ecosystems’ (i.e. EU
Biodiversity Strategy to 2020).
Taking stock of existing EEA reporting on ecosystems (e.g. Baseline 2010),
available European data sets (e.g. Corine Land Cover) and European habitat
lists (e.g Habitats Directive Annex I, EUNIS).
Creating links to ecosystem assessment, mapping of ecosystem services and
ecosystem capital accounting approaches, as they evolve in other work areas.
Outcome
Overall EEA proposal for implementing ‘ecosystem mapping’ at European level.
1 Contact Andrus Meiner and Branislav Olah
Towards biophysical mapping of ecosystems – 15.08.2012 2
1. What is ‘ecosystem’ and what is ‘mapping’?
1.1 Definition of ecosystem
Ecological science defines ecosystem as a complex of living organisms with their
environment and their mutual relations. Although, this definition applies to all
hierarchical levels (from a single microorganism’s ecosystem to Earth’s biomes), for
practical reasons local (habitat, biotope) or landscape level ecosystems are mapped
and assessed (Box 1).
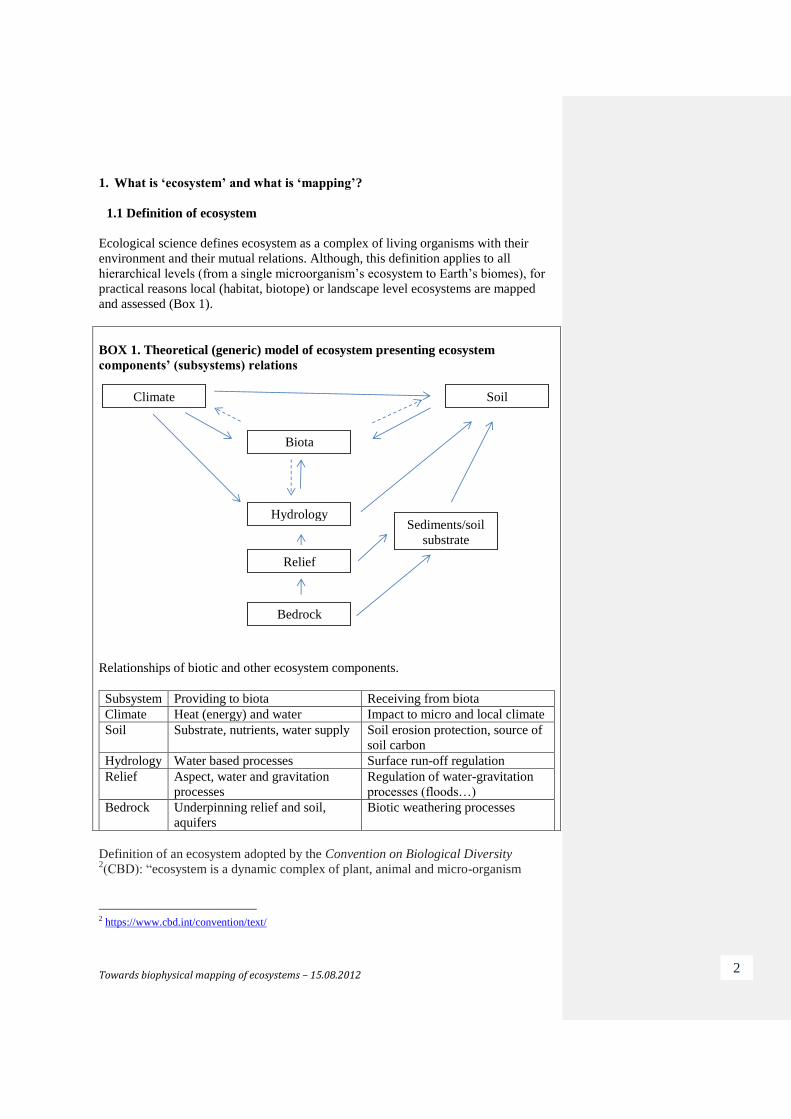
BOX 1. Theoretical (generic) model of ecosystem presenting ecosystem
components’ (subsystems) relations
Relationships of biotic and other ecosystem components.
Subsystem Providing to biota Receiving from biota
Climate Heat (energy) and water Impact to micro and local climate
Soil Substrate, nutrients, water supply Soil erosion protection, source of
soil carbon
Hydrology Water based processes Surface run-off regulation
Relief Aspect, water and gravitation
processes
Regulation of water-gravitation
processes (floods…)
Bedrock Underpinning relief and soil,
aquifers
Biotic weathering processes
Definition of an ecosystem adopted by the Convention on Biological Diversity 2(CBD): “ecosystem is a dynamic complex of plant, animal and micro-organism
2 https://www.cbd.int/convention/text/
Bedrock
Relief
Biota
Soil
Hydrology Sediments/soil
substrate
Climate
Towards biophysical mapping of ecosystems – 15.08.2012 3
communities and their non-living environment interacting as a functional unit”
(United Nations 1992:Article 2).
Definition by Millennium Ecosystem Assessment (MEA3): A practical approach to the
‘spatial delimitation of an ecosystem’ is to build up a series of overlays of significant
factors, mapping the location of discontinuities, such as in the distribution of
organisms, the biophysical environment (soil types, drainage basins, depth in a water
body), and spatial interactions (home ranges, migration patterns, fluxes of matter).
A useful ecosystem boundary is the place where a number of these relative
discontinuities coincide. Ecosystems within each category share a suite of biological,
climatic, and social factors that tend to differ across categories. More specifically,
there generally is greater similarity within than between each category in:
climatic conditions;
geophysical conditions;
dominant use by humans;
surface cover (based on type of vegetative cover in terrestrial ecosystems or on
fresh water, brackish water, or salt water in aquatic ecosystems);
species composition;
resource management systems and institutions.
The EU Habitats Directive4does not define ecosystems but natural habitats: natural
habitats mean terrestrial or aquatic areas distinguished by geographic, abiotic and
biotic features, whether entirely natural or semi-natural.
1.2 Mapping of ecosystems
Ecosystem mapping is spatial delineation of ecosystems following agreed ecosystem
classification (ecosystem types). Ecosystem classification strongly depends on
mapping purpose and scale. Mapping in broader sense may also include mapping of
status or health as the result of monitoring of ecosystems’ quality.
Global approaches to ecosystem classification and mapping (or reporting) apply two
basic principles: typological and regional (or their combination) (ANNEX 1).
Typological approach divides nature into ecosystem types – classes that can occur at
more geographical locations (i.e., temperate broadleaf and mixed forests). Regional
approach describes ecosystems from a regional (spatially unique) perspective (i.e.,
Dinaric mixed forests).
In the context of policy e.g. EU Biodiversity 2020 Strategy, ecosystem mapping also
has to satisfy management perspective and is largely determined by data availability.
In the absence of agreed and regularly updated European ecosystem map, the task of
mapping could be interpreted as aggregation of some proxy spatial information that
describes as good as possible the biophysical complex on the ground surface and
3 http://millenniumassessment.org/documents/document.300.aspx.pdf
4 http://eur-lex.europa.eu/LexUriServ/LexUriServ.do?uri=CONSLEG:1992L0043:20070101:EN:PDF
Towards biophysical mapping of ecosystems – 15.08.2012 4
adequate representation in the seas. Such mapping should aim at providing
quantitative aspects of ‘state of ecosystems’.
For practical purpose and strong links to the emerging GMES Land monitoring
services, the proposed method of ecosystem mapping is based on the EU Biodiversity
2010 Baseline approach. This implies that CORINE land cover classes as used in
GMES are aggregated in most meaningful way to represent broad-scale ecosystem
areas. This aggregation is based on detailed expert analysis of relations between land
cover classes and habitat classification systems (i.e. EUNIS) to ensure consistency
between these approaches. The resulting cross-walk schema is used as look-up table
for spatial re-aggregation of land cover units in to broad-scale ecosystems suitable for
European ecosystems assessment (ANNEX 3).
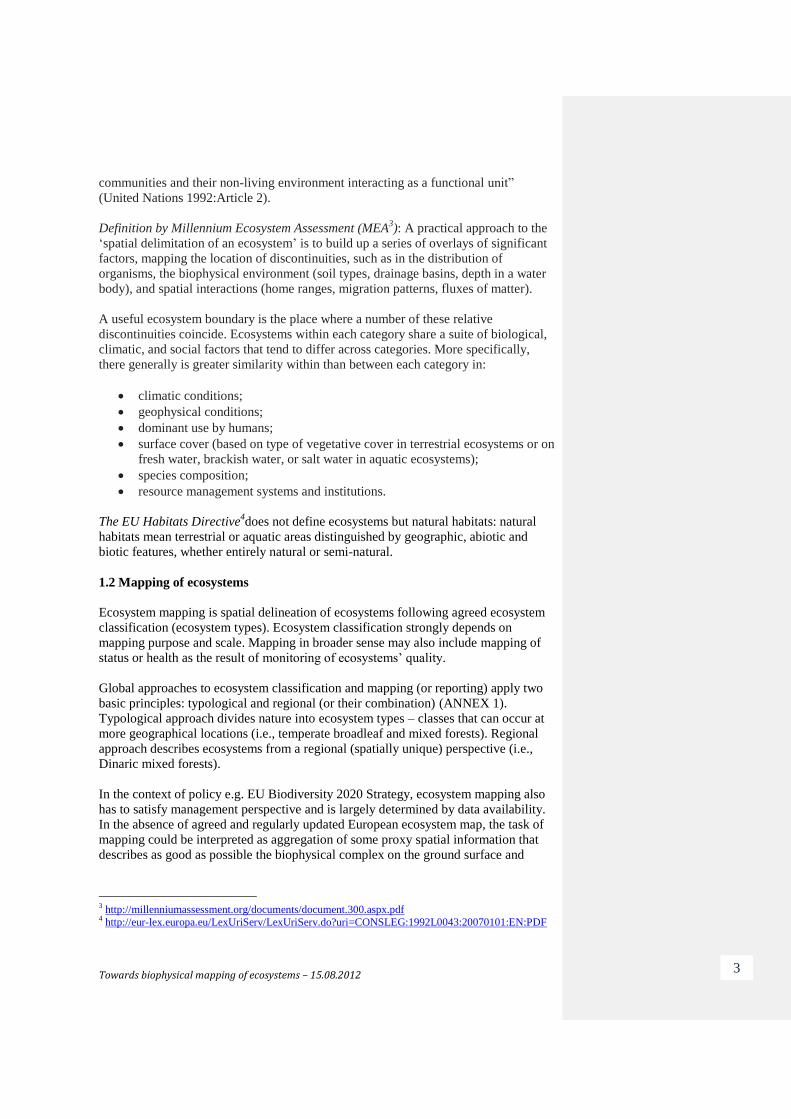
Ecosystem mapping approach also has to be practical for setting up ecosystem
accounting. For that reason, constructed broad-scale ecosystem zones are converted in
to reference grid of 1 km2 cells (based on respective INSPIRE specifications).
Records of ecosystems presence and where possible, key qualitative properties, in
each cell across Europe provides direct input layer for accounting systems and enables
assessment of ecosystems and their services (Fig 1).
Figure 1. Concept for ecosystem mapping at European scale
CORINE LC 2006
Ecosystem assessments
Reference grid of 1 km2
cells
Broad-scale ecosystem
areas
Ecosystem accounts
EUNIS and HD
directive
Drivers, pressures, responses
CORINE LC /
EUNIS Cross-walk
Concept for ecosystem mapping at European scale
Stocks for 1990, 2000, 2006 and 2012 (foreseen)
Reporting WFD, MSFD
HD Art17
Reporting deadlines (various)
Annual statistics
Towards biophysical mapping of ecosystems – 15.08.2012 5
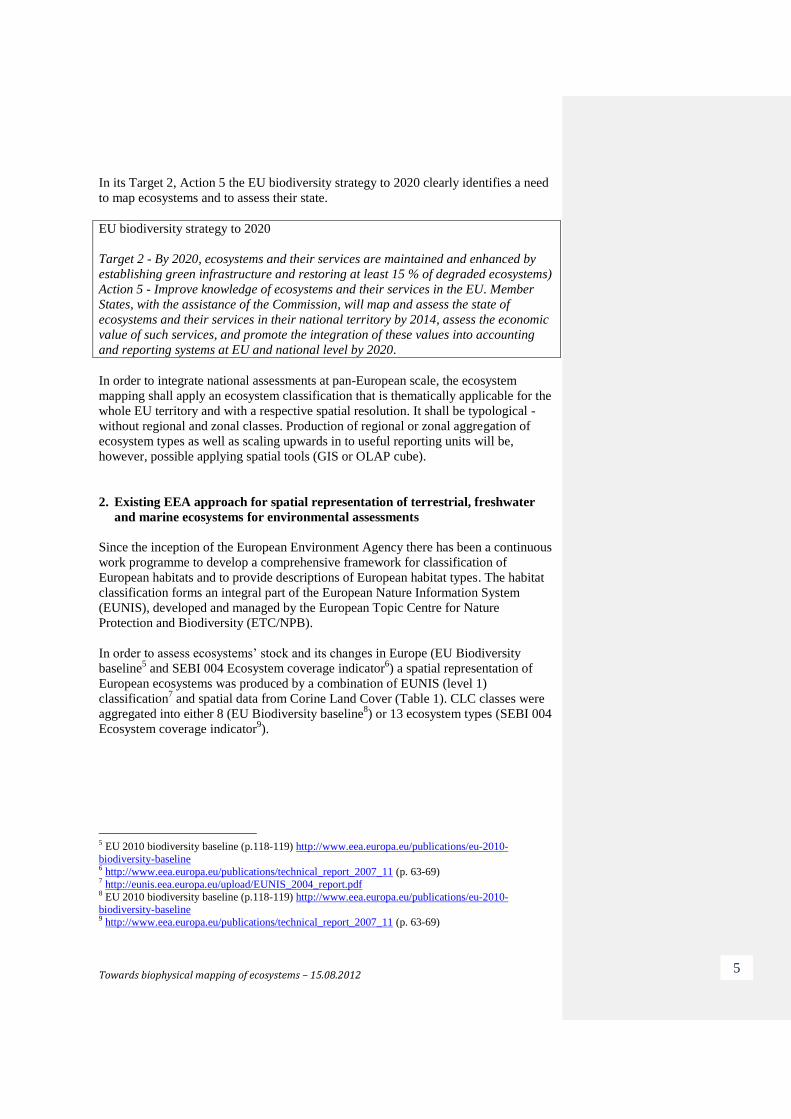
In its Target 2, Action 5 the EU biodiversity strategy to 2020 clearly identifies a need
to map ecosystems and to assess their state.
EU biodiversity strategy to 2020
Target 2 - By 2020, ecosystems and their services are maintained and enhanced by
establishing green infrastructure and restoring at least 15 % of degraded ecosystems)
Action 5 - Improve knowledge of ecosystems and their services in the EU. Member
States, with the assistance of the Commission, will map and assess the state of
ecosystems and their services in their national territory by 2014, assess the economic
value of such services, and promote the integration of these values into accounting
and reporting systems at EU and national level by 2020.
In order to integrate national assessments at pan-European scale, the ecosystem
mapping shall apply an ecosystem classification that is thematically applicable for the
whole EU territory and with a respective spatial resolution. It shall be typological -
without regional and zonal classes. Production of regional or zonal aggregation of
ecosystem types as well as scaling upwards in to useful reporting units will be,
however, possible applying spatial tools (GIS or OLAP cube).
2. Existing EEA approach for spatial representation of terrestrial, freshwater
and marine ecosystems for environmental assessments
Since the inception of the European Environment Agency there has been a continuous
work programme to develop a comprehensive framework for classification of
European habitats and to provide descriptions of European habitat types. The habitat
classification forms an integral part of the European Nature Information System
(EUNIS), developed and managed by the European Topic Centre for Nature
Protection and Biodiversity (ETC/NPB).
In order to assess ecosystems’ stock and its changes in Europe (EU Biodiversity
baseline5 and SEBI 004 Ecosystem coverage indicator
6) a spatial representation of
European ecosystems was produced by a combination of EUNIS (level 1)
classification7 and spatial data from Corine Land Cover (Table 1). CLC classes were
aggregated into either 8 (EU Biodiversity baseline8) or 13 ecosystem types (SEBI 004
Ecosystem coverage indicator9).
5 EU 2010 biodiversity baseline (p.118-119) http://www.eea.europa.eu/publications/eu-2010-
biodiversity-baseline 6 http://www.eea.europa.eu/publications/technical_report_2007_11 (p. 63-69)
7 http://eunis.eea.europa.eu/upload/EUNIS_2004_report.pdf
8 EU 2010 biodiversity baseline (p.118-119) http://www.eea.europa.eu/publications/eu-2010-
biodiversity-baseline 9 http://www.eea.europa.eu/publications/technical_report_2007_11 (p. 63-69)
Towards biophysical mapping of ecosystems – 15.08.2012 6
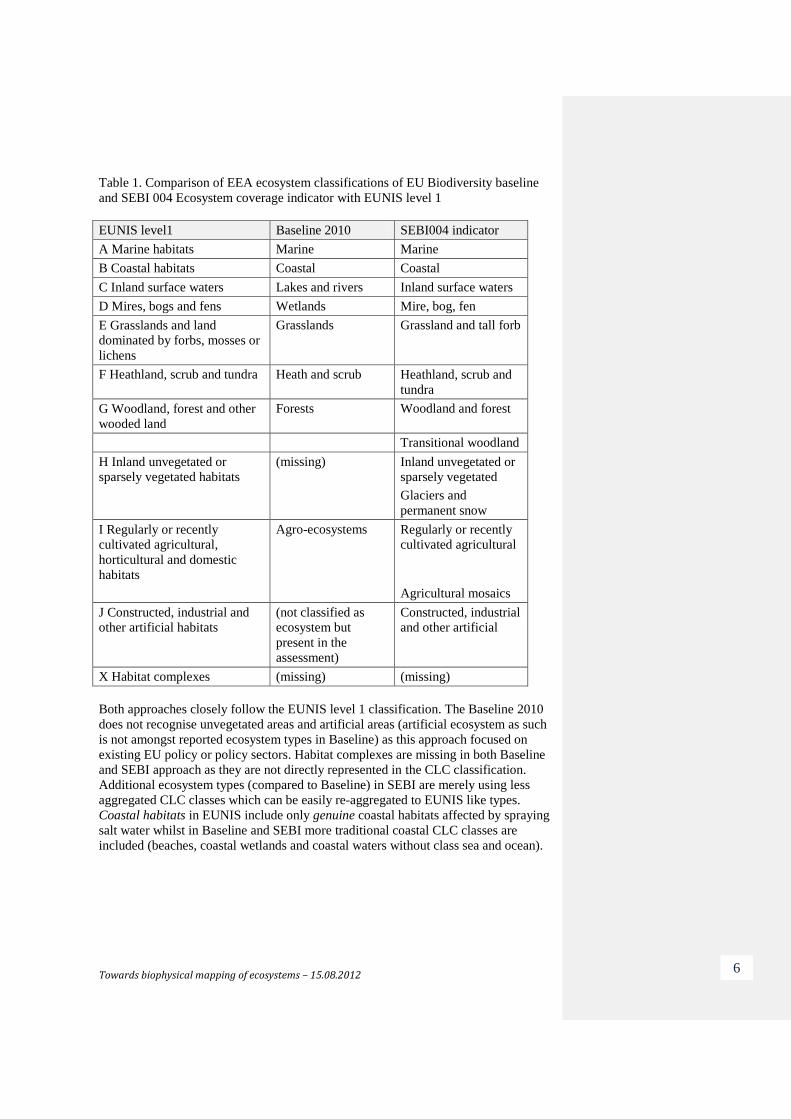
Table 1. Comparison of EEA ecosystem classifications of EU Biodiversity baseline
and SEBI 004 Ecosystem coverage indicator with EUNIS level 1
EUNIS level1 Baseline 2010 SEBI004 indicator
A Marine habitats Marine Marine
B Coastal habitats Coastal Coastal
C Inland surface waters Lakes and rivers Inland surface waters
D Mires, bogs and fens Wetlands Mire, bog, fen
E Grasslands and land
dominated by forbs, mosses or
lichens
Grasslands Grassland and tall forb
F Heathland, scrub and tundra Heath and scrub Heathland, scrub and
tundra
G Woodland, forest and other
wooded land
Forests Woodland and forest
Transitional woodland
H Inland unvegetated or
sparsely vegetated habitats
(missing) Inland unvegetated or
sparsely vegetated
Glaciers and
permanent snow
I Regularly or recently
cultivated agricultural,
horticultural and domestic
habitats
Agro-ecosystems Regularly or recently
cultivated agricultural
Agricultural mosaics
J Constructed, industrial and
other artificial habitats
(not classified as
ecosystem but
present in the
assessment)
Constructed, industrial
and other artificial
X Habitat complexes (missing) (missing)
Both approaches closely follow the EUNIS level 1 classification. The Baseline 2010
does not recognise unvegetated areas and artificial areas (artificial ecosystem as such
is not amongst reported ecosystem types in Baseline) as this approach focused on
existing EU policy or policy sectors. Habitat complexes are missing in both Baseline
and SEBI approach as they are not directly represented in the CLC classification.
Additional ecosystem types (compared to Baseline) in SEBI are merely using less
aggregated CLC classes which can be easily re-aggregated to EUNIS like types.
Coastal habitats in EUNIS include only genuine coastal habitats affected by spraying
salt water whilst in Baseline and SEBI more traditional coastal CLC classes are
included (beaches, coastal wetlands and coastal waters without class sea and ocean).
Towards biophysical mapping of ecosystems – 15.08.2012 7
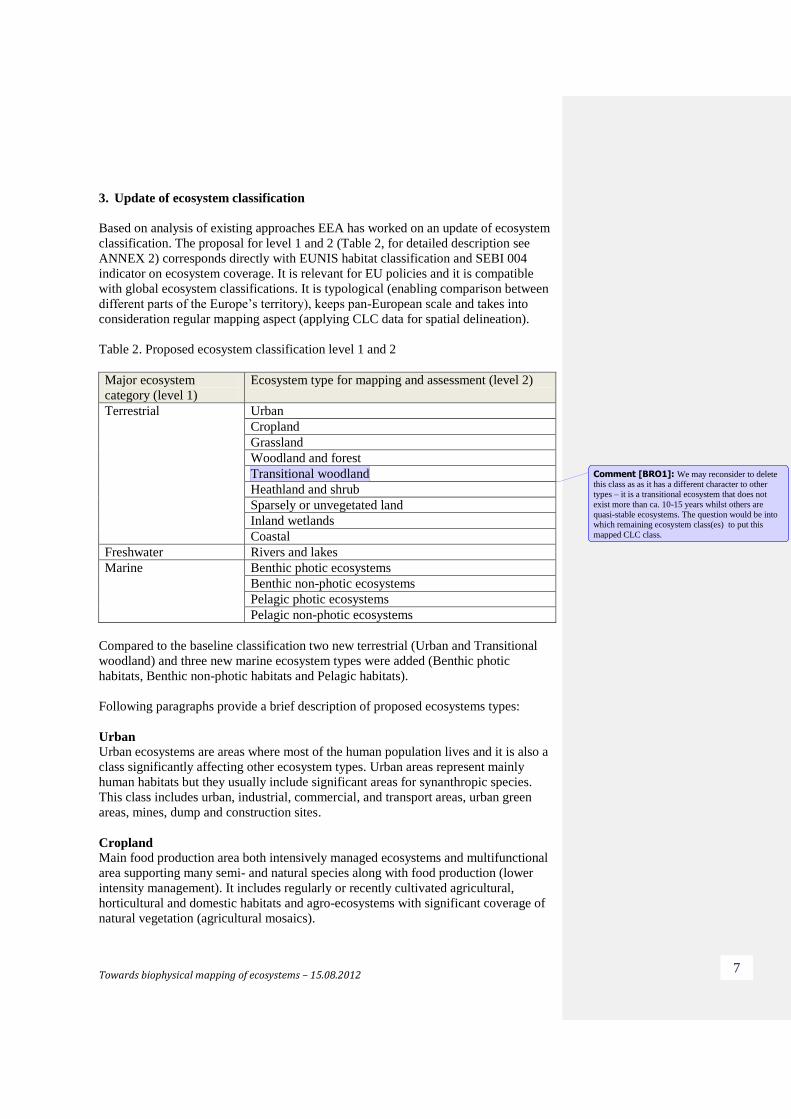
3. Update of ecosystem classification
Based on analysis of existing approaches EEA has worked on an update of ecosystem
classification. The proposal for level 1 and 2 (Table 2, for detailed description see
ANNEX 2) corresponds directly with EUNIS habitat classification and SEBI 004
indicator on ecosystem coverage. It is relevant for EU policies and it is compatible
with global ecosystem classifications. It is typological (enabling comparison between
different parts of the Europe’s territory), keeps pan-European scale and takes into
consideration regular mapping aspect (applying CLC data for spatial delineation).
Table 2. Proposed ecosystem classification level 1 and 2
Major ecosystem
category (level 1)
Ecosystem type for mapping and assessment (level 2)
Terrestrial Urban
Cropland
Grassland
Woodland and forest
Transitional woodland
Heathland and shrub
Sparsely or unvegetated land
Inland wetlands
Coastal
Freshwater Rivers and lakes
Marine Benthic photic ecosystems
Benthic non-photic ecosystems
Pelagic photic ecosystems
Pelagic non-photic ecosystems
Compared to the baseline classification two new terrestrial (Urban and Transitional
woodland) and three new marine ecosystem types were added (Benthic photic
habitats, Benthic non-photic habitats and Pelagic habitats).
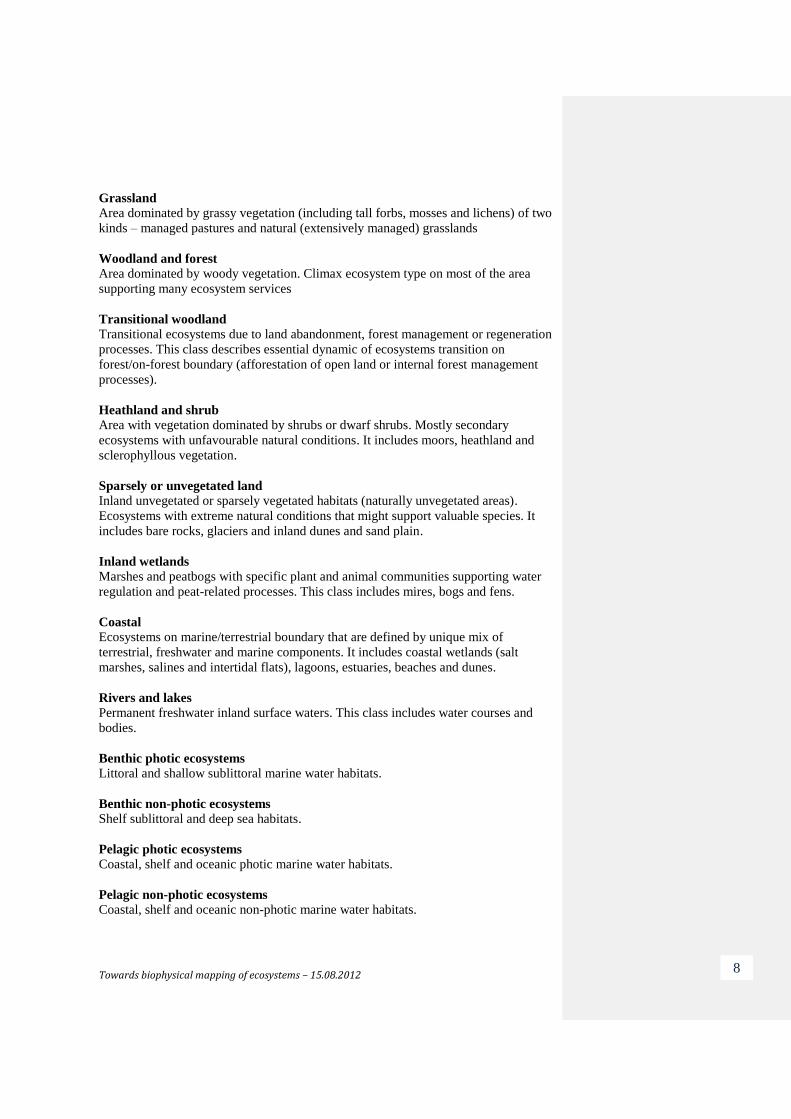
Following paragraphs provide a brief description of proposed ecosystems types:
Urban
Urban ecosystems are areas where most of the human population lives and it is also a
class significantly affecting other ecosystem types. Urban areas represent mainly
human habitats but they usually include significant areas for synanthropic species.
This class includes urban, industrial, commercial, and transport areas, urban green
areas, mines, dump and construction sites.
Cropland
Main food production area both intensively managed ecosystems and multifunctional
area supporting many semi- and natural species along with food production (lower
intensity management). It includes regularly or recently cultivated agricultural,
horticultural and domestic habitats and agro-ecosystems with significant coverage of
natural vegetation (agricultural mosaics).
Comment [BRO1]: We may reconsider to delete this class as as it has a different character to other types – it is a transitional ecosystem that does not
exist more than ca. 10-15 years whilst others are
quasi-stable ecosystems. The question would be into which remaining ecosystem class(es) to put this
mapped CLC class.
Towards biophysical mapping of ecosystems – 15.08.2012 8
Grassland
Area dominated by grassy vegetation (including tall forbs, mosses and lichens) of two
kinds – managed pastures and natural (extensively managed) grasslands
Woodland and forest
Area dominated by woody vegetation. Climax ecosystem type on most of the area
supporting many ecosystem services
Transitional woodland
Transitional ecosystems due to land abandonment, forest management or regeneration
processes. This class describes essential dynamic of ecosystems transition on
forest/on-forest boundary (afforestation of open land or internal forest management
processes).
Heathland and shrub
Area with vegetation dominated by shrubs or dwarf shrubs. Mostly secondary
ecosystems with unfavourable natural conditions. It includes moors, heathland and
sclerophyllous vegetation.
Sparsely or unvegetated land
Inland unvegetated or sparsely vegetated habitats (naturally unvegetated areas).
Ecosystems with extreme natural conditions that might support valuable species. It
includes bare rocks, glaciers and inland dunes and sand plain.
Inland wetlands
Marshes and peatbogs with specific plant and animal communities supporting water
regulation and peat-related processes. This class includes mires, bogs and fens.
Coastal
Ecosystems on marine/terrestrial boundary that are defined by unique mix of
terrestrial, freshwater and marine components. It includes coastal wetlands (salt
marshes, salines and intertidal flats), lagoons, estuaries, beaches and dunes.
Rivers and lakes Permanent freshwater inland surface waters. This class includes water courses and
bodies.
Benthic photic ecosystems Littoral and shallow sublittoral marine water habitats.
Benthic non-photic ecosystems Shelf sublittoral and deep sea habitats.
Pelagic photic ecosystems Coastal, shelf and oceanic photic marine water habitats.
Pelagic non-photic ecosystems Coastal, shelf and oceanic non-photic marine water habitats.
Towards biophysical mapping of ecosystems – 15.08.2012 9
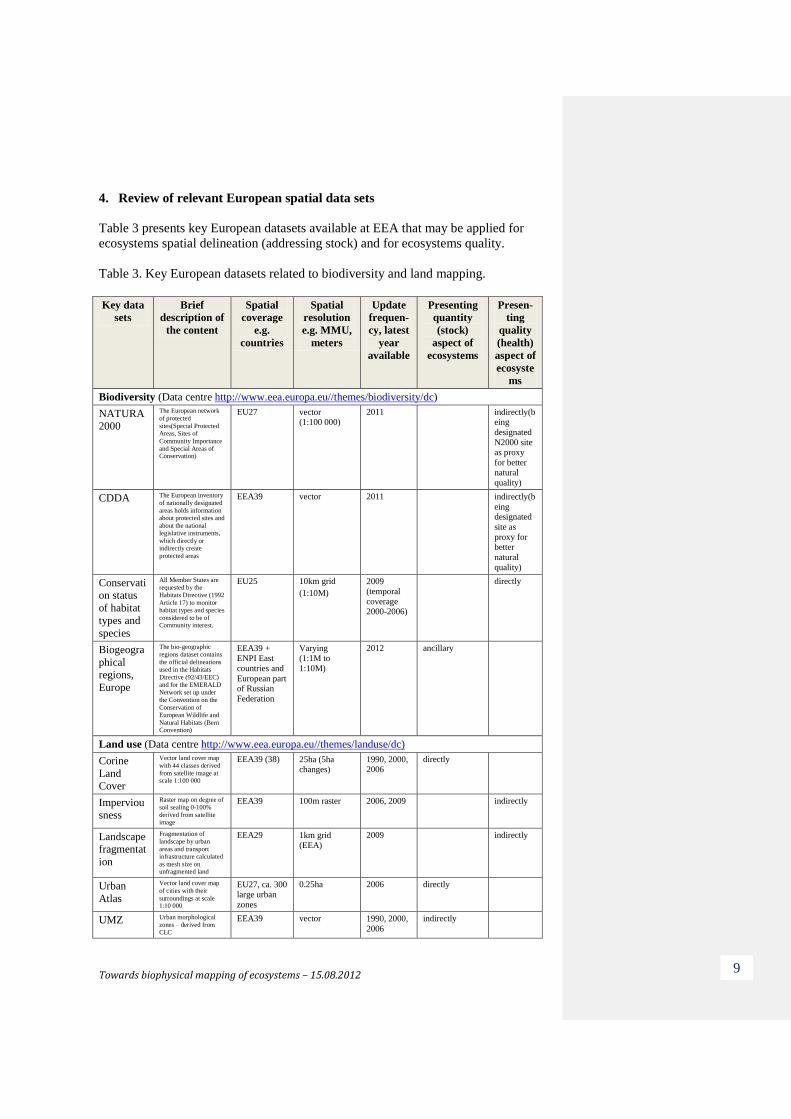
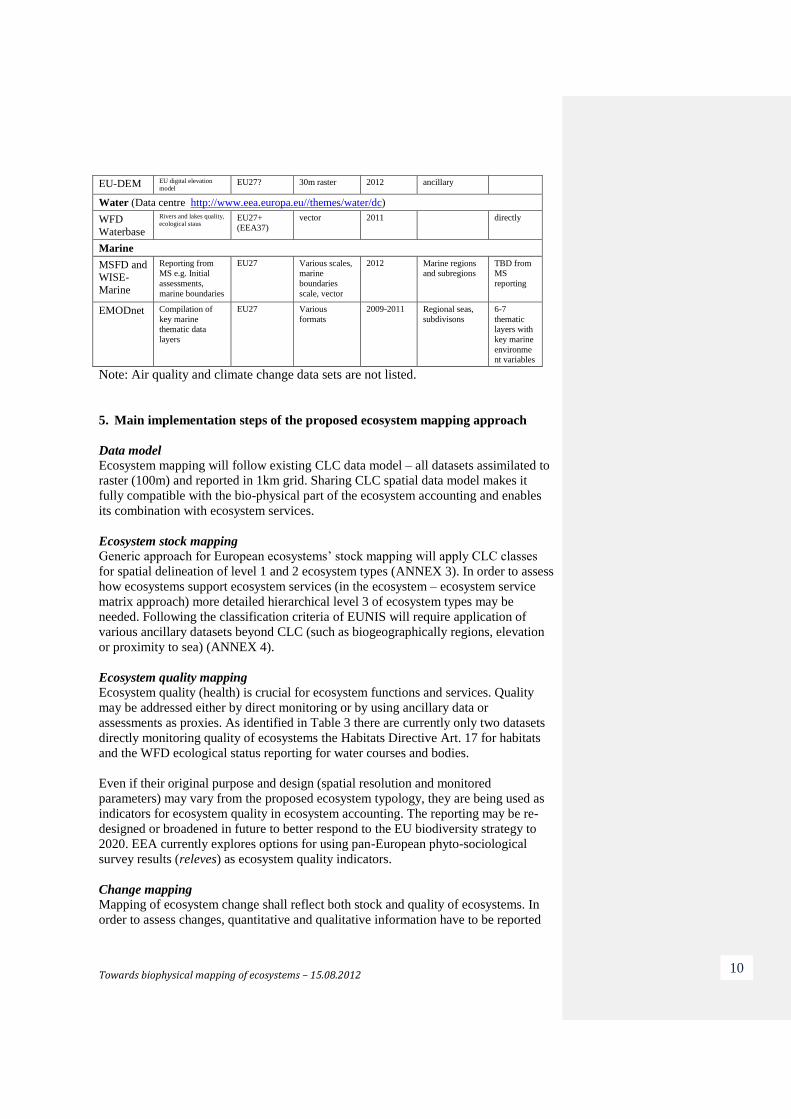
4. Review of relevant European spatial data sets
Table 3 presents key European datasets available at EEA that may be applied for
ecosystems spatial delineation (addressing stock) and for ecosystems quality.
Table 3. Key European datasets related to biodiversity and land mapping.
Key data
sets
Brief
description of
the content
Spatial
coverage
e.g.
countries
Spatial
resolution
e.g. MMU,
meters
Update
frequen-
cy, latest
year
available
Presenting
quantity
(stock)
aspect of
ecosystems
Presen-
ting
quality
(health)
aspect of
ecosyste
ms
Biodiversity (Data centre http://www.eea.europa.eu//themes/biodiversity/dc)
NATURA
2000
The European network
of protected
sites(Special Protected Areas, Sites of
Community Importance and Special Areas of Conservation)
EU27 vector (1:100 000)
2011 indirectly(being
designated
N2000 site as proxy
for better natural
quality)
CDDA The European inventory
of nationally designated
areas holds information about protected sites and
about the national legislative instruments,
which directly or indirectly create protected areas
EEA39 vector 2011 indirectly(b
eing designated
site as
proxy for better
natural
quality)
Conservati
on status
of habitat
types and
species
All Member States are
requested by the Habitats Directive (1992
Article 17) to monitor habitat types and species
considered to be of Community interest.
EU25 10km grid
(1:10M)
2009 (temporal
coverage 2000-2006)
directly
Biogeogra
phical
regions,
Europe
The bio-geographic
regions dataset contains
the official delineations
used in the Habitats
Directive (92/43/EEC) and for the EMERALD
Network set up under the Convention on the
Conservation of European Wildlife and
Natural Habitats (Bern Convention)
EEA39 + ENPI East
countries and
European part of Russian
Federation
Varying (1:1M to
1:10M)
2012 ancillary
Land use (Data centre http://www.eea.europa.eu//themes/landuse/dc)
Corine
Land
Cover
Vector land cover map
with 44 classes derived
from satellite image at scale 1:100 000
EEA39 (38) 25ha (5ha changes)
1990, 2000, 2006
directly
Imperviou
sness
Raster map on degree of
soil sealing 0-100% derived from satellite image
EEA39 100m raster 2006, 2009 indirectly
Landscape
fragmentat
ion
Fragmentation of
landscape by urban
areas and transport infrastructure calculated
as mesh size on unfragmented land
EEA29 1km grid (EEA)
2009 indirectly
Urban
Atlas
Vector land cover map
of cities with their
surroundings at scale 1:10 000
EU27, ca. 300 large urban
zones
0.25ha 2006 directly
UMZ Urban morphological
zones – derived from CLC
EEA39 vector 1990, 2000,
2006
indirectly
Towards biophysical mapping of ecosystems – 15.08.2012 10
EU-DEM EU digital elevation
model EU27? 30m raster 2012 ancillary
Water (Data centre http://www.eea.europa.eu//themes/water/dc)
WFD
Waterbase
Rivers and lakes quality, ecological staus
EU27+ (EEA37)
vector 2011 directly
Marine
MSFD and
WISE-
Marine
Reporting from MS e.g. Initial
assessments,
marine boundaries
EU27
Various scales, marine
boundaries
scale, vector
2012
Marine regions and subregions
TBD from MS
reporting
EMODnet
Compilation of
key marine thematic data
layers
EU27
Various
formats
2009-2011
Regional seas,
subdivisons
6-7
thematic layers with
key marine
environment variables
Note: Air quality and climate change data sets are not listed.
5. Main implementation steps of the proposed ecosystem mapping approach
Data model
Ecosystem mapping will follow existing CLC data model – all datasets assimilated to
raster (100m) and reported in 1km grid. Sharing CLC spatial data model makes it
fully compatible with the bio-physical part of the ecosystem accounting and enables
its combination with ecosystem services.
Ecosystem stock mapping
Generic approach for European ecosystems’ stock mapping will apply CLC classes
for spatial delineation of level 1 and 2 ecosystem types (ANNEX 3). In order to assess
how ecosystems support ecosystem services (in the ecosystem – ecosystem service
matrix approach) more detailed hierarchical level 3 of ecosystem types may be
needed. Following the classification criteria of EUNIS will require application of
various ancillary datasets beyond CLC (such as biogeographically regions, elevation
or proximity to sea) (ANNEX 4).
Ecosystem quality mapping
Ecosystem quality (health) is crucial for ecosystem functions and services. Quality
may be addressed either by direct monitoring or by using ancillary data or
assessments as proxies. As identified in Table 3 there are currently only two datasets
directly monitoring quality of ecosystems the Habitats Directive Art. 17 for habitats
and the WFD ecological status reporting for water courses and bodies.
Even if their original purpose and design (spatial resolution and monitored
parameters) may vary from the proposed ecosystem typology, they are being used as
indicators for ecosystem quality in ecosystem accounting. The reporting may be re-
designed or broadened in future to better respond to the EU biodiversity strategy to
2020. EEA currently explores options for using pan-European phyto-sociological
survey results (releves) as ecosystem quality indicators.
Change mapping
Mapping of ecosystem change shall reflect both stock and quality of ecosystems. In
order to assess changes, quantitative and qualitative information have to be reported

Towards biophysical mapping of ecosystems – 15.08.2012 11
separately or combined as in the currently developed ecosystem accounting approach.
Implementation example of proposed approach as applies for 2000-2006 is presented
in ANNEX 5.
Towards biophysical mapping of ecosystems – 15.08.2012 12
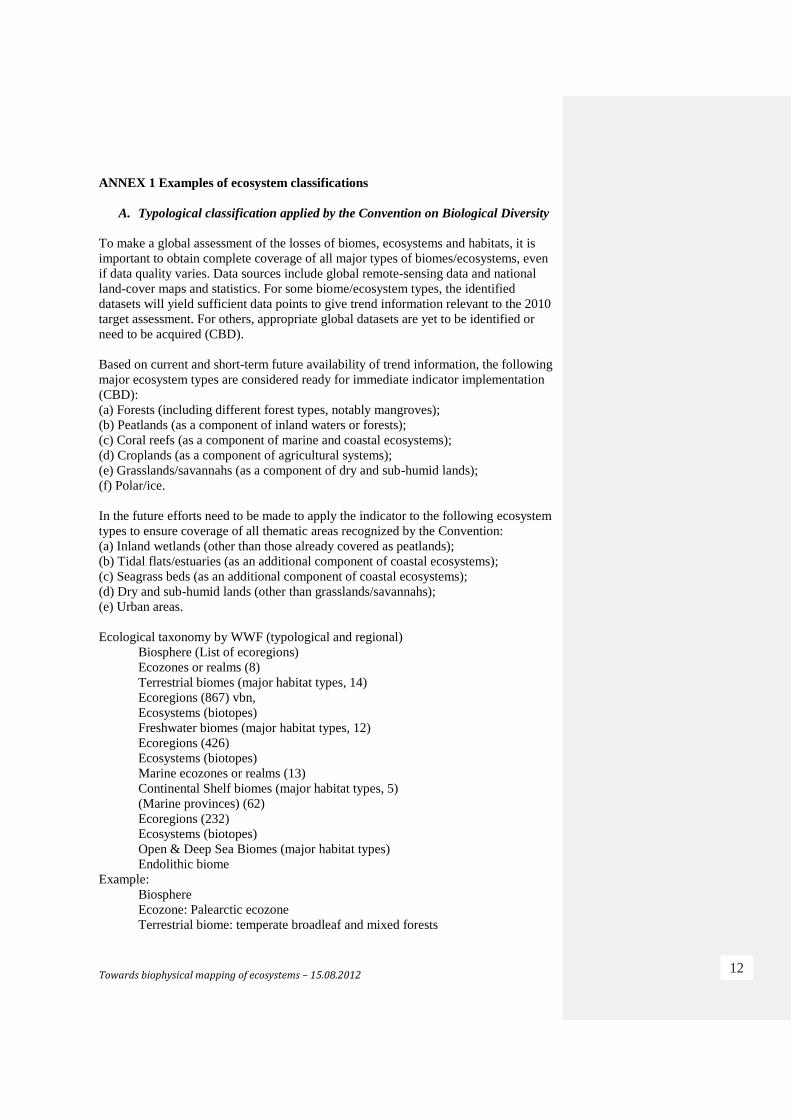
ANNEX 1 Examples of ecosystem classifications
A. Typological classification applied by the Convention on Biological Diversity
To make a global assessment of the losses of biomes, ecosystems and habitats, it is
important to obtain complete coverage of all major types of biomes/ecosystems, even
if data quality varies. Data sources include global remote-sensing data and national
land-cover maps and statistics. For some biome/ecosystem types, the identified
datasets will yield sufficient data points to give trend information relevant to the 2010
target assessment. For others, appropriate global datasets are yet to be identified or
need to be acquired (CBD).
Based on current and short-term future availability of trend information, the following
major ecosystem types are considered ready for immediate indicator implementation
(CBD):
(a) Forests (including different forest types, notably mangroves);
(b) Peatlands (as a component of inland waters or forests);
(c) Coral reefs (as a component of marine and coastal ecosystems);
(d) Croplands (as a component of agricultural systems);
(e) Grasslands/savannahs (as a component of dry and sub-humid lands);
(f) Polar/ice.
In the future efforts need to be made to apply the indicator to the following ecosystem
types to ensure coverage of all thematic areas recognized by the Convention:
(a) Inland wetlands (other than those already covered as peatlands);
(b) Tidal flats/estuaries (as an additional component of coastal ecosystems);
(c) Seagrass beds (as an additional component of coastal ecosystems);
(d) Dry and sub-humid lands (other than grasslands/savannahs);
(e) Urban areas.
Ecological taxonomy by WWF (typological and regional)
Biosphere (List of ecoregions)
Ecozones or realms (8)
Terrestrial biomes (major habitat types, 14)
Ecoregions (867) vbn,
Ecosystems (biotopes)
Freshwater biomes (major habitat types, 12)
Ecoregions (426)
Ecosystems (biotopes)
Marine ecozones or realms (13)
Continental Shelf biomes (major habitat types, 5)
(Marine provinces) (62)
Ecoregions (232)
Ecosystems (biotopes)
Open & Deep Sea Biomes (major habitat types)
Endolithic biome
Example:
Biosphere
Ecozone: Palearctic ecozone
Terrestrial biome: temperate broadleaf and mixed forests
Towards biophysical mapping of ecosystems – 15.08.2012 13
Ecoregion: Dinaric Mountains mixed forests (PA0418)
Ecosystem: Orjen, vegetation belt between 1,100- 1,450 m, Oromediterranean
zone, nemoral zone (temperate zone)
Biotope: Oreoherzogio-Abietetum illyricae Fuk. (Plant list)
Plant: Silver fir (Abies alba)
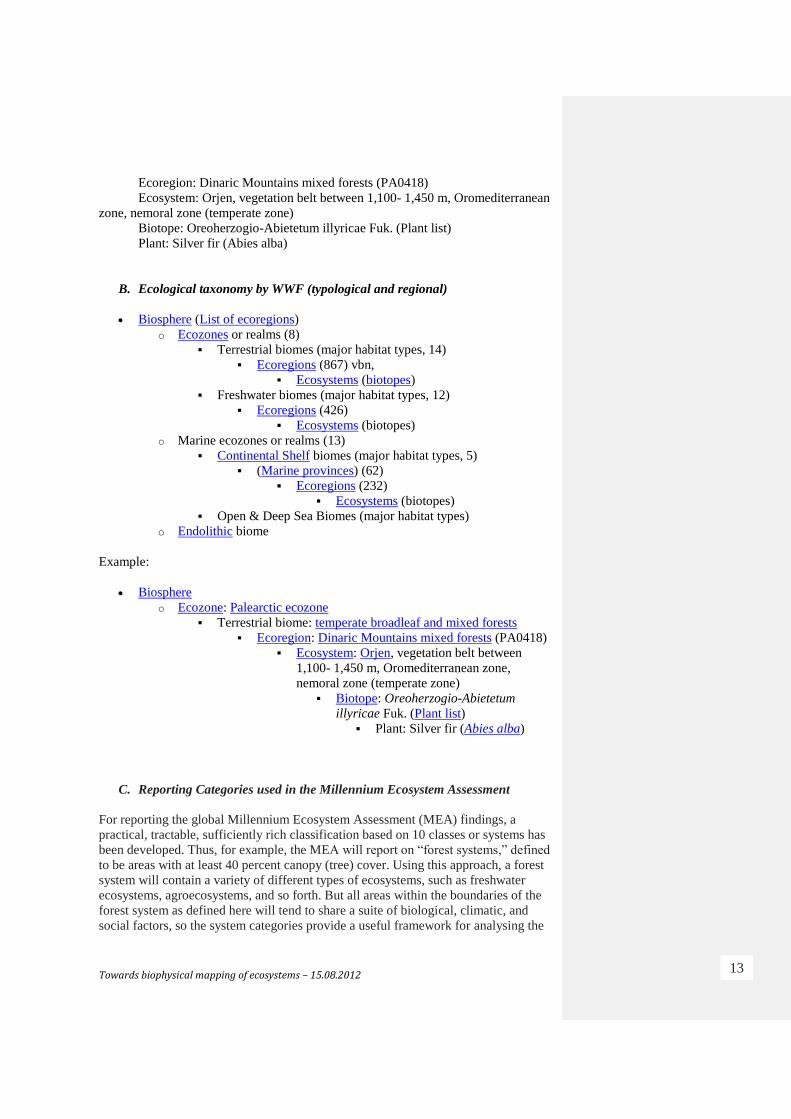
B. Ecological taxonomy by WWF (typological and regional)
Biosphere (List of ecoregions)
o Ecozones or realms (8)
Terrestrial biomes (major habitat types, 14)
Ecoregions (867) vbn,
Ecosystems (biotopes)
Freshwater biomes (major habitat types, 12)
Ecoregions (426)
Ecosystems (biotopes)
o Marine ecozones or realms (13)
Continental Shelf biomes (major habitat types, 5)
(Marine provinces) (62)
Ecoregions (232)
Ecosystems (biotopes)
Open & Deep Sea Biomes (major habitat types)
o Endolithic biome
Example:
Biosphere
o Ecozone: Palearctic ecozone
Terrestrial biome: temperate broadleaf and mixed forests
Ecoregion: Dinaric Mountains mixed forests (PA0418)
Ecosystem: Orjen, vegetation belt between
1,100- 1,450 m, Oromediterranean zone,
nemoral zone (temperate zone)
Biotope: Oreoherzogio-Abietetum
illyricae Fuk. (Plant list)
Plant: Silver fir (Abies alba)
C. Reporting Categories used in the Millennium Ecosystem Assessment
For reporting the global Millennium Ecosystem Assessment (MEA) findings, a
practical, tractable, sufficiently rich classification based on 10 classes or systems has
been developed. Thus, for example, the MEA will report on “forest systems,” defined
to be areas with at least 40 percent canopy (tree) cover. Using this approach, a forest
system will contain a variety of different types of ecosystems, such as freshwater
ecosystems, agroecosystems, and so forth. But all areas within the boundaries of the
forest system as defined here will tend to share a suite of biological, climatic, and
social factors, so the system categories provide a useful framework for analysing the
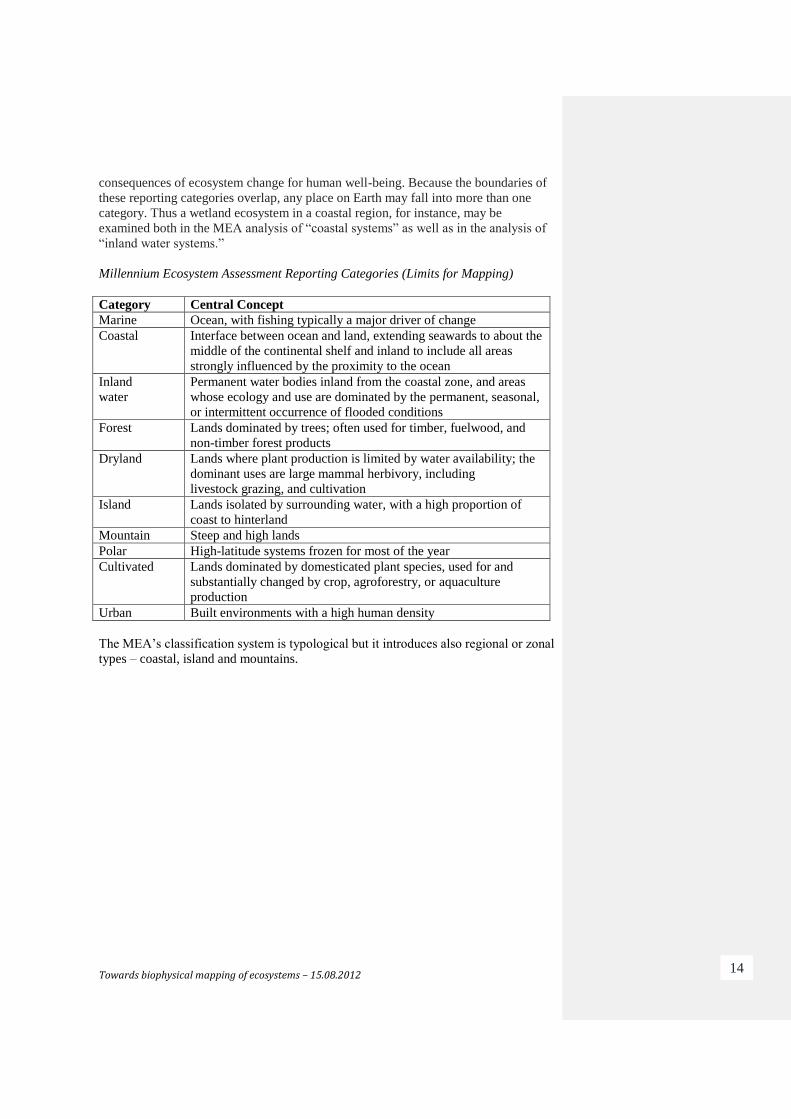
Towards biophysical mapping of ecosystems – 15.08.2012 14
consequences of ecosystem change for human well-being. Because the boundaries of
these reporting categories overlap, any place on Earth may fall into more than one
category. Thus a wetland ecosystem in a coastal region, for instance, may be
examined both in the MEA analysis of “coastal systems” as well as in the analysis of
“inland water systems.”
Millennium Ecosystem Assessment Reporting Categories (Limits for Mapping)
Category Central Concept
Marine Ocean, with fishing typically a major driver of change
Coastal Interface between ocean and land, extending seawards to about the
middle of the continental shelf and inland to include all areas
strongly influenced by the proximity to the ocean
Inland
water
Permanent water bodies inland from the coastal zone, and areas
whose ecology and use are dominated by the permanent, seasonal,
or intermittent occurrence of flooded conditions
Forest Lands dominated by trees; often used for timber, fuelwood, and
non-timber forest products
Dryland Lands where plant production is limited by water availability; the
dominant uses are large mammal herbivory, including
livestock grazing, and cultivation
Island Lands isolated by surrounding water, with a high proportion of
coast to hinterland
Mountain Steep and high lands
Polar High-latitude systems frozen for most of the year
Cultivated Lands dominated by domesticated plant species, used for and
substantially changed by crop, agroforestry, or aquaculture
production
Urban Built environments with a high human density
The MEA’s classification system is typological but it introduces also regional or zonal
types – coastal, island and mountains.
Towards biophysical mapping of ecosystems – 15.08.2012 15
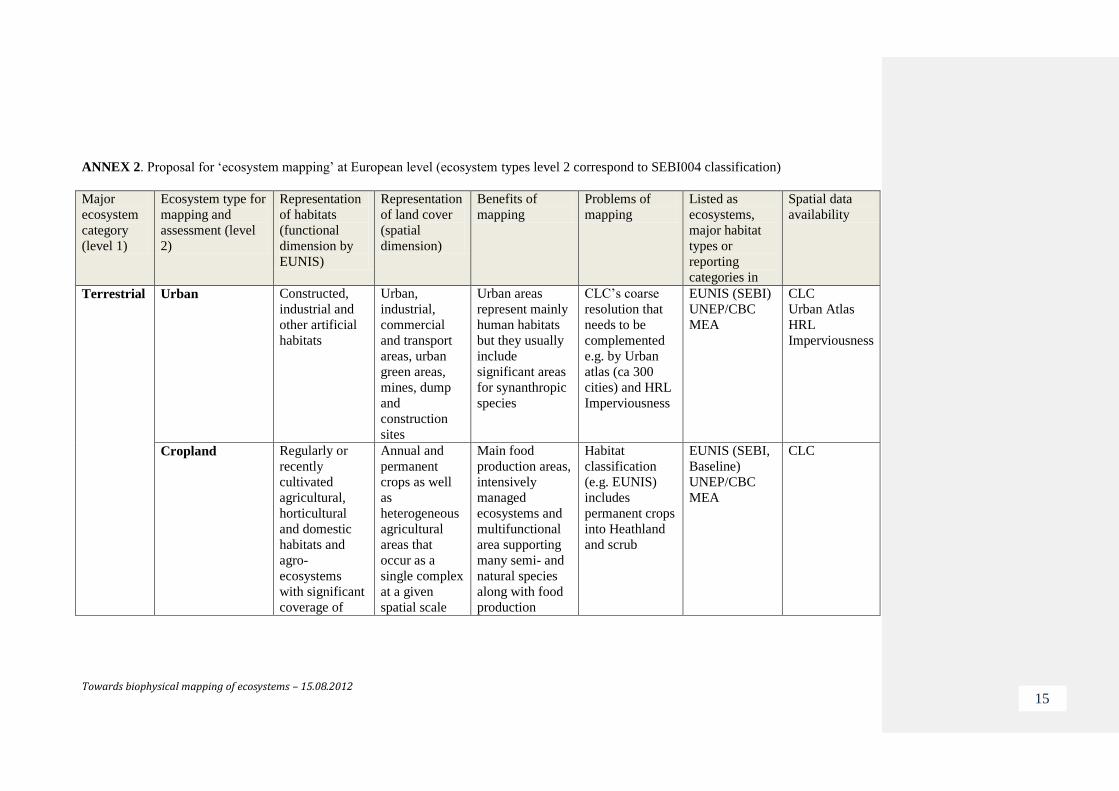
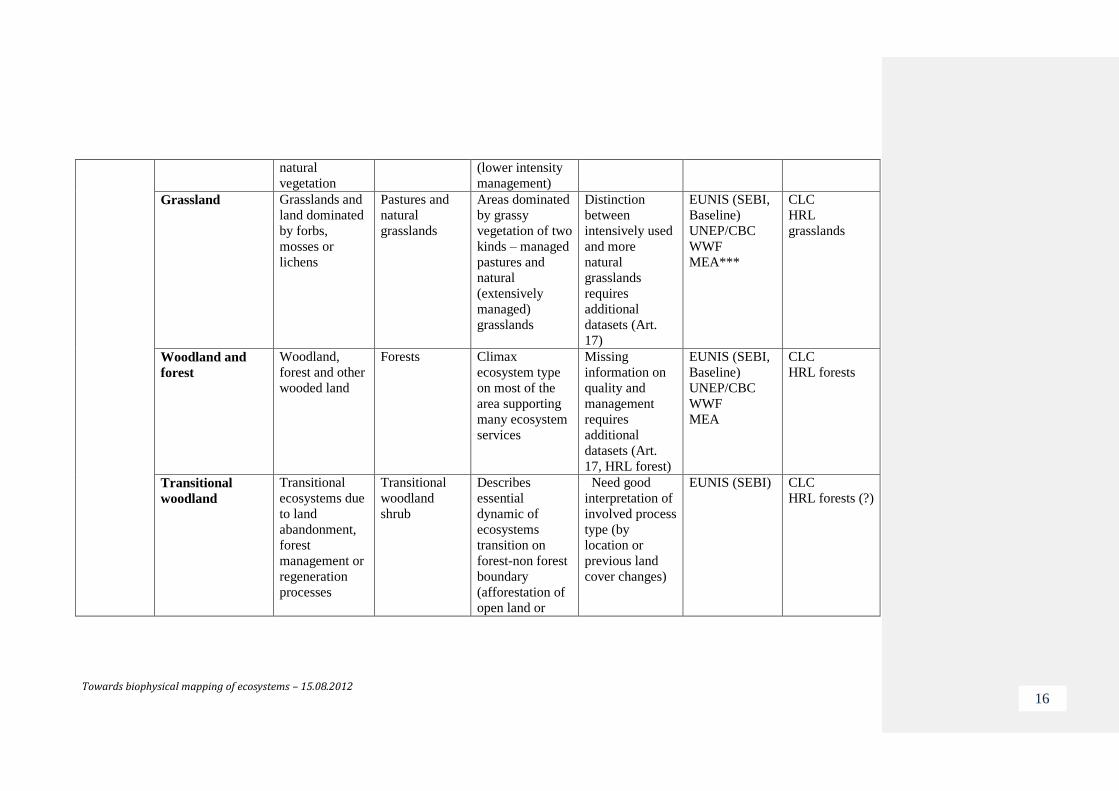
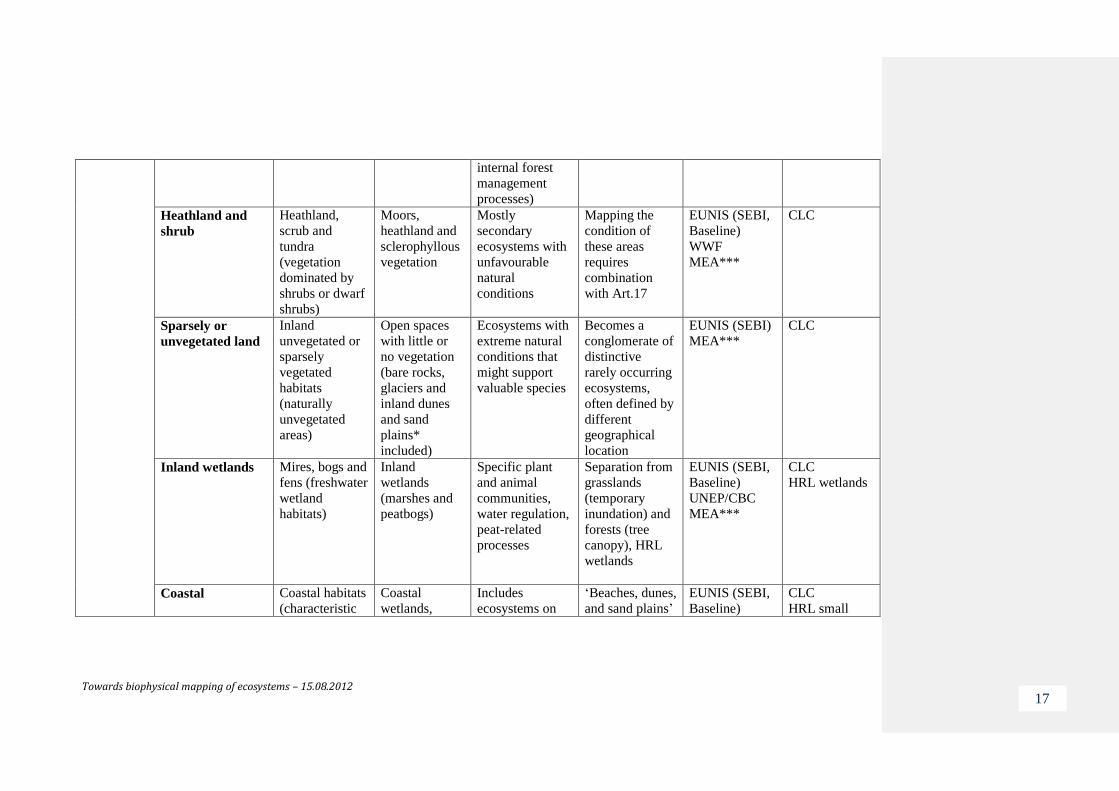
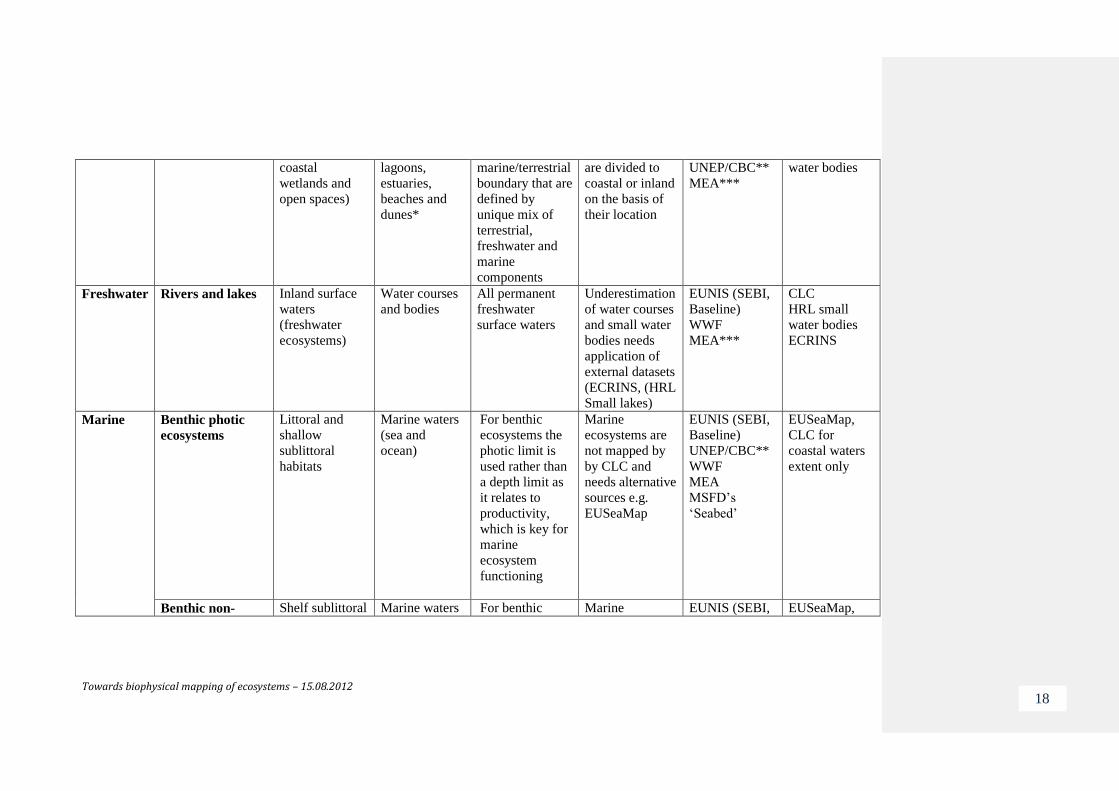
ANNEX 2. Proposal for ‘ecosystem mapping’ at European level (ecosystem types level 2 correspond to SEBI004 classification)
Major
ecosystem
category
(level 1)
Ecosystem type for
mapping and
assessment (level
2)
Representation
of habitats
(functional
dimension by
EUNIS)
Representation
of land cover
(spatial
dimension)
Benefits of
mapping
Problems of
mapping
Listed as
ecosystems,
major habitat
types or
reporting
categories in
Spatial data
availability
Terrestrial Urban Constructed,
industrial and
other artificial
habitats
Urban,
industrial,
commercial
and transport
areas, urban
green areas,
mines, dump
and
construction
sites
Urban areas
represent mainly
human habitats
but they usually
include
significant areas
for synanthropic
species
CLC’s coarse
resolution that
needs to be
complemented
e.g. by Urban
atlas (ca 300
cities) and HRL
Imperviousness
EUNIS (SEBI)
UNEP/CBC
MEA
CLC
Urban Atlas
HRL
Imperviousness
Cropland
Regularly or
recently
cultivated
agricultural,
horticultural
and domestic
habitats and
agro-
ecosystems
with significant
coverage of
Annual and
permanent
crops as well
as
heterogeneous
agricultural
areas that
occur as a
single complex
at a given
spatial scale
Main food
production areas,
intensively
managed
ecosystems and
multifunctional
area supporting
many semi- and
natural species
along with food
production
Habitat
classification
(e.g. EUNIS)
includes
permanent crops
into Heathland
and scrub
EUNIS (SEBI,
Baseline)
UNEP/CBC
MEA
CLC
Towards biophysical mapping of ecosystems – 15.08.2012 16
natural
vegetation
(lower intensity
management)
Grassland Grasslands and
land dominated
by forbs,
mosses or
lichens
Pastures and
natural
grasslands
Areas dominated
by grassy
vegetation of two
kinds – managed
pastures and
natural
(extensively
managed)
grasslands
Distinction
between
intensively used
and more
natural
grasslands
requires
additional
datasets (Art.
17)
EUNIS (SEBI,
Baseline)
UNEP/CBC
WWF
MEA***
CLC
HRL
grasslands
Woodland and
forest
Woodland,
forest and other
wooded land
Forests Climax
ecosystem type
on most of the
area supporting
many ecosystem
services
Missing
information on
quality and
management
requires
additional
datasets (Art.
17, HRL forest)
EUNIS (SEBI,
Baseline)
UNEP/CBC
WWF
MEA
CLC
HRL forests
Transitional
woodland
Transitional
ecosystems due
to land
abandonment,
forest
management or
regeneration
processes
Transitional
woodland
shrub
Describes
essential
dynamic of
ecosystems
transition on
forest-non forest
boundary
(afforestation of
open land or
Need good
interpretation of
involved process
type (by
location or
previous land
cover changes)
EUNIS (SEBI)
CLC
HRL forests (?)
Towards biophysical mapping of ecosystems – 15.08.2012 17
internal forest
management
processes)
Heathland and
shrub
Heathland,
scrub and
tundra
(vegetation
dominated by
shrubs or dwarf
shrubs)
Moors,
heathland and
sclerophyllous
vegetation
Mostly
secondary
ecosystems with
unfavourable
natural
conditions
Mapping the
condition of
these areas
requires
combination
with Art.17
EUNIS (SEBI,
Baseline)
WWF
MEA***
CLC
Sparsely or
unvegetated land
Inland
unvegetated or
sparsely
vegetated
habitats
(naturally
unvegetated
areas)
Open spaces
with little or
no vegetation
(bare rocks,
glaciers and
inland dunes
and sand
plains*
included)
Ecosystems with
extreme natural
conditions that
might support
valuable species
Becomes a
conglomerate of
distinctive
rarely occurring
ecosystems,
often defined by
different
geographical
location
EUNIS (SEBI)
MEA***
CLC
Inland wetlands
Mires, bogs and
fens (freshwater
wetland
habitats)
Inland
wetlands
(marshes and
peatbogs)
Specific plant
and animal
communities,
water regulation,
peat-related
processes
Separation from
grasslands
(temporary
inundation) and
forests (tree
canopy), HRL
wetlands
EUNIS (SEBI,
Baseline)
UNEP/CBC
MEA***
CLC
HRL wetlands
Coastal
Coastal habitats
(characteristic
Coastal
wetlands,
Includes
ecosystems on
‘Beaches, dunes,
and sand plains’
EUNIS (SEBI,
Baseline)
CLC
HRL small
Towards biophysical mapping of ecosystems – 15.08.2012 18
coastal
wetlands and
open spaces)
lagoons,
estuaries,
beaches and
dunes*
marine/terrestrial
boundary that are
defined by
unique mix of
terrestrial,
freshwater and
marine
components
are divided to
coastal or inland
on the basis of
their location
UNEP/CBC**
MEA***
water bodies
Freshwater Rivers and lakes Inland surface
waters
(freshwater
ecosystems)
Water courses
and bodies
All permanent
freshwater
surface waters
Underestimation
of water courses
and small water
bodies needs
application of
external datasets
(ECRINS, (HRL
Small lakes)
EUNIS (SEBI,
Baseline)
WWF
MEA***
CLC
HRL small
water bodies
ECRINS
Marine Benthic photic
ecosystems
Littoral and
shallow
sublittoral
habitats
Marine waters
(sea and
ocean)
For benthic
ecosystems the
photic limit is
used rather than
a depth limit as
it relates to
productivity,
which is key for
marine
ecosystem
functioning
Marine
ecosystems are
not mapped by
by CLC and
needs alternative
sources e.g.
EUSeaMap
EUNIS (SEBI,
Baseline)
UNEP/CBC**
WWF
MEA
MSFD’s
‘Seabed’
EUSeaMap,
CLC for
coastal waters
extent only
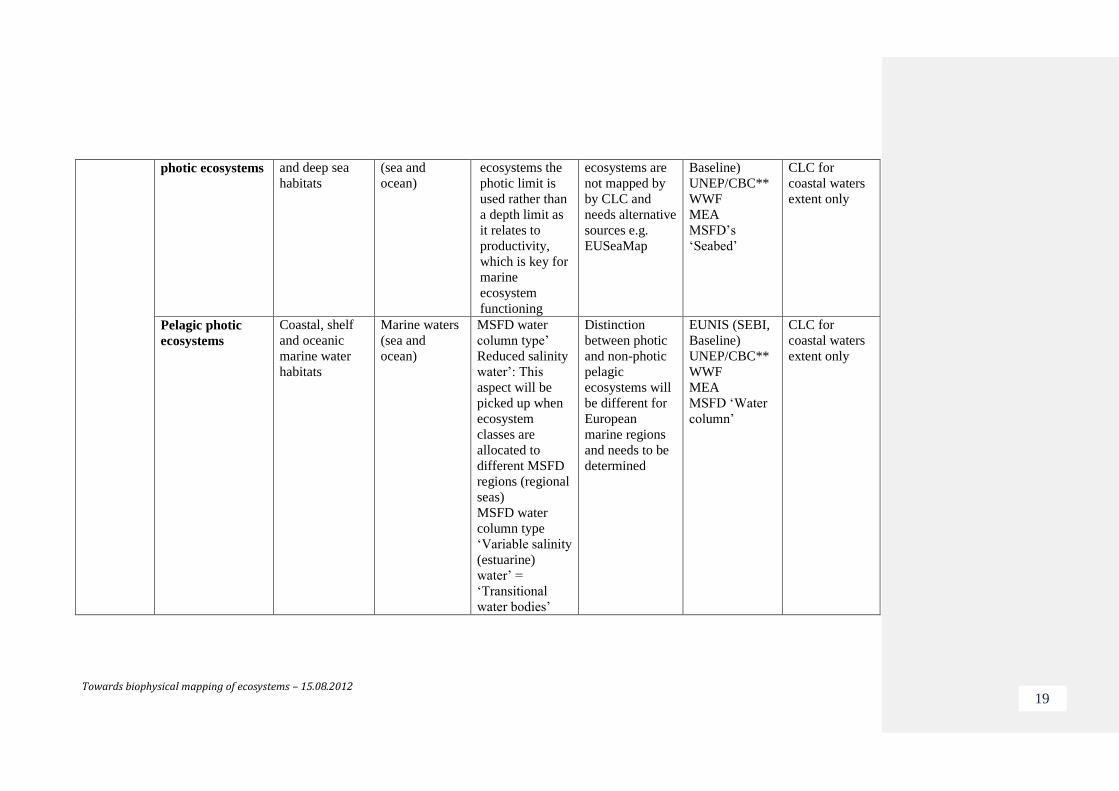
Benthic non- Shelf sublittoral Marine waters For benthic Marine EUNIS (SEBI, EUSeaMap,
Towards biophysical mapping of ecosystems – 15.08.2012 19
photic ecosystems and deep sea
habitats
(sea and
ocean)
ecosystems the
photic limit is
used rather than
a depth limit as
it relates to
productivity,
which is key for
marine
ecosystem
functioning
ecosystems are
not mapped by
by CLC and
needs alternative
sources e.g.
EUSeaMap
Baseline)
UNEP/CBC**
WWF
MEA
MSFD’s
‘Seabed’
CLC for
coastal waters
extent only
Pelagic photic
ecosystems
Coastal, shelf
and oceanic
marine water
habitats
Marine waters
(sea and
ocean)
MSFD water
column type’
Reduced salinity
water’: This
aspect will be
picked up when
ecosystem
classes are
allocated to
different MSFD
regions (regional
seas)
MSFD water
column type
‘Variable salinity
(estuarine)
water’ =
‘Transitional
water bodies’
Distinction
between photic
and non-photic
pelagic
ecosystems will
be different for
European
marine regions
and needs to be
determined
EUNIS (SEBI,
Baseline)
UNEP/CBC**
WWF
MEA
MSFD ‘Water
column’
CLC for
coastal waters
extent only
Towards biophysical mapping of ecosystems – 15.08.2012 20
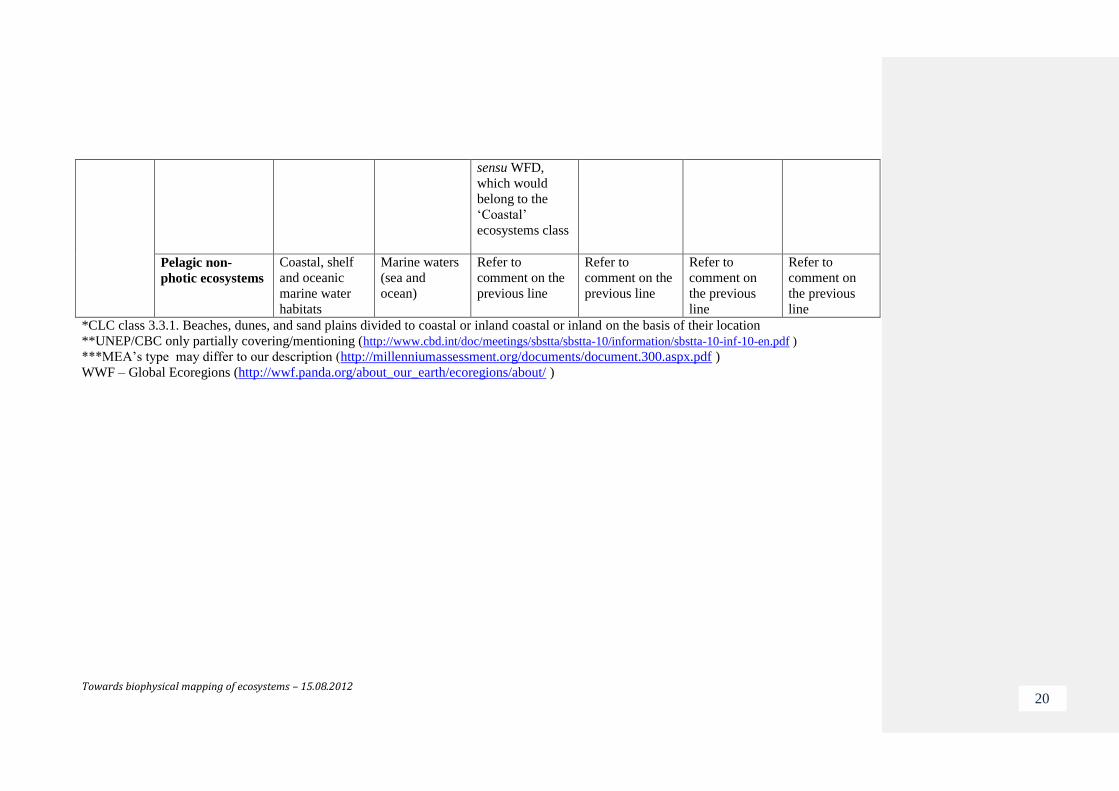
sensu WFD,
which would
belong to the
‘Coastal’
ecosystems class
Pelagic non-
photic ecosystems
Coastal, shelf
and oceanic
marine water
habitats
Marine waters
(sea and
ocean)
Refer to
comment on the
previous line
Refer to
comment on the
previous line
Refer to
comment on
the previous
line
Refer to
comment on
the previous
line
*CLC class 3.3.1. Beaches, dunes, and sand plains divided to coastal or inland coastal or inland on the basis of their location
**UNEP/CBC only partially covering/mentioning (http://www.cbd.int/doc/meetings/sbstta/sbstta-10/information/sbstta-10-inf-10-en.pdf )
***MEA’s type may differ to our description (http://millenniumassessment.org/documents/document.300.aspx.pdf )
WWF – Global Ecoregions (http://wwf.panda.org/about_our_earth/ecoregions/about/ )
Towards biophysical mapping of ecosystems – 15.08.2012 21
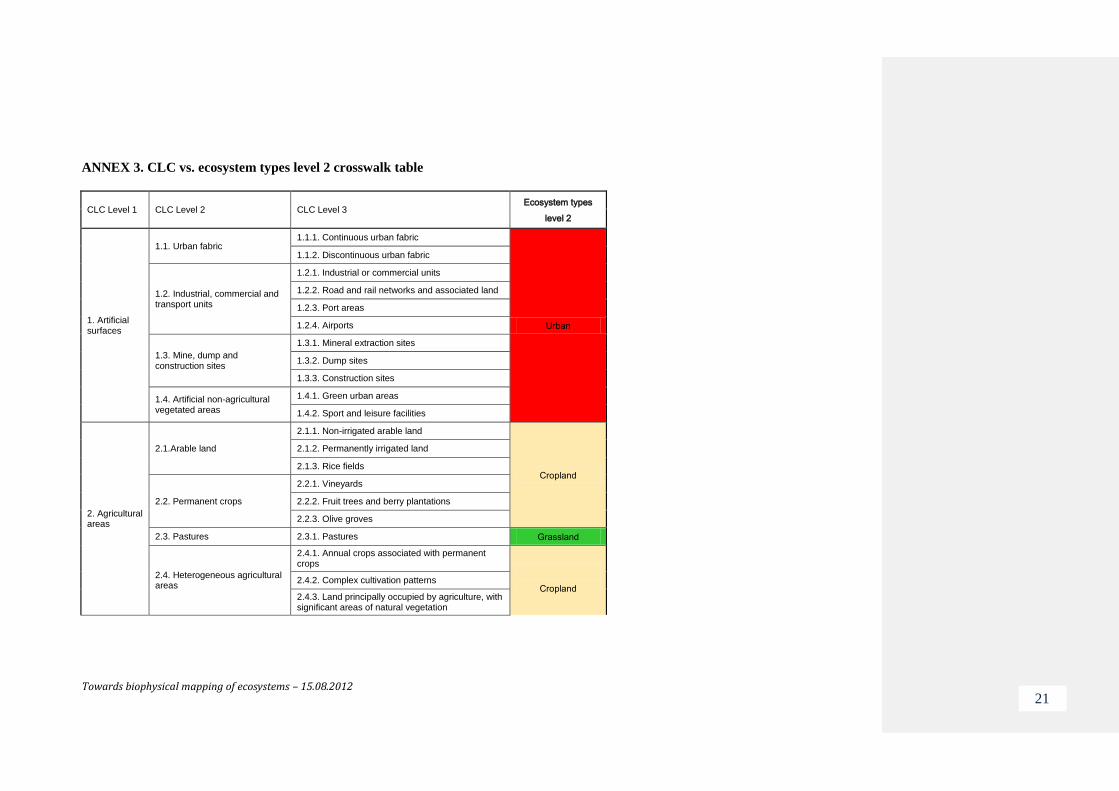
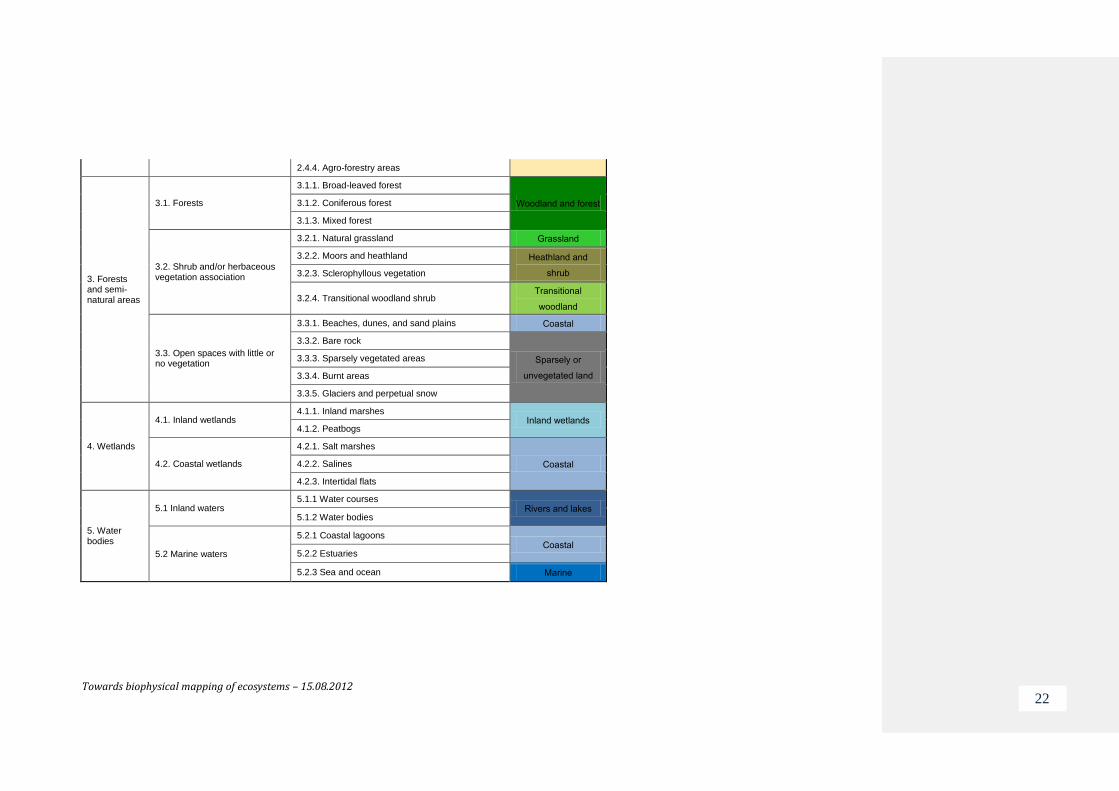
ANNEX 3. CLC vs. ecosystem types level 2 crosswalk table
CLC Level 1 CLC Level 2 CLC Level 3 Ecosystem types
level 2
1. Artificial surfaces
1.1. Urban fabric 1.1.1. Continuous urban fabric
Urban
1.1.2. Discontinuous urban fabric
1.2. Industrial, commercial and transport units
1.2.1. Industrial or commercial units
1.2.2. Road and rail networks and associated land
1.2.3. Port areas
1.2.4. Airports
1.3. Mine, dump and construction sites
1.3.1. Mineral extraction sites
1.3.2. Dump sites
1.3.3. Construction sites
1.4. Artificial non-agricultural vegetated areas
1.4.1. Green urban areas
1.4.2. Sport and leisure facilities
2. Agricultural areas
2.1.Arable land
2.1.1. Non-irrigated arable land
Cropland
2.1.2. Permanently irrigated land
2.1.3. Rice fields
2.2. Permanent crops
2.2.1. Vineyards
2.2.2. Fruit trees and berry plantations
2.2.3. Olive groves
2.3. Pastures 2.3.1. Pastures Grassland
2.4. Heterogeneous agricultural areas
2.4.1. Annual crops associated with permanent crops
Cropland 2.4.2. Complex cultivation patterns
2.4.3. Land principally occupied by agriculture, with significant areas of natural vegetation
Towards biophysical mapping of ecosystems – 15.08.2012 22
2.4.4. Agro-forestry areas
3. Forests and semi-natural areas
3.1. Forests
3.1.1. Broad-leaved forest
Woodland and forest 3.1.2. Coniferous forest
3.1.3. Mixed forest
3.2. Shrub and/or herbaceous vegetation association
3.2.1. Natural grassland Grassland
3.2.2. Moors and heathland Heathland and
shrub 3.2.3. Sclerophyllous vegetation
3.2.4. Transitional woodland shrub Transitional
woodland
3.3. Open spaces with little or no vegetation
3.3.1. Beaches, dunes, and sand plains Coastal
3.3.2. Bare rock
Sparsely or
unvegetated land
3.3.3. Sparsely vegetated areas
3.3.4. Burnt areas
3.3.5. Glaciers and perpetual snow
4. Wetlands
4.1. Inland wetlands 4.1.1. Inland marshes
Inland wetlands 4.1.2. Peatbogs
4.2. Coastal wetlands
4.2.1. Salt marshes
Coastal 4.2.2. Salines
4.2.3. Intertidal flats
5. Water bodies
5.1 Inland waters 5.1.1 Water courses
Rivers and lakes 5.1.2 Water bodies
5.2 Marine waters
5.2.1 Coastal lagoons Coastal
5.2.2 Estuaries
5.2.3 Sea and ocean Marine
Towards biophysical mapping of ecosystems – 15.08.2012 23
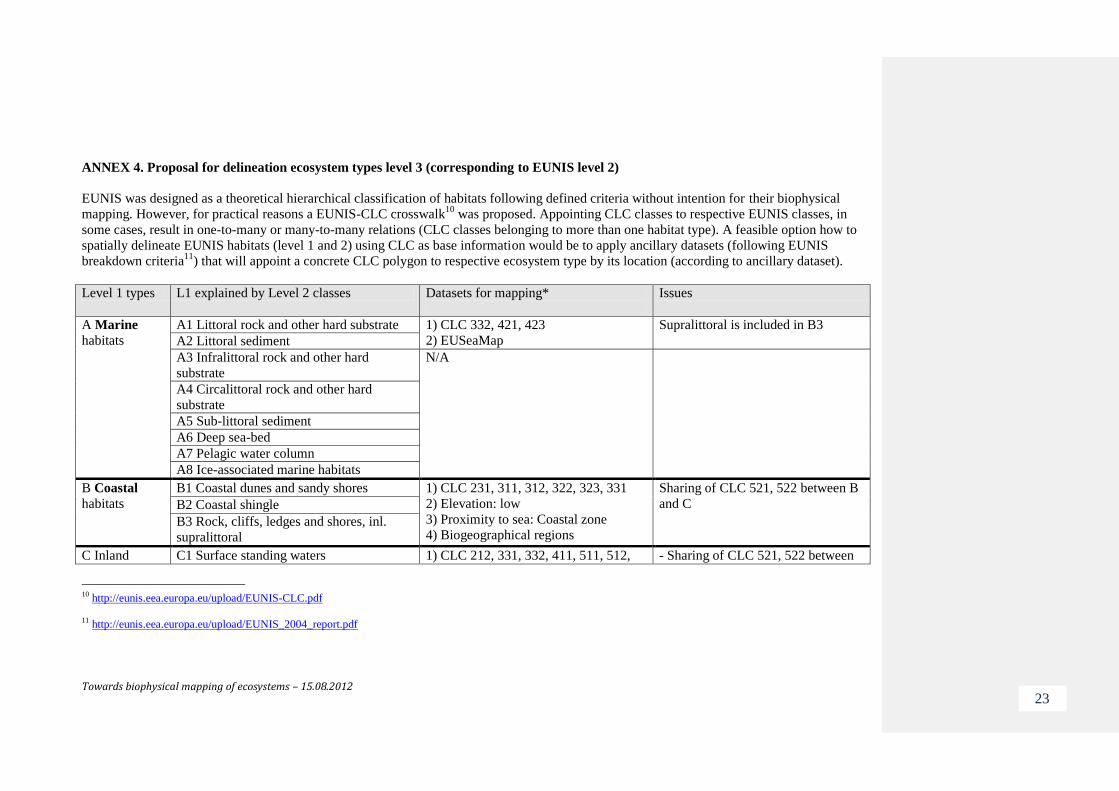
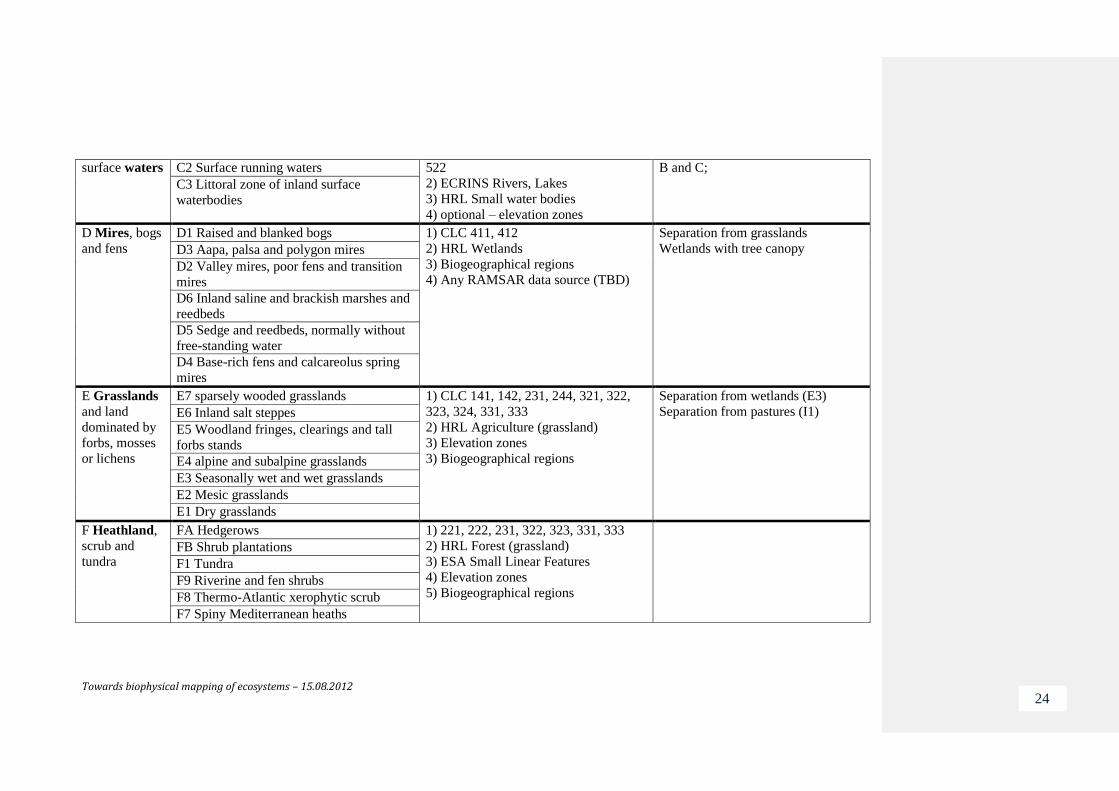
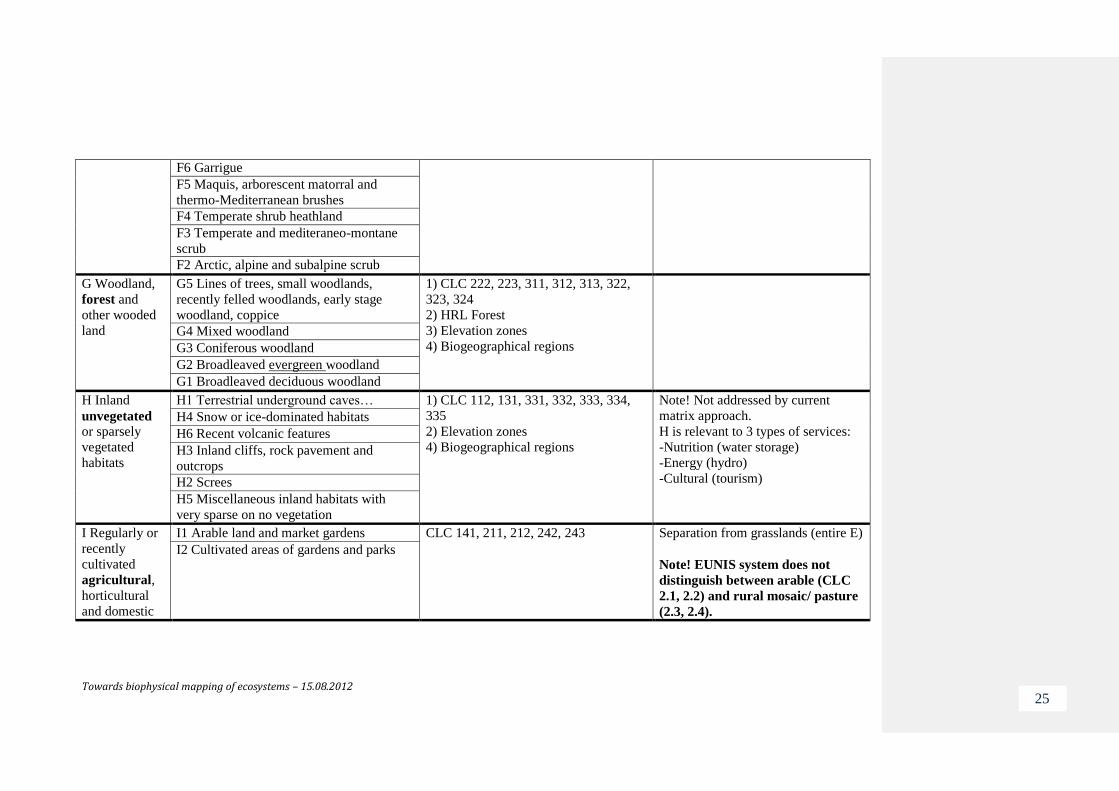
ANNEX 4. Proposal for delineation ecosystem types level 3 (corresponding to EUNIS level 2)
EUNIS was designed as a theoretical hierarchical classification of habitats following defined criteria without intention for their biophysical
mapping. However, for practical reasons a EUNIS-CLC crosswalk10
was proposed. Appointing CLC classes to respective EUNIS classes, in
some cases, result in one-to-many or many-to-many relations (CLC classes belonging to more than one habitat type). A feasible option how to
spatially delineate EUNIS habitats (level 1 and 2) using CLC as base information would be to apply ancillary datasets (following EUNIS
breakdown criteria11
) that will appoint a concrete CLC polygon to respective ecosystem type by its location (according to ancillary dataset).
Level 1 types L1 explained by Level 2 classes Datasets for mapping*
Issues
A Marine
habitats
A1 Littoral rock and other hard substrate 1) CLC 332, 421, 423
2) EUSeaMap
Supralittoral is included in B3
A2 Littoral sediment
A3 Infralittoral rock and other hard
substrate
N/A
A4 Circalittoral rock and other hard
substrate
A5 Sub-littoral sediment
A6 Deep sea-bed
A7 Pelagic water column
A8 Ice-associated marine habitats
B Coastal
habitats
B1 Coastal dunes and sandy shores 1) CLC 231, 311, 312, 322, 323, 331
2) Elevation: low
3) Proximity to sea: Coastal zone
4) Biogeographical regions
Sharing of CLC 521, 522 between B
and C B2 Coastal shingle
B3 Rock, cliffs, ledges and shores, inl.
supralittoral
C Inland C1 Surface standing waters 1) CLC 212, 331, 332, 411, 511, 512, - Sharing of CLC 521, 522 between
10
http://eunis.eea.europa.eu/upload/EUNIS-CLC.pdf
11
http://eunis.eea.europa.eu/upload/EUNIS_2004_report.pdf
Towards biophysical mapping of ecosystems – 15.08.2012 24
surface waters C2 Surface running waters 522
2) ECRINS Rivers, Lakes
3) HRL Small water bodies
4) optional – elevation zones
B and C;
C3 Littoral zone of inland surface
waterbodies
D Mires, bogs
and fens
D1 Raised and blanked bogs 1) CLC 411, 412
2) HRL Wetlands
3) Biogeographical regions
4) Any RAMSAR data source (TBD)
Separation from grasslands
Wetlands with tree canopy D3 Aapa, palsa and polygon mires
D2 Valley mires, poor fens and transition
mires
D6 Inland saline and brackish marshes and
reedbeds
D5 Sedge and reedbeds, normally without
free-standing water
D4 Base-rich fens and calcareolus spring
mires
E Grasslands
and land
dominated by
forbs, mosses
or lichens
E7 sparsely wooded grasslands 1) CLC 141, 142, 231, 244, 321, 322,
323, 324, 331, 333
2) HRL Agriculture (grassland)
3) Elevation zones
3) Biogeographical regions
Separation from wetlands (E3)
Separation from pastures (I1)
E6 Inland salt steppes
E5 Woodland fringes, clearings and tall
forbs stands
E4 alpine and subalpine grasslands
E3 Seasonally wet and wet grasslands
E2 Mesic grasslands
E1 Dry grasslands
F Heathland,
scrub and
tundra
FA Hedgerows 1) 221, 222, 231, 322, 323, 331, 333
2) HRL Forest (grassland)
3) ESA Small Linear Features
4) Elevation zones
5) Biogeographical regions
FB Shrub plantations
F1 Tundra
F9 Riverine and fen shrubs
F8 Thermo-Atlantic xerophytic scrub
F7 Spiny Mediterranean heaths
Towards biophysical mapping of ecosystems – 15.08.2012 25
F6 Garrigue
F5 Maquis, arborescent matorral and
thermo-Mediterranean brushes
F4 Temperate shrub heathland
F3 Temperate and mediteraneo-montane
scrub
F2 Arctic, alpine and subalpine scrub
G Woodland,
forest and
other wooded
land
G5 Lines of trees, small woodlands,
recently felled woodlands, early stage
woodland, coppice
1) CLC 222, 223, 311, 312, 313, 322,
323, 324
2) HRL Forest
3) Elevation zones
4) Biogeographical regions
G4 Mixed woodland
G3 Coniferous woodland
G2 Broadleaved evergreen woodland
G1 Broadleaved deciduous woodland
H Inland
unvegetated or sparsely
vegetated
habitats
H1 Terrestrial underground caves… 1) CLC 112, 131, 331, 332, 333, 334,
335
2) Elevation zones
4) Biogeographical regions
Note! Not addressed by current
matrix approach.
H is relevant to 3 types of services:
-Nutrition (water storage)
-Energy (hydro)
-Cultural (tourism)
H4 Snow or ice-dominated habitats
H6 Recent volcanic features
H3 Inland cliffs, rock pavement and
outcrops
H2 Screes
H5 Miscellaneous inland habitats with
very sparse on no vegetation
I Regularly or
recently
cultivated
agricultural,
horticultural
and domestic
I1 Arable land and market gardens CLC 141, 211, 212, 242, 243 Separation from grasslands (entire E)
Note! EUNIS system does not
distinguish between arable (CLC
2.1, 2.2) and rural mosaic/ pasture
(2.3, 2.4).
I2 Cultivated areas of gardens and parks
Towards biophysical mapping of ecosystems – 15.08.2012 26
habitats
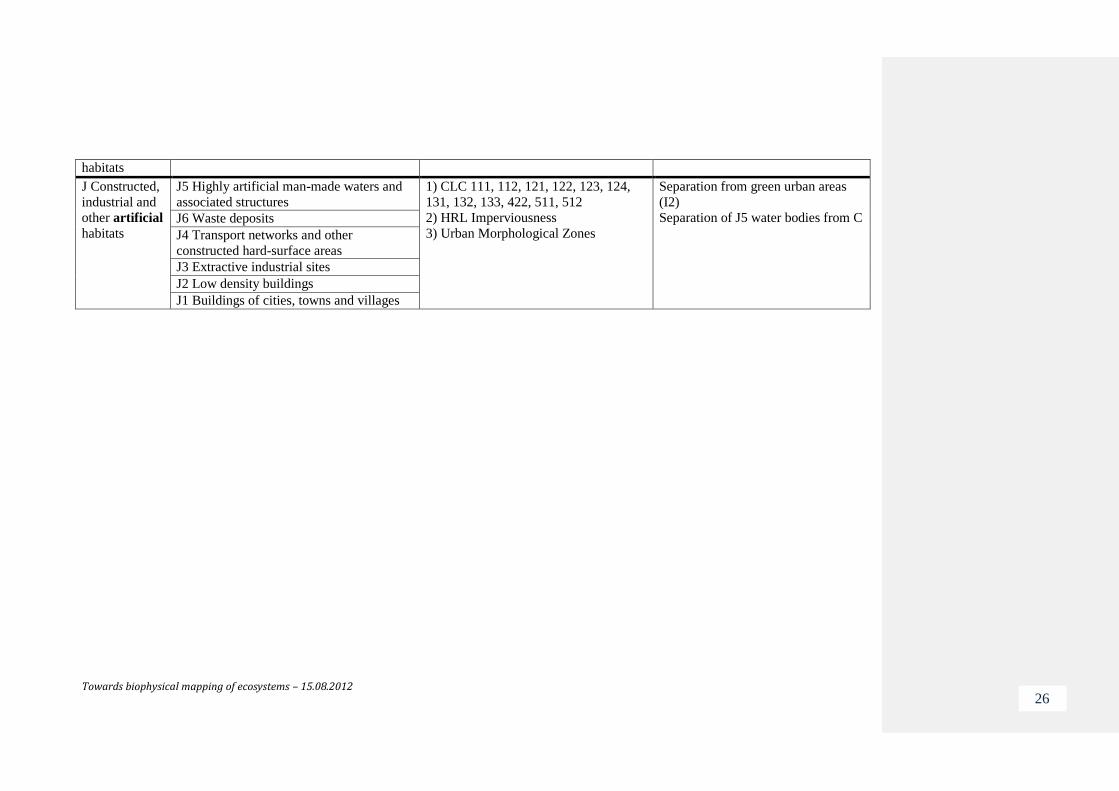
J Constructed,
industrial and
other artificial
habitats
J5 Highly artificial man-made waters and
associated structures
1) CLC 111, 112, 121, 122, 123, 124,
131, 132, 133, 422, 511, 512
2) HRL Imperviousness
3) Urban Morphological Zones
Separation from green urban areas
(I2)
Separation of J5 water bodies from C
J6 Waste deposits
J4 Transport networks and other
constructed hard-surface areas
J3 Extractive industrial sites
J2 Low density buildings
J1 Buildings of cities, towns and villages
Towards biophysical mapping of ecosystems – 15.08.2012 27
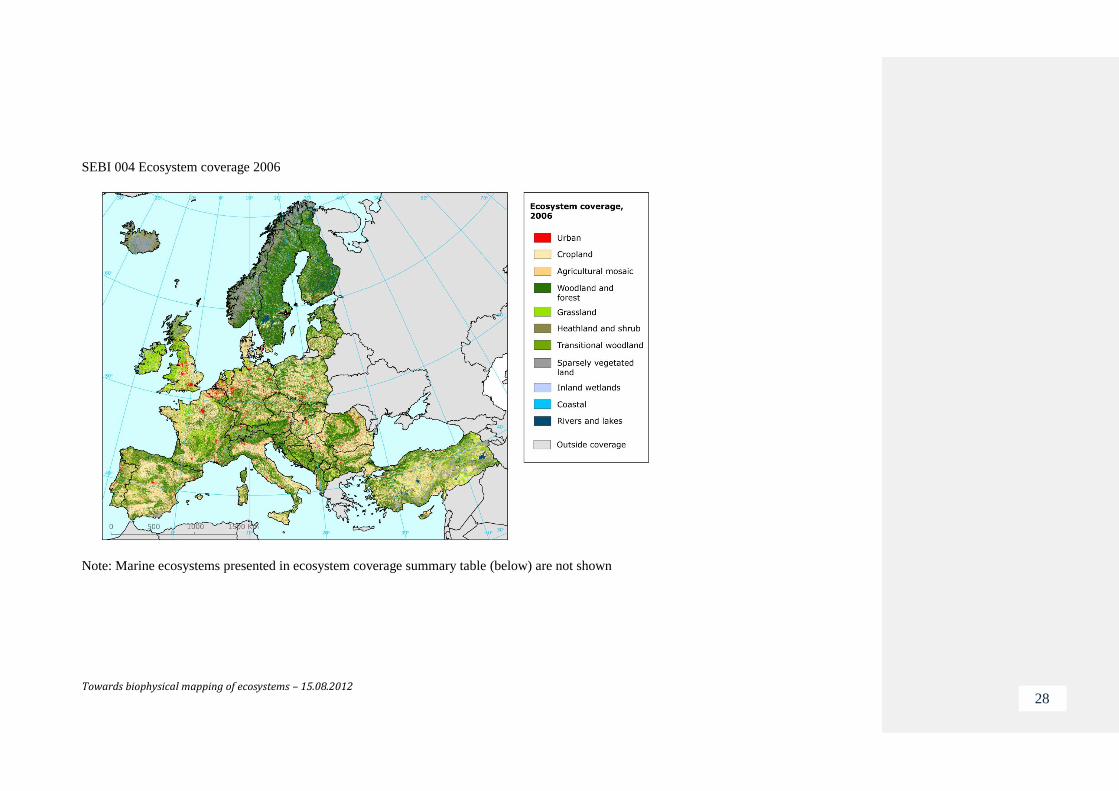
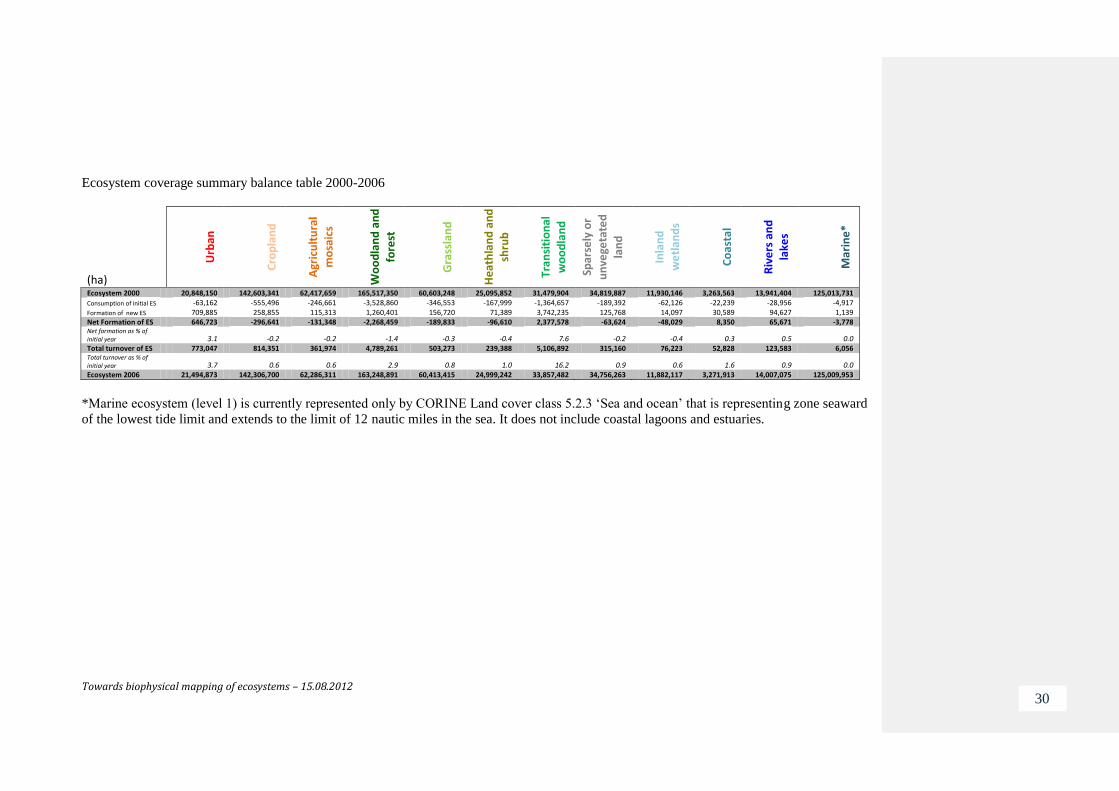
ANNEX 5. Ecosystem coverage in 2006 and its changes 2000-2006
In order to test the proposed classification system we applied 13 ecosystem types on Corine Land Cover 2006 (v.16). The map and the pie chart
show the ecosystem stock in 2006. Changes between 2000 and 2006 are presented in the ‘Ecosystem coverage summary balance table 2000-
2006’ and the bar diagram below. An even distribution of 9 terrestrial classes justifies the applied CLC grouping (especially valid for sparsely
vegetated land comprising bare rocks, sparsely vegetated, burnt and glaciers ecosystems that separately would have only minimal coverage).
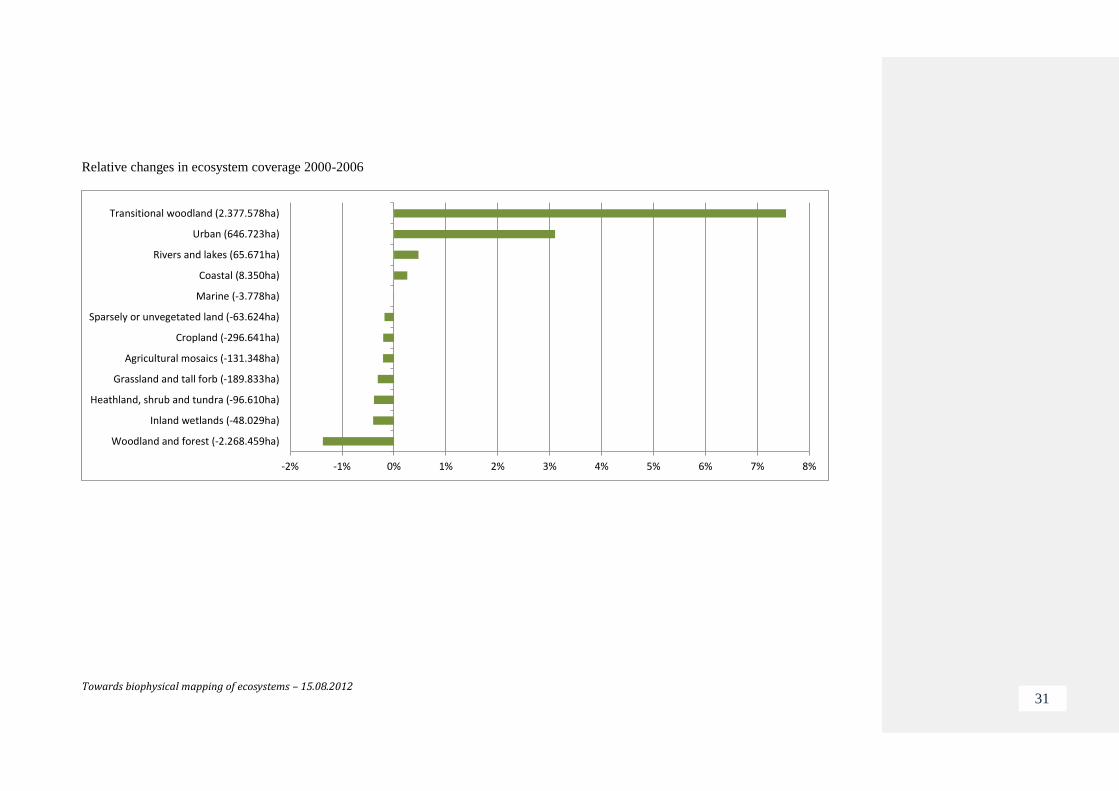
Marine ecosystem (level 1) is currently represented only by CORINE Land cover class 5.2.3 ‘Sea and ocean’ that is representing the zone
seaward of the lowest tide limit and extends to the limit of 12 nautical miles in the sea. This class appears only in change assessment.
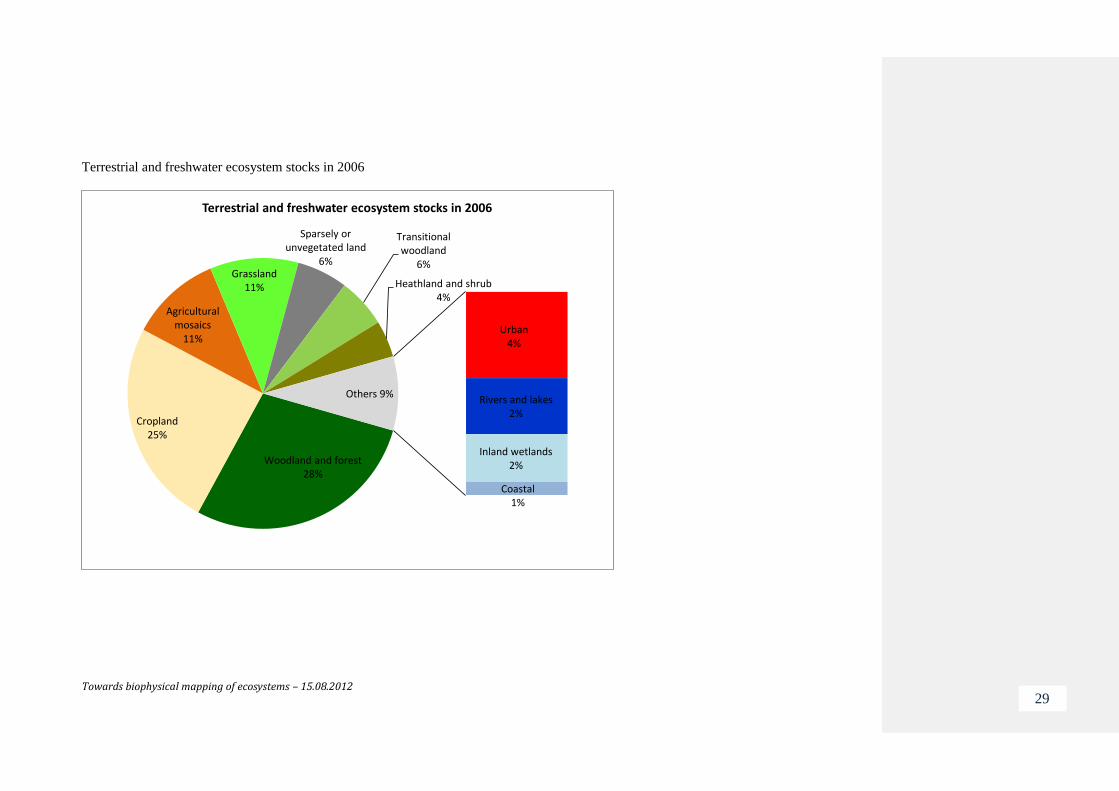
Transitional woodlands represent significant ecosystem coverage (6%) but more importantly it is the most dynamic ecosystem type between
2000-2006 with a total turnover of 16.2% and a net increase of 7.6%. Mapping this type separately provides important information on ecological
processes in forested (management) and agricultural (land abandonment) areas.
Note: The current results present class Agricultural mosaics separately as they were prepared following the SEBI04 methodology. In the
proposed ecosystem classification (table 2) Agricultural mosaics are merged with Cropland.
Towards biophysical mapping of ecosystems – 15.08.2012 28
SEBI 004 Ecosystem coverage 2006
Note: Marine ecosystems presented in ecosystem coverage summary table (below) are not shown
Towards biophysical mapping of ecosystems – 15.08.2012 29
Terrestrial and freshwater ecosystem stocks in 2006
Woodland and forest 28%
Cropland 25%
Agricultural mosaics
11%
Grassland 11%
Sparsely or unvegetated land
6%
Transitional woodland
6%
Heathland and shrub 4%
Urban 4%
Rivers and lakes 2%
Inland wetlands 2%
Coastal 1%
Others 9%
Terrestrial and freshwater ecosystem stocks in 2006
Towards biophysical mapping of ecosystems – 15.08.2012 30
Ecosystem coverage summary balance table 2000-2006
(ha)
Urb
an
Cro
pla
nd
Agr
icu
ltu
ral
mo
saic
s
Wo
od
lan
d a
nd
fo
rest
Gra
ssla
nd
Hea
thla
nd
an
d
shru
b
Tran
siti
on
al
wo
od
lan
d
Spar
sely
or
un
vege
tate
d
lan
d
Inla
nd
w
etl
and
s
Co
asta
l
Riv
ers
an
d
lake
s
Mar
ine*
Ecosystem 2000 20,848,150 142,603,341 62,417,659 165,517,350 60,603,248 25,095,852 31,479,904 34,819,887 11,930,146 3,263,563 13,941,404 125,013,731
Consumption of initial ES -63,162 -555,496 -246,661 -3,528,860 -346,553 -167,999 -1,364,657 -189,392 -62,126 -22,239 -28,956 -4,917
Formation of new ES 709,885 258,855 115,313 1,260,401 156,720 71,389 3,742,235 125,768 14,097 30,589 94,627 1,139 Net Formation of ES 646,723 -296,641 -131,348 -2,268,459 -189,833 -96,610 2,377,578 -63,624 -48,029 8,350 65,671 -3,778 Net formation as % of initial year 3.1 -0.2 -0.2 -1.4 -0.3 -0.4 7.6 -0.2 -0.4 0.3 0.5 0.0 Total turnover of ES 773,047 814,351 361,974 4,789,261 503,273 239,388 5,106,892 315,160 76,223 52,828 123,583 6,056 Total turnover as % of initial year 3.7 0.6 0.6 2.9 0.8 1.0 16.2 0.9 0.6 1.6 0.9 0.0 Ecosystem 2006 21,494,873 142,306,700 62,286,311 163,248,891 60,413,415 24,999,242 33,857,482 34,756,263 11,882,117 3,271,913 14,007,075 125,009,953
*Marine ecosystem (level 1) is currently represented only by CORINE Land cover class 5.2.3 ‘Sea and ocean’ that is representing zone seaward
of the lowest tide limit and extends to the limit of 12 nautic miles in the sea. It does not include coastal lagoons and estuaries.
Towards biophysical mapping of ecosystems – 15.08.2012 31
Relative changes in ecosystem coverage 2000-2006
-2% -1% 0% 1% 2% 3% 4% 5% 6% 7% 8%
Woodland and forest (-2.268.459ha)
Inland wetlands (-48.029ha)
Heathland, shrub and tundra (-96.610ha)
Grassland and tall forb (-189.833ha)
Agricultural mosaics (-131.348ha)
Cropland (-296.641ha)
Sparsely or unvegetated land (-63.624ha)
Marine (-3.778ha)
Coastal (8.350ha)
Rivers and lakes (65.671ha)
Urban (646.723ha)
Transitional woodland (2.377.578ha)