town of hanover affordable housing feasibility study july ... · town of hanover affordable housing...
TRANSCRIPT

TOWN OF HANOVER AFFORDABLE HOUSING FEASIBILITY STUDY
July 2001 EXECUTIVE SUMMARY
While this study looks at the need for affordable housing in Hanover, we
emphasize that housing supply and affordability is a regional issue needing regional solutions. The acute shortage of housing which is affordable to the region’s workforce has a direct impact on the economy of the Upper Valley. Businesses struggle to recruit new employees and retain existing employees; the lack of affordable housing is the primary reason. The supply of housing is falling far short of the demand and there is little incentive for developers to produce affordable housing either for low-moderate income persons or even for "middle income" persons.
The roots of the affordable housing problem are complex. Dependence upon local property taxes creates a disincentive for towns to allow growth which includes families. Local land use regulation and a shortage of developable land create barriers to a logical market response to the demand for new construction.
Homes in college communities like Hanover with access to quality healthcare are highly sought after by retirees and professionals resulting in an upward spiral of housing prices. The perception of Hanover as a "gated" community is becoming more prevalent in the Upper Valley, generating animosity from other communities who are shouldering the affordable housing burden and the associated impacts on schools and public infrastructure.
Dartmouth College, whose student body alone represents close to half of the Town of Hanover’s population, and the Dartmouth Hitchcock Medical Center (DHMC), are responsible in large part for the quality of life and booming economy that we enjoy in the Upper Valley. Businesses and institutions such as Dartmouth College, DHMC, Timken, GDT, Dartmouth Printing, Hypertherm, and Spectra, to name just a few, sustain the Upper Valley economy by providing job opportunities spanning a range from highly paid professionals to janitorial staff and resulting in one of the lowest unemployment rates in the nation. In addition, these institutions provide cultural and educational opportunities together with the best in health care. Is it any wonder that the Upper Valley attracts so many professionals and "empty-nesters" with disposable income? A recent survey published on AOL, lists Hanover as the 6th best place to live in the United States for just these qualities and Money Magazine lists Hanover as the best place to retire to.
Hanover Affordable Housing Feasibility Study Executive
Summary i

Dartmouth College and the Dartmouth Hitchcock Medical Center between them employ a workforce of over 7,700 (full-time equivalent) and the College has over 1,800 off-campus students enrolled; and yet between them, the two institutions provide only approximately 650 units of housing in one form or another. Almost 500 of these units are provided by the College. The presence of those employees and students generate additional service sector jobs many of which are lower paying. Consequently, the affordable housing need generated by these institutions is far greater than the immediate needs of their employees and students.
The real estate market will not generate affordable housing in Hanover, land is simply too scarce, too valuable, and the demand for high-end units too strong. The median price of a home in Hanover between October of 2000 and the end of March 2001, was $318,900. To afford this home, assuming that a person could make a 20% down payment, and take a 30-year mortgage (depending upon other debt restrictions) would take an annual income of over $100,000. This eliminates the greater majority of Hanover’s workforce and even more of the Upper Valley’s workforce.
Dartmouth College, admirably, has proposed approximately 360 rental units between Rivercrest and North Park Street in Hanover, and Sachem Village in Lebanon. The construction of these units as presented will require zoning amendments in both communities and the Rivercrest site offers some logistical constraints besides the regulatory ones. The City of Lebanon rejected the most recent request for a zoning change at Sachem; we understand that when the Land Use chapter of the Lebanon Master Plan is complete, this issue might be revisited. In addition, the College proposes to build dormitory space for up to 400 of its estimated 685 off-campus undergraduate students over the next ten years.
The College's Grasse Road (ownership) units starting at approximately $200,000, are not affordable to households making less than approximately $78,000 a year; in fact, the majority of the newer units at Grasse Road sell for between $250,000 and $340,000, requiring even higher incomes. It should be noted that the College does provide mortgage assistance to higher- end faculty and staff. These units are affordable only to a very small segment of the College’s workforce. The College must produce units that are available to the full spectrum of its employees based on the Grafton County income levels; otherwise, the majority of Dartmouth College employees will continue to be excluded from the Hanover community.

Like Dartmouth College, Upper Valley businesses including Dartmouth Hitchcock Medical Center must consider either developing employee housing themselves, providing incentives for developers to produce housing that is affordable to their employees, and/or consider creating incentive programs for their employees including setting up and matching Individual Development Accounts for down payment funds or providing second mortgages. To that end the Upper Valley Workforce Housing Task Force comprised of banks, municipal officials, state agencies, businesses, regional planning commissions and affordable housing advocates, has begun working on an Upper Valley Workforce Housing Summit for the Fall and is creating committees to tackle the complex issues surrounding housing development.
Based on our survey of employees of Hanover businesses, approximately eighteen- percent (18%) of Hanover’s 8,592 person workforce households have incomes which put them in the Grafton County low-moderate income range. It should be noted that if we exclude responses from the Town employees and the School District employees who on average earn more than employees of other businesses particularly service sector employees, the percentage of low-moderate income households would increase significantly. More than 80% of those employees responding do not live in Hanover. A broader survey of employers which included more service-oriented businesses suggests that the percentage of the workforce living outside of Hanover is closer to 93%.
The Town of Hanover could increase the supply of affordable housing both through direct construction and through regulatory controls; this report provides many recommendations by which the Town and College could address the issue. Both the Town and the College should participate with the regional entities such as the Workforce Housing Task Force and Twin Pines Housing Trust as they endeavor to implement regional solutions to the affordable housing crisis. In Town, a first step would be establish the Hanover Housing Coalition as an official committee of the Town with an appropriate budget and endorse its mission to implement the recommendations contained at the end of this report. The Town should support and encourage Dartmouth College’s actions to increase the supply of housing in Hanover through regulatory changes. That said, if the Town of Hanover is committed to increasing the supply of affordable housing and increasing the diversity if its population, in all likelihood the Town will have to establish a Conditional Use Permit System which requires mandatory affordable housing quotas and provides density bonuses as a means to assist developers, including the College, comply with this requirement.
Hanover Affordable Housing Feasibility Study Hadfield Associates, July 2001
3

INTRODUCTION This study documents the findings of an affordable housing study completed for the Town of Hanover to determine the extent of the need for affordable housing in Hanover for elderly and disabled households and low-moderate income households. The project was funded by a Community Development Feasibility Grant (CDBG) from the New Hampshire Office of State Planning to the Town of Hanover. The purpose of this study was twofold. First to assess the need for affordable housing in the Town of Hanover for the above referenced populations and to propose mechanisms to realistically address that need, and second to develop a plan for the use of Town controlled property to provide some form of affordable housing in conjunction with the possible expansion of the senior center. In particular the study was to address the following: 1) Identify housing needs in the following categories: low-moderate income
elderly both disabled and non-disabled, non-elderly disabled, low-moderate single parent households and other low-moderate income households.
2) Based on a review of existing data and data collected through the study, develop a set of action strategies which would enable Hanover to address the identified affordable housing needs.
3) Work with Town staff to determine on the basis of the study what numbers and types of affordable Housing should be planned and constructed on the Senior Center property and what potential funding sources might be available.
We were asked to determine the types of affordable housing that should be planned and constructed on the Senior Center property referred to above. It is our understanding that discussions have focused on using the property for both a community center and an expanded senior center leaving little room for housing development. Consequently, while we have suggested additional units for this site, we have gone beyond these parameters to suggest housing projects which may be constructed elsewhere in the community in the event that buildable land can be made available either through the Town, Dartmouth College or private landowners. We have spent many hours during the past few months with Hanover Affordable Housing Coalition members, developers and area agencies trying to identify a parcel of land, without success. Consequently we have settled for identifying the extent of the need and suggesting housing models which are appropriate to Hanover. The Coalition will continue to work towards this goal.
Hanover Affordable Housing Feasibility Study Hadfield Associates, July 2001
4
While we have included a list of possible funding sources in the appendix, we should point out that funding affordable housing projects is complex and almost invariably requires juggling many different funding sources for a single project. It is not at all unusual to have nine or more funding sources including state, federal and private, for one project and these may be combinations of grants and loans all with different eligibility and application requirements. Consequently while we have offered a project as one option that Hanover might consider if the land were to become available, targeting specific funding sources at this time is not appropriate. Affordable Housing is a Regional Issue While this study looks at the need for affordable housing in Hanover, housing supply and affordability is a regional issue which is inextricably tied to the economy of the Region. The roots of the affordable housing problem are complex. Dependence upon local property taxes creates a disincentive for towns to allow growth which includes families. Local land use regulation creates barriers to a logical market response to the demand for new construction. The problem is often most prevalent in communities which either disallow or discourage forms of housing other than the traditional stick- built types and where developable land is at a premium. The under-utilization of alternate forms of housing in some communities further increases the impact on towns without such restrictions and generates a pervasive animosity between communities. The acute shortage of housing which is affordable to the region’s workforce has a direct impact on the economy of the region. Economic growth in New Hampshire is increasing the demand for housing far beyond the supply (1). The shortage is forcing middle-income families to purchase homes generally considered affordable to lower-to-moderate income households. The Upper Valley has one of the lowest unemployment rates in the United States. Businesses and institutions such as Dartmouth College, Dartmouth Hitchcock Medical Center (DHMC), Timken, GDT, Dartmouth Printing, Hypertherm, and Spectra, to name just a few, sustain the Upper Valley economy by providing job opportunities spanning a range from highly paid professionals to janitorial staff. In addition, these institutions provide cultural and educational opportunities together with the best in health care which contribute to the quality of life that Upper Valley residents enjoy and which attract so many professionals and “empty-nesters” with disposable income to the Upper Valley. A recent survey published on AOL, lists Hanover as the 6th best place to live in the United States for just these qualities and Money Magazine lists Hanover as the best place to retire to.
Hanover Affordable Housing Feasibility Study Hadfield Associates, July 2001
5

The ability of local businesses, including Dartmouth College, to recruit new employees and retain existing employees is becoming increasingly difficult and expensive. This dynamic creates a barrier to business expansion. One business told us that on average it costs them approximately $35,000 to simply hire one professional. All of the employers whom we surveyed told us that having their employees live in Hanover was not a major concern; however, how far their employees had to commute is a problem. Based on the information that we have collected, the average commute into Hanover is only 20 - 30 minutes, which is not considered extreme. However, lower-tier employees are buying or renting property in outlying towns, some of whom commute more than an hour each way. Employees with long commutes have less time to spend with their families and participate less in after-hours events such as school and local functions. This situation places the additional burden of transportation costs on those earning the least. The result is communities with lack of diversity of income, ethnicity and household type. The great majority of Hanover’s workforce does not have the opportunity to live and participate in the community where they work and many do not have the time to participate in the community in which they live. This problem is all too common across the nation. Impact of Dartmouth College While Hanover is unique in the Upper Valley community because of the presence of Dartmouth College it is not unique relative to other college communities. College communities are appealing to higher-income, educated professionals and retirees who can afford to pay the asking prices and who, in return, benefit significantly from the quality of life and cultural resources available to them. Add to this the presence of Dartmouth Hitchcock Medical Center in Lebanon close to the Hanover town line and the excellent reputation of the Hanover school systems and the result is a housing market totally out reach to low- moderate-and even middle-income households. In 1990, the “Regional Council on Affordable Housing Needs of Academic Communities” released a report which included a comprehensive study of the housing market in the region surrounding the University of Massachusetts (UMASS). (2) The report states that academic institutions are different from other economic entities in the following ways: ! By generating a need for housing, not only for students (when off campus),
they have a profound impact on the local housing market. In general, students, particularly graduate students are assumed to be low-income. Undergraduates, on the other hand, may still have parental support and not be averse to living in crowded quarters in order to reduce rent to an acceptable level.
Hanover Affordable Housing Feasibility Study Hadfield Associates, July 2001
6

! In addition, there is what is known as a “student retention factor”, that is, a percentage of students do not move on after graduation, but stay in the area.
Even though Dartmouth College may not be growing in the number of students, the region and the demand for housing will continue to grow on this retention basis alone. This is true for the Upper Valley where many new businesses have been created by Dartmouth College graduates or as ancillary research facilities for the College which in turn creates more employment. ! Faculty members are recruited nationwide and the packages that the
College offers to attract them must take into account housing costs. For example, for a potential employee currently working in the mid-west, the salary and benefits offered must be adequate to afford at least the same level of housing to which that person is used to. In turn, existing junior faculty or administrative staff who cannot find housing are more likely to respond to offers from other institutions. This is also true for area businesses. ! The presence of the student body and staff creates a demand for services,
supplies, food and entertainment businesses; services which are generally performed by lower-income persons. It has been estimated that while academic institutions tend to have smaller economic multipliers than other industries, still, for every three jobs in the educational sector, two additional jobs are generated, many of them low-paying. (3)
It is not a great leap to extrapolate that the low-moderate-income housing need generated by the College is much greater than the sum of the immediate needs of the faculty, students and employees. It is in the College’s best interest to have a supply of affordable housing for both staff and faculty and married graduate students. The regional lack of low-to- moderate-income housing affects the College as it does other Upper Valley businesses through recruitment costs, higher salaries and relocation packages. The report, prepared by OKM Associates Inc. and Rolf Geotze, on behalf of the Commission, provides a compendium of academic housing strategies for Academic Institutions based on their review of three major national surveys of academic housing strategies and the relationships between academic institutions and their communities. According to the report, “most academic institutions have limited their housing efforts to the two traditional housing strategies of building dormitories and providing direct loan programs to faculty. Only a few academic institutions have implemented innovative strategies to provide housing for junior faculty, administrative staff and lower-level employees, much less, non-affiliated community residents.”
Hanover Affordable Housing Feasibility Study Hadfield Associates, July 2001
7

While it is beyond the scope of this report to delve too far into the mechanisms by which a College could create affordable housing, according to OKM and Goetze, academic institutions like Dartmouth College, have significant resources available to them to help address the issue; these include lands and buildings, pension funds which can be prevailed upon to invest in community housing that will serve its participants, access to credit, research and design skills, communications to educate people about the affordable housing crisis, and other financial resources including endowments, capital fund raising programs, and access to tax-exempt bonds. In addition, we understand that for the College to subsidize units for faculty and staff would have tax implications. Other colleges and universities are subsidizing housing; therefore, we assume that more research will show that this is something that the College can do. Dartmouth Hitchcock Medical Center (DHMC) We have not extended our research of institutions to the impact of having a hospital in the community or region. However, we believe that the majority of the social and economic impacts generated by the College are also true for the Dartmouth Hitchcock Medical Center particularly in the creation of low-moderate income service sector jobs and the need for affordable housing. DHMC currently employs approximately 3,299 full time 1,307 part-time personnel. Approximately 13% of the hospital’s employees currently live in Hanover or Etna. While no official estimates have been released, it is our understanding that the hospital’s planned expansion is expected to generate at least a hundred new employees to begin with but that figure could increase substantially, further stressing an already critical housing market. The hospital has taken the radical step of contracting with Stone Farm to lease 60 units and leases an additional 34 units at New Hampshire House. The cost to hospital employees to rent a two-bedroom unit (1,000 sq ft) at Stone Farm in $950 per month, a one-bedroom rents for $850 a month. In addition, the hospital shares the units at the Rivercrest development in Hanover with Dartmouth College. Still, like the College and other area businesses, the hospital struggles to find housing for their employees. The hospital currently has no plans to construct housing that we are aware of. (4)
Hanover Affordable Housing Feasibility Study Hadfield Associates, July 2001
8

Zoning and Growth Controls The affordable housing shortage by itself provokes communities to protect themselves; restricting growth by imposing regulatory measures including lot coverage restrictions, large lot size requirements, or low housing density, and by limiting public infrastructure. The effect is spiraling land and housing costs which in turn negatively affect business efforts to recruit and retain employees. While one result is windfall gains to homeowners and landlords, this creates increasing hardship for renters and persons seeking to relocate to the area. Interestingly, another side effect of this is that those who can afford to purchase housing in the very high end range tend not to be families with young children, which, in a state dependent upon property taxes for education, provides further incentive to restrictive planning by communities. Impacts on Infrastructure Housing development can have a significant impact on a community’s infrastructure. More roads to plow, extension of sewer and water systems, and (the most sensitive of issues, especially in New Hampshire) the impact on the school systems. One impact of the housing shortage in Hanover is significantly higher traffic volumes in Hanover and in all of the surrounding communities and on major throughways contributing to lengthy commutes, degradation of air quality, and increasing traffic congestion. (5) Affordable housing has also become synonymous with children and impact on the school systems; however, in general low- moderate- income housing units do not create significantly more children than other middle-income housing developments of corresponding size, number of units and number of bedrooms per unit. While there is unquestionably a moral argument that people have a right to have children and those children have a right to an education, another argument for providing housing is one of economics: people with school age children, tend to be older, more financially established and less likely to move their children between schools, making for a more stable workforce. The most recent U.S. Census figures show a significant decline in the childbearing age groups and correspondingly in the under 10 and under 5 year old age groups. While we discuss this is more detail later in the study, we expect that there will be a corresponding decline in the number of school age children for the foreseeable future, thus reducing the stress on school systems and off-setting the need for expansion created by potential affordable housing construction. Consequently, the impact on schools may not be a significant issue at the present time.
Hanover Affordable Housing Feasibility Study Hadfield Associates, July 2001
9

Fair Share Concept The Fair Share Concept is not new terminology but is greeted with both skepticism and chagrin depending on the community; however, there is both statute and case law to the effect that communities must provide for their fair share of affordable housing. “The fair share concept originated from the Mount Laurel cases in New Jersey, in which it was established that exclusionary zoning is not a legitimate land-use technique. In the Mount Laurel II decision, the New Jersey Supreme Court indicated that all municipalities are responsible for providing a realistic opportunity for the construction of their fair share of the region’s present need for low income housing”. (6) As lower income workers move to outlying communities in search of affordable housing, buy homes and have families, the impact of providing housing falls onto those towns. The increased tax revenue from housing development in general does not cover the associated annual costs particularly in regards to education. In response, local property taxes rise, further increasing housing costs to lower tier workers. In a nutshell, communities that do not allow affordable housing to be built either because of land use restrictions or because of potential impact on schools are simply not carrying their fair share of the burden of providing housing for the region’s workforce. What is affordable? An explanation of the terminology used in this study is important particularly as it relates to potential funding mechanisms. For the purpose of this study we have used the Housing and Urban Development (HUD) definition of “affordable” which states that “ for families that have incomes below 80% of the median family income for the county which is $47,500 (Grafton), and who are spending 30% or less of their income on housing”: for example, a hypothetical family making 70% of the median income for Grafton County would earn $33,250. If that family is spending more than $9,975 (30%) per year on housing inclusive of taxes and utilities, which translates to approximately $830 per month, using the HUD definition, that housing would not be considered affordable.
Hanover Affordable Housing Feasibility Study Hadfield
Associates, July 2001
10

What is low - moderate income? State and federal assistance is geared toward low- moderate-income persons including the homeless. Indeed, all current legislative proposals in New Hampshire are aimed at the homeless and low and moderate-income households. Under the CDBG program through which this study was funded, the terms low and moderate are based on a percentage of the Grafton County median family income with 60 - 80% being considered moderate, less than 60% being considered low. A copy of the current income levels is included in Appendix III. (7) It should be noted that some programs use 80 - 120 percent of median household income as moderate and 60 -80 percent of median household as low. While this family vs. household median is a little confusing, because family income tends, in general, to be at least 20% higher than household income, the two resulting figures are actually very close. It should be noted that the definition of a family includes groups of related individuals whereas households may be non-related individuals. Eligibility levels also vary between rental assistance programs and home ownership programs. For example, the New Hampshire Housing Finance Authority provides home ownership assistance to families earning up to $58,800 which equates to just over 120% of median family income for Grafton County. Affordable housing has also become synonymous with low-income housing particularly since tax credits have become a major source of funding for affordable housing projects. However, because of the huge disparity between the county median income limits upon which awards are based and the area or community median income limits, non-profit housing developers often have problems identifying households with incomes low enough to qualify for the projects created using tax credits in the area for which the units were constructed to serve(8).When funds such as Community Development Block Grants (CDBG) are combined with tax credits the units are restricted to the tax credit income criteria as well the CDBG rent criteria. What are we calling middle income? We have used the term “middle-income” to define the need for housing for families and households which fall into the gap between income brackets for which state or federal assistance is available and the reality of what is affordable in Hanover. In particular, for the difference between the Grafton County median family income and the Town of Hanover median family income. Between 1990 and 2000, the Grafton County median family income rose from $35,489 to $47,500, an increase of 34%. If we assume that the Hanover 1990 median family income of $65,488 increased by the same percentage, Hanover’s median family income would be approximately $89,700. (Note: these figures should be verified and updated as the 2000 Census income data becomes available in July of 2002) Workforce Housing
Hanover Affordable Housing Feasibility Study Hadfield
Associates, July 2001
11
At a recent seminar on New Hampshire’s seacoast the term “Workforce Housing” was used to describe housing which can be affordable to the region’s working families (9). Many of the Upper Valley’s working families earn less than $30,000 and can not find affordable housing; indeed many working families earning $70,000 can not find housing in the Upper Valley area. The need for workforce housing spans the range from low- moderate- middle income. Any discussion of affordable/workforce housing should include all of these categories. Efforts should be made to expand the definition of affordable/workforce housing as it applies to state and federal programs and eligibility criteria; federal and state programs should be encouraged to use “area” definitions for median income levels rather than county definitions. Resources/Advocacy The Upper Valley has a wealth of resources that can work together to address housing needs. In particular the Twin Pines Housing Trust, Vital Communities, Lebanon Housing Authority, Upper Valley Housing-Bittinger Associates, Mascoma Bank, Upper Valley Lake Sunapee Regional Planning Commission, Habitat for Humanity, Dartmouth College, Dartmouth Hitchcock Medical Center, Chambers of Commerce, Realtors, Upper Valley businesses, and not least, the newly formed Hanover Affordable Housing Coalition led by the very energetic Bob Strauss. An Upper Valley Workforce Housing Task Force with a membership from banks, businesses, municipalities and Upper Valley non-profits was also recently created. The first action of this group is to hold a “Workforce Housing Summit” in the Upper Valley this fall. In addition to agencies that are involved, there is access to state and federal funding for the low- moderate-income housing development and potential private resources, both local and national, for what we are referring to as “middle-income” households. In the spring of 2001, the Hanover Affordable Housing Coalition organized a series of seminars to educate Hanover residents about what affordable housing is, and why Hanover should take steps to provide housing. The seminars were invaluable for both the educational opportunities that they presented as well as generating drive and enthusiasm for providing a potential ongoing capacity to actually develop housing.
Hanover Affordable Housing Feasibility Study Hadfield
Associates, July 2001
12

METHODOLOGY In order to identify and quantify the need for the household types requested by the Town we took the following steps: ! Reviewed existing data on area demographics, housing information, US
Census statistics, traffic and commuting information, employment figures, and other recent relevant studies, statistical, demographic and employment data.
! Human services and affordable housing providers from around the Upper Valley and Grafton County were interviewed including the Hanover's Community Counselor, Lebanon Housing Authority, Twin Pines Housing Trust, Headrest, WISE, Casey Family Services.
! Interviewed local real estate professionals in the area to understand factors about current Hanover land and housing market, i.e. home purchase costs, land costs, rental costs, and their availability.
! Interviewed major local employers to understand the needs of employees for low-moderate income housing
! Over 1,000 employee surveys were distributed between 5 major employers including the Town of Hanover and the School Administrative Unit, Spectra, Hypertherm and the Hanover Coop Foodstore.
! Interviewed Dartmouth College Real Estate and Dartmouth College Housing offices: They have provided us with the results of their own employee housing survey.
! To gain a perspective on how other college communities are dealing with the housing issue we contacted Bennington and Amherst Colleges and the Chambers of Commerce in those areas to review housing actions/strategies.
! Reviewed Sections of the Town’s Draft Master Plan which is currently being updated, and reviewed Planning Board work and maps as they relate to housing and remaining areas of developable space in the town, and the Town's Zoning Ordinance.
! We have worked with local housing professionals and developers, Town staff, and the Hanover Affordable Housing Coalition to identify potential projects.
! We have researched what other communities have done with their zoning to allow and encourage developers to build affordable housing.
! Finally, we have researched state and federal funding programs that currently exist.
Hanover Affordable Housing Feasibility Study Hadfield
Associates, July 2001
13
Given the very high median incomes for the Town of Hanover relative to the rest of the Upper Valley and to Grafton County, coming up with a range of affordable housing needed in the community was a challenge. Six major focus areas arose from our discussions and research over the last few months: ! Identifying the need for those persons falling into the categories under
which this study was developed- low- moderate-income persons, low-mod elderly and disabled.
! How to categorize the need for housing to assist businesses with
recruitment and retention. ! Many people expressed concerns that people who work in town cannot live
in town. ! Students aside, Hanover should at the very least provide its fair share of
affordable housing for the region’s workforce. ! How to categorize the need given the huge disparity between affordable
housing as defined by Grafton County income criteria and the reality of what constitutes affordability in Hanover.
! What obligation does Dartmouth College have to house students, staff and
faculty particularly with respect to undergraduate students and employees at the lower end of the pay scale?
Hanover Affordable Housing Feasibility Study Hadfield
Associates, July 2001
14

Because, as we believe, the majority of low- moderate-income persons who would live in Hanover if the housing were affordable are currently living in outlying communities, looking only at current Hanover residents or Dartmouth College would not give us a picture of the housing need in the community. This assumption is validated by the results of our employee survey and of the survey of employers. Therefore we looked at low- moderate income housing need using five different methods.
! We asked local social service providers what they believed to be the need
for affordable housing. ! We looked at the 1995 Regional Fair Share Housing Analysis of the Upper
Valley Lake Sunapee Regional Planning Commission. ! We looked at the 1990 Census data for Hanover to find out what
percentage of 1990 Hanover households would fall into the low-moderate and middle- income categories.
! We interviewed Human Resources personnel from 8 Hanover businesses,
and distributed over 1,000 surveys to employees of 5 of those Hanover businesses, of which 238 were returned. Questions ranged from household income as defined by HUD, need for housing, wish to live in Hanover, what price ranges were considered affordable, etc.
! We reviewed the Dartmouth College 2000 Housing Survey and commuting
data of College employees. We also asked Dartmouth College to provide us with a breakout of employees by job classification and pay range so that we could come up with a percentage of employees who might fit the low-moderate income category (10). While we have received information regarding the percentage of employees by job category we have not yet received information on pay scales. Therefore we have made the assumption that the percentage of Dartmouth College employees who are low and moderate-income mirrors that of employees from other businesses in the community. However, given that approximately 47% of Dartmouth College’s employees are non-salaried, hourly workers, we believe that the percentage of Dartmouth College employees in low and moderate-income households may be significantly higher. As more data becomes available from both the College and from the 2000 Census this topic could be revisited.
Hanover Affordable Housing Feasibility Study Hadfield
Associates, July 2001
15

Hanover Affordable Housing Feasibility Study Hadfield
Associates, July 2001
16

Review of Existing Data It is not the intent of this study to duplicate existing data. We will quote existing data only as it pertains to our goal of identifying certain segments of the population for which there is a need for housing, particularly low- moderate income. Our study uses data drawn from a number of sources including employee surveys, interviews, housing studies, and state and federal statistics, such as the 2000 Census. A great deal of data already exists. One of our biggest challenges was digesting and sifting the data enough to be able to summarize the problem. That said, we relied heavily on two documents to provide information. In 1993 Douglas Kennedy Associates prepared a Housing Profile for the Town of Hanover which based the majority of its conclusions regarding population, housing and income on the 1990 Census data. Much of this Profile is repeated verbatim in the Housing Section of the draft of the new Hanover Master Plan. We have used the 1990 income figures summarized by Kennedy because the 2000 Census data for income will not be released until July of 2002. We encourage readers to refer to the Housing Profile as background material. It should be noted that one of the final conclusions of the Housing Profile was that an appropriate affordable housing model for the Town of Hanover would be ownership units oriented towards moderate-income persons. The second document upon which we have relied heavily is the “Report of the Regional Commission on Affordable Housing Needs of Academic Communities, January 1990” This report, generated by project consultants: OKM Associates, Inc. and Rolf Geotze, analyzes the conditions affecting the availability of affordable housing in Amherst, Mass. and the surrounding region and presents strategies for both academic institutions and municipalities. One of the most interesting documents that we reviewed was the “New Hampshire Basic Needs and a Livable Wage” (June, 2000 North Country Council et al). The report estimates the costs of basic needs in New Hampshire for different household types. The basic needs include food, rent and utilities, basic telephone, clothing and household expenses, transportation, childcare, personal expenses and savings. This report is summarized further below. It should be noted that our survey of business employees took place in January through March of 2001 and was based on the year 2000 income limits for state and federal programs which was current at the time. Under these guidelines, the median income for a family of four in Grafton County was $37,350. The recently issued 2001 income limits raise this figure to $39,900, an increase of 6.5%. Given the responses to the surveys however we do not believe that this factor changes the outcome significantly. Population
Hanover Affordable Housing Feasibility Study Hadfield
Associates, July 2001
17
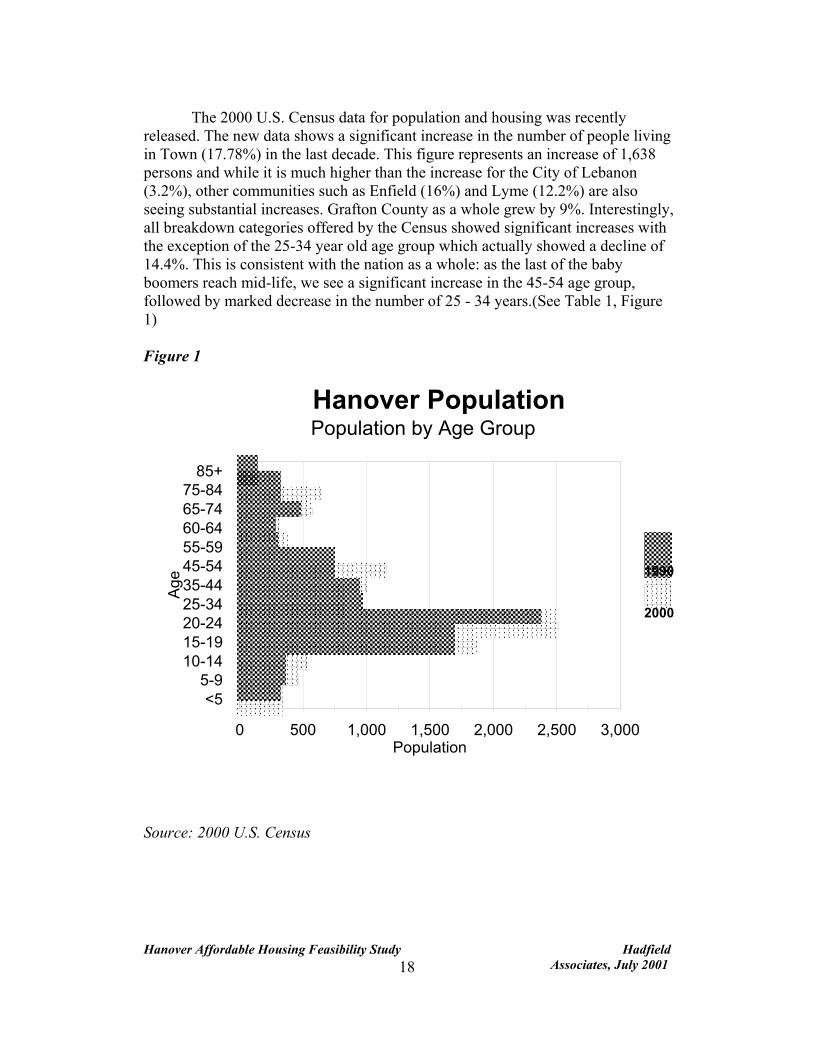
The 2000 U.S. Census data for population and housing was recently released. The new data shows a significant increase in the number of people living in Town (17.78%) in the last decade. This figure represents an increase of 1,638 persons and while it is much higher than the increase for the City of Lebanon (3.2%), other communities such as Enfield (16%) and Lyme (12.2%) are also seeing substantial increases. Grafton County as a whole grew by 9%. Interestingly, all breakdown categories offered by the Census showed significant increases with the exception of the 25-34 year old age group which actually showed a decline of 14.4%. This is consistent with the nation as a whole: as the last of the baby boomers reach mid-life, we see a significant increase in the 45-54 age group, followed by marked decrease in the number of 25 - 34 years.(See Table 1, Figure 1) Figure 1
0 500 1,000 1,500 2,000 2,500 3,000Population
<55-9
10-1415-1920-2425-3435-4445-5455-5960-6465-7475-84
85+
Age
������������������������������������
��������������������������������������������������������������������������������������������������������������������������������������������������
������������������������������������������������������������������������������������������������������������������������������������������������������������������������������������������������������������������������������������������������������������
������������������������������������������������������������������������������������
��������������������������������������������������������������������������������������������������������������
������������������������������������������
����������������������������������
������������������������������������������������������������������������������
�������������������������������������������������������
��������������������������������������������������������������������������������������������������������������������������������������������������������������������������
������������������������������������������������������������������������������������������������������������������������������������������������������������������������������������������������������������������������
����������������������������������������������������������������������������
��������������������������������������������������������
����������������������������������
����������������
���������������������������������1990����������������������
2000
Hanover Population Population by Age Group
Source: 2000 U.S. Census
Hanover Affordable Housing Feasibility Study Hadfield Associates, July 2001
18
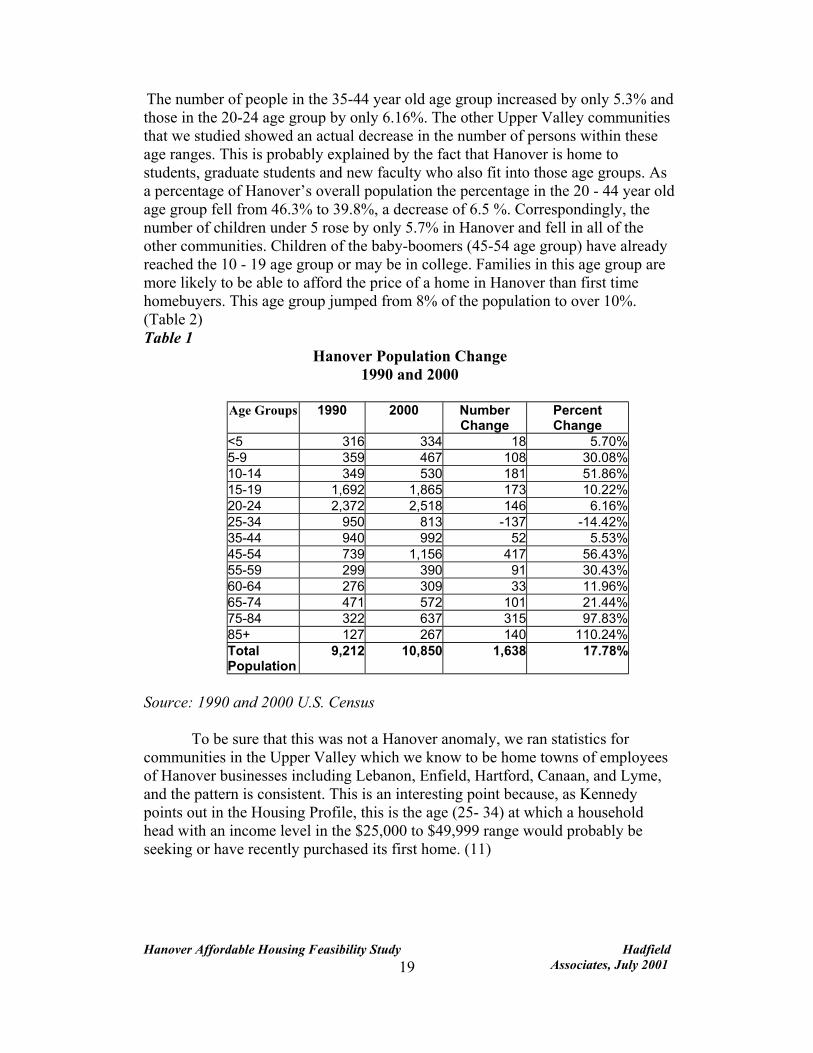
The number of people in the 35-44 year old age group increased by only 5.3% and those in the 20-24 age group by only 6.16%. The other Upper Valley communities that we studied showed an actual decrease in the number of persons within these age ranges. This is probably explained by the fact that Hanover is home to students, graduate students and new faculty who also fit into those age groups. As a percentage of Hanover’s overall population the percentage in the 20 - 44 year old age group fell from 46.3% to 39.8%, a decrease of 6.5 %. Correspondingly, the number of children under 5 rose by only 5.7% in Hanover and fell in all of the other communities. Children of the baby-boomers (45-54 age group) have already reached the 10 - 19 age group or may be in college. Families in this age group are more likely to be able to afford the price of a home in Hanover than first time homebuyers. This age group jumped from 8% of the population to over 10%. (Table 2) Table 1
Hanover Population Change 1990 and 2000
Age Groups
1990 2000 Number
Change Percent Change
<5 316 334 18 5.70% 5-9 359 467 108 30.08% 10-14 349 530 181 51.86% 15-19 1,692 1,865 173 10.22% 20-24 2,372 2,518 146 6.16% 25-34 950 813 -137 -14.42% 35-44 940 992 52 5.53% 45-54 739 1,156 417 56.43% 55-59 299 390 91 30.43% 60-64 276 309 33 11.96% 65-74 471 572 101 21.44% 75-84 322 637 315 97.83% 85+ 127 267 140 110.24% Total Population
9,212 10,850 1,638 17.78%
Source: 1990 and 2000 U.S. Census To be sure that this was not a Hanover anomaly, we ran statistics for communities in the Upper Valley which we know to be home towns of employees of Hanover businesses including Lebanon, Enfield, Hartford, Canaan, and Lyme, and the pattern is consistent. This is an interesting point because, as Kennedy points out in the Housing Profile, this is the age (25- 34) at which a household head with an income level in the $25,000 to $49,999 range would probably be seeking or have recently purchased its first home. (11)
Hanover Affordable Housing Feasibility Study Hadfield
Associates, July 2001
19
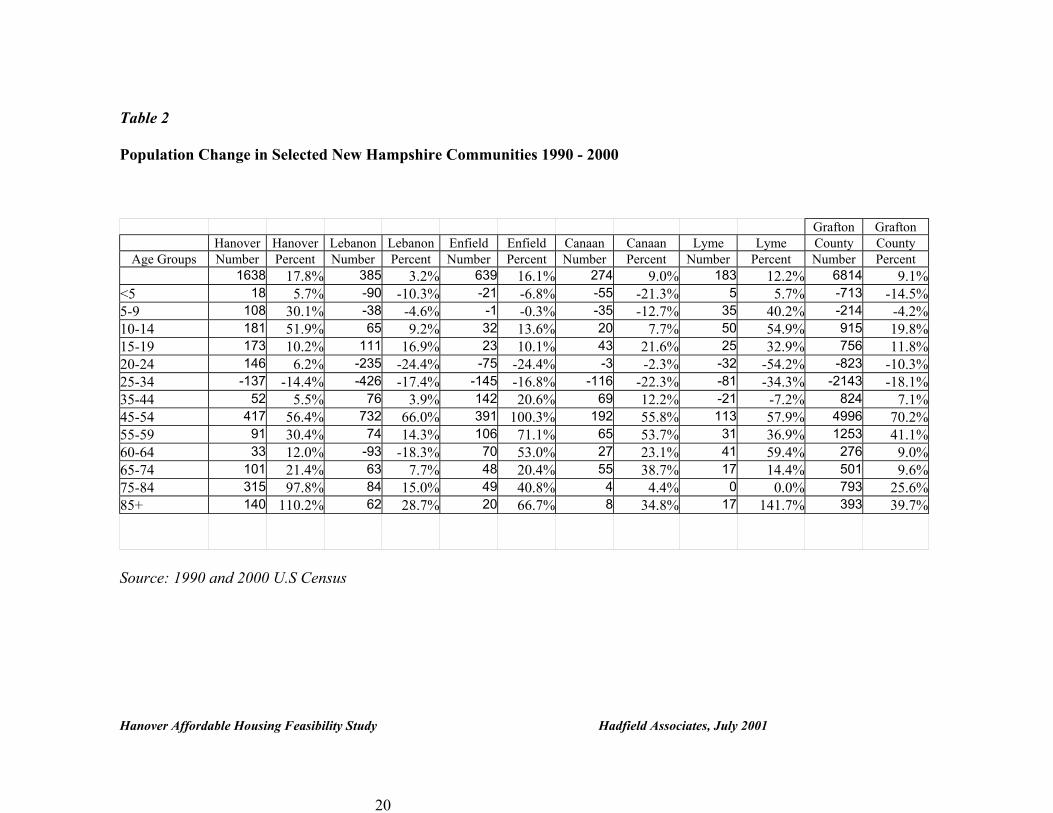
Table 2 Population Change in Selected New Hampshire Communities 1990 - 2000
Grafton GraftonHanover Hanover Lebanon Lebanon Enfield Enfield Canaan Canaan Lyme Lyme County County
Age Groups Number Percent Number Percent Number Percent Number Percent Number Percent Number Percent 1638 17.8% 385 3.2% 639 16.1% 274 9.0% 183 12.2% 6814 9.1%
<5 18 5.7% -90 -10.3% -21 -6.8% -55 -21.3% 5 5.7% -713 -14.5% 5-9 108 30.1% -38 -4.6% -1 -0.3% -35 -12.7% 35 40.2% -214 -4.2% 10-14 181 51.9% 65 9.2% 32 13.6% 20 7.7% 50 54.9% 915 19.8% 15-19 173 10.2% 111 16.9% 23 10.1% 43 21.6% 25 32.9% 756 11.8% 20-24 146 6.2% -235 -24.4% -75 -24.4% -3 -2.3% -32 -54.2% -823 -10.3% 25-34 -137 -14.4% -426 -17.4% -145 -16.8% -116 -22.3% -81 -34.3% -2143 -18.1% 35-44 52 5.5% 76 3.9% 142 20.6% 69 12.2% -21 -7.2% 824 7.1% 45-54 417 56.4% 732 66.0% 391 100.3% 192 55.8% 113 57.9% 4996 70.2% 55-59 91 30.4% 74 14.3% 106 71.1% 65 53.7% 31 36.9% 1253 41.1% 60-64 33 12.0% -93 -18.3% 70 53.0% 27 23.1% 41 59.4% 276 9.0% 65-74 101 21.4% 63 7.7% 48 20.4% 55 38.7% 17 14.4% 501 9.6% 75-84 315 97.8% 84 15.0% 49 40.8% 4 4.4% 0 0.0% 793 25.6% 85+ 140 110.2% 62 28.7% 20 66.7% 8 34.8% 17 141.7% 393 39.7%
Source: 1990 and 2000 U.S Census
Hanover Affordable Housing Feasibility Study Hadfield Associates, July 2001
20
Not surprisingly, the percentage of seniors in the community more than doubled in the oldest resident categories 85 and over (+110%), and 75-84 (+98%). The number of people in the 65-74-age group increased by 21%. This clearly reflects the presence of such elderly housing as Kendall, Outreach House and South Main Housing, as well as the fact that we are an aging population. While all communities saw dramatic increases in this segment of the population, Hanover’s increase was substantially greater. The population of residents 65 and over rose just under 10% of the population in 1990 to 13.6% in 2000. The increase in the percentage of senior citizens in Hanover corresponds with a smaller percentage of residents (56%) in the 20 - 64 year old group (labor force) when compared to other Upper Valley communities, Lebanon 61%, Enfield 65%, Canaan 61%, Lyme 57%. However, only 55% of Grafton County residents are in this labor force age group.
Hanover Affordable Housing Feasibility Study Hadfield
Associates, July 2001
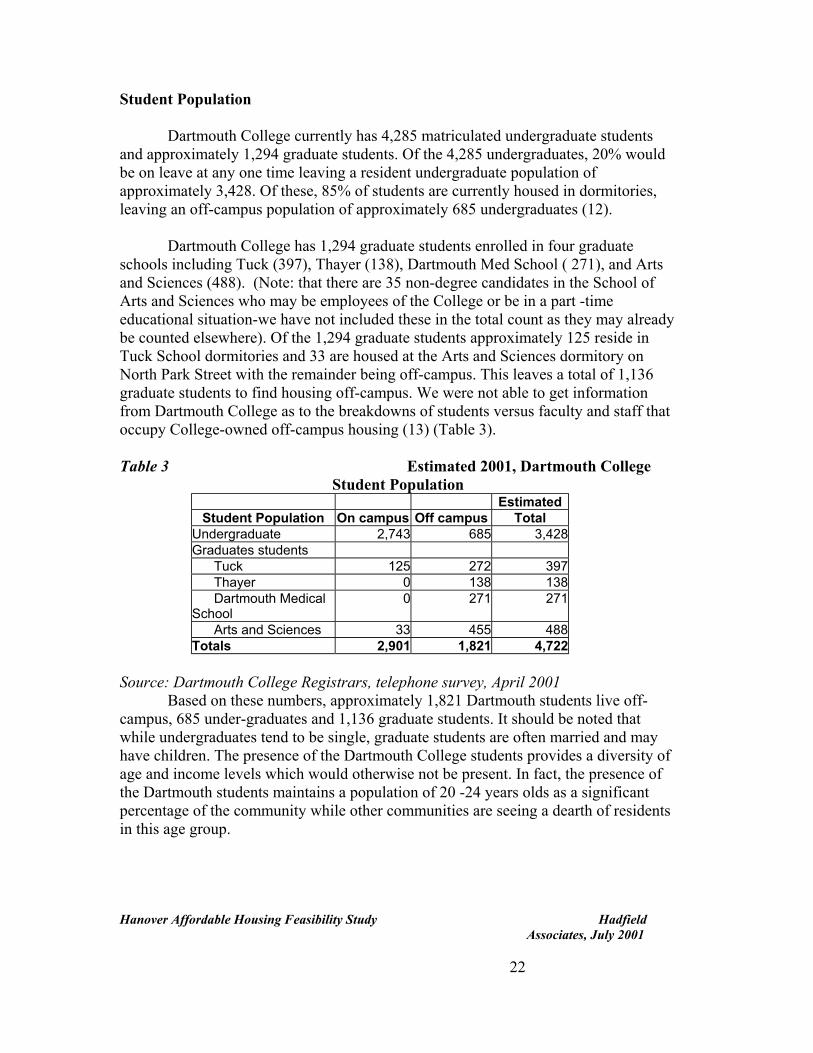
Student Population Dartmouth College currently has 4,285 matriculated undergraduate students and approximately 1,294 graduate students. Of the 4,285 undergraduates, 20% would be on leave at any one time leaving a resident undergraduate population of approximately 3,428. Of these, 85% of students are currently housed in dormitories, leaving an off-campus population of approximately 685 undergraduates (12). Dartmouth College has 1,294 graduate students enrolled in four graduate schools including Tuck (397), Thayer (138), Dartmouth Med School ( 271), and Arts and Sciences (488). (Note: that there are 35 non-degree candidates in the School of Arts and Sciences who may be employees of the College or be in a part -time educational situation-we have not included these in the total count as they may already be counted elsewhere). Of the 1,294 graduate students approximately 125 reside in Tuck School dormitories and 33 are housed at the Arts and Sciences dormitory on North Park Street with the remainder being off-campus. This leaves a total of 1,136 graduate students to find housing off-campus. We were not able to get information from Dartmouth College as to the breakdowns of students versus faculty and staff that occupy College-owned off-campus housing (13) (Table 3). Table 3 Estimated 2001, Dartmouth College Student Population
Estimated Student Population On campus Off campus Total
Undergraduate 2,743 685 3,428 Graduates students Tuck 125 272 397 Thayer 0 138 138 Dartmouth Medical School
0 271 271
Arts and Sciences 33 455 488 Totals 2,901 1,821 4,722
Source: Dartmouth College Registrars, telephone survey, April 2001 Based on these numbers, approximately 1,821 Dartmouth students live off-campus, 685 under-graduates and 1,136 graduate students. It should be noted that while undergraduates tend to be single, graduate students are often married and may have children. The presence of the Dartmouth College students provides a diversity of age and income levels which would otherwise not be present. In fact, the presence of the Dartmouth students maintains a population of 20 -24 years olds as a significant percentage of the community while other communities are seeing a dearth of residents in this age group.
Hanover Affordable Housing Feasibility Study Hadfield
Associates, July 2001
22

Household Size and Types Despite the presence of the Dartmouth College student population, the percentage of non-family households and householders who live alone is actually lower in Hanover than it is in Lebanon and other surrounding communities. In addition, while it might be expected that the off-campus student population would increase the number of persons per unit resulting in overcrowding, the 2000 U.S. Census figures do not substantiate this. While the average size of renter occupied units (2.25) is higher than the corresponding percentage for Lebanon, it is consistent with that of other Upper Valley communities. The presence of the Dartmouth College students is however, clearly reflected in the Median Age as compared to other communities (Table 4). Table 4 Selected Statistics of Upper Valley Communities 2000 Median Non Average Average Avg. Size of Avg. Size of
Age Family Household Family Owner Occupied Renter Occupied
Households Size Size Units Units Grafton County 37 11,332 2.38 2.9 2.51 2.11 Canaan 37.7 349 2.59 3 2.64 2.37 Enfield 38.3 683 2.33 2.78 2.42 2.07 Grafton 38.8 149 2.5 3.01 2.51 2.46 Hanover 22.8 1,071 2.47 2.96 2.59 2.25 Lebanon 37.1 2,322 2.23 2.87 2.5 1.93 Lyme 42.6 203 2.46 2.96 2.58 1.95 Orange 38.3 26 2.69 2.98 2.65 3.5 Orford 40.4 161 2.32 2.84 2.43 1.89 Piermont 40.8 95 2.41 2.9 2.41 2.42 Source: 2000 U.S. Census
Hanover Affordable Housing Feasibility Study Hadfield
Associates, July 2001
23

Housing Stock The 2000 U.S. Census has released total counts of housing units but not a breakdown by type of housing unit. In 1990 there were 2,623 units of which 2,321 were occupied and 302 vacant. (This vacant figure includes seasonal units). The number of housing units increased by 14% (366) to 2,989 during the years between 1989 and 1999. Of the 2,989 units, 2,832 are occupied and 157 are listed as vacant. It should be noted that the 2000 Census shows that the number of occupied units has actually increased by 511 (22.2%) from the 1990 Census and the number of seasonal units has been reduced correspondingly. This would help to account for where the additional 1,638 people are living. Of the occupied units, 1,869 (66%) are owner occupied and 963 (34%) are renter occupied. The vacancy rate for owner occupied (year-round )is 0.8% and for rental units is 0.9% (table 5, Figure 2). Figure 2 Source: 200
Hanover Affo
0
500
1000
1500
2000
2500
3000
Num
ber o
f uni
ts
Total Units Owner Occ. Renter Occ. Vacant
������������������������������������������������������������������������������������������������������������������������������������������������������������
������������������������������������������������������������������������������������������������
����������������������������������������������������
������������������������
������������������������������������������������������������������������������������������������������������������������������������������������������������������������
���������������������������������������������������������������������������������������������������������������������
������������������������������������������������������������ �������������
������������������ 1990
������������������ 2000
Housing Units1990 and 2000 Census
0 U.S. Census
rdable Housing Feasibility Study Hadfield Associates, July 2001
24

Table 5 Housing Stock - Selected Upper Valley Communities 2000
Total Occupied Vacant For Seasonal Homeowner Rental Owner Renter General Housing Housing Housing or Occasional Vacancy Vacancy Occupied Occupied Quarters Units Units Units Use Rate (%) Rate (%) Units Units
Grafton County 6,388 43,729 31,598 12,131 10,428 2 3.7 21,677 9,921 Canaan 0 1,588 1,279 309 239 0.7 3.2 1,064 215Enfield 25 2,372 1,975 397 343 0.8 2 1,426 549Hanover 3,849 2,989 2,832 157 111 0.8 0.9 1,869 963 Lebanon 290 5,707 5,500 207 52 0.5 2.1 2,893 2,607Lyme 10 752 678 74 44 2.5 0.8 550 128Orange 0 134 111 23 21 0 0 105 6Orford 0 561 470 91 66 2.1 2.1 376 94Piermont 0 394 294 100 85 2.4 3.7 242 52 Source: 2000 U.S. Census
Hanover Affordable Housing Feasibility Study Hadfield Associates, July 2001
25

By comparison the number of units in Enfield grew by 10%, Canaan 10.6%, Lyme 8.5 % and in Grafton County as a whole by 3.6%. (Note: The 2000 Census data shows Lebanon as actually losing housing units with 5,718 in 1990 and only 5,707 for 2000. The NH Office of State Planning believes this to have come from an enumeration error in the 1990 Census and that the 2000 Census is correct. The City of Lebanon has issued over 250 building permits in the last decade). Vacancy rates in those communities parallel Hanover for owner occupied units with the exception of Lyme which shows an ownership vacancy rate of 2.5% (neighboring Orford is 2.1% and Piermont 2.4%). However, rentals are more available in Enfield (2%), Canaan (3.2%), and Lebanon (2.1%). As you travel further north and east the availability of rentals increases with Orford (2.1%), Piermont (3.7%), and Dorchester (10%). Dartmouth College Housing Stock The College currently has approximately 440 units of rental housing off-campus including 61 units at Rivercrest Housing (of which 1 is a single family and 60 are duplex units). These units are shared with DHMC; the split is currently approximately 25% DHMC and 75% College employees and graduate students. (14) There are 32 units at Fletcher and Chandler Circles (of which 31 are three bedrooms and 1 two-bedroom), and 6 three-bedroom units are on Burton Road off East Wheelock. The College is in the process of developing graduate student housing on North Park Street and Wheelock and expects to create between 80 and 100 beds in community living style quarters. In addition, the College has a large number of apartments scattered throughout town, particularly in the Valley Road area. In Lebanon, the College also owns 132 housing units at Sachem Village and two single-family homes elsewhere in the City. According to Susie Weider in the Dartmouth College Rental Housing Office, they are currently able to provide housing for only 22% of those requesting it. In addition, there are simply not enough beds for the number of students who want to be on campus (15). Although the College has no set housing policy at this time, we understand that the draft Master Plan contains provisions to provide on-campus housing to 400 of the 685 off-campus undergraduate students over the next ten years by building new dormitories. The College has asked the City of Lebanon for a zoning change which would increase the development capability of Sachem Village to between 220 and 260 housing units. However, the Lebanon City Council recently rejected the proposed zoning amendment which would have allowed that expansion and the College is now examining other possibilities at Sachem. In addition, there is a significant expansion proposed at Rivercrest which would more than quadruple the number of rental units from 61 to 244. This proposal will also require a zoning amendment, this time from the Town of Hanover, to allow increased density on that site. However, the site also has logistical constraints due to the presence of Dartmouth College facilities buildings on the site which must be relocated. (16)
Hanover Affordable Housing Feasibility Study Hadfield
Associates, July 2001
26
A significant portion of the College’s housing units are considered transitional with the intent being that graduate students, faculty or staff can rent until they can find a permanent residence. The College does provide mortgage assistance for faculty and upper level administrative staff (17). After three years tenants of rental units are charged a 10% surcharge which is added each year after to discourage renters from remaining in the housing beyond three years. However, the shortage of either alternative rental housing or affordable housing is a strong disincentive for persons to move. In some cases it is cheaper to continue living in those units and pay the surcharge each year. Those tenants that do move are generally forced to relocate outside of Hanover. Given the shortage of housing throughout the Upper Valley, the College should reevaluate the transitional housing policy. In addition to providing rental housing, the College has constructed 32 single-family units on Grasse Road. Phase 2 of Grasse Road, now under construction, contains an additional 23 units. These units were all applied for by prospective buyers in just a few hours. With the smallest of these units (1200 sq. feet approx) priced a little lower at $199,900, the average price is around $240,000 to over $340,000. It is our understanding that the College, given the huge demand for Phase 2, has speeded up the permitting for Phase 3 and is current surveying and delineating wetlands (18). It should be noted that the College retains first right of refusal and the resale price is adjusted by the Consumer Price Index and improvements to an amount no more than $2,500 per year. Mortgage assistance is available to some employees. The College owns a number of properties in town which may be suitable for high density housing particularly the 70-acre Sullivan/Gibson tracts (also know as Sandhill). This property is close to the downtown and has access to public facilities. We understand that the College is considering this property for housing but as yet has not developed plans. (Source: Dartmouth College Real Estate)
Hanover Affordable Housing Feasibility Study Hadfield
Associates, July 2001
27

Median Housing Values Kennedy’s Housing Profile examined the median value of a home in Hanover and in the commuter-shed, which is defined as a 20-mile radius of the town. In 1990 over 50% of the Town’s housing stock exceeded $200,000 in value, whereas the similar figure for the commuter shed is 14%. In 1990 median home value for the Town as a whole was $215,476 compared to that commuter-shed figure of $113,889. At our request, the New Hampshire Housing Finance Authority (NHHFA) tabulated the median purchase prices of homes in New Hampshire communities from which we know Hanover employees to be commuting and, for which a large enough sample was available for the year 2000 (table 6). For that year, the median purchase price of an existing single family home in Hanover (excluding condominiums) was $310,500 compared with a median price for a single family home in the Hanover- Lebanon market area of $122,500. The median price for a single family (non-condominium) home in Lebanon was approximately $134,200. Table 6 Median Purchase Price for Single Family Primary Residences In Selected NH Municipalities 2000
Towns All Homes ExistingHomes
Non -Condo minimum
Median Purchase
Price
Sample Size
Median Purchase
Price
Sample Size Median Purchase
Price
Sample Size
Hanover $282,000 91 $282,000 87 $310,500 80 Lebanon $129,250 106 $128,000 98 $134,200 88 Plainfield N/A 25 N/A 21 N/A 23 Claremont $77,000 149 $77,000 147 $77,000 149 Lyme N/A 21 N/A 16 N/A 13 Grantham $140,750 76 $137,000 69 $148,750 58 Enfield $111,000 51 $111,000 51 N/A 45 Canaan N/A 28 N/A 26 N/A 28 Hanover-Lebanon
$120,000 547 $119,000 515 $122,500 484
Market Area Source: New Hampshire Housing Finance Authority
Hanover Affordable Housing Feasibility Study Hadfield
Associates, July 2001
28
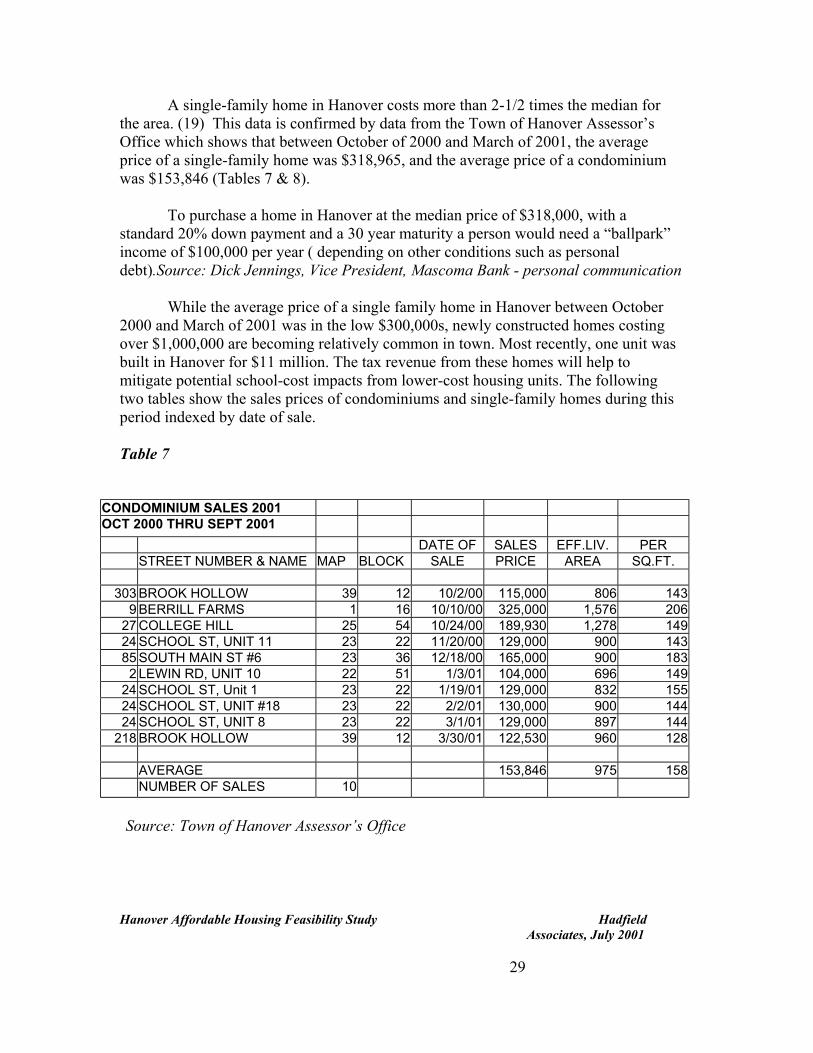
A single-family home in Hanover costs more than 2-1/2 times the median for the area. (19) This data is confirmed by data from the Town of Hanover Assessor’s Office which shows that between October of 2000 and March of 2001, the average price of a single-family home was $318,965, and the average price of a condominium was $153,846 (Tables 7 & 8). To purchase a home in Hanover at the median price of $318,000, with a standard 20% down payment and a 30 year maturity a person would need a “ballpark” income of $100,000 per year ( depending on other conditions such as personal debt).Source: Dick Jennings, Vice President, Mascoma Bank - personal communication While the average price of a single family home in Hanover between October 2000 and March of 2001 was in the low $300,000s, newly constructed homes costing over $1,000,000 are becoming relatively common in town. Most recently, one unit was built in Hanover for $11 million. The tax revenue from these homes will help to mitigate potential school-cost impacts from lower-cost housing units. The following two tables show the sales prices of condominiums and single-family homes during this period indexed by date of sale. Table 7
CONDOMINIUM SALES 2001 OCT 2000 THRU SEPT 2001
DATE OF SALES EFF.LIV. PER STREET NUMBER & NAME MAP BLOCK SALE PRICE AREA SQ.FT.
303 BROOK HOLLOW 39 12 10/2/00 115,000 806 143
9 BERRILL FARMS 1 16 10/10/00 325,000 1,576 206 27 COLLEGE HILL 25 54 10/24/00 189,930 1,278 149 24 SCHOOL ST, UNIT 11 23 22 11/20/00 129,000 900 143 85 SOUTH MAIN ST #6 23 36 12/18/00 165,000 900 183
2 LEWIN RD, UNIT 10 22 51 1/3/01 104,000 696 149 24 SCHOOL ST, Unit 1 23 22 1/19/01 129,000 832 155 24 SCHOOL ST, UNIT #18 23 22 2/2/01 130,000 900 144 24 SCHOOL ST, UNIT 8 23 22 3/1/01 129,000 897 144
218 BROOK HOLLOW 39 12 3/30/01 122,530 960 128 AVERAGE 153,846 975 158 NUMBER OF SALES 10
Source: Town of Hanover Assessor’s Office
Hanover Affordable Housing Feasibility Study Hadfield
Associates, July 2001
29

Table 8
SINGLE FAMILY HOUSES 2001
OCT 2000 THRU SEPT 2001 DATE OF SALES EFF.LIV. PER STREET NUMBER & NAME
MAP BLOCK SALE PRICE AREA SQ.FT.
11 SCHOOL ST 33 54 10/2/00 190,000 1,260 151 18 HEMLOCK RD 44 51 10/2/00 208,530 1,416 147 18 DRESDEN RD 47 9 10/3/00 213,000 1,500 142 29 RIVER RD 12 199 10/4/00 439,000 3,144 140 15 HEMLOCK RD 44 45 10/10/00 420,000 3,188 132 71 DOGFORD RD 5 85 10/19/00 160,000 983 163
4 PINE DR 42 9 10/23/00 339,930 2,892 118 23 MACDONALD DR 48 26 10/23/00 225,670 1,818 124 15 BUELL ST 23 64 10/30/00 400,000 2,529 158 57 EAST WHEELOCK ST 39 9 10/30/00 197,000 1,328 148 12 MAPLE ST 22 43 11/1/00 313,530 2,493 126
7 CUTTING'S COR 27 24 11/1/00 475,000 2,768 172 53 ETNA RD 29 30 11/2/00 102,530 957 107
3 GIBSON RD 25 3 11/3/00 209,000 1,056 198 10 RESERVOIR RD 47 50 11/13/00 173,000 1,820 95 13
3 LYME RD 12 106 11/16/00 149,000 1,285 116
8 LEWIN RD 22 52 11/17/00 375,000 1,634 229 6 READ RD 22 63 11/17/00 225,000 1,056 213
39 EAST WHEELOCK ST 38 55 11/20/00 269,000 2,228 121 1 PINNEO HILL RD 8 30 11/30/00 256,000 2,582 99
19 LOW RD 39 120 11/30/00 270,000 2,024 133 50 FERSON RD 13 59 12/4/00 556,330 2,295 242
3 LEWIN RD 22 55 12/4/00 225,000 1,527 147 41 GREENSBORO RD 25 25 12/4/00 140,000 1,000 140 31 LYME RD 44 5 12/4/00 413,000 3,296 125 25 MULHERRIN FARM RD 15 85 12/20/00 460,000 2,898 159 79 LEBANON ST 24 50 12/20/00 150,000 2,346 64 13
4 LYME RD 12 72 1/8/01 139,400 1,207 115
181
RUDDSBORO RD 3 64 1/16/01 325,000 2,716 120
13 LOW RD 39 123 1/22/01 249,000 1,642 152
Hanover Affordable Housing Feasibility Study Hadfield
Associates, July 2001
30
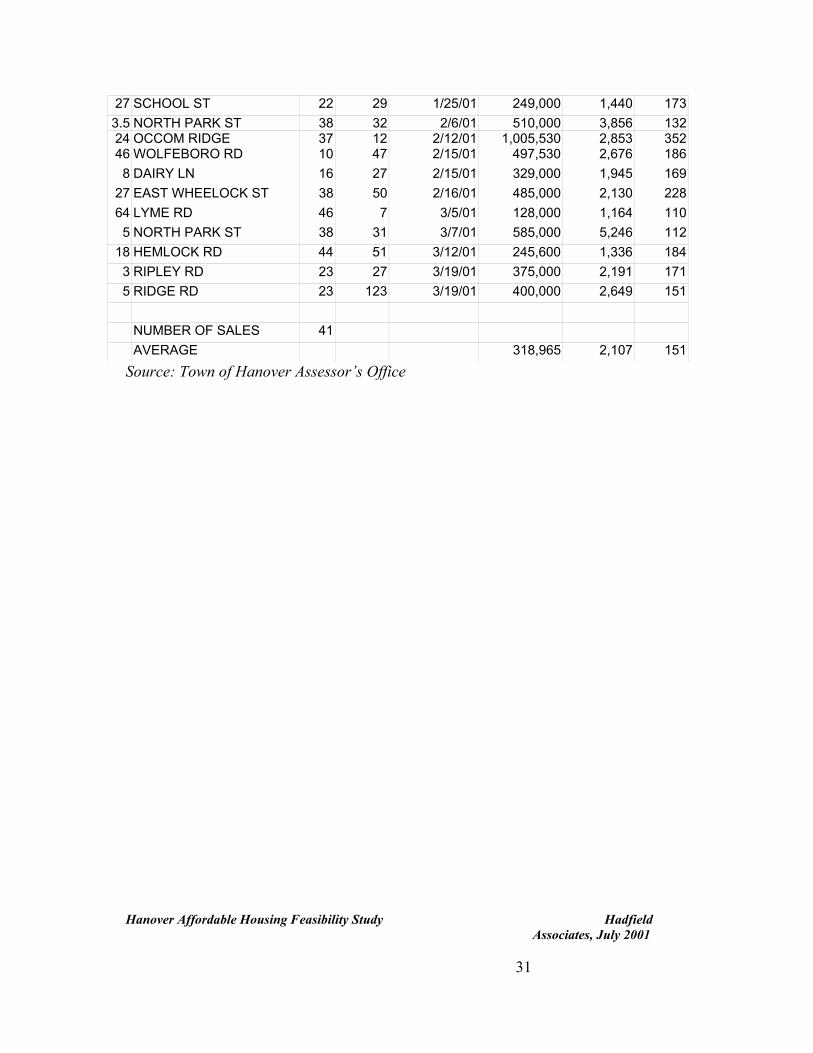
27 SCHOOL ST 22 29 1/25/01 249,000 1,440 173 3.5 NORTH PARK ST 38 32 2/6/01 510,000 3,856 132 24 OCCOM RIDGE 37 12 2/12/01 1,005,530 2,853 352 46 WOLFEBORO RD 10 47 2/15/01 497,530 2,676 186
8 DAIRY LN 16 27 2/15/01 329,000 1,945 169 27 EAST WHEELOCK ST 38 50 2/16/01 485,000 2,130 228 64 LYME RD 46 7 3/5/01 128,000 1,164 110
5 NORTH PARK ST 38 31 3/7/01 585,000 5,246 112 18 HEMLOCK RD 44 51 3/12/01 245,600 1,336 184
3 RIPLEY RD 23 27 3/19/01 375,000 2,191 171 5 RIDGE RD 23 123 3/19/01 400,000 2,649 151
NUMBER OF SALES 41 AVERAGE 318,965 2,107 151
Source: Town of Hanover Assessor’s Office
Hanover Affordable Housing Feasibility Study Hadfield
Associates, July 2001
31
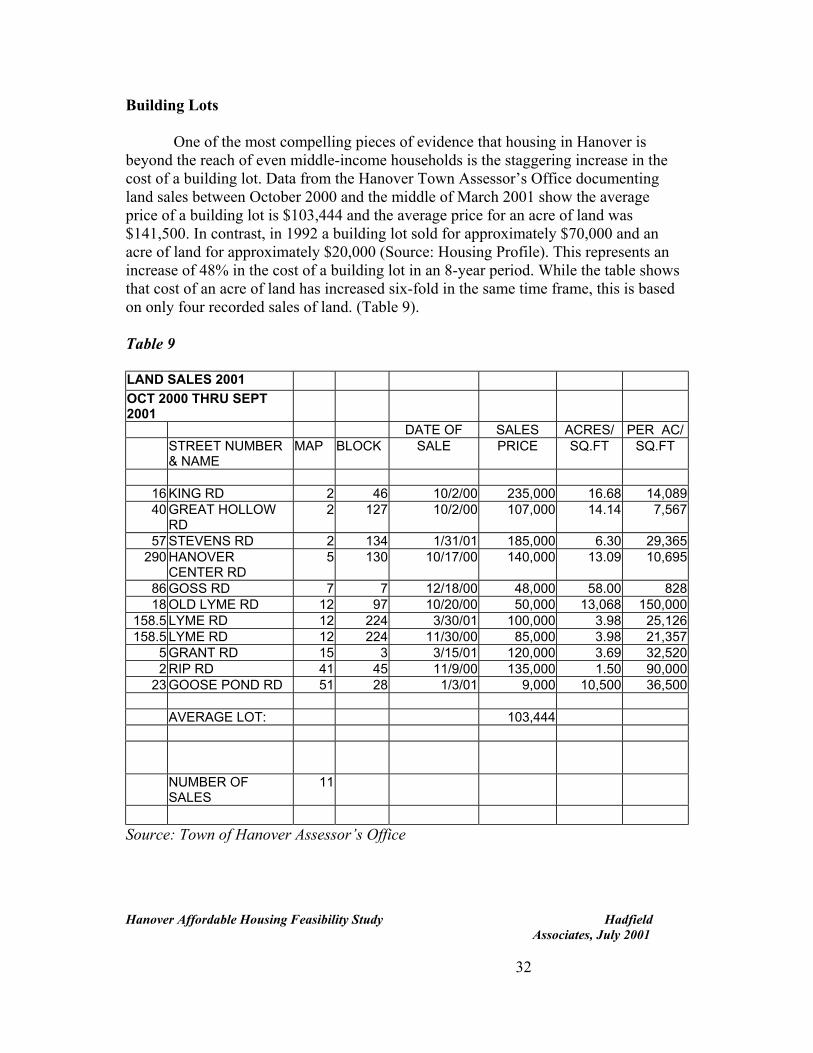
Building Lots One of the most compelling pieces of evidence that housing in Hanover is beyond the reach of even middle-income households is the staggering increase in the cost of a building lot. Data from the Hanover Town Assessor’s Office documenting land sales between October 2000 and the middle of March 2001 show the average price of a building lot is $103,444 and the average price for an acre of land was $141,500. In contrast, in 1992 a building lot sold for approximately $70,000 and an acre of land for approximately $20,000 (Source: Housing Profile). This represents an increase of 48% in the cost of a building lot in an 8-year period. While the table shows that cost of an acre of land has increased six-fold in the same time frame, this is based on only four recorded sales of land. (Table 9). Table 9 LAND SALES 2001 OCT 2000 THRU SEPT 2001
DATE OF SALES ACRES/ PER AC/ STREET NUMBER & NAME
MAP BLOCK SALE PRICE SQ.FT SQ.FT
16 KING RD 2 46 10/2/00 235,000 16.68 14,089 40 GREAT HOLLOW
RD 2 127 10/2/00 107,000 14.14 7,567
57 STEVENS RD 2 134 1/31/01 185,000 6.30 29,365 290 HANOVER
CENTER RD 5 130 10/17/00 140,000 13.09 10,695
86 GOSS RD 7 7 12/18/00 48,000 58.00 828 18 OLD LYME RD 12 97 10/20/00 50,000 13,068 150,000
158.5 LYME RD 12 224 3/30/01 100,000 3.98 25,126 158.5 LYME RD 12 224 11/30/00 85,000 3.98 21,357
5 GRANT RD 15 3 3/15/01 120,000 3.69 32,520 2 RIP RD 41 45 11/9/00 135,000 1.50 90,000
23 GOOSE POND RD 51 28 1/3/01 9,000 10,500 36,500 AVERAGE LOT: 103,444
NUMBER OF SALES
11
Source: Town of Hanover Assessor’s Office
Hanover Affordable Housing Feasibility Study Hadfield
Associates, July 2001
32

Income and Wages While the income data from the 2000 Census would have been helpful in looking at income and wages, many of the people for whom housing is needed in the Town of Hanover do not currently live in Hanover. These people are a part of the regional population and would not therefore be reflected in the income data for the Town. There are many people of low, moderate and middle incomes who currently work in Hanover for the Town, for the School District, for Dartmouth College, and for Hanover businesses who would like to live in Hanover but are currently living in either Lebanon, Hartford or smaller outlying communities including Enfield, Canaan, Lebanon, Lyme, Hartland, Fairlee, Sharon, Bradford, Plainfield and many more where the cost of housing is significantly lower. The Grafton County 1990 median household income of $30,065 was significantly lower than that for Hanover ($51,899) and for Hanover’s commuter-shed ($32,604). It is important to note that the income of the commuter-shed from which Hanover draws the significant portion of its employees is much closer to that of the County rather than the town (20). Table 10 Comparative Median Family and Median Household Incomes
1989 1989 Town Median Family Median Household
Income Income Canaan $34,336 $31,479 Enfield $38,645 $33,925 Hanover $65,488 $51,899 Lebanon $40,745 $32,221 Lyme $50,563 $42,188 Norwich $58,377 $42,619 Plainfield $42,566 $40,006 Thetford $41,068 $37,205 Grafton County $35,489 $30,065 New Hampshire $41,628 $36,329
Source: 1990 U.S. Census
Hanover Affordable Housing Feasibility Study Hadfield
Associates, July 2001
33

Arguably, the median income of Hanover residents bears little resemblance to the median household income for Grafton County or the commuter shed and yet these are the criteria under which state and federal funding for affordable housing is provided. One Hanover business told us that 47% of their employees earn less than $35,000 (21). Even a two-income household could not at this rate afford a home in Hanover. Private funding will therefore become a critical piece of the affordable housing puzzle for Hanover. While 2000 income figures are not yet available for Hanover, U.S. Department of Housing and Urban Development (HUD) has issued median family income figures for Grafton County for 2000. We compared the percentage change in the price of a building lot in Hanover from 1990 to 2000, a 78% increase, to that of the increase in the Grafton County median family income over the same period, 34%. The cost of land in Hanover is rising at more than twice that of the Grafton County median family income. Table 11
Building Lot Hanover Median Grafton County Price Family Income Median Family Income
1990 $58,000 $65,488 $35,489 2000 $103,444 N/A $43,900
Total % Increase
78% 34%
Source: Town of Hanover Assessor’s Office The NH Basic Needs and Livable Wage Study calculates that the livable wage for a family unit with two working parents and two children in Grafton County is $10.68 (x 2 because the formula assumes that both parents work full-time) or $21.36 per hour (Table 13). This translates to an annual household family income of $44,428 which is $4,500 higher than the Grafton County moderate income (22). The problem with this study is that it allocates only $566 per month for “rent and utilities” (20) The NHHFA 2001, Residential Rental Cost Survey, released on June 26, 2001, puts the rent of a two-bedroom unit in Grafton County at $693. (Statewide the average rent for a two-bedroom apartment of over $800 - Table 12.) (23) We reviewed the rent ranges cited in the same report and found that rents for two-bedroom unit in Grafton County range from $368 to $1,887. Reviews of newspaper ads, and contacts with realtors and social service agencies in the Upper Valley reveal that the average rent in the Upper Valley area for a two-bedroom unit is $750 -$850 plus electricity ($800 per month), a three-bedroom unit can average $1,100 a month.
Hanover Affordable Housing Feasibility Study Hadfield
Associates, July 2001
34

In practical terms this adds approximately $314 per month to the annual livable wage needed for a family with two working parents and two children, that is to $50,395 for the Upper Valley area. We believe this is another illustration of the fact that state and federal eligibility criteria should be expanded to catch these working families in the “affordable housing” net. By comparison, the average two-bedroom apartment in Hanover rents for over $1,200 per month, and the average single family home for $2,200 and up. Table 12 Source: 2001 residential Rental Cost Survey, NHHFA
Hanover Affordable Housing Feasibility Study Hadfield
Associates, July 2001
35
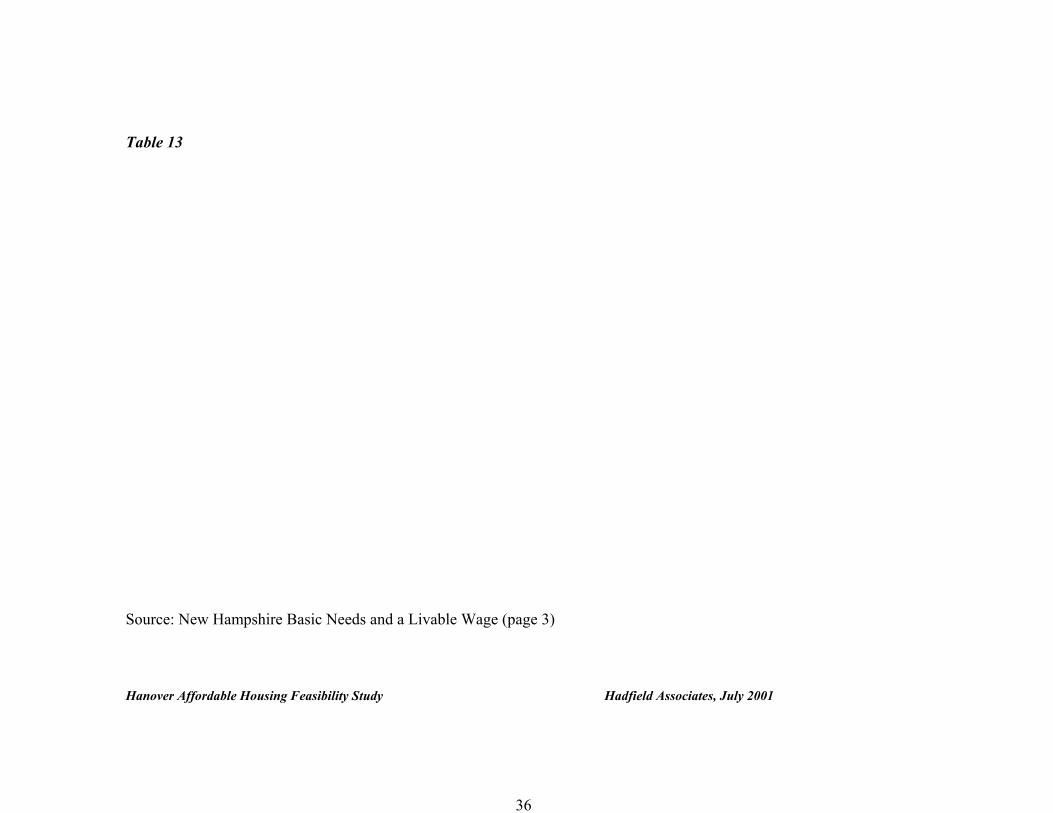
Table 13 Source: New Hampshire Basic Needs and a Livable Wage (page 3)
Hanover Affordable Housing Feasibility Study Hadfield Associates, July 2001
36
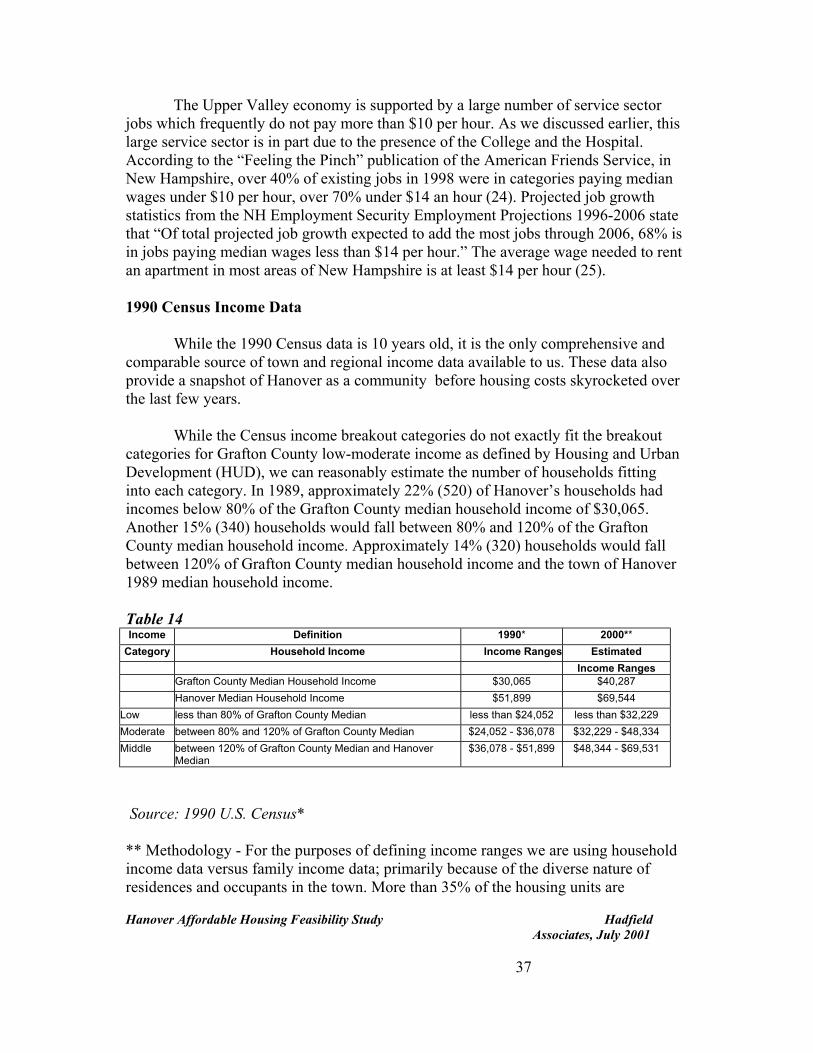
The Upper Valley economy is supported by a large number of service sector jobs which frequently do not pay more than $10 per hour. As we discussed earlier, this large service sector is in part due to the presence of the College and the Hospital. According to the “Feeling the Pinch” publication of the American Friends Service, in New Hampshire, over 40% of existing jobs in 1998 were in categories paying median wages under $10 per hour, over 70% under $14 an hour (24). Projected job growth statistics from the NH Employment Security Employment Projections 1996-2006 state that “Of total projected job growth expected to add the most jobs through 2006, 68% is in jobs paying median wages less than $14 per hour.” The average wage needed to rent an apartment in most areas of New Hampshire is at least $14 per hour (25). 1990 Census Income Data While the 1990 Census data is 10 years old, it is the only comprehensive and comparable source of town and regional income data available to us. These data also provide a snapshot of Hanover as a community before housing costs skyrocketed over the last few years. While the Census income breakout categories do not exactly fit the breakout categories for Grafton County low-moderate income as defined by Housing and Urban Development (HUD), we can reasonably estimate the number of households fitting into each category. In 1989, approximately 22% (520) of Hanover’s households had incomes below 80% of the Grafton County median household income of $30,065. Another 15% (340) households would fall between 80% and 120% of the Grafton County median household income. Approximately 14% (320) households would fall between 120% of Grafton County median household income and the town of Hanover 1989 median household income. Table 14 Income Definition 1990* 2000**
Category Household Income Income Ranges Estimated Income Ranges
Grafton County Median Household Income $30,065 $40,287 Hanover Median Household Income $51,899 $69,544
Low less than 80% of Grafton County Median less than $24,052 less than $32,229 Moderate between 80% and 120% of Grafton County Median $24,052 - $36,078 $32,229 - $48,334 Middle between 120% of Grafton County Median and Hanover
Median $36,078 - $51,899 $48,344 - $69,531
Source: 1990 U.S. Census*
Hanover Affordable Housing Feasibility Study Hadfield
Associates, July 2001
37
** Methodology - For the purposes of defining income ranges we are using household income data versus family income data; primarily because of the diverse nature of residences and occupants in the town. More than 35% of the housing units are

occupied by non-family households primarily due to the presence of College students and faculty who might be sharing quarters. Typically, family median incomes tend to be approximately 20% higher than household median. The only recent income data available to us at this time is the HUD family median income for Grafton County which is $47,500 (2000). This represents a 34% increase over the 1989 family median income figure. After reviewing previous census and income data, we have made the assumption, for planning purposes, that household income has increased at the same rate as family income. This translates to a Grafton County median household income of $40,267 with low income being less than $32,229, moderate $32,229 - $48,344, and middle income $48,344 to $69,531. These estimates are for planning purposes only and should be verified and updated as soon as the 2000 Census data become available. One of the populations hit hardest by the housing crunch is single parent, head of households, both male and female. These families frequently must survive on one income. In 1990, in Hanover, only 90 units were occupied by single-parent head of households, representing 4% of the town’s households. (Interestingly, while single parent head-of-households have tended to be female, 46 of these units were occupied by single-male head of households with dependents under 18 and 44 single females with dependents under 18.) That number increased to 99 in the 2000 Census but when compared to the increase in the number of households, the percentage of single-parent households in Hanover is falling, most likely due to the lack of affordable housing for a single wage earner. By comparison, in 1996, 24% of New Hampshire’s families with children were headed by a single parent (26). Another population often hit hard by rising housing costs is the over-age-65 category. Twenty-two percent (22%) or 517 of the 1990 households fit into this age group. Of these households, approximately 200 had incomes below $24,999 and would be considered primarily low income, 74 had incomes between 80 and 120% of Grafton County median household income and would be considered moderate, another 50 households had incomes between 120% of Grafton County median and the Hanover median household income. This is a difficult age group for which to quantify need because persons in this age group may have significant assets, own their home or property outright, and have fewer day-to-day expenses. Interestingly, there were 213 single females over the age of 65 living alone compared to only 7 males. The presence of Kendall, Outreach House and the Town’s subsidized senior housing units all contribute as single women are more likely to seek housing in close quarters with other senior citizens for reasons of safety, companionship and economics. Single female households are one of the fastest growing segments of the nation’s population (27).
Hanover Affordable Housing Feasibility Study Hadfield Associates, July 2001

Commuter Data The most recent employment figures released by the NH Department of Employment Security, put the current covered-wage employment for Hanover at 8,592. Covered wage employment are employees for whom employers report wages and tax information as required by law. The 2000 Census put the potential Hanover resident workforce at 4,113; this assumes that all persons between 20 and 64 are in the workforce and does not include undergraduates. We assume the actual resident workforce to be substantially less as some households will have only one breadwinner and many are graduate students. Consequently the majority of Hanover’s workforce commutes from other communities. Dartmouth College has contracted with Resource Systems Group (RSG) to develop a Traffic and Parking Report as a part of the Dartmouth College Master Plan. We thank Ken Kaliski of Resource Systems Group (RSG), and Shawn Donovan of Dartmouth College for a preview of the data that was collected and for their permission to cite it this report (28). As our focus is on housing need for low- moderate-income households, we were looking to establish the commuting patterns of Hanover employees (including Dartmouth College employees) from those communities which provide housing for people working in Hanover. The RSG study documents the commuting patterns of the college’s employees. These statistics closely resemble those from our own employee and business employer survey with the exception of the percentage living in Hanover. Data was tabulated for 3,581 of the college’s employees, 26% (917) are Hanover residents, 16% (561) live in Lebanon, 8% (293) Hartford, 6% (218) in Enfield, 5% (192) Norwich, 4% (143) Thetford. Two-thirds of the College’s employees are New Hampshire residents (66%), and one-third live in Vermont. Of those employees who commute from outside of Hanover, employees are split almost evenly between NH (1,462) and VT (1,202). Interestingly, we asked DHMC for a list of their employee’s hometowns. Of the hospital’s employees, only 13% live in Hanover, and in Lebanon (27%), Hartford (12%), Enfield (11%), Norwich (6%), Claremont (5%), Canaan (5%), Windsor (2.7%) and Thetford (2.2%)
Hanover Affordable Housing Feasibility Study Hadfield
Associates, July 2001
39

Table 15 Commuting Patterns of Hanover Employees March/April, 2001
College DHMC Employee Employer Employees(1) Employees(2) Survey(3) Survey (4)
Hanover 26% 13% 20% 7% Hartford 8% 12% 10% 9% Lebanon 16% 27% 20% 23% Norwich 5% 6% 4% 3% Enfield 6% 11% 10% 13% Thetford 5% 2% <1 5% Canaan 3% 5% 4% 8% Claremont 1% 5% <1 5% Newport <1 <1 <1 3% Windsor 2% 3% <1 4% Plainfield 2% 3% 3% 2% Lyme 4% 3% <1 2% Grantham 2% 4% 5% 3% 80% 94% 76% 87%
Source: 1) Resource Systems Group on behalf of Dartmouth College 2) Dartmouth Hitchcock Medical Center, Director of Employment 3) Employee Survey, Hadfield Associates, March 2001* 4) Employer Survey, Hadfield Associates, March 2001* * We have offered the results of the employee survey and the employer survey separately. The employer survey and employee survey differed in the number and type of businesses that responded. For example, while we surveyed eight businesses, only five businesses allowed us to survey their employees; of which, one was the Town of Hanover and one the School District. Both the Town and the School District offered more generous salaries than do the other businesses that we surveyed (this is common in public sector positions); consequently, their employees are more likely to be able to live in Hanover and this is reflected in that both the Town and the School District have a larger percentage of Hanover residents than do the other business that we surveyed such as the Hanover Food Coop, Spectra and Hypertherm. This is also supported by the DHMC commuter statistics.
Hanover Affordable Housing Feasibility Study Hadfield Associates, July 2001
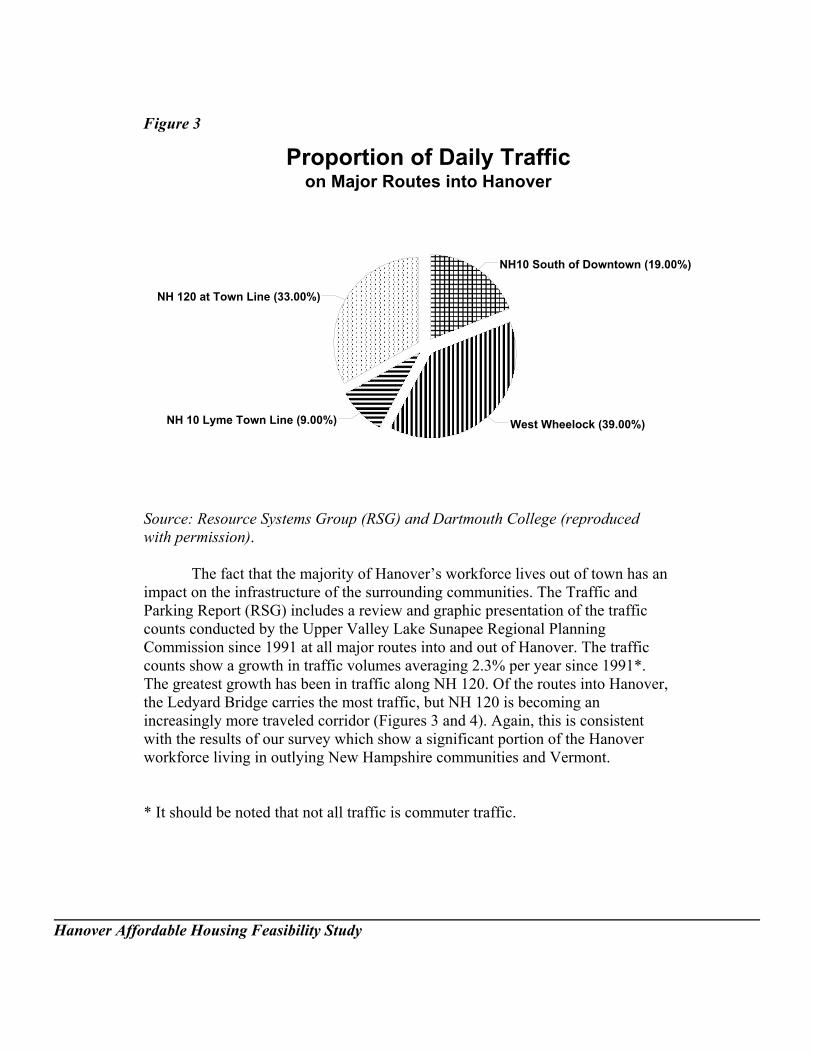
Figure 3
Sw imPcCcTthinww *
Hanover Affor
��������������������������������������������������������������������������������������������������������������������������������������������������������������������������������������������������������������������������������
������������������������������������������������������������������������������������������������������������������������������������������������������������������������������������������������������������������������������������������������������������������������������������������������������������������
������������������������������������������������������������������������������������������������������������������������������������������������������������������������������������
������������������������������������������������������������������������������������������������������������������������������������������������������������������������������������������������������������������������������������������������������������������������������������������������������������������������������������������������������������������������������������������������������������������������
NH10 South of Downtown (19.00%)
NH 120 at Town Line (33.00%)
West Wheelock (39.00%)NH 10 Lyme Town Line (9.00%)
Proportion of Daily Trafficon Major Routes into Hanover
ource: Resource Systems Group (RSG) and Dartmouth College (reproduced ith permission).
The fact that the majority of Hanover’s workforce lives out of town has an pact on the infrastructure of the surrounding communities. The Traffic and
arking Report (RSG) includes a review and graphic presentation of the traffic ounts conducted by the Upper Valley Lake Sunapee Regional Planning ommission since 1991 at all major routes into and out of Hanover. The traffic ounts show a growth in traffic volumes averaging 2.3% per year since 1991*. he greatest growth has been in traffic along NH 120. Of the routes into Hanover, e Ledyard Bridge carries the most traffic, but NH 120 is becoming an creasingly more traveled corridor (Figures 3 and 4). Again, this is consistent ith the results of our survey which show a significant portion of the Hanover orkforce living in outlying New Hampshire communities and Vermont.
It should be noted that not all traffic is commuter traffic.
dable Housing Feasibility Study
Figure 4 Traffic Trends Since 1991 Source: Upper Valley Lake Sunapee Regional Planning Commission
Hanover Affordable Housing Feasibility Study Hadfield Associates, July 2001

Fair Share Housing Analysis In 1995 the Upper Valley Lake Sunapee Regional Planning Commission (UVLSRPC) completed a regional Fair Share Housing Analysis (29). The study found that in the UVLSRPC region approximately 3,520 renter households with incomes of 80% or less than the median for Grafton County, along with 3,328 owner households, are spending more than 30% of their gross income on housing (30). This translates to approximately 32% of the County’s renter households and 14% of owner households. When all housing units are considered, renter- and owner-occupied, approximately one out of every five households in the region (20%) are paying an amount for housing that does not leave enough of their income to adequately provide other necessities. (Source: UVLSRPC) Of the 772 rental units in Hanover in 1990, 214 (28%) were occupied by households paying more than 30% of the household income compared to 32% for the region. The high percentage of lower-income renters in the town is a reflection of the Dartmouth College off-campus students occupying both apartments and single-family homes. While the students are often willing to overcrowd in order to bring down rents per person, this gives landlords the opportunity to charge higher rents, thus restricting non-student renters (31). Only 129 (8%) of the town’s households of owner- occupied units were paying more than 30% of their household income for housing compared to 14% for the region as a whole. Given the very high median income levels in Hanover compared to the rest of the region, the low percentage of owners paying more than 30% is not surprising. The Fair Share model establishes the amount of housing needed based on financially burdened lower-income renter households but does not include those home owners struggling to keep their homes, overcrowded units, or renters looking to own. The models suggests that Hanover’s total Fair Share increase of units is 456 rental units, or 19% of the commuter-shed’s need of 2,398 units or an increase of 15% in the number of housing units in the Town. To extend the review of households further, 62% of renters over the age of 65 were paying more than 30% of their income for housing compared to 38% of those in the 15-64 year cohort. In contrast, 22% of home owners in the 15-64 year cohort were paying more than 30% of their household income for housing and 28% of home owners over 65 were paying more than 30%.
Hanover Affordable Housing Feasibility Study
It should be noted that the Fair Share Housing Analysis is a study, and not a mandate. The resulting number of units established by the study should be used as a guideline and not a hard number. The intent of the analysis is to encourage municipalities to look at their own regulations and develop plans to address the need for affordable housing as well as those of other communities and to open a regional dialogue. The Fair Share methodology has limitations; for example, it

does not take into account steep slopes, unsuitable soils or wetlands of which Hanover has plenty (as do other communities); in addition, the methodology does not differentiate between a community hosting a student population versus one without. We believe that while the Town of Hanover needs to create affordable rental housing, Dartmouth College also has a significant role to play in producing new rental units for faulty, staff and graduate students which, together with the creation of new dormitory space for the majority of the under-graduate student population, will go a long way to addressing Hanover’s fair share of the region’s rental needs. There are two other “Fair Share” criteria which we should consider in our quest to determine the need for affordable housing. The first is the number of subsidized housing units in Hanover as compared to other Upper Valley communities including Lebanon, Hartford, Claremont, Newport and Enfield. The second is the percentage of mobile homes as a portion of a community’s housing units. While not all mobile homes are occupied by low- moderate-income households, the number and percentage of these alternative housings units is a strong indicator.
Hanover Affordable Housing Feasibility Study Hadfield Associates, July 2001
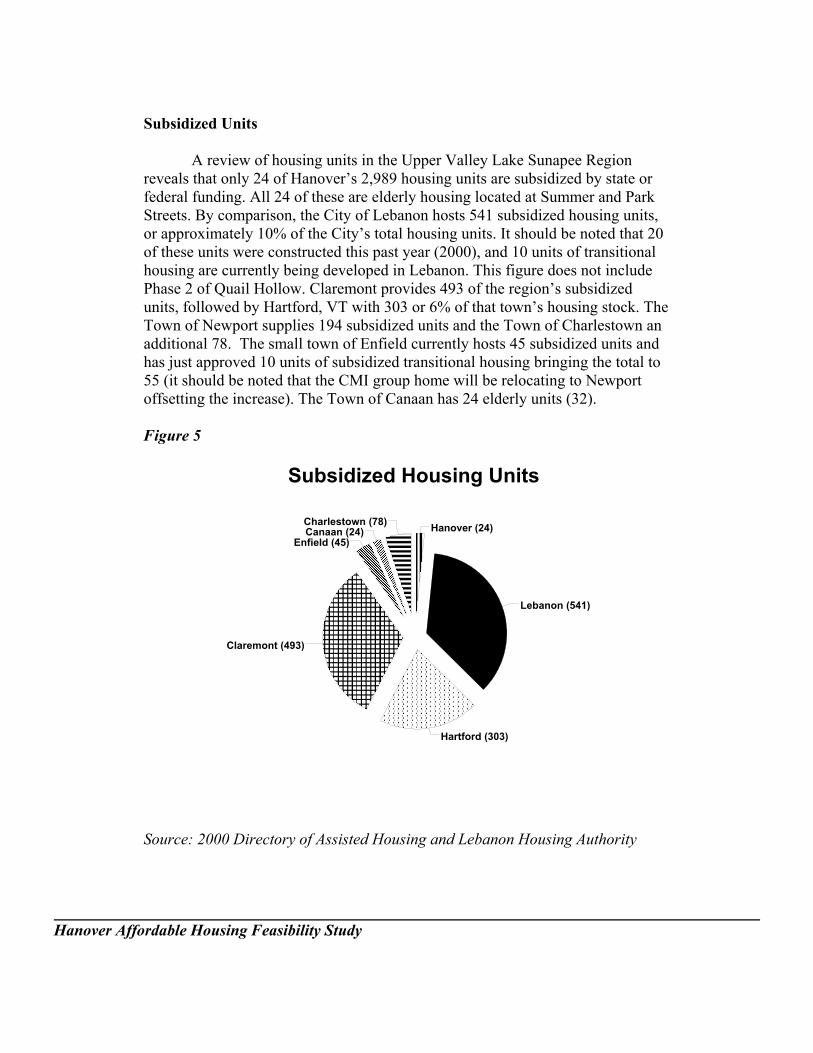
Subsidized Units A review of housing units in the Upper Valley Lake Sunapee Region reveals that only 24 of Hanover’s 2,989 housing units are subsidized by state or federal funding. All 24 of these are elderly housing located at Summer and Park Streets. By comparison, the City of Lebanon hosts 541 subsidized housing units, or approximately 10% of the City’s total housing units. It should be noted that 20 of these units were constructed this past year (2000), and 10 units of transitional housing are currently being developed in Lebanon. This figure does not include Phase 2 of Quail Hollow. Claremont provides 493 of the region’s subsidized units, followed by Hartford, VT with 303 or 6% of that town’s housing stock. The Town of Newport supplies 194 subsidized units and the Town of Charlestown an additional 78. The small town of Enfield currently hosts 45 subsidized units and has just approved 10 units of subsidized transitional housing bringing the total to 55 (it should be noted that the CMI group home will be relocating to Newport offsetting the increase). The Town of Canaan has 24 elderly units (32). Figure 5
C
Source: 2000
Hanover Affordable Housi
Upper Valley Region, 2001
������������������������
������������������������������������������������������������������������
������������������������������������������������������������������������������������
������������������������������������������������������������������������������������������������������������������
��������������������������������������������������������������������������������������������������������������������������������������������������������������������������������������������������������������������������������������������������������������������������������������������������������������������������������
������������������������������������������������������������������������������������������������������������������������������������������������������������������������������������������������������������������������������������
Lebanon (541)
Hanover (24)Enfield (45)
Canaan (24)Charlestown (78)
Hartford (303)
laremont (493)
Subsidized Housing Units
Directory of Assisted Housing and Lebanon Housing Authority
ng Feasibility Study
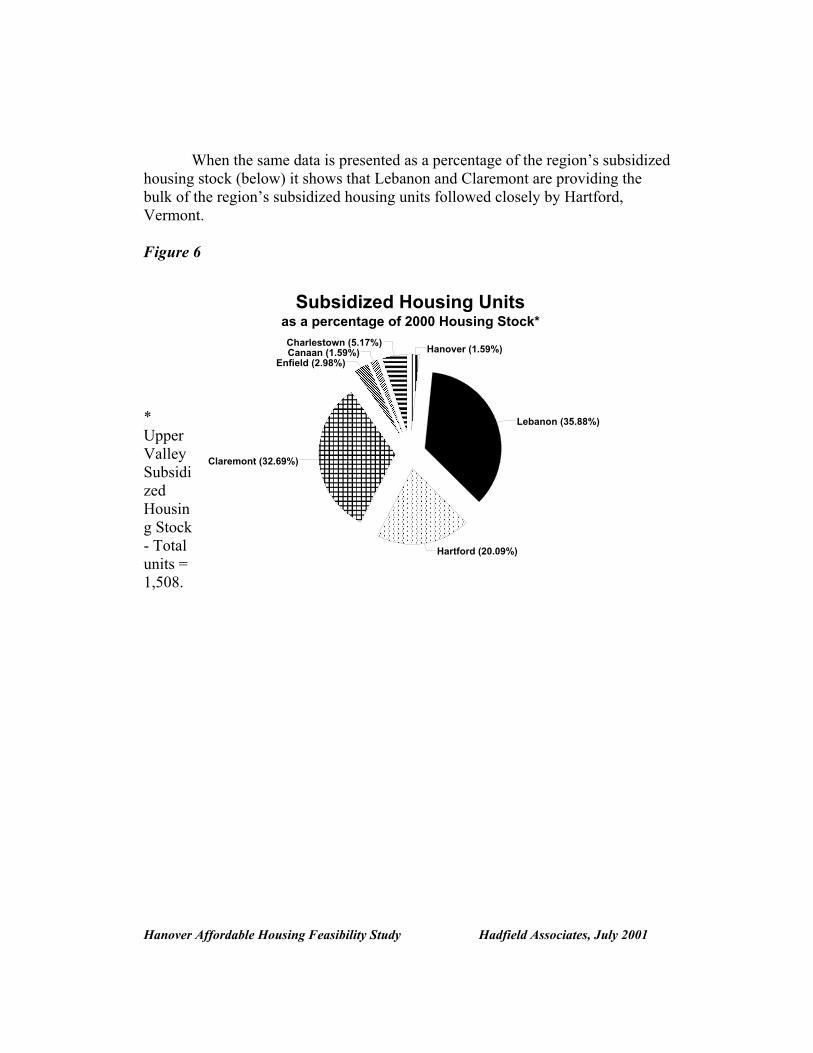
When the same data is presented as a percentage of the region’s subsidized housing stock (below) it shows that Lebanon and Claremont are providing the bulk of the region’s subsidized housing units followed closely by Hartford, Vermont. Figure 6 * Upper Valley Subsidized Housing Stock - Total units = 1,508.
Hanover A
������������������������
������������������������������������������������������������������
������������������������������������������������������������������������������
������������������������������������������������������������������������������������������
����������������������������������������������������������������������������������������������������������������������������������������������������������������������������������������������������������������������������������������������������������������������������������������������������������������������
������������������������������������������������������������������������������������������������������������������������������������������������������������������������������������������������������������������������
Lebanon (35.88%)
Hanover (1.59%)Enfield (2.98%)
Canaan (1.59%)Charlestown (5.17%)
Hartford (20.09%)
Claremont (32.69%)
Subsidized Housing Unitsas a percentage of 2000 Housing Stock*
ffordable Housing Feasibility Study Hadfield Associates, July 2001

Manufactured Housing Units Mobile homes have become the only recourse for many who seek home ownership but have limited incomes. The percentage of mobile homes is also considered an indicator of a community’s wealth. According to the 1990 Census, only 3 of the Town of Hanover’s housing units were mobile homes. By contrast 4.3% (59) of Norwich’s residences were mobile homes and 4.2% (238) of the City of Lebanon’s housing units. However, other communities have been even more open to manufactured housing units, 447 (8.9%) of the Town of Hartford’s housing units were mobile homes and fully 11.4% (246) of the units in the Town of Enfield were mobile homes or trailers (Figure 7) (33). Figure 7
Hanover Affordable Housi
700
0
100
200
300
400
500
600
Num
ber o
f uni
ts
Hanover Canaan Lebanon Enfield Claremont Hartford Charlestown
Manufactured Housing 1990
ng Feasibility Study

Hanover Affordable Housing Feasibility Study Hadfield Associates, July 2001

SURVEY OF SOCIAL SERVICE AGENCIES Between January and May of 2001, we interviewed Upper Valley Social Service Agencies either by telephone or in person to receive input on the need for affordable housing in Hanover. These interviews included Jonathon Chaffee ( Lebanon Housing Authority), Terry Chesbro (Hartford Housing Authority), Dena Romero (Hanover Counselor), Donna Hutchins (Lebanon Welfare Director), Gretchen Rittenhouse, Executive Director (Twin Pines Housing Trust), Lynn Goodwin (Casey Family Services), and Caye Currier (WISE). Without exception the agencies, told us that other than the existing 24 senior and disabled units administered by the Lebanon Housing Authority on behalf of the Town of Hanover, they did not consider Hanover as a possibility for referrals for affordable housing. Most of the time Hanover residents who are in need of shelter and who do not fit the criteria for the senior housing are referred out of Hanover. Even with Section 8 vouchers, most could not afford the rent in Hanover. Dena Romero, Hanover Counselor, explains that she has often worked to keep an individual in the community because that person may have children in the school but more frequently refers cases out of town. Of the 24 units of Senior Housing, the turnover is approximately one unit per year. Lebanon Housing Authority has an un-official waiting list of 13 elderly and 3 disabled persons including primarily persons with family in Hanover. The list is not publicized and the Authority does not solicit persons for the list. Based on our discussions, the service agencies believe that there exists a need for 8 additional units on the existing senior center site. It should be noted that the majority of the existing units are rented to moderate-income tenants rather than low-income and that many of the tenants tend to be retired professional women who have pensions. According to the 1990 Census, 157 housing units in Hanover were occupied by households with the heads of household being over the age of 65 and whose household incomes were less than $25,000. We asked the service agencies about the need for housing for single female head of households with children and the need for low- moderate-income families. Most reiterated that they have not considered Hanover but that they do have clients who have come from Hanover and who could not find rental housing there. It appears that 4 units could readily be filled by single female heads of household, one of the fastest growing segments of the population, but that a number for low- moderate-income was difficult to come up with. It was noted that there has been a sharp increase not only in the Upper Valley, but in the state, in the number of working families asking for assistance with housing costs. The consensus was that the Town should strive to meet Hanover’s fair share of the region’s need for affordable housing.
Hanover Affordable Housing Feasibility Study

SURVEY OF REAL ESTATE PROFESSIONALS Few understand the housing market like the real estate professionals in the town. To gain perspective, seven Hanover real estate professionals were contacted. Initially each was given an outline of questions and potential areas of discussion developed for this specific purpose so that they might better understand our goals. During March and April of 2000 we interviewed five real estate agents face to face. The following is a summary of their responses. Market Trends: What trends in the land/housing market have been predominant in the last six months ! Very low inventory in all price ranges. ! Quick turn around; average 79-90 days on market, which is unusually fast ! Low interest rates ! People are remodeling and renovating existing properties because they
can’t sell and find better properties or because it is more cost effective. ! Salary increases are not keeping pace with inflation of real estate prices. ! People are getting full price or better creating bidding wars; in some cases
buyer will offer way over asking price and pay cash. ! The stable strong job market has brought people to the area, as well as the
trend of telecommuting; for example they can move here from Boston and physically commute back perhaps only one day a week or less.
! Several agents speculate that smaller houses closer to town will go for outrageous prices and will be snapped up for the land and not the house.
! Larger homes will replace smaller homes to the extent of the zoning ordinance.
! Most thought that it was both a buyer’s and a seller’s market with each benefiting equally.
! Low cost buildable land is scarce ! Low inventory of land and houses - not this low since the 80's ! Dartmouth owns acreage in the GR -1 zone but is not likely to release it to
the public for purchase but could build employee housing there. ! 35% to 40% of buyers are paying cash ! Housing starts way down; becoming very expensive to buy building
material and transport. ($110 to $160 per sq.ft.) ! In 2000, only 15 new starts in Hanover, 35 in Lebanon, and 15 in
Norwich. ! Average sale price for 2001 has been between $329,000 and $352,000 ! Listing prices have remained high, $415,000 in Hanover and $154,000 in
Lebanon as people speculate and put their homes on the market hoping for a buyer willing to pay their asking price
Hanover Affordable Housing Feasibility Study Hadfield Associates, July 2001

! Rentals; get 2 to 3 calls a day from people looking to rent. Mostly students who don’t want to live in dorms, but also from people looking to relocate and want to rent initially.
! At least 10% appreciation in value each year. ! Low rental availability-very high cost; average between $800-$1,200 for
two-bedroom apartment. A two-bedroom house will rent for anywhere from $1,200 to $1,700 a month.
! People come to Hanover because it’s “the place to be”; quality of life, schools, hospital, etc.
! Desirable because it combines cultural with the classic New England community.
! Hanover is the 7th most educated community in the U.S.; people choose Hanover because they want to live with people like themselves.
What is the average income of buyers and renters looking to locate in Hanover?
$70,000 to $90,000 minimum; more likely as high as $150,000 Zoning Implications?
Re- zoning for higher density will have to happen if we intend to grow at all.
Business Development?
Won’t see much in Hanover; it will all go to Centerra and other areas of Lebanon.
What does the future hold for Hanover? ! Status quo; the College will grow, the Hospital will grow and so will the
demand for housing. ! On affordable housing; hard to see it in Hanover, but outside of town is a
possibility. We would have to ease off restrictions and build differently to satisfy the need.
! $1 million dollar houses will be common. ! If the Town and the College swapped the land they now own, some of the
problem might be solved and it would be a win/ win situation, i.e. The College could build student housing close to school and the Town could look at offering up properties for more affordable housing.
! If we maintain the status quo, we won’t make a dent in the need. Predictions for the demand for housing, single family and/or rentals ! In both areas there will continue to be a huge demand ! Inventory will continue to be low and appreciate in value
Hanover Affordable Housing Feasibility Study
! Costs and no land will continue to make new starts few and far between.

! What starts are happening are not affordable for the average person. ! If the College plans to meet for the needs of its students on campus, they
will need to build more apartment/townhouse type living facilities to succeed.
SURVEY OF HANOVER EMPLOYERS How is the lack of affordable housing affecting Hanover’s business community? The lack of affordable housing is taking its toll on the ability of businesses to attract new employees, retain the existing workforce and maintain and expand current operations. We contacted eight local businesses, who agreed to participate in this study. As with the Real Estate survey, a list of questions was sent out ahead and then each contact was interviewed. The interviews we conducted took place in March and April of this year. To protect the businesses we have summarized responses. Eight businesses participated in the survey and interview process: Spectra, Inc; Hypertherm, Hanover Coop Foodstore, Town of Hanover, Creare, Trumbull-Nelson Construction Company, Dartmouth Printing Company, Hanover Area Chamber of Commerce. The following is a selection of responses to the survey. Most businesses have the same issues surrounding housing, recruitment and childcare. ! All of the employers we spoke with expressed the same concerns around
recruiting new employees. The major issue for these businesses revolves around the lack of affordable housing and the lack of childcare. Many candidates from across the nation are eager to come to Hanover and the Upper Valley. They seek the life style it offers, the job opportunities available, the proximity of a first- class medical facility, and the education the school system can provide. But when they get here to look for a place to live, they experience, as one employer put it, “sticker shock”. The prices of housing and the lack of options have proven to be “a deal breaker” more often then not. One company has as much as a 50% rejection rate as a result of the housing situation.
! Recruitment and retention issues occur when people have to commute
long distances to the job. ! New employees can’t afford Hanover. “If they move all of the students
onto campus and the hospital built housing that would free up a lot; 25 to 50 (25%) of our employees would want to move to Hanover”.
Hanover Affordable Housing Feasibility Study Hadfield Associates, July 2001

! We have to send people farther out of Hanover to look for housing, which then creates a commute that many new hires are trying to avoid.
! “To preserve the quality of life and services you need to provide housing
for the people who preserve the quality through the services they provide.”
! All businesses stressed that this is a regional issue requiring a regional
solution. ! Need to create a non-profit Housing Corp with Twin Pines, need the College as a partner because they have the land.
! Change zoning, replace existing housing with much higher density. Develop rental possibilities.
! Area schools and housing go hand in hand, need a regional school system. ! Hanover has a significant lack of diversity in its population and housing. ! Upper level recruits, engineers, may be buying their first house but the
cost has not kept them away. Non-engineering positions are a problem. Most are renting and have problems finding affordable rentals.
! Huge lack of apartment living space. Need apartment complexes (high density) of quality construction and reasonable prices.
! Have more refusals from secretarial staff in the $20-$30K level; they can’t find affordable housing.
! Housing opportunities and educational opportunities haven’t kept up with business expansion in the area.
! Most of our trades’ people don’t want to live in Hanover - too many snobs ! Chemists earn $70 - $90,000 but 50% refuse job because of high housing
costs. ! Manufacturing workforce has difficulty finding rentals and keeping
houses. ! Entry-level positions find it hard to locate housing to rent or buy. ! More and better housing would make selling the area and the company
much easier. ! Hanover needs a balance, this is more than just about the college. ! 10% turn down because they are sold on Hanover and cannot afford to live
there. ! Hanover’s strong zoning requirements and regulations stop growth. ! College didn’t predict the future needs of the school, 30-40 years ago the
problem should have been acknowledged and dealt with. ! Childcare is a huge issue. Any personnel increases will bring huge child
care issues. We asked employers what towns their current employees lived in and what they thought the daily commutes were for these employees. Of the 1,167
Hanover Affordable Housing Feasibility Study

employees for which employers provided us with information, only 7% called Hanover home compared to 26% of the college’s employees. According to the employers, twenty-three percent (23%) of the employees who responded to our survey live in Lebanon, 13% live in Enfield, 9% in Hartford, 8% in Canaan and almost 5% live in Claremont. According to employers, the average commute time was 20 - 30 minutes. SURVEY OF HANOVER EMPLOYEES With the permission of their employers we surveyed employees of local businesses including the Town of Hanover, and the School District, Spectra, Hypertherm and the Coop Foodstore. Surveys were distributed through both printed surveys and e-mails. We received two hundred and twenty-seven (227) responses of which 28 were deemed as not having enough response to be considered valid responses: fourteen of those persons called to complete the survey verbally so that they could express their personal feelings on the subject; the rest of these surveys were cases in which the respondents ignored the questions and provided verbal comments only. Many of those comments expressed a desire to live in Hanover but believe it will always be an impossibility, starkly at variance with comments from some current Hanover residents who feel that the market is working fine and who do not want any subsidized housing in Hanover. The following information was generated using the remaining 198 responses. It should be noted that we did not interview Dartmouth College employees because Dartmouth did their own housing study last year which asked a number of similar questions. We will provide correlation and comparisons below. The following summary presents some of the factors used to estimate the number of housing units needed and to break out how many of those may be in the low-moderate income range. ! Hanover employees tended to stay with their employers for long periods
of time, this trend was consistent throughout the survey, irrespective of the employer and where the employee lives. Sixty-five (65%) said that they had been with the same employer for more than 3 years, 29% more than 10 years and 12% more than 20 years.
Hanover Affordable Housing Feasibility Study Hadfield Associates, July 2001
! Employees called over 40 different communities home. (note: for this calculation we have combined Lebanon and West Lebanon, Hartford and the villages of WRJ, Wilder and Quechee, and Hanover and Etna). Figures are rounded to the nearest whole percentage. Twenty-nine ( 29) respondents said that they lived in Hanover and10 in Etna. The combined total of 39 represents approximately 20% of the responses. Of the balance,

another 39 said that they lived either in Lebanon or West Lebanon (20%). Twenty of the respondents live in Enfield (10%) followed by 19 (10%) in Hartford (WRJ, Wilder and Quechee). Of the remaining 40%, 9 live in Grantham, 7 in Canaan, 7 in Norwich, 6 in Plainfield , 5 in Claremont, 5 in Cornish, and 5 in Lyme. The remaining 37 employees are spread over 31 different communities.
! Despite the large number of communities from which Hanover pulls its
employees, the presence of the two interstate highways enables employees to travel fairly long distances within a relatively short period of time. Twenty-six percent (26%) said that it took them less than 10 minutes to drive to work one-way. The average commute is 15 - 25 minutes with the average distance traveled at 10 miles or less. Thirty percent (30%) of commuters travel 10- 20 miles to reach their place of employment.
! Eighty-seven percent (87%) said that parking was provided by their
employers. Of the remaining 25 respondents, all said that finding parking was not usually a problem for them.
! Just over one third (36%) of respondents said that they had moved to the
Upper Valley because of their jobs. Of those 72 respondents 27 (38%) said that the cost of housing was a significant factor. Of those that added a written explanation, most said that they did not consider housing as an issue until after they had taken the job and moved to the area and were then unable to find housing close to their employment.
! Of the 39 current residents of Hanover (including Etna) who responded to
the survey, 10 (25%) said that the high cost of housing would affect their decision to remain as an employee in Hanover.
! For non-Hanover residents we asked that if more affordable housing were
available in Hanover would you prefer to live in Hanover. Of the 159 respondents 87 (52%) said they would prefer to live in Hanover. Forty percent (40%) of Town employees would like to live in the town that they work in, 30% of school employees responding expressed the same sentiment. One third of Spectra’s employees would like to live in Hanover if they could afford housing and fully 59% of Hypertherm’s employees would also like to live in Hanover.
! We asked what size unit and in what price range would respondents
consider to be affordable to their household. Of 176 responses, thirty-one percent (31%) believed that housing under $100,000 was what they could afford with 31 needing 2 bedrooms and 19 households needing three-
Hanover Affordable Housing Feasibility Study
bedroom units. Seventy-five (75) households or (43%), would need 3 bedroom units in the $100,000 to $150,000 range. Twenty-four ( 24) households (14%) that could pay $150,000 to $200,000 for a three-bedroom unit. Only 13 households (7%) believed that a unit over $200,000 was affordable to them.
! We asked those who currently do not live in Hanover but would like to
live there, what size units and levels of affordability they would need. The percentage of need and affordability mirrors that of the survey response as a whole. More than half of the need is for 3 bedroom units (44) with 11 in the less than $100,000 range, 24 in the $100,000 to $150,000 range, and 9 in the $150,000 to $200,000 range. There is also a significant need for 2 bedroom units (33%), with 16 units at less than $100,000 and 10 units between $100,000 and $150,000.
! Of the 187 employees who responded to the survey, based on the Grafton
County income limits calculated by HUD, 34 households (18%) would be considered low- moderate income with 17 households falling into the low-income category and 17 into the moderate- income category. Four (4) of the respondents were single-females and two (2) single male, all with dependent children under 18.
It should be noted that for some respondents who do not currently live in Hanover and did not want to, the “snob” factor and “gated community” image played a significant role. We believe that the 18% low- moderate-income rate generated by this survey is a reasonable percentage upon which to base the need for low- moderate-income housing. We do however, believe that this figure underestimates the need because of the greater percentage of responses from the Town employees who in general tend to have higher household incomes than for example, employees of the Coop Foodstore.
Hanover Affordable Housing Feasibility Study Hadfield Associates, July 2001
Dartmouth College Housing Survey As mentioned earlier we did not survey Dartmouth employees regarding their attitudes towards housing because the Dartmouth College Real Estate Office conducted its own survey concluded in March of 2000. The questionnaire was distributed to 750 randomly selected Dartmouth employees, a total of 269 responses were returned. While the goal of the survey was different from that of the Business Employee survey above, some of the questions are comparable and the responses useful in determining the need for affordable housing in Hanover (34). Dartmouth College, Department of Human Resources, recently supplied us with a breakout of employees by job category. Of the College’s 3,809 employees for which they reported, the following job classification apply: 9% or 331 tenured faculty 19% or 733 other faculty 25% or 957 exempt (AP-1) 32% 9r 1,217 non-exempt (AP-2) 15% or 571 service (union and non-union) It should be noted that the exempt and non-exempt categories are roughly comparable to the AP-1 and AP-2 categories used in the survey below. Non-exempt and service personnel (47%) are generally hourly paid workers and were more likely to be in the lower income range and accordingly much less likely to be able to live in Hanover.
Hanover Affordable Housing Feasibility Study
! Respondent’s hometowns varied substantially depending on their job classification. The 5 classifications include Tenured/Track faculty, Other faculty, AP-1 (Upper - Level Administrative), AP-2 (Lower-level Administrative) and staff. Only 9 AP-2s, (9.5%) live in either Hanover or Etna compared to 32.5% of the AP-1s, 44% of other faculty, and 45% of

tenure track faculty. AP -1s are also twice as likely to live in Norwich than AP-2's. Forty-five percent of “tenured track faculty” and 45% of “other faculty live” in Hanover, and 10.6% and 13% respectively live in Norwich. The 14 staff persons responding live in 11 different communities.
! Single-family homes are the housing of choice for 94% of tenured faculty
and 81% of AP-1 personnel. Seventy-six percent of AP-2s also live in single- family homes in the region as do the majority (71%) of the staff. Interestingly, only 65% of the “other faculty” live in single-family homes. Ninety-three percent (93%) of tenure track faculty own their homes compared to only 50% of the staff. Twenty-six percent (26%) of AP-2s rent along with 22% of AP-1s. “Other faculty” tend to be almost equally as likely to rent as to own. Interestingly, staff were more likely to consider the housing supply as abundant than other employee categories, most likely because they are not looking for housing in the immediate vicinity of Hanover.
! Dartmouth College offers a Mortgage Assistance Program which nearly
half of the tenured track/tenured faculty said that they took advantage of. The program includes reduced down payment and lower-than-normal interest rates. The majority of respondents to the survey were unaware that this program existed.
! Many Dartmouth faculty and staff start out their employment by renting
housing from the College. Fifty-five percent of tenured faculty and 39% of other faculty had actually rented housing with an average of 3.1 years to 3.9 years. AP personnel and staff were significantly less likely to rent, 28% of AP-1, 18% of AP-2, and 21% of staff and the average stay ranged from 2.0 to 2.8 years. Not enough staff responded to questions about rental housing and the Grasse Road houses. In rating the rental unit program at the College AP-2s responded negatively to the occupancy time limit (too short), the rental rates (too high) and the design and style of the units. AP-2s also thought that the costs of the homes on Grasse Road are too high.
! While the commuting data resembled that of our research with the
businesses, AP-2's were more likely to drive further to work. Most commuters fell within the 15 -25 minutes but staff and AP-2's are more likely to drive for more than 20 minutes.
Hanover Affordable Housing Feasibility Study Hadfield Associates, July 2001
! Respondents rated Hanover, Norwich and then Lyme as the most desirable place to live. Question 8 asked why they live where they live when other locations are more desirable? Of the 71 written responses, 54 were from staff and APs almost 90% said that it was because of the cost of housing.

Respondents were asked what services Dartmouth might offer to assist with housing needs. Responses ranged from ! Petition the Town to allow more development of affordable housing, ! Create a greater range of housing opportunities both in town and in the
area, ! Promote and enhance the mortgage assistance program, ! Pro-rate the rental housing costs relative to salary, ! Offer second mortgages, ! Offer programs to staff and AP-2s as well as faculty and upper level
administrators, ! Provide more long-term rentals, ! Provide low-interest loans for down-payment assistance, ! Offer prospective retirees help in finding smaller housing, ! Create savings programs for down payments. College Town Comparison - UMASS at Amherst The debate over preserving land versus providing housing is bitter in most communities, with equally vociferous supporters on either side, but especially so in college communities where the connection between the economic and cultural benefit that the institution provides is blurred by the impacts associated with the college. Undeveloped land does not require services and does not produce children, making it the least costly alternative for a community, housing on the other hand is the most expensive. Stanford University fights this battle on a daily basis as does Amherst. The issue is summed up quite well by Larry Horton, the Director of Stanford University’s government and community relations, who was quoted in the Stanford University daily news (web site) on August 10, 2000 as saying, “The reality is that people like housing in the abstract, but they dislike almost any and all specific proposals”. The Town of Hanover is not unique when it comes to facing the issues created by the need to house a college population. The Town of Amherst, Massachusetts and the University of Massachusetts (Umass) at Amherst have been working together to address the issue of affordable housing. Connie Kruger, Amherst Senior Planner and Judy Steinkamp, UMass Master Plan Coordinator, attended one of the Hanover Affordable Housing Coalition seminars, talked with us about the issues, and supplied us with a variety of documents including a briefing on student housing and the report of the Campus Housing Master Plan Committee (35). With a population of 35,000 Amherst is much larger than Hanover; however, the housing dynamics are similar although on a larger scale. The
Hanover Affordable Housing Feasibility Study

majority of Dartmouth students live on campus, approximately one-third of Amherst students (6-7000) live off campus. The need for housing is great and both the University and the Town are under pressure to create more housing for faculty, students, staff and for non-college residents. The Town of Amherst has requested that the campus build additional “below market” housing on campus so that the affordable units now occupied by students in the Town can be vacated. (36) The Town and the College have reached an agreement to work together (Town/Gown). The Agreement has resulted in a “Joint Planning Initiative” and a “Comprehensive Plan Committee”. They have developed Buildout and Future Growth Analysis which in turn identified a need for 300-600 units for undergraduates, 200-300 apartments for graduates and 300+ affordable family units. The solution being developed by the joint Town/Gown Agreement includes developing both Town and University lands to solve the problem. The Town and the University are engaged in discussions about a joint development project which would bring together land from the Town and land from the University to develop affordable family housing. The project proposes to build two types of housing that accommodates two groups of students and low- to moderate- income households. ! Single graduate student housing, single bedrooms and shared living,
kitchen and bathroom facilities set up in clusters of four bedrooms. Three buildings on 3 acres of land x 48 beds per unit = 288 graduate beds.
! Family apartments consisting of one- two- and three-bedroom units for
couples with and without children. An acre of land can typically accommodate 12-15 units depending on size and number of stories.
! The Town piece will contain apartment style units with a large mix of
affordable units and market rate units. The project would be financed using a combination of approaches including low-cost financing programs, foundation funding and private developer financing. Amherst faces much the same issues as Hanover but has come together publicly with the College to propose a joint solution (28).
Hanover Affordable Housing Feasibility Study Hadfield Associates, July 2001

SUMMARY OF NEED 1) Interviews with Social Service Agencies ! Immediate need is for 8 units of Senior Housing based on the existing
waiting list, 3 units for persons with disabilities, and 4 units for single-female head of households with dependent children.
2) 1990 Census
While the 1990 Census data is 10 years old, it is the only comprehensive and comparable source of town and regional income data available to us. These data also provide a snapshot of Hanover as a community before housing costs skyrocketed over the last few years.
! While the Census income breakout categories do not exactly fit the
breakout categories for Grafton County low-moderate income as defined by Housing and Urban Development (HUD), we can reasonably estimate the number of households fitting into each category. In 1989, approximately 22% (520) of Hanover’s households had incomes below 80% of the Grafton County median household income of $30,065. Another 15% (340) households would fall between 80% and 120% of the
Hanover Affordable Housing Feasibility Study

Grafton County median household income. Approximately 14% (320) households would fall between 120% of Grafton County median household income and the town of Hanover 1989 median household income.
Table 14 Income Definition 1990* 2000**
Category Household Income Income Ranges Estimated Income Ranges
Grafton County Median Household Income $30,065 $40,287 Hanover Median Household Income $51,899 $69,544
Low less than 80% of Grafton County Median less than $24,052 less than $32,229 Moderate between 80% and 120% of Grafton County Median $24,052 - $36,078 $32,229 - $48,334 Middle between 120% of Grafton County Median and Hanover
Median $36,078 - $51,899 $48,344 - $69,531
Source: 1990 U.S. Census*
** Methodology - For the purposes of defining income ranges we are using household income data versus family income data; primarily because of the diverse nature of residences and occupants in the town. More than 35% of the housing units are occupied by non-family households due to the presence of College students and faculty who might be sharing quarters. Typically, family median incomes tend to be approximately 20% higher than household median. The only recent income data available to us at this time is the HUD family median income for Grafton County which is $47,500 (2000). This represents a 34% increase over the 1989 family median income figure. After reviewing previous census and income data, we have made the assumption, for planning purposes, that household income has increased at the same rate as family income. This translates to a Grafton County median household income of $40,267 with low income being less than $32,229, moderate $32,229 - $48,344, and middle income $48,344 to $69,531. Their estimates are for planning purposes only and should be verified and updated as soon as the 2000 Census data become available.
! Based on review of the data approximately 10% (52) of lower income households are likely to be occupied by single head of households with dependents under 18.
Hanover Affordable Housing Feasibility Study Hadfield Associates, July 2001
! Of the lower income households 47% (245) units were occupied by head of household either under 25 or under 35. We surmise that these units are primarily occupied by students both graduate and undergraduates. Approximately 38% (200) of the lower income units were occupied by head of households over the age of 65.

! With the exception of the head of household under age 25 group, moderate
and middle-income households were spread fairly evenly across the age groups defined by the census. This suggests that housing affordable to moderate and middle-income households would be an appropriate target for housing development.
3) The Fair Share ! According to the Fair Share Analysis of UVLSRPC, Hanover’s suggested
fair share is an increase of approximately 456 rental units or 19% of the commuter-shed’s need of 2,398 units.
! Of the 772 rental units in Hanover in 1990, 214 (28%) were occupied by
households paying more than 30% of the household income for housing. The high percentage of lower-income renters in the town is a reflection of the Dartmouth College off-campus students occupying both apartments and single-family homes. While the students are often willing to overcrowd in order to bring down rents per person, this gives landlords the opportunity to charge higher rents, thus restricting non-student renters (31).
! Eight-percent (129) of the town’s households of owner- occupied units were paying more than 30% of their household income for housing.
! The Fair Share model establishes the amount of housing needed based on
financially burdened lower-income renter households but does not include those home owners struggling to keep their homes, overcrowded units, or renters looking to own. The models suggests that Hanover’s total Fair Share increase of units is 456 rental units, or 19% of the commuter-shed’s need of 2,398 units or an increase of 15% of the number of housing units in the Town.
! To extend the review of households further, 62% of renters over the age of
65 were paying more than 30% of their income for housing compared to 38% of those in the 15-64 year cohort. In contrast, 22% of home owners in the 15-64 year cohort were paying more than 30% of their household income for housing and 28% of home owners over 65 were paying more than 30%.
! In 1990, only 3 of the Town’s housing units were mobile homes compared
to 4.3% of Norwich’s housing units and 4.2% (238) of Lebanon’s housing units, 447 (8.9%) of the Town of Hartford’s housing units, 11.4% (246) of the units in the Town of Enfield.
Hanover Affordable Housing Feasibility Study

! Only 24 of the Town housing units are subsidized, less than 1 tenth of 1
percent compared with 10% of Lebanon’s housing stock, 9% of Claremont’s, and 6% of Hartford’s.
4) Employee Survey ! Eighteen percent of the 187 employees who responded to the income
survey, 34 households (18%) fall into the Grafton County low-moderate income category.
! Of the 187 employees who responded, 12 (6.4%) were single-parent head
- of- households with dependent children under 18. ! Of the 34 low-moderate income households, 4 were single female head of
household and 2 single male head of households with dependents under 18.
! One unit was occupied by a head of household over the age of 62. ! The housing requirements of these 34 households include 11 three-
bedroom units, 9 two-bedroom units and 14 one-bedroom units. Families requiring two - and three- bedroom units were more likely to be moderate income while single persons were more likely to be low income.
! Hanover’s current covered employment, that is employees for whom their
employer reports wage and tax information as required by law, is 8,792. (37). If the low-moderate income percentage of 18% that we identified in our employee survey was applied to the work force of 8,792 it would translate to approximately 1,700 units.
5) Dartmouth College ! Approximately 1,821 Dartmouth students live off-campus, 685 under
graduates and 1,136 graduate students. ! The college employs 3,809 faculty and staff. ! The college currently has approximately 440 units of rental housing off-
campus and has constructed 32 ownership units at Grasse Road for a total of 505 units. An additional 23 ownership units are now under construction at Grasse Road.
Hanover Affordable Housing Feasibility Study Hadfield Associates, July 2001

! The college currently provides approximately 505 units to serve approximately 5,630 faculty, staff, graduate students and off-campus undergraduates.
! 47% of the College’s employees are non-exempt, hourly paid workers. SUMMARY AND RECOMMENDATIONS In keeping with our earlier statement we will not present existing information except as it pertains to this study. We recommend readers review the Town of Hanover Draft Master Plan and, more importantly, attend Planning Board meetings when this subject is on the agenda. Affordable housing is a regional issue and while we have focused on Hanover as requested, solutions to the current affordable housing crisis require regional cooperation. Hanover alone cannot solve the immediate housing crisis nor will market forces produce affordable housing in Hanover.
Hanover Affordable Housing Feasibility Study
Real estate values in Hanover and the Upper Valley are continuing to rise (38). This is further evidenced by the prices of the college’s Grasse Road units ($200,000 - $340,000), the prices of the Simpson Development units, Phase I ($340,000+) ; by the emerging trend of removing existing houses and replacing them with larger houses, and also by the strong home equity market. Hanover residents, seeing no place else to move to in town are simply upgrading their existing properties(39).

Most of the Hanover employers that we talked with are not planning large expansions in the near future; however, the Dartmouth Hitchcock Medical Center expansion will impact the demand for affordable housing within the region and in Hanover. Affordable housing must be looked at in the context of the region and the income and employment levels of the region. To this end the Upper Valley Lake Sunapee Regional Planning Commission has spearheaded an effort to study the number of existing housing units and predict future needs using economic factors as a basis. Applied Economic Research (AER) has been hired to conduct the study and the results are expected in early November. We mention this study primarily because we have only touched briefly on the complex economic factors which effect the supply of housing and the future housing needs and we expect that that study which includes the entire Upper Valley Region, on both sides of the river, will define the future needs for affordable housing in the region. While national economic trends point to stabilization and possibly even a mild recession, the Upper Valley is somewhat insulated from recession by the presence of the College and the Hospital. Given the economic multipliers of the College and, we surmise, the Hospital, which by their nature generate more lower-income service jobs to support their own students, employees and patients, the need for affordable housing will only increase. The research for this report strongly indicates that a deficit of affordable housing already exists throughout the region and especially so in Hanover, both in terms of rental units and for home ownership. This study endorses the recommendations and housing policies contained in the draft Master Plan housing chapter including: ! Guiding residential use to areas of Hanover where Town facilities and
services are available. ! Housing affordable to low- and moderate- income families and disabled
and elderly residents is desirable. ! Preference for Open Space subdivisions and Planned Residential
developments in outlying areas of town, and compact higher density Village Centers, in areas near the village centers and proximate to downtown.
! The housing stock should appeal to and be affordable by an economically diverse range of people.
! The college should build more housing for students and all income levels of faculty and staff.
Hanover Affordable Housing Feasibility Study Hadfield Associates, July 2001
However, while these are admirable policies they have not been implemented and any change in the Hanover housing situation will most likely require regulatory action on the part of the Town, specifically re-zoning, and including the incorporation of affordable housing requirements in the zoning regulations along with specific action by the town and the college to create affordable units. The recent development by the Hanover Planning Board Members of the Master Plan Vision Statements is encouraging. The vision statements take the next step of mapping out areas of the community for new “Village Centers” with both high-density housing and commercial development supported by public transit. The effect of these new Village Centers besides the obvious one of creating new neighborhoods will be to reduce the traffic impact in the downtown area. In addition, the increased density will allow the town to preserve open space while still providing affordable housing to the workforce and student population. We begin this summary with some general findings based on our research and follow with specific recommendations. Findings ! Both the Town of Hanover and Dartmouth College rely on other
communities to provide housing for their lower- to moderate- income workforce. Other Upper Valley communities carry the burden of providing subsidized units and non-traditional housing; in particular Lebanon, Claremont, Newport and Enfield, New Hampshire and Hartford, VT.
! Any attempt to create affordable housing in Hanover will require the full
support, cooperation and the commitment of the Town government, the community, Dartmouth College and other major employers.
! Due to the shortage of land available for construction, any construction of
affordable housing will require that either the Town or the college will provide the land at no cost or long term (99 year) lease. However, with such tremendous housing needs of its own, there is little incentive for the College to provide land for housing units for which the College’s own employees and students would then have to compete.
! The College can significantly address affordable housing needs by
offering a wide range of housing types and costs appropriate to the entire College employment wage scale.
! Affordable housing will require high-density zoning in areas served by
public sewer and water.
Hanover Affordable Housing Feasibility Study
! Any new housing should be in conformity with the existing building styles
of Hanover and New England. ! New housing production should be mixed-income to prevent the
perception of creating a low-income neighborhood and to avoid socio-economic segregation.
! The production of affordable housing units by the Town, the college or
any other private developer will require that the Town adopt mandatory affordable housing quotas and/or density bonuses in its development regulations.
! While it is perhaps unrealistic to consider that every person who works in
Hanover should be able to live there, the housing stock in the Town should at least reflect the percentage of low-to moderate-income households (excluding student housing) which make up the workforce (18%).
! Only if housing is available for people from different income levels can
the diversity of Hanover’s population increase and can a larger segment of those who work in the town also live in the town.
! The failure of the Town of Hanover to carry its share of the regional
burden of providing affordable housing units forces other communities to enact land use regulations to protect themselves from being the recipient of additional affordable or low-income units.
! Given the current population breakout, the dearth of persons in the 20 - 44
year old age group, and the corresponding small percentage of children in the under 5 age group, the creation of affordable housing is not likely to have a significant impact on the existing elementary school system over the next ten years. As the children of the baby boomers move through to college age over the next few years we will see further reductions in the number of elementary school age children. This situation provides a planning “window of opportunity”.
! The cost and number of children generated by housing development is
continually raised in opposition to new housing development. Contrary to the general perception that if a house has 3 bedrooms it will have 4 children, the number of school age children generated by new single-family homes is considered to be between .65 and .75 per unit (Source: AER).
Hanover Affordable Housing Feasibility Study Hadfield Associates, July 2001

! Very expensive homes are becoming common in Hanover. These homes tend to be owned by older, financially secure people who do not have young children. The taxes paid by these units will probably more than offset any school expense burden expected to be modest, caused by the provision of affordable housing in the town.
! The provision of affordable housing must be integrated into both existing
and future residential planning. ! We have looked at affordable housing in terms of low - to moderate-
income standards based on Grafton County demographics but we must also consider what that means to Hanover and the Upper Valley and include housing units available to middle- income households earning between the Grafton County median income and the town of Hanover median income. It should be noted that homebuyer assistance is available through the New Hampshire Housing Finance Authority for families with incomes as high as $58,800. However, this income could not buy a house in Hanover. The need for affordable housing spans the income ranges from <$20,000 to as high as $70,000.
! New housing should be clustered in order to preserve open space where
possible and to provide residential amenity. The density of new housing development must be high with at least 14 units per acre with perhaps up to 20 units per acre depending on land limitations in order to bring the cost down to affordable rates. Legally binding restrictions need to be provided to ensure that affordable housing remains affordable over the long term.
! Increasing the number, diversity and density of housing units in the
“urban” area and the downtown will require rezoning and the organization of high density, diverse housing, based on new village centers. Infill housing should be encouraged as should rehabilitation of existing structures and, if necessary, replacement with higher-density housing units,
! Reliance on our automobiles is a disincentive to the production of higher
density housing in the urban area and the Hanover downtown. Future more dense developments in this area must require that parking be available but at lesser rates than now required. This is a radical step, but in a college community which is well served by public transit, this could work especially for students and college employees, and which could have a high level of pedestrian commuting. New development should consider residences above parking areas.
Hanover Affordable Housing Feasibility Study

! The proposed Rivercrest and Centerra North village centers should include high-density housing along with mixed office/commercial development. Densities should be high enough to enable diverse and affordable housing and to promote the feasibility of public transportation and other alternative forms of commuting. In addition, zoning should allow infill or redevelopment of existing lots in these neighborhoods to increase the density area while respecting the character of the existing neighborhoods.
! The development of large private land tracts in areas served by public
water and sewer should have a requirement that a percentage of those units be affordable by Grafton County income limits, the percentage should reflect the percentage appropriate to the income spectrum of the town’s workforce falling into the low- moderate and middle income categories.
! The College has approximately 3,581 employees and 1,200 graduates
students and approximately 685 under-graduates living off campus, and currently provides approximately 440 units of rental housing between all locations. Approximately 360 more rental units are proposed for faculty, staff and graduate students between locations in Hanover and Lebanon.
! Dartmouth College plans to create new dormitories to accommodate 400
of their approximately 685 under-graduates who are currently living off campus. It is difficult to predict the effect of the construction of the new dormitories on the Hanover rental market. We surmise that the result will be a gravitation of graduate students and faculty moving back into Hanover. However, graduate students tend to be lower income and less willing to overcrowd the units they occupy putting them on a more competitive level with non-college households; this may alleviate some of the need for non-college rental housing. In addition, the result will be to free up units in other communities
! The College plans to re-develop the Rivercrest development quadrupling
the number of units by adding approximately 180 rental units of a much more diverse character than at present.
! The college hopes to expand the number of units at Sachem Village in
Lebanon, adding approximately 100 rental units and plans additional Phases at its Grasse Road faculty and staff ownership housing.
Hanover Affordable Housing Feasibility Study Hadfield Associates, July 2001

Strategies/Actions for Increasing the Supply of Affordable Housing
Hanover Affordable Housing Feasibility Study
There are a number of ways in which Hanover can increase the supply of affordable housing in the town and in the region. These include, the Town in partnership with the Hanover Affordable Housing Coalition and Twin Pines Housing Trust taking immediate action to identify property and developing mixed-income affordable/workforce housing for both rental and home-ownership options oriented towards singles, couples and families of low-, moderate- and middle-incomes. This should include units for which Section 8 vouchers can be

applied for and should include a variety of housing styles compatible with New England village architecture. In addition, while providing affordable housing for the senior population did not surface as a high priority, including 8 additional units of senior/disabled housing on the site of the existing current Senior Center as part of the re-development of that site could address the identified need for senior housing. It should be noted that a significant portion of Hanover’s population is elderly and are on fixed incomes. For many of these residents rising taxes may make it impossible to continue to live in Hanover. However, there is a large number of housing units, both subsidized and non-subsidized, already dedicated to seniors in the Upper Valley, and there is significant expansion already planned at Quail Hollow in Lebanon. In discussion with Upper Valley housing providers this segment of the population was not considered a “priority need”; in addition, discussion focused on the fact that today’s seniors tend to be healthier and more active and many do not wish to move to a seniors only location. We propose 50 units of affordable/workforce housing which, while not designated specifically for elderly, would be available to mixed ages and incomes. We also add that many seniors are able to continue to live in their own homes and allowing more “mother-in-law” apartments could address two issues - allowing seniors to stay in their homes and community by providing rental income and providing much needed rental units for singles and couples. Building and Funding Affordable Housing We have included in the appendix a compendium of state and federal programs directed towards affordable housing; this compendium was created by Applied Economic Resources (AER)for the Salem Willows project but is equally applicable here. Also useful is a summary of affordable housing financing sources and strategies created by Bill Bittinger of Upper Valley Housing for one of the Hanover Affordable Housing Coalition’s affordable housing seminars (see Appendix III). The document cites 22 ways to lower homebuyer’s costs. Strategies include how to reduce the price of the house itself and how to reduce the cost of ownership. Possibly the most important section of this document is the list of the possible roles of the many diverse entities that can partner to create and maintain affordable housing.
Hanover Affordable Housing Feasibility Study Hadfield Associates, July 2001
Another mechanism for providing affordable housing is to allow the transfer of development rights. Transfer of development rights is used to reduce development in one area in exchange for increasing development somewhere else. The actual requirements can vary from community to community. In Boulder, Colorado, for example, the City and the County adopted a joint transfer of development rights agreement as part of the regional effort. Under this program developers can skip the City of Boulder’s growth management allocation process if they purchase one transfer of development right unit for every housing unit that

they want to build. The Town of Hanover could develop a version of this program to promote infill and higher density housing in the “urban” areas of town already served by public water and sewer, while enabling the reduction of development density and the provision of additional open space, in the rural areas of Hanover.
Hanover Affordable Housing Feasibility Study
RECOMMENDATIONS There is a critical shortage of affordable housing units in the Upper Valley and especially in Hanover. While, we have provided both long and short-term recommendations, simply implementing either the short-term or the long-term recommendations/strategies alone will not accomplish the desired result of increasing the supply and diversity of housing in Hanover. Hanover should take steps to implement as many of these recommendations as possible. Long Term Recommendations The following list of recommendations is divided into three sections: Land Use, Finance and Public Advocacy. The majority of these recommendations are considered long-term such as those which establish new zoning districts, higher densities and legislative initiatives. In addition, we propose two recommendations to develop affordable housing immediately. Land Use Recommendations: ! Encourage the voluntary creation of affordable housing, both rental and
home-ownership, through bonus densities, cash incentives and other financial support. Consider cash payments in lieu of affordable housing percentages.
! Require that affordable home ownership units created should have deed
covenants to make them permanently affordable. ! Create a mechanism to mange units including turnover, qualifications,
screening, selection process, renewal of deed covenants etc. either through the Hanover Affordable Housing Coalition or through Twin Pines Housing Trust.
! Require that any housing units, including those proposed for Rivercrest,
constructed by Dartmouth College have an affordable housing component proportionate to the percentage of Dartmouth College employees falling into the low - to moderate and middle-income ranges.
! Dartmouth College must take the lead in providing affordable rental units
for faculty, staff and graduate students. The proposed units at Rivercrest will go a long way to cover the town’s suggested “Fair Share” apportionment of 456 units. However, this is still only a portion of the identified need.
Hanover Affordable Housing Feasibility Study Hadfield Associates, July 2001

! Dartmouth College should include home ownership units affordable to the income spectrum of faculty and staff as well as rental units instead of only high- end home ownership units.
! The Town should support the College’s request to re-zone Rivercrest to
allow substantially increased density. Expand the re-zoning to include increases in density throughout the proposed Village Center. In addition, the Town should allow and encourage increased density at Centerra North, within the downtown, and allow PRDs in the SR zone.
! The Town should, by rezoning and public infrastructure improvements,
enable the College to redevelop its newly acquired downtown properties with mixed, high-density residential and commercial uses, including a wide diversity of housing types and costs consistent with the income-spectrum of its employees.
! The College should support any efforts by the Town to provide low-
moderate income housing since such developments give notice to the Upper Valley that Hanover is willing to do its part. The encouragement of regional cooperation might then benefit the College in its attempts to expand housing in other communities.
! The College should work in partnership with the Town and the Hanover
Housing Coalition to facilitate a more expeditious implementation of housing creation.
! Conduct a Town wide study of vacant and developed lands able to support
higher densities (up to 20 units per acre). Look within existing water and sewer service areas for potentially developable land.
! Work with Upper Valley Land Trust and the Hanover Conservation
Council to identify available options as a component of developing affordable housing along with preserving green space, including transfers of development rights and promotion of Open Space Subdivisions and Planned Residential Developments.
! Work with Dartmouth College to identify college properties that could be
suitable for a combined college/town joint affordable housing project. The Sullivan-Gibson/Sand Hill tract could be appropriate.
! Encourage the college to move faster with its program to build on-campus
housing for all undergraduate students and require that under-graduate students live on campus. Princeton has this policy, as do other universities.
Hanover Affordable Housing Feasibility Study

! The Town should purchase properties in the downtown and “urban” areas
that are potentially developable for rehabilitation as rental housing as they become available, or create a Housing Commission to do so.
! The Town should encourage the College to develop higher density housing on the properties purchased by the college from the Hanover Improvement Society. Where possible ground floors of the units should be commercial to allow for future expansion with residential on upper floors. The Town should support zoning amendments to allow higher density housing in this area of the downtown.
! Identify under-built properties in downtown area and consider applying
for state and federal funding to develop low- to moderate-income rental housing.
! The housing section of the new Master Plan should contain, as a policy,
the Town’s commitment to provide affordable housing based on the Grafton County income ranges but also should be reflective of Hanover’s resident and employee income ranges.
! Increase the housing density to not less than 14 to 20 units per acre in the
Village Centers proposed in the Draft Master Plan at Rivercrest and Centerra North.
! Encourage the creation of “mother-in-law” apartments in owner-occupied
homes to allow older residents to provide affordable rentals and in turn remain in their homes, while respecting the established character of neighborhoods.
Public Advocacy Recommendations: ! Endorse and fund the Hanover Affordable Housing Coalition as a
permanent commission of the Town and support their efforts to work with the Town and the college to create affordable housing in Hanover, or alternatively.
! Support Twin Pines Housing Trust: consider funding a position with Twin
Pines Housing Trust which could be dedicated to working specifically on Hanover’s affordable housing needs; or alternatively,
! Endorse the Hanover Affordable Housing Coalition’s application to
become a non-profit and hire a Town staff member to work with a Hanover Affordable Housing Commission and Coalition.
Hanover Affordable Housing Feasibility Study Hadfield Associates, July 2001

! Formally create an official Town and College “Housing Planning Committee” (similar to Amherst/UMASS and Burlington and University of Vermont) to look at how the Town and the College can work together jointly to address the housing issues, or promote such cooperation through the Town/Gown Committee.
! Work with the newly formed Upper Valley Workforce Housing Task Force to assure that banks, developers, and area housing agents are supported in their goal to develop affordable housing for the whole of the Upper Valley region.
! Work with area businesses to understand their ongoing need for housing
that directly reflects their growth and expansion.
! The College should follow up on the housing study which was conducted in the spring of 2000 and develop a housing strategy which considers the needs of students and employees and plans housing development accordingly.
! Encourage legislation to provide incentives to developers to build
affordable housing. Link the production of higher- end housing with affordable housing.
! Encourage area businesses to provide employer-assisted housing benefits
such as mortgage and down payment assistance programs including the creation of Individual Deposit Accounts (IDAs).
! Encourage area businesses to plan for housing as part of any expansion. ! Encourage the State to consider rewarding communities that zone for
increased densities with higher priorities for infrastructure funding, grants and loans and to enact a “Comprehensive Permit” zoning override process to foster affordable housing.
! Encourage state and federal agencies to produce housing assistance
programs using the same formulas and to provide better coordination between programs.
! Encourage state and federal agencies to use income criteria which reflect
the income levels in the area of need rather than the County.
Hanover Affordable Housing Feasibility Study

Finance Recommendations: ! Encourage and work with Habitat for Humanity and similar organizations
to develop a plan that would enable them to construct and maintain affordable housing in Hanover.
! Seek financing from state, federal and private sources to develop mixed-
income housing that includes low- to moderate, middle-income and market-rate housing.
Short Term Recommendations Project 1 Create 8 units of affordable senior and disabled housing The results of this study indicate a specific need for 8 additional units of affordable elderly housing and 3 units of disabled housing. We suggest that along with the construction of the Senior Center and Community Center, that another cluster of 8 units of senior housing in conformance with the existing residences at Summer and Park Streets be constructed on the site of the existing senior center building. Housing for the disabled should be incorporated under project 2. Work with the Lebanon Housing Authority to apply for HUD Section 202 grant funds to develop this housing. The Lebanon Housing Authority would manage these units along with the existing residences. Project 2 Create 50 units of mixed income rental and home-ownership units to serve low-moderate and middle-income households. While we have used the results of the study to identify the need and type of units outlined in this project, we also had a brainstorming session with Upper Valley service agencies and housing developers including the Hanover Affordable Housing Coalition, Bittinger Associates (Upper Valley Housing), Vital Communities, Twin Pines Housing Trust, and the Lebanon Housing Authority to create this scenario. We caution that to put funding together for this project is possible, but it is a monumental task and requires experience. We suggest that in the event that the Town or the Housing Coalition attempts this project that they hire a developer/ consultant with experience in putting together affordable housing projects and work closely with Twin Pines Housing Trust.
Hanover Affordable Housing Feasibility Study Hadfield Associates, July 2001
The study (of 187 persons employed in Hanover) identified 34 (18%) low-moderate income households in need of affordable housing. Of these a significant
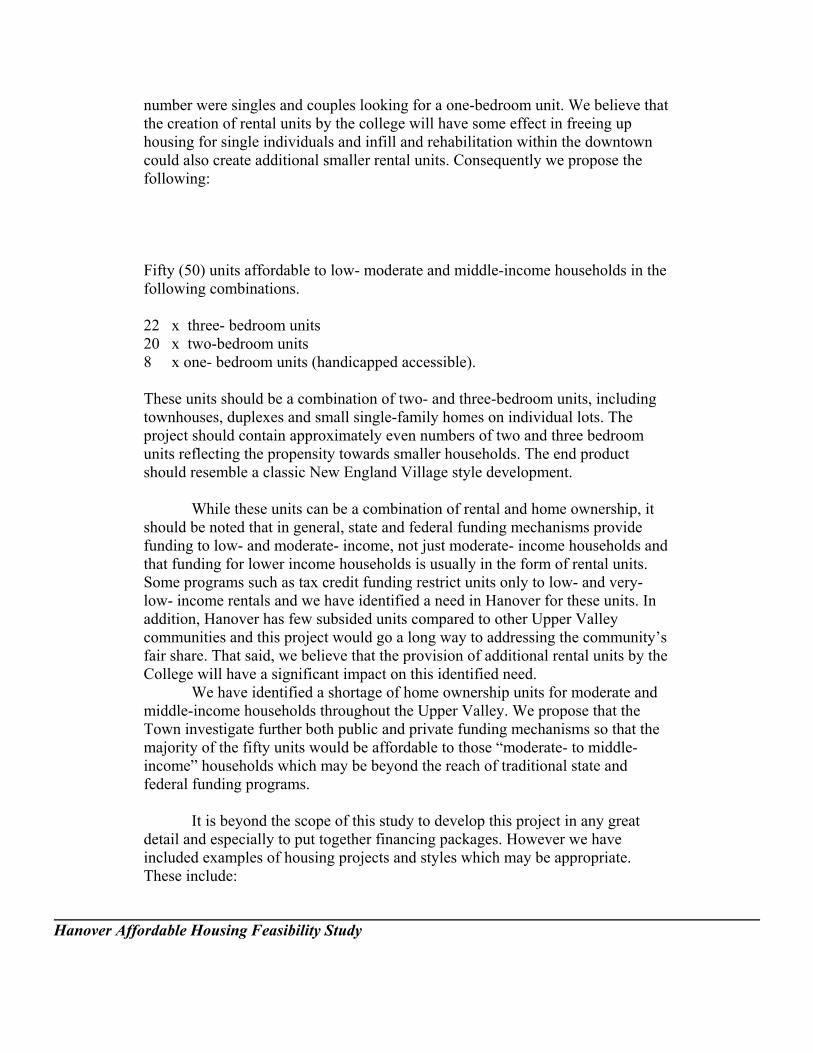
number were singles and couples looking for a one-bedroom unit. We believe that the creation of rental units by the college will have some effect in freeing up housing for single individuals and infill and rehabilitation within the downtown could also create additional smaller rental units. Consequently we propose the following: Fifty (50) units affordable to low- moderate and middle-income households in the following combinations. 22 x three- bedroom units 20 x two-bedroom units 8 x one- bedroom units (handicapped accessible). These units should be a combination of two- and three-bedroom units, including townhouses, duplexes and small single-family homes on individual lots. The project should contain approximately even numbers of two and three bedroom units reflecting the propensity towards smaller households. The end product should resemble a classic New England Village style development. While these units can be a combination of rental and home ownership, it should be noted that in general, state and federal funding mechanisms provide funding to low- and moderate- income, not just moderate- income households and that funding for lower income households is usually in the form of rental units. Some programs such as tax credit funding restrict units only to low- and very- low- income rentals and we have identified a need in Hanover for these units. In addition, Hanover has few subsided units compared to other Upper Valley communities and this project would go a long way to addressing the community’s fair share. That said, we believe that the provision of additional rental units by the College will have a significant impact on this identified need. We have identified a shortage of home ownership units for moderate and middle-income households throughout the Upper Valley. We propose that the Town investigate further both public and private funding mechanisms so that the majority of the fifty units would be affordable to those “moderate- to middle- income” households which may be beyond the reach of traditional state and federal funding programs. It is beyond the scope of this study to develop this project in any great detail and especially to put together financing packages. However we have included examples of housing projects and styles which may be appropriate. These include:
Hanover Affordable Housing Feasibility Study
! Battle Road Farm, Lincoln, Mass., which includes 120 home-ownership mixed-income townhouse style units.
! Perley Place in Concord, 11 rental units, consisting of a Victorian style
duplex including 2 two-bedroom units and 9 three-bedroom units. Note while this is currently a rental project this design could be used for home-ownership.
More locally, ! Star Lake Village in Norwich, VT is a collection of small two- and three-
bedroom single-family home-ownership units restricted to income-qualified buyers.
We have included photographs of these affordable housing projects in Appendix I.
Hanover Affordable Housing Feasibility Study Hadfield Associates, July 2001
Notes/References 1) Housing and Economic Growth in New Hampshire, November 1998, update April 1999, Applied Economic Resources and Feeling the Pinch, Wages and Housing in New Hampshire, report, The New Hampshire Housing Forum, 2000. 2) Report of the Regional Commission on Affordable Housing Needs of Academic Communities, January 1990, OKM Associates Inc., and Rolf Geotze. 3) Report of the Regional Commission on Affordable Housing Needs of Academic Communities, January 1990, OKM Associates Inc., and Rolf Geotze. 4) Hadfield Associates, Employer Survey - June Fisher, Director of Employment, Dartmouth Hitchcock Medical Center, Interviews - on site and by telephone. 5)Resource Systems Group (RSG) Traffic and Parking Report for Dartmouth College, Dartmouth College (not yet released), Statement of Impact, Dartmouth Hitchcock Medical Center New Facilities Project, DHMC, Resource Systems Group, Pathways Consulting, and Natural Resource Consulting Service. 6) Upper Valley Lake Sunapee Regional Planning Commission, Handout prepared for Hanover Affordable Housing Coalition Seminar, April 13, 2001. 7) The study was undertaken using the year 2000 HUD income limits. In April of 2001, HUD issued new income limits which increase the median income approximately 6.5% over the previous year. 8) Twin Pines Housing Trust (Gretchen Rittenhouse), Concord Area trust for Community Housing (Mary Downes) telephone interviews. 9) Greater Seacoast Workforce Housing/Labor Shortage Summit, March 28, 2001 10) Dartmouth College, Human Resources (Linda Langley) 11) Spencer Square, Lebanon, New Hampshire: Market Feasibility Analysis, Doug Kennedy Associates, February, 1999. 12) Dartmouth College Undergraduate Registrar by telephone, May 2001 13) Registrars of each Graduate School by telephone, May 2001
Hanover Affordable Housing Feasibility Study
14) Dartmouth College Real Estate Office, Larry Kelly, Susie Weider; City of Lebanon Planning Office; Town of Hanover Planning and Zoning Department.

15) Larry Kelly, Dartmouth College Real Estate Office, interview. 16) Jonathan Edwards, Town of Hanover, Planning and Zoning Director 17) Dartmouth College Housing Survey prepared for Dartmouth College Real Estate Office by Millyn Moore and Associates, Quechee, VT., March 2000. 18)Jonathan Edwards, Town of Hanover, Planning and Zoning Director 19) New Hampshire Housing Finance Authority, Dan Smith (Note: Includes Claremont where homes tend to sell for less). 20) Hanover Housing Profile, Doug J. Kennedy & Associates, July 16, 1993 for the Hanover Planning Board. 21) Hadfield Associates - Employer Survey, March 2001
22) New Hampshire Basic Needs and a Livable Wage, The Josiah Bartlett Center for Public Policy and North Country Council et al. June 2000. 23) 2001 Residential Rental Survey, New Hampshire Housing Finance Authority 24) Feeling the Pinch, Wages and Housing in New Hampshire, report, The New Hampshire Housing Forum, 2000. 25) NH Employment Security, quoted in Feeling the Pinch 26) Feeling the Pinch, Wages and Housing in New Hampshire, report, The New Hampshire Housing Forum, 2000. 27) Feeling the Pinch, Wages and Housing in New Hampshire, report, The New Hampshire Housing Forum, 2000. 28) Resource Systems Group (RSG) Traffic and Parking Report for Dartmouth College, Dartmouth College (not yet released), Statement of Impact, Dartmouth Hitchcock Medical Center New Facilities Project, DHMC, Resource Systems Group, Pathways Consulting, and Natural Resource Consulting Service. 29) 1995 Fair Share Housing Analysis, Upper Valley Lake Sunapee Regional Planning Commission. 30) Includes principle, interest, taxes and insurance.
Hanover Affordable Housing Feasibility Study Hadfield Associates, July 2001
31) Though the 2000 Census data does not corroborate this

32) Directory of Assisted Housing 2000, New Hampshire Housing Finance Authority, and Jonathan Chaffee, Lebanon Housing Authority, personal communication. 33) 1990 U.S. Census (2000 data not yet available) 34) In citing the results of the Dartmouth College Housing survey we caution that the proportion of Administrative Personnel responding to the survey was far greater than that of the faculty and especially that of the staff. Consequently some of the statistics are based on very small samples. 35) University of Massachusetts, Amherst, Briefing on Student Housing, Judith Steinkamp, April 4, 2001, and Campus Housing Master Plan, 2001. 36) The Amherst Housing Authority has documented that UMASS students occupy a significant number of Section 8 affordable housing units in the town. Similarly, Northampton has issued a statement that over 2000 students attending UMass rent housing units in their city, competing for affordable housing and driving up other rental prices. (Note: new projects constructed using HOME and/or federal Low Income Housing Tax Credits are not available to full-time students; however, existing units are available.)
37) In New Hampshire some of those employed in agriculture, students in work study programs, as well as the self-employed, those employed by religious organizations, fully commissioned real estate brokers and insurance sellers, and elected and appointed officials are not generally covered.
38) Town of Hanover Assessor’s Office 39) Hadfield Associates, Real Estate Survey, February 2001
Hanover Affordable Housing Feasibility Study Hadfield
Associates, July 2001
83

Hanover Affordable Housing Feasibility Study Hadfield
Associates, July 2001
84

Hanover Affordable Housing Feasibility Study Hadfield
Associates, July 2001
85