town of medway housing production plan · richard d'innocenzo, clerk thomas a. gay, clerk...
TRANSCRIPT

Town of Medway
Housing Production Plan
2016
11/23/2015 6 Cutler St - Google Maps
https://www.google.com/maps/@42.14452,-71.42301,3a,52y,5.83h,98.53t/data=!3m6!1e1!3m4!1soNcwbGjS94tl_PCXyIEPyg!2e0!7i13312!8i6656 1/1
Image capture: Sep 2013 © 2015 Google
Medway, Massachusetts
Street View - Sep 2013
6 Cutler St
Adopted by:
Affordable Housing Committee 11/5/2015
Affordable Housing Trust 11/5/2015
Board of Selectmen 1/4 /2016
Planning and Economic Development Board 12/8/2015
/2015

Medway Housing Production Plan 2016 ii
MEDWAY
HOUSING PRODUCTION PLAN
2016 UPDATE
Board of Selectmen Planning and Economic Development Board
John Foresto, Chairman Andy Rodenhiser, Chairman Mary Jane White, Vice-Chairman Robert K. Tucker, Vice-Chairman Richard D'Innocenzo, Clerk Thomas A. Gay, Clerk Glenn Trindade Matthew Hayes, P.E. Dennis Crowley Richard Di lulio Approved 1/4/2016 Approved 12/8/2015
Affordable Housing Committee Affordable Housing Trust Bob Ferrari, Chair Ann Sherry, Chair Michael Leone Judi LaPan Judi LaPan John Maguire Teresa O’Brien Karen Soter John Parlee Glenn Trindade Sue Rorke Alison Slack Karen Soter Approved 11/5/2015 Approved 11/5/2015 Michael E. Boynton, Town Administrator Stephanie Mercandetti, Community and Economic Development Director J. Douglas Havens, Community Housing Coordinator Susy Affleck Childs, Planning and Economic Development Coordinator Consultant: PGC Associates, Inc. 1 Toni Lane Franklin, MA 02038-2648 508-533-8106 [email protected]

Medway Housing Production Plan 2016 iii
Table of Contents
Introduction 1
I. Comprehensive Housing Needs Assessment 2
A. Demographic Profile 2
Population 2
Income 3
B. Growth Projections 7
Age Cohorts 7
Regional Growth 7
C. Housing Stock 11
Types of Housing 11
Age of Housing 11
Household Size 14
Housing Occupancy 15
Current Development Trends 15
Affordable Housing Stock – Chapter 40B 18
Home Values and Rent Levels 19
Supply-Demand Housing Gap 21
D. Developmental Constraints 26
Chapter 21E Sites 26
Natural Wildlife Habitats 27
Zone II Areas 28
E. Capacity of Infrastructure 30
Water and Sewer 30
Roads 31
Public Transit 31
Schools 31
II. Affordable Housing Goals 33
A. Background – Setting Sights for Success 33
1999 Master Plan Goals 33
1999 Master Plan Housing Objectives 33
Milestones: Meeting the Housing Goals of the 1999 Master Plan 34
B. 2016 Housing Production Plan: Goals and Objectives –
Carrying the Effort Forward 36
III. Implementation Strategies 44
A. Locations 44
B. Basic Strategies 47
C. Numerical Targets and Schedule 51
D. Certification 52
Appendix 54
Endnotes 56
Medway Housing Production Plan 2016 iv
List of Tables
1. Population Characteristics, 2000-2013 3
2. Income Characteristics, 2013 4
3. Median Family Income, in Medway, Abutting Towns, Boston MSA 5
and Massachusetts, 1999-2013
4. Population Projections to 2020 and 2030, by Age Cohort 7
5. Population Growth in SWAP Sub-Region, 2000-2013 9
6. Types of Housing Units in Medway and in Massachusetts, 2013 12
7. Age of Housing Units in Medway and in Massachusetts, 2013 13
8. Number of Rooms in Medway and in Massachusetts, 2013 14
9. Average Household Size in Medway and in Massachusetts, 2000, 2013 14
10. Building Permits in Medway and Abutting Towns, 2005-2013 16
11. Median Housing Unit Values and Rents, Medway and Surrounding
Towns, 2013 19
12. Medway Home Values and Percentage of Income Needed for
Housing for Owner-Occupied Units, 2013 20
13. Medway Rents and Percentage of Income Needed for Rents, 2000 20
14. Medway Median Home Value, 2009-2015 22
15. Medway Median Rent 2011-2015 22
16. Medway Housing Supply-Demand Gap by Household Income 24
17. Chapter 21E Sites 27
18. Numerical Targets and Schedule 50
List of Figures
1. Median Family Income in Medway, Abutting Towns, Boston MSA 6
and Massachusetts, 1999-2013
2. Population Projections to 2020 and 2013 by Age Cohort 8
3. Population Growth in SWAP Sub-Region, 2000-2013 10
4. Medway Single Family Building Permits, 2005-2013 17
5. Medway Median Home Value, 2009- 2015 23
6. Medway Housing Supply-Demand Gap by Household Income 25
7. Developmental Constraints Map 29
8. Housing Development Targets 45
9. Multifamily Development Overlay District 47

Medway Housing Production Plan 2016 1
Introduction
This Housing Production Plan is an update to the 2010 Housing Production Plan. It
is written in compliance with the guidelines and requirements for Housing Production Plans
adopted by the Massachusetts Department of Housing and Community Development
according to 760 CMR 56.03. Approval of this plan is valid for a period of five years.
The first section of the plan is a Comprehensive Housing Needs Assessment,
which provides an analysis of current and future projected housing-related statistics. First,
local and regional population and income statistics related to housing are presented. Next,
growth projections on both a local and regional level are discussed. Then, the housing stock
currently available in Medway is summarized by type, age, size and affordability. Finally,
developmental constraints and the capability of the existing infrastructure to support
additional growth are analyzed.
The second section presents Affordable Housing Goals. It begins with a review of
the goals of the 1999 Master Plan, and a chronology of the town’s actions since adopting the
plan. Next, it discusses current goals and objectives:
Goal 1:Identify Housing Needs
Goal 2: Strengthen Organizational Infrastructure to Implement Housing Plans.
Goal 3: Identify Viable Locations and Optimize Opportunities for Their
Development.
Goal 4: Identify Zoning Practices that Encourage Housing Development that Best
Serves Our Community’s Needs.
Goal 5: Explore and Utilize Creative Development Opportunities
The final section, Implementation Strategies discusses a variety of options
available for accomplishing the goals and objectives of the Affordable Housing Goals
section. Such strategies include encouraging the use of the ARCPUD and open space
subdivision bylaws, monitoring the accessory apartment and inclusionary zoning bylaws,
and developing additional public housing as well as criteria for local initiative program
projects. It also identifies locations for additional housing and provides numerical targets
and a schedule for producing affordable housing.

Medway Housing Production Plan 2016 2
Section I: Comprehensive Housing Needs Assessment
A. Demographic Profile
Population
Medway’s population characteristics as estimated by the U.S. Census Bureau’s
American Community Survey for 2013 and trends since 2000 are presented in Table 1. The
total population was 12,866. The age distribution indicates a family-oriented community
with the most populous cohorts falling between ages 0-14 and 25-54. The least populous
cohorts in 2000 were those between ages 15 to 24 and over 55. By 2013, those cohorts were
still among the lowest, though the numbers for the over 55 group increased significantly as
the population aged. The 15-24 cohort also increased in numbers as the 5-14 cohort aged
into it.
The decline in 5-14 year olds coupled with the drop in nearly half of 35-44 cohort and the
decline in the 25-34 cohort indicates a reduced need for single-family homes. The
significant increases in the over 55 population and the increase in the 20-24 cohort indicate
the need for apartments of condominiums to meet the needs of those groups.
Income
Income characteristics in Medway in 2013 are presented in Table 2. Whether
measured by household or by family, a large majority of households (63.9%) and families
(71.5%) earned between $50,000 and $200,000 annually. The medium household income
was $106,132 while the medium family income was $125,865. Only 2.8 percent of families
in Medway earned under $35,000 per year. Table 2 also shows the maximum income limits
for affordable housing as determined by the U.S. Department of Housing and Urban
Development (HUD). Their figures are based on levels of 30%, 50% and 80%1 of median
family income for the entire metropolitan area.
Table 3 presents Medway’s 1999, 2011 and estimated 2013 median family incomes
compared to abutting communities, the region, and the state as a whole. Medway compares
favorably in this measure as only Norfolk and Holliston have a higher median family
income. Medway’s median family income is compared to that of the region and the state
graphically in Figure 1. Medway’s also had the third highest rate of growth in income (again
after Norfolk and Holliston) from 1999 to 2011 and well above the Boston MSA and State
average. It fell to 4th in increase from 2011-2013,
Table 3 also presents the HUD income limits for 2- and 3-person families.
Medway’s average household size in 2013 was 3.07 for owner-occupied units and 1.66 for
rented units.
1 The 80% level is limited to be no greater than the median family income for the U.S. as a
whole with some adjustments (up to 5%) for high housing cost areas, which results in a
70.8% level for the Boston-Cambridge-Quincy MSA.

Medway Housing Production Plan 2016 3
Table 1:
Population Characteristics, 2000-2013
2000 2010 2013
Subject Number Percent Number Percent Number Percent
Total Population 12,448 100 12,752 100 12,866 100
SEX AND AGE
Male 6,032 48.5 6,205 48.7 6,159 47.9
Female 6,416 51.5 6,547 51.3 6,707 52.1
Under 5 years 1,067 8.6 693 5.4 1,071 8.3
5 to 9 years 1,236 9.9 981 7.7 836 6.5
10 to 14 years 1,119 9.0 1,150 9.0 895 7.0
15 to 19 years 718 5.8 1,021 8.0 890 6.9
20 to 24 years 357 2.9 556 4.4 634 4.9
25 to 34 years 1,445 11.6 982 7.7 1,239 9.6
35 to 44 years 2,707 21.7 1,899 14.9 1,443 11.2
45 to 54 years 1,820 14.6 2,579 20.2 2,642 20.5
55 to 59 years 501 4.0 888 7.0 886 6.9
60 to 64 years 341 2.7 678 5.3 871 6.8
65 to 74 years 636 5.1 650 5.1 702 5.5
75 to 84 years 358 2.9 487 3.8 438 3.4
85 years and over 143 1.1 188 1.5 319 2.5
Median age (years) 36 NA 41.2 NA 42.1 NA
25 to 59 6,473 52.0 6,348 49.8 6,210 48.3
60 to 84 1,335 10.7 1,815 14.2 2011 15.6
65 years and over 1,137 9.1 1,325 10.4 1,459 11.3
85 years and over 143 1.1 188 1.5 319 2.5
Source: U.S. Census 2000, 2010; American Community Survey, 5-year Estimates 2009-2013

Medway Housing Production Plan 2016 4
Table 2:
Income Characteristics, 2013
Income In 2013 Number* Percent
Households 4439 100
Less than $10,000 93 2.1
$10,000 to $14,999 160 3.6
$15,000 to $24,999 231 5.2
$25,000 to $34,999 160 3.6
$35,000 to $49,999 297 6.7
$50,000 to $74,999 550 12.4
$75,000 to $99,999 577 13.0
$100,000 to $149,999 1088 24.5
$150,000 to $199,999 621 14.0
$200,000 or more 661 14.9
Median household
income (dollars) $106,132
Income In 2013 Number* Percent
HUD Income
Limits
2-person
Family#
HUD Income
Limits
3-person
Family#
Families 3,431 100
Less than $10,000 14 0.4
$10,000 to $14,999 51 1.5
$15,000 to $24,999 0 0.0 30% -- $23,650 30% - $26,600
$25,000 to $34,999 31 0.9
$35,000 to $49,999 220 6.4 50% -- $39,400 50% -- $44,350
$50,000 to $74,999 319 9.3 70.8% -- $55,800 70.8% -- $62,750
$75,000 to $99,999 518 15.1
$100,000 to
$149,999 995 29.0
$150,000 to
$199,999 621 18.1
$200,000 or more 662 19.3
Median family
income (dollars) $125,865
Source: American Community Survey, 5-year Estimates 2009-2013
* Calculated by authors from estimated percentages. The ACS estimates for
each category have margins of error varying from .6 to 4.1
# 2015 HUD limits for 2 and 3 person households (median family sizes for
rented and owned housing units in Medway) for Extra Low (30%), Very Low
(50%) and Low (70.8%) Income Families as a percentage of the Median
Family Income for Boston-Cambridge-Quincy MSA

Medway Housing Production Plan 2016 5
Table 3:
Median Family Income in Medway and Abutting Towns, Boston MSA,
and Massachusetts, 1999-2013
1999 2011
%Change
1999-2011 2013
%Change
2011-2013
Milford $61,029 $80,127 31.3% $77,865 -2.8%
Bellingham $72,074 $93,655 29.9% $99,157 5.9%
Millis $72,171 $99,906 38.4% $103,173 3.3%
Franklin $81,826 $109,602 33.9% $119,957 9.4%
Holliston $84,878 $125,236 47.5% $130,647 4.3%
Medway $85,627 $119,864 40.0% $125,865 5.0%
Norfolk $92,001 $132,250 43.7% $149,302 12.9%
Boston MSA* $68,341 $90,330 32.2% NA NA
Massachusetts $61,664 $83,371 35.2% $84,900 1.8%
Source: U.S. Census 2000, American Community Survey 2011, 2013 *Boston-Cambridge-Quincy MA-NH Metro Area

Medway Housing Production Plan 2016 6
Figure 1:
Median Family Income in Medway, Abutting Towns, Boston MSA and Massachusetts, 1999-2013
Source: U.S. Census 2000, American Community Survey 2011, 2013 *Boston-Cambridge-Quincy MA-NH Metro Area

Medway Housing Production Plan 2016 - 7 -
B. Growth Projections
Age Cohorts
Table 4 presents projected population by age cohort according to a 2014
Metropolitan Area Planning Council (MAPC) study. That study used 2 scenarios and
both projected little growth in Medway to 2030. The projections were close enough that
only one is presented here for simplicity. The projections for the years 2020 and 2030
indicate a continuing trend toward an older population as current residents grow older
and move into new cohorts. The increase in residents in ages 65 and greater is significant,
and the fact that the 50-65 age cohorts show the highest numbers (equaling more than
27% of the total projected population) indicates that the trend will continue beyond 2030.
The projection also indicates a decline in school-aged children. The 5-19 cohorts
decline by 840, or 26.6% Figure 2 provides a visual depiction of these trends, which
provide further evidence of the need for housing types other than single-family homes,
and that Medway is especially underserved by apartments and smaller homes/condos for
both young people in their late 20’s/early 30’s as well as for older residents wishing to
downsize.
Table 4:
Population Projections to 2020 and 2030, by Age Cohort
Age
Group 2010 2020 2030
0-4 693 537 534
5-9 981 780 768
10-14 1,150 756 755
15-19 1,021 771 789
20-24 556 530 556
25-29 446 579 613
30-34 536 725 761
35-39 723 704 713
40-44 1,176 824 831
45-49 1,392 722 726
50-54 1,187 1,107 1,120
55-59 888 1,239 1,250
60-64 678 1,044 1,053
65-69 385 738 744
70-74 265 580 584
75-79 242 305 307
80-84 245 209 211
85+ 188 258 262
TOTAL 12,752 12,409 12,578
Sources: Metropolitan Area Planning Council projection,
January 14, 2014; U.S. Census 2010

Medway Housing Production Plan 2016
8
Figure 2: Medway Population Projections to 2020 and 2030, by Age Cohort
Sources: Metropolitan Area Planning Council projection, January 14, 2014
U.S. Census 2010
0
200
400
600
800
1000
1200
1400
2010 2020 2030

Medway Housing Production Plan 2016
9
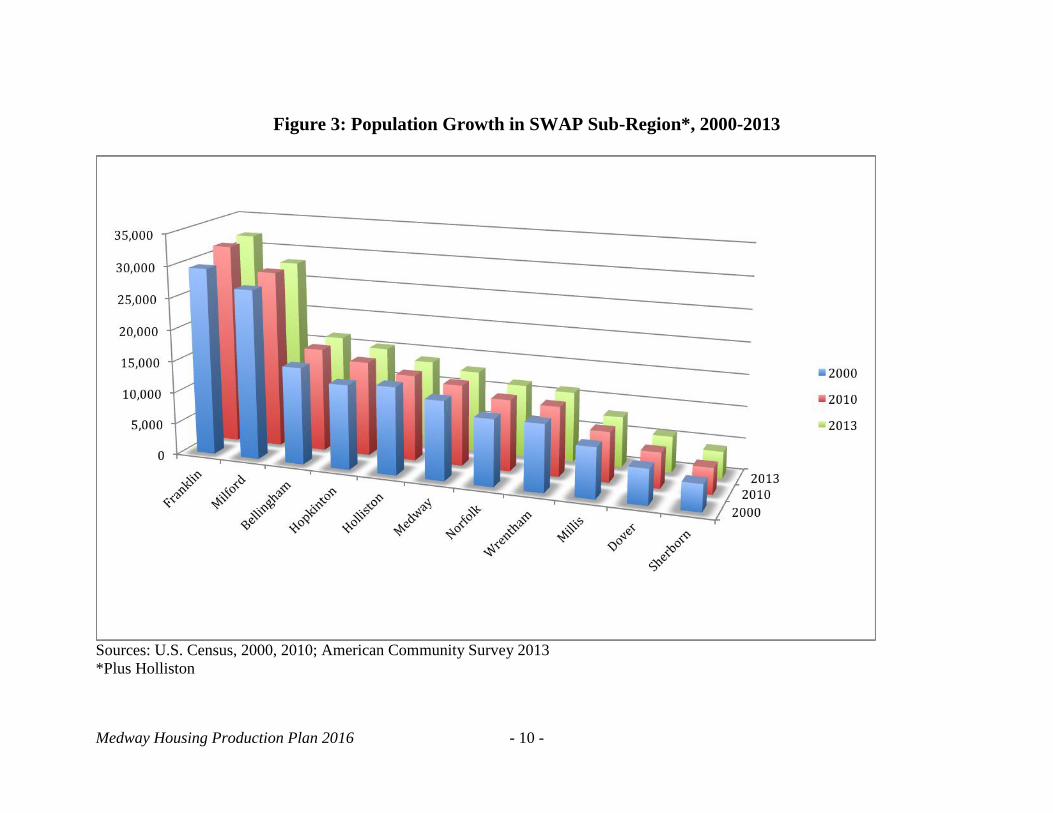
Regional Growth
Table 5 presents population growth in the Southwest Area Planning (SWAP) sub-
region (plus Holliston) from 2000 to 2013. Between 2000 and 2013, Medway’s
population grew from 12,448 to 12,866, an increase of 3.4%. This was the fourth-lowest
percentage increase in the 10-town sub-region of the MAPC area, putting Medway in the
lower half of the group with a rate that is half of the rate for region as a whole, and less
than Massachusetts. Hopkinton, Norfolk and Franklin led the region in growth.
Table 5:
Population Growth in SWAP Sub-Region2, 2000-2013
Town 2000 2010 2013
Percent
Change
(2000-
2013)
Absolute
Change
(2000 -
2013)
Franklin 29,560 31,635 32,064 8.5% 2,504
Milford 26,799 27,999 28,109 4.9% 1,310
Bellingham 15,314 16,332 16,438 7.3% 1,124
Hopkinton 13,346 14,925 15,271 14.4% 1,925
Holliston 13,801 13,547 13,811 0.07% 10
Medway 12,448 12,752 12,866 3.4% 418
Norfolk 10,460 11,227 11,409 9.1% 949
Wrentham 10,554 10,955 11,058 4.8% 504
Millis 7,902 7,891 7,950 0.6% 48
Dover 5,558 5,589 5,677 2.1% 119
Sherborn 4,200 4,119 4,169 -0.7% -31
SWAP2 149,942 156,971 158,822 5.9% 8,880
Massachusetts 6,349,105 6,547,629 6,605,058 4.0% 255,953
Sources: U.S. Census, 2000, 2010; American Community Survey 2013
It should be noted the fast-growing towns of Hopkinton, Norfolk and Franklin
also rank among the towns with the greatest increase in median family income. Holliston
is an exception to this in that its income increased among the leaders but essentially did
not grow in population. Also, Bellingham was among the leaders in population growth
but its income growth was below the state average.
2 Plus Holliston
Medway Housing Production Plan 2016
- 10 -
Figure 3: Population Growth in SWAP Sub-Region*, 2000-2013
Sources: U.S. Census, 2000, 2010; American Community Survey 2013
*Plus Holliston

Medway Housing Production Plan 2016
- 11 -
C. Housing Stock
Types of Housing
Table 6 presents the types of housing units in Medway, some similar nearby towns and in
Massachusetts as a whole. In 2013, there were a total of 4,686 housing units in Medway. As the
table indicates, the vast majority of Medway housing units (77.3%) were detached single-family
homes. Another 3.6% were attached single-family homes and 5.0% were duplex units. Medway’s
stock includes 14.1% of housing units in buildings with three or more units. As Table 6 indicates,
this is a typical mix for a suburban community. In fact, Medway’s housing stock is more diverse
than the neighboring towns shown, and the diversity of unit types has increased since 2008 as
developers have taken advantage of zoning changes permitting greater diversity. However, in the
state as a whole, 31.4% of housing units are in buildings with three or more units.
It should also be noted that, according to the 2013 American Community Survey, 80.9% of
the housing units in Medway were owner-occupied and 13.8% were renter-occupied (5.3% were
vacant). By contrast, in the state as a whole, 56.4% of housing units were owner-occupied, 33.6%
renter occupied and 9.9% were vacant.
The large difference in housing types and occupancies between Medway and the state as a
whole indicates that Medway is underserved by rental housing.
Age of Housing
The age of Medway’s housing stock is presented in Table 7. As would be expected for a
community that has experienced rapid growth in relatively recent years, 23.7% of Medway’s
housing units were constructed since 1990 [Note: This understates the situation since the estimate
provided by the 2013 American Community Survey shows 0 units constructed since 2010. This is
clearly not accurate when one considers the building permits issued during this period as presented
in Table 10)]. During this same period, only 14.9% of the state housing stock was constructed.
Furthermore, while 52.1% of the state’s housing stock was constructed prior to 1960, only 39.8% of
Medway’s housing was constructed before that year. Again, this is to be expected as Medway’s first
large growth spurt occurred in the 1960’s, then after a decline during the 1970’s, picked up steam in
the 1980’s and 1990’s, before leveling off somewhat after 2000.
As houses age, especially in denser neighborhoods, there is often a tendency to divide them
into more than one unit if zoning allows it. Some of Medway’s housing stock may be approaching
that point.

Medway Housing Production Plan 2016
- 12 -
Table 6:
Types of Housing Units in Medway, Nearby Towns and in Massachusetts, 2013
Medway Medfield Holliston Wrentham Massachusetts
Unit Type Number Percent Number Percent Number Percent Number Percent Number Percent
Single Family
- Detached 3,623 77.3% 3,736 84.3% 4,223 83.6% 3,525 85.1% 1,468,336 52.3%
Single Family
– Attached# 168
3.6% 155 3.5% 91 1.8% 173 4.2% 143,933
5.1%
Duplex 233 5.0% 106 2.4% 140 2.8% 123 3.0% 288,984 10.3%
3 or 4 Units 158 3.4% 51 1.2% 125 2.5% 125 3.0% 309,207 11.0%
5 to 9 Units 124 2.6% 118 2.7% 173 3.4% 99 2.4% 167,093 5.9%
10 to 19 Units 247 5.3% 139 3.1% 27 0.5% 0 0.0% 118,438 4.2%
20 or More
Units 133 2.8% 125 2.8% 274 5.4% 95 2.3% 288,403 10.3%
Mobile Homes 0 0.0% 0 0.0% 0 0.0% 0 0.0% 23,768 0.8%
Boat, RV,
Van, etc. 0
0.0% 0 0.0% 0 0.0% 0 0.0% 387
0.0%
Total 4,686 100% 4,430 100% 5,053 100% 4,140 100% 2,808,549 100%
Source: U.S. Census American Community Survey 2013
#For example, row houses or townhouses that share a wall that goes from basement to roof.

Medway Housing Production Plan 2016 - 13 -
Table 7:
Age of Housing Units in Medway and in Massachusetts, 2013
Medway Massachusetts
Year Built Number Percentage Number Percentage
2010 or later 0* 9,397 0.3%
2000-2009 343 7.3% 205,499 7.3%
1990-1999 770 16.4% 205,985 7.3%
1980-1989 698 14.9% 302,336 10.8%
1970-1979 579 12.4% 327,501 11.7%
1960-1969 430 9.2% 292,797 10.4%
1950-1959 747 15.9% 325,468 11.6%
1940-1949 65 1.4% 166,942 5.9%
1939 or before 1054 22.5% 972,624 34.6%
Total 4,686 100% 2,808,549 100.0%
Source: U.S. Census American Community Survey 2013
*Estimate from American Community Survey with margin of error of 19. See Table 10 for building permits
issued during this period.

Medway Housing Production Plan 2016
- 14 -
Household Size
Table 8 presents the number of rooms in housing units in Medway and in Massachusetts.
Only 38.4% of units in Medway had 6 or fewer rooms compared to 66.9% of units in all of
Massachusetts. Conversely, 61.6% of housing units in Medway had 7 or more rooms versus only
33.1% in Massachusetts as a whole. In 2013, the median number of rooms was estimated to be 7.3
in Medway while it was 5.5 in Massachusetts.
Table 9 presents the average household size in Medway and in Massachusetts in 2013. The
average household size of owner-occupied units in Medway was 3.07 compared to 2.69 for owner-
occupied units in Massachusetts. For renter-occupied units, the average household size was 1.66 in
Medway, while for Massachusetts it was 2.22.
Table 8:
Number of Rooms in Medway and in Massachusetts, 2013
Medway Massachusetts
Rooms Number Percentage Number Percentage
1 107 2.3% 63,089 2.2%
2 100 2.1% 83,239 3.0%
3 213 4.5% 279,565 10.0%
4 286 6.1% 440,932 15.7%
5 434 9.3% 514,275 18.3%
6 660 14.1% 498,343 17.7%
7 711 15.2% 343,900 12.2%
8 880 18.8% 263,210 9.4%
9 or more 1,295 27.6% 321,996 11.5%
Median 7.3 5.5
Source: U.S. Census American Community Survey 2013
Table 9:
Average Household Size in Medway and in Massachusetts, 2000, 2013
Source: U.S. Census 2000, U.S. Census American Community Survey 2013
Average Household Size Medway Massachusetts
2000 2013 2000 2013
Owner-occupied units 3.12 3.07 2.71 2.69
Renter-occupied units 1.96 1.66 2.16 2.22

Medway Housing Production Plan 2016 - 15 -
Housing Occupancy
Nearly half, 47% of households moved into their current unit since 2000. The statewide rate
was 59.3%. The vast majority, 77.3% of the 4,439 households in Medway were families. Of these
families, 41.7% had children under 18. Non-family households totaled 22.7%, of which 21.8% were
persons living alone. The homeowner vacancy rate was 1.3%, equal to the statewide rate. The rental
vacancy rate was 13.2% compared to a statewide rate of 5.0%. (It should be noted that the small
sample size of the American Community Survey within a specific community can produce
inaccurate results. The margin of error for this statistic is 9.4% so the actual rate could be as low as
3.8%).
Current Development Trends
The number of building permits for new housing units in Medway and its six abutting towns
during the period 2005-2013 is presented in Table 10. As the table indicates, Medway issued a total
of 120 building permits for single-family houses, an annual average of 13.3 over the nine-year
period. It also issued 4 permits for multiple family units, an annual average of approximately .4.
This trend is graphically demonstrated in Figure 4. This represents a significant slowdown from the
pre-2008 period.
With 10.5% of the total 2013 population of the 7 towns, Medway accounted for 6.3% of the
building permits for single-family homes and 0.6% of the multiple family units during the 2005-
2013 period. Only Millis averaged fewer single-family home permits. Bellingham, (1.7), Milford
(0) and Norfolk (0) averaged fewer permits for multiple family housing. With 427 units, Franklin
accounted for 80% of the multiple family units in the 7 towns.

Medway Housing Production Plan 2016 - 16 -
Table 10:
Building Permits in Medway and Abutting Towns, 2005-2013
Single Family
Year
Town 2005 2006 2007 2008 2009 2010 2011 2012 2013 Total Average
Medway 30 11 11 8 6 9 6 5 34 120 13.3
Bellingham 84 43 15 9 13 12 19 22 20 237 26.3
Franklin 64 75 87 53 41 24 21 25 32 422 46.9
Holliston 50 21 19 25 20 30 21 29 60 275 30.6
Milford 105 41 72 24 37 31 22 35 67 434 48.2
Millis 25 5 14 2 2 9 3 5 7 72 8.0
Norfolk 57 40 33 10 21 39 29 40 59 328 36.4
Total 415 236 251 131 140 154 121 161 279 1,888 209.8
Multiple Famly1
Year
Town 2005 2006 2007 2008 2009 2010 2011 2012 2013 Total Average
Medway 2 0 0 0 0 0 2 0 0 4 0.4
Bellingham 0 10 0 2 0 0 0 3 0 15 1.7
Franklin 146 53 14 163 7 21 0 7 16 427 47.4
Holliston 0 0 0 0 0 30 4 0 0 34 3.8
Milford 0 0 0 0 0 0 0 0 0 0 0.0
Millis 0 2 0 4 0 10 0 0 40 56 6.2
Norfolk 0 0 0 0 0 0 0 0 0 0 0.0
Total 148 65 14 169 7 61 6 10 56 536 59.6
Source: U.S. Census, various years
1Includes number of units in duplexes, 3-4 unit structures and 5+ unit structures.

Medway Housing Production Plan 2016
17
Figure 4: Medway Single Family Building Permits, 2005 – 2013
Source: U.S. Census, various years

Medway Housing Production Plan 2016
18
Affordable Housing Stock - Chapter 40B
Medway currently has 233 units of affordable housing according to the Chapter 40B
Subsidized Housing Inventory published by the Massachusetts Department of Housing and
Community Development (DHCD) in December 2014. This housing consists primarily of units
managed by the Medway Housing Authority, including the following:
Location Housing
Mahan Circle 70 apartments or elderly, handicapped and disabled
Lovering Heights 60 apartments for elderly
Kenny Drive 34 apartments for elderly
Maple Lane 30 apartments for families
2 apartments for handicapped 284 Village Street 6 apartments for handicapped 5 County Lane 1 home for 3 handicapped individuals
Scattered Site 4 apartments for families
Subtotal 207
Chapter 40B of the Massachusetts General Laws is designed to encourage the construction
of affordable housing. Under this statute, towns whose housing stock includes less than 10% of
affordable housing have little control over housing developments that do not conform to the Town’s
Zoning Bylaw if such projects provide that at least 25% of the units are affordable as defined by the
state.
The Chapter 40B inventory maintained by DCHD classifies 233 housing units in Medway
as subsidized out of a total of 4,603, or 5.1%. Medway would need a total of 461 subsidized
housing units (an additional 228 units) to reach 10% if no more market rate units were developed.
If the previous nine-year average of 13.3 new housing units per year were to continue for
the next five years (67 total), at least 3-4 of those units per year (17 total) would need to be
affordable units in order to just avoid falling further behind the effort to reach 10%. However, the
previous nine years included several years of single digit growth, which is not likely to be repeated
over the next 5 years. As noted in Table 10, permits for 34 new single family homes were issued in
2013 and the Medway Building Department reports that 21 permits for single family homes and
permits for 6 duplex/multifamily units were issued in 2014. Therefore, many more than 3-4 per year
are likely to be needed just to stay at 5.1%.
The number of housing units issued building permits and built over the past 2 years has
averaged 31 units per year (34 in 2013 and 27 in 2014). If this were to continue over the next 5
years, then in order to reach the 10% goal in the same period, an average of 46 new affordable units
would need to be built each year (in addition to the 31 units). This would bring the total number of
units to 4988 and the total number of affordable units to 463. This would, of course, be very
difficult to achieve. Furthermore, the 2020 U.S. Census will produce a new base number of total

Medway Housing Production Plan 2016 19
housing units and the Town would then fall back under 10%. So an even higher number of
affordable units would need to be built in order to remain above 10%. Temporary “safe harbor”
status could be achieved by building 23 affordable units per year to increase the supply by .5%
(Base units = 4603, .5% x 4603 = 23). That is still a daunting number. Other options are discussed
in the Affordable Housing Goals section.
House Values and Rent Levels
Table 11 presents the median housing unit value and median rent for Medway and its
abutting towns in 2013 as reported by the U.S. Census. The table indicates that Medway had the
third lowest median housing unit value among its neighbors in 2013. It also had the lowest median
rent, according to these figures, but the reported value appears to be significantly understated,
perhaps due to a small sample size.
Table 11:
Median Housing Unit Values and Rents, Medway and Surrounding Towns, 2013
Town Median Housing Unit Value Median Rent Values
Medway $364,800 $ 760*
Bellingham $285,900 $1,249
Franklin $380,900 $1,109
Holliston $382,400 $ 897
Milford $300,300 $1,085
Millis $370.100 $1,233
Norfolk $443,400 $ 921
Source: U.S. Census American Community Survey (ACS) 2013
*This understates rent values. Of the 629 rental units estimated by ACS, nearly one third are units
operated by the Medway Housing Authority. Table 15 presents a more realistic picture of the rental
costs in Medway. A recent search on Zillow and Craigslist found 6 units with rents ranging from
$895 to $2500. The rents cited are for “housing units,” not rooms.
Table 12 presents a breakdown of the values of owner-occupied units in Medway in 2013,
as well as the percentage of income necessary for monthly mortgage payments and other selected
monthly costs. Table 13 presents the same information for renters. Housing is generally considered
affordable when it requires less than 30% of its occupants’ income. These tables indicate that
11.2% of homeowners devoted between 30% and 35% of their income to housing and another
20.2% devoted at least 35% of their income for a total of 31.4% of homeowners spending more
than 30% of their income for housing. This is an increase from 23.2% in 2000.
For renters, the difference is even more dramatic. In 2000, a total of 16.2% of renters in
Medway spent more than 30% of their income on rent. In 2013, 13.8% spent between 30% and 35%
of their income on housing and another 22.9% spent 35% or more for a total of 36.7% devoting
30% or more of their income to housing in 2013. This statistic also supports the fact that the median
rent reported in Table 11 is significantly underestimated. It also strongly supports the need for more
affordable rental units in Medway.

Medway Housing Production Plan 2016 20
Table 12:
Medway Home Values and Percentage of Income Needed for Housing for
Owner-Occupied Units, 2013
2013 Value Percentage of Income
Range Number Percent
Range Number Percent
Less than
$100,000 144# 3.8% Less than 20% 1123 37.7% $100,000-
$149,999 7 0.2% 20-24.9% 443 14.9% $150,000-
$199,999 100 2.6% 25-29.9% 467 15.7% $200,000-
$299,999 669 17.6% 30-34.9% 333 11.2% $300,000-
$499,999 2153 56.8% 35% or more 601 20.2% $500,000-
$999,999 667 17.6% Not computed 9 0.3% $1,000,000+ 52 1.4% Median monthly
cost
Median $364,800 $2,437
Source: U.S. Census American Community Survey 2013 #This is likely inaccurate due to a combination of inaccurate reporting and margin of error in ACS survey.
Assessors records show 1 housing unit with a value below $100,000.
Table 13:
Medway Rents and Percentage of Income Needed for Rents, 2013
2013 Rent Percentage of Income
Range Number Percent
Range Number Percent
Less than
$200 27 4.2%
Less than
15% 50 7.9%
$200-$299 48 7.4% 15-19.9% 115 18.3%
$300-$499 136 21.0% 20-24.9% 78 12.4%
$500-$749 98 15.1% 25-29.9% 155 24.6%
$750-$999 67 10.4% 30-34.9% 87 13.8%
$1000-$1499 125 19.3% 35% or more 144 22.9%
$1500+ 128 19.8%
No cash rent
18 2.8%
Not
computed 18
Median $760*
Source: U.S. Census American Community Survey 2013 *This understates rent values. Of the 629 rental units estimated by ACS, nearly one third are units
operated by the Medway Housing Authority. Table 15 presents a more realistic picture of the rental costs in
Medway. A recent search on Zillow and Craigslist found 6 units with rents ranging from $895 to $2500. The
rents cited are for “housing units,” not rooms.

Medway Housing Production Plan 2016 21
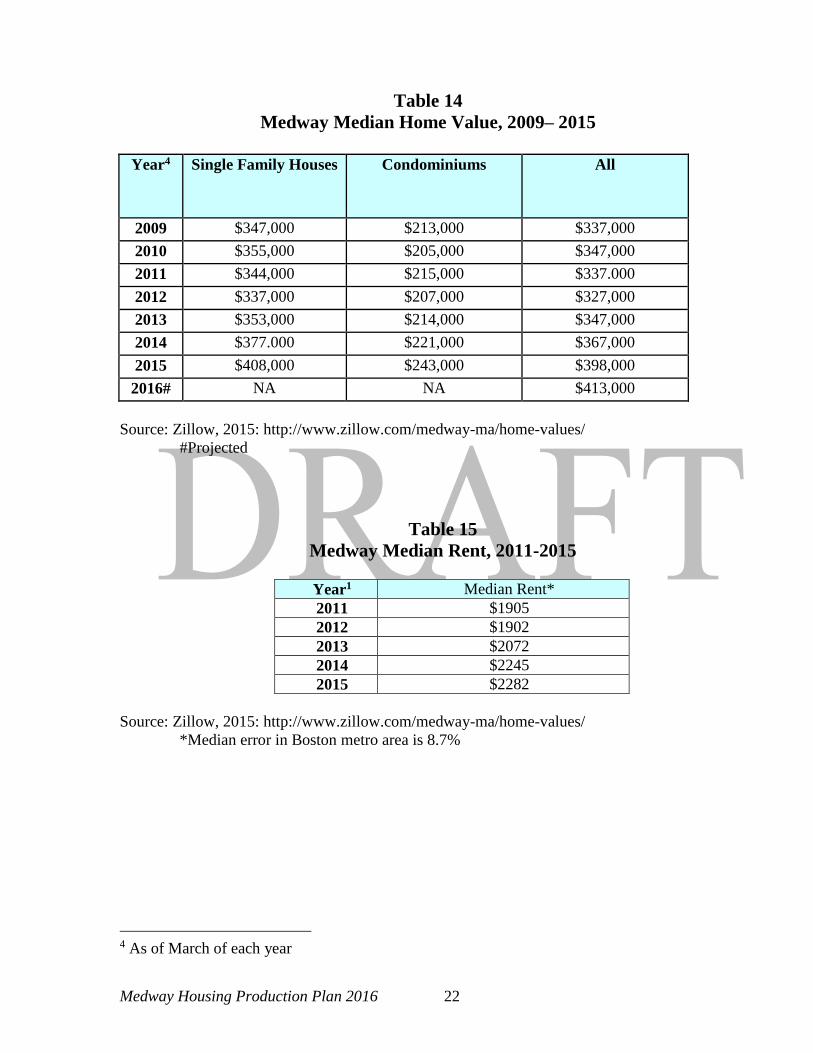
The Supply-Demand Housing Gap As Table 14 indicates, the median sales price of homes in Medway was relatively stable
in the years following 2008. However, according to Zillow, it has increased considerably in the
past 2 years (from $353,000 in 2013 to $408,000 in 2015) and is projected to increase an
additional 3.8% by March 2016. Similarly, rents have increased nearly 20% over the past 5
years, from $1905 to $2282 (see Table 15).
Table 3 indicates the increase in median family income between 2011 and 2013 (latest
year available) only increased by about 5% between 2011 and 2013. Using a different source
with more recent data (but not strictly comparable), the U.S. Department of Housing and Urban
Development estimates median family income by metropolitan statistical area to determine
eligibility for affordable housing programs. Their estimates indicate an increase of 4.3% between
2013 and 2015. Thus, while housing prices increased 15.6% between 2013 and 2015 for
ownership units and 10.1% for rental units, incomes increased by only 5% during that period.
Nevertheless, using U.S. Census data from the same source, a Medway family with the
estimated 2013 median family income of $125,865 could afford the 2013 median home value of
a single-family home of $364,800. Assuming 5% down ($18,240) and a mortgage of $322,050 at
4.5% interest over 30 years results in a monthly payment of $1756. This equals an annual cost of
$21,072, well within 30% of the median family income of $125,865 ($37,759), leaving plenty of
margin to cover closing costs, private mortgage insurance, taxes, etc.). However, the median
family income and median values mask the impacts of housing costs on households at the low
end and middle of the income scale.
Low-income households are defined as those whose income is 50% or less of the region’s
median income. For the Boston metropolitan statistical area, that means households with
incomes of $49,250 or less (50% of the 2015 median income of $98,500). Moderate-income
households are those with incomes between $49,250 and $78,800 (80% of median). Middle-
income households have incomes between $78,800 and $147,750 (150% of the median). Thus,
Medway’s median income falls in the middle-income category. However, as the following tables
demonstrate, there are housing needs in all three groups but especially the low and moderate-
income categories.
Table 16 presents, and Figure 6 illustrates, a more detailed analysis of housing
affordability by income categories. It presents the number of housing units available to
households at various income levels, using data from the 2013 U.S. Census American
Community Survey. The table indicates there were 644 households (14.5% of total households)
with incomes up to $34,999 in Medway that could afford a house costing as much as $172,500 in
2013. There were only 196 houses reported to be valued at that level or below3. The gap is
partially made up by the 343 rental units affordable to these income levels. However, that still
means that only 539 housing units (12.1% of total occupied housing units) were affordable to
this group.
3 However, the distribution of those units at the lower end of the scale is not accurate, as there are no housing units valued
below $100,000. Assessors data indicates 91 condos and 12 single family homes assessed below $172,500, and another 51
condos just above $172,500 (up to $185,000). All but 17 are assessed above $125,000.Therefore, the 4 categories below
$35,000 have been collapsed into 2: Less than $25,000 and $25,000 to $34,900.
Medway Housing Production Plan 2016 22
Table 14
Medway Median Home Value, 2009– 2015
Year4 Single Family Houses Condominiums All
2009 $347,000 $213,000 $337,000
2010 $355,000 $205,000 $347,000
2011 $344,000 $215,000 $337.000
2012 $337,000 $207,000 $327,000
2013 $353,000 $214,000 $347,000
2014 $377.000 $221,000 $367,000
2015 $408,000 $243,000 $398,000
2016# NA NA $413,000
Source: Zillow, 2015: http://www.zillow.com/medway-ma/home-values/
#Projected
Table 15
Medway Median Rent, 2011-2015
Year1 Median Rent*
2011 $1905
2012 $1902
2013 $2072
2014 $2245
2015 $2282
Source: Zillow, 2015: http://www.zillow.com/medway-ma/home-values/
*Median error in Boston metro area is 8.7%
4 As of March of each year

Medway Housing Production Plan 2016
23
Figure 5: Medway Median Home Value, 2009- 2015
22
Source: Zillow, 2015: http://www.zillow.com/medway-ma/home-values/

Medway Housing Production Plan 2016 24
Table 16
Medway Housing Supply-Demand Gap by Household Income
HOUSEHOLD
INCOME
LEVEL
PERCENT OF
HOUSEHOLDS
NUMBER OF
HOUSEHOLDS
AFFORDABLE
PURCHASE
PRICE1
NUMBER OF
HOMES AT
AFFORDABLE
PRICE2
AFFORDABLE
RENTAL
LEVEL3
NUMBER OF
AFFORDABLE
RENTAL
UNITS2
TOTAL
UNITS
Less than
$25,000 10.9 484 Up to $123,500 147 0-$625 260 407
$25,000 to
$34,999 3.6 160
$124,500-
$172,500 49 $625-$875 83 132
$35,000 to
$49,999 6.7 297
$173,000-
$246,500 366 $875-$1250 96 462
$50,000 to
$74,999 12.4 550
$247,000-
$370,000 1112 $1250-$1875 88 1200
$75,000 to
$99,999 13.0 577
$370,500-
$483,500 1222 $1875-$2500 102 1324
$100,000 to
$149,999 24.5 1088
$484,000-
$740,000 497 $2500-$3750 -- 497
$150,000 to
$199,999 14.0 621
$740.000-
$986,500 329 $3750-$5000 -- 329
$200,000 or
more 14.9 661 $986,500+ 70 $5000+ -- 70
TOTALS 100% 4439 -- 3792 6474 44394
Source: U.S. Bureau of the Census and derived by author 1Based on 30% of income, 5% down payment and a 30-year loan at 4.5% interest 2Figures have been interpolated based on 2013 U.S. Census American Community Survey figures. See notes for Tables 12 and 13 for explanation
of why the numbers of low value homes and rents are overstated. 3Based on 30% of income 4Including 18 units for which no rent was paid. U.S. Census reported a total of 4686 occupied housing units in 2013, so these figures slightly
understate actual numbers.

Medway Housing Production Plan 2016 25
Figure 6: Medway Housing Supply-Demand Gap by Household Income
MEDWAY MEDIAN HOUSEHOLD INCOME LIMITS FOR MEDIAN SIZE ROUNDED TO 3

Medway Housing Production Plan 2016
26
Table 16 presents and Figure 6 illustrates that there is surplus of housing serving
the next three income categories. While there are 297 households in the income range of
$35,000 to $49,999, there are 366 homes and 96 rental units (462 total housing units)
affordable to this group. Similarly, there are 550 households with incomes from $50,000
to $74,999, while 1112 houses and 88 apartments are affordable to this group, and there
were 577 households with incomes between $75,000 and $99,999 who had 1222 houses
and 102 apartments affordable to them.
This phenomenon in these income categories can be partially explained by the
fact that 31.4% of homeowners (634 households) and 36.7% of renters (231 households)
are spending more than 30% of their income on housing. Thus, they are living in these
middle-income units, but spending more than what is considered an “affordable”
percentage of their income on housing. This may partially explain the difficulty Medway
has encountered in finding buyers for the affordable units that have become available in
recent years.
Another portion of the phenomenon can be explained by the fact that there are
2370 households with incomes ($100,000 and above) sufficient to afford houses costing
$484,000 and up. However, there are only 896 such units. Therefore, the rest of the
households live in lower cost houses and can spend lower percentages of their income on
housing. As illustrated in Tables 12 and 13, 1288 households (1,123 homeowners and
165 renters) spend less than 20% of their income on housing.
Furthermore, it should be noted that housing is a regional issue. This fact has two
potentially conflicting impacts. On the one hand, Medway could serve a regional need for
affordable housing. As noted above, while a large percentage of Medway homeowners
and renters are spending more than 30% of their income on housing, it has been difficult
to find buyers for the affordable units that have come on the market. This provides an
opportunity for those outside Medway to purchase those units.
On the other hand, since affordable prices are based on median income for the
entire metropolitan Boston area as a whole, the prices for affordable homes and
apartments in Medway are virtually identical to those that are in Boston or closer to
Boston in locations that may be considered more desirable than Medway. Since the band
of individuals and families whose income is below the maximum allowed, yet above
what is needed to qualify for a mortgage, this limited pool of buyers may be more
attracted to those locations nearer to Boston.
D. Developmental Constraints
Chapter 21E Sites
Under the Massachusetts General Laws Chapter 21E, sites which are
contaminated by oil or other hazardous material and are subject to special restrictions for
redevelopment. Such sites are classified by tiers based on their level of contamination and
their owner’s compliance with regulations. The Massachusetts Department of
Environmental Protection (Mass DEP) has a searchable database
http://public.dep.state.ma.us/SearchableSites2/Search.aspx) that lists 40 reportable spills

Medway Housing Production Plan 2016 27
of oil and/or hazardous materials in Medway from 1987 through March 2015. Most of
those sites, including some former gas station sites, are classified in a status that poses no
significant risk.
Table 17 and Figure 5 present five Tier II and Tier 1D Chapter 21E sites in
Medway. Three gas stations on Main Street are classified as Tier II, meaning that permits
from the Massachusetts Department of Environmental Protection (Mass DEP) are not
required and response action may be performed under the supervision of a Licensed Site
Professional, without prior Departmental approval. All three stations are in cleanup
phase. All three are also located within the C-I district, which allows multi-family
housing as part of a mixed-use development by special permit.
The Medway Oil and Propane Facility and 8 Populatic Street are located in the C-
III and AR-II zoning districts respectively and are designated as Tier 1D sites. Tier 1D
includes any site where the responsible party fails to provide a required submittal to Mass
DEP by a specified deadline. A site is categorically classified as Tier 1D on the date of
its applicable transition deadline and is assessed annual compliance fees should the
responsible party fail to submit certain paperwork to the department by the applicable
deadline1. The Populatic Street site is unlikely to be targeted for housing-related
redevelopment in the foreseeable future.
The Medway Oil and Propane facility is the site of another release reported in
March 2015. That incident is unclassified pending a report due within one year of the
report. The site is within the newly adopted Multifamily Housing Overlay District.
Table 17:
Chapter 21E Sites
Site Name Address Zoning Tier
Medway Mobil Station 107 Main Street C-I II
Aoude Gas Station 73 Main Street C-I II
Texaco Station 71 Main Street C-I II
Medway Oil Facility 37 Broad Street C-III 1D
NA 8 Populatic Street AR-II 1D
Source: MassGIS
It should be noted that Table 17 presents those sites on a list of sites with reported spills
that has been prepared by Mass DEP. It is not meant to suggest that these sites are
undevelopable for housing, nor it is intended here to imply that these are the only sites
that may be hindered for development due to past spills. That judgment must necessarily
be made on a site-by-site basis.
Natural Wildlife Habitats
Figure 5 includes the Natural Heritage and Endangered Species Program’s
(NHESP) BioMap Core Habitat and Supporting Natural Landscape. The Core Habitat is
an area designated by NHESP scientists as a most viable habitat for rare and endangered
species. The Supporting Natural Landscape Habitat is a buffer around Core Habitats and
Medway Housing Production Plan 2016 28
provides connections between Core Habitats. According to NHESP, the designation of
SNL zones was based on four characteristics:
Natural vegetation patch characteristics;
Size of relatively road-less areas;
Subwatershed integrity;
Contribution to buffering BioMap Core Habitat polygons for plants and
exemplary communities.
Medway’s Core Habitat and SNL habitats are located in the northwest corner of
town between Routes 109 and 126. The BioCore Habitat extends into Holliston and is
adjacent to a SNL habitat connecting it to BioCore Habitats in Holliston and Milford.
There are no existing plans to target new affordable housing developments in or near
these habitats.
Zone II Areas
Zone II areas are protected areas of an aquifer that contribute to severe pumping
and recharge conditions. Medway has four Zone II areas, including three that overlap.
One area is in the southwest corner of town extending from the Bellingham town line to
Route 109. The other three are overlapping in the southeast corner of town covering the
Great Black Swamp and most of the area south of Main Street from Holliston Street to
the Norfolk town line.

Medway Housing Production Plan 2016
- 29 -

Medway Housing Production Plan 2016
- 30 -
Housing developments in Zone II areas are generally restricted to a maximum of 15%
coverage of impervious surfaces per lot, unless a special permit for greater coverage is
granted. This restriction can significantly inhibit the density of a housing development,
especially a multi-unit development. However, mitigating measures can be included in
such developments, which would help in obtaining the necessary special permit.
E. Capacity of Infrastructure1
This section analyses the existing infrastructure in Medway and its ability to
support the current housing supply. It also discusses the ability of the infrastructure to
accommodate future growth and current initiatives involving expansion or improvements
to Medway’s infrastructure. In preparation for writing the 2009 Master Plan, the
committee conducted a survey of Medway residents to gather their opinion on the most
important concerns regarding the town’s infrastructure. The results of that survey indicate
that the most important issues were the quality of drinking water, the maintenance of
public buildings and the quality of the schools.
Water and Sewer
Medway has four public wells that pump an average of 333 million gallons per
year to support the town water supply. They are located on Populatic Street, Oakland
Street, Village Street and off Industrial Park Road. There are also two water tanks with a
combined capacity of 2.8 million gallons and about 75 miles of water mains. A recent
leak detection program resulted in repair of some water lines significantly reducing water
lost through leaks. An annual water restriction program also conserves water needed to
support Medway’s population and commercial establishments. These measures are
necessary to support the existing and future housing supply. However, additional
measures are likely necessary to support any substantial future growth since the
Massachusetts Department of Environmental Protection strictly limits the amount of
water that can be withdrawn from Medway’s aquifers within the Charles River Basin.
Medway is within the Charles River Water Pollution Control District and falls
under its oversight for management, treatment and disposal of wastewater. There is a
treatment facility on Village Street that discharges its treated effluent into the Charles
River.
Wastewater in Medway is disposed primarily through its sewer system, though
some parts of town are not served and therefore use private septic systems. In 1973, the
Charles River Water Pollution Control District (CRPCD) was established to manage and
oversee regional treatment and disposal of wastewater. The treatment facility is jointly
owned by Medway (16.75%) and Franklin (63.9%). Some of its capacity has been
purchased by Millis (11%), Bellingham (6.6%), Norfolk, Dover and Sherborn.
Medway’s sewer system includes 44 miles of gravity sewer mains serving nearly
2500 locations. It also now includes a sewer pump station and associated force mains
serving the Medway-495 Business Park. The Town’s daily share of the regional sewer
treatment plant’s capacity is about 895,000 gallons. Due in part to several new

Medway Housing Production Plan 2016 - 31 -
developments as well as inflow and infiltration to the system, that capacity is nearly
exhausted. Therefore, the Town adopted a temporary moratorium on extending sewer
mains until the capacity issue is resolved. Residences and businesses located along
existing sewer lines may connect to the system, but those lines are not allowed to be
extended to new areas.
The first 2 phases of $28 million dollar upgrade of the sewer treatment plant have
been completed and the third and final phase is under construction (and expected to be
completed in September 2016). However, while the upgrades improve treatment, they do
not increase the capacity of the plant.
The Town has initiated an Illicit Discharge and Detection Program to reduce
inflow and is continuing to examine areas for potential infiltration problems. Reducing
inflow and infiltration will free up capacity for additional sewer connections.
Medway has completed master plans of its infrastructure in recent years that have
led to numerous other infrastructure improvements. The Capital Improvement Plan
includes additional future improvements as well.
Roads
Medway has approximately 100 miles of roadway, encompassing 280 lane miles,
for which the Department of Public Services is responsible. Interstate 495 as well as state
Routes 126 and 109.also serve the Town. Route 126 (Summer Street) has been
reconstructed in recent years to increase capacity and safety. Route 109 has been
redesigned and its reconstruction has been approved for funding. Construction is
expected to begin in 2016.
The network of sidewalks in Medway is inadequate, as sidewalks are mostly not
interconnecting. Commercial areas in town are not easily accessible by pedestrians from
residential areas. Efforts are underway to improve the sidewalk network, by making
connections where feasible.
Public Transit
Medway has access to the MBTA commuter rail line through three stations in the
abutting towns of Norfolk and Franklin. The commuter rail line provides access to
Boston as well as neighboring suburbs. In September 2007, the Greater Attleboro and
Taunton Transit Authority (GATRA) bus service began a route with several stops in
Medway to the Norfolk train station. The GATRA bus offers three runs in the morning
and three in the evening with stops at the Medway Middle School and the Village Street
Post Office.
Schools
Medway has four public schools serving approximately 2400 students. There are
two public elementary schools: Burke-Memorial and McGovern, which combine to serve
students from Pre-Kindergarten through grade four. The Francis J Burke Elementary
school on Cassidy Lane opened in 1953 while the Memorial Elementary School was

Medway Housing Production Plan 2016 - 32 -
added in 1997. The combined school currently offers grades 2-4. The John D McGovern
Elementary School on Lovering Street opened in 1965 and offers pre-kindergarten and
kindergarten.as well as grade 1. The Medway Middle School on Holliston Street offers
grades 5-8. Medway High School opened in 2004 and is located on Summer Street.
Three of the four schools have either been built or undergone major renovations
within the past 20 years. The McGovern and Burke side of the Burke-Memorial School
may be in need of updating.

Medway Housing Production Plan 2016 - 33 -
II. Affordable Housing Goals
A. Background – Setting Sights for Success
Medway’s 1999 Master Plan served as the basis for many of the housing
initiatives pursued steadfastly by town leaders during the first decade of the twenty-first
century. Drafted during a period of rapid growth in the Town5 and statewide shortages in
affordable housing, Medway’s 1999 Master Plan recognized the importance of managing
growth while diversifying housing to meet targeted needs. Additionally, the significantly
increased demand for services, facilities and infrastructure6 and the substantial loss of
open space, heightened the desire to maintain Medway’s character.
As reviewed in the 2009 Master Plan, Medway’s affordable housing efforts led to
the implementation of a sizable number of the “best practices” espoused by various
housing advocacy groups. Their successes provided a solid basis for the vision laid out in
the town’s 2009 Master Plan and the subsequent 2010 Housing Production Plan.
While this section revisits the gains spurred by the 1999 Master Plan, the
following section “B. 2016 Housing Production Plan: Goals and Objectives – Carrying
the Effort Forward,” enumerates additional advances realized since 2010 and carries
forward the 2009-2010 goals and implementation steps, as reflecting experience and
insight gained since.
1999 Master Plan Housing Goals
The 1999 Master Plan included four major housing-related goals, as follows:
Manage the Rate of Residential Growth
Develop an Affordable Housing Plan
Target Housing Needs
Maintain Current Character
1999 Master Plan Housing Objectives:
In addition to setting down the broad strokes of a housing policy, the 1999
planners identified objectives designed to move toward those goals, expressing the need
for the Town:
to reactivate the Affordable Housing Committee;
to target housing inventories to meet both community needs and state
mandates;
5 Medway had the third largest percentage increase in the Southwest Area Planning sub-region of MAPC
and the seventh largest percentage increase in the number of housing units among the 101 cities and towns
in the MAPC region. 6 These included new and expanded schools, new police and fire stations, expanded library, expanded
sewer treatment plant, planning for a new municipal well, etc.

Medway Housing Production Plan 2016 - 34 -
to encourage open space development plans;
to provide for Planned Unit Developments;
to encourage housing for senior citizen, and
to provide a fiscal base for achieving the other goals by rezoning some
residential land in order to increase economic development opportunities
thereby encouraging a considered preservation of neighborhoods.
Milestones: Meeting the Housing Goals of the 1999 Master Plan
The concentrated focus and coordinated activity by many volunteers,
elected officials and town staff led to a considerable body of regulatory and
organizational changes designed to promote the growth of affordable housing while
accommodating the remaining community goals.
The major accomplishments of this period are listed in a rough chronology below
and are further described in the endnotes concluding this section.
2000
Affordable Housing Committee reactivated.
Portions of AR-I and the AR-II district were rezoned to create a new
Commercial V zoning district.
The Zoning Board of Appeals issues its first 40B permit,i generating 14
affordable units.
An Adult Retirement Community Planned Unit Development (ARCPUD)ii
option was passed by Town Meeting in October.
2001
The Community Preservation Actiii was adopted, collecting the maximum
rate allowed.
An updated demolition delay bylaw was approved by Town Meeting.
2002
Colonial Arms Estate Condominiums generates 4 affordable units.
2004
An affordable housing plan was completed as part of a Community
Development Plan.
A process allowing accessory dwelling unitsiv was adopted in 2004.
An Adaptive Use Overlay Districtv, allowing mixed-use development was
approved.
2005
A new Open Space Residential Development (OSRD)vi option within the
Zoning Bylaw was adopted.
2007
The bylaw for the Adaptive Use Overlay District was amended to allow
multifamily housing on the site of the Medway Mill. Subsequently,
portions of Village Street was added to the district.

Medway Housing Production Plan 2016 - 35 -
2008
An inclusionary zoning bylawvii was adopted.
The creation and funding of an affordable housing trustviii were both
approved in 2008.
2009
A new Master Plan was adopted, reviewing progress in housing
production and diversity over the prior decade, surveying residents about
housing issues and setting new affordable housing production goals.
An infill developmentix bylaw for affordable housing was adopted in 2009.
A Town-owned lot was conveyed to Habitat for Humanity in 2009 for the
construction of an affordable home.
Assisted living units allowed in C1 district, which was expanded to
include C2 and C6 districts.
2010
Adoption of the 2010 Housing Production Plan
As demonstrated, the actions taken to meet the 1999 goals succeeded not only in
producing affordable housing but also in establishing stratagems of ongoing impact.
Moreover, they reflect the considerable time spent educating leaders and residents about
the need and merits of affordable housing and demonstrate an ingrained awareness
among town leaders.

Medway Housing Production Plan 2016
36
B. 2016 Housing Production Plan: Goals and Objectives –
Carrying the Effort Forward
After surveying the advances made toward the goals of the Town’s 1999 Master
Plan, the authors of the affordable housing section of the 2009 Master Plan developed a
more finely tuned set of 5 housing goals and “implementation actions”, which were
adopted in the 2010 Housing Production Plan and pursued vigorously. In continued
pursuit of the aspirations of the Town’s 2009 Master Pan, those goals remain the focus of
this updated Housing Plan. They are:
Goal 1: Identify Housing Needs
Goal 2: Strengthen Organizational Infrastructure to Implement Housing Plans.
Goal 3: Identify Viable Locations and Optimize Opportunities for Their
Development.
Goal 4: Identify Zoning Practices that Encourage Housing Development that Best
Serves Our Community’s Needs.
Goal 5: Explore and Utilize Creative Development Opportunities
Despite the realization of many “best practices” as catalogued in the previous
section, progress towards the 2010 Housing Plan’s numerical goals has met with limited
success, with 5 projects producing 13 affordable ownership units and “in lieu payments”
to the Trust for a mixture of 12 ownership and rental units. These include:
Williamsburg Condominium: Special Permit, OSRD – 18 Duplex
Townhouses/2 Affordable Units – nearing completion;
Fox Run Farm: Comprehensive Permit – 12 Detached Single-family
Units/3 Affordable Units – completed;
Millstone Village: Special Permit, ARCPUD – 80 Units: 35 Detached
Single Family, 18 Duplex Townhouse, 27 Triplex Townhouses/8
Affordable Units – under construction;
Charles River Village: Special Permit, OSRD – 11 Detached Single-
family Units/In lieu payments for 2 Affordable Units – nearing
completion;
The Willows: Special Permit, ARCPUD – 60 Assisted Living Apartments,
40 Memory-impaired Apartments, 56 Independent Living Apartments, 71
Independent Living Cottages/In lieu payments for 8 Affordable Units – in
permitting process.
Currently, Timber Crest, a proposed comprehensive permit project is under eligibility
review by Mass Housing. The original plan anticipates constructing 76 single family
homes and 116 condominium units, yielding 48 affordable units. While the project’s size
is troublesome in many respects, town officials are working with the developer reviewing
perceived problems with the project’s density in the proposed location. Concern has also
been expressed about the Town’s capacity to absorb the amount of ownership affordable
units under foreseeable market conditions, which indicate an overwhelming need for
rental opportunities. It has been noted that, depending on the project’s production

Medway Housing Production Plan 2016 37
schedule, this project alone will not meet the Town’s 10% goal and may, in fact, even fail
to provide limited safe harbor from other outsized ventures.
Medway is not alone in its shortfall in projected affordable housing production.
Sluggish production and resales have been reported in many towns ringing Boston and
are attributed to the “Great Recession’s” effects on housing development in general.
More specifically, the affordable housing market has been stymied by a disproportionate
drain on moderate and low incomes and down-payment reserves, the evaporation of
credit available to previously qualifying households and other pressures on traditional
first-time buyers such as student loans or under-employment.
Looking forward, the lumbering recovery from the housing crash is revealing
enduring market factors, perhaps obscured in more robust economies, which seem to
increasingly threaten both the proliferation of the smaller-scaled housing development
consistent with the Town’s goals and the possibility of attaining the mandated 10%
housing goal. Along this vein, various local, district and administration stakeholders
have opened discussion about the causes and policy implications of the lack of qualified
buyers for local affordable inventories and the anti-competitive nature of identical pricing
of affordable units among the greatly disparate communities within our Metropolitan
Statistical Area.
While the Town expects to continue its investment in this conversation, this
section of the 2016 Housing Production Plan:
lays out each of the Town’s current goals (as restated from the 2010 plan);
provides a summation of activity and accomplishments over the last 5
years; and finally,
outlines implementing actions and initiatives in the face of foreseeable
local economic and market conditions.
Goal 1: Identify Housing Needs.
Among the goals and objectives of the both the 1999 and 2009 Master Plans,
several bore on the importance of information to gauge priorities among differing
housing needs and hopefully to identify confluent opportunities. Hence, this goal is
carried forward, since identifying evolving conditions is an ongoing process, (e.g. call for
rental versus ownership, changing household size, need for universally accessible
housing, etc.)
The completion of the 2010 Housing Production Plan was an important step in
identifying these needs and it serves as a model for our current review. The subsequent
activity of the Affordable Housing Committee and Trust combined with the work of the
Community Housing Coordinator have helped to identify “post” recession housing needs
and limitations affecting local marketing of both new and re-selling units.
With 2 ARCPUD projects in the pipeline representing over 300 age-55+ units of
housing, the foreseeable need for market-rate, senior housing options may be met.

Medway Housing Production Plan 2016 38
Unfortunately, the Town’s available opportunities for the growing class of moderate and
lower income seniors and infirmed or disabled remain limited.
This process is ongoing.
Implementation Actions:
1. Update the Housing Production Plan per DHCD requirements using
current, recognized statistical sources. i. Identify extent of populations needing accessible housing. ii. Identify shortfalls in affordable ownership and rental housing
stocks across a wide range of household incomes, sizes and ability
levels. 2. Determine the extent of the need for new and replacement of existing
public housing. 3. Increase outreach efforts to make the Town’s efforts to collect affordable
housing information more broadly known in the business and real estate
community.
Goal 2: Strengthen Organizational Infrastructure to Implement Housing Plans.
The Town needs its active committees and experienced personnel to continue to
identify development opportunities, and to initiate needed and desirable housing projects.
Access to funding sources is a critical component of this goal.
The 2010 goal to establish such an infrastructure has been largely attained by
reactivating the Affordable Housing Committee and establishing the Affordable Housing
Trust with the Community Preservation Committee’s recommendation for significant
funding at Town Meeting. At its first meeting on January 5, 2011, the Trust adopted an
Action Plan7, which laid out the Trusts mission:
“To assist eligible residents to manage housing costs and to actively
preserve existing and create new affordable housing opportunities,
both rental and homeownership, to increase Medway’s subsidized housing
inventory.”
The Action Plan contained seven initiatives in line with the Housing Plan’s goals
and a 5-year budget. As it has turned out, practice varied considerably from expectations
due to the unanticipated slow pace of the recovery from the housing crisis and the
ensuing uncertainty of specific housing needs arising out of an alarming lack of buyers
for both new and reselling affordable units. Due to the close alignment of objectives
between the 2010 Production and the 2011 Action plans, the main narrative of this update
will remain focused on achievements, goals and actions as organized in the Housing
Production Plan.
7 The Action Plan’s Executive Summary is appended to this document.

Medway Housing Production Plan 2016 39
Subsequent to its initial allocation of CPA funds, the Trust has received targeted
annual supplements from Community Preservation Funds to meet administrative,
operational, legal and consultation needs. The payment-in-lieu option of the inclusionary
zoning bylaw has also provided additional funding to the Trust.
A part-time Community Housing Coordinator has been active since the end of
2011 advising and coordinating local boards, assisting in preserving the affordable status
of reselling units, facilitating and monitoring regulatory compliance of private sector
projects and supporting the ongoing progress of the Trust and Committee toward goals
laid out in various plans.
Implementation Actions:
1. To better achieve the town’s housing goals, increase the Community
Housing Coordinator’s compensated time to:
a. more effectively identify, promote and facilitate appropriate
housing initiatives in conjunction with housing-related boards
and committees;
b. collaborate and share innovative approaches and best practices
with peers and housing advocates;
c. better understand and develop policies that overcome market
anomalies negatively affecting Medway and similar towns in
the region;
d. qualify for and provide (or monitor 3rd party) marketing and
lottery agent services including the compilation and
administration of buyer and renter lists for the fair allocation of
housing, and
e. determine, coordinate and assure compliance with the
regulations, policies, procedures, practices and other
requirements related to the development of housing qualified
for inclusion in DHCD’s Subsidized Housing Inventory.
2. Improve communication links among town boards, committees and
staff to increase understanding of changing housing needs, important
regulatory developments, the work of the Trust and Committee and
each other’s various roles in the process.
3. Identify potential property managers (including Medway Housing
Authority) to operate 40 B rental properties purchased or developed by
the Town.
4. Develop relationships with developers to understand their needs and
promote local development.
5. Update the Trust’s charter to better align its spending authority with
the broader uses allowed for the CPA funds reserved for affordable
housing.
6. Explore extant avenues of government funding available for projects.
Medway Housing Production Plan 2016 40
7. Research the potential and practice of leveraging real property assets
to optimize the use of available funds.
8. Continue to actively engage the Affordable Housing Committee in
promoting and facilitating programs, and researching housing issues.
9. Encourage Trust and Committee members to benefit from educational
opportunities such as the Massachusetts Housing Partnership’s
Housing Institute and other periodic workshops.
10. Identify individuals with mission-related skills and backgrounds for
consultation or membership on the Board and Committee.
Goal 3: Identify Viable Locations and Optimize Opportunities for Their
Development.
The Affordable Housing Committee and Affordable Housing Trust should refocus
on compiling a comprehensive inventory and map of undeveloped parcels and “under-
built” properties, in order to improve recognition of development opportunities.
Particular emphasis should be placed on town committees working collaboratively
toward reaching mutually beneficial goals, such as preserving open space and producing
affordable housing at the same time.
In addition to the 5 projects permitted or completed since 2009, numerous other
possibilities have been proposed by 3rd parties or identified internally and undergone
varying degrees of review and analysis. Until most recently, none have borne fruit.
Several failed to make economic sense and one promising property was sold faster than
the requisition process allowed the Trust to respond.
Recently, the Trust’s first major project has been initiated with the purchase of the
former American Legion Hall, a 6,000 sq. ft. structure. Originally built as a schoolhouse
in the late 19th century, the property affords an excellent opportunity for repurposing.
The Trust is actively engaged in procuring bids for the design/build of 12 affordable
rental units for variously sized households.
Implementation Actions:
1. Continue to identify and list appropriate parcels and/or buildings
(including single family homes) for review as they become available.
2. Proactively promote use of infill, accessory apartment and multifamily
conversions of existing properties.
3. Seek the help of local professionals to identify opportunities on a
timely basis.
4. Continue to streamline the Trust’s procurement and proposal process,
definitively resolving related legal issues.
5. Help to purchase land for open space/restricted affordable housing
combination as parcels and funding are available.
6. Identify locations where private/affordable housing combined-
development or conversion is possible and take action to facilitate such
development (See Goal 4)
Medway Housing Production Plan 2016 41
7. Identify the best manner and adequate means to secure and maintain
appropriate properties through the process of procuring developers.
8. Coordinate land use with the Medway Housing Authority as they
develop plans to update their properties.
Goal 4: Identify Zoning Practices that Encourage Housing Development that Best
Serves Our Community’s Needs.
As noted, many zoning changes have been made to encourage increases in
housing stocks. However, existing zoning may still prohibit projects from being
developed or implemented in the most appropriate areas. For example, the Medway
Zoning Bylaw does not provide for the “by right” construction of apartments anywhere in
Medway. Frequently, these barriers result from tension between the goals of providing
for diverse housing needs and preserving character. Fortunately, this conflict has been
addressed and mollified in many communities often by the sensitive modification or
expansion of existing market rate units to include affordable elements.
The most recent changes allow mixed-use projects in the C-1 district by special
permit, and sanction multifamily housing by special permit in new overlay zoning
districts. In the C-1 district, by special permit, housing units may occupy up to 67% of
the floor area of new mixed-use developments provided the housing is either (1) on the
upper floors of a building, or (2) in the same or a separate building as long as commercial
space faces the public way or private access drive and the housing is to the rear of the
commercial space. As an incentive to use the special permit, dimensional requirements
are relaxed, including smaller lot sizes, reduced frontage and greater height (up to 60
feet). There are also open space and connectivity requirements.
The multifamily overlay district includes most neighborhoods within about 2000
feet of a commercial district. By special permit, conversion of existing buildings or new
construction for multifamily housing can be developed at a density up to 12 units per
acre. Density bonuses are also available for the inclusion of affordable housing and the
repurposing of existing stock.
Additionally, the Town’s bylaws were entirely edited and reorganized to avoid
duplicative language, consolidate definitions, simplify configuration and standardize
formats. The intent of the exercise was to promote development by facilitating project
planning and avoiding unnecessary delays in the application process.
The Affordable Housing Committee must continue to coordinate and work
together with other town boards such as the Planning and Economic Development Board,
Zoning Board of Appeals, and the Design Review Committee, and identify ways to
strategically use of CPA funds to ensure that affordable housing can be developed in
Medway.

Medway Housing Production Plan 2016 42
Implementation Actions:
1. Promote and encourage use of both “mixed-use” development option
by special permit in C-I district, and multifamily housing option by
special permit in the multifamily overlay district.
2. Determine if incentives might be available to encourage use of “in-fill”
development that allows affordable housing on nonconforming lots.
3. Reconsider the applicability of the State’s “Smart Growth” and
“Compact Neighborhoods” programs.
4. Actively promote the use of Zoning Bylaw provisions for the
development of duplexes and/or multi-family housing in appropriate
locations.
5. Revisit inclusionary zoning bylaw and consider changing the current
10% requirement to a sliding scale calculation based on a project’s
total number of units.
6. Consider adoption of a “Traditional Neighborhood Development”
bylaw to encourage higher densities in appropriate locations, while
reducing the need for new infrastructure and services, minimizing
environmental impact, and increasing “sense of community.”
7. Revisit the accessory family dwelling unit provision to consider
revisions that may better address housing needs.
Goal 5: Explore and Utilize Creative Development Opportunities
To stay abreast of trends and new ideas, the Town should increasingly coordinate
with other organizations such as peer networks, developers, builders, architects, and
consultants that specialize in affordable housing. In addition, the Town should work
closely with state and quasi-governmental housing agencies, such as DHCD, Citizen’s
Housing and Planning Association, the Massachusetts Housing Institute, and the
Massachusetts Housing Partnership, to guide its efforts to implement its plans.
Finding creative methods for working with developers and builders to streamline
the permitting and building or renovation of housing without sidestepping important
bylaws designed to protect Medway should receive special emphasis. The current
housing market presents unique challenges, but may also yield previously unavailable
opportunities to provide both market and affordable housing and move towards the 10%
goal.
A proposed comprehensive permit project called Timber Crest is under project
eligibility review by Mass Housing. The original plan anticipates the construction of 76
single family homes and 116 condominium units, yielding 48 affordable units. The
project will not meet the Town’s 10% goal, but may help reach safe harbor status.
Implementation Actions:
1. Solicit local builders and non-profit organizations to build “friendly
40B” projects within our housing target areas, with an emphasis on

Medway Housing Production Plan 2016 43
rental units, and seek input on other actions that could encourage
housing production.
2. Look into “buying down” existing residences, apartments and
foreclosed properties to restrict them to affordable use.
3. Further encourage use of ARCPUD and OSRD development options
in desirable locales.
4. Facilitate the transfer and use of CPC funds to support development of
affordable housing.
5. Determine ways to increase the number of housing units affordable to
those households with less than 50% and between 50% and 80% of
median family income.
6. Encourage an increase in number of units for disabled persons.
7. Explore opportunities for regional management of rental housing.
8. Work with the Medway Redevelopment Authority to identify
opportunity and plan for the inclusion of affordable housing in its
long-range plans.
9. Identify temporary housing solutions where residents of public
housing could live if existing units are renovated.

Medway Housing Production Plan 2016 44
III. Implementation Strategies
This section is to provide strategies for implementing activities to achieve the five
goals stated above. The intent is to achieve and maintain safe harbor status while working
toward the goal of 10% of the Town’s housing stock being affordable.
The strategies with the highest priority are those that attempt to accomplish
multiple objectives for community development. Moreover, the overarching goal of these
strategies is for Medway to achieve and maintain safe harbor while working toward a
minimum of 10% of its housing stock being affordable in compliance with MGL Chapter
40B.
A. Locations
The preferred locations for new housing (See Figure 8) are generally those areas
with existing infrastructure (primarily nearby transportation, town sewer and water,
sidewalks, etc.) capable of handling new development. Also, encouraging compact
development rather than sprawl suggests that new housing should be located near existing
or emerging centers of activity. The following are the target locations for increased
housing:
Main Street Shopping Center Area (C1 district) as part of a new mixed–use/Town
Center zoning district adopted in 2014.
The area around the new mixed-use/Town Center zoning district, including the
new multi-family zoning district adopted in 2015 around the commercial districts.
Route 109 /Trotter Drive area (Oak Grove) for mixed use and apartments on
residentially-zoned portion of Oak Grove.
Area between Medway Village and the Medway Commons shopping center.
Infill lots within existing neighborhoods.
Medway Mill.
While it is impossible to accurately estimate the number of potential new units in
these areas due to the number of possible combinations of unit types, sizes and permitting
vehicles, reasonable estimates based on plausible scenarios have been calculated.
The mixed-use district encompassing the current C1 zoning district that allows
apartments on the upper floors of buildings and/or residential condominiums could
potentially accommodate between 100 or 200 new housing units, but this would require
major redevelopment of existing sites that is not likely within the next 5 years. Based on
discussions with private developers, we are more likely to see smaller projects resulting
in 25-50 new units over the next few years.

Medway Housing Production Plan 2016
45

Medway Housing Production Plan 2016
46
The new multifamily zoning overlay districts (Figure 9) offers one of the best
opportunities for producing additional housing. The district encourages both conversion of
existing buildings and construction of new units. Density bonuses are offered for historic
preservation and affordable housing. The district generally encompasses the areas of Town that
already have many duplex and multifamily units and that are within walking distance of the
commercial districts.
The Route 109/Trotter Drive (Oak Grove) area is another potential area for additional
housing. In a project sponsored by the 495 Metrowest Corridor Partnership, a graduate class from
UMass-Amherst completed a study that proposed a mixed use district in this area that would serve
as a “gateway” to Medway from the west. One version of the study proposed about 300 dwelling
units for the area. A Medway Redevelopment Authority has been formed and a redevelopment
plan is underway. However, in addition to completing a redevelopment plan, there are title issues
that need to be resolved. While offering a long-term opportunity, significant development is likely
beyond the 5-year horizon of this report. This is an area where the Town could consider an RFP
for a “friendly 40B.”
The area between Medway Village (off Broad and Village Streets) and the Medway
Commons shopping center also has potential for substantial housing development. One scenario
for development of this area could be an extension of the existing “village” style of development
from Broad Street into the parcel.
Development in this area could consist of single structures8 on small lots compatible with
the adjacent Medway Village. Condominiums, cottage-style clusters and multifamily housing
could be part of the mix. Ideally, both rental and ownership housing, designed to accommodate
households of different sizes or with special needs would be integrated throughout.
Since a stream and wetlands traverse the site, an open space element (perhaps a possible
Town Common) could also be part of development in this area. A recreation component should
also be integrated into the mix of uses. The proximity of this area to the historic Medway Village,
the Medway Commons, Medway Shopping Center area and the Medway Middle School make it a
potential 40R site. It would also be an excellent location for additional public housing to replace
or supplement the Medway Housing Authority’s existing stock.
Development of this area could accommodate 50-100 single-family homes and 100-150
condominiums while still maintaining a large area of open space.
8 Housing single or multi-families

Medway Housing Production Plan 2016
47
Figure 9: Multifamily Development Overlay District
!!!!!
!!!!
Multi' family!Development!Overlay!District!
Prepared!for:!
!Prepared!by:!
!
!
AR'I!
AR' I!!!AR'II!
!
C' I!C'V!
C' IV!C' III!
C' I!
!

Medway Housing Production Plan 2016
48
The infill housing development bylaw adopted in 2009 encourages affordable
development on parcels that do not comply with current zoning requirements but are
similar in size and frontage to other lots in the neighborhood, and that are suitable to be
built upon. This provision has not been used and should be reviewed to determine
incentives to encourage its use. An estimated 15-25 new units could be developed in
these locations.
The owner of the Medway Mill continues to express interest in adding apartments
to the historic site and has developed conceptual plans to do so. The Mill is now part of
the new multifamily housing district which should help facilitate such a project. This
could result in 20-30 housing units.
In summary, the various areas targeted here for housing could accommodate an
estimated 435 - 805 units of single- and multi-family homes, apartments and
condominiums. Of course, at current rates it would take decades to reach these totals
with affordable production falling short of desired safe harbor triggers. Hopefully the
strategies outlined here combined with developments affecting affordable-market
conditions, such as increasingly available credit and more highly competitive pricing
practices, can counteract any systemic drag on preferred development scenarios.
B. Basic Strategies
Representing higher-order approaches to achieving this plan’s goals, the dozen or
so strategies listed below either encompass or supplement the “Implementation Actions”
previously detailed in Section II.
Identify Land and Existing Housing Units for Purchase, Development or
Conversion as Affordable Ownership or Rental Housing
Monitor listing services and public notices to identify properties that can be
developed or converted as affordable ownership or rental housing or produce a
combination of affordable housing and open space. Review funding sources and propose
as appropriate, policies and evaluation criteria to fund the purchase and subsidization of
existing housing to be resold or rented as deed restricted units.
Continue to Monitor and Evaluate Inclusionary Zoning Bylaw
The inclusionary zoning bylaw originally required that 15% of new housing
developments be affordable units. That requirement was reduced to 10% after the
Planning and Economic Development Board determined the marginal expense as overly
burdensome for developers of relatively small projects. Since inclusionary-exempt
projects of fewer than 6 units do not generate affordable units and larger developments
offset just 10% of their market rate units, the existing version of this zoning provision

Medway Housing Production Plan 2016 49
does not advance the Town’s long-term9, proportional standing in the Subsidized
Housing Inventory. Therefore, a sliding scale of percentage requirements based on a
project size should be considered.
In addition to adjusting the required percentage, the construction of rental units
should be facilitated by promoting measures to allow, and developing incentives to
produce, apartment units as an alternative to on-site production. To promote the
integration of affordable units throughout town, raising and clearly defining the standards
for accepting in-lieu payment or off-site units as inclusionary alternatives should be
considered.
Clarify Protocols for Local Initiative Program and Comprehensive Permit Projects
In order to facilitate and encourage private sector developments that include
affordable housing and to provide early input to 40B projects, permitting bodies should
formalize intake procedures and model parameters for all proposed Chapter 40B
projects,10 including location, design, density, amenities, percentage of affordable units,
infrastructure needs, etc.
Encourage Use of Mixed-Use/Town Center Special Permit in C-I Zoning District
Medway currently lacks a coherent, traditional New England mixed-use Town
Center and developing one would serve multiple objectives. It would encourage
additional commercial development while providing an opportunity to develop new
housing at a higher density in areas that can best accommodate growth. Encouraging and
concentrating housing in and adjacent to a Town Center would allow more of the open
space throughout town to be preserved. Providing housing in close proximity to
commercial areas reduces traffic by accommodating pedestrian activity. Finally, a mixed
use, pedestrian-friendly center provides opportunities for social interaction that are
missed when virtually all trips are made by automobile.
A “vision” of what a future Town Center in the C-I district could look like was
produced several years ago using a Priority Development Fund grant.
Promote the Use of Accessory Apartments beyond Family Members
Accessory dwelling units are currently allowed in the AR-I and AR-II districts by
special permit. Such apartments are limited in area, design and occupancy. Broadening
the allowed uses of such arrangements beyond immediate family members should
encourage their production.
9 While new affordable units are added to the SHI as eligible, the total number of units in a municipality
are adjusted once after the U.S. Census causing spiked declines in percentages of affordable units. 10 Both comprehensive permit and LIP projects.

Medway Housing Production Plan 2016 50
It should be noted that accessory apartments will probably count toward the
Town’s Subsidized Housing Inventory in very few instances. However, they would fill a
significant housing need and reduce pent up pressure in the area’s rental market.
Promote and Encourage Use of New Multifamily Housing Special Permit Provision
This new bylaw adopted at the 2015 Annual Town Meeting allows both
conversion of existing buildings and development of new housing units at densities up to
12 units per acre (and up to 20 units per acre with certain density bonuses). It is subject to
the inclusionary zoning bylaw and offers an additional incentive of 2 market rate units
when the number of affordable units equals 25% of the total. This provides a significant
tool for meeting Medway’s housing needs both in terms of units that qualify for the
Subsidized Housing Inventory as well as market rate units that do not qualify for the SHI
but nevertheless fill a need for lower priced housing in areas with appropriate
infrastructure and close to commercial services.
Consider Additional Options for Duplexes and Multi-Family Housing
The use of the accessory apartment and multifamily housing bylaws should be
promoted and analyzed periodically in order to identify and evaluate the need for future
revisions to those zoning provisions. If needed, zoning amendments to further encourage
such housing, including possibly allowing it by right, should be considered.
Encourage Use of Open Space Subdivision Bylaw
The Town’s Open Space Residential Development (OSRD) bylaw provides
incentives to preserve open space, reducing sprawl and resulting in more attractive
developments. It also allows multifamily housing to be developed as part of an OSRD. In
combination with the inclusionary zoning bylaw, this bylaw has likelihood to result in
new affordable units. Consideration should be given to make it more appealing to
developers by allowing open space subdivisions by right (subject to certain criteria)
rather than by special permit in order to streamline a process that accomplishes the dual
goals of providing affordable housing and protecting open space.
Develop Alternatives to ARCPUD Housing for Seniors
Since its adoption, the ARCPUD has successfully encouraged housing
developments that provide housing tailored to the needs of Medway’s rapidly-growing
senior population while concurrently making progress toward preserving open space and
providing affordable housing. One age-restricted ARCPUD of 80 units is currently under
construction while another multifaceted development of 227 units including assisted
living, congregate care, memory care and independent living units, is in the permitting
process. Both projects will contribute to the attainment of affordable housing targets,
either through unit construction or in-lieu payments.

Medway Housing Production Plan 2016 51
While it is unclear if the market will currently support additional ARCPUD
developments within Medway, the senior population will continue to grow and we need
to plan for their housing needs, ideally in a more widely integrated fashion.
Develop Additional Public Housing
The Medway Housing Authority (MHA) currently operates more than 200 units
of affordable units serving families, senior citizens and incapacitated individuals. Since
the housing supply-demand gap illustrates a significant shortage of housing for those with
less than 50% of median household income, plans to build and identify funding sources
for additional subsidized affordable rental housing should be undertaken by the Medway
Housing Authority and increasingly be of concern to town leaders.
The two largest of the current public housing facilities are aging and require
replacement or rehabilitation. Consideration should be given on how to maximize the
benefit of such expenditures. That is, rather than rehabilitating the facilities in place, it
may be preferable to relocate the current housing to areas closer to services and putting
the land to other uses. A financing plan for relocating these developments would likely be
difficult and would require significant grant assistance.
Consideration should also be given to expanding the role of MHA by assigning it
management responsibility for affordable rental units developed with Town funding as
well as serving as monitoring agent for privately-owned affordable units. Income
generated could be used for MHA administration and capital maintenance expenses.
Use the Affordable Housing Trust to Administer New Funding Opportunities
The Trust will be key in implementing this Housing Production Plan. In addition
to formalizing policy and protocol for its current focus on funding Trust-initiated
projects, the institution of new uses to better leverage unit production should be pursued.
Among the other potential activities envisioned by the AHT are a down payment
assistance program; purchasing, renovating and deed restricting existing homes; gap
financing for small inclusive projects; and constructing new homes on vacant land.

Medway Housing Production Plan 2016 52
A. Numerical Targets and Schedule
Table 18 presents a proposed schedule for adding affordable units over the next 5
years. The table is optimistic in the sense that some of the projected affordable units to be
derived from the multifamily overlay district, affordable housing trust (beyond the Cutler
Street project), inclusionary zoning and the C-1 district mixed use overlay district are
speculative since there is no way to accurately predict how private property owners will
react to these new incentives. At the same time, it is reasonable and fairly conservative in
that the large majority of projected units (60 of 113) are derived from projects currently
in the works.
The schedule indicated would help Medway achieve safe harbor status by 2017
and maintain it through 2020. It would also represent a significant movement toward the
10% goal by bringing Medway to about 7.5%
B. Certification
Upon achieving production of housing units in accordance with Table 18,
Medway will be eligible to request certification of its Housing Production Plan.
Certification will provide the Town the option of denying a Chapter 40B comprehensive
permit application. Certification will be valid for one year if the Town achieves an
increase in the number of units in its Subsidized Housing Inventory of .5% in one year, or
it will be valid for two years if it achieves an increase of .75%.
If a community has achieved certification within 15 days of the opening of the
local hearing for a Comprehensive Permit, the ZBA shall provide written notice to the
Applicant, with a copy to DHCD, that it considers that a denial of the permit or the
imposition of conditions or requirements would be Consistent with Local Needs, the
grounds that it believes have been met, and the factual basis for that position, including
any necessary supportive documentation. If the Applicant wishes to challenge the ZBA's assertion, it must do so by
providing written notice to DHCD, with a copy to the ZBA, within 15 days of its receipt
of the ZBA's notice, including any documentation to support its position. DHCD shall
review the materials provided by both parties and issue a decision within 30 days of its
receipt of all materials. The ZBA shall have the burden of proving satisfaction of the
grounds for asserting that a denial or approval with conditions would be consistent with
local needs, provided, however, that any failure of the DHCD to issue a timely decision
shall be deemed a determination in favor of the municipality. This procedure shall toll the
requirement to terminate the hearing within 180 days.

Medway Housing Production Plan 2016 53
Table 18
Numerical Targets and Schedule*
YEAR #UNITS SOURCE CUMULATIVE
2016 6 4 from Millstone
2 from Multifamily Overlay District
6
2017 36
4 from Millstone
16 from 40Bs
2 from Multifamily Overlay
12 from Housing Trust project on
Cutler Street
2 from Inclusionary Zoning
requirement
42
2018
24
2 from Inclusionary Zoning
Requirement,
16 from 40Bs
2 from Affordable Housing Trust Fund
4 from Multifamily Overlay District
66
2019
24
2 from Inclusionary Zoning
Requirement,
2 from Affordable Housing Trust Fund,
16 from 40Bs
2 from Multifamily Overlay District
90
2020
23
5 from Inclusionary Zoning
Requirement,
6 from Affordable Housing Trust Fund,
6 from Multifamily Overlay District
6 from C-1 mixed use development
113
*The number of affordable units needed annually to achieve and maintain safe harbor status is 23. In addition to the total number, it is a goal that 10% of affordable units are 3 bedroom units in accordance with the Interagency Agreement among DHCD and other housing agencies.

Medway Housing Production Plan 2016 54
Appendix

Medway Housing Production Plan 2016 55

Medway Housing Production Plan 2016 56
Endnotes i Chapter 40B Comprehensive Permit Projects - In 2000, the town Zoning Board of Appeals approved a
comprehensive permit under Chapter 40B for Woodside, a condominium development of 53 townhouse
units. Fourteen of the units are affordable. That project is now fully built out and occupied. Since then,
three additional projects were granted comprehensive permits, 2 of which were completed: Colonial Park
Estates and Fox Run Farms. ii Adult Retirement Community Overlay District - This zoning bylaw provides for the creation of overlay
districts within the two residential zoning districts. The overlay districts allow greater density (up to 3 units
per acre) for housing units restricted to persons 55 years of age or older. The bylaw also requires that at
least 40% of the parcel be set aside as open space, and 10% of its units be affordable. It also encourages
mixed uses (including limited commercial development). Such overlay districts are authorized through a
special permit granted by the Planning Board and known as an Adult Retirement Community Planned Unit
Development (ARCPUD).
Since its adoption in 2007, two developments of 115 and 80 condominium units respectively were granted
special permits by the Planning Board. Due to market conditions and other factors, however, neither of
these projects were constructed at that time. Subsequently, the 80 unit project is under construction by a
different developer, and a new application for a 227 unit ARCPUD on the same site as the 115-unit project
has been submitted earlier this year (2015). iii Community Preservation Act - Medway adopted the Community Preservation Act (CPA) in 2001. The
Act imposes a surcharge of 3% on property taxes and qualifies the Town to receive matching funds from a
document-recording fee levied at the Registry of Deeds. A minimum of 10% of the revenues generated by
this legislation must be dedicated for each of three uses: the production and maintenance of affordable
housing; the conservation of open space (including recreational uses) and the preservation of historical
points of interest. In 2009, the Community Preservation Committee transferred $433k from the housing
reserve fund to the Affordable Housing Trust and has supplemented the administrative/operating budget
each year since. iv Accessory Apartment Bylaw - In 2004, Medway adopted a provision to allow accessory apartments in the
AR-I and AR-II districts. The bylaw limits occupancy to relatives and includes restrictions to ensure that
the house retains the character of a single-family dwelling. v Adaptive Use Overlay District - In 2004, the Town adopted an Adaptive Use Overlay District for the area
along Route 109 that abuts its primary commercial district. The overlay district allows mixed commercial
and 1 or 2 family units within existing structures in the district vi Open Space Residential Development Bylaw - The original version of an open space residential
development bylaw was used only once. In 2005, Medway adopted a new version and has since fine-tuned
it several times. The present bylaw allows multifamily housing as well as single family homes as part of a
development. Three multifamily OSRD projects have been granted special permits. Pine Ridge, a project of
20 townhouse-quad units was permitted prior to inclusionary zoning and has been completed.
Williamsburg, an 18-unit project with 2 affordable units is nearly complete. Charles River Village,
consisting of 11 single family detached units is nearing completion, and has made “in lieu” payments to the
Trust as substitution for providing 2 affordable units on site. vii Inclusionary Zoning Bylaw
In May 2008, the Town adopted an inclusionary Zoning Bylaw that required that 15% of new
housing projects of 3 or more units be affordable. It was later amended to require 10%. The bylaw allows
for the units to be located on or off-site and provides for payment into an Affordable Housing Trust Fund as
a third option to satisfy the requirement. This bylaw, to date, has produced or generated over $290 k.
viii Affordable Housing Trust (AHT) - Pursuant to MGL 44 - 55C, the Medway Affordable Housing Trust
was created in 2008. The Trust can accept contributions from CPA funds, cash-in-lieu payments from

Medway Housing Production Plan 2016 57
inclusionary zoning and other sources. The funds can be used to support affordable housing projects and
maintain existing units. This entity became active in 2010 as trustees were appointed and it was capitalized
with CPA funds for a variety of targeted applications. A five-year operational plan was developed, and a
part-time staff person was hired.
The Trust has recently purchased a late 19th century school house and is planning to convert the
building into an affordable housing development. At subsequent points in its history, it has served as a
WPA workroom and as the Town’s American Legion Hall. As such, and through ancillary use as a scout
den, dance studio and function hall, the location known to many town residents and represents an excellent
opportunity to showcase positive aspects of affordable housing. ix Infill Development Bylaw - Under this bylaw adopted in 2009, certain undersized lots may be used for
affordable housing. Among the requirements are that the lot size and building setbacks be similar to those
that already exist in the neighborhood.

Medway Housing Production Plan 2016 58