township of russell hall...township of russell ... over a 10-year planning period from 2017 to 2026....
TRANSCRIPT
TOWNSHIP OF RUSSELL
ASSET MANAGEMENT PLAN WATER / WASTEWATER
JUNE 2017
– WSP 100 Commerce Valley Drive West Thornhill, ON L3T 0A1 Contact: Kevin Morawski Email: [email protected] Phone +1 905-882-1100 www.wspgroup.com

CONTENTS
EXECUTIVE SUMMARY ................................................................ 1
INTRODUCTION ............................................................. 7
1.1 Background 7 1.2 Purpose 7 1.3 Development of an Asset Management Plan 8 1.4 Relationship to other Planning Documents 9
STATE OF THE LOCAL INFRASTRUCTURE .......... 10
2.1 Inventory of Assets 10 2.2 Asset Value 10 2.3 Asset Condition 11 2.4 Next Steps 14
EXPECTED LEVELS OF SERVICE ................................ 18
3.1 Minimum Regulatory Requirements 26 3.2 Levels of Service by Asset Category 26 3.3 Next Steps 28
ASSET MANAGEMENT STRATEGY .......................... 29
4.1 Planned Action Strategies 35 4.2 Analysis of Planned Actions 36 4.3 Asset Life Cycle Treatments 38 4.4 Inflation 39 4.5 Procurement 39 4.6 Overview of Risks 40 4.7 Next Steps 43
FINANCING STRATEGY .............................................. 44
5.1 Expenditure Forecasts 51 5.2 Expenditure History vs Forecasts 53 5.3 Funding Strategy 54 5.4 Next Steps 56

CONTENTS
LIST OF TABLES Table 2-1 PSAB 3150 vs. Asset Management 10 Table 2-2 Asset Condition Rating Scale 12 Table 2-3 Condition Rating and Grade 12 Table 2-4 Average Water Distribution Asset Condition 13 Table 2-5 Average Sanitary Sewer Condition 13 Table 2-6 Average Pumping Station Condition 14 Table 2-7 State of Local Infrastructure Next Steps 15 Table 3-1 Minimum Regulatory Requirements 26 Table 3-2 Level of Service Performance Measures Success Scoring 27 Table 3-3 Level of Service Performance Measures for Water Distribution 27 Table 3-4 Level of Service Performance Measures for Wastewater Collection 28 Table 4-1 Recommended Lifecycle Treatments for Water Distribution 38 Table 4-2 Recommended Lifecycle Treatments for Wastewater Collection 39 Table 4-3 Recommended Lifecycle Treatments for Pumping Stations 39 Table 4-4 Risk Likelihood Rating Scale 40 Table 4-5 Risk Severity Rating Scale 41 Table 4-6 Risk Levels 41 Table 4-7 Average Asset Category Risk 42 Table 5-1 Ten Year Needs by Infrastructure Category (in thousands of dollars) 51 Table 5-2 Ten Year Needs by Planned Action Strategy (in thousands of dollars) 52 Table 5-3 Annual Expenses for Water and Wastewater 54

CONTENTS
LIST OF FIGURES Figure 1-1 Typical Asset Management Framework 8 Figure 2-1 Total Replacement Values (2014) by Asset Category 11 Figure 4-1 Small but Timely Renewal Investments Save Money (Figure 1, Ministry of Infrastructure, “Guide for Municipal Asset Management Plans”) 37 Figure 4-2 Asset Ownership Lifecycle 38 Figure 4-4 Risk Classification Chart 42 Figure 5-1 Ten Year Needs by Planned Action Strategy 52 Figure 5-2 Water and Wastewater Systems 10-Year Investment Requirements 53 APPENDICES Appendix A Asset Inventory

EXECUTIVE SUMMARY


1
EXEC
UT
IVE
SUM
MA
RY
WSP was retained to undertake the development of a comprehensive asset management plan that the Township of Russell (Township) can utilize to assist with decisions regarding the building, operating, maintaining, renewing, replacing, disposing and funding of their water and wastewater infrastructure assets.
This asset management plan was prepared in accordance with the Ontario Ministry of Infrastructure’s, “Guide for Municipal Asset Management Plans” and has been structured based on the following sections.
1. Executive Summary 2. Introduction 3. State of Local Infrastructure 4. Expected Levels of Service 5. Asset Management Strategy 6. Financing Strategy
The scope of this project encompasses only the Water and Wastewater infrastructure owned and operated by the Township of Russell. The Township’s linear infrastructure consists of approximately 65 km of watermains, and 40 km of sanitary sewers. Additionally, there are 8 Pumping stations, 2 Water Treatment Plants, 3 elevated towers, 1 reservoir, and 2 lagoons.
Asset condition was established for the Township of Russell’s infrastructure based on the age and expected life of each asset. However, condition information documented by Township staff and inspection reports (e.g., Russell Water and Wastewater Systems Condition Assessment Report, WSP, 2014) was used when available. Furthermore, an assessment of risk was undertaken to determine the priority of works associated with the Township’s infrastructure.
Full life cycle investments for maintenance, rehabilitation, renewal and replacement needs were applied over a 10-year planning period from 2017 to 2026. The capital projects for the Township projected over the 10-year planning period include:
EXECUTIVE SUMMARY
2
EXEC
UT
IVE
SUM
MA
RY
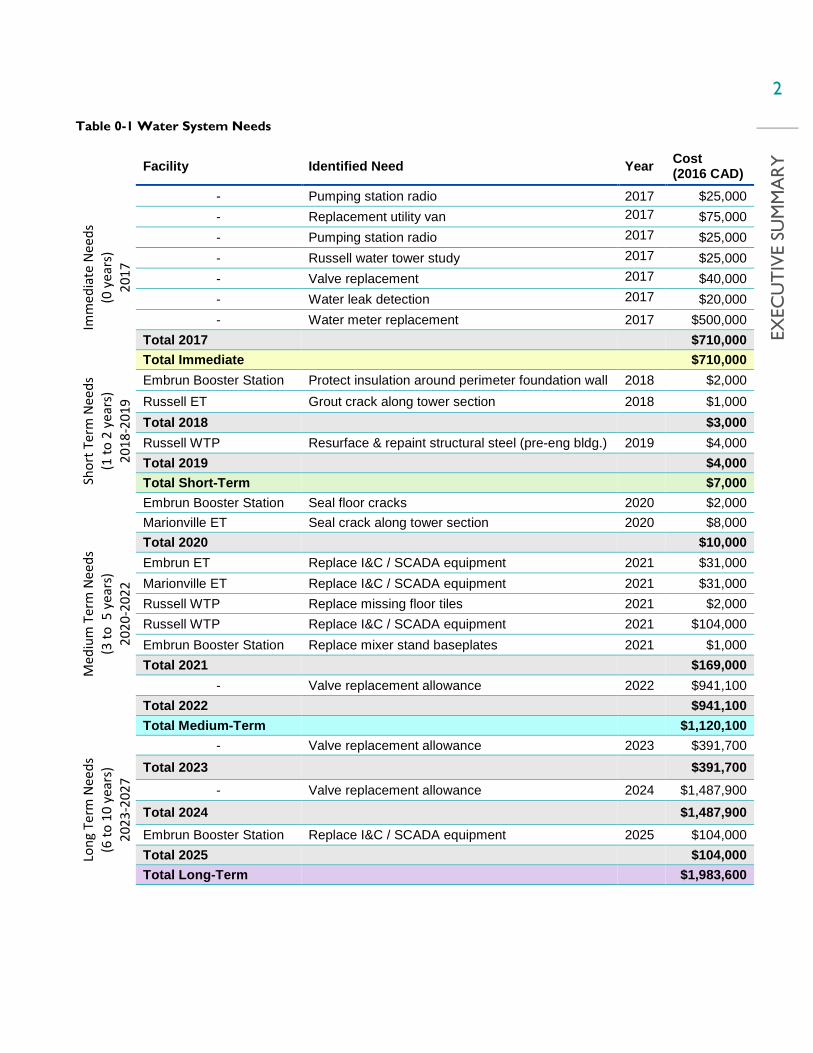
Table 0-1 Water System Needs
Facility Identified Need Year Cost (2016 CAD)
Imm
edia
te N
eeds
(0
yea
rs)
2017
- Pumping station radio 2017 $25,000 - Replacement utility van 2017 $75,000 - Pumping station radio 2017 $25,000 - Russell water tower study 2017 $25,000 - Valve replacement 2017 $40,000 - Water leak detection 2017 $20,000 - Water meter replacement 2017 $500,000
Total 2017 $710,000 Total Immediate $710,000
Shor
t Ter
m N
eeds
(1
to 2
yea
rs)
2018
-201
9
Embrun Booster Station Protect insulation around perimeter foundation wall 2018 $2,000 Russell ET Grout crack along tower section 2018 $1,000 Total 2018 $3,000 Russell WTP Resurface & repaint structural steel (pre-eng bldg.) 2019 $4,000 Total 2019 $4,000 Total Short-Term $7,000
Med
ium
Ter
m N
eeds
(3
to 5
yea
rs)
2020
-202
2
Embrun Booster Station Seal floor cracks 2020 $2,000 Marionville ET Seal crack along tower section 2020 $8,000 Total 2020 $10,000 Embrun ET Replace I&C / SCADA equipment 2021 $31,000 Marionville ET Replace I&C / SCADA equipment 2021 $31,000 Russell WTP Replace missing floor tiles 2021 $2,000 Russell WTP Replace I&C / SCADA equipment 2021 $104,000 Embrun Booster Station Replace mixer stand baseplates 2021 $1,000 Total 2021 $169,000
- Valve replacement allowance 2022 $941,100 Total 2022 $941,100 Total Medium-Term $1,120,100
Long
Ter
m N
eeds
(6
to 1
0 ye
ars)
20
23-2
027
- Valve replacement allowance 2023 $391,700 Total 2023 $391,700
- Valve replacement allowance 2024 $1,487,900
Total 2024 $1,487,900
Embrun Booster Station Replace I&C / SCADA equipment 2025 $104,000 Total 2025 $104,000 Total Long-Term $1,983,600
3
EXEC
UT
IVE
SUM
MA
RY
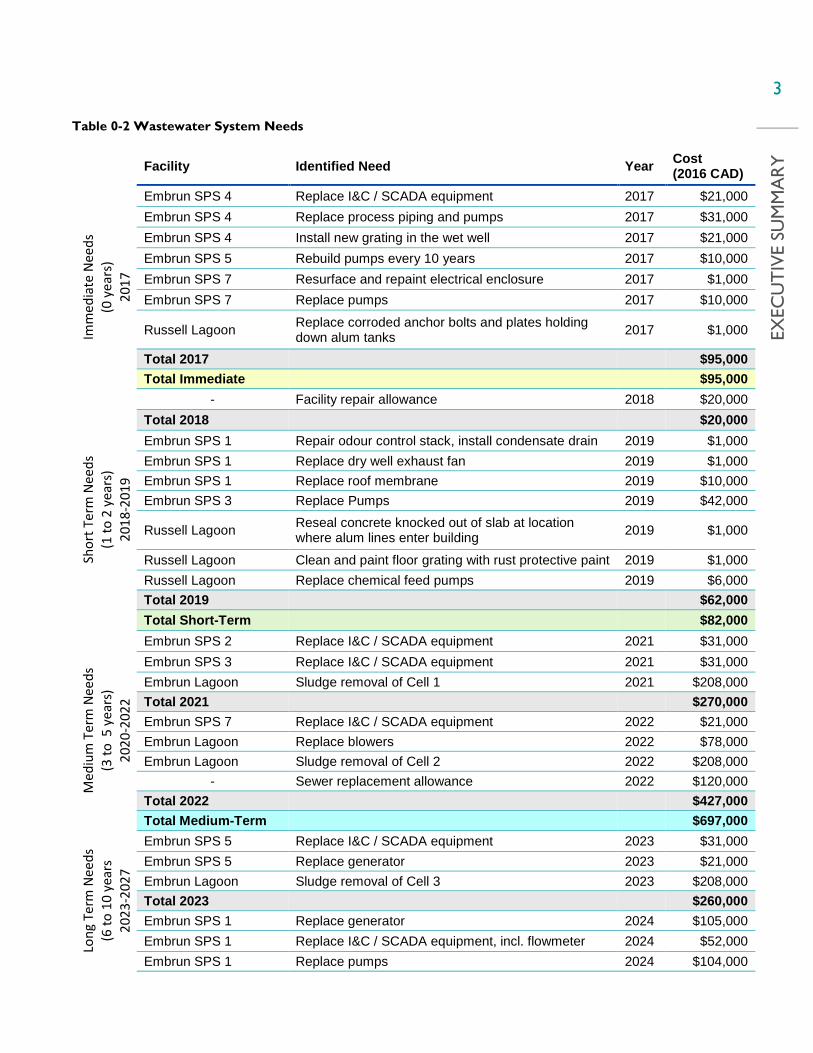
Table 0-2 Wastewater System Needs
Facility Identified Need Year Cost (2016 CAD)
Imm
edia
te N
eeds
(0
yea
rs)
2017
Embrun SPS 4 Replace I&C / SCADA equipment 2017 $21,000 Embrun SPS 4 Replace process piping and pumps 2017 $31,000 Embrun SPS 4 Install new grating in the wet well 2017 $21,000 Embrun SPS 5 Rebuild pumps every 10 years 2017 $10,000 Embrun SPS 7 Resurface and repaint electrical enclosure 2017 $1,000 Embrun SPS 7 Replace pumps 2017 $10,000
Russell Lagoon Replace corroded anchor bolts and plates holding down alum tanks 2017 $1,000
Total 2017 $95,000 Total Immediate $95,000
Shor
t Ter
m N
eeds
(1
to 2
yea
rs)
2018
-201
9
- Facility repair allowance 2018 $20,000 Total 2018 $20,000 Embrun SPS 1 Repair odour control stack, install condensate drain 2019 $1,000 Embrun SPS 1 Replace dry well exhaust fan 2019 $1,000 Embrun SPS 1 Replace roof membrane 2019 $10,000 Embrun SPS 3 Replace Pumps 2019 $42,000
Russell Lagoon Reseal concrete knocked out of slab at location where alum lines enter building 2019 $1,000
Russell Lagoon Clean and paint floor grating with rust protective paint 2019 $1,000 Russell Lagoon Replace chemical feed pumps 2019 $6,000 Total 2019 $62,000 Total Short-Term $82,000
Med
ium
Ter
m N
eeds
(3
to 5
yea
rs)
2020
-202
2
Embrun SPS 2 Replace I&C / SCADA equipment 2021 $31,000 Embrun SPS 3 Replace I&C / SCADA equipment 2021 $31,000 Embrun Lagoon Sludge removal of Cell 1 2021 $208,000 Total 2021 $270,000 Embrun SPS 7 Replace I&C / SCADA equipment 2022 $21,000 Embrun Lagoon Replace blowers 2022 $78,000 Embrun Lagoon Sludge removal of Cell 2 2022 $208,000
- Sewer replacement allowance 2022 $120,000 Total 2022 $427,000 Total Medium-Term $697,000
Long
Ter
m N
eeds
(6
to 1
0 ye
ars
2023
-202
7
Embrun SPS 5 Replace I&C / SCADA equipment 2023 $31,000 Embrun SPS 5 Replace generator 2023 $21,000 Embrun Lagoon Sludge removal of Cell 3 2023 $208,000 Total 2023 $260,000 Embrun SPS 1 Replace generator 2024 $105,000 Embrun SPS 1 Replace I&C / SCADA equipment, incl. flowmeter 2024 $52,000 Embrun SPS 1 Replace pumps 2024 $104,000

4
EXEC
UT
IVE
SUM
MA
RY
Embrun Lagoon Sludge removal of Cell 4 2024 $208,000 Total 2024 $469,000 Russell SPS 2 Replace I&C / SCADA equipment 2025 $52,000 Embrun Lagoon Sludge removal of Cell 5 2025 $208,000 Total 2025 $260,000 Russell SPS 1 Replace I&C / SCADA equipment 2026 $104,000 Embrun Lagoon Sludge removal of Cell 6 2026 $208,000 Russell Lagoon Replace I&C / SCADA equipment 2026 $21,000 Total 2026 $333,000 Embrun SPS 5 Rebuild pumps every 10 years 2027 $10,000 Embrun SPS 7 Replace pumps 2027 $10,000 Russell Lagoon Sludge removal of Cell A 2027 $208,000 - Sewer replacement allowance 2027 $120,000 Total 2027 $348,000 Total Long-Term $1,670,000
In addition to the projects listed in the above tables, a $30,000 annual allowance for watermain breaks and separate hydrant replacement program have been recommended for the water system, as well as $165,000 annually in reserve contributions for the eventual Ottawa feedermain replacement. For the wastewater system, costs not included in the above table include a $32,000 annual sewer flushing program. These costs have been included in Table 5-1 and Table 5-2, summarizing the total 10-year program costs.
Finally, yearly expenditure forecasts were summarized to determine the annual average investment required for infrastructure sustainability. The projected infrastructure investment needs were compared to the Township’s historical expenditures to identify potential funding gaps or surpluses.
Next steps have been provided at the end of each section to elaborate on how the Township can continue to develop and update this Asset Management Plan in the future. A brief summary of the next steps is provided in Table 0-3.
5
EXEC
UT
IVE
SUM
MA
RY
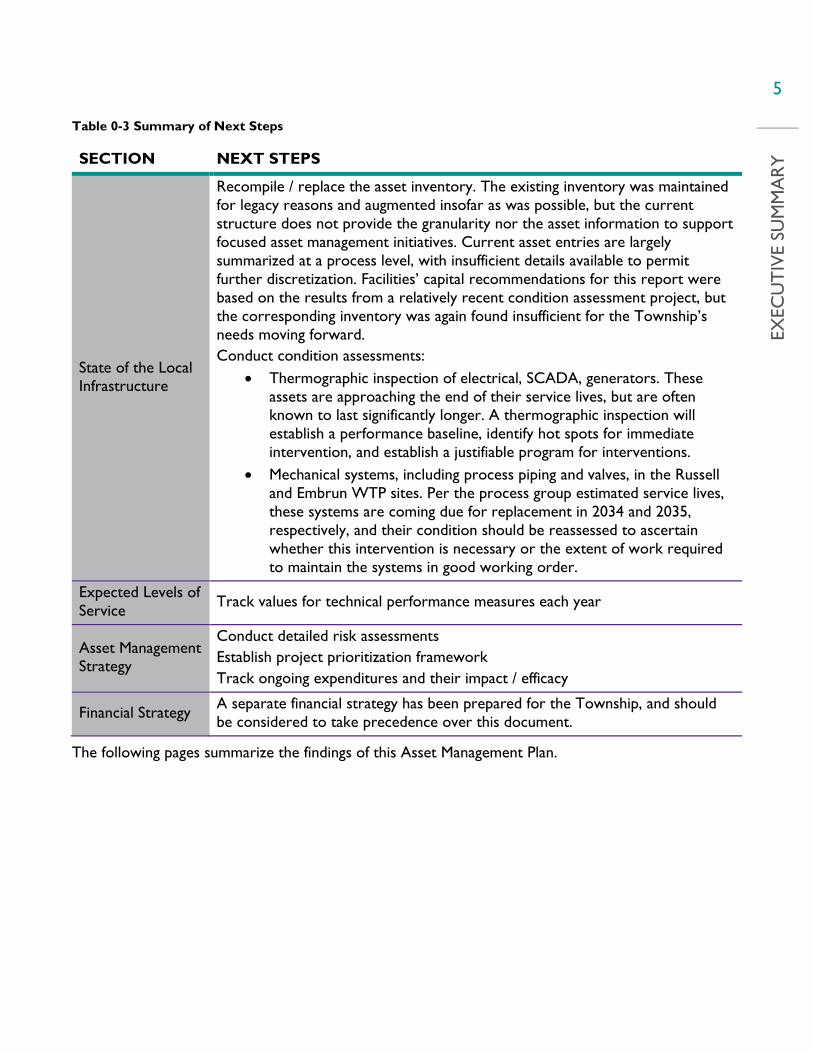
Table 0-3 Summary of Next Steps
SECTION NEXT STEPS
State of the Local Infrastructure
Recompile / replace the asset inventory. The existing inventory was maintained for legacy reasons and augmented insofar as was possible, but the current structure does not provide the granularity nor the asset information to support focused asset management initiatives. Current asset entries are largely summarized at a process level, with insufficient details available to permit further discretization. Facilities’ capital recommendations for this report were based on the results from a relatively recent condition assessment project, but the corresponding inventory was again found insufficient for the Township’s needs moving forward. Conduct condition assessments:
• Thermographic inspection of electrical, SCADA, generators. These assets are approaching the end of their service lives, but are often known to last significantly longer. A thermographic inspection will establish a performance baseline, identify hot spots for immediate intervention, and establish a justifiable program for interventions.
• Mechanical systems, including process piping and valves, in the Russell and Embrun WTP sites. Per the process group estimated service lives, these systems are coming due for replacement in 2034 and 2035, respectively, and their condition should be reassessed to ascertain whether this intervention is necessary or the extent of work required to maintain the systems in good working order.
Expected Levels of Service Track values for technical performance measures each year
Asset Management Strategy
Conduct detailed risk assessments Establish project prioritization framework Track ongoing expenditures and their impact / efficacy
Financial Strategy A separate financial strategy has been prepared for the Township, and should be considered to take precedence over this document.
The following pages summarize the findings of this Asset Management Plan.

6
EXEC
UT
IVE
SUM
MA
RY
–
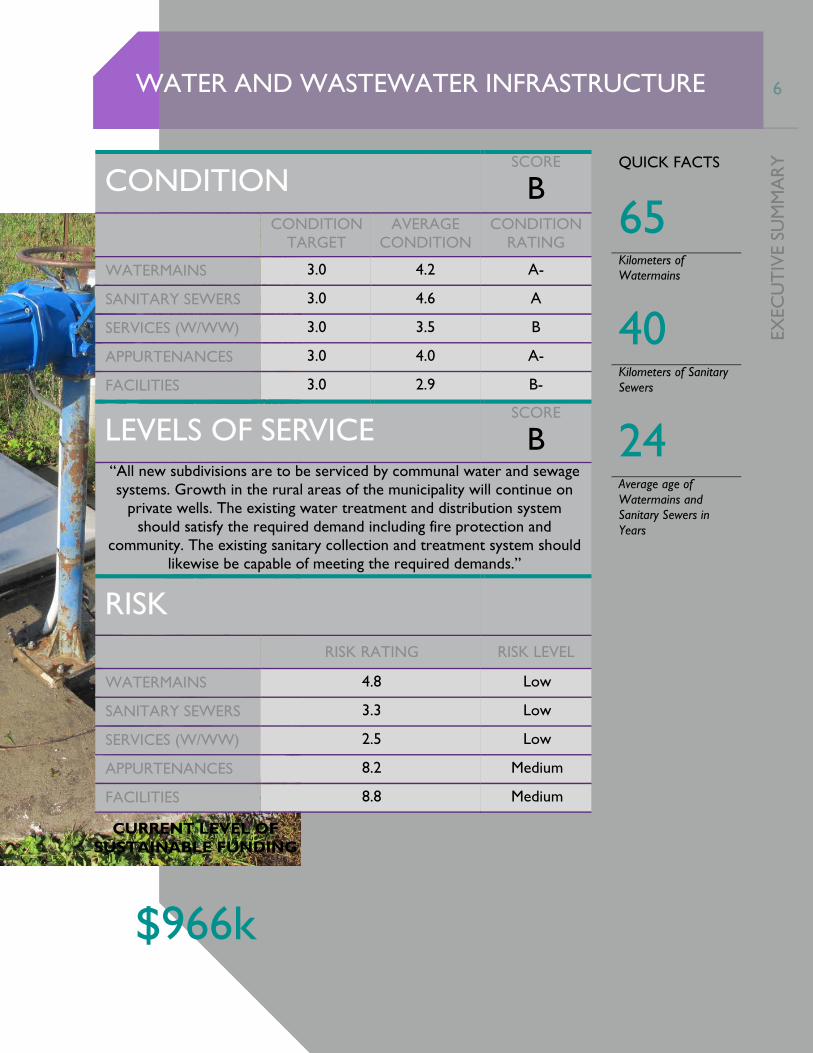
CONDITION SCORE
B
CONDITION TARGET
AVERAGE CONDITION
CONDITION RATING
WATERMAINS 3.0 4.2 A-
SANITARY SEWERS 3.0 4.6 A
SERVICES (W/WW) 3.0 3.5 B
APPURTENANCES 3.0 4.0 A-
FACILITIES 3.0 2.9 B-
LEVELS OF SERVICE SCORE
B
“All new subdivisions are to be serviced by communal water and sewage systems. Growth in the rural areas of the municipality will continue on
private wells. The existing water treatment and distribution system should satisfy the required demand including fire protection and
community. The existing sanitary collection and treatment system should likewise be capable of meeting the required demands.”
RISK
RISK RATING RISK LEVEL
WATERMAINS 4.8 Low
SANITARY SEWERS 3.3 Low
SERVICES (W/WW) 2.5 Low
APPURTENANCES 8.2 Medium
FACILITIES 8.8 Medium
QUICK FACTS
65
Kilometers of Watermains
40
Kilometers of Sanitary Sewers
24
Average age of Watermains and Sanitary Sewers in Years
CURRENT LEVEL OF SUSTAINABLE FUNDING
$966k
WATER AND WASTEWATER INFRASTRUCTURE


–
INTRODUCTION


7
INT
RO
DU
CT
ION
The Township of Russell is a lower tier municipality within the United Counties of Prescott Russell, located Southeast of Ottawa. There are four urban communities within the Township’s boundaries: Embrun, Russell, Marionville and Limoges.
Based on the Township’s PSAB database, the water and wastewater systems consist of approximately 65 km of watermains and 40 km of sanitary sewers. There is one water booster station (located in Russell), a reservoir and booster station (located between Russell and Embrun), three elevated tanks (in Russell, Embrun, and Marionville), eight sewage pumping stations (two in Russell and six in Embrun), two water treatment plants and two sewage lagoon treatment facilities.
1.1 BACKGROUND The Ontario Ministry of Infrastructure’s, “Building Together: Guide for Municipal Asset Management Plans” (June 2011), indicates that any municipality seeking provincial infrastructure funding must demonstrate how its proposed project fits within a detailed asset management plan. This helps to ensure that limited resources are directed to the most critical needs.
WSP was retained to undertake the development of a Water / Wastewater asset management plan that the Township of Russell (Township) can use to guide decisions related to the management of their water and wastewater infrastructure assets.
This asset management plan is structured in accordance with the Ontario Ministry of Infrastructure’s, “Guide for Municipal Asset Management Plans.”
1.2 PURPOSE The objective of this Asset Management Plan is to provide a strategic document that will guide decisions related to how the Township’s water and wastewater infrastructure (both linear and vertical) will be managed to most efficiently and effectively allocate resources in a manner that will meet the Township’s desired levels of service in the lowest overall lifecycle costs.
This Plan identifies the costs and benefits of infrastructure investment decisions across the organizations asset portfolio. To demonstrate the impact of investment decisions, target Levels of Services were set so that performance against these targets could be measured. A Financial Plan is also included in this document which shows how current levels of investment are measuring up against the asset needs. This plan will help to demonstrate the impacts of investment decisions across the organization. It ultimately provides a ten (10) year capital needs forecast based on recent condition assessment information, from 2017 to 2026, and makes recommendations for how the Township may advance its asset management programme moving forward.
INTRODUCTION

8
INT
RO
DU
CT
ION
1.3 DEVELOPMENT OF AN ASSET MANAGEMENT PLAN This Asset Management Plan only documents the asset management strategy for the core public Water and Wastewater systems. A separate Asset Management Plan is being prepared for the Township’s Roads, Bridges, and Storm Water assets; another for the Recreational Facilities. Future government funding of infrastructure projects will be contingent on asset management plans and therefore these asset categories were selected as a starting point for Asset Management within the Township of Russell to match with potential future funding programs. It is highly recommended that the Township consider future integration of Asset Management Plans to promote consideration of mutual needs, infrastructure interdependencies, and avoidance of institutional siloing.
While the previous Plan documented all of the Township’s infrastructure categories, it had two major deficiencies. First, the condition rating assigned to infrastructure asset systems was a blend of theoretical asset condition based on age and a theoretical annual investment calculated using assumed economic Service Life Spans for infrastructure that were consistent with the actual engineering Service Lives. This produced inaccurately poor infrastructure condition scores. The second deficiency was that, though an annual cost was identified for the plan, no actual infrastructure investments were identified.
This document looks at a 10-year planning horizon from 2017 to 2026 but should be re-evaluated on a five year basis. This Asset Management Plan has been developed so that regular updates can be made to reflect the Township’s changing needs and funding availability.
Below is a typical asset management framework as presented in the International Infrastructure Management Manual. It outlines the relationship between the processes and procedures being presented in this Plan.
Figure 1-1 Typical Asset Management Framework
Asset management is the philosophy of actively managing infrastructure with the intention of achieving a specific objective; in this case, delivering the Township’s services at the lowest lifecycle cost. This Plan should not be a standalone document that will simply be updated every five years; it is an iteration of a continually-evolving framework for best management of the Township’s infrastructure, to be
9
INT
RO
DU
CT
ION
integrated into day-to-day operations and reviewed on an annual basis. Although certain principles of asset management such as Condition Assessment, Levels of Service and Capital Planning are addressed within this document, these are high level approaches and assessments that are to be refined as the Township’s asset management program grows. This asset management plan will require on-going and continual work to ensure its success. On-going work or next steps to the refinement of the asset management strategy are presented at the end of each section.
1.4 RELATIONSHIP TO OTHER PLANNING DOCUMENTS This Asset Management Plan relied upon other targeted planning documents in developing the overall asset strategy. This document has already drawn upon the valuable work completed under other planning documents such as:
• Water and Wastewater Systems Condition Assessment, WSP (2015)
• Russell Master Plan – Phases 1 & 2, Stantec (2004)
• Russell Master Plan Update, WSP (2016)
• Asset Management Plan, Public Sector Digest (2013)
• Russell TCA by Department, Russell Township (2016)
• Other internally developed planning resources

STATE OF THE LOCAL INFRASTRUCTURE

10
STA
TE
OF
TH
E LO
CA
L IN
FRA
STRU
CTU
RE
2.1 INVENTORY OF ASSETS Key asset inventory information including location, size, length, material and other attribute information is displayed in the inventory of assets.
PSAB 3150 VS ASSET MANAGEMENT
Effective January 1, 2009, the Public Sector Accounting Board’s (PSAB) Rules on Tangible Capital Assets (PS3150) required that local governments record their Tangible Capital Assets on the statement of financial position and amortize them over their useful lives, moving all governments to a universal full accrual accounting system. In order to comply with this directive, municipalities across Ontario needed to develop an inventory of all of their infrastructure assets, along with an assumed replacement cost.
PSAB 3150 provides accounting information for tangible capital assets (TCA) using historical cost valuation. An asset management plan needs to provide the financial information and timing associated with future replacements, rehabilitations, disposals, expansions and maintenance for the tangible capital assets. Table 2-1 summarizes key differences between PSAB 3150 and asset management.
Table 2-1 PSAB 3150 vs. Asset Management
PSAB 3150 ASSET MANAGEMENT
Use To inventory TCAs and provide valuations
To inventory TCAs and provide a long term, sustainable services
Valuation Amortize costs of assets Project future costs (taking into account inflation) of assets
Procedure Use assumed economic service life to determine asset amortization
Use condition and risk to determine asset needs
Reporting Audited Financial Statements, Financial Information Returns Asset Management Plans
The foundational information used in the development of this Asset Management Plan was based on the Township’s 2016 PSAB 3150 data. This information was augmented by the 2015 Condition Assessment of the Township’s Water and Wastewater infrastructure, prepared by WSP. Where more recent data meeting the requirements of this plan was available, best efforts were made to incorporate the newer data.
STATE OF THE LOCAL INFRASTRUCTURE

11
STA
TE
OF
TH
E LO
CA
L IN
FRA
STRU
CTU
RE
2.2 ASSET VALUE The estimated life expectancy of each asset type and current year (2016) replacement value are both listed in the inventory of assets. The life expectancy and assumed replacement values used in this plan are based on the replacement values assigned to each asset under the previous PSAB 3150 compliance exercise and subsequent condition assessment. The life expectancies are based on a number of factors, including industry accepted standards, engineering best practice, and local experience by Township of Russell Staff. While the PSAB 3150 values were escalated forward to 2016 at a rate of 3% per year to determine the 2016 replacement cost, this is an approximation of the actual costs that may be incurred due to changes in technology, designs, and even infrastructure requirements. The total current year (2016) replacement costs for each asset category are displayed in Figure 2-2.
Figure 2-1 Total Replacement Values (2014) by Asset Category
2.3 ASSET CONDITION
2.3.1 ASSET CONDITION RATING SCALE
The condition of the linear assets (watermains and sewers) was established based on the age and expected life of each asset. For the vertical assets (pump stations, lagoons, etc.), the condition was established based on a theoretical deterioration of the asset condition as recorded in the previous condition assessment project. No field investigations were conducted as part of this assessment. Assets were assigned a condition rating of 1 to 5 based on the rating scale shown in Table 2-2.
12
STA
TE
OF
TH
E LO
CA
L IN
FRA
STRU
CTU
RE
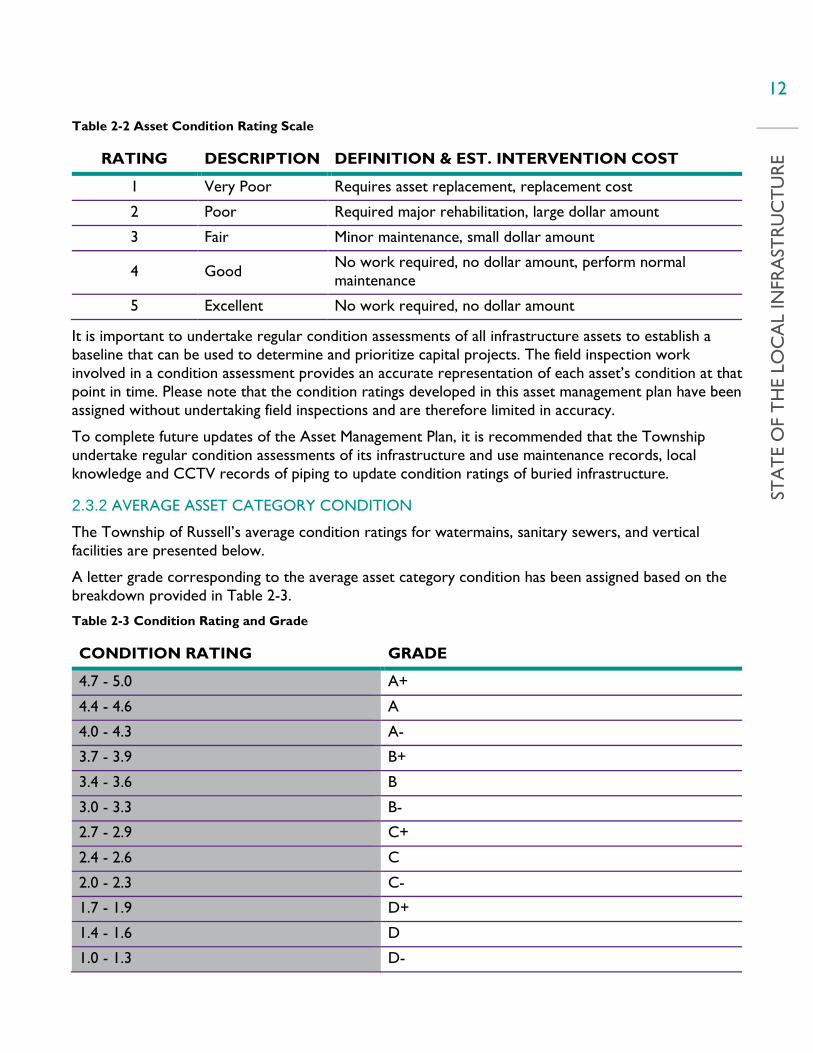
Table 2-2 Asset Condition Rating Scale
RATING DESCRIPTION DEFINITION & EST. INTERVENTION COST
1 Very Poor Requires asset replacement, replacement cost
2 Poor Required major rehabilitation, large dollar amount
3 Fair Minor maintenance, small dollar amount
4 Good No work required, no dollar amount, perform normal maintenance
5 Excellent No work required, no dollar amount
It is important to undertake regular condition assessments of all infrastructure assets to establish a baseline that can be used to determine and prioritize capital projects. The field inspection work involved in a condition assessment provides an accurate representation of each asset’s condition at that point in time. Please note that the condition ratings developed in this asset management plan have been assigned without undertaking field inspections and are therefore limited in accuracy.
To complete future updates of the Asset Management Plan, it is recommended that the Township undertake regular condition assessments of its infrastructure and use maintenance records, local knowledge and CCTV records of piping to update condition ratings of buried infrastructure.
2.3.2 AVERAGE ASSET CATEGORY CONDITION
The Township of Russell’s average condition ratings for watermains, sanitary sewers, and vertical facilities are presented below.
A letter grade corresponding to the average asset category condition has been assigned based on the breakdown provided in Table 2-3.
Table 2-3 Condition Rating and Grade
CONDITION RATING GRADE
4.7 - 5.0 A+
4.4 - 4.6 A
4.0 - 4.3 A-
3.7 - 3.9 B+
3.4 - 3.6 B
3.0 - 3.3 B-
2.7 - 2.9 C+
2.4 - 2.6 C
2.0 - 2.3 C-
1.7 - 1.9 D+
1.4 - 1.6 D
1.0 - 1.3 D-

13
STA
TE
OF
TH
E LO
CA
L IN
FRA
STRU
CTU
RE
WATER DISTRIBUTION
The Township of Russell is responsible for the operation and maintenance of approximately 65 km of watermains, including 3,344 valves and 374 fire hydrants throughout the distribution system. There are no watermains that have surpassed their expected service life. The average condition of each type of water distribution asset and the overall condition rating for the Township of Russell’s water distribution system are displayed in Table 2-4.
Table 2-4 Average Water Distribution Asset Condition
ASSET TYPE AVERAGE AGE
(YEARS)
EXPECTED SERVICE
LIFE (YEARS)
2016 AVERAGE
CONDITION RATING
AVERAGE GRADE
OVERALL GRADE
Hydrant 22.7 30 4.0* A-
A- Valves 23.0 40 4.0* A-
Water Services 22.9 60 3.41 B
Curb Stops 22.9 60 3.41 B
Watermain 22.9 100 4.35 A
* The condition has been set based on the Township’s annual maintenance program. All defective assets are replaced.
WASTEWATER COLLECTION
The Township of Russell is responsible for the operation and maintenance of approximately 40km of sanitary sewers, including 262 maintenance holes throughout the system.
There are no sanitary sewers that have surpassed their expected service life. The average condition of each type of wastewater collection asset and the overall condition rating for the Township of Russell’s sanitary sewer system is displayed in Table 2-5.
Table 2-5 Average Sanitary Sewer Condition
ASSET TYPE
AVERAGE AGE
(YEARS)
EXPECTED SERVICE
LIFE (YEARS)
2016 AVERAGE
CONDITION RATING
AVERAGE GRADE
OVERALL GRADE
Sanitary Sewer 24.3 100 4.71 A+
A Maintenance Hole Lid
24.3 60 3.51 B
Sanitary Service
24.4 60 3.51 B
FACILITIES
The Township of Russell is responsible for the operation and maintenance of the following facilities:

14
STA
TE
OF
TH
E LO
CA
L IN
FRA
STRU
CTU
RE
WATER (6 total) WASTEWATER (11 total) 1. Embrun Water Tower 2. Marionville Water Tower 3. Russell Water Tower 4. Russell Reservoir 5. Russell WTP 6. Embrun WTP
1. Embrun SPS 1 2. Embrun SPS 2 3. Embrun SPS 3 4. Embrun SPS 4 5. Embrun SPS 5 6. Embrun SPS 7 7. Russell SPS 1 (old) 8. Russell SPS 1 (new) 9. Russell SPS 2 10. Embrun Lagoon 11. Russell Lagoon
The average condition of each type of pumping station and the overall condition rating for the Township of Russell’s pumping stations are displayed in Table 2-6.
Table 2-6 Average Pumping Station Condition
PUMPING STATION TYPE
AVERAGE AGE
(YEARS)
EXPECTED SERVICE
LIFE (YEARS)
2016 AVERAGE
CONDITION RATING
AVERAGE GRADE
OVERALL GRADE
Water 21.7 50 3.22 B- B-
Wastewater 21.5 53 2.96 B-
2.4 NEXT STEPS The State of Local Infrastructure Report has been prepared based on the most complete data set for each asset category. The available datasets are based upon the Township’s PSAB registry and refined with the results from previous condition assessment work. In future endeavors, we recommend that the Township complete a “bottom up” inventory of their facilities and equipment along with replacement cost estimates to better integrate enhanced PSAB reporting and maintenance management. The inventory for individual facilities should be refined during future condition assessments of the sites. This will ensure a more accurate representation of the state of the local infrastructure for future updates to this Asset Management Plan, and permit more detailed management of the Township’s asset portfolio.
Recommended work to the Township’s facilities are presented in Table 2-7.

15
STA
TE
OF
TH
E LO
CA
L IN
FRA
STRU
CTU
RE
Table 2-7 State of Local Infrastructure Next Steps
Wastewater Facility Identified Need Year
Cost (2016 CAD)
Embrun SPS 4 Replace I&C / SCADA equipment 2017 $21,000
Embrun SPS 4 Replace process piping and pumps 2017 $31,000
Embrun SPS 4 Install new grating in the wet well 2017 $21,000
Embrun SPS 5 Rebuild pumps every 10 years 2017 $10,000
Embrun SPS 7 Resurface and repaint electrical enclosure 2017 $1,000
Embrun SPS 7 Replace pumps 2017 $10,000
Russell Lagoon Replace corroded anchor bolts and plates holding down alum tanks 2017 $1,000
Total 2017 $95,000 Total Immediate $95,000
- Facility repair allowance 2018 $20,000
Total 2018 $20,000 Embrun SPS 1 Repair odour control stack, install condensate drain 2019 $1,000
Embrun SPS 1 Replace dry well exhaust fan 2019 $1,000
Embrun SPS 1 Replace roof membrane 2019 $10,000
Embrun SPS 3 Replace Pumps 2019 $42,000
Russell Lagoon Reseal concrete knocked out of slab at location where alum lines enter building 2019 $1,000
Russell Lagoon Clean & paint floor grating with rust protective paint 2019 $1,000
Russell Lagoon Replace chemical feed pumps 2019 $6,000
Total 2019 $62,000 Total Short-Term $82,000 Embrun SPS 2 Replace I&C / SCADA equipment 2021 $31,000
Embrun SPS 3 Replace I&C / SCADA equipment 2021 $31,000
Embrun Lagoon Sludge removal of Cell 1 2021 $208,000
Total 2021 $270,000 Embrun SPS 7 Replace I&C / SCADA equipment 2022 $21,000
Embrun Lagoon Replace blowers 2022 $78,000
Embrun Lagoon Sludge removal of Cell 2 2022 $208,000
- Sewer replacement allowance 2022 $120,000
Total 2022 $427,000 Total Medium-Term $697,000

16
STA
TE
OF
TH
E LO
CA
L IN
FRA
STRU
CTU
RE
Embrun SPS 5 Replace I&C / SCADA equipment 2023 $31,000
Embrun SPS 5 Replace generator 2023 $21,000
Embrun Lagoon Sludge removal of Cell 3 2023 $208,000
Total 2023 $260,000 Embrun SPS 1 Replace generator 2024 $105,000
Embrun SPS 1 Replace I&C / SCADA equipment including flowmeter 2024 $52,000
Embrun SPS 1 Replace pumps 2024 $104,000
Embrun Lagoon Sludge removal of Cell 4 2024 $208,000
Total 2024 $469,000 Russell SPS 2 Replace I&C / SCADA equipment 2025 $52,000
Embrun Lagoon Sludge removal of Cell 5 2025 $208,000
Total 2025 $260,000 Russell SPS 1 Replace I&C / SCADA equipment 2026 $104,000
Embrun Lagoon Sludge removal of Cell 6 2026 $208,000
Russell Lagoon Replace I&C / SCADA equipment 2026 $21,000
Total 2026 $333,000 Embrun SPS 5 Rebuild pumps every 10 years 2027 $10,000
Embrun SPS 7 Replace pumps 2027 $10,000
Russell Lagoon Sludge removal of Cell A 2027 $208,000
- Sewer replacement allowance 2027 $120,000
Total 2027 $348,000 Total Long-Term $1,670,000
Water Facility Identified Need Year Cost
(2016 CAD)
- Pumping station radio 2017 $25,000
- Replacement utility van 2017 $75,000
- Pumping station radio 2017 $25,000
- Russell water tower study 2017 $25,000
- Valve replacement 2017 $40,000
- Water leak detection 2017 $20,000
- Water meter replacement 2017 $500,000
Total 2017 $710,000 Total Immediate $710,000

17
STA
TE
OF
TH
E LO
CA
L IN
FRA
STRU
CTU
RE
Embrun Booster Protect insulation around perimeter foundation wall 2018 $2,000
Russell ET Grout crack along tower section 2018 $1,000
Total 2018 $3,000 Russell WTP Resurface & repaint structural steel in pre-eng bldg 2019 $4,000
Total 2019 $4,000 Total Short-Term $7,000 Embrun Booster Seal floor cracks 2020 $2,000
Marionville ET Seal crack along tower section 2020 $8,000
Total 2019 $10,000 Embrun ET Replace I&C / SCADA equipment 2021 $31,000
Marionville ET Replace I&C / SCADA equipment 2021 $31,000
Russell WTP Replace missing floor tiles 2021 $2,000
Russell WTP Replace I&C / SCADA equipment 2021 $104,000
Embrun Booster Replace mixer stand baseplates 2021 $1,000
Total 2021 $169,000
- Valve replacement allowance 2022 $941,000
Total 2022 $941,100 Total Medium-Term $1,120,100
- Valve replacement allowance 2023 $391,700 Total 2023 $391,700
- Valve replacement allowance 2024 $1,487,900 Total 2024 $1,487,900
Embrun Booster Replace I&C / SCADA equipment 2025 $104,000
Total 2025 $104,000 Total Long-Term $1,879,600
In addition to the projects listed in the above tables, a $30,000 annual allowance for watermain breaks and a separate hydrant replacement program have been recommended for the water system, as well as $165,000 annually in reserve contributions for the eventual Ottawa feedermain replacement. For the wastewater system, costs not included in the above table include a $32,000 annual sewer flushing program. These costs have been included in Table 5-1 and Table 5-2, summarizing the total 10-year program costs.

EXPECTED LEVELS OF SERVICE


26
EXPE
CTE
D L
EVEL
S O
F SE
RV
ICE
Levels of service are qualitative and quantitative descriptions of the Township’s objectives for your infrastructure. They provide the means to measure affordability of the infrastructure and its management against infrastructure users’ needs and expectations. The asset management decision-making process is driven by the impact of the levels of service on citizens, communities and the natural environment. This section outlines the Township’s desired levels of service for their water and wastewater linear and vertical infrastructure.
3.1 MINIMUM REGULATORY REQUIREMENTS As a minimum level of service, there are regulatory requirements associated with the Township’s infrastructure that must be met. The regulatory requirements applicable to the Township are summarized in Table 3-1. These requirements are not being identified as a Level of Service since they are already a minimum target and therefore must be met by the Township.
Table 3-1 Minimum Regulatory Requirements
ASSET CATEGORY REGULATORY REQUIREMENTS
Water, Wastewater, Pumping Stations, Retention Ponds
Environmental Protection Act Ontario Water Resources Act, R.S.O. 1990 Safe Drinking Water Act, 2002
Facilities Building Code Act, 1992 (Ontario Regulation 332/12) Accessibility for Ontarians with Disabilities Act (AODA)
3.2 LEVELS OF SERVICE BY ASSET CATEGORY The levels of service have been defined for each of the asset categories: Water Distribution System, Wastewater Collection System, and Facilities.
Each level of service has been defined through technical performance measures. In order to actively track the Township’s performance in meeting the desired levels of service, an assigned value will provide a means to measure the performance. The target values, existing values and target timeframes for each technical performance measure by asset category are listed in Table 3-3 to Table 3-12. A letter grade has been assigned to indicate how well the Township is meeting their desired performance measures for each category. Table 3-2 outlines the Service Level Scoring.
EXPECTED LEVELS OF SERVICE

27
EXPE
CTE
D L
EVEL
S O
F SE
RV
ICE
Table 3-2 Level of Service Performance Measures Success Scoring
GRADE GUIDELINES
A Currently meeting or exceeding performance level targets for the asset category
B Asset category is showing positive improvement in achieving Levels of Service targets by target timeframe
C Asset category is showing no improvement in achieving levels of Service Targets by target timeframe
F Actual Level of Service is trending away from Level of Service target
WATER DISTRIBUTION
LEVEL OF SERVICE: “TO PROVIDE UNINTERRUPTED SERVICE OF CLEAN, POTABLE WATER”
Table 3-3 Level of Service Performance Measures for Water Distribution
TECHNICAL PERFORMANCE MEASURE
UNIT EXISTING VALUE
TARGET VALUE
TARGET TIMEFRAME
(YEAR)
CURRENTLY MEETING TARGET?
Watermain breaks No/
100km /yr
TBD 2 2024 TBD
Unplanned Repairs No/yr TBD 5 2019 TBD
Percentage of valves annually cycled % 100* 20 2021
Average condition rating of watermains 1-5 4.3 3.0 2024
Average condition rating of water facilities 1-5 3.0 3.0 2024
* All road valves are operated annually. Any defective assets are replaced.
28
EXPE
CTE
D L
EVEL
S O
F SE
RV
ICE
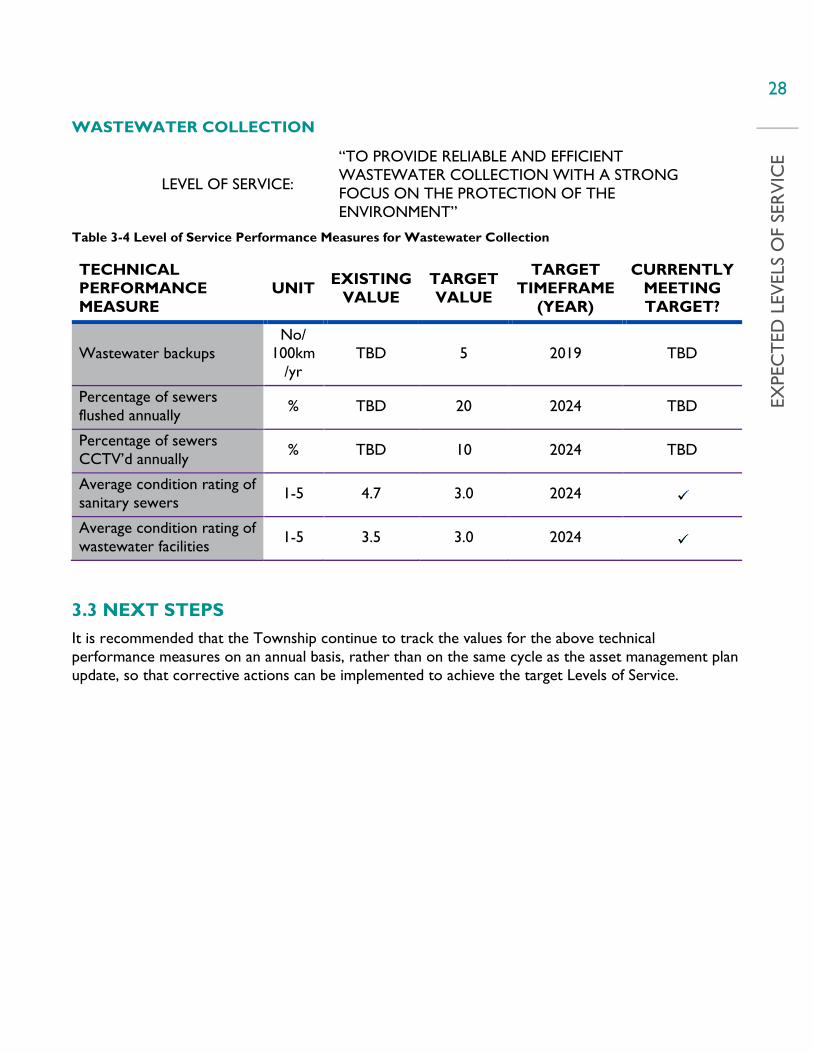
WASTEWATER COLLECTION
LEVEL OF SERVICE:
“TO PROVIDE RELIABLE AND EFFICIENT WASTEWATER COLLECTION WITH A STRONG FOCUS ON THE PROTECTION OF THE ENVIRONMENT”
Table 3-4 Level of Service Performance Measures for Wastewater Collection
TECHNICAL PERFORMANCE MEASURE
UNIT EXISTING VALUE
TARGET VALUE
TARGET TIMEFRAME
(YEAR)
CURRENTLY MEETING TARGET?
Wastewater backups No/
100km/yr
TBD 5 2019 TBD
Percentage of sewers flushed annually % TBD 20 2024 TBD
Percentage of sewers CCTV’d annually % TBD 10 2024 TBD
Average condition rating of sanitary sewers 1-5 4.7 3.0 2024
Average condition rating of wastewater facilities 1-5 3.5 3.0 2024
3.3 NEXT STEPS It is recommended that the Township continue to track the values for the above technical performance measures on an annual basis, rather than on the same cycle as the asset management plan update, so that corrective actions can be implemented to achieve the target Levels of Service.


ASSET MANAGEMENT STRATEGY


35
ASS
ET M
AN
AG
EMEN
T S
TRA
TEG
Y
Infrastructure sustainability is dependent on activities such as maintenance, repairs, upgrades and replacements when necessary. The application of these activities relies heavily on the level of funding available and the effective allocation of that funding. To ensure recommended works are appropriately prioritized, an assessment of risk was undertaken to determine the urgency of the works associated with the Township’s infrastructure. The asset management strategy outlines the planned action strategies and determines the risk for the Township’s infrastructure assets.
4.1 PLANNED ACTION STRATEGIES Recommended works were classified based on six (6) planned action strategies: non-infrastructure solutions, maintenance activities, renewal/rehabilitation activities, replacement activities, disposal activities and expansion activities, as outlined in the Ministry of Infrastructure Ontario’s, “Guide for Municipal Asset Management Plans”. A description of each strategy is outlined below.
4.1.1 NON-INFRASTRUCTURE SOLUTIONS
Non-infrastructure solutions produce lower costs for long-term asset sustainability. Cost and time savings are optimized by implementing an organizational approach for all infrastructure works. Important non-infrastructure solutions include implementation of an asset management plan and regular inspections of the various infrastructure assets. Results of inspections should be used to regularly update the asset management plan. Infrastructure should generally be inspected every five (5) years.
4.1.2 MAINTENANCE ACTIVITIES
Maintenance is essential to managing infrastructure, as the expected level of service often relies on maintenance activities. Regular maintenance can also add significant life to assets. It is important that the Township of Russell schedule regular inspections of its assets to identify maintenance requirements. Annual maintenance expenditures for the Township’s infrastructure have been estimated and incorporated into the final investment requirements. The Township should track the sufficiency and efficacy of its ongoing maintenance expenditures over time, and adjust as needs dictate.
4.1.3 RENEWAL / REHABILITATION ACTIVITIES
Rehabilitation is necessary when an asset does not perform to its desired level of service. Significant repairs designed to extend the life of the asset are determined through regular inspections. Rehabilitation over replacement is advantageous when there are only a few components that need repair. Recommended renewal/rehabilitation activities are found in Section 6.1 and include, but are not limited to cleaning retention ponds and rehabilitations pumping stations and facilities.
ASSET MANAGEMENT STRATEGY

36
ASS
ET M
AN
AG
EMEN
T S
TRA
TEG
Y
4.1.4 REPLACEMENT ACTIVITIES
Occasionally, the extent of damage or deterioration to an asset is too great and rehabilitation is deemed unfeasible. At this point, replacement is necessary. As an asset approaches the end of its service life, more frequent inspection may be necessary to determine if replacement of the asset is critical in the short-term, or if deferral of the asset replacement is possible. The recommended replacement activities within the 10-year planning period include, but are not limited to, the replacement of assets exceeding their service lives, and select facility assets according to their condition and assumed deterioration.
4.1.5 DISPOSAL ACTIVITIES
Disposal costs are associated with the reduction of services or elimination of demands placed on systems. By establishing target levels of service, an organization can clearly determine whether or not infrastructure or particular assets are needed.
For the Township of Russell’s water and wastewater systems, no superfluous assets were identified. Asset disposal costs associated with infrastructure replacement activities are generally included with the estimates made for asset replacement.
4.1.6 EXPANSION ACTIVITIES
Expansion activities are required to extend services to previously un-serviced areas or to expand services to accommodate growth demands. The Township of Russell had a population of 16,180 in 2013, and is expected to grow to a population of 19,800 by the year 2023 (2015 Water & Wastewater Master Plan). While the 2004 Master Plan forecast a water shortage based on demands at the time, the 2015 Master Plan indicates that with the decrease in per capita water usage experienced since 2010, it is expected that current sources augmented with the supply capacity from Ottawa will be sufficient to service the forecasted growth.
4.2 ANALYSIS OF PLANNED ACTIONS An analysis of planned actions was used to determine the most effective strategy for managing the Township’s infrastructure. The analysis compares two strategies for managing infrastructure; one with timely renewal investments, and one without timely investments. These two strategies are depicted in figure 4-1.
37
ASS
ET M
AN
AG
EMEN
T S
TRA
TEG
Y
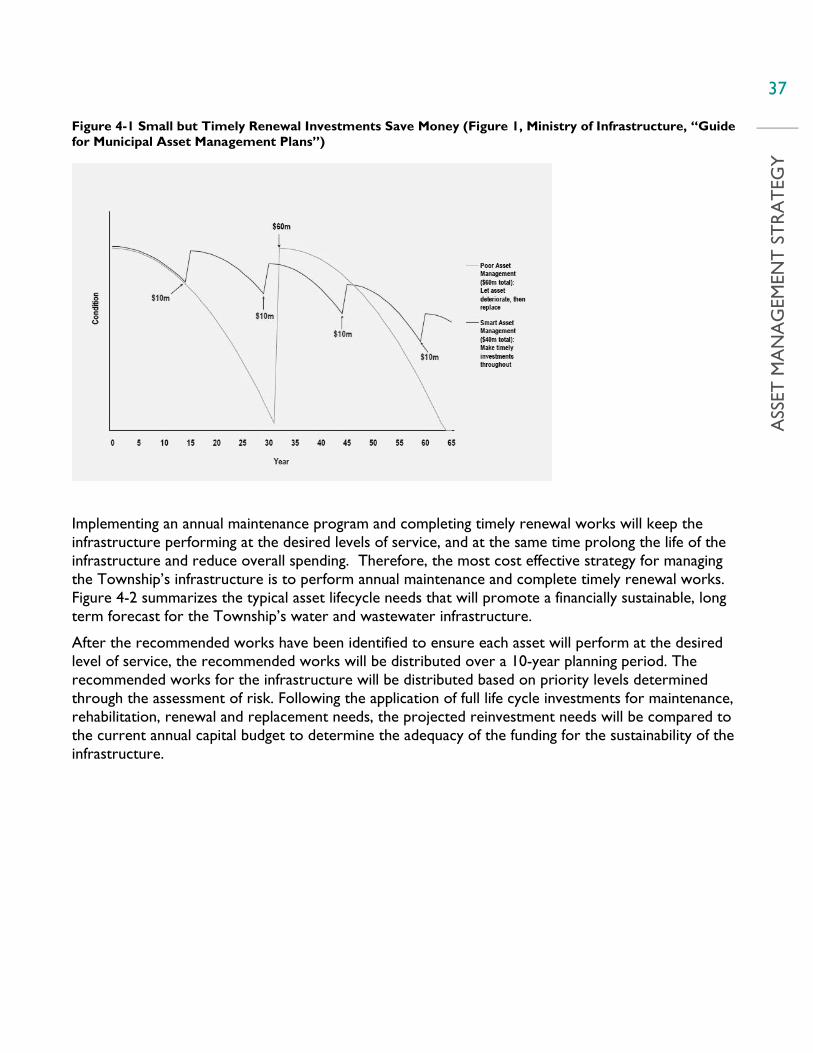
Figure 4-1 Small but Timely Renewal Investments Save Money (Figure 1, Ministry of Infrastructure, “Guide for Municipal Asset Management Plans”)
Implementing an annual maintenance program and completing timely renewal works will keep the infrastructure performing at the desired levels of service, and at the same time prolong the life of the infrastructure and reduce overall spending. Therefore, the most cost effective strategy for managing the Township’s infrastructure is to perform annual maintenance and complete timely renewal works. Figure 4-2 summarizes the typical asset lifecycle needs that will promote a financially sustainable, long term forecast for the Township’s water and wastewater infrastructure.
After the recommended works have been identified to ensure each asset will perform at the desired level of service, the recommended works will be distributed over a 10-year planning period. The recommended works for the infrastructure will be distributed based on priority levels determined through the assessment of risk. Following the application of full life cycle investments for maintenance, rehabilitation, renewal and replacement needs, the projected reinvestment needs will be compared to the current annual capital budget to determine the adequacy of the funding for the sustainability of the infrastructure.

38
ASS
ET M
AN
AG
EMEN
T S
TRA
TEG
Y
Figure 4-2 Asset Ownership Lifecycle
4.3 ASSET LIFE CYCLE TREATMENTS The following sections outline the assumptions made in determining the total costs to undertake the projected lifecycle treatments for each of the Township’s water and wastewater assets.
4.3.1 WATER DISTRIBUTION SYSTEM
Recommended lifecycle rehabilitation for the water distribution system has been included in Table 4-1.
Table 4-1 Recommended Lifecycle Treatments for Water Distribution
RECOMMENDED TREATMENT TIMING ESTIMATED COST
Replacement of Watermains End of Service Life (80-90 years)
Cost varies by diameter $360-$2,060 per meter
Replacement of Fire Hydrants End of Service Life (60 years) $4,000
Replacement of Valves End of Service Life (40 years)
Cost varies by diameter and valve type (50mm-600mm) $2,500-$23,400
Watermain Maintenance (Winterization of Hydrants, Watermain and hydrant flushing)
Annually Negligible
39
ASS
ET M
AN
AG
EMEN
T S
TRA
TEG
Y
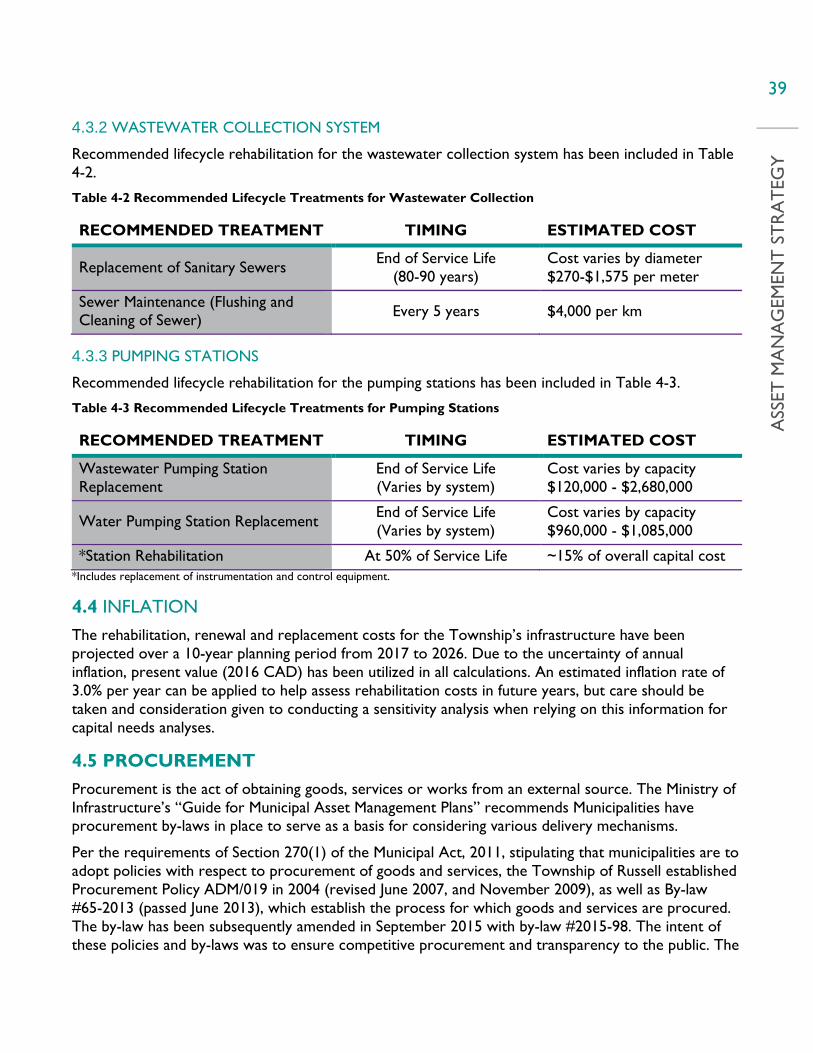
4.3.2 WASTEWATER COLLECTION SYSTEM
Recommended lifecycle rehabilitation for the wastewater collection system has been included in Table 4-2.
Table 4-2 Recommended Lifecycle Treatments for Wastewater Collection
RECOMMENDED TREATMENT TIMING ESTIMATED COST
Replacement of Sanitary Sewers End of Service Life (80-90 years)
Cost varies by diameter $270-$1,575 per meter
Sewer Maintenance (Flushing and Cleaning of Sewer) Every 5 years $4,000 per km
4.3.3 PUMPING STATIONS
Recommended lifecycle rehabilitation for the pumping stations has been included in Table 4-3.
Table 4-3 Recommended Lifecycle Treatments for Pumping Stations
RECOMMENDED TREATMENT TIMING ESTIMATED COST
Wastewater Pumping Station Replacement
End of Service Life (Varies by system)
Cost varies by capacity $120,000 - $2,680,000
Water Pumping Station Replacement End of Service Life (Varies by system)
Cost varies by capacity $960,000 - $1,085,000
*Station Rehabilitation At 50% of Service Life ~15% of overall capital cost *Includes replacement of instrumentation and control equipment.
4.4 INFLATION The rehabilitation, renewal and replacement costs for the Township’s infrastructure have been projected over a 10-year planning period from 2017 to 2026. Due to the uncertainty of annual inflation, present value (2016 CAD) has been utilized in all calculations. An estimated inflation rate of 3.0% per year can be applied to help assess rehabilitation costs in future years, but care should be taken and consideration given to conducting a sensitivity analysis when relying on this information for capital needs analyses.
4.5 PROCUREMENT Procurement is the act of obtaining goods, services or works from an external source. The Ministry of Infrastructure’s “Guide for Municipal Asset Management Plans” recommends Municipalities have procurement by-laws in place to serve as a basis for considering various delivery mechanisms.
Per the requirements of Section 270(1) of the Municipal Act, 2011, stipulating that municipalities are to adopt policies with respect to procurement of goods and services, the Township of Russell established Procurement Policy ADM/019 in 2004 (revised June 2007, and November 2009), as well as By-law #65-2013 (passed June 2013), which establish the process for which goods and services are procured. The by-law has been subsequently amended in September 2015 with by-law #2015-98. The intent of these policies and by-laws was to ensure competitive procurement and transparency to the public. The
40
ASS
ET M
AN
AG
EMEN
T S
TRA
TEG
Y
levels of service and the Township’s ability to meet the associated targets and timeframes may be affected by any limitations of these by-laws.
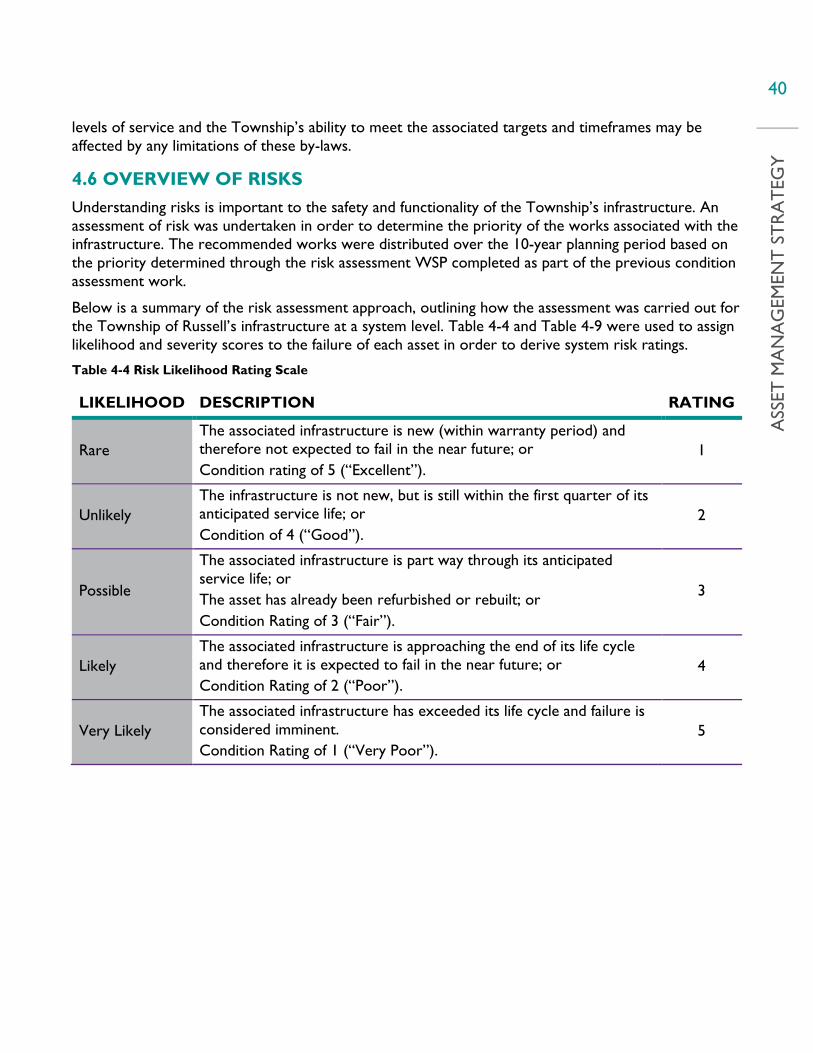
4.6 OVERVIEW OF RISKS Understanding risks is important to the safety and functionality of the Township’s infrastructure. An assessment of risk was undertaken in order to determine the priority of the works associated with the infrastructure. The recommended works were distributed over the 10-year planning period based on the priority determined through the risk assessment WSP completed as part of the previous condition assessment work.
Below is a summary of the risk assessment approach, outlining how the assessment was carried out for the Township of Russell’s infrastructure at a system level. Table 4-4 and Table 4-9 were used to assign likelihood and severity scores to the failure of each asset in order to derive system risk ratings.
Table 4-4 Risk Likelihood Rating Scale
LIKELIHOOD DESCRIPTION RATING
Rare The associated infrastructure is new (within warranty period) and therefore not expected to fail in the near future; or Condition rating of 5 (“Excellent”).
1
Unlikely The infrastructure is not new, but is still within the first quarter of its anticipated service life; or Condition of 4 (“Good”).
2
Possible
The associated infrastructure is part way through its anticipated service life; or The asset has already been refurbished or rebuilt; or Condition Rating of 3 (“Fair”).
3
Likely The associated infrastructure is approaching the end of its life cycle and therefore it is expected to fail in the near future; or Condition Rating of 2 (“Poor”).
4
Very Likely The associated infrastructure has exceeded its life cycle and failure is considered imminent. Condition Rating of 1 (“Very Poor”).
5
41
ASS
ET M
AN
AG
EMEN
T S
TRA
TEG
Y
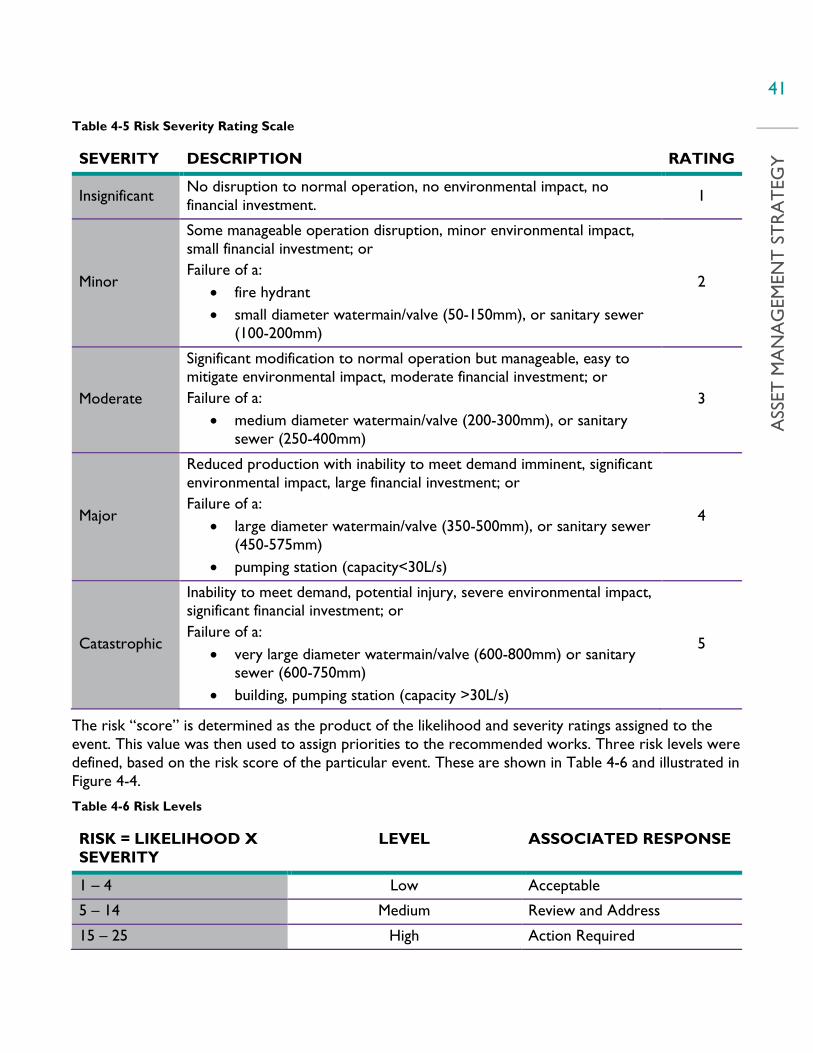
Table 4-5 Risk Severity Rating Scale
SEVERITY DESCRIPTION RATING
Insignificant No disruption to normal operation, no environmental impact, no financial investment. 1
Minor
Some manageable operation disruption, minor environmental impact, small financial investment; or Failure of a:
• fire hydrant • small diameter watermain/valve (50-150mm), or sanitary sewer
(100-200mm)
2
Moderate
Significant modification to normal operation but manageable, easy to mitigate environmental impact, moderate financial investment; or Failure of a:
• medium diameter watermain/valve (200-300mm), or sanitary sewer (250-400mm)
3
Major
Reduced production with inability to meet demand imminent, significant environmental impact, large financial investment; or Failure of a:
• large diameter watermain/valve (350-500mm), or sanitary sewer (450-575mm)
• pumping station (capacity<30L/s)
4
Catastrophic
Inability to meet demand, potential injury, severe environmental impact, significant financial investment; or Failure of a:
• very large diameter watermain/valve (600-800mm) or sanitary sewer (600-750mm)
• building, pumping station (capacity >30L/s)
5
The risk “score” is determined as the product of the likelihood and severity ratings assigned to the event. This value was then used to assign priorities to the recommended works. Three risk levels were defined, based on the risk score of the particular event. These are shown in Table 4-6 and illustrated in Figure 4-4.
Table 4-6 Risk Levels
RISK = LIKELIHOOD X SEVERITY
LEVEL ASSOCIATED RESPONSE
1 – 4 Low Acceptable
5 – 14 Medium Review and Address
15 – 25 High Action Required

42
ASS
ET M
AN
AG
EMEN
T S
TRA
TEG
Y
Figure 4-3 Risk Classification Chart
4.6.1 AVERAGE ASSET CATEGORY RISK
The recommended works were prioritized in order to minimize the Township’s overall average risk level over the 10-year planning period. The average risk ratings for the Township of Russell’s infrastructure by asset category are presented in Table 4-7.
Table 4-7 Average Asset Category Risk
ASSET CATEGORY
TYPE 2016 AVERAGE
RISK RATING
AVERAGE LEVEL
OVERALL LEVEL
Buried Infrastructure
Watermains 4.0 Low 3.1
Sanitary Sewers 2.8 Low
Facilities Water 14.0 Medium
13.1 Wastewater 11.9 Medium

43
RO
STER
CA
TEG
ORY
: ##
4.7 NEXT STEPS It is recommended that a more detailed risk assessment be undertaken for the Township’s infrastructure through future asset management planning activities to refine the results of the high level risk analysis performed under this study.
In addition to enhancing the risk assessment, it is recommended that the Township establish formal integrated project prioritization frameworks to assist in capital planning and risk management between asset categories / classes. It is important to concurrently track the efficacy / impact of ongoing expenditures to validate or refine the investment strategy.

FINANCING STRATEGY

51
FIN
AN
CIN
G S
TR
ATE
GY
Note that a more detailed financial strategy has been prepared for the Township’s water and wastewater asset categories. That document has been derived using the information presented herein.
5.1 EXPENDITURE FORECASTS
5.1.1 10-YEAR INVESTMENT NEEDS BY ASSET CATEGORY
Based on approaches to asset lifecycle investments, including installation, maintenance and replacement at the end of service life, 10-year asset needs profiles have been created for the asset categories. The forecasted needs do not include the costs associated with staffing or the staffing growth requirements to meet the future infrastructure needs, nor does it include any expansion or upgrades that may be necessary to meet a growing demand on the infrastructure. A summary of the 10-year asset needs (in thousands of dollars, 2016 CAD) is included in Table 5-1.
Table 5-1 Ten Year Needs by Infrastructure Category (in thousands of dollars)
ASSET CATEGORY
2017 2018 2019 2020 2021 2022 2023 2024 2025 2026
Watermains $50 $30 $30 $30 $30 $30 $30 $30 $30 $30
Valves $0 $0 $0 $0 $0 $941 $392 $1,488 $0 $0
Hydrants $552 $27 $754 $11 $5 $15 $19 $0 $24 $14
Water Facilities
$690 $3 $4 $10 $169 $0 $0 $0 $104 $0
Sanitary Sewers
$32 $32 $32 $32 $32 $152 $32 $32 $32 $32
Wastewater Facilities
$95 $20 $62 $0 $270 $307 $260 $469 $260 $333
Total (2016 CAD, ‘000)
$1,419 $112 $882 $83 $506 $1,445 $733 $2,019 $450 $409
5.1.2 10-YEAR INVESTMENT NEEDS BY PLANNED ACTION STRATEGY
A summary of the recommended works categorized by the previously defined planned action strategies over the next 10-year period (in thousands of dollars, 2016 CAD) is included in Table 5-2. This forecast will assist Township staff in planning for the expenses associated with replacement, maintenance, rehabilitation and expansion of the Township’s infrastructure.
FINANCING STRATEGY

52
FIN
AN
CIN
G S
TR
ATE
GY
Table 5-2 Ten Year Needs by Planned Action Strategy (in thousands of dollars)
PLANNED ACTION STRATEGY
2017 2018 2019 2020 2021 2022 2023 2024 2025 2026
Maintenance Activities
$82 $62 $62 $62 $62 $182 $62 $62 $62 $62
Renewal / Rehabilitation Activities
$- $3 $4 $10 $202 $200 $200 $200 $200 $200
Replacement Activities
$1,337 $48 $816 $12 $242 $1,063 $471 $1,757 $188 $147
Expansion Activities
- - - - - - - - - -
Total (2016 CAD, ‘000)
$1,419 $112 $882 $83 $506 $1,445 $733 $2,019 $450 $409
Figure 5-1 Ten Year Needs by Planned Action Strategy

53
FIN
AN
CIN
G S
TR
ATE
GY
5.2 EXPENDITURE HISTORY VS FORECASTS
WATER AND WASTEWATER
The recommended annual maintenance investment for the water and wastewater systems is approximately $62,000. The current annual sustainable infrastructure investment projected for the water and wastewater systems is approximately $834,000. The projected annual expenditures over the 10-year planning period are summarized in Figure 5-2.
Figure 5-2 Water and Wastewater Systems 10-Year Investment Requirements
The Township’s average expenditure for the water and wastewater systems between the years of 2013 to 2017 is $434,271. The breakdown of the yearly expenses is presented in Table 5-3.
54
FIN
AN
CIN
G S
TR
ATE
GY
Table 5-3 Annual Expenses for Water and Wastewater
CATEGORY 2013 2014 2015 2016 2017 PROPOSED BUDGET
AVERAGE (2010 – 2014)
Water (capital) - $29,686 $1,024,688 $137,000 $100,000 $258,275
Wastewater (capital) - - $398,730 $181,500 $92,000 $134,446
Water (operation) - $126,321 $19,427 - $30,000 $35,150
Wastewater (operation) - - - - $32,000 $6,400
Average Annual Expenditure
$434,271
The difference between the forecasted annual sustainable investment and the existing average annual investment is $289,499, however this does not represent a gap in funding. The historical investments made reflect a fully funded system, therefore it is anticipated that future investments will reflect the actual future needs as well.
5.3 FUNDING STRATEGY A full cost recovery Financial Plan has been completed for the Township that should be considered to take priority over the findings of this AMP. The Financial Plan is based on the capital plan defined in this AMP, with more detail placed in the analysis.
5.3.1 REVENUE SOURCES
Several sources of funding are available to the Township of Russell to support the sustainable infrastructure investments over the next ten years. Typical funding sources are outlined below for discussion purposes however, funding of the sustainable infrastructure plan will be further determined through other studies to be undertaken by the Finance and Budget Departments.
RESERVE ACCOUNTS
The Township currently contributes a portion of revenue to reserve accounts, from which funds can be drawn upon when needed. Reserve accounts play an important role in long term financial planning. The benefits of having reserve accounts for infrastructure are as follows:
Provides a buffer for unexpected expenditures
Accumulation of funding for significant future infrastructure investments
DEBENTURE
Debenture financing involves taking out a loan to fund infrastructure needs at a fixed interest rate. It is a long term debt that is paid back over time according to a fixed payment schedule. Both corporations and governments frequently issue this type of bond in order to secure capital.
55
FIN
AN
CIN
G S
TR
ATE
GY
USER FEES
User fees are levies charged to the users of a good or service. A rate is typically used to determine the user fees, which may or may not be based on full cost recovery.
The Township currently charges a water and sewer user fee at a rate dependent upon property type and cubic meter usage. The Township currently has 2,903 water connections.
DEVELOPMENT CHARGES
Development charges are fees collected from developers to help fund growth related capital infrastructure. Development charges are used by most municipalities in Ontario to ensure that the cost to provide infrastructure in new developments is not passed on to existing residents through higher property taxes.
The Development Charges By-Law Number 5-2014 establishes the development charges applicable for the Township of Russell.
PUBLIC PRIVATE PARTNERSHIPS
The Public Private Partnership program, P3 Canada, is a federally funded program that aims to improve the delivery of infrastructure with contracts between the public sector and private parties. Public private partnerships are a long term approach to developing infrastructure that enhances the accountability of the private sector for infrastructure assets over their expected service lives. The private party assumes responsibility for the design, construction, financing and operation of the infrastructure. The public sector repays the operating and capital expenditures to the private party throughout the life of the infrastructure. This allows for a significant portion of the risk associated with infrastructure development to be passed over to the private party.
Public private partnerships are not the right solution for all infrastructure developments; however they can provide many benefits when applied to the right projects.
FEDERAL GAS TAX
The Federal Gas Tax Fund (GTF) provides predictable, long-term funding for municipalities to help build and revitalize infrastructure. Funding is provided twice a year to provinces and territories who then distribute this funding to their municipalities. Municipalities can pool, bank and borrow against this funding. Currently, federal GTF can be used for the following:
public transit
WASTEWATER INFRASTRUCTURE
DRINKING WATER
solid waste management
community energy systems
local roads and bridges
capacity building
highways
local and regional airports
short-line rail
short-sea shipping
disaster mitigation
broadband and connectivity
brownfield redevelopment
culture
tourism
sport
recreation
56
FIN
AN
CIN
G S
TR
ATE
GY
GRANTS/RECOVERIES
This Asset Management Plan is intended to be used as a tool during capital grant application processes. Although grants may become available in the future, the sustainable funding plan cannot rely on awarded grants in order to balance the funding needs.
TAXATION
Property taxes are levies on a property which are issued by the governing municipality in which the property is located. Two components make up the property tax calculation for Ontario Municipalities:
The annual operating expenditure to provide services to residents; and
The total current market value of the assessment base (property) over which the operating expenditure is to be recovered.
The tax rate is determined by divided the annual operating expenditure by the total assessment value.
5.4 NEXT STEPS After identifying the Township of Russell’s infrastructure funding gaps and the available funding strategies/sources, it is recommended that the Township determine the appropriate strategy (strategies) going forward to fund the identified gaps. A full cost recovery strategy will have been developed as part of the Financial Plan document.
It is also recommended that the Township seek approval to adopt this Asset Management Plan in principle, as a sustainable strategy. It is understood that annual funding will still be subject to the annual budget approval process, and that the Financial Plan should be taken as taking precedence over this AMP.
Before future updates to this Asset Management Plan are undertaken, it is recommended that the Township review, redesign, and revise their asset inventory. This will provide the Township with one comprehensive asset inventory, including key asset management themes such as condition, technical performance measures and risk, for all assets at a functional level and related to one another through practical asset hierarchies.
We recommend that the Township should continue to develop its infrastructure inventory in GIS. This will allow the Township to view where various infrastructure assets are spatially located in relation to each other. The benefit of incorporating GIS with asset management planning is that future projects will be able to be combined based on location, potentially empowering the Township to apply corridor management techniques, and help to reduce costs and preserve asset condition. For example, the resurfacing of a road segment will be combined with the replacement of the respective watermain such that a newly resurfaced road will not have to be dug up and patched to repair the buried infrastructure underneath.
This asset management plan should be updated when regular inspections are completed and when conditions are re-assessed; at least every five (5) years.
Asset management is a cost effective measure to help optimize investments, create long-term savings and better manage infrastructure risks. The implementation of this asset management plan will assist the Township of Russell in making informed decisions to meet the desired levels of service, reduce overall risk and improve the infrastructure over the 10-year timeframe of the plan.
–
Appendix A Asset Inventory


–
–
ABOUT US WSP is one of the world’s leading professional services firm, working with governments, businesses, architects and planners and providing integrated solutions across many disciplines. The firm provides services to transform the built environment and restore the natural environment, and its expertise ranges from environmental remediation to urban planning, from engineering iconic buildings to designing sustainable transport networks, and from developing the energy sources of the future to enabling new ways of extracting essential resources. It has approximately 15,000 employees, mainly engineers, technicians, scientists and architects, as well as various environmental experts, based in more than 300 offices, across 35 countries, on every continent.
Head office WSP Canada Inc. 1600 René-Lévesque Blvd West, Floor 16 Montréal (Québec) H3H 1P9 Phone +1 514-340-0046 Fax +1 514-340-1337 www.wspgroup.com