toxic air - american lung association report: · toxic air the case for cleaning up coal-fired...
TRANSCRIPT

Toxic AirThe Case for Cleaning Up Coal-fired Power Plants
March 2011

American Lung Association National Headquarters Offices
Washington, D.C. New York City
1301 Pennsylvania Ave., NW 14 Wall Street
Suite 800 Suite 8C
Washington, DC 20004-1725 New York, NY 10005-2113
Phone: (202) 785-3355 Phone: (212) 315-8700
Fax: (202) 452-1805 Fax: (212) 608-3219
Our Mission: To save lives by improving lung health and preventing lung disease.
http://www.LungUSA.org • 1-800-LUNG-USA
Copyright ©2011 by the American Lung Association.
American Lung Association is a registered trademark.
Designed by Barbieri & Green, Inc., Washington, D.C.

Overview Coal-fired power plants produce electricity for
the nation’s power grid, but they also produce more
hazardous air emissions than any other industrial
pollution sources. The quantity is staggering. Over
386,000 tons of 84 separate hazardous air pollu-
tants spew from over 400 plants in 46 states.1
Their emissions threaten the health of people who
live near these plants, as well as those who live
hundreds of miles away. Despite the concentration
of these plants largely in the Midwest and South-
east, their toxic emissions threaten the air in com-
munities nationwide.
In 1990, Congress took action to protect Ameri-
cans from these airborne hazards. Congress added
special requirements in the Clean Air Act to require
the U.S. Environmental Protection Agency to clean
up toxic substances. Now, at last, over twenty years
later, EPA is poised to announce steps on March 16,
2011 to finally require the electric utility companies
to clean up these dangerous emissions.
Toxic Air: The Case for Cleaning Up Coal-fired
Power Plants highlights the threats from the haz-
ardous air pollutants from electricity generators and
explains why cleaning up these plants is essential.
More details are in a longer white paper, Emissions
of Hazardous Air Pollutants from Coal-fired Power
Plants, available at www.lungusa.org/ToxicAirReport.
The American Lung Association commissioned the
analysis from Environmental Health and Engineer-
ing, Inc. in Boston. That paper describes the risks
and the cleanup equipment in greater detail. Also,
on the website is a separate summary table that lists
the power plants in each state, provides information
on the coal that they burn and any equipment they
have in place to reduce hazardous air pollutants.
1
Toxic Air The Case for Cleaning Up Coal-fired Power Plants
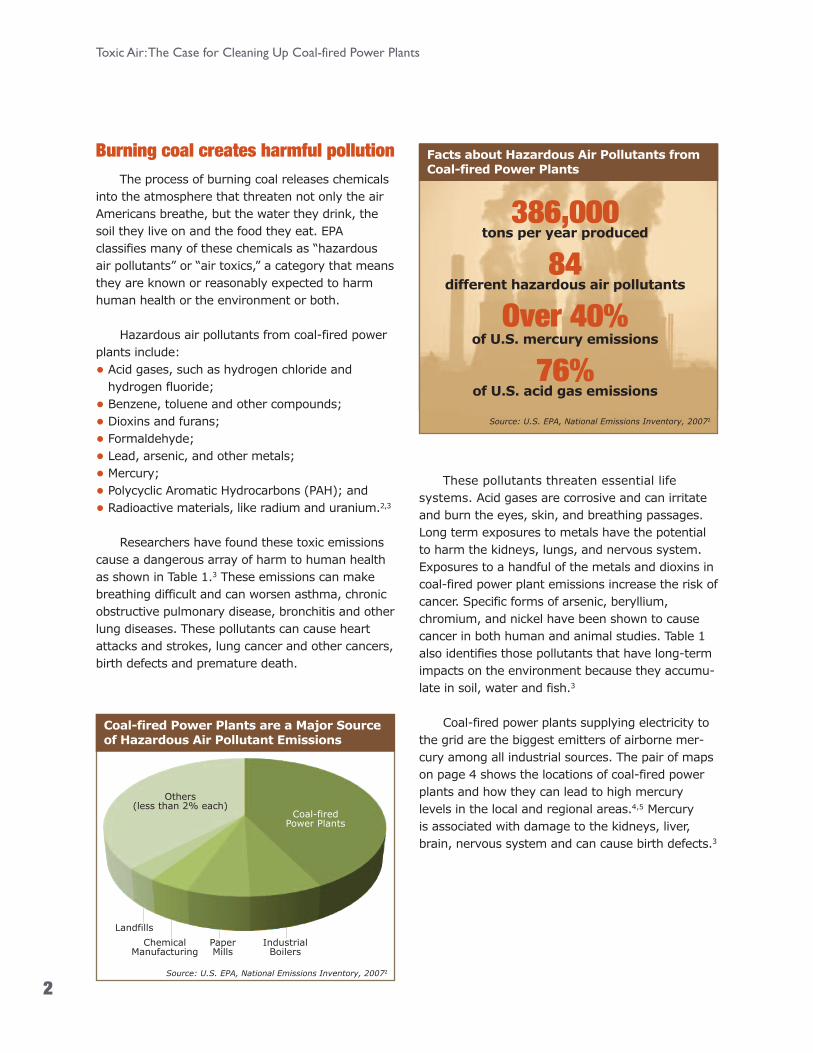
Burning coal creates harmful pollutionThe process of burning coal releases chemicals
into the atmosphere that threaten not only the air
Americans breathe, but the water they drink, the
soil they live on and the food they eat. EPA
classifies many of these chemicals as “hazardous
air pollutants” or “air toxics,” a category that means
they are known or reasonably expected to harm
human health or the environment or both.
Hazardous air pollutants from coal-fired power
plants include:
• Acid gases, such as hydrogen chloride and
hydrogen fluoride;
• Benzene, toluene and other compounds;
• Dioxins and furans;
• Formaldehyde;
• Lead, arsenic, and other metals;
• Mercury;
• Polycyclic Aromatic Hydrocarbons (PAH); and
• Radioactive materials, like radium and uranium.2,3
Researchers have found these toxic emissions
cause a dangerous array of harm to human health
as shown in Table 1.3 These emissions can make
breathing difficult and can worsen asthma, chronic
obstructive pulmonary disease, bronchitis and other
lung diseases. These pollutants can cause heart
attacks and strokes, lung cancer and other cancers,
birth defects and premature death.
These pollutants threaten essential life
systems. Acid gases are corrosive and can irritate
and burn the eyes, skin, and breathing passages.
Long term exposures to metals have the potential
to harm the kidneys, lungs, and nervous system.
Exposures to a handful of the metals and dioxins in
coal-fired power plant emissions increase the risk of
cancer. Specific forms of arsenic, beryllium,
chromium, and nickel have been shown to cause
cancer in both human and animal studies. Table 1
also identifies those pollutants that have long-term
impacts on the environment because they accumu-
late in soil, water and fish.3
Coal-fired power plants supplying electricity to
the grid are the biggest emitters of airborne mer-
cury among all industrial sources. The pair of maps
on page 4 shows the locations of coal-fired power
plants and how they can lead to high mercury
levels in the local and regional areas.4,5 Mercury
is associated with damage to the kidneys, liver,
brain, nervous system and can cause birth defects.3
2
Toxic Air: The Case for Cleaning Up Coal-fired Power Plants
Coal-fired Power Plants are a Major Sourceof Hazardous Air Pollutant Emissions
Source: U.S. EPA, National Emissions Inventory, 20072
Facts about Hazardous Air Pollutants fromCoal-fired Power Plants
Source: U.S. EPA, National Emissions Inventory, 20072
386,000 tons per year produced
84different hazardous air pollutants
Over 40% of U.S. mercury emissions
76%of U.S. acid gas emissions
Others(less than 2% each)
Landfills
Paper Mills
IndustrialBoilers
Coal-fired Power Plants
ChemicalManufacturing

3
American Lung Association www.LungUSA.org 1-800-LUNG-USA
Table 1 Health and Environmental Issues Associated With Hazardous Air
Pollutants (HAP) Emitted By Electric Generating Stations Fueled By Coal
Class of HAP Notable HAPs Human Health Hazards Environmental Hazards
Acid Gases Hydrogen Chloride,
Hydrogen Fluoride
Irritation to skin, eyes, nose, throat,
breathing passages
Acid precipitation,
damage to crops and forests.
Dioxins and
Furans
2,3,7,8-
tetrachlorodioxin
(TCDD)
Probable Carcinogen: Stomach and
immune system. Affects reproductive
endocrine and immune system.
Deposits into rivers, lakes and
oceans and is taken up by fish
and wildlife. Accumulates in the
food chain.
Mercury Methylmercury Damage to brain, nervous system,
kidneys and liver. Causes neurological
and developmental birth defects.
Taken up by fish and wildlife.
Accumulates in the food chain.
Non-Mercury
Metals and
Metalloids
(excluding
radioisotopes)
Antimony, Arsenic,
Beryllium, Cadmium,
Chromium Nickel,
Selenium,
Manganese
Carcinogens: lung, bladder, kidney, skin.
May adversely affect nervous,
cardiovascular, dermal, respiratory and
immune systems
Accumulates in soil and
sediments. Soluble forms may
contaminate water systems.
Lead Damages developing nervous system.
May adversely affect learning, memory
and behavior. May cause cardiovascular
and kidney effects, anemia, weakness of
ankles, wrists and fingers.
Harms plants and wildlife;
accumulates in soils and
sediments. May adversely affect
land and water ecosystems.
Polycyclic
Aromatic
Hydrocarbons
(PAH)
Benzo-a-anthracene,
Benzo-a-pyrene,
Fluoranthene,
Chrysene,
Dibenzo-a-
anthracene
Probable Carcinogens. May attach to
small particulate matter and deposit in
the lungs. May have adverse affects to
the liver, kidney, and testes.
May damage sperm cells and cause
impairment of reproduction.
Exists in vapor or particulate
phase. Accumulates in soil and
sediments
Radioisotopes Radium
Uranium
Carcinogen: lung and bone.
Bronchopneumonia, anemia, brain
abscess.
Carcinogen: lung and lymphatic system.
Kidney disease
Deposits into rivers, lakes and
oceans and is taken up by fish
and wildlife. Accumulates in soils
and sediments and in the food
chain.
Volatile
Organic
Compounds
Aromatic
hydrocarbons
including benzene,
xylene, ethylbenzene
and toluene.
Irritation of the skin, eyes, nose, throat;
difficulty in breathing; impaired function
of the lungs; delayed response to visual
stimulus; impaired memory; stomach
discomfort; and effects to the liver and
kidneys. May also cause adverse effects
to the nervous system. Benzene is a
carcinogen.
Accumulates in soil and
sediments.
Aldehydes including
formaldehyde
Probable Carcinogen: lung and
nasopharyngeal cancer. Eye, nose,
throat irritation, respiratory symptoms

Particulate matter pollution is anotherdeadly air pollutant from these plants.
Burning coal in these plants also produces fine
particles, or particulate matter. These particles
come directly from the ash and soot, but smaller
particles come from chemical reactions that emitted
gases undergo in the atmosphere. The smaller par-
ticles, those produced by fossil fuel combustion
such as coal-fired power plants, (otherwise known
as fine particles or PM2.5) worsen asthma and bron-
chitis, cause heart attacks and strokes, and in-
crease the risk of premature death. This is in part
because these fine particles can travel far deeper
into the lungs than larger ones that are filtered out
by the nose and larger airways. Health problems
from power plant emissions can occur when levels
are high over a short period or at lower levels over
longer time periods.6
The environment is also affected by these
emissions. This includes such environmental
degradation as the buildup of toxic metals; con-
tamination of rivers, lakes and oceans; degrada-
tion of culturally important monuments, such as
the Statue of Liberty and the Lincoln Memorial by
acid rain. Acid rain reaching soil and water bodies
can change their acidity or pH and alter the chem-
istry and nutrient balance in those environments.
This can lead to changes in the types of plants,
animals and microorganisms that inhabit those
areas. Hazardous air pollutants also add to pollu-
tion in rivers and streams and can cause damage
to crops, forests and, ultimately, to humans.6,7
Not all power plants are the same. There
are over 400 coal-fired power plants, each with on
average 2 to 3 individual boilers, supplying the elec-
tricity to the grid. Emissions vary depending on the
types of coal used, the types of controls in place,
and the length of time operated. Effects of the
plant emissions will vary depending on the height of
the stacks and their location relative to population
centers, topography, and weather patterns.
4
Toxic Air: The Case for Cleaning Up Coal-fired Power Plants
L e t h a l C o m b i n a t i o n sIt can sometimes be difficult
to link a health problem
to a single air pollutant
because of the complexity
of the pollution mixtures.
Different mixtures of pollutants
can be much more dangerous
than any one on its own.
Coal-fired Power Plants Contribute to Local and Regional Fall-Out of Mercury to Soil and Water
Source: National Atmospheric DepositionProgram/Mercury Deposition Network
Source: M. J. Bradley & Associates. (2010). Benchmarking Air Emis-sions of the 100 Largest Electric Power Producers in the United States.
Local and Relative Size of U.S. Power Plants
by Mercury Emissions
Mercury Emissions
2,000 lbs.
1,000 lbs.
200 lbs.
<_44-66-88-1010-1212-1414-1616-18>18
Mercury(µg/m2)

Hazardous emissions threaten health
locally and at great distances. People who live
nearest the smokestacks have historically borne
the brunt of these hazardous pollutants. For ex-
ample, acid gases, such as hydrochloric acid and
hydrofluoric acid tend to settle out within a day or
two, posing high risk to neighborhoods and towns
nearby. Mercury and sulfur dioxide emissions from
power plants also have immediate impact in the
local area. Many pollutants also travel much farther
and can be carried hundreds or even thousands
of miles from their original source. Health effects
may be experienced so far from the actual power
plants that cause-and-effect relationships can
only be determined through detailed analyses
of relationships between emissions, transport,
concentrations, exposure, and effect.3
Many metals, dioxins and other pollu-
tants adhere themselves to the fine parti-
cles. They may travel with airborne particles to
distant locations. These particles can remain in
the air for up to a week or more, travelling long
distances, being carried by winds to areas far
away from the original source. Even areas which
seem remote and pristine such as national parks
can be affected by toxic pollutants emitted many
miles away. These emissions put the quality of
the air at risk both locally and across the country.
They can be inhaled deep into the body as well.6
Some hazardous pollutants adhere to particles and travel widely.
5
American Lung Association www.LungUSA.org 1-800-LUNG-USA
Spatial Range of Impact
GlobalMercury, dioxins,
fi ne particulate matter
Source: ATSDR 2011
As=Arsenic Cd=Cadmium Se=Selenium OC=Organic Compounds
Town
Acid gases, organics, aldehydes, metals, mercury, dioxins, particulate
matter (both coarse and fi ne)
Out of StateMetals (lead, arsenic, cadmium,
chromium, manganese, selenium, nickel, radium, mercury, dioxins,
fi ne particulate matter)

6
Toxic Air: The Case for Cleaning Up Coal-fired Power Plants
Who is at risk?Everyone faces increased risk of harm from
exposure to these hazardous air pollutants.
However, many people face greater risk because
of their age, health conditions, or exposure to
the pollutants. They include:
• Children and teenagers;
• Older adults;
• Pregnant women;
• People with asthma and other lung diseases;
• People with cardiovascular diseases;
• Diabetics;
• People with low incomes;
• People who work or exercise outdoors; and
• Others with existing health problems.6,7
All too often those who have low incomes or
who are members of ethnic or racial minorities
bear a disproportionate share of the effects of air
pollution because they live closer to industrial
facilities, including power plants, and to high
traffic areas.8,9
Living closer to these plants likely puts them
at higher risk of exposure to the pollutants. For
instance, a study of mercury pollution in eastern
Ohio, found that most of the mercury pollution
there came from the power plants that ring
Steubenville, Ohio.10 An analysis of the data from
the 2000 Census found that 68 percent of the
African Americans lived within 30 miles of a coal-
fired power plant.11 One study of five power
plants in the Washington, DC, area found that
African Americans and people with less than a
high school education were among the groups
hardest hit by pollution from these plants. Nearly
50 percent of the risks for premature mortality of
power plant-related exposures were borne by the
25 percent of the population with less than high
school education.8
Cleaning up is possible and requiredby law
The most effective way to reduce these
emissions is to install cleanup technology that
provides the “maximum achievable” clean up of
the coal-fired power plants. In 1990, Congress
amended the Clean Air Act to require the EPA to
start work requiring sources to clean up 187
different pollutants recognized as “hazardous.”
EPA is finally putting these requirements in place for
the electric utility industry after two decades and as
a result of a court decision requiring them to act.12
Power Plants in 46 StatesBurn Coal to Supply Electricity
Source: EPA 2009b, EPA 2009c

7
American Lung Association www.LungUSA.org 1-800-LUNG-USA
What the rule will doCoal-fired plants and oil-fired plants that
produce 25 megawatts or more of electricity for
sale to the grid will be required to install “maxi-
mum achievable control technology” under the
new rule. New plants will be required to have the
same level of technology as the best-controlled
similar plants. Existing plants will be required to in-
stall controls that are at least as stringent as the
top 12 percent of plants in that category. The
graph below shows emission levels reported to EPA
from the “top performing” plants (top 12 percent)
compared to a random sampling of plants in 2010.
It provides clear evidence that better controls can
cut the emission of the toxic pollutants in the air.
The EPA will propose these new requirements
on or before March 16, 2011. The courts have
required the EPA to issue the final rules by No-
vember 16, 2011. All coal and oil-fired power
plants that produce 25 megawatts of power for
sale will be required to comply with this ruling,
as required by the Clean Air Act. The new regula-
tions are expected to take effect three years
from the date EPA makes them final.
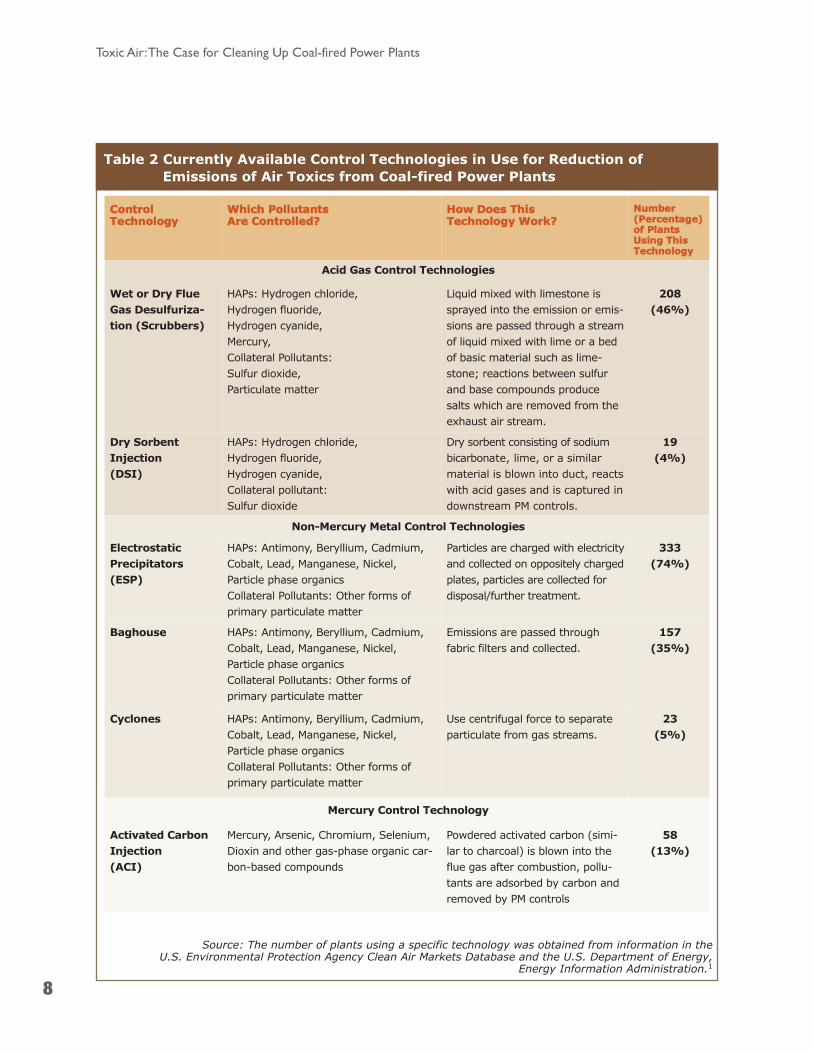
Control Technologies Are Currently Available
Control technologies to meet the require-
ments to clean up these pollutants currently
exist. In fact, many power plants use them
already. Because the pollutants are so diverse,
separate equipment is needed to target the
major groups. For example, scrubbers cut acid
gases, sulfur dioxide and particulate matter;
additional technologies work to reduce other
particles; activated carbon injection curbs mercury
emissions. Under this approach, the coal-fired
power plants will be able to select the most cost-
effective, facility-specific strategies to reduce
pollutants in their emissions. Table 2 describes
the technologies widely in use now that can be
used to comply with this rule.1
More benefits from cleaning up these hazards
More good news for cleaning up these pollu-
tants: Reducing emissions of these hazardous air
pollutants will also cut emissions of other harmful
pollutants. The same equipment needed to clean
up the 84 hazardous emissions also lowers other
harmful air pollutants, including sulfur dioxide,
fine particulate matter (PM2.5), and nitrogen
oxides. Each of these three makes breathing
difficult, causes asthma attacks and increases
the risk of emergency room and hospital visits.
But particulate matter is an even more threaten-
ing pollutant, as these microscopic particles can
cause cardiovascular disease, including heart
attacks and strokes, and can cause premature
death.6 Reductions in nitrogen oxides may also
help reduce ozone smog, another widespread
and harmful pollutant, because they are one of
the key “ingredients” in producing ozone in the
atmosphere.15
Top Performing Coal-fired Plants Emit Substantially Smaller Amounts of Hazardous Air Pollutants
Source: EPA 2009b, EPA 2009c
Percent in Coal Emitted to the Atmosphere
40%
30%
20%
10%
0%
Randomly Selected Plants
Top Performing Plants as
Designated by EPA
Mercu
ry
Antim
ony
Beryll
ium
Cadm
ium
Chrom
ium
Lead
Manga
nese
Nickel
Selen
ium
Hydro
gen
Chlor
ide
Hydro
gen
Fluor
ide
Toxic Air: The Case for Cleaning Up Coal-fired Power Plants
8
Table 2 Currently Available Control Technologies in Use for Reduction of
Emissions of Air Toxics from Coal-fired Power Plants
Control Technology
Which Pollutants Are Controlled?
How Does This Technology Work?
Number (Percentage)of PlantsUsing ThisTechnology
Acid Gas Control Technologies
Wet or Dry Flue
Gas Desulfuriza-
tion (Scrubbers)
HAPs: Hydrogen chloride,
Hydrogen fluoride,
Hydrogen cyanide,
Mercury,
Collateral Pollutants:
Sulfur dioxide,
Particulate matter
Liquid mixed with limestone is
sprayed into the emission or emis-
sions are passed through a stream
of liquid mixed with lime or a bed
of basic material such as lime-
stone; reactions between sulfur
and base compounds produce
salts which are removed from the
exhaust air stream.
208
(46%)
Dry Sorbent
Injection
(DSI)
HAPs: Hydrogen chloride,
Hydrogen fluoride,
Hydrogen cyanide,
Collateral pollutant:
Sulfur dioxide
Dry sorbent consisting of sodium
bicarbonate, lime, or a similar
material is blown into duct, reacts
with acid gases and is captured in
downstream PM controls.
19
(4%)
Non-Mercury Metal Control Technologies
Electrostatic
Precipitators
(ESP)
HAPs: Antimony, Beryllium, Cadmium,
Cobalt, Lead, Manganese, Nickel,
Particle phase organics
Collateral Pollutants: Other forms of
primary particulate matter
Particles are charged with electricity
and collected on oppositely charged
plates, particles are collected for
disposal/further treatment.
333
(74%)
Baghouse HAPs: Antimony, Beryllium, Cadmium,
Cobalt, Lead, Manganese, Nickel,
Particle phase organics
Collateral Pollutants: Other forms of
primary particulate matter
Emissions are passed through
fabric filters and collected.
157
(35%)
Cyclones HAPs: Antimony, Beryllium, Cadmium,
Cobalt, Lead, Manganese, Nickel,
Particle phase organics
Collateral Pollutants: Other forms of
primary particulate matter
Use centrifugal force to separate
particulate from gas streams.
23
(5%)
Mercury Control Technology
Activated Carbon
Injection
(ACI)
Mercury, Arsenic, Chromium, Selenium,
Dioxin and other gas-phase organic car-
bon-based compounds
Powdered activated carbon (simi-
lar to charcoal) is blown into the
flue gas after combustion, pollu-
tants are adsorbed by carbon and
removed by PM controls
58
(13%)
Source: The number of plants using a specific technology was obtained from information in the U.S. Environmental Protection Agency Clean Air Markets Database and the U.S. Department of Energy,
Energy Information Administration.1

No more delays: obey the law nowAfter 20 years, these electric utilities will
finally be required to follow the law. No longer
will these power plants be allowed to emit
pollutants that are so hazardous to human health
and the environment. This rule will hold power
plants accountable to the same standards that
other industries have been held to nationwide.
Even though the Clean Air Act Amendments of
1990 clearly set out the requirement for cleaning
up these toxic pollutants, the electric power
industry has used various loopholes and
extensions to avoid having to clean up. They
have long been one of the nation’s top polluters.
This will be the first time there will be federal
limits on air toxics from power plants. This is a
huge step towards cleaning up the air we depend
on and giving us back the air we deserve.
References1 U.S. Environmental Protection Agency (EPA). 2010. Air Toxics
Standards for Utilities: Utility MACT ICR Data. Part I & II:Final draft (version 2) of selected EU MACT ICR responsedata (excludes facility contact information), including; All PartI (General Facility Information); and All Part II (Fuel Analysisand Emission Data); including all Hg CEMs data. Web Link:http://www.epa.gov/ttn/atw/utility/utilitypg.html [Accessed11 January 2011].
2 U.S. Environmental Protection Agency (EPA). 2007. NationalEmission Inventory (NEI) 2002: Inventory Data: Point SectorData – ALLNEI HAP Annual 01232008. Web Link:http://www.epa.gov/ttn/chief/net/2002inventory.html#inventorydata [Accessed 11 January 2011].
3 Agency for Toxic Substances and Disease Registry (ATSDR).2011. Toxic Substances Portal: Toxicological Profiles. Wash-ington, DC, USA: ATSDR. Web Link:http://www.atsdr.cdc.gov/toxprofiles/index.asp [Accessed: 3February 2011].
4 M. J. Bradley & Associates. (2010). Benchmarking Air Emis-sions of the 100 Largest Electric Power Producers in theUnited States.
5 National Atmospheric Deposition Program. Mercury DepositionNetwork. Map shows total mercury wet deposition for 2006.
6 U.S. Environmental Protection Agency (EPA), 2009a. Inte-grated Science Assessment for Particulate Matter, EPA 600/R-08/139F. Available at http://cfpub.epa.gov/ncea/cfm/recordisplay.cfm?deid=216546.
7 U.S. Environmental Protection Agency (EPA). 1997. MercuryStudy Report to Congress, Volumes I – VIII: (EPA-452/R-97-003 through EPA-452/R-97-010). Washington, DC, USA: EPA.
8 Levy JI, Greco SL, Spengler JD. 2002. The importance ofpopulation susceptibility for air pollution risk assessment: acase study of power plants near Washington, DC. Environ-mental Health Perspectives. 110(12):1253-60.
9 O'Neill MS, Jerrett M, Kawachi I, Levy JI, Cohen AJ, GouveiaN, et al. 2003. Health, Wealth, and Air Pollution: AdvancingTheory and Methods. Environmental Health Perspectives111:1861-1870.
10 White EM, Keeler GJ, Landis MS. 2009. Spatial variability ofmercury wet deposition in eastern Ohio: summertime mete-orological case study analysis of local source influences. En-vironmental Science and Technology. 43(13):4946-53.
11 Georgia Coalition for the Peoples’ Agenda, Black LeadershipForum, the Southern Organizing Committee for Economicand Social Justice and Clear the Air. 2002. Air of Injustice.Access at http://www.catf.us/resources/publications/files/Air_of_Injustice.pdf.
12 United States District Court for the District of Columbia.2010. Case 1:08-cv-02198-RMC Document 33, CONSENTDECREE. Filed 04/15/10. American Nurses Association, etal., Plaintiffs, v. Lisa Jackson, Administrator, United StatesEnvironmental Protection Agency, and United States Envi-ronmental Protection Agency, Defendants.
13 U.S. Environmental Protection Agency (EPA). 2009b. Sup-porting Statement for OMB Review of EPA ICR No. 2362.01(OMB Control Number 2060-0631): Information CollectionEffort for New and Existing Coal- and Oil-Fired Electric UtilitySteam Generating Units, Part A, Final. Research TrianglePark, NC.
14 U.S. Environmental Protection Agency (EPA). 2009c. Sup-porting Statement for OMB Review of EPA ICR No. 2362.01(OMB Control Number 2060-0631): Information CollectionEffort for New and Existing Coal- and Oil-Fired Electric UtilitySteam Generating Units, Part B, Final. Research TrianglePark, NC.
15 U.S. Environmental Protection Agency (EPA). 2006. AirQuality Criteria for Ozone and Related Photochemical Oxi-dants. EPA–HQ–OAR–2005–0172.
For More Information
Find more information about power
plants in your state and take action to
support cleaning up power plants at
www.LungUSA.org/ToxicAirReport.

About the American Lung Association
Now in its second century, the American Lung Association is the leading
organization working to save lives by improving lung health and
preventing lung disease. With your generous support, the American
Lung Association is “Fighting for Air” through research, education and
advocacy. For more information about the American Lung Association,
a Four-Star Charity Navigator Charity and holder of the Better Business
Bureau Wise Giving Guide Seal,or to support the work it does, call
1-800-LUNG-USA (1-800-586-4872) or visit www.LungUSA.org.