toyota jidosha kabushiki kaisha toyota motor … · (vii) political and economic instability in the...
TRANSCRIPT
As filed with the Securities and Exchange Commission on June 24, 2016
UNITED STATESSECURITIES AND EXCHANGE COMMISSION
Washington, D.C. 20549
FORM 20-F(Mark One)‘ REGISTRATION STATEMENT PURSUANT TO SECTION 12(b) OR (g) OF THE SECURITIES EXCHANGE ACT
OF 1934OR
È ANNUAL REPORT PURSUANT TO SECTION 13 OR 15(d) OF THE SECURITIES EXCHANGE ACT OF 1934For the fiscal year ended: March 31, 2016
OR‘ TRANSITION REPORT PURSUANT TO SECTION 13 OR 15(d) OF THE SECURITIES EXCHANGE ACT OF
1934OR
‘ SHELL COMPANY REPORT PURSUANT TO SECTION 13 OR 15(d) OF THE SECURITIES EXCHANGE ACTOF 1934
Commission file number: 001-14948
TOYOTA JIDOSHA KABUSHIKI KAISHA(Exact Name of Registrant as Specified in its Charter)
TOYOTA MOTOR CORPORATION(Translation of Registrant’s Name into English)
Japan(Jurisdiction of Incorporation or Organization)
1 Toyota-cho, Toyota CityAichi Prefecture 471-8571
Japan+81 565 28-2121
(Address of Principal Executive Offices)Nobukazu Takano
Telephone number: +81 565 28-2121Facsimile number: +81 565 23-5800
Address: 1 Toyota-cho, Toyota City, Aichi Prefecture 471-8571, Japan(Name, telephone, e-mail and/or facsimile number and address of registrant’s contact person)
Securities registered or to be registered pursuant to Section 12(b) of the Act:Title of Each Class: Name of Each Exchange on Which Registered:
American Depositary Shares* The New York Stock ExchangeCommon Stock**
* American Depositary Receipts evidence American Depositary Shares, each American Depositary Share representing two shares of the registrant’s Common Stock.** No par value. Not for trading, but only in connection with the registration of American Depositary Shares, pursuant to the requirements of the U.S. Securities and
Exchange Commission.Securities registered or to be registered pursuant to Section 12(g) of the Act:
NoneSecurities for which there is a reporting obligation pursuant to Section 15(d) of the Act:
NoneIndicate the number of outstanding shares of each of the issuer’s classes of capital or common stock as of the close of the period covered by the
annual report: 3,037,675,870 shares of common stock (including 66,933,269 shares of common stock in the form of American Depositary Shares)and 47,100,000 First Series Model AA class shares as of March 31, 2016
Indicate by check mark if the registrant is a well-known seasoned issuer, as defined in Rule 405 of the Securities Act: Yes È No ‘If this report is an annual or transition report, indicate by check mark if the registrant is not required to file reports pursuant to Section 13 or 15(d) of
the Securities Exchange Act of 1934: Yes ‘ No ÈIndicate by check mark whether the registrant (1) has filed all reports required to be filed by Section 13 or 15(d) of the Securities Exchange Act of
1934 during the preceding 12 months (or for such shorter period that the registrant was required to file such reports), and (2) has been subject to such filingrequirements for the past 90 days: Yes È No ‘
Indicate by check mark whether the registrant has submitted electronically and posted on its corporate Web site, if any, every Interactive Data Filerequired to be submitted and posted pursuant to Rule 405 of Regulation S-T (§232.405 of this chapter) during the preceding 12 months (or for such shorterperiod that the registrant was required to submit and post such files): Yes È No ‘
Indicate by check mark whether the registrant is a large accelerated filer, an accelerated filer, or a non-accelerated filer. See definition of “acceleratedfiler and large accelerated filer” in Rule 12b-2 of the Exchange Act. (Check one):
Large accelerated filer È Accelerated filer ‘ Non-accelerated filer ‘Indicate by check mark which basis of accounting the registrant has used to prepare the financial statements included in this filing:
U.S. GAAP È International Financial Reporting Standards as issued by the International Accounting Standards Board ‘ Other ‘If “Other” has been checked in response to the previous question, indicate by check mark which financial statement item the registrant has elected to
follow: Item 17 ‘ Item 18 ‘If this is an annual report, indicate by check mark whether the registrant is a shell company (as defined in Rule 12b-2 of the Exchange
Act): Yes ‘ No È
TABLE OF CONTENTS
ITEM 1. IDENTITY OF DIRECTORS, SENIOR MANAGEMENT AND ADVISERS . . . . . . . . . . 1
ITEM 2. OFFER STATISTICS AND EXPECTED TIMETABLE . . . . . . . . . . . . . . . . . . . . . . . . . . . 1
ITEM 3. KEY INFORMATION . . . . . . . . . . . . . . . . . . . . . . . . . . . . . . . . . . . . . . . . . . . . . . . . . . . . . 1
3.A SELECTED FINANCIAL DATA . . . . . . . . . . . . . . . . . . . . . . . . . . . . . . . . . . . . . . . . . . . . 13.B CAPITALIZATION AND INDEBTEDNESS . . . . . . . . . . . . . . . . . . . . . . . . . . . . . . . . . . . 43.C REASONS FOR THE OFFER AND USE OF PROCEEDS . . . . . . . . . . . . . . . . . . . . . . . . 53.D RISK FACTORS . . . . . . . . . . . . . . . . . . . . . . . . . . . . . . . . . . . . . . . . . . . . . . . . . . . . . . . . . . 5
ITEM 4. INFORMATION ON THE COMPANY . . . . . . . . . . . . . . . . . . . . . . . . . . . . . . . . . . . . . . . 8
4.A HISTORY AND DEVELOPMENT OF THE COMPANY . . . . . . . . . . . . . . . . . . . . . . . . . 84.B BUSINESS OVERVIEW . . . . . . . . . . . . . . . . . . . . . . . . . . . . . . . . . . . . . . . . . . . . . . . . . . . 94.C ORGANIZATIONAL STRUCTURE . . . . . . . . . . . . . . . . . . . . . . . . . . . . . . . . . . . . . . . . . . 524.D PROPERTY, PLANTS AND EQUIPMENT . . . . . . . . . . . . . . . . . . . . . . . . . . . . . . . . . . . . 53
ITEM 4A. UNRESOLVED STAFF COMMENTS . . . . . . . . . . . . . . . . . . . . . . . . . . . . . . . . . . . . . . . . 54
ITEM 5. OPERATING AND FINANCIAL REVIEW AND PROSPECTS . . . . . . . . . . . . . . . . . . . . 54
5.A OPERATING RESULTS . . . . . . . . . . . . . . . . . . . . . . . . . . . . . . . . . . . . . . . . . . . . . . . . . . . 545.B LIQUIDITY AND CAPITAL RESOURCES . . . . . . . . . . . . . . . . . . . . . . . . . . . . . . . . . . . . 875.C RESEARCH AND DEVELOPMENT, PATENTS AND LICENSES . . . . . . . . . . . . . . . . . 905.D TREND INFORMATION . . . . . . . . . . . . . . . . . . . . . . . . . . . . . . . . . . . . . . . . . . . . . . . . . . . 925.E OFF-BALANCE SHEET ARRANGEMENTS . . . . . . . . . . . . . . . . . . . . . . . . . . . . . . . . . . 925.F TABULAR DISCLOSURE OF CONTRACTUAL OBLIGATIONS . . . . . . . . . . . . . . . . . 935.G SAFE HARBOR . . . . . . . . . . . . . . . . . . . . . . . . . . . . . . . . . . . . . . . . . . . . . . . . . . . . . . . . . . 94
ITEM 6. DIRECTORS, SENIOR MANAGEMENT AND EMPLOYEES . . . . . . . . . . . . . . . . . . . . 94
6.A DIRECTORS AND SENIOR MANAGEMENT . . . . . . . . . . . . . . . . . . . . . . . . . . . . . . . . . 946.B COMPENSATION . . . . . . . . . . . . . . . . . . . . . . . . . . . . . . . . . . . . . . . . . . . . . . . . . . . . . . . . 1026.C BOARD PRACTICES . . . . . . . . . . . . . . . . . . . . . . . . . . . . . . . . . . . . . . . . . . . . . . . . . . . . . 1036.D EMPLOYEES . . . . . . . . . . . . . . . . . . . . . . . . . . . . . . . . . . . . . . . . . . . . . . . . . . . . . . . . . . . . 1046.E SHARE OWNERSHIP . . . . . . . . . . . . . . . . . . . . . . . . . . . . . . . . . . . . . . . . . . . . . . . . . . . . . 105
ITEM 7. MAJOR SHAREHOLDERS AND RELATED PARTY TRANSACTIONS . . . . . . . . . . . . 106
7.A MAJOR SHAREHOLDERS . . . . . . . . . . . . . . . . . . . . . . . . . . . . . . . . . . . . . . . . . . . . . . . . . 1067.B RELATED PARTY TRANSACTIONS . . . . . . . . . . . . . . . . . . . . . . . . . . . . . . . . . . . . . . . . 1077.C INTERESTS OF EXPERTS AND COUNSEL . . . . . . . . . . . . . . . . . . . . . . . . . . . . . . . . . . 107
ITEM 8. FINANCIAL INFORMATION . . . . . . . . . . . . . . . . . . . . . . . . . . . . . . . . . . . . . . . . . . . . . . 107
8.A CONSOLIDATED STATEMENTS AND OTHER FINANCIAL INFORMATION . . . . . 1078.B SIGNIFICANT CHANGES . . . . . . . . . . . . . . . . . . . . . . . . . . . . . . . . . . . . . . . . . . . . . . . . . 108
ITEM 9. THE OFFER AND LISTING . . . . . . . . . . . . . . . . . . . . . . . . . . . . . . . . . . . . . . . . . . . . . . . . 108
9.A LISTING DETAILS . . . . . . . . . . . . . . . . . . . . . . . . . . . . . . . . . . . . . . . . . . . . . . . . . . . . . . . 1089.B PLAN OF DISTRIBUTION . . . . . . . . . . . . . . . . . . . . . . . . . . . . . . . . . . . . . . . . . . . . . . . . . 1089.C MARKETS . . . . . . . . . . . . . . . . . . . . . . . . . . . . . . . . . . . . . . . . . . . . . . . . . . . . . . . . . . . . . . 1099.D SELLING SHAREHOLDERS . . . . . . . . . . . . . . . . . . . . . . . . . . . . . . . . . . . . . . . . . . . . . . . 1099.E DILUTION . . . . . . . . . . . . . . . . . . . . . . . . . . . . . . . . . . . . . . . . . . . . . . . . . . . . . . . . . . . . . . 1099.F EXPENSES OF THE ISSUE . . . . . . . . . . . . . . . . . . . . . . . . . . . . . . . . . . . . . . . . . . . . . . . . 109
ITEM 10. ADDITIONAL INFORMATION . . . . . . . . . . . . . . . . . . . . . . . . . . . . . . . . . . . . . . . . . . . . . 109
10.A SHARE CAPITAL . . . . . . . . . . . . . . . . . . . . . . . . . . . . . . . . . . . . . . . . . . . . . . . . . . . . . . . . 10910.B MEMORANDUM AND ARTICLES OF ASSOCIATION . . . . . . . . . . . . . . . . . . . . . . . . . 10910.C MATERIAL CONTRACTS . . . . . . . . . . . . . . . . . . . . . . . . . . . . . . . . . . . . . . . . . . . . . . . . . 11710.D EXCHANGE CONTROLS . . . . . . . . . . . . . . . . . . . . . . . . . . . . . . . . . . . . . . . . . . . . . . . . . . 117
10.E TAXATION . . . . . . . . . . . . . . . . . . . . . . . . . . . . . . . . . . . . . . . . . . . . . . . . . . . . . . . . . . . . . 11810.F DIVIDENDS AND PAYING AGENTS . . . . . . . . . . . . . . . . . . . . . . . . . . . . . . . . . . . . . . . . 12410.G STATEMENT BY EXPERTS . . . . . . . . . . . . . . . . . . . . . . . . . . . . . . . . . . . . . . . . . . . . . . . 12410.H DOCUMENTS ON DISPLAY . . . . . . . . . . . . . . . . . . . . . . . . . . . . . . . . . . . . . . . . . . . . . . . 12410.I SUBSIDIARY INFORMATION . . . . . . . . . . . . . . . . . . . . . . . . . . . . . . . . . . . . . . . . . . . . . 124
ITEM 11. QUANTITATIVE AND QUALITATIVE DISCLOSURES ABOUT MARKET RISK . . . 124
ITEM 12. DESCRIPTION OF SECURITIES OTHER THAN EQUITY SECURITIES . . . . . . . . . . . 126
12.A DEBT SECURITIES . . . . . . . . . . . . . . . . . . . . . . . . . . . . . . . . . . . . . . . . . . . . . . . . . . . . . . . 12612.B WARRANTS AND RIGHTS . . . . . . . . . . . . . . . . . . . . . . . . . . . . . . . . . . . . . . . . . . . . . . . . 12612.C OTHER SECURITIES . . . . . . . . . . . . . . . . . . . . . . . . . . . . . . . . . . . . . . . . . . . . . . . . . . . . . 12612.D AMERICAN DEPOSITARY SHARES . . . . . . . . . . . . . . . . . . . . . . . . . . . . . . . . . . . . . . . . 126
ITEM 13. DEFAULTS, DIVIDEND ARREARAGES AND DELINQUENCIES . . . . . . . . . . . . . . . . 128
ITEM 14. MATERIAL MODIFICATIONS TO THE RIGHTS OF SECURITY HOLDERS ANDUSE OF PROCEEDS . . . . . . . . . . . . . . . . . . . . . . . . . . . . . . . . . . . . . . . . . . . . . . . . . . . . . . 128
ITEM 15. CONTROLS AND PROCEDURES . . . . . . . . . . . . . . . . . . . . . . . . . . . . . . . . . . . . . . . . . . . 128
ITEM 16. [RESERVED] . . . . . . . . . . . . . . . . . . . . . . . . . . . . . . . . . . . . . . . . . . . . . . . . . . . . . . . . . . . . 129
ITEM 16A. AUDIT COMMITTEE FINANCIAL EXPERT . . . . . . . . . . . . . . . . . . . . . . . . . . . . . . . . . . 129
ITEM 16B. CODE OF ETHICS . . . . . . . . . . . . . . . . . . . . . . . . . . . . . . . . . . . . . . . . . . . . . . . . . . . . . . . . 129
ITEM 16C. PRINCIPAL ACCOUNTANT FEES AND SERVICES . . . . . . . . . . . . . . . . . . . . . . . . . . . 130
ITEM 16D. EXEMPTIONS FROM THE LISTING STANDARDS FOR AUDIT COMMITTEES . . . 131
ITEM 16E. PURCHASES OF EQUITY SECURITIES BY THE ISSUER AND AFFILIATEDPURCHASERS . . . . . . . . . . . . . . . . . . . . . . . . . . . . . . . . . . . . . . . . . . . . . . . . . . . . . . . . . . . 131
ITEM 16F. CHANGE IN REGISTRANT’S CERTIFYING ACCOUNTANT . . . . . . . . . . . . . . . . . . . 132
ITEM 16G. CORPORATE GOVERNANCE . . . . . . . . . . . . . . . . . . . . . . . . . . . . . . . . . . . . . . . . . . . . . . 132
ITEM 16H. MINE SAFETY DISCLOSURE . . . . . . . . . . . . . . . . . . . . . . . . . . . . . . . . . . . . . . . . . . . . . . 135
ITEM 17. FINANCIAL STATEMENTS . . . . . . . . . . . . . . . . . . . . . . . . . . . . . . . . . . . . . . . . . . . . . . . 136
ITEM 18. FINANCIAL STATEMENTS . . . . . . . . . . . . . . . . . . . . . . . . . . . . . . . . . . . . . . . . . . . . . . . 136
ITEM 19. EXHIBITS . . . . . . . . . . . . . . . . . . . . . . . . . . . . . . . . . . . . . . . . . . . . . . . . . . . . . . . . . . . . . . . 137
As used in this annual report, the term “fiscal” preceding a year means the twelve-month period endedMarch 31 of the year referred to. All other references to years refer to the applicable calendar year, unless thecontext otherwise requires. As used herein, the term “Toyota” refers to Toyota Motor Corporation and itsconsolidated subsidiaries as a group, unless the context otherwise indicates.
In parts of this annual report, amounts reported in Japanese yen have been translated into U.S. dollars for theconvenience of readers. Unless otherwise noted, the rate used for this translation was ¥112.68 = $1.00. This wasthe approximate exchange rate in Japan on March 31, 2016.
CAUTIONARY STATEMENT WITH RESPECT TO FORWARD-LOOKING STATEMENTS
Written forward-looking statements may appear in documents filed with the Securities and ExchangeCommission, or the SEC, including this annual report, documents incorporated by reference, reports toshareholders and other communications.
The U.S. Private Securities Litigation Reform Act of 1995 provides a “safe harbor” for forward-lookinginformation to encourage companies to provide prospective information about themselves without fear oflitigation so long as the information is identified as forward looking and is accompanied by meaningfulcautionary statements identifying important factors that could cause actual results to differ materially from thoseprojected in the information. Toyota relies on this safe harbor in making forward-looking statements.
Forward-looking statements appear in a number of places in this annual report and include statementsregarding Toyota’s current intent, belief, targets or expectations or those of its management. In many, but not allcases, words such as “aim,” “anticipate,” “believe,” “estimate,” “expect,” “hope,” “intend,” “may,” “plan,”“predict,” “probability,” “risk,” “should,” “will,” “would,” and similar expressions, are used as they relate toToyota or its management, to identify forward-looking statements. These statements reflect Toyota’s currentviews with respect to future events and are subject to risks, uncertainties and assumptions. Should one or more ofthese risks or uncertainties materialize or should underlying assumptions prove incorrect, actual results may varymaterially from those which are anticipated, aimed at, believed, estimated, expected, intended or planned.
Forward-looking statements are not guarantees of future performance and involve risks and uncertainties.Actual results may differ from those in forward-looking statements as a result of various factors. Importantfactors that could cause actual results to differ materially from estimates or forecasts contained in theforward-looking statements are identified in “Risk Factors” and elsewhere in this annual report, and include,among others:
(i) changes in economic conditions, market demand, and the competitive environment affecting theautomotive markets in Japan, North America, Europe, Asia and other markets in which Toyota operates;
(ii) fluctuations in currency exchange rates, particularly with respect to the value of the Japanese yen,the U.S. dollar, the euro, the Australian dollar, the Russian ruble, the Canadian dollar and the British pound,and interest rates fluctuations;
(iii) changes in funding environment in financial markets and increased competition in the financialservices industry;
(iv) Toyota’s ability to market and distribute effectively;
(v) Toyota’s ability to realize production efficiencies and to implement capital expenditures at thelevels and times planned by management;
(vi) changes in the laws, regulations and government policies in the markets in which Toyota operatesthat affect Toyota’s automotive operations, particularly laws, regulations and government policies relatingto vehicle safety including remedial measures such as recalls, trade, environmental protection, vehicleemissions and vehicle fuel economy, as well as changes in laws, regulations and government policies thataffect Toyota’s other operations, including the outcome of current and future litigation and other legalproceedings, government proceedings and investigations;
(vii) political and economic instability in the markets in which Toyota operates;
(viii) Toyota’s ability to timely develop and achieve market acceptance of new products that meetcustomer demand;
(ix) any damage to Toyota’s brand image;
(x) Toyota’s reliance on various suppliers for the provision of supplies;
(xi) increases in prices of raw materials;
(xii) Toyota’s reliance on various digital and information technologies;
(xiii) fuel shortages or interruptions in electricity, transportation systems, labor strikes, work stoppagesor other interruptions to, or difficulties in, the employment of labor in the major markets where Toyotapurchases materials, components and supplies for the production of its products or where its products areproduced, distributed or sold; and
(xiv) the impact of natural calamities including the negative effect on Toyota’s vehicle production andsales.
PART I
ITEM 1. IDENTITY OF DIRECTORS, SENIOR MANAGEMENT AND ADVISERS
Not applicable.
ITEM 2. OFFER STATISTICS AND EXPECTED TIMETABLE
Not applicable.
ITEM 3. KEY INFORMATION
3.A SELECTED FINANCIAL DATA
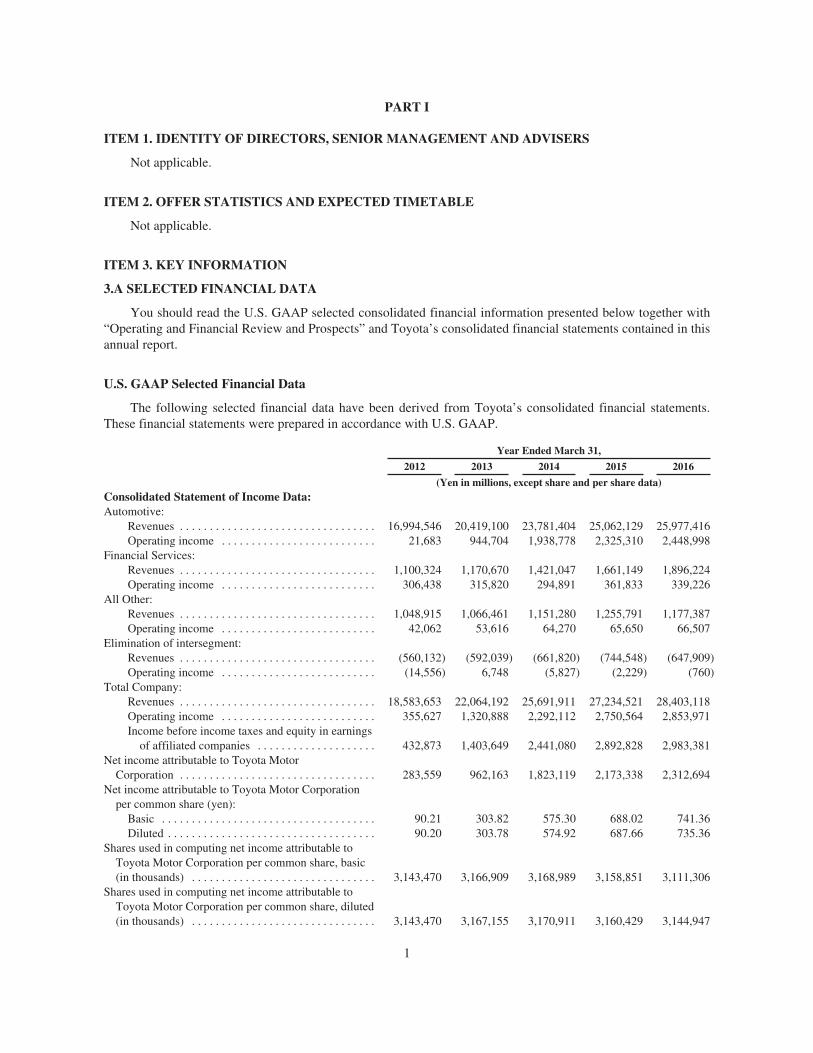
You should read the U.S. GAAP selected consolidated financial information presented below together with“Operating and Financial Review and Prospects” and Toyota’s consolidated financial statements contained in thisannual report.
U.S. GAAP Selected Financial Data
The following selected financial data have been derived from Toyota’s consolidated financial statements.These financial statements were prepared in accordance with U.S. GAAP.
Year Ended March 31,
2012 2013 2014 2015 2016
(Yen in millions, except share and per share data)Consolidated Statement of Income Data:Automotive:
Revenues . . . . . . . . . . . . . . . . . . . . . . . . . . . . . . . . . 16,994,546 20,419,100 23,781,404 25,062,129 25,977,416Operating income . . . . . . . . . . . . . . . . . . . . . . . . . . 21,683 944,704 1,938,778 2,325,310 2,448,998
Financial Services:Revenues . . . . . . . . . . . . . . . . . . . . . . . . . . . . . . . . . 1,100,324 1,170,670 1,421,047 1,661,149 1,896,224Operating income . . . . . . . . . . . . . . . . . . . . . . . . . . 306,438 315,820 294,891 361,833 339,226
All Other:Revenues . . . . . . . . . . . . . . . . . . . . . . . . . . . . . . . . . 1,048,915 1,066,461 1,151,280 1,255,791 1,177,387Operating income . . . . . . . . . . . . . . . . . . . . . . . . . . 42,062 53,616 64,270 65,650 66,507
Elimination of intersegment:Revenues . . . . . . . . . . . . . . . . . . . . . . . . . . . . . . . . . (560,132) (592,039) (661,820) (744,548) (647,909)Operating income . . . . . . . . . . . . . . . . . . . . . . . . . . (14,556) 6,748 (5,827) (2,229) (760)
Total Company:Revenues . . . . . . . . . . . . . . . . . . . . . . . . . . . . . . . . . 18,583,653 22,064,192 25,691,911 27,234,521 28,403,118Operating income . . . . . . . . . . . . . . . . . . . . . . . . . . 355,627 1,320,888 2,292,112 2,750,564 2,853,971Income before income taxes and equity in earnings
of affiliated companies . . . . . . . . . . . . . . . . . . . . 432,873 1,403,649 2,441,080 2,892,828 2,983,381Net income attributable to Toyota Motor
Corporation . . . . . . . . . . . . . . . . . . . . . . . . . . . . . . . . . 283,559 962,163 1,823,119 2,173,338 2,312,694Net income attributable to Toyota Motor Corporation
per common share (yen):Basic . . . . . . . . . . . . . . . . . . . . . . . . . . . . . . . . . . . . 90.21 303.82 575.30 688.02 741.36Diluted . . . . . . . . . . . . . . . . . . . . . . . . . . . . . . . . . . . 90.20 303.78 574.92 687.66 735.36
Shares used in computing net income attributable toToyota Motor Corporation per common share, basic(in thousands) . . . . . . . . . . . . . . . . . . . . . . . . . . . . . . . 3,143,470 3,166,909 3,168,989 3,158,851 3,111,306
Shares used in computing net income attributable toToyota Motor Corporation per common share, diluted(in thousands) . . . . . . . . . . . . . . . . . . . . . . . . . . . . . . . 3,143,470 3,167,155 3,170,911 3,160,429 3,144,947
1
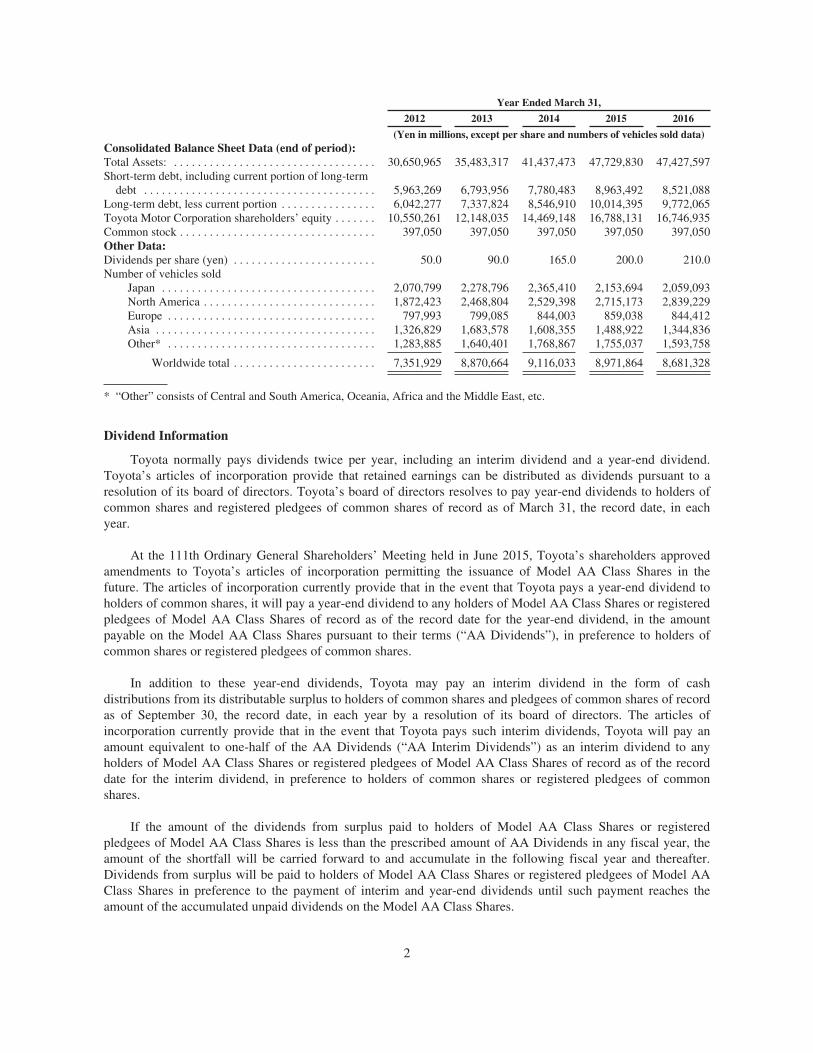
Year Ended March 31,
2012 2013 2014 2015 2016
(Yen in millions, except per share and numbers of vehicles sold data)Consolidated Balance Sheet Data (end of period):Total Assets: . . . . . . . . . . . . . . . . . . . . . . . . . . . . . . . . . . 30,650,965 35,483,317 41,437,473 47,729,830 47,427,597Short-term debt, including current portion of long-term
debt . . . . . . . . . . . . . . . . . . . . . . . . . . . . . . . . . . . . . . . 5,963,269 6,793,956 7,780,483 8,963,492 8,521,088Long-term debt, less current portion . . . . . . . . . . . . . . . . 6,042,277 7,337,824 8,546,910 10,014,395 9,772,065Toyota Motor Corporation shareholders’ equity . . . . . . . 10,550,261 12,148,035 14,469,148 16,788,131 16,746,935Common stock . . . . . . . . . . . . . . . . . . . . . . . . . . . . . . . . . 397,050 397,050 397,050 397,050 397,050Other Data:Dividends per share (yen) . . . . . . . . . . . . . . . . . . . . . . . . 50.0 90.0 165.0 200.0 210.0Number of vehicles sold
Japan . . . . . . . . . . . . . . . . . . . . . . . . . . . . . . . . . . . . 2,070,799 2,278,796 2,365,410 2,153,694 2,059,093North America . . . . . . . . . . . . . . . . . . . . . . . . . . . . . 1,872,423 2,468,804 2,529,398 2,715,173 2,839,229Europe . . . . . . . . . . . . . . . . . . . . . . . . . . . . . . . . . . . 797,993 799,085 844,003 859,038 844,412Asia . . . . . . . . . . . . . . . . . . . . . . . . . . . . . . . . . . . . . 1,326,829 1,683,578 1,608,355 1,488,922 1,344,836Other* . . . . . . . . . . . . . . . . . . . . . . . . . . . . . . . . . . . 1,283,885 1,640,401 1,768,867 1,755,037 1,593,758
Worldwide total . . . . . . . . . . . . . . . . . . . . . . . . 7,351,929 8,870,664 9,116,033 8,971,864 8,681,328
* “Other” consists of Central and South America, Oceania, Africa and the Middle East, etc.
Dividend Information
Toyota normally pays dividends twice per year, including an interim dividend and a year-end dividend.Toyota’s articles of incorporation provide that retained earnings can be distributed as dividends pursuant to aresolution of its board of directors. Toyota’s board of directors resolves to pay year-end dividends to holders ofcommon shares and registered pledgees of common shares of record as of March 31, the record date, in eachyear.
At the 111th Ordinary General Shareholders’ Meeting held in June 2015, Toyota’s shareholders approvedamendments to Toyota’s articles of incorporation permitting the issuance of Model AA Class Shares in thefuture. The articles of incorporation currently provide that in the event that Toyota pays a year-end dividend toholders of common shares, it will pay a year-end dividend to any holders of Model AA Class Shares or registeredpledgees of Model AA Class Shares of record as of the record date for the year-end dividend, in the amountpayable on the Model AA Class Shares pursuant to their terms (“AA Dividends”), in preference to holders ofcommon shares or registered pledgees of common shares.
In addition to these year-end dividends, Toyota may pay an interim dividend in the form of cashdistributions from its distributable surplus to holders of common shares and pledgees of common shares of recordas of September 30, the record date, in each year by a resolution of its board of directors. The articles ofincorporation currently provide that in the event that Toyota pays such interim dividends, Toyota will pay anamount equivalent to one-half of the AA Dividends (“AA Interim Dividends”) as an interim dividend to anyholders of Model AA Class Shares or registered pledgees of Model AA Class Shares of record as of the recorddate for the interim dividend, in preference to holders of common shares or registered pledgees of commonshares.
If the amount of the dividends from surplus paid to holders of Model AA Class Shares or registeredpledgees of Model AA Class Shares is less than the prescribed amount of AA Dividends in any fiscal year, theamount of the shortfall will be carried forward to and accumulate in the following fiscal year and thereafter.Dividends from surplus will be paid to holders of Model AA Class Shares or registered pledgees of Model AAClass Shares in preference to the payment of interim and year-end dividends until such payment reaches theamount of the accumulated unpaid dividends on the Model AA Class Shares.
2
For a further discussion of Model AA Class Shares, please see “Additional Information — Memorandumand Articles of Association.”
In addition, under the Companies Act of Japan (the “Companies Act”), dividends may be paid to holders ofcommon shares and pledgees of record of common shares as of any record date, other than those specified above,as set forth in Toyota’s articles of incorporation or as determined by its board of directors from time to time.Under the Companies Act, dividends may be distributed in cash or (except in the case of interim dividendsmentioned in the third preceding paragraph) in kind, subject to limitations on distributable surplus and to certainother conditions.
The following table sets forth the dividends declared per common share by Toyota for each of the periodsshown. The periods shown are the six months ended on that date. The U.S. dollar equivalents for the cashdividends shown are based on the noon buying rate for Japanese yen on the last date of each period set forthbelow.
Cash Dividends per CommonShare
Period Ended Yen U.S. dollars
September 30, 2011 . . . . . . . . . . . . . . . . . . . . . . . . . . . . . . . . . . . . . . . . . . . . . . . . . . . 20.0 0.25March 31, 2012 . . . . . . . . . . . . . . . . . . . . . . . . . . . . . . . . . . . . . . . . . . . . . . . . . . . . . . . 30.0 0.36September 30, 2012 . . . . . . . . . . . . . . . . . . . . . . . . . . . . . . . . . . . . . . . . . . . . . . . . . . . 30.0 0.38March 31, 2013 . . . . . . . . . . . . . . . . . . . . . . . . . . . . . . . . . . . . . . . . . . . . . . . . . . . . . . . 60.0 0.63September 30, 2013 . . . . . . . . . . . . . . . . . . . . . . . . . . . . . . . . . . . . . . . . . . . . . . . . . . . 65.0 0.66March 31, 2014 . . . . . . . . . . . . . . . . . . . . . . . . . . . . . . . . . . . . . . . . . . . . . . . . . . . . . . . 100.0 0.97September 30, 2014 . . . . . . . . . . . . . . . . . . . . . . . . . . . . . . . . . . . . . . . . . . . . . . . . . . . 75.0 0.68March 31, 2015 . . . . . . . . . . . . . . . . . . . . . . . . . . . . . . . . . . . . . . . . . . . . . . . . . . . . . . . 125.0 1.04September 30, 2015 . . . . . . . . . . . . . . . . . . . . . . . . . . . . . . . . . . . . . . . . . . . . . . . . . . . 100.0 0.83March 31, 2016 . . . . . . . . . . . . . . . . . . . . . . . . . . . . . . . . . . . . . . . . . . . . . . . . . . . . . . . 110.0 0.97
Toyota deems the benefit of its shareholders as one of its priority management policies, and it continues towork to improve its corporate structure to realize sustainable growth in order to enhance its corporate value.Toyota will strive to continue to pay stable dividends on its common shares aiming at a consolidated dividendpayout ratio, defined as dividends per common share divided by net income attributable to Toyota MotorCorporation per common share, of 30% while giving due consideration to factors such as business results foreach term, investment plans and its cash reserves. Toyota will pay dividends on the First Series Model AA ClassShares in accordance with a prescribed calculation method.
In order to successfully compete in this highly competitive industry, Toyota plans to utilize its internal fundsfor the early commercialization of technologies for next-generation environment and safety giving priority tocustomer safety and sense of security. Considering these factors, with respect to the dividends for fiscal 2016,Toyota has determined to pay a year-end dividend of 110 yen per common share by a resolution of the board ofdirectors pursuant to Toyota’s articles of incorporation. As a result, combined with the interim dividend of 100yen per common share, the annual dividend will be 210 yen per common share, and the total amount of thedividends on common shares for the year will be 645.5 billion yen. Furthermore, through repurchasing shares,Toyota will return capital to shareholders and promote capital efficiency and agile capital policy in view of thebusiness environment.
In fiscal 2016, Toyota repurchased 39 million common shares, for an aggregate purchase price of 293.3billion yen, in order to return to shareholders the profits derived from Toyota’s business operations in the fiscalyear ended March 31, 2015 and repurchased 23 million common shares, for an aggregate purchase price of 139.3billion yen, in order to return to shareholders the profits derived from Toyota’s business operations in the interimperiod ended September 30, 2015.
3
In addition, in fiscal 2016, Toyota repurchased 47 million common shares, for an aggregate purchase priceof 349.9 billion yen, in order to avoid dilution of common shares as a result of the issuance of the First SeriesModel AA Class Shares.
Furthermore, Toyota has determined to repurchase 100 million common shares (maximum), for anaggregate purchase price of 500.0 billion yen (maximum), in order to return to shareholders the profits derivedfrom Toyota’s business operations in the second half of the fiscal year ended March 31, 2016 by a resolution ofthe board of directors on May 11, 2016.
Exchange Rates
In parts of this annual report, yen amounts have been translated into U.S. dollars for the convenience ofinvestors. Unless otherwise noted, the rate used for the translations was ¥112.68 = $1.00. This was theapproximate exchange rate in Japan on March 31, 2016.
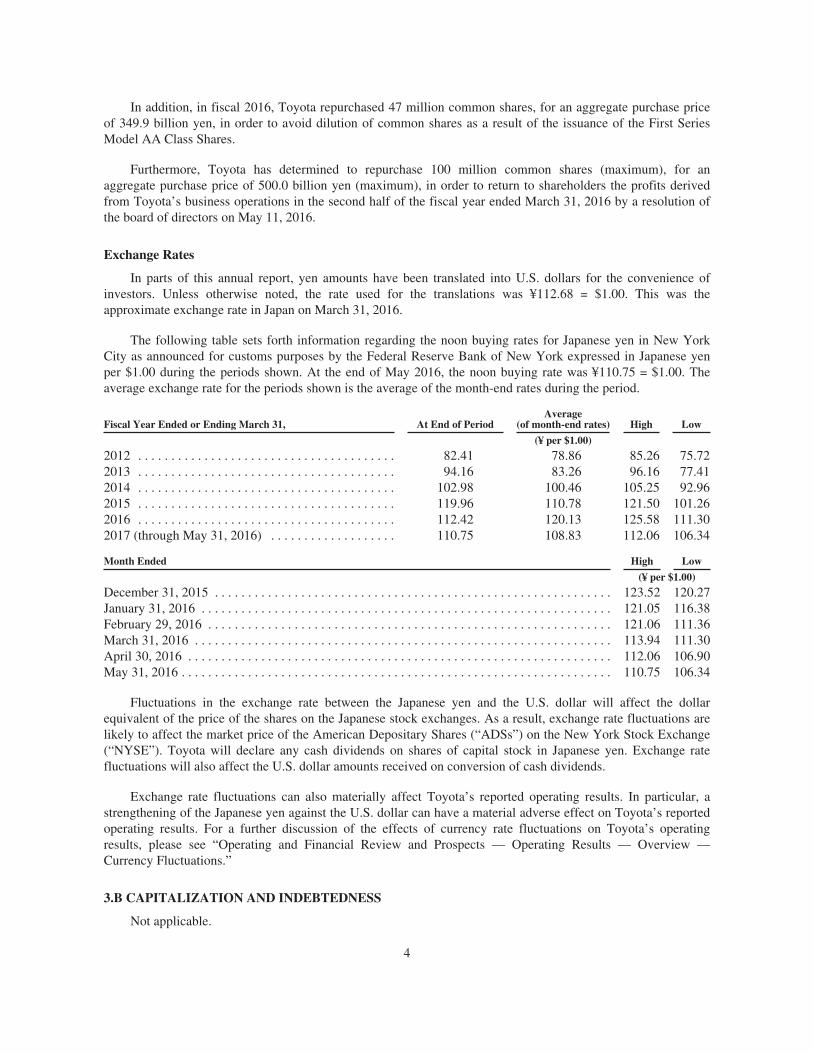
The following table sets forth information regarding the noon buying rates for Japanese yen in New YorkCity as announced for customs purposes by the Federal Reserve Bank of New York expressed in Japanese yenper $1.00 during the periods shown. At the end of May 2016, the noon buying rate was ¥110.75 = $1.00. Theaverage exchange rate for the periods shown is the average of the month-end rates during the period.
Fiscal Year Ended or Ending March 31, At End of PeriodAverage
(of month-end rates) High Low
(¥ per $1.00)
2012 . . . . . . . . . . . . . . . . . . . . . . . . . . . . . . . . . . . . . . . 82.41 78.86 85.26 75.722013 . . . . . . . . . . . . . . . . . . . . . . . . . . . . . . . . . . . . . . . 94.16 83.26 96.16 77.412014 . . . . . . . . . . . . . . . . . . . . . . . . . . . . . . . . . . . . . . . 102.98 100.46 105.25 92.962015 . . . . . . . . . . . . . . . . . . . . . . . . . . . . . . . . . . . . . . . 119.96 110.78 121.50 101.262016 . . . . . . . . . . . . . . . . . . . . . . . . . . . . . . . . . . . . . . . 112.42 120.13 125.58 111.302017 (through May 31, 2016) . . . . . . . . . . . . . . . . . . . 110.75 108.83 112.06 106.34
Month Ended High Low
(¥ per $1.00)
December 31, 2015 . . . . . . . . . . . . . . . . . . . . . . . . . . . . . . . . . . . . . . . . . . . . . . . . . . . . . . . . . . . . 123.52 120.27January 31, 2016 . . . . . . . . . . . . . . . . . . . . . . . . . . . . . . . . . . . . . . . . . . . . . . . . . . . . . . . . . . . . . . 121.05 116.38February 29, 2016 . . . . . . . . . . . . . . . . . . . . . . . . . . . . . . . . . . . . . . . . . . . . . . . . . . . . . . . . . . . . . 121.06 111.36March 31, 2016 . . . . . . . . . . . . . . . . . . . . . . . . . . . . . . . . . . . . . . . . . . . . . . . . . . . . . . . . . . . . . . . 113.94 111.30April 30, 2016 . . . . . . . . . . . . . . . . . . . . . . . . . . . . . . . . . . . . . . . . . . . . . . . . . . . . . . . . . . . . . . . . 112.06 106.90May 31, 2016 . . . . . . . . . . . . . . . . . . . . . . . . . . . . . . . . . . . . . . . . . . . . . . . . . . . . . . . . . . . . . . . . . 110.75 106.34
Fluctuations in the exchange rate between the Japanese yen and the U.S. dollar will affect the dollarequivalent of the price of the shares on the Japanese stock exchanges. As a result, exchange rate fluctuations arelikely to affect the market price of the American Depositary Shares (“ADSs”) on the New York Stock Exchange(“NYSE”). Toyota will declare any cash dividends on shares of capital stock in Japanese yen. Exchange ratefluctuations will also affect the U.S. dollar amounts received on conversion of cash dividends.
Exchange rate fluctuations can also materially affect Toyota’s reported operating results. In particular, astrengthening of the Japanese yen against the U.S. dollar can have a material adverse effect on Toyota’s reportedoperating results. For a further discussion of the effects of currency rate fluctuations on Toyota’s operatingresults, please see “Operating and Financial Review and Prospects — Operating Results — Overview —Currency Fluctuations.”
3.B CAPITALIZATION AND INDEBTEDNESS
Not applicable.
4
3.C REASONS FOR THE OFFER AND USE OF PROCEEDS
Not applicable.
3.D RISK FACTORS
Industry and Business Risks
The worldwide automotive market is highly competitive.
The worldwide automotive market is highly competitive. Toyota faces intense competition from automotivemanufacturers in the markets in which it operates. Although the global economy continues to recover gradually,competition in the automotive industry has further intensified amidst difficult overall market conditions. Inaddition, competition is likely to further intensify in light of further continuing globalization in the worldwideautomotive industry, possibly resulting in industry reorganizations. Factors affecting competition include productquality and features, safety, reliability, fuel economy, the amount of time required for innovation anddevelopment, pricing, customer service and financing terms. Increased competition may lead to lower vehicleunit sales, which may result in a further downward price pressure and adversely affect Toyota’s financialcondition and results of operations. Toyota’s ability to adequately respond to the recent rapid changes in theautomotive market and to maintain its competitiveness will be fundamental to its future success in existing andnew markets and to maintain its market share. There can be no assurances that Toyota will be able to competesuccessfully in the future.
The worldwide automotive industry is highly volatile.
Each of the markets in which Toyota competes has been subject to considerable volatility in demand.Demand for vehicles depends to a large extent on economic, social and political conditions in a given market andthe introduction of new vehicles and technologies. As Toyota’s revenues are derived from sales in marketsworldwide, economic conditions in such markets are particularly important to Toyota.
Reviewing the general economic environment for the fiscal year ended March 2016, with respect to theworld economy, the U.S. economy has seen ongoing recovery mainly due to steady progress of personalconsumption, and the European economy has seen a moderate recovery in the eurozone. Meanwhile, weaknesseshave been seen in China and other Asian emerging countries. The Japanese economy has been on a moderaterecovery as a whole, while weakness could be seen in personal consumption and other areas. For the automobileindustry, although markets have progressed in a steady manner, especially in the U.S., markets in some emergingcountries have become stagnant, and the Japanese market has slowed down mainly in the sales of mini-vehiclesdue to the tax increase.
The shifts in demand for automobiles are continuing, and it is unclear how this situation will transition inthe future. Toyota’s financial condition and results of operations may be adversely affected if the shifts indemand for automobiles continues or progresses further. Demand may also be affected by factors directlyimpacting vehicle price or the cost of purchasing and operating vehicles such as sales and financing incentives,prices of raw materials and parts and components, cost of fuel and governmental regulations (including tariffs,import regulation and other taxes). Volatility in demand may lead to lower vehicle unit sales, which may result indownward price pressure and adversely affect Toyota’s financial condition and results of operations.
Toyota’s future success depends on its ability to offer new, innovative and competitively priced products thatmeet customer demand on a timely basis.
Meeting customer demand by introducing attractive new vehicles and reducing the amount of time requiredfor product development are critical to automotive manufacturers. In particular, it is critical to meet customerdemand with respect to quality, safety and reliability. The timely introduction of new vehicle models, atcompetitive prices, meeting rapidly changing customer preferences and demand is more fundamental to Toyota’ssuccess than ever, as the automotive market is rapidly transforming in light of the changing global economy.
5
There is no assurance, however, that Toyota will adequately and appropriately respond to changing customerpreferences and demand with respect to quality, safety, reliability, styling and other features in a timely manner.Even if Toyota succeeds in perceiving customer preferences and demand, there is no assurance that Toyota willbe capable of developing and manufacturing new, price competitive products in a timely manner with itsavailable technology, intellectual property, sources of raw materials and parts and components, and productioncapacity, including cost reduction capacity. Further, there is no assurance that Toyota will be able to implementcapital expenditures at the level and times planned by management. Toyota’s inability to develop and offerproducts that meet customers’ preferences and demand with respect to quality, safety, reliability, styling andother features in a timely manner could result in a lower market share and reduced sales volumes and margins,and may adversely affect Toyota’s financial condition and results of operations.
Toyota’s ability to market and distribute effectively is an integral part of Toyota’s successful sales.
Toyota’s success in the sale of vehicles depends on its ability to market and distribute effectively based ondistribution networks and sales techniques tailored to the needs of its customers. There is no assurance thatToyota will be able to develop sales techniques and distribution networks that effectively adapt to changingcustomer preferences or changes in the regulatory environment in the major markets in which it operates.Toyota’s inability to maintain well-developed sales techniques and distribution networks may result in decreasedsales and market share and may adversely affect its financial condition and results of operations.
Toyota’s success is significantly impacted by its ability to maintain and develop its brand image.
In the highly competitive automotive industry, it is critical to maintain and develop a brand image. In orderto maintain and develop a brand image, it is necessary to further increase customers’ confidence by providingsafe, high-quality products that meet customer preferences and demand. If Toyota is unable to effectivelymaintain and develop its brand image as a result of its inability to provide safe, high-quality products or as aresult of the failure to promptly implement safety measures such as recalls when necessary, vehicle unit salesand/or sale prices may decrease, and as a result revenues and profits may not increase as expected or maydecrease, adversely affecting its financial condition and results of operations.
Toyota relies on suppliers for the provision of certain supplies including parts, components and raw materials.
Toyota purchases supplies including parts, components and raw materials from a number of externalsuppliers located around the world. For some supplies, Toyota relies on a single supplier or a limited number ofsuppliers, whose replacement with another supplier may be difficult. Inability to obtain supplies from a single orlimited source supplier may result in difficulty obtaining supplies and may restrict Toyota’s ability to producevehicles. Furthermore, even if Toyota were to rely on a large number of suppliers, first-tier suppliers with whomToyota directly transacts may in turn rely on a single second-tier supplier or limited second-tier suppliers.Toyota’s ability to continue to obtain supplies from its suppliers in a timely and cost-effective manner is subjectto a number of factors, some of which are not within Toyota’s control. These factors include the ability ofToyota’s suppliers to provide a continued source of supply, and Toyota’s ability to effectively compete andobtain competitive prices from suppliers. A loss of any single or limited source supplier or inability to obtainsupplies from suppliers in a timely and cost-effective manner could lead to increased costs or delays orsuspensions in Toyota’s production and deliveries, which could have an adverse effect on Toyota’s financialcondition and results of operations.
The worldwide financial services industry is highly competitive.
The worldwide financial services industry is highly competitive. Increased competition in automobilefinancing may lead to decreased margins. A decline in Toyota’s vehicle unit sales, an increase in residual valuerisk due to lower used vehicle price, an increase in the ratio of credit losses and increased funding costs arefactors which may impact Toyota’s financial services operations. If Toyota is unable to adequately respond to thechanges and competition in automobile financing, Toyota’s financial services operations may adversely affect itsfinancial condition and results of operations.
6
Toyota’s operations and vehicles rely on various digital and information technologies.
Toyota depends on various information technology networks and systems, some of which are managed bythird parties, to process, transmit and store electronic information, including sensitive data, and to manage orsupport a variety of business processes and activities, including manufacturing, research and development,supply chain management, sales and accounting. In addition, Toyota’s vehicles may rely on various digital andinformation technologies, including information service and driving assistance functions. Despite securitymeasures, Toyota’s digital and information technology networks and systems may be vulnerable to damage,disruptions or shutdowns due to attacks by hackers, computer viruses, breaches due to unauthorized use, errors ormalfeasance by employees and others who have or gain access to the networks and systems Toyota depends on,service failures or bankruptcy of third parties such as software development or cloud computing vendors, powershortages and outages, and utility failures or other catastrophic events like natural disasters. Such incidents couldmaterially disrupt critical operations, disclose sensitive data, interfere with information services and drivingassistance functions in Toyota’s vehicles, and/or give rise to legal claims or proceedings, liability or regulatorypenalties under applicable laws, which could have an adverse effect on Toyota’s brand image and its financialcondition and results of operations.
Financial Market and Economic Risks
Toyota’s operations are subject to currency and interest rate fluctuations.
Toyota is sensitive to fluctuations in foreign currency exchange rates and is principally exposed tofluctuations in the value of the Japanese yen, the U.S. dollar and the euro and, to a lesser extent, the Australiandollar, the Russian ruble, the Canadian dollar and the British pound. Toyota’s consolidated financial statements,which are presented in Japanese yen, are affected by foreign currency exchange fluctuations through translationrisk, and changes in foreign currency exchange rates may also affect the price of products sold and materialspurchased by Toyota in foreign currencies through transaction risk. In particular, strengthening of the Japaneseyen against the U.S. dollar can have an adverse effect on Toyota’s operating results.
Toyota believes that its use of certain derivative financial instruments including foreign exchange forwardcontracts and interest rate swaps and increased localized production of its products have reduced, but noteliminated, the effects of interest rate and foreign currency exchange rate fluctuations. Nonetheless, a negativeimpact resulting from fluctuations in foreign currency exchange rates and changes in interest rates may adverselyaffect Toyota’s financial condition and results of operations. For a further discussion of currency and interest ratefluctuations and the use of derivative financial instruments, see “Operating and Financial Review and Prospects— Operating Results — Overview — Currency Fluctuations,” “Quantitative and Qualitative Disclosures AboutMarket Risk,” and notes 21 and 22 to Toyota’s consolidated financial statements.
High prices of raw materials and strong pressure on Toyota’s suppliers could negatively impact Toyota’sprofitability.
Increases in prices for raw materials that Toyota and Toyota’s suppliers use in manufacturing their productsor parts and components such as steel, precious metals, non-ferrous alloys including aluminum, and plastic parts,may lead to higher production costs for parts and components. This could, in turn, negatively impact Toyota’sfuture profitability because Toyota may not be able to pass all those costs on to its customers or require itssuppliers to absorb such costs.
A downturn in the financial markets could adversely affect Toyota’s ability to raise capital.
Should the world economy suddenly deteriorate, a number of financial institutions and investors will facedifficulties in providing capital to the financial markets at levels corresponding to their own financial capacity,and, as a result, there is a risk that companies may not be able to raise capital under terms that they would expectto receive with their creditworthiness. If Toyota is unable to raise the necessary capital under appropriateconditions on a timely basis, Toyota’s financial condition and results of operations may be adversely affected.
7
Political, Regulatory, Legal and Other Risks
The automotive industry is subject to various governmental regulations.
The worldwide automotive industry is subject to various laws and governmental regulations including thoserelated to vehicle safety and environmental matters such as emission levels, fuel economy, noise and pollution. Inparticular, automotive manufacturers such as Toyota are required to implement safety measures such as recallsfor vehicles that do not or may not comply with the safety standards of laws and governmental regulations. Inaddition, Toyota may, in order to reassure its customers of the safety of Toyota’s vehicles, decide to voluntarilyimplement recalls or other safety measures even if the vehicle complies with the safety standards of relevant lawsand governmental regulations. Many governments also impose tariffs and other trade barriers, taxes and levies, orenact price or exchange controls. Toyota has incurred, and expects to incur in the future, significant costs incomplying with these regulations. If Toyota launches products that result in safety measures such as recalls,Toyota may incur various costs including significant costs for free repairs. Furthermore, new legislation orchanges in existing legislation may also subject Toyota to additional expenses in the future. If Toyota incurssignificant costs related to implementing safety measures or meeting laws and governmental regulations,Toyota’s financial condition and results of operations may be adversely affected.
Toyota may become subject to various legal proceedings.
As an automotive manufacturer, Toyota may become subject to legal proceedings in respect of variousissues, including product liability and infringement of intellectual property. Toyota may also be subject to legalproceedings brought by its shareholders and governmental proceedings and investigations. Toyota is in factcurrently subject to a number of pending legal proceedings and government investigations. A negativeoutcome in one or more of these pending legal proceedings could adversely affect Toyota’s financial conditionand results of operations. For a further discussion of governmental regulations, see “Information on theCompany — Business Overview — Governmental Regulation, Environmental and Safety Standards” and forlegal proceedings, please see “Information on the Company — Business Overview — Legal Proceedings.”
Toyota may be adversely affected by natural calamities, political and economic instability, fuel shortages orinterruptions in social infrastructure, wars, terrorism and labor strikes.
Toyota is subject to various risks associated with conducting business worldwide. These risks includenatural calamities; political and economic instability; fuel shortages; interruption in social infrastructureincluding energy supply, transportation systems, gas, water, or communication systems resulting from naturalhazards or technological hazards; wars; terrorism; labor strikes and work stoppages. Should the major markets inwhich Toyota purchases materials, parts and components and supplies for the manufacture of Toyota products orin which Toyota’s products are produced, distributed or sold be affected by any of these events, it may result indisruptions and delays in the operations of Toyota’s business. Should significant or prolonged disruptions ordelays related to Toyota’s business operations occur, it may adversely affect Toyota’s financial condition andresults of operations.
ITEM 4. INFORMATION ON THE COMPANY
4.A HISTORY AND DEVELOPMENT OF THE COMPANY
Toyota Motor Corporation is a limited liability, joint-stock company incorporated under the CommercialCode of Japan and continues to exist under the Companies Act. Toyota commenced operations in 1933 as theautomobile division of Toyota Industries Corporation (formerly, Toyoda Automatic Loom Works, Ltd.). Toyotabecame a separate company on August 28, 1937. In 1982, the Toyota Motor Company and Toyota Motor Salesmerged into one company, the Toyota Motor Corporation of today. As of March 31, 2016, Toyota operatedthrough 548 consolidated subsidiaries (including variable interest entities) and 200 affiliated companies, of which54 companies were accounted for through the equity method.
8
See “— Business Overview — Capital Expenditures and Divestitures” for a description of Toyota’sprincipal capital expenditures and divestitures between April 1, 2013 and March 31, 2016 and informationconcerning Toyota’s principal capital expenditures and divestitures currently in progress.
Toyota’s principal executive offices are located at 1 Toyota-cho, Toyota City, Aichi Prefecture 471-8571,Japan. Toyota’s telephone number in Japan is +81-565-28-2121.
4.B BUSINESS OVERVIEW
Toyota primarily conducts business in the automotive industry. Toyota also conducts business in financeand other industries. Toyota sold 8,681 thousand vehicles in fiscal 2016 on a consolidated basis. Toyota had netrevenues of ¥28,403.1 billion and net income attributable to Toyota Motor Corporation of ¥2,312.6 billion infiscal 2016.
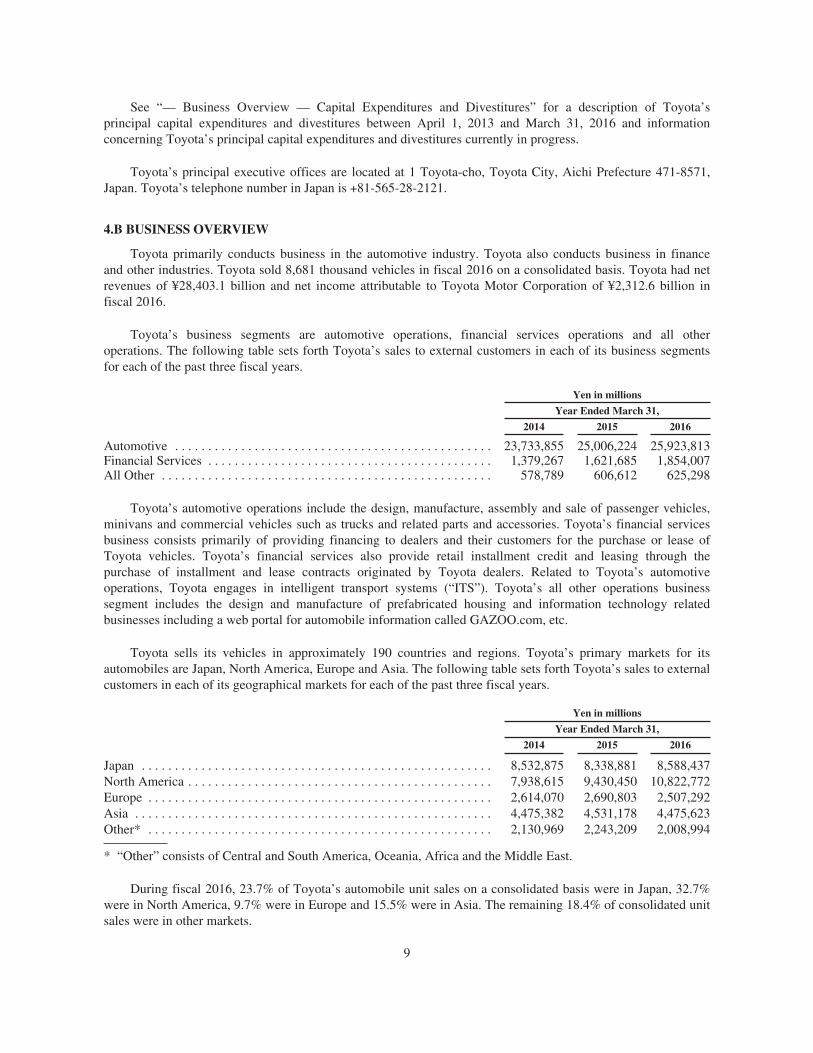
Toyota’s business segments are automotive operations, financial services operations and all otheroperations. The following table sets forth Toyota’s sales to external customers in each of its business segmentsfor each of the past three fiscal years.
Yen in millions
Year Ended March 31,
2014 2015 2016
Automotive . . . . . . . . . . . . . . . . . . . . . . . . . . . . . . . . . . . . . . . . . . . . . . . . 23,733,855 25,006,224 25,923,813Financial Services . . . . . . . . . . . . . . . . . . . . . . . . . . . . . . . . . . . . . . . . . . . 1,379,267 1,621,685 1,854,007All Other . . . . . . . . . . . . . . . . . . . . . . . . . . . . . . . . . . . . . . . . . . . . . . . . . . 578,789 606,612 625,298
Toyota’s automotive operations include the design, manufacture, assembly and sale of passenger vehicles,minivans and commercial vehicles such as trucks and related parts and accessories. Toyota’s financial servicesbusiness consists primarily of providing financing to dealers and their customers for the purchase or lease ofToyota vehicles. Toyota’s financial services also provide retail installment credit and leasing through thepurchase of installment and lease contracts originated by Toyota dealers. Related to Toyota’s automotiveoperations, Toyota engages in intelligent transport systems (“ITS”). Toyota’s all other operations businesssegment includes the design and manufacture of prefabricated housing and information technology relatedbusinesses including a web portal for automobile information called GAZOO.com, etc.
Toyota sells its vehicles in approximately 190 countries and regions. Toyota’s primary markets for itsautomobiles are Japan, North America, Europe and Asia. The following table sets forth Toyota’s sales to externalcustomers in each of its geographical markets for each of the past three fiscal years.
Yen in millions
Year Ended March 31,
2014 2015 2016
Japan . . . . . . . . . . . . . . . . . . . . . . . . . . . . . . . . . . . . . . . . . . . . . . . . . . . . . 8,532,875 8,338,881 8,588,437North America . . . . . . . . . . . . . . . . . . . . . . . . . . . . . . . . . . . . . . . . . . . . . . 7,938,615 9,430,450 10,822,772Europe . . . . . . . . . . . . . . . . . . . . . . . . . . . . . . . . . . . . . . . . . . . . . . . . . . . . 2,614,070 2,690,803 2,507,292Asia . . . . . . . . . . . . . . . . . . . . . . . . . . . . . . . . . . . . . . . . . . . . . . . . . . . . . . 4,475,382 4,531,178 4,475,623Other* . . . . . . . . . . . . . . . . . . . . . . . . . . . . . . . . . . . . . . . . . . . . . . . . . . . . 2,130,969 2,243,209 2,008,994
* “Other” consists of Central and South America, Oceania, Africa and the Middle East.
During fiscal 2016, 23.7% of Toyota’s automobile unit sales on a consolidated basis were in Japan, 32.7%were in North America, 9.7% were in Europe and 15.5% were in Asia. The remaining 18.4% of consolidated unitsales were in other markets.
9
The Worldwide Automotive Market
Toyota estimates that annual worldwide vehicle sales totaled approximately 91 million units in 2015.
Automobile sales are affected by a number of factors including:
• social, political and economic conditions;
• introduction of new vehicles and technologies; and
• costs incurred by customers to purchase and operate automobiles.
These factors can cause consumer demand to vary substantially from year to year in different geographicmarkets and in individual categories of automobiles.
In fiscal 2016, the U.S. economy experienced steady growth, with Europe undergoing gradual recoveryfollowing additional monetary easing measures while the economy in Japan lacked strength as the improvementin the jobs market did not impact income and consumption remained low. Growth in emerging markets sloweddue to weakness of local currencies deriving partly from a downturn in the Chinese economy, as well as a declinein prices of natural resources in resource-producing countries.
The automotive industry was also impacted by this trend. In 2015, with respect to developed countries,markets in Europe and the United States expanded. In addition, in Japan, market demand decreased despite arecovery in general consumption levels and signs of recovery from the consumption tax increase in April 2014.In emerging markets, the expansion of the Chinese market continued, but markets in other emerging countriescontracted.
However, in the medium- to long-term, Toyota expects the automotive market to grow driven principally bythe growth in emerging markets. Global competition is expected to be severe, as competition in compact andlow-price vehicles intensifies, and technological development and development of new products become morefrequent with a heightened global awareness of the environment and more stringent fuel economy standards.
In 2015, China, North America, Europe and Asia were the world’s largest automotive markets. The share ofeach market across the globe, which Toyota estimates based on the available automobile sales data in eachcountry and region information, was 28% for China, 23% for North America (22% excluding Mexico and PuertoRico), 21% for Europe and 10% for Asia. In China, new vehicle sales increased to approximately 25.0 millionunits. In North America, new vehicle sales increased to approximately 20.8 million units. In Europe, new vehiclesales increased to approximately 19.0 million units. In Asia (including India but excluding Japan and China), newvehicle unit sales increased from the previous year to approximately 9.3 million units.
The worldwide automotive industry is affected significantly by government regulations aimed at reducingharmful effects on the environment, enhancing vehicle safety and improving fuel economy. These regulationshave added to the cost of manufacturing vehicles. Many governments also mandate local procurement of partsand components and impose tariffs and other trade barriers and price or exchange controls as a means of creatingjobs, protecting domestic producers or influencing their balance of payments. Changes in regulatoryrequirements and other government-imposed restrictions can limit an automaker’s operations. These regulationscan also make it difficult to repatriate profits to an automaker’s home country.
The development of the worldwide automotive market includes the continuing globalization of automotiveoperations. Manufacturers seek to achieve globalization by localizing the design and manufacture of automobilesand their parts and components in the markets in which they are sold. By expanding production capabilitiesbeyond their home markets, automotive manufacturers are able to reduce their exposure to fluctuations in foreignexchange rates as well as to trade restrictions and tariffs.
10
Recently, there have been many global business alliances and investments entered into betweenmanufacturers in the global automotive industry. There are various reasons behind these transactions includingthe need to respond to the excessive global capacity in the production of automobiles, the need to reduce costsand improve efficiency by increasing the number of automobiles produced using common vehicle platforms andby sharing research and development expenses for environmental and other technology, the desire to expand acompany’s global presence through increased size and the desire to expand into particular segments orgeographic markets.
Toyota believes that its research and development initiatives, particularly the development ofenvironmentally friendly new vehicle technologies, vehicle safety and information technology, provide it with astrategic advantage.
Toyota’s ability to compete in the global automotive industry will depend in part on Toyota’s successfulimplementation of its business strategy. This is subject to a number of factors, some of which are not in Toyota’scontrol. These factors are discussed in “Operating and Financial Review and Prospects” and elsewhere in thisannual report.
Toyota Global Vision
In March 2011, Toyota unveiled its “Toyota Global Vision” corporate outline for the future, which servesnot only to give direction to Toyota employees around the world, but also to convey such direction to customersand to the public at large. Toyota will work to achieve sustained growth through the realization of the followingideals which are parts of the Vision:
“The safest and most responsible ways of moving people”
• Safety is Toyota’s highest priority, and Toyota will continue to provide world-class safety.
• Toyota will also continue to contribute to environmental quality and to human happiness by usingleading environmental technology and by deploying that technology in a growing line of vehiclemodels. At the same time, Toyota will work through the provision of products, sales and services thatexceed customer expectation to offer a rewarding experience for customers.
“Enriching lives around the world”
• Toyota has been consistently true to its founding spirit of serving society through conscientiousmanufacturing, and it will continue working in that spirit to contribute to enhance the quality of lifewherever it has operations.
• Toyota will strive to continue contributing to economic vitality wherever it has operations by generatingstable employment and by participating in mutually beneficial business relationships with dealers andsuppliers. It will also strive to continue to actively engage in initiatives for human resourcesdevelopment and the promotion of cultural activities of its host communities.
“Lead the way to the future of mobility”
• Toyota will lead the industry in technological development that will spawn next-generation mobility.For example, it will explore possibilities in personal mobility and in the convergence of informationtechnology for automobiles and “smart grids” for optimizing energy generation and consumption.Toyota will strive to offer products and services that match the needs in each market.
• Toyota will strive to advance environmental technology and develop low-carbon technologies andtechnologies for maximizing safety through interaction with the transport infrastructure to lay afoundation for sustainable and amenable future mobility.
11
“Our commitment to quality, constant innovation”
• Toyota is committed to providing quality vehicles that are highly reliable and driven with a sense ofsafety and reliability.
• Toyota will constantly reinvent itself and continue to engage in cutting-edge technology development.Toyota will work towards offering vehicles around the world that address the needs of today and oftomorrow at affordable prices.
“Continued awareness for the Earth and environment”
• Toyota will continue to work towards minimizing environmental impact in its manufacturing and otheroperations, and products.
• With an emphasis on environmental awareness, Toyota will in its operations work towards energyconservation, reduction in carbon dioxide emission, efficient use of resources such as recycling, andhuman resource development and production methods that allow for coexistence with nature.
“Exceed expectations and be rewarded with a smile”
• Everyone at Toyota will continuously maintain a sense of gratitude to customers and will strive to earnsmiles with products and services that are stimulating and inspiring and exceed customer expectations.
“There is always a better way”
• All Toyota employees will share the recognition that there is always a better way and share acommitment to continuous improvement, which are fundamental to The Toyota Way.
“Meet challenging goals by engaging the talent and passion of people”
• Toyota will nurture a corporate culture where teamwork and individual creativity thrive and wherepeople will approach their work with pride and passion.
• Toyota will honor the spirit of diversity in recruiting, training and promoting capable individuals aroundthe world. Human resources development at Toyota will continue to promote the transfer of thecompany’s monozukuri spirit of conscientious manufacturing and related skills and know-how from onegeneration to the next.
As for the future business environment, the U.S. is expected to continue recovering and Europe, chiefly inthe eurozone, is expected to continue its moderate recovery. Meanwhile, China and other emerging countries areshowing a risk of a slowdown. With regards to the Japanese economy, attention needs to be paid to an economicdecline caused by a slowdown in emerging countries.
The automotive market is expected to progress steadily in developed countries, though concerns overslowdowns in emerging countries continue. In addition, measures to respond to environmental and fuelconsumption regulations in various countries and to reinforce efforts toward the development of safetytechnologies are required, while companies in other businesses are newly venturing into the development ofautomated driving technology. Fierce competition is thus intensifying on a global scale.
In this severe business environment, Toyota intends to steadily progress toward the realization of the ToyotaGlobal Vision through sustainable growth based on the following policies:
First, Toyota intends to contribute to the realization of a future mobility society through pioneeringtechnologies, products and businesses. Toyota will develop human resources who will foresee the future andcourageously take on new challenges.
12
Second, Toyota intends to reinforce true competitiveness in order to grow as steadily as a tree adding annualgrowth rings. Toyota will thoroughly improve quality, establish new working methods to sincerely engage with“customers and cars,” and enhance its crisis management abilities for responding to crises of every type.
In order to realize the above vision, Toyota reorganized its corporate structure in April 2016 to establish athree-part structure: product-based in-house companies, region-based business units, and the head office. At theproduct-based in-house companies, streamlined operation from planning through manufacturing enables quickand independent decision-making. Within the region-based business units, Toyota aims to build even moreregional operations. The head office will work to formulate a medium- to long-term vision and managementstrategy, including an appropriate allocation of resources, with an eye toward the future.
Based on these initiatives, Toyota will contribute to “enriching lives of communities” by providing“ever-better cars.” This is expected to encourage more customers to purchase Toyota cars and thereby lead to theestablishment of a stable business base. By perpetuating this cycle, Toyota will aim to realize sustainable growthand enhance corporate value. In addition, through full observance of corporate ethics such as compliance withapplicable laws and regulations, Toyota will fulfill its social responsibilities.
Toyota Environmental Challenge 2050
Positioning responding to environmental issues as one of the most prioritized challenges for management,Toyota has tackled head-on activities such as the development and promotion of next-generation vehiclesincluding hybrid vehicles and fuel cell vehicles, efficient production that puts less of a burden on theenvironment, the recycling of end-of-life vehicles and hybrid vehicle batteries, planting trees for the coexistenceof humans and nature in harmony, and conservation of ecosystems.
However, in recent years, the seriousness of environmental issues is increasing over a wide area, asevidenced by global warming, water shortages, resource depletion, and degradation of biodiversity. In responseto the situation, Toyota believes it is necessary to take on new challenges that consider the world 20 or 30 yearsin the future, in order to remain closely aligned with the global environment. Accordingly, Toyota announcedToyota Environmental Challenge 2050 in October 2015.
With the aims of reducing the environmental impact of vehicles as much as possible as well as movingtoward a net positive impact, by 2050 in order to contribute to the realization of a sustainable society, the ToyotaEnvironmental Challenge 2050 has set forth the following six challenges for Toyota to address.
1. New Vehicles Zero CO2 Emissions Challenge
2. Life Cycle Zero CO2 Emissions Challenge
3. Plant Zero CO2 Emissions Challenge
4. Challenge of Minimizing and Optimizing Water Usage
5. Challenge of Establishing a Recycling-Based Society and Systems
6. Challenge of Establishing a Future Society in Harmony with Nature
Further strengthening collaboration with the Toyota group and all other stakeholders, Toyota willconsolidate new ideas, dynamism and technology to tackle together the realization of a truly sustainable societyfrom a long-term perspective.
Automotive Operations
Toyota’s revenues from its automotive operations were ¥25,977.4 billion in fiscal 2016, ¥25,062.1 billion infiscal 2015 and ¥23,781.4 billion in fiscal 2014.
13
Toyota produces and sells passenger vehicles, minivans and commercial vehicles such as trucks. ToyotaMotor Corporation’s subsidiary, Daihatsu Motor Co., Ltd. (“Daihatsu”), produces and sells mini-vehicles andcompact cars. Hino Motors, Ltd. (“Hino”), also a subsidiary of Toyota Motor Corporation, produces and sellscommercial vehicles such as trucks and buses. Toyota also manufactures automotive parts, components andaccessories for its own use and for sale to others.
On January 29, 2016, Toyota and Daihatsu announced that, with an aim to strengthen competitiveness in thesmall car segment, they entered into a share exchange agreement to make Daihatsu a wholly-owned subsidiary ofToyota as of August 1, 2016. Under a joint strategy, Toyota and Daihatsu will be able to plan and implementoptimal strategies including combining their technical expertise and bases of operations, joint development ofnext-generation technology, bold cost reduction and expansion of product lineups with a global brand strategy.Daihatsu will play a key role in developing globally competitive small cars of both brands based on thetechnology Daihatsu has developed through manufacturing of mini-vehicles.
Vehicle Models
Toyota’s vehicles (produced by Toyota, Daihatsu and Hino) can be classified into three categories: hybridvehicles, conventional engine vehicles, and fuel cell vehicles. Toyota’s product line-up includes subcompact andcompact cars, mini-vehicles, mid-size, luxury, sports and specialty cars, recreational and sport-utility vehicles,pickup trucks, minivans, trucks and buses.
Hybrid Vehicles
The world’s first mass-produced hybrid car was Toyota’s Prius. It runs on an efficient combination of agasoline engine and motor. This system allows the Prius to travel more efficiently than conventional enginevehicles of comparable size and performance. The hybrid design of the Prius also results in the output of75% less emission than the maximum amount allowed by Japanese environmental regulations. Toyota views thePrius as the cornerstone of its emphasis on designing and producing eco-friendly automobiles.
In the last three years, Toyota has strengthened its hybrid lineup by introducing the fully remodeled IS300hin May 2013, the fully remodeled Corolla Axio HV/Corolla Fielder HV in August 2013, the fully remodeledHarrier HV in December 2013, the fully remodeled Voxy HV/Noah HV in January 2014, the NX300h inJuly 2014, the RC300h and the Esquire HV in September 2014, the fully remodeled Alphard and Vellfire inJanuary 2015, the Sienta HV in June 2015, the fully remodeled RX-HV in September 2015 and the fullyremodeled Prius in November 2015. In the hybrid vehicles area, where strong growth is anticipated, Toyota aimsto continue its efforts to offer a diverse line-up of hybrid vehicles, enhance engine power while improving fueleconomy and otherwise work towards increasing the sales of hybrid vehicles.
Fuel Cell Vehicles
Toyota began limited sales of a fuel cell vehicle in Japan and the United States in December 2002. InJune 2005, Toyota’s new fuel cell passenger vehicle became the first in Japan to acquire vehicle type certificationunder the Road Vehicles Act, as amended, on March 31, 2005, by Japan’s Ministry of Land, Infrastructure,Transport and Tourism. Leases for fuel cell vehicles began in July 2005. By 2007, Toyota was able to makeimprovements to start-up and cruising distance at temperatures below freezing, which were technologicalchallenges. Toyota has made advances by solving technological issues such as the above and worked towards thepractical use of such solutions, culminating in the general sale of the world’s first mass produced fuel cell vehicleMIRAI in Japan beginning in December 2014, in the United States beginning in June 2015 and in Europebeginning in September 2015.
14
Conventional Engine Vehicles
Subcompact and Compact
Toyota’s subcompact and compact cars include the four-door Corolla sedan, which is one of Toyota’sbestselling models. The Yaris, marketed as the Vitz in Japan, is a subcompact car designed to perform better andoffer greater comfort than other compact cars available in the market with low emissions that are particularlyattractive to European consumers. In Europe, Toyota introduced the fully remodeled Aygo in June 2014. InJapan, Toyota introduced the remodeled Corolla Axio/Fielder in May 2012, the remodeled Porte and its variant,the Spade, in July 2012 and the remodeled Auris in August 2012. In India, Asia, China and other markets, Toyotaintroduced the Etios and Vios. In addition, Toyota introduced the AGYA, which is designed and manufacturedby Daihatsu. Moreover, Scion iA, which is designed and manufactured by Mazda Motor Corporation, was newlyintroduced in July 2015.
Mini-Vehicles
Mini-vehicles are manufactured and sold by Daihatsu. Daihatsu manufactures mini-vehicles, passengervehicles, commercial vehicles and auto parts. Mini-vehicles are passenger vehicles, vans or trucks with enginedisplacements of 660 cubic centimeters or less. Daihatsu sold approximately 530 thousand mini-vehicles and177 thousand automobiles on a consolidated basis during fiscal 2016. Daihatsu’s largest market is Japan, whichaccounted for approximately 80% of Daihatsu’s unit sales during fiscal 2016. From 2011, Toyota began to sellsome mini-vehicles manufactured by Daihatsu under the Toyota brand.
Mid-Size
Toyota’s mid-size models include the Camry, which has been the bestselling passenger car in theUnited States for eighteen of the past nineteen calendar years (from 1997 to present) and also for the last fourteenconsecutive years. The Camry was fully remodeled in August 2011. Camry sales in the United States for2015 were approximately 429 thousand units (including Camry hybrids). In addition, Toyota’s other mid-sizemodels include the REIZ for the Chinese market, the Avensis, which was remodeled in November 2008 for theEuropean market, and the Mark X, which was remodeled in October 2009 for the Japanese market.
Luxury & Large
In North America, Europe, Japan and other regions, Toyota’s luxury lineup consists primarily of vehiclessold under the Lexus brand name. Lexus passenger car models include the LS, the GS, the ES, the IS, the HS, theCT and the RC. Lexus models also include the LX, the GX, the RX and the NX sold as luxury sport-utilityvehicles. Toyota commenced sales of its luxury automobiles in Japan under the Lexus brand in August 2005. Asof March 31, 2016, the Lexus brand lineup in Japan includes the LS, the GS, the HS, the IS, the CT, the LX, theRX, the NX and the RC. The Toyota brand’s full-size luxury car, the Avalon, was remodeled in October 2012,and the Crown was remodeled in December 2012. Toyota also sells the Century limousine in Japan.
Sports and Specialty
In the United States Toyota sells the Scion tC, a sports model targeted at young drivers. In December 2010,Toyota introduced the LFA model under the Lexus brand as the high-performance sports model, and inApril 2012, Toyota introduced the 86 (called Scion FR-S in the U.S.), a compact sports car with a front-mountedengine and rear-wheel drive. In October 2014, Toyota introduced the RC coupe that leads the image of Lexus,which engages drivers on a sentimental level.
Recreational and Sport-Utility Vehicles and Pickup Trucks
Toyota sells a variety of sport-utility vehicles and pickup trucks. Toyota’s sport-utility vehicles available inNorth America include the Sequoia, the 4Runner, the RAV4, the Highlander, the FJ Cruiser and the Land
15
Cruiser, and pickup trucks available are the Tacoma and Tundra. The Tacoma, the Tundra, the Highlander andthe Sequoia are manufactured in the United States. Toyota also offers four types of sport-utility vehicles underthe Lexus brand, including the LX, the GX, the RX, and the NX. Toyota also manufactures the RX and RAV4models in Canada. Toyota’s pickup truck, the Hilux, has been the bestselling model of all Toyota cars sold inThailand. In North America, the fully remodeled RAV4 was introduced in December 2012 and the fullyremodeled Highlander was introduced in December 2013. In July 2014, Toyota introduced the new NX modelunder the Lexus brand. In May 2015, Toyota introduced the fully remodeled Hilux in Thailand and in September2015, it introduced the fully remodeled RX of the Lexus brand in North America.
Minivans and Cabwagons
Toyota offers several basic models for the global minivan market. Its largest minivans in Japan, the Alphardand the Vellfire, were remodeled in January 2015. In addition, the Corolla Verso was remodeled inDecember 2008 in Europe, and the Wish was remodeled in April 2009, the Noah/Voxy was remodeled inJanuary 2014 and the new model Esquire was introduced in October 2014 in Japan. Toyota’s other minivanmodels include, in Japan, the Estima, the Sienta and the Isis, and, in North America, the Sienna.
Trucks and Buses
Toyota’s product lineup includes trucks (including vans) up to a gross vehicle weight of five tons and micro-buses that are sold in Japan and in overseas markets. Trucks and buses are also manufactured and sold by Hino, asubsidiary of Toyota. Hino’s product lineup includes large trucks with a gross vehicle weight of over eleven tons,medium trucks with a gross vehicle weight of between five and eleven tons and small trucks with a gross vehicleweight of up to five tons. Hino’s bus lineup includes medium to large buses used primarily as tour buses andpublic buses, small buses and micro-buses.
Product Development
New cars introduced in Japan during fiscal 2016 and thereafter include the Sienta HV and theGS F. Remodeled cars in Japan during fiscal 2016 and thereafter include the Sienta, the RX, the Prius and thePasso. New vehicles introduced outside of Japan during fiscal 2016 and thereafter include the MIRAI, the ScioniA and the GS F. Remodeled cars outside of Japan during fiscal 2016 and thereafter include the Hilux, the RXand the Prius.
In addition, the IMV product lineup based on the IMV project to optimize global manufacturing and supplysystems is a lineup of strategic multipurpose vehicles produced from a single platform to meet market demand.The IMV product lineup includes, as of March 31, 2016, the Hilux, Fortuner, and Innova, one or all of which areavailable in all regions except for Japan.
16
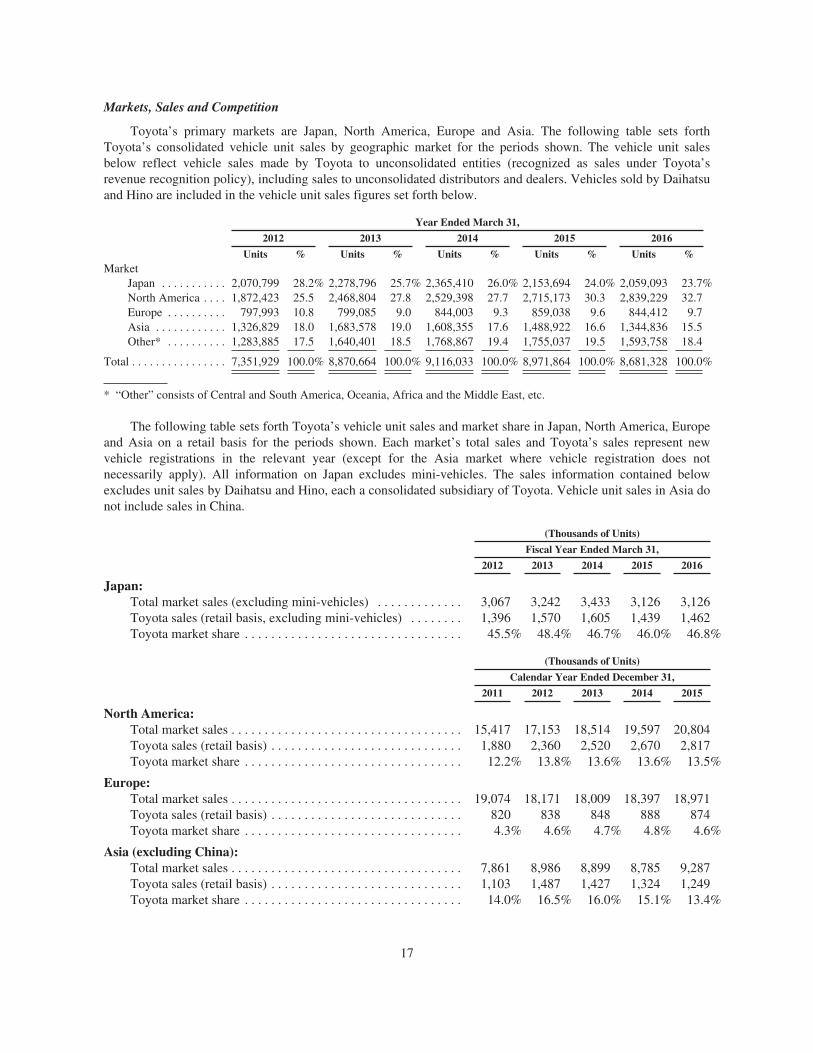
Markets, Sales and Competition
Toyota’s primary markets are Japan, North America, Europe and Asia. The following table sets forthToyota’s consolidated vehicle unit sales by geographic market for the periods shown. The vehicle unit salesbelow reflect vehicle sales made by Toyota to unconsolidated entities (recognized as sales under Toyota’srevenue recognition policy), including sales to unconsolidated distributors and dealers. Vehicles sold by Daihatsuand Hino are included in the vehicle unit sales figures set forth below.
Year Ended March 31,
2012 2013 2014 2015 2016
Units % Units % Units % Units % Units %Market
Japan . . . . . . . . . . . 2,070,799 28.2% 2,278,796 25.7% 2,365,410 26.0% 2,153,694 24.0% 2,059,093 23.7%North America . . . . 1,872,423 25.5 2,468,804 27.8 2,529,398 27.7 2,715,173 30.3 2,839,229 32.7Europe . . . . . . . . . . 797,993 10.8 799,085 9.0 844,003 9.3 859,038 9.6 844,412 9.7Asia . . . . . . . . . . . . 1,326,829 18.0 1,683,578 19.0 1,608,355 17.6 1,488,922 16.6 1,344,836 15.5Other* . . . . . . . . . . 1,283,885 17.5 1,640,401 18.5 1,768,867 19.4 1,755,037 19.5 1,593,758 18.4
Total . . . . . . . . . . . . . . . . 7,351,929 100.0% 8,870,664 100.0% 9,116,033 100.0% 8,971,864 100.0% 8,681,328 100.0%
* “Other” consists of Central and South America, Oceania, Africa and the Middle East, etc.
The following table sets forth Toyota’s vehicle unit sales and market share in Japan, North America, Europeand Asia on a retail basis for the periods shown. Each market’s total sales and Toyota’s sales represent newvehicle registrations in the relevant year (except for the Asia market where vehicle registration does notnecessarily apply). All information on Japan excludes mini-vehicles. The sales information contained belowexcludes unit sales by Daihatsu and Hino, each a consolidated subsidiary of Toyota. Vehicle unit sales in Asia donot include sales in China.
(Thousands of Units)
Fiscal Year Ended March 31,
2012 2013 2014 2015 2016
Japan:Total market sales (excluding mini-vehicles) . . . . . . . . . . . . . 3,067 3,242 3,433 3,126 3,126Toyota sales (retail basis, excluding mini-vehicles) . . . . . . . . 1,396 1,570 1,605 1,439 1,462Toyota market share . . . . . . . . . . . . . . . . . . . . . . . . . . . . . . . . . 45.5% 48.4% 46.7% 46.0% 46.8%
(Thousands of Units)
Calendar Year Ended December 31,
2011 2012 2013 2014 2015
North America:Total market sales . . . . . . . . . . . . . . . . . . . . . . . . . . . . . . . . . . . 15,417 17,153 18,514 19,597 20,804Toyota sales (retail basis) . . . . . . . . . . . . . . . . . . . . . . . . . . . . . 1,880 2,360 2,520 2,670 2,817Toyota market share . . . . . . . . . . . . . . . . . . . . . . . . . . . . . . . . . 12.2% 13.8% 13.6% 13.6% 13.5%
Europe:Total market sales . . . . . . . . . . . . . . . . . . . . . . . . . . . . . . . . . . . 19,074 18,171 18,009 18,397 18,971Toyota sales (retail basis) . . . . . . . . . . . . . . . . . . . . . . . . . . . . . 820 838 848 888 874Toyota market share . . . . . . . . . . . . . . . . . . . . . . . . . . . . . . . . . 4.3% 4.6% 4.7% 4.8% 4.6%
Asia (excluding China):Total market sales . . . . . . . . . . . . . . . . . . . . . . . . . . . . . . . . . . . 7,861 8,986 8,899 8,785 9,287Toyota sales (retail basis) . . . . . . . . . . . . . . . . . . . . . . . . . . . . . 1,103 1,487 1,427 1,324 1,249Toyota market share . . . . . . . . . . . . . . . . . . . . . . . . . . . . . . . . . 14.0% 16.5% 16.0% 15.1% 13.4%
17
Japan
Japan is one of the leading countries with respect to technological advancements and improvements and willcontinue to demonstrate such strength. Toyota strives to earn customer satisfaction by introducing productsdistinctive of Japan’s manufacturing ability such as value-added products including Lexus models, hybridvehicles, vehicles with 3-seat rows and mini-vehicles. Toyota’s consolidated vehicle sales in Japan in fiscal2016 was 2,059 thousand units, a decrease of 95 thousand units in comparison with the previous year. Toyotaendeavors to secure and maintain its large share of and position atop the Japanese market. Toyota held adomestic market share (excluding mini-vehicles) on a retail basis of 46.7% in fiscal 2014, 46.0% in fiscal2015 and 46.8% in fiscal 2016.
Although Toyota’s principle is to conduct production in regions where it enjoys true competitiveness, itconsiders Japan to be the source of its good manufacturing practices. Toyota supports its operations worldwidethrough measures such as the development of new technologies and products, low-volume vehicles tocomplement local production, production of global vehicle models which straddle multiple regions andsupporting overseas factories. Toyota will also launch the implementation of the new platform and the new unitfor the Toyota New Global Architecture (“TNGA”) globally, with Japan at the core. In Japan, Toyota isimplementing flexible production based on market needs, in order to support its large share of domestic sales.
Since Toyota formed an alliance with Fuji Heavy Industries, Ltd. (“FHI”) in 2005, Toyota and FHI haveutilized each other’s resources in development and production. In April 2008, in order to create synergy and tofurther strengthen competitiveness, Toyota, Daihatsu and FHI agreed on the following three points: (1) Toyotaand FHI will jointly develop a compact rear-wheel-drive sports car that will be marketed by both Toyota andFHI, (2) Toyota will provide FHI with a compact car on an original equipment manufacturing basis (“OEM”) and(3) Daihatsu will supply FHI with mini-vehicles and an FHI version of the Daihatsu Coo compact car on anOEM basis. In order to promote a smooth cooperation, FHI transferred 61 million FHI shares owned by FHI toToyota in July 2008. As a result of this transfer, Toyota owns 16.5% of FHI issued shares. While Toyota vehicleshave been manufactured at FHI’s North American production center, Subaru of Indiana Automotive, Inc., since2007, Toyota and FHI have decided to cease such production in the fall of 2016, and the collaboration betweenToyota and FHI will shift going forward to collaboration focusing on products and technology.
Toyota and Mazda have been engaged in collaboration such as the licensing of Toyota’s hybrid technologiesto Mazda and the production of compact cars for Toyota at Mazda’s plant in Mexico. In May 2015, Toyota andMazda entered into an agreement to build a mutually beneficial long-term partnership that leverages theresources of both companies to complement and enhance each other’s products and technologies and that willresult in more appealing cars that meet the diverse needs and tastes of customers around the world. A jointcommittee is currently evaluating how best to utilize each company’s respective strengths. The committee willencourage broad and meaningful collaboration across a range of fields, including environmental and advancedsafety technologies.
In 2011, Toyota and BMW Group agreed to conduct collaborative research in the field of next-generationlithium-ion battery technologies and for BMW to supply diesel engines to Toyota Motor Europe, Toyota’sEuropean subsidiary. In 2013, as part of their strategic long-term cooperation in the field of sustainable mobility,Toyota and BMW Group entered into agreements for the joint development of a fuel cell system, jointdevelopment of architecture and components for sports vehicles and joint research and development oflightweight technologies. The two companies also agreed to commence collaborative research on lithium-airbatteries, a post-lithium-battery solution, marking the second phase of collaborative research into next-generationlithium-ion battery cells.
In Japan, there are five major domestic manufacturers, five specialized domestic manufacturers and agrowing volume of imports from major United States and European manufacturers. The prolonged economicslump in the Japanese economy and the recent increases in environmental awareness have also shifted consumerpreference towards more affordable automobiles such as compact and subcompact vehicles and towards utility
18
vehicles such as mini-vans. For more than 40 years, Toyota has maintained its position as the largest automobilemanufacturer in Japan. Every year since fiscal 1999, Toyota, excluding Daihatsu and Hino, has achieved amarket share (excluding mini-vehicles) of over 40%, reflecting in part the success of the introduction of newmodels for subcompact and compact cars, mini-vans and sedans. In August 2005, Toyota launched the Lexusbrand in Japan and achieved a record top market share of 25.6% in the luxury market in 2011. Toyota aims tofurther distinguish the Lexus brand by continuing to attract new and affluent customers including customers thattypically had purchased imported vehicles.
North America
The North American region is one of Toyota’s most significant markets. Toyota has reorganized itsproduction structure and made improvements to its product lineup. In addition, Toyota is actively working topromote increased local operations independence in North America, in accordance with the Toyota GlobalVision, announced in 2011.
In the North American region, of which the U.S. is the center, Toyota has a wide product lineup (excludinglarge trucks and buses), and sold 2,839 thousand vehicles on a consolidated basis in fiscal 2016. This representsapproximately 33% of Toyota’s total unit sales on a consolidated basis. The U.S., in particular, is the largestmarket in the North American region, accounting for 89% of the retail sales of Toyota in such region. Salesfigures for fiscal 2016 were 104.6% of those in the prior fiscal year.
Toyota commenced sales of the first-generation Prius hybrid model in North America in 2000. The Priusbecame Toyota’s bestselling model behind the Corolla and Camry, having gained particular support amongcustomers concerned with the environment. Toyota introduced the first hybrid model under the Lexus brand, theRX400h, and the Highlander hybrid in 2005. Toyota continued further expansion of its environmentally friendlyvehicles with the introduction of models such as the CT200h in 2011, the ESh and the Avalon HV in 2012, theNXh in 2014 and the all-new Prius and the fuel cell vehicle MIRAI in 2015.
Since the introduction of the LS and ES models under the premium brand model, Lexus, in the United Statesin 1989, Toyota has expanded its Lexus sales with models including the GS, IS and RX. In 2013, Toyotaintroduced the new IS model, and unit sales reached 274 thousand units. Toyota is seeking to steadily increasesales every year and achieved sales of 311 thousand units through the introduction of the new NX and RC modelsin 2014 and 344 thousand units through the introduction of the new RX model in 2015.
Toyota is continuing to revise its vehicle models and North American production capacities in response tochanges in market conditions. Starting 2011, Toyota, instead of importing from Japan, began production of theCorolla at its Mississippi plant. In 2013, the production capacity at the Woodstock plant in Canada increasedfrom 150 to 200 thousand units per year, and the production capacity at the Indiana plant also increased. Toyotacommenced production of the RX450h hybrid model at its Cambridge plant in Canada in 2014. Through thebusiness alliance with Mazda Motor Corporation, the production of Toyota brand light vehicles for sale mainly inNorth America began at Mazda’s plant in Mexico in June 2015. In addition, Toyota commenced production ofthe Lexus ES350 at its Kentucky plant for sale in the North America market starting in October 2015.
In terms of auto parts, Toyota increased production capacity of engine plants in Kentucky and Alabama in2013 and 2014, respectively, to meet rising demand, and also increased production capacity of auto parts at itsautomatic transmission plant in West Virginia in 2014.
In order to further strengthen competitiveness in North America, Toyota will continue the realignment ofNorth American manufacturing operations going forward. As part of this effort, a new plant will be built inMexico in 2019 and production of the Corolla will be shifted from the plant in Canada to the new plant inMexico. In addition to the plant in Mississippi, compact cars will also be produced at the new plant. Toyota will
19
consider focusing its production of mid-sized vehicles in the plant in Canada, along with the plants in Indianaand Kentucky, by commencing production of mid-sized vehicles instead of the Corolla in Canada starting in2019.
As for Toyota’s vehicle development in North America, the Toyota Technical Center spearheads the design,planning, and evaluation of vehicles and parts as to their ability to meet customer needs. Toyota will continue topromote self-reliance towards producing even better cars in the future.
In April 2014, Toyota decided to relocate its North American headquarters for manufacturing, sales andmarketing, financial services and other functions to the city of Plano in northern Dallas, Texas. By unifying itsNorth American operations, Toyota plans to promote collaboration and efficiencies across functions, positionitself to deliver “ever-better cars” to customers and work towards realizing sustainable growth in theNorth America market. The relocation is expected to take place following the completion of the construction ofthe new headquarters in late 2016 or early 2017.
Europe
While competition continues to intensify, Toyota has expanded its lineup of hybrid models to furtherstrengthen its sales operations, and has entered into supply agreements with BMW and PSA for diesel enginesand light commercial vehicles, respectively. As a result, Toyota launched the BMW engine-equipped Verso inearly 2014 and started equipping the RAV4 with BMW engines beginning in 2015. Toyota also began sales oflight commercial vehicles supplied by PSA from mid-2013. In addition, Toyota is actively promoting productionand sales measures that meet local demand by strengthening its value chain including used car dealerships, after-sales services and finance and insurance services.
In 2015, while the market in Eastern European countries, mainly in Russia, continued to stagnate due tofactors such as a decline in crude oil prices, the European market expanded from the previous year as theEurozone market grew steadily due to its strong economy.
Sales in 2015 in Europe decreased from the previous year due to the slowdown in Eastern Europeancountries including Russia, but sales in the Eurozone exceeded the previous year’s sales due to the introductionof new models and increased sales of hybrid models. Moreover, annual sales in Turkey, Poland and Israelreached a record high. Going forward, Toyota will strive to maintain sales with the expansion of its productlineup while being responsive to market risks. Toyota’s consolidated vehicle sales in Europe in fiscal 2016 was844 thousand units, a decrease of 1.7% from fiscal 2015.
Toyota has in the past increased European production in response to sales growth, establishing ToyotaMotor Manufacturing (UK) Ltd. (“TMUK”) in 1992, Toyota Motor Manufacturing Turkey Inc. (“TMMT”) in1994 and Toyota Motor Manufacturing France S.A.S. (“TMMF”) in 2001. Further, in 2005, Toyota PeugeotCitroën Automobile Czech was formed as a result of a joint venture with PSA Peugeot Citroën as vehicle supplyfactories to Europe. At the time of the economic crisis in Europe, Toyota promptly reduced personnel and madeadjustments to its plant operations. In addition, in 2010, TMUK limited its production to one production line atits Burnaston plant. At the same time, Toyota conducted measures such as changing from a two-shift to a one-shift production operation at TMMT and change from a three-shift to a two-shift production operation at ToyotaMotor Manufacturing Poland SP.zo.o. To increase the utilization rate of these factories, Toyota began to transferthe production of the Corolla from South Africa to TMMT and commenced exporting the TMMF Yaris to NorthAmerica in 2013. Toyota plans to commence production of the compact crossover C-HR by increasing the annualproduction capacity of TMMT from 150,000 units to 280,000 units by the end of 2016.
Toyota opened the Toyota Motor Manufacturing Russia (“TMMR”) plant in 2007 as a base for itsmanufacturing operations in the Russian market. A two-shift production operation started in September 2012 andproduction capacity was increased from 20,000 units to 50,000 units per year. In addition, Toyota decided inSeptember 2013 to manufacture a second model, namely the RAV4. Moreover, OOO “Toyota Motor” (sales) and
20
TMMR were merged into one company at the end of 2013 to strengthen the business base and promotecoordination of manufacturing and sales operations. Toyota commenced contract assembly of the Land CruiserPrado by Sollers Bussan in Vladivostok in February 2013, but ended production at the end of June 2015. Toyotacommenced complete knock down, or CKD, production of the IMV Fortuner in Kazakhstan beginning in thespring of 2014.
Toyota’s principal European markets are Germany, France, the United Kingdom, Italy, Spain and Russia.Toyota’s principal competitors in Europe are Volkswagen, Renault, Ford, Opel and Peugeot, as well as Koreanmanufacturers Hyundai and Kia.
Asia
Toyota’s consolidated vehicle sales in Asia (including China) in fiscal 2016 was 1,345 thousand units, adecrease of 9.7% from fiscal 2015.
In light of the importance of the Asian market that is further expected to grow in the long term, Toyota aimsto build an operational framework that is efficient and self-reliant as well as a predominant position in theautomotive market in Asia. Toyota has responded to increasing competition in Asia by making strategicinvestments in the market and developing relationships with local suppliers. Toyota believes that its existinglocal presence in the market provides it with an advantage over new entrants to the market and expects to be ableto promptly respond to demand for vehicles in the region.
In this region, Toyota has been further strengthening its business foundations by improving its product line-up, expanding local procurement and increasing production capacities.
As an example of enhancing the product line-up, Toyota began producing IMVs (the Hilux, Fortuner andInnova) in Thailand, Indonesia, India, the Philippines and Malaysia in 2005 and in Vietnam in 2006.Furthermore, with increased production capacity, the Thailand plant now produces IMVs for export outside ofAsia, including to Australia and to the Middle East, contributing greatly to the expansion of Toyota’s automotivebusiness.
As part of Toyota’s efforts to expand business, Toyota Motor Thailand Co., Ltd. commenced production ofhybrid vehicles such as the Camry hybrid in 2009. Toyota also started operation of its second Gateway plant in2013, expanding production capacity by 80 thousand units in Thailand to 810 thousand units. In April 2015,Toyota implemented a full model change for IMV models manufactured at its plant in Thailand.
In India, Toyota constructed a second plant with an annual production capacity of 70 thousand units andcommenced production and sales of the Etios compact model designed specifically for the Indian market in 2010.Furthermore, Toyota increased production capacity in India during 2012 and 2013 to 210 thousand units.Moreover, Toyota began exporting the gasoline-fueled model of the Etios to South Africa from India in 2012.
In Indonesia, Toyota introduced the Etios and commenced operation of a second plant in Karawang in 2013in order to meet the diverse customer needs and the expanding market. In 2014, Toyota increased the initialproduction capacity of 70 thousand units per year to 120 thousand units per year with the introduction of the Viosand the Yaris, and also began exporting the Vios to the Middle East. Toyota also constructed a passenger vehicleengine plant that commenced production in February 2016. In Malaysia, Toyota began production of the Camryhybrid in March 2015, and is planning to reorganize its production structure there in 2019 by building a newplant dedicated to passenger vehicles while making the existing plant dedicated to commercial vehicles. Inaddition, in 2012 Toyota began production and sales of the Camry hybrid in Taiwan to accommodate the spreadof environmentally friendly vehicles. Moreover, in light of the free trade agreement between the U.S. and Korea,Toyota began sales of the U.S.-produced Camry in Korea in January 2012.
Toyota’s principal Asian markets are Thailand, Indonesia, India and Taiwan.
21
China
Toyota has been conducting operations in China through joint ventures, and its success in producingproducts that meet local demands and in establishing its sales and service network has significantly contributed toToyota’s profits. Based on the firm business foundation that it has established, Toyota is conducting itsoperations with the aim of promoting further growth and increasing profitability through further development ofits sales and service network and expansion of its product lineup.
In China, Toyota has been conducting joint ventures with two major partners. First, with respect to the jointventure with China FAW Group Corporation since Toyota first launched the Vios through the joint venture in2002, Toyota has been producing and selling the Land Cruiser Prado, the Land Cruiser, the Corolla, the CorollaHV, the Crown, the REIZ, the Coaster and the RAV4 in China. With regard to production capacity, in 2007,Toyota commenced production at the new Tianjin Teda plant, which has an annual production capacity of200 thousand units, and in 2012, commenced production at a new factory in Changchun, China, which has anannual production capacity of 100 thousand units. Toyota also increased annual production capacity of the plantin Sichuan from 30 thousand units to 50 thousand units in the spring of 2015 to increase production of the Prado.Toyota plans to construct a new production line to replace an aging existing line at the Tianjin Teda plant in themiddle of 2018.
GAC Toyota Motor Co., Ltd., a joint venture between Toyota and Guangzhou Automobile Group Co., Ltd.,commenced sales of the Camry in 2006, followed by production and sales of the Yaris, the Highlander, the E’z,the Levin and the Levin HV. In 2006, it commenced production at the first plant on a single shift basis with anannual production capacity of 100 thousand units and expanded its annual production capacity to 200 thousandunits on a double shift basis. In addition, a second plant commenced production in 2009 and Toyota plans tocomplete construction of a third plant in 2017. In terms of auto parts, in 2014, Toyota opened a plant inChangshu in Jiangsu, China for the production of the CVT as the first CVT plant outside of Japan. Toyota alsoopened a plant to produce hybrid vehicle batteries in October 2015.
Total vehicle sales in the Chinese market increased 4% from 24.03 million in 2014 to 25.00 million in 2015.In this market, Toyota’s sales in 2015 were 1.12 million vehicles, up 9% from the previous year. In the passengervehicle market (19.29 million units), Toyota had a market share of 6%. In 2015, favorable conditions in the less-than-1.6 liter market continued, and in particular sales of SUVs expanded as a result of customers’ valuediversification. As for Toyota’s distribution network, Toyota has been expanding the distribution network forlocally produced vehicles in cooperation with Chinese joint venture partners under Tianjin FAW Toyota MotorCo., Ltd. and Guanqi Toyota Motor Co., Ltd., and for imported vehicles, Toyota has also been expandingprimarily the Lexus brand sales network. Toyota plans to further increase sales by expanding the number ofdealers and the product lineup for both locally produced and imported vehicles, particularly inland. In addition,as the market in China develops, Toyota plans to promote the so-called “Value Chain” businesses such as usedcars, services, financing and insurance.
South and Central America, Oceania, Africa and the Middle East
Toyota’s consolidated vehicle sales in South and Central America, Oceania, Africa and the Middle East(collectively, the “Four Regions”) in fiscal 2016 were 1,594 thousand units, a decrease of 9.2% from fiscal 2015.The core models in this region are global models such as the Corolla, IMV (the Hilux) and Camry. In order toincrease production of IMVs, Toyota expanded the annual production capacity of its Argentina factory from70 thousand units to 90 thousand units in 2011. Toyota further increased annual production capacity to140 thousand units per year at the end of 2015 and is seeking to increase production to meet demand after 2016.In order to expand business in Brazil, Toyota constructed a new factory in Sorocaba with an annual productioncapacity of 70 thousand units, and in 2012, began production and sales of compact vehicles. Starting from thebeginning of 2016, Toyota increased production capacity to 110 thousand units per year. Further, Toyota beganlocal production of the Fortuner in Egypt in 2012. Moreover, in terms of auto parts, Toyota commencedproduction at a plant in Brazil for passenger vehicle engines in February 2016.
22
Toyota decided to end production of vehicles and engines at Toyota Motor Corporation Australia Ltd. by theend of 2017.
In these regions, which are expected to become increasingly important to Toyota’s business strategy, Toyotaaims to develop new products which meet the specific demands of each region, increase production and furtherpromote sales.
Toyota’s principal markets in the Four Regions are Brazil in South and Central America, Australia inOceania, South Africa in Africa and Saudi Arabia in the Middle East.
Production
Toyota and its affiliated companies produce automobiles and related parts and components through morethan 50 overseas manufacturing companies in 28 countries and regions besides Japan. Toyota’s majormanufacturing facilities include plants in Japan, the United States, Canada, the United Kingdom, France, Turkey,Thailand, China, Taiwan, India, Indonesia, South Africa, Australia, Argentina and Brazil. Daihatsu brandvehicles are produced at 4 factories in Japan and 4 manufacturing companies in 3 other countries, includingIndonesia and Malaysia. Hino brand vehicles are produced at 2 factories in Japan and 10 manufacturingcompanies in 10 countries, including Indonesia and Thailand. For a listing of Toyota’s principal productionfacilities, see “Information on the Company — Property, Plants and Equipment.”
In promoting a sustainable growth strategy, establishing a system capable of providing optimal supply ofproducts in the global market is integral to Toyota’s strategy.
In line with its basic policy of manufacturing where there is demand and where Toyota is truly competitive,Toyota will make efficient use of and maximize capacity utilization at its existing plants to respond to theexpanding market and will continue to focus on making efficient capital investments as necessary. Furthermore,Toyota will continue to place top priority on safety and quality in strengthening true competitiveness with theaim of achieving sustainable growth.
In 2015, 75.1% of Toyota vehicles sold in overseas markets were manufactured in overseas plants byToyota and its unconsolidated affiliated companies. In 2015, approximately 72.2% of Toyota vehicles sold inNorth America were produced in North America. Of the vehicles sold in Europe in 2015, approximately 76.3%were produced in Europe. In fiscal 2016, Toyota produced on a consolidated basis 3,981 thousand vehicles inJapan and 4,595 thousand vehicles overseas, compared to 4,125 thousand vehicles in Japan and 4,805 thousandvehicles overseas in fiscal 2015.
The following table shows the worldwide vehicle unit production by Toyota for the periods shown. Theseproduction figures do not include vehicles produced by Toyota’s unconsolidated affiliated companies. The salesunit information elsewhere in this annual report includes sales of vehicles produced by these affiliatedcompanies. Vehicles produced by Daihatsu and Hino are included in the vehicle production figures set forthbelow.
Year Ended March 31,
2012 2013 2014 2015 2016
Units Produced . . . . . . . . . . . . . . . . . . . . . . . . . . . . 7,435,781 8,698,454 9,032,165 8,929,887 8,575,899
Toyota closely monitors its actual units of sale, market share and units of production data and uses thisinformation to allocate resources to existing manufacturing facilities and to plan for future expansions.
See “— Capital Expenditures and Divestitures” for a description of Toyota’s recent investments incompleted plant constructions and for a description of Toyota’s current investments in ongoing plantconstructions.
23
The Toyota Production System
Toyota pioneered the internationally recognized production system known as the “Toyota ProductionSystem.” The Toyota Production System is based on Toyota’s own concepts of efficient production of onlynecessary and quality products and efficient cost reduction, and has the following two principal elements:
• “Just-in-Time,” and
• “Jidoka.”
Just-in-Time is an approach in which necessary parts and components are manufactured and delivered in justthe right quantity in a timely manner just as they are needed. This allows Toyota to maintain low levels ofinventory while maintaining operating efficiency.
Jidoka is a production concept which involves immediate stop of work when problems arise in theproduction line in order to stop the production of defective items from being passed on to subsequent stages ofthe process, and therefore making quality assurance an inherent part of the production process. To achieve this,Toyota’s equipment is designed to detect and highlight abnormalities and to stop whenever abnormalities occur.Toyota also authorizes its machine operators and other members of its production team to stop productionwhenever they note anything suspicious. This helps Toyota to build quality into the production process byavoiding defects and preventing the waste that would result from producing a series of defective items.
Toyota believes that the Toyota Production System allows it to achieve mass-production efficiencies even inhigh-mix, low-volume production. This belief gives Toyota the flexibility to respond to changing consumerdemand without significantly increasing production costs. While the Toyota Production System remains the basisof Toyota’s automobile production, the system has been expanded for use in Toyota’s parts production, logisticsand customer service activities as well.
Through the Toyota Production System, issues are identified and analyzed at the actual site, the entireproduction process is made visible and production efficiency as well as product quality are improved through theapplication of measures to address the sources of problems. As one method to implement these measures, Toyotautilizes sophisticated information technologies to improve each step of its vehicle development process, fromproduct planning to commencement of mass-production. These technologies are intended to enhance flexibility,simplification, quality, cost competitiveness and speed. Specifically, detailed virtual assembly and othersimulations of manufacturing processes are conducted on computers for a new vehicle or new productionequipment/systems before a prototype is made. An actual prototype is made only after defects and related issueshave been identified and resolved by computer simulation, thereby minimizing the time required for rebuildingprototypes and significantly shortening the time required before starting mass production. Moreover, this systemis used to prepare virtual factories and other visual aids in order to facilitate training and communication atoverseas plants and enable the efficient transfer of necessary technology and skills.
In order to strengthen manufacturing and promote localization of overseas production, Toyota establishedthe Global Production Center (“GPC”) in July 2003 as a development and training center for global humanresources. The GPC is intended to introduce local managers to the Toyota methodology, allowing them to traintheir subordinates while managing locally. GPC develops simple, easy-to-understand and efficient trainingsystems for the development of explicit knowledge. One characteristic of the GPC is that managers andsupervisors, new hires and experienced workers can all receive common skill-training. GPC’s training systeminvolves a pre-training phase where trainees learn basic skills and discover the skills that they must acquirethrough image training. This is followed by various steps, from basic skill training and elemental task training tostandard task training, which ensures a step-by-step training. The fruits of this training method are reducedtraining time, higher levels of achievement and the efficiency of training. Since January 2006, Toyota has openedregional GPCs in North America, Europe and Asia. In each region, Toyota commenced courses where traineesfrom each department are trained by local trainers to become trainers themselves.
24
In April 2015, the GPC was reorganized into TPS Promotion Center in order to promote TPS (ToyotaProduction System) and activities centering on improving production engineering and manufacturing methods ateach manufacturing process by sharing global best standards in cooperation across different plants in order tofoster highly skilled workers and improve logistics in order to comprehensively improve manufacturing abilities.Through these activities, Toyota has been making efforts to resolve issues relating to the entire supply chain.
Toyota is working company-wide towards the production of “ever-better cars.” The production engineeringand manufacturing divisions are developing Toyota’s own innovative production systems, equipment andprocessing technologies and deploying them in production lines in order to produce vehicles that createexcitement, joy and fun for customers through truly competitive manufacturing methods.
Distribution
Toyota’s automotive sales distribution network is the largest in Japan. As of March 31, 2016, this networkconsisted of 280 dealers employing approximately 33 thousand sales personnel and operating approximately4.7 thousand sales and service outlets. Toyota owns 15 of these dealers and the remainder is independent.
Toyota believes that this extensive sales network has been an important factor in its success in the Japanesemarket. A large number of the cars sold in Japan are purchased from salespersons who visit customers in theirhomes or offices. In recent years, however, the traditional method of sales through home visits is being replacedby showroom sales and the percentage of automobile purchases through showrooms has been graduallyincreasing. Toyota expects this trend to continue, and accordingly, is working to improve its sales activities suchas customer reception and meticulous service at showrooms to increase customer satisfaction.
Sales of Toyota vehicles in Japan are conducted through four sales channels — “Toyota,” “Toyopet,”“Corolla” and “Netz.” In addition, Toyota introduced the Lexus brand to the Japanese market in August 2005,and currently distributes the Lexus brand vehicles through a network of 169 sales outlets in order to enhance itscompetitiveness in the domestic luxury automobile market. The following table provides information for eachchannel as of March 31, 2016.
Dealers
ChannelToyotaOwned Independent Total Market Focus
Toyota . . . . . . . . . . . . . . 4 45 49 Luxury channel for Toyota brand vehiclesToyopet . . . . . . . . . . . . . 4 48 52 Leading channel for the medium marketCorolla . . . . . . . . . . . . . 4 70 74 Volume retail channel centering on compact modelsNetz . . . . . . . . . . . . . . . . 3 102 105 Sales channel targeting customers with new values for
the 21st century
BrandSales
Outlets Market Focus
Lexus . . . . . . . . . . . . . . . . . . . . . . . . . . . . . . . . 169 Premium brand
Outside Japan, Toyota vehicles are sold through approximately 170 distributors in approximately190 countries and regions. Through these distributors, Toyota maintains networks of dealers. The chart belowshows the number of Toyota distributors as of March 31, 2016 by country and region:
Country/Region Number of Countries Number of Distributors
North America . . . . . . . . . . . . . . . . . . . . . . . . . . . . . . . . . . . . . . . . . . . . 3 5Europe . . . . . . . . . . . . . . . . . . . . . . . . . . . . . . . . . . . . . . . . . . . . . . . . . . 53 30China . . . . . . . . . . . . . . . . . . . . . . . . . . . . . . . . . . . . . . . . . . . . . . . . . . . 1 4Asia (excluding China) . . . . . . . . . . . . . . . . . . . . . . . . . . . . . . . . . . . . . 19 12Oceania . . . . . . . . . . . . . . . . . . . . . . . . . . . . . . . . . . . . . . . . . . . . . . . . . 17 15Middle East . . . . . . . . . . . . . . . . . . . . . . . . . . . . . . . . . . . . . . . . . . . . . . 16 14Africa . . . . . . . . . . . . . . . . . . . . . . . . . . . . . . . . . . . . . . . . . . . . . . . . . . . 55 48Central and South America . . . . . . . . . . . . . . . . . . . . . . . . . . . . . . . . . . 30 40
25
Improving Efficiency
Toyota is working on the following to create a corporate structure allowing for efficient development,production and sales that can respond flexibly to changes in the external environment:
• working with suppliers as one team to dramatically increase the efficiency of development;
• creating a production structure that can better withstand fluctuations in demand and currency exchangerates; and
• strengthening sales capabilities in line with local conditions.
Toyota also plans to improve profitability and enhance operating efficiency by continuing to pursueaggressive cost reduction programs, including:
• improving product development and production efficiencies through the re-integration and improvementof vehicle platforms and power trains as well as through the development of electronic platforms whichorganize electronic devices of vehicles as a package and standardize electronic structure andinfrastructure;
• implementing Ryohin-Renka Cost Innovation (“RR-CI”) activity, which aims for the elimination ofwaste in all processes from design to production while ensuring the reliability and safety of each part;
• applying advanced information technologies to improve efficiency throughout the product developmentand production processes;
• promoting global reinforcement of the supply base under an open and fair purchasing policy;
• streamlining production systems; and
• improving the efficiency of domestic and international distribution.
Toyota is further improving production efficiency by installing more versatile equipment and systems,modifying vehicle body designs to allow for a greater variety of models on each production line and sharingmore parts among vehicles, not simply among different models but also among different platforms.
In April 2012, Toyota announced a new development framework, the TNGA, which reconciles sweepingadvances in product appeal with cost reductions. The new framework sets forth an architecture that incorporatesnot only the three fundamental vehicle functions of moving, turning and stopping, but also ergonomics such asdriving position as well as freedom of design. Toyota plans to efficiently develop cars with high basic-performance attributes by developing parts and modules based on this architecture. The TNGA provides forhandling multiple models simultaneously in grouped development projects that will increase the sharing of partsand core vehicle components. This sharing, carried out in cooperation with suppliers, will result in lowered costs,thereby allowing developmental manpower and funds to be reinvested in R&D to meet consumer preferences andR&D to meet regional needs, resulting in further product improvement.
By April 2013, Toyota established systems to rapidly promote the TNGA and carried out productdevelopment under this new way of doing business. As a result, Toyota realized high basic performance andmarketability in the Prius that was introduced in Japan in December 2015. Toyota plans to roll out the results ofdevelopment to other vehicles.
Enhancing Vehicle Functionality and Realizing a Smart Mobility Society
Toyota is striving to realize a smart mobility society in which people feel at ease and excited about being incars and in everyday life by connecting vehicles, people and communities in order to meet the needs of rapidlychanging societies, including the falling birth rate and aging populations in developed nations and an increasinglydiverse range of energy sources, among others. In particular, Toyota aims to contribute to an affluent lifestyle
26
that offers peace of mind by enhancing vehicle functionality that will increase the attractiveness of vehicles andthe excitement of driving, enhancing transport systems that make being in cars more comfortable and moreenvironmentally friendly, and realizing Smart Communities that aim for optimization of local energy use andestablishment of a low-carbon emission transportation system.
Enhancing Vehicle Functionality — Information Service Functions
To Toyota, enhancing vehicle functionality means advancing information service functions that integratevehicles with telecommunication systems, and driving assistance functions that use communication technologiesand sensor technologies to create vehicles with intelligent features. Information service functions can improveconvenience and enrich the driving experience through information communication technologies that add newfunctions that are connected to the basic vehicle functions of “running, turning and stopping.” Examples includethe following:
• Toyota is advancing enhancement of car navigation systems, such as car parking maps that displaydetailed information inside car parks, as well as the VICS system (Vehicle Information andCommunication System) that provides real-time road traffic information such as congestion, accidents,traffic restrictions and parking. Car navigation systems play an increasingly important role in providingdrivers with various types of information on safety, smooth traveling, comfort and convenience.
• T-Connect/G-BOOK is the latest information network service that merges the latest networktechnologies and car multimedia a step ahead of the arrival of the ubiquitous network society.T-Connect/G-BOOK provides various types of information useful for driving, as well as safety andsecurity services that detect unusual conditions in the vehicle, thereby supporting a lifestyle with one’svehicles anytime and anywhere through a network. In 2005, Toyota started G-BOOK ALPHA andG-Link for Lexus, each with additional various features including traffic congestion forecast service. In2007, Toyota launched G-BOOK mX, which in addition to the well-received conventional safety andsecurity services of G-BOOK, introduced even more useful car navigation services such as“Map-on-Demand” — the world’s first technology for automatically updating map data — and “ProbeCommunication Traffic Information” that provides drivers with highly precise information on trafficcongestion. In 2014, Toyota launched T-Connect, which in addition to conventional telematics services,provides new services and functions through the distribution of applications to on-board device, as wellas destination and other information searches through the adoption of a voice recognition system.
• HELPNET is an emergency dial system that, in the event of a traffic accident or medical emergency,transmits information required for emergency rescue, such as present-location data and vehicle details,either automatically or with the touch of a button. It immediately contacts police and fire departmentsthrough the HELPNET Operation Center. This system is integrated into T-Connect/G-BOOK andG-Link to improve the quality of services. HELPNET shortens the time taken to report following anemergency situation, which contributes to decreasing the number of traffic accident fatalities andreducing the level of impact, while at the same time aiming to prevent secondary disasters and easetraffic congestion.
In addition to the above, Toyota also operates a Japanese-language web portal for automobile information,GAZOO.com. The name “GAZOO” originates from the Japanese word gazo, meaning images. GAZOO wasestablished as an Internet membership service linking Toyota, its national dealer network and GAZOO members,and has provided information on new and used Toyota vehicles and related services, as well as online shoppingservices. GAZOO currently provides information on not only Toyota vehicles but also other automakers, as wellas offering a rich blog feature as a social networking portal site on automobiles. In addition, GAZOO featuresGAZOO Racing and Gazoo mura, through which Toyota aims to expand the fan base of car enthusiasts bypromoting activities such as user-participatory motor sports, where customers can experience in real life theenjoyment that cars offer, to further complement its contents line-up. Toyota utilized its GAZOO technology tofurther expand its automobile information service by launching the G-BOOK telematics service in Japan in fall2002 and G-Link, which is a service exclusive to Lexus, in August 2005. Toyota also offers a theft detectionsystem, vehicle tracking service and operator support service as standard services to enhance services aiming to
27
provide safety, security and comfort for T-Connect/G-BOOK and G-Link users in their lifestyle using vehicles.With G-BOOK mX announced in April 2007, Toyota started offering services that allow drivers to use moreconvenient navigation systems such as “Map-on-Demand” — the world’s first technology for automaticallyupdating map data. In addition, Toyota has further strengthened its linkage between GAZOO and G-BOOK andhas, for example, allowed map information searched on a blog on GAZOO.com to be used on G-BOOK, furthermaturing as a comprehensive telematics service. In Japan, Toyota is seeking to promote the use of theT-Connect/G-BOOK by equipping all Lexus models and certain Crown models with the T-Connect/G-BOOK asa standard feature. Toyota has also licensed its T-Connect/G-BOOK technology to certain other competitors inJapan. Toyota is applying the technology and experience which it has accumulated in Japan to regions outsideJapan; G-BOOK services were introduced in China in March 2009, and unique telematics services in the UnitedStates were launched in August 2009. In addition, Toyota began offering telematics services for smartphones inDecember 2010 in Japan, and began to offer the same service in Thailand in March 2012 and the Middle Eastfrom January 2014 (UAE, Qatar and Lebanon in January 2014, Saudi Arabia in August 2014, Bahrain inOctober 2014 and Kuwait in January 2015).
In addition, in March 2004, Toyota launched its CRM (Customer Relationship Management) system callede-CRB (evolutionary Customer Relationship Building) in Thailand. e-CRB builds on a technology cultivatedthrough the development of Gazoo and G-BOOK and offers its customers a variety of services such as providinginformation on new vehicles, accepting requests for brochures and estimates and notifying customers when it istime for maintenance by keeping track of the vehicle’s maintenance history and mileage. In addition, e-CRBoffers an advanced operation system that can be utilized comprehensively at dealers including new and used carsand services. Toyota is promoting e-CRB in countries such as China, Thailand, Australia, India and Brazil wheresteady progress has been made as the service-in ratio has increased. In 2013, Toyota introduced thenext-generation e-CRB that adopts tablet terminals (portable information processing terminals) in China. Thesetablet terminals are supporting the improvement of customer satisfaction at points of sale and in after-saleservice.
Toyota also introduced a system called Sales Logistics Integrated Management (“SLIM”) in Guangzhou,China and India. By utilizing real sales information and linking with production and distribution, Toyota is ableto realize the Just-in-Time production system of producing and delivering only the number of vehicles that havebeen sold. SLIM has been recognized to significantly increase the freshness of inventory and improve cash flow.
In September 2010, Toyota announced its smart-grid initiatives, which are intended to demonstrate efficientenergy use toward the realization of a low-carbon and energy-saving society. By utilizing technology cultivatedthrough the Internet and telematics services mentioned above, Toyota developed the Toyota Smart Center(“TSC”) that optimally controls electricity and links EV (electric vehicles) and PHV (plug-in hybrid vehicles)with homes, and conducted a demonstration project in Rokkasho Village in Aomori aimed at reducing overallCO2 emissions and users’ electricity costs. In addition, in order to develop a global platform of the TSC, Toyotaannounced a partnership with Microsoft Corp. in April 2011 and a partnership with Salesforce.com in May 2011.Toyota plans to utilize the cloud technology of these two companies in its Internet and telematics services tobuild a framework for TSC’s global implementation. In January 2012, Toyota began eConnect and “TOYOTAfriend” services for PHV. In May 2013, Toyota utilized the latest version of Microsoft’s SharePoint tocomprehensively redesign GAZOO, the automobile information portal site. Toyota aims to offer new services,achieve better vehicle quality and enhance product attractiveness as well as contribute further to society byutilizing the vehicle information, road conditions and other parameters collected via telematics services andstored at the TSC. With regard to contribution to society, Toyota began offering the Big Data Traffic InformationService in June 2013, through which traffic information, statistics and other related information are provided tolocal governments, universities and businesses to support traffic flow improvement and assist disaster preventionmeasures. Toyota plans to continue to work with new information technologies and the IT industry to establish aframework for TSC’s global implementation and to realize a mobility society of the future.
In 2016, Toyota has been working actively on “connected car technology” and alliances with othercompanies for effective vehicle data utilization to “make ever-better cars” and for safer and securer “connected”
28
service. In January 2016, Toyota announced a “connected vehicle framework” to increase installation of a DataCommunication Module (DCM) into a broader range of its vehicles starting in the United States from 2017. InApril 2016, Toyota established a new company, “Toyota Connected, Inc.,” in the United States to consolidateand analyze information collected from vehicles and to develop new products, and thereby promoting “makingever-better cars” through utilizing big data. In addition, Toyota is collaborating with insurance companies ondeveloping insurance services as well as tying up with a sharing service company, thereby actively advancingresearch for new services and the realization of a mobility society utilizing big data.
Enhancing Vehicle Functionality — Driving Assistance Functions
Toyota’s driving assistance functions offer functions that assist drivers with an aim to lessen the burden ofdriving, enhance safety and provide to everyone the pleasure of driving. Toyota has commercializedenhancements to various functions that assist the driver in sensing external information, avoiding danger andmaking appropriate maneuvers. Examples of driving assistance functions include the following:
• VDIM (Vehicle Dynamics Integrated Management) is a system that constantly monitors the driver’soperations and the vehicle’s situation and centrally manages the engine, steering mechanisms andbrakes. By stabilizing the vehicle before the driver loses control of the vehicle, VDIM achieves a highlevel of ‘active safety’ and improves driving performance, consisting namely of running, turning andstopping.
• “Pre-collision System” is a system that perceives possibilities of a crash with obstacles, cars in front orcrossing pedestrians through a sensor installed in a vehicle. If a collision seems likely, it proceeds toactivate warnings as well as brake assistance, which aids the driver’s operation of the brake, or theautomatic braking system, which aids in avoiding the collision altogether or mitigates any damage.
• “Radar Cruise Control (with all-speed tracking function)” allows the vehicle to keep a constant distancebetween itself and the preceding vehicle within a speed range from zero to a preset speed, automaticallyslowing down and stopping if necessary to avoid collision. When the car in front speeds up, it allows thedriver to accelerate.
• “Lane Departure Alert” is a system that uses a camera to detect white or yellow lane markers whiledriving. The system warns the driver with a buzzer and displays if it detects possible deviation in orderto assist in avoiding a collision accident resulting from deviation. In addition, “Lane Keeping AssistSystem,” a system that assists the driver’s operation of the steering wheel with electric power steering inorder to help keep the vehicle traveling between lane markers, has been developed.
• “Automatic High Beam” detects the headlights of oncoming vehicles or taillights of vehicles running infront and adjusts the headlight range, automatically switching to low beam or high beam, in order toavoid dazzling the visions of the drivers with bright lights, as well as to secure the drivers’ forwardvisions at night.
• “Blind Spot Monitor” is a system which aims to reduce accidents by alerting the driver to other vehiclesin the driver’s blind spot diagonally behind the driver’s seat with sound and visual display in the sidemirrors while changing lanes.
From these driving assistance functions, in 2015 Toyota commercialized the Toyota Safety Sense, acollision avoidance support package that includes the Pre-collision System, the Lane Departure Alert and theAutomatic High Beam. By the end of 2017, Toyota plans to install this package on nearly all models sold inJapan, the United States and Europe at an affordable price aimed at widespread adaption.
Enhancing Transport Systems
Enhancing transport systems requires taking a general approach that addresses various factors across a widescope that are pertinent not only to vehicles but also roads, people and public transport systems in order to ensure
29
smooth and efficient movement of people and vehicles and to build a safe transportation environment. In additionto VICS and ETC (Electronic Toll Collection System), which are already standard in Japan, the “CooperativeITS,” which combines cutting edge IT and vehicle technology, is in development and has begun to be partiallyimplemented.
• The “ITS Spot Service” commenced in 2009 and corresponding products are available for purchase.Mainly for use on highways, this service provides drivers with information related to road traffic andsafe driving that is transmitted from road infrastructures to car navigation systems through video andvoice.
• In the summer of 2011, Toyota introduced products corresponding to the driving safety support system,“DSSS,” which the National Police Agency has started operating. Mainly for use on normal roads, thissystem supports safe driving, including by preventing the driver from overlooking red lights, bytransmitting traffic control information (such as traffic lights and signs) and other local informationfrom road infrastructures to automobiles.
• Aiming at further reducing accidents, improving fuel efficiency and reducing CO2 emissions, “ITSConnect,” a new driving safety support system that uses a dedicated ITS frequency of 760 MHz, wasintroduced in the fall of 2015. Through direct and continuous exchange of information between vehiclesand the road and among vehicles, this system aims to mitigate accidents near intersections, which havebeen difficult to mitigate to date. The system also includes Communicating Radar Cruise Controlfeatures, which supports fuel efficient driving and smooth acceleration and deceleration when followingbehind another vehicle. Toyota plans to continue development aimed at the realization of a society inwhich all drivers can move safely, smoothly and freely.
Toyota is committed to developing new ITS products. Toyota believes that intelligent transport systems willbecome an integral part of its overall automotive operations and enhance the competitiveness of its vehicles. Asfamiliarity with and demand for ITS products grow, Toyota expects an increasing number of ITS products tobecome commercially available and achieve greater acceptance each year.
Smart Communities
In April 2010, Toyota City was selected as a “Model Region for Next-Generation Energy Systems” by theMinistry of Economy, Trade and Industry. Toyota has since joined the “Toyota City Low-Carbon SocietyVerification Council” (established in August 2010), and carried out experiments relating to the “Optimization ofLocal Energy Use in Households and Destinations (commercial and public facilities)” and “Establishment of aSystem for Low-Carbon Emission Transportation.” In addition, starting in October 2014, Toyota launched anexperimental ultra-compact electric vehicle sharing program in Grenoble, France, together with the city ofGrenoble and local companies, and in Tokyo and Okinawa from April 2015 and January 2016, respectively.
In February 2013, Toyota, together with Toyota affiliated companies, established the “F-Grid Ohira, MiyagiLimited Liability Partnership,” a smart community business which operates the “F-Grid” in the Northern SendaiIndustrial Park in the village of Ohira, Miyagi. The Partnership began supplying electricity and heat to partners inthe industrial park in April 2013. This business aims to contribute to “creating a safe and secure community withthe community and the industrial park working as one,” “revitalizing local industry” and “revitalizing thecommunity.” Toyota believes that the elemental technologies developed through these experiments andbusinesses will help in the creation of new systems for society that meet differing social environments andmunicipal needs, not just in Japan but around the world, in both developed and emerging countries, and will playa role in the creation of energy and transportation infrastructure to help spread next-generation eco-cars.
Financial Services
Toyota’s financial services include loan programs and leasing programs for customers and dealers. Toyotabelieves that its ability to provide financing to its customers is an important value-added service. In July 2000,
30
Toyota established a wholly-owned subsidiary, Toyota Financial Services Corporation (“TFSC”), to oversee themanagement of Toyota’s finance companies worldwide, through which Toyota aims to strengthen the overallcompetitiveness of its financial business, improve risk management and streamline decision-making processes.Toyota has expanded its network of financial services, in accordance with its strategy of developing auto-relatedfinancing businesses in significant markets. Accordingly, Toyota currently operates financial services companiesin 36 countries and regions, which support its automotive operations globally.
Toyota’s revenues from its financial services operations were ¥1,896.2 billion in fiscal 2016,¥1,661.1 billion in fiscal 2015 and ¥1,421.0 billion in fiscal 2014. In fiscal 2015, amid a gradual recovery inmarkets mainly in the United States, Toyota collaborated with dealers in various countries and regions, and thebalance of loan receivables increased steadily. In fiscal 2016, although economic weakness was seen in areassuch as Asia, including China, recovery in the United States, among other places, continued. In such anenvironment, as a result of Toyota’s continued collaboration with dealers in various countries and regions andefforts to expand products and services that meet customer needs, Toyota’s share of financing provided for newcar sales of Toyota and Lexus vehicles in regions where TFSC operates remained at a high level of 36% and thebalance of loan receivables, mainly in the United States, continued to increase steadily. Meanwhile, Toyota ismaking efforts to provide both its customers and dealers with stable financial services by diversifying its fundingmechanisms with ABCP (Asset Backed Commercial Paper) and ABS (Asset Backed Securities), in addition tomid- to long-term financings, primarily in commercial paper issuances, corporate bonds and bank borrowings.Toyota continued to perform detailed credit appraisals and serve customers by monitoring bad debt and loanpayment extensions, and the percentage of credit losses remained low, at 0.36% and 0.31% in fiscal years 2016and 2015, respectively. Toyota continues to work towards improving its risk management measures inconnection with credit and residual value risks.
Toyota Motor Credit Corporation is Toyota’s principal financial services subsidiary in the United States.Toyota also provides financial services in 35 other countries and regions through various financial servicessubsidiaries, including:
• Toyota Finance Corporation in Japan;
• Toyota Credit Canada Inc. in Canada;
• Toyota Finance Australia Ltd. in Australia;
• Toyota Kreditbank GmbH in Germany;
• Toyota Financial Services (UK) PLC in the United Kingdom;
• Toyota Leasing (Thailand) Co., Ltd. in Thailand; and
• Toyota Motor Finance (China) Co., Ltd. in China.
Toyota Motor Credit Corporation provides a wide range of financial services, including retail financing,retail leasing, wholesale financing and insurance. Toyota Finance Corporation also provides a range of financialservices, including retail financing, retail leasing and credit cards. Toyota’s other finance subsidiaries provideservices including retail financing, retail leasing and wholesale financing.
In April 2013, Toyota established Toyota Financial Services Kazakhstan MFO LLP, a financial servicescompany, in Kazakhstan, which began operations in January 2014. In addition, in June 2016, Toyota establishedToyota Financial Services Portugal Limited, a financial services company, in Portugal as a branch of ToyotaKreditbank GmbH.
Net finance receivables for all of Toyota’s dealer and customer financing operations were ¥14,555.6 billionas of March 31, 2016, representing a decrease of 5.9% as compared to the previous year. The majority ofToyota’s financial services are provided in North America. As of March 31, 2016, 59.1% of Toyota’s financereceivables were derived from financing operations in North America, 11.9% from Asia, 10.3% fromEurope, 8.3% from Japan and 10.4% from other areas.
31
Approximately 50% of Toyota’s unit sales in the United States during fiscal 2016 included a finance orlease arrangement with Toyota. Because the majority of Toyota’s financial services operations are related to thesale of Toyota vehicles, a decrease in vehicle unit sales may lead to a contraction of Toyota’s financial servicesoperations.
The worldwide financial services market is highly competitive. Toyota’s competitors in retail financing andretail leasing include commercial banks, credit unions and other finance companies. Commercial banks and otherautomobile finance subsidiary companies serving their parent automobile companies are competitors of Toyota’swholesale financing activities. Competitors in Toyota’s insurance operations are primarily national and regionalinsurance companies.
For information on Toyota’s finance receivables and operating leases, please see “Operating and FinancialReview and Prospects — Operating Results — Financial Services Operations.”
Retail Financing
Toyota’s finance subsidiaries acquire new and used vehicle installment contracts primarily from Toyotadealers. Installment contracts acquired must first meet specified credit standards. Thereafter, the financecompany retains responsibility for installment payment collections and administration. Toyota’s financesubsidiaries acquire security interests in the vehicles financed and can generally repossess vehicles if customersfail to meet their contractual obligations. Almost all retail financings are non-recourse, which relieves the dealersfrom financial responsibility in the event of repossession. In most cases, Toyota’s finance subsidiaries requiretheir retail financing customers to carry automobile insurance on financed vehicles covering the interests of boththe finance company and the customer.
Toyota has historically sponsored, and continues to sponsor, special lease and retail programs by subsidizingbelow market lease and retail contract rates.
Retail Leasing
In the area of retail leasing, Toyota’s finance subsidiaries acquire new vehicle lease contracts originatedprimarily through Toyota dealers. Lease contracts acquired must first meet specified credit standards after whichthe finance company assumes ownership of the leased vehicle. The finance company is generally permitted totake possession of the vehicle upon a default by the lessee. Toyota’s finance subsidiaries are responsible forcontract collection and administration during the lease period. The residual value is normally estimated at thetime the vehicle is first leased. Vehicles returned to the finance subsidiaries at the end of their leases are sold byauction. For example, in the United States, vehicles are sold through a network of auction sites as well as throughthe Internet. In most cases, Toyota’s finance subsidiaries require lessees to carry automobile insurance on leasedvehicles covering the interests of both the finance company and the lessee.
Wholesale Financing
Toyota’s finance subsidiaries also provide wholesale financing primarily to qualified Toyota vehicle dealersto finance inventories of new Toyota vehicles and used vehicles of Toyota and others. The finance companiesacquire security interests in vehicles financed at wholesale. In cases where additional security interests would berequired, the finance companies take dealership assets or personal assets, or both, as additional security. If adealer defaults, the finance companies have the right to liquidate any assets acquired and seek legal remedies.
Toyota’s finance subsidiaries also make term loans to dealers for business acquisitions, facilitiesrefurbishment, real estate purchases and working capital requirements. These loans are typically secured withliens on real estate, other dealership assets and/or personal assets of the dealers.
32
Insurance
Toyota provides insurance services in the United States through Toyota Motor Credit Corporation’s wholly-owned subsidiary, Toyota Motor Insurance Services, Inc. (“TMIS”) and its wholly-owned insurance companysubsidiaries. Their principal activities include marketing, underwriting and claims administration. TMIS alsoprovides coverage related to vehicle service agreements and contractual liability agreements through Toyotadealers to customers. In addition, TMIS also provides coverage and related administrative services to affiliatedcompanies of Toyota Motor Credit Corporation. Toyota dealers in Japan and in other countries and regions alsoengage in vehicle insurance sales.
Other Financial Services
Toyota Finance Corporation launched its credit card business in April 2001 and began issuing Lexus creditcards in 2005 when the Lexus brand was introduced in Japan. As of March 31, 2016, Toyota Finance Corporationhas 14.2 million card holders (including Lexus credit card holders).
All Other Operations
In addition to its automotive operations and financial services operations, Toyota is involved in a number ofother non-automotive business activities. Net sales for these activities totaled ¥1,177.3 billion in fiscal 2016,¥1,255.7 billion in fiscal 2015 and ¥1,151.2 billion in fiscal 2014. Sales to external customers of all otheroperations in fiscal 2016 represented 2.2% of Toyota’s net revenues for fiscal 2016. Substantially all of Toyota’srevenues from other operations were derived in Japan.
Housing
Toyota established its subsidiary Toyota Housing Corporation in April 2003 and has transferred to it productplanning and sales operations related to the manufacture and sale of housing. Furthermore, in order to quicklyand accurately grasp clients’ needs and to plan, develop and sell products on a timely basis, in April 2008,Toyota transferred the product development operation to Toyota Housing Corporation. In October 2010, Toyotaspun-off its housing operations (project planning, technology development and manufacturing) through astatutory demerger and integrated them into Toyota Housing Corporation. Toyota believes that in the vastlychanging housing market environment, the integration of the development, manufacture and sales functions willexpedite decision making and lead to flexible business operations that will enable Toyota to better respond to theneeds of even more customers. In March 2005, Toyota, together with institutional investors, agreed to jointlyinvest in Misawa Home Holdings, Inc. (“Misawa”; renamed Misawa Homes Co., Ltd.) pursuant to its request forassistance in its rehabilitation. In April 2010, determining that a stronger collaboration with Misawa would bedesirable in order to achieve further growth in the difficult operating environment of the housing industry,Toyota Housing Corporation agreed to purchase Misawa shares from an institutional investor. In addition,Toyota transferred ownership of Misawa to Toyota Housing Corporation in October 2010. Through theseactivities, Toyota has strengthened the housing business of both companies.
Information Technology
See “— Enhancing Vehicle Functionality and Intelligent Transport Systems” for a description of Toyota’sinformation technology.
Governmental Regulation, Environmental and Safety Standards
Toyota is subject to laws in various jurisdictions regulating the levels of pollutants generated by its plants.In addition, Toyota is subject to regulations relating to the emission levels, fuel economy, noise and safety of itsproducts. Toyota has incurred significant costs in complying with these laws and regulations and expects to incursignificant compliance costs in the future. Toyota’s management views leadership in environmental protection asan important competitive factor in the marketplace.
33
Vehicle Emissions
Japanese Standards
The Air Pollution Control Law of Japan and the Road Vehicle Law and the Law Concerning SpecialMeasures for Total Emission Reduction of Nitrogen Oxides from Automobiles in Specified Areas regulatevehicle emissions in Japan. In addition, both the Noise Regulation Law and the Road Vehicles Law provide fornoise reduction standards on automobiles in Japan. Toyota’s vehicles manufactured for sale in Japan comply withall Japanese exhaust emission and noise level standards.
U.S. Federal Standards
The federal Clean Air Act directs the Environmental Protection Agency (“EPA”) to establish and enforce airquality standards, including emission control standards on passenger vehicles, light-duty trucks and heavy-dutyvehicles. The EPA decided in February 2000 to adopt more stringent vehicle emission and fuel economystandards applicable to passenger vehicles and light-duty trucks produced in model years 2004 and beyond. In thestandards adopted for model years 2004 and beyond, manufacturers must guarantee that their vehicles meet therequirements for ten years or 120 thousand miles, whichever occurs first. Manufacturers are not permitted to sellvehicles in the United States that do not meet the standards. In April 2007, EPA regulations that further restrictemissions from passenger vehicles and light-duty trucks operating at cold temperatures became effective. Thenew emission standards set by these regulations were phased in between 2010 and 2013. Similar standards thatfurther restrict emissions from heavy-duty vehicles operating at cold temperatures have been phased in from2012 to 2015. In March 2014, the EPA finalized new vehicle emission and fuel standards for passenger vehiclesand light-duty trucks for model years 2017 and onwards. Under the new standards, emission standards forvolatile organic compounds and nitrogen oxides are to be strengthened in phases from 2017 to 2025, bringing theemission standards in line with emission standards in California, resulting in the unification of the differingCalifornia and federal emission standards. In addition, the particulate matter standards and fuel vapor emissionstandards will also be strengthened to be brought in line with California’s emission standards. This is expected tolead to reductions in the burden on development, such as a reduction in the number of tests required forcertification and standardization of emission reduction systems.
Furthermore, in April 2007 the U.S. Supreme Court ruled that the EPA has the authority to regulateautomobile emissions of greenhouse gases. In response to this ruling, on April 1, 2010 the EPA and the federalNational Highway Traffic Safety Administration (“NHTSA”) issued a joint final rule to reduce the emission ofgreenhouse gases from passenger vehicles, light-duty trucks and medium-duty passenger vehicles for modelyears 2012 through 2016. These vehicles are required to meet an estimated combined average emissions level of250 grams of carbon dioxide per mile, equivalent to 35.5 miles per gallon if the requirements were met throughfuel economy standards. The NHTSA also set Corporate Average Fuel Economy (“CAFE”) standards forpassenger vehicles and light-duty trucks that will require manufacturers of those vehicles to meet an estimatedcombined average fuel economy level of 34.1 miles per gallon in model year 2016. In addition, on August 28,2012, the EPA and the NHTSA jointly issued the final rule to further reduce greenhouse gas emissions andimprove fuel economy for passenger vehicles, light-duty trucks and medium-duty passenger vehicles for modelyears 2017 through 2025. In the final rule, these vehicles are required to meet an estimated combined averageemission level of 163 grams of carbon dioxide per mile in model year 2025, equivalent to 54.5 miles per gallon ifthese requirements were met through improvements in fuel economy standards. The NHTSA also issued CAFEstandards for passenger vehicles and light-duty trucks that would require manufacturers to meet an estimatedcombined average fuel economy level of 49.6 miles per gallon in model year 2025. According to the final rule,these standards are to be reevaluated by 2018.
In addition, in July 2015, the EPA adopted final rules to limit, in relation to greenhouse gas emissions, theuse of various hydroflourocarbons (HFCs) and HFC-containing refrigerant blends used in motor vehicle airconditioning systems for new vehicles, among other applications. Toyota purchases air conditioning systemsfrom third parties for use in its vehicles. The final rules list HFC-134a, the most dominant refrigerant used in
34
light-duty vehicles worldwide, as unacceptable for use in motor vehicle air conditioning systems in new light-duty vehicles beginning in model year 2021. The final rules also list additional refrigerant blends as unacceptablefor use in new light-duty vehicles beginning in model year 2017. Feasible alternatives to these refrigerants thatwill be prohibited by the rules may be costly or present other risks, such as flammability or other safety concerns.
As discussed above, the EPA has been granted the authority to set fuel standards in connection with theregulation of automobile emissions. In October 2010, the EPA approved the sale and use of fuel with a 15%ethanol blend (“E15”) for model years 2007 and later passenger vehicles and light-duty trucks. The use of E15 isnot permitted for engines used in lawnmowers, small generators, motorbikes, boats and other vehicles andequipment. Subsequently, in February 2011, the EPA approved the use of E15 for certain 2001 model year ornewer vehicles, such as light-duty passenger vehicles and small trucks. However, E15 is prohibited for use inother 2000 model year or older vehicles and general purpose engines. As a result, the EPA promulgatedregulations in July 2011, effective August 2011, requiring businesses that sell E15 to put a warning labelregarding E15 on gasoline fuel dispensers.
California Standards
Under the federal Clean Air Act, the State of California is permitted to establish its own vehicle emissioncontrol standards if it receives a waiver from the EPA. As a result, the California Air Resources Board (“CARB”)established the Low Emission Vehicle Program and set emission standards for certain regulated pollutants thatwere phased in beginning in the 2004 model year. Under these standards, most light-duty trucks and passengervehicles are required to meet the same emission standards, which were stricter than the federal standards. As partof the original Low Emission Vehicle Program, the CARB also required that a specified percentage of amanufacturer’s passenger vehicles and light-duty trucks sold in California for all model years 1998 and after be“zero-emission vehicles” (vehicles producing no emissions of regulated pollutants). This zero-emission vehiclesrequirement also permitted certain advanced technology vehicles such as PHV (Plug-in Hybrid Vehicles), hybridcars and alternative fuel vehicles that meet “partial zero-emission vehicles requirements” to be granted partialqualification as EV (Electronic Vehicles) or FCV (Fuel Cell Vehicle). The current zero-emission regulationsmandate substantial annual increases in the production and sale of battery-electric, fuel cell and plug-in hybridvehicles such that, by 2025, the state of California has estimated that approximately 15% of the new vehicles soldin the state would be zero-emission or plug-in hybrid vehicles. Toyota’s battery-powered RAV4 EV compactsport-utility vehicle and the MIRAI qualify as zero-emission vehicles. The current Prius plug-in hybrid, Prius andthe Camry Hybrid qualify as partial zero-emission vehicles under the zero-emission vehicles requirementadopted by the CARB. Toyota intends to continue to develop additional advanced technologies and alternativefuel technologies that will allow other vehicles using such technologies to qualify as zero-emission vehicles orpartial-zero-emission vehicles.
In July 2002, the California legislature passed legislation that required the CARB to develop and adopt, bythe end of 2004, regulations that achieved the maximum feasible reduction in greenhouse gas emissions fromvehicles. In September 2004, the CARB adopted regulations that required a 20 to 30 percent reduction ofgreenhouse gas emissions from passenger vehicles, light-duty trucks and other noncommercial vehicles to bephased in between the 2009 and 2016 model years.
In December 2007, the EPA denied California’s request for a waiver under the Clean Air Act that wouldhave allowed the state to enforce these regulations to control greenhouse gas emissions from motor vehicles.However, the EPA reconsidered its decision pursuant to a direction issued by the U.S. President in January 2009,and in July 2009 decided to allow the state to enforce such regulations.
The CARB has enacted regulations that deem automobile manufacturers that produced vehicles in modelyears 2012 through 2016 and 2017 through 2025 that are in compliance with the greenhouse gas emissionsregulations of the EPA to be in compliance with California’s greenhouse gas emissions regulations.
35
In January 2012, the CARB approved a new Low Emission Vehicle program for model years 2015 to 2025as part of Advanced Clean Cars. The program covers greenhouse gas standards for cars and light-duty trucks,reductions of smog-forming emissions, zero-emission vehicles regulations and clean fuels outlet regulations.
Other States’ Standards
The states of New York, Massachusetts, Connecticut, Maine, Maryland, New Jersey, Oregon, Rhode Islandand Vermont have either adopted, or plan to adopt, regulations substantially similar to California’s zero-emissionvehicles requirement. With regard to greenhouse gas emissions regulations, in addition to these states,Pennsylvania and Washington have also adopted California’s regulations.
Canadian Standards
Canada has established vehicle emission standards equivalent to the federal standards in the United States,including the heightened requirements that became applicable to passenger vehicles and light-duty trucks inmodel years 2004 and beyond. In addition, in response to the strengthening of the federal greenhouse gasemission standards in the United States applicable to model years 2017 to 2025, Canada finalized equivalentstandards in October 2014. Furthermore, certain Canadian provinces are currently considering enacting their ownregulations on vehicle emissions of greenhouse gases. Canada also adopted more stringent fuel legislation, whichis based on fuel legislation in the United States, that reduces refineries’ annual average sulfur concentration ofgasoline to 10 mg/kg from 2017 with a new addition of credit system to secure compliance.
European Standards
The European Union adopted a directive that establishes increasingly stringent emission standards forpassenger vehicles and light commercial vehicles in October 1998. Under this directive, the standards adoptedbeginning with year 2000 require manufacturers to recall any vehicles which fail to meet the standards forfive years or 80 thousand kilometers, whichever occurs first. Toyota introduced vehicles complying with thisdirective in 1999. Under standards adopted in 2005, manufacturers are obligated to meet the more stringentstandards for five years or total vehicle miles of 100 thousand kilometers, whichever occurs first. In 2007, theEuropean Parliament adopted more stringent emission standards for passenger vehicles and light commercialvehicles. The effective dates for phasing in these stricter standards for passenger vehicles were September 2009for Euro 5 and September 2014 for Euro 6. For light commercial vehicles, the effective dates are September 2010for Euro 5 and September 2015 for Euro 6. Euro 5 provides for lower emission levels for gasoline and dieselpowered vehicles and also extends the manufacturers’ responsibility for emission performance to total vehiclemiles of 160 thousand kilometers. The primary focus of Euro 6 is to limit further emissions of diesel poweredvehicles and bring them down to a level equivalent to gasoline powered vehicles. In addition, Euro 6 will beimplemented in two stages, and beginning with the second stage (September 2017 for passenger vehicles andSeptember 2018 for commercial vehicles), the EU is implementing the Real Driving Emission (RDE)regulations, which regulate emissions under real driving conditions, and the Worldwide harmonized Lightvehicles Test Procedure (WLTP). A second RDE package of regulations establishing quantitative limits foremissions in RDE tests was approved by the European Parliament and Council in February 2016.
Chinese Standards
Emissions regulations are being implemented throughout China pursuant to the Chinese National Standards(GB) of the Ministry of Environmental Protection of the People’s Republic of China, and the manufacture andsale of models not meeting these regulations are prohibited.
For passenger vehicles, pursuant to GB18352.3-2005, Level 3 Emissions Regulations (corresponding toEuro 3 standards) apply to new models after July 2007 and Level 4 Emissions Regulations (corresponding toEuro 4 standards) apply to new models after July 2010. New models after July 2008 are also required to be
36
equipped with on-board diagnostics. With respect to passenger vehicles, pursuant to GB18352.5-2013, Level 5Emissions Regulations (corresponding to Euro 5 standards) are to be implemented throughout China for allmodels that are sold and registered after January 2018.
For diesel-powered commercial vehicles, pursuant to GB17691-2005, new Level 3 Emissions Regulationsapply to models after January 2007. Although Level 4 Emissions Regulations were to apply to new models afterJanuary 2010, and Level 5 Emissions Regulations were to apply to new models after January 2012, because theinfrastructure to supply sufficient diesel fuel meeting the Level 4 quality standards had yet to be put in place, theimplementation of the Level 4 Emissions Regulations for all models was postponed to July 2013. In connectionwith such delay, the implementation of the Level 5 Emissions Regulations has been postponed from the originalplan and is now scheduled to be implemented from July 2017. For gasoline-powered commercial vehicles,pursuant to GB14762-2008, Level 3 Emissions Regulations apply to new models after July 2009 and Level 4Emissions Regulations apply to new models after July 2012. After the first day the regulation is implemented to anew model, all new models released during the following one-year period also become subject to the regulation.In addition, in some areas such as Beijing, Shanghai, Guangzhou and the Pearl River Delta region, the abovementioned regulations were implemented several years earlier by regional environmental preservation authoritieswith the authorization of the Chinese State Council. Cities with serious air pollution are increasingly exhibitingtendencies to similarly implement Level 5 Emissions Regulations in advance of the rest of China.
China will also start implementing stricter diesel and gasoline fuel standards a year earlier than scheduled toreduce vehicle emissions, pursuant to GB19147-2013 and GB17930-2013. The new Level 5 standards(equivalent to Euro 5 standards) will be implemented in 11 provincial capitals in eastern China in January 2016,and are now planned to be implemented nationwide in January 2017, as opposed to the previously announcedJanuary 2018 implementation date. In connection with this, the Ministry of Environmental Protection and theMinistry of Industry and Information Technology issued a notification regarding the implementation of the Level5 standards, which will be implemented for gasoline-powered passenger vehicles in 11 provincial capitals ineastern China from April 2016, for gasoline-powered passenger vehicles nationwide in China from January 2017and for diesel passenger vehicles nationwide in China from January 2018.
Compliance with new and more stringent emissions and fuel standards will present significant technologicalchallenges to automobile manufacturers and will likely require significant expenditures. Examples of thesechallenges include the development of advanced technologies, such as high performance batteries and catalyticconverters, as well as the development of alternative fuel technologies. Manufacturers that are unable to developcommercially viable technologies within the time frames set by the new standards will lose their market shareand will be forced to decrease the number of types of vehicles and engines in their principal markets.
Standards of Other Countries
Countries other than Japan, the United States, Europe and China are also proactively introducing emissionsregulations. Many countries or regions such as Australia, Mexico, the Middle East, Taiwan and Hong Kong, aswell as countries in Eastern Europe and Asia, have considered or implemented emissions regulations.
Especially in India, the government accelerated the effective date of BS-6 (equivalent to EURO6) to 2020due to the worsening air pollution problem and its Supreme Court suggested imposing a tax on sales of all dieselpassenger vehicles in the Delhi metropolitan area. Until the discussion on the new tax is settled, the registrationof diesel passenger vehicles larger than 2 liters is temporarily banned in the Delhi metropolitan area.
37

Vehicle Fuel Economy
Japanese Standards
The Law Concerning the Rational Use, etc. of Energy requires automobile manufacturers to improve theirvehicles to meet specified fuel economy standards. Fuel economy standards are established according to thetypes of vehicles specified below, and are required to be met by either fiscal 2011 (April 2010-March 2011),fiscal 2016 (April 2015-March 2016), fiscal 2021 (April 2020-March 2021) or fiscal 2023(April 2022-March 2023).
Among qualifying passenger vehicles are:
• Vehicles which are designated in Article 75, Paragraph 1 of the Road Vehicles Law as type-designatedvehicles (“type-designated vehicles”) with 10 seats or less using gasoline, gas oil or LPG;
• Type-designated vehicles with 11 seats or more that are 3.5 tons or less in vehicle weight using gasolineor gas oil; and
• Type-designated vehicles with 11 seats or more that are over 3.5 tons in vehicle weight using gas oil, ordesignated carbon monoxide emission control vehicles (“designated carbon monoxide emission controlvehicles”) which are designated in Article 75-3 Paragraph 1 of the Road Vehicles Law.
Among qualifying cargo vehicles are:
• Type-designated vehicles that are 3.5 tons or less in vehicle weight using gasoline, gas oil or LPG; and
• Type-designated vehicles that are over 3.5 tons in vehicle weight using gas oil or LPG, or designatedcarbon monoxide emission control vehicles.
Toyota is in compliance with the fuel economy standards that currently apply and is promoting theimprovement of its vehicles in order to achieve compliance with the standards that will apply beginning in fiscal2021.
Japan is a signatory to the Framework Convention on Climate Change and has agreed to take measures toreduce its greenhouse gas emissions. Improved vehicle fuel economy is contributing to the reduction in carbondioxide emissions.
U.S. Standards
The Federal Motor Vehicle Information and Cost Savings Act requires automobile manufacturers to complywith CAFE standards. Under this law, limits are imposed on the amount of regulated pollutants that may beemitted by new motor vehicles in the United States. A manufacturer is subject to substantial civil penalties if, inany model year, its vehicles do not meet the CAFE standards. Manufacturers that exceed the CAFE standardsearn credits determined by the difference between the average fuel economy performance of their vehicles andthe CAFE standards. Credits earned for the five model years preceding the current model year, and creditsprojected to be earned for the next three model years, can be used to meet CAFE standards in a current modelyear.
In April 2006, the NHTSA established CAFE standards applicable to light-duty trucks for model year 2008and beyond. These CAFE standards aimed at shifting the framework from one that used to be advantageous onlyto compact car manufacturers to one that is fair to full line manufacturers. The requirements were changed so thatthe CAFE standards are now determined by a sales rate based on vehicle size (measured by the area of the wheeland wheel base) for each manufacturer.
On April 1, 2010, the EPA and the NHTSA issued a joint final rule to reduce the emission of greenhousegases from passenger vehicles, light-duty trucks and medium-duty passenger vehicles for model years 2012
38
through 2016. These vehicles are required to meet an estimated combined average emissions level of 250 gramsof carbon dioxide per mile, equivalent to 35.5 miles per gallon if the requirements were met through fueleconomy standards. The NHTSA also set CAFE standards for passenger vehicles and light-duty trucks that willrequire manufacturers of those vehicles to meet an estimated combined average fuel economy level of 34.1 milesper gallon in model year 2016. Furthermore, the EPA and the NHTSA joint final rule allows the two agenciesand California standards to act in a unified way, and creates a regulatory framework that makes compliance lessburdensome for the manufacturers. In addition, in December 2011, the EPA and the NHTSA issued a jointproposed rule to further reduce greenhouse gas emissions and improve fuel economy for passenger vehicles,light-duty trucks and medium-duty passenger vehicles for model years 2017 through 2025. In the rule, which wasfinalized in August 2012, these vehicles are required to meet an estimated combined average emission level of163 grams of carbon dioxide per mile in model year 2025, equivalent to 54.5 miles per gallon if theserequirements are met through improvements in fuel economy standards. At the same time, the NHTSA alsoissued CAFE standards for passenger vehicles and light-duty trucks that would require manufacturers to meet anestimated combined average fuel economy level of 49.6 miles per gallon in model year 2025. The standards offuel economy are stringent, and Toyota strives to meet the fuel economy standards by further developing fuel-efficient technology, alternative fuel technology and other advanced technology.
In addition, the Energy Tax Act of 1978 imposes a “gas guzzler” tax on automobiles with a fuel economyrating below specified levels.
European Standards
In December 2008, the European Parliament approved a new regulation that establishes an average emissionstandard of 130 grams of carbon dioxide per kilometer by 2012 for passenger vehicles sold in member states,made effective in June 2009. The regulation has been phased in gradually, initially requiring 65% of new cars tocomply with the new standards in 2012 and increasing to 100% of new cars in 2015. As a result of the newregulations, different targets will apply to each manufacturer, based on their respective fleets of vehicles andweight. Penalties will apply to those manufacturers who fail to meet their targets from 2012, in amountscorresponding to the degree of shortfall. Manufacturers failing to meet their targets between 2012 and 2018 willincur penalties of between €5 and €95 per each gram of carbon dioxide per kilometer shortfall for eachnon-compliant vehicle, and such penalties will rise to €95 in 2019 and beyond. Furthermore, in June 2011, a newcarbon dioxide emission standard applicable to light commercial vehicles entered into force establishing anaverage emissions target of 175 grams of carbon dioxide per kilometer. This regulation has the same basicregulatory framework as passenger vehicles, raising the compliance rate from 70% in 2014 to 100% in 2017.
Furthermore, in February 2014, the European Parliament and Council adopted a regulation to reduce theaverage carbon dioxide emissions target for light commercial vehicles to 147 grams per kilometer beginning in2020. In March 2014, the European Parliament and Council adopted a regulation to reduce the average carbondioxide emissions target for passenger vehicles to 95 grams per kilometer beginning in 2021. 95% of eachmanufacturer’s new cars must comply with this new standard by 2020. The relevant legislation requested theEuropean Commission to conduct a review by 2015 and, if appropriate, propose new targets for the periodbeyond 2020, including possibly setting a 2025 target.
An increasing number of EU member states are introducing vehicle tax laws based on carbon dioxideemission levels pursuant to the directive issued by the European Commission in 2005. This trend is expected tocontinue in accordance with the recent increases in environmental awareness.
An EU directive on motor vehicle air conditioning units requires manufacturers to replace currently usedrefrigerants with refrigerants having a lower global warming impact for all newly registered vehicles starting inJanuary 2017.
39
Chinese Standards
Fuel consumption regulations are being implemented pursuant to the Chinese National Standards (“GB”),and the manufacture and sale of vehicle models not meeting these regulations are prohibited. For passengervehicles, pursuant to GB19578-2004, Level 1 Fuel Consumption Regulations apply to new models afterJuly 2005 and Level 2 Fuel Consumption Regulations apply to new models after January 2008. For smallcommercial vehicles, pursuant to GB20997-2007, Level 2 Fuel Consumption Regulations apply to new modelsafter February 2008, Level 1 Fuel Consumption Regulations apply to all vehicles as of January 2009 and Level 2Fuel Consumption Regulations apply to all models as of January 2011. These regulations determine theconsumption standards that apply depending on the mass of the applicable vehicle and set forth a method fordetermining whether each model has met the regulation. With respect to passenger vehicles, GB27999-2011 hasbeen issued to further strengthen fuel consumption regulations from 2012 and beyond. In these Level 3 FuelConsumption Regulations for passenger vehicles, the regulation framework was substantially revised, such as achange from regulations requiring each model to meet consumption standards to regulations requiringautomobile manufacturers to meet standards of average consumption across models. Furthermore, in order toachieve the national target for average fuel efficiency for 2020, the following more stringent fuel consumptionregulations have been enacted as Level 4 Fuel Consumption Regulations for passenger vehicles. First,GB19578-2014, which has been enacted to strengthen regulations for each model, is being applied to new modelsafter January 2016. Second, GB27999-2014, which has been enacted to strengthen corporate average regulations,will come into effect in 2016.
Standards of Other Countries
As momentum gathers to increase energy security and prevent global warming, other countries in additionto Japan, the United States, Europe and China are moving to introduce fuel consumption regulations, and Korea,Mexico, Brazil, Taiwan, India, Saudi Arabia and Canada have already decided to introduce or implemented fuelconsumption regulations. Australia is also considering the introduction of new regulations to reduce averagecarbon dioxide emissions by vehicles. Toyota predicts that this trend will spread to other countries, and in thefuture many nations will consider new regulations related to fuel consumption and carbon dioxide.
Vehicle Safety
Japanese Standards
In Japan, efforts have been made since 1998 to bring Japanese standards in line with the regulations of theUnited Nations Economic Commission for Europe (“UN”).
With respect to standards that were previously brought in line with the UN regulations, the Japanesestandards regarding steering systems require disabling of automatic steering functions when vehicles travel atmore than 10km/h. These standards apply to new model cars beginning in July 2016. As amendments to therequirement to disable automatic steering functions are currently being discussed at the United Nations, and inlight of the fact that vehicles equipped with automatic steering functions are already being sold in Japan, theapplication of the requirement to disable automatic steering functions is expected to be suspended for the timebeing in Japan.
With respect to standards that were newly brought in line with the UN regulations, standards for fireprevention will apply to new models beginning in September 2018. Standards for protection of passengers frompole side impact will apply to new models beginning in June 2018. Standards for vehicle exterior noise of tires,and friction force and rolling resistance on wet roads will apply in stages to new models beginning in April 2018and will apply in stages to existing models still in production beginning in April 2022. Standards for illuminationof rear registration plates will apply to vehicles to be manufactured on or after June 2020. Standards for filamentlight bulbs, standards for gas-discharge light sources and standards for LED will apply to vehicles to bemanufactured on or after June 2015.
40
With respect to standards that are scheduled to be newly brought in line with the UN regulations, safetystandards for hydrogen fuel cell vehicles will apply in stages to new models beginning in September 2018.Standards for protection of passengers from full-wrap head-on collision will apply in stages to new modelsbeginning in September 2018. Standards for indirect visibility will apply to new models beginning in June 2019and to existing models still in production beginning in June 2021.
Furthermore, unique to Japan, technical guidelines for remote-controlled parking assistance systems andguidelines for response systems for driver emergencies have been created. The standardization of measuresrelating to the quietness of hybrid vehicles, brake override systems, the strengthening of anti-spinal injurymeasures and anti-drunk driving measures are currently under consideration.
U.S. Standards
The U.S. National Traffic and Motor Vehicle Safety Act of 1966, or Safety Act, requires vehicles andequipment sold in the United States to meet various safety standards issued by the NHTSA. The Safety Act alsoauthorizes the NHTSA to investigate complaints relating to vehicle safety and to order manufacturers to recalland repair vehicles found to have safety-related defects. The cost of these recalls can be substantial depending onthe nature of the repair and the number of vehicles affected.
The Transportation Recall Enhancement, Accountability and Documentation Act was enacted in the UnitedStates on November 1, 2000. This Act required the NHTSA to regulate the dynamic rollover standards and toupgrade federal motor vehicle safety standards relating to tires. It also required the NHTSA to enhance itsauthority to gather information potentially relating to motor vehicle defects. This Act substantially increases themaximum civil penalties for violation of regulatory requirements and specifies possible criminal penalties forviolations of the federal Fraud and False Statements Act. In 2003, the NHTSA expanded its New Car AssessmentProgram (“NCAP”) to implement consumer information programs for vehicle rollover resistance and childrestraints and, beginning in 2003, adopted extensive early warning defect reporting requirements. Regulationsregarding tire-pressure monitoring systems were strengthened in 2005.
Legislation on a transportation budget plan promoting a safe and efficient vehicle safety program fordrivers, the Safe, Accountable, Flexible, Efficient Transportation Equity Act: A Legacy for Users(SAFETEA-LU) was passed in August 2005. The legislation requires the NHTSA to propose and issue safetystandards to reduce rollover accidents, to complete the creation of standards for the reduction of vehiclepassengers released from cars at the time of rollover accidents, to upgrade door lock standards, to complete theupgrade of roof crash standards, to decide on the side impact protection standards for passengers in all seatlocations, to review seat belt wearing technology and complete a study that includes a proposal for improving therate of seat belt usage, to establish standards to display NCAP ratings on new car labels and to complete theupgrade of the standard for power windows that will require pulling up switches. Some actions have already beentaken and completed in response to the above requirements.
In February 2008, legislation to prevent non-traffic related injuries to young children caused by vehicles, the“Cameron Gulbransen Kids Transportation Safety Act,” was passed. Pursuant to this legislation, the NHTSAfinalized standards requiring vehicles to be equipped with rearview camera systems in order to ensure rearwardvisibility to prevent children from being struck by backing vehicles and mandating the use of brake shiftinterlock systems.
In January 2011, legislation to improve the safety of the visually impaired and other pedestrians, the“Pedestrian Safety Enhancement Act of 2010,” was passed. The legislation requires the NHTSA to draft andfinalize standards for warning sounds of electric and hybrid vehicles. The NHTSA formally proposed minimumsound standards in January 2013, and the standards are currently in the regulatory review process.
41
In response to the unintended acceleration issue in 2010, the NHTSA has started to examine and implementmeasures to strengthen safety standards, such as mandating brake override systems, mandating Event DataRecorders, or EDR, and standardizing push-start switches.
In August 2014, the NHTSA initiated rulemaking that would propose to create a new safety standard torequire new passenger and light-duty truck vehicles to have dedicated short-range communication (DSRC) unitsthat enable Vehicle-to-Vehicle (V2V) communication.
In January 2015, the NHTSA proposed to amend safety standards regarding child restraint anchoragesystems to improve the ease of use, and in March 2015, the NHTSA proposed to amend a safety standardregarding seat belt assembly anchorages to specify an alternative test procedure.
In March 2016, the NHTSA proposed changes to safety standards to add an alternative requirement forelectrical shock protection from electric vehicles and hydrogen fuel cell vehicles. In the same month, the NHTSAand Insurance Institute for Highway Safety announced that they have agreed with twenty major vehiclemanufacturers to standardize equipment of automatic emergency brakes on almost all new models by 2022.
European Standards
In 2009, the European Union overhauled its safety regulations and enacted a new regulation and a simplifiedframework, repealing more than 50 existing European Commission directives regarding vehicle safety other thanpedestrian protection, and replacing them with a single regulation aimed at incorporating the UN regulations. Thenew regulation also requires the adoption of advanced safety systems. The EU Regulation directly incorporatingthe UN Regulations commenced in 2012 and requires advanced safety systems, including requiring new typevehicles to have electronic stability control systems from 2011, to introduce regulations relating to low rollingresistance tires in 2013, to require tire pressure monitoring systems starting in 2012 and to require heavy vehiclesto have advanced emergency braking systems and lane departure warning systems from 2013. All of the technicalrequirements for these advanced safety systems were discussed in the United Nations. Further, application of UNregulation came into force from November 2012 for new vehicle types and from 2014 for all new vehicles sold inthe EU market. The new mandatory measures include electric car safety requirements and gear shift indicators.
In October 2010, CARS 21 was resumed in order to proceed with the realization of the “2020 Strategy”(CARS 2020) by the European Commission that aims for high-level, sustainable and comprehensive growth, andthe CARS 21 final report was issued in June 2012. The final report addresses issues facing the widespreadadoption of electric vehicles, including charging infrastructure in the EU, establishing battery requirements,adopting seat belt reminder devices for all seats, connection of alcohol interlock devices to vehicles, adoptingspeed management devices, establishing safety requirements for micro urban mobility, strengthening safetyregulation to protect the vulnerable from collisions and the possibility of regulation in connection withpreventative safety technology. In November 2012, “CARS 2020: Action Plan for a competitive and sustainableautomotive industry in Europe” was issued based on the final report. The action plan is built on four coreconcepts, and within these concepts it discusses enhancement of road safety, improving the market conditionswithin the EU and the implementation of smart regulations. Each item is given a target date and is to bemonitored going forward. A stakeholder hearing on the implementation of the CARS 2020 action plan took placein February 2014 in Brussels in preparation for the Commission’s final report, which the Commission publishedin October 2014. The report indicates the direction for future short and medium term actions.
On the widespread adoption of emergency call systems (“eCall”), the European Commission concluded thata legislative approach is effective as a result of the impact assessment by the Commission in 2011. Accordingly,eCall will become mandatory from the end of March 2018 for light-duty passenger vehicles and light-dutycommercial vehicles using the framework of “Whole Vehicle Type Approval.” Regulations setting forth thetechnical standards of eCall were adopted in May 2015. Rulemaking regarding eCall has also been proposed bythe United Nations, and is also currently being considered. In addition, in the event the installation of eCall
42
becomes mandatory in the EU, it will be necessary at the same time to build infrastructure such ascommunication bases in the different member states of the EU, and rulemaking regarding eCall is expected toalso cover the creation of such infrastructure.
The possibility of regulation in connection with ITS and other advanced driver assist systems for 2020 andbeyond is also under consideration. In addition, the adoption of Advanced Emergency Breaking systems and lanedeparture warning systems on light vehicles, Advanced Emergency Breaking systems which detect pedestrians,and the adoption of blind spot monitors, reverse system which detect pedestrians, reverse detection, Evert DataRecorders on trucks and alcohol interlock devices are also expected to be considered. In March 2015, theEuropean Commission published a final report on the benefit and feasibility of a range of new safetytechnologies. The plan is scheduled to come into effect as an official Communication around June 2016 and theCommunication is planned to be sent to the European Council and the European Parliament. At the same time, aprocess to revise the General Safety Regulation (EC) No 661/2009 and Regulation (EC) No 78/2009 with regardsto pedestrian protection are likely for 2016. With respect to individual matters that are to be strengthened throughregulations, the European Commission plans to propose amendments to the United Nations rules regardingmatters that are already regulated by the United Nations, while other matters are likely to be considered withinthe EU. In either case, deliberations will be conducted with the goal of application to new vehicle models from2020, although target date of the regulations vary for each matter.
From April 2009, the applicable scope for Whole Vehicle Type Approval (“WVTA”) was extended to coverall vehicle categories. Furthermore, an amendment was issued in 2011 which clarifies the categories (especiallythose for passenger and light-duty commercial vehicles). Through this amendment, the criteria for light-dutycommercial vehicles was clarified, and there is a possibility that vehicles currently classified as light-dutycommercial vehicles become classified as passenger vehicles. In addition, revisions to EU regulations related tovehicle mass and dimensions were issued in 2012. These revisions clarified the mass, criteria and definitionswhich comprise the base specifications for vehicles. In 2016, the European Commission’s proposal regardingmajor amendments to the WVTA, including a strengthening of type approval process (e.g. enabling access tosoftware algorithm; five year approval limit (type approval validity)) with the market surveillance requirements(addition of auditing authority by the European Commission), strengthening of auditing of technical service andclarification of recall requirements, was submitted. Currently, the bill is under deliberation by the EuropeanCouncil and the European Parliament.
In addition, GEAR2030 (the High Level Group on the Competitiveness and Sustainable Growth of theAutomotive Industry in the European Union) was established in January 2016 as a successor body of theCARS2020 and deliberations on recommendations to the European Commission, member states and high-levelrelated stakeholders for strengthening the competitiveness of the automobile value chain in Europe by 2030commenced. In particular, a roadmap for smooth development of automatic driving vehicles is scheduled to bediscussed. The finalization of the recommendation is aimed for the end of 2017.
United Nations Regulations
The 1958 Agreement (“Agreement Concerning the Adoption of Uniform Technical Prescriptions forWheeled Vehicles, Equipment and Parts which can be Fitted and/or be Used on Wheeled Vehicles and theConditions for Reciprocal Recognition of Approvals Granted on the Basis of These Prescriptions”) wasoriginally based on the European regulations, but the UN Regulations are developing as an establishedinternational law, and Japan, Thailand, Malaysia and Egypt as well as other countries outside the EU havebecome members after the amendment in 1995, and many other countries are expected to join in the future. Thecountries bound by the 1958 Agreement have incorporated the UN Regulations into their own domestic policies(The EU and Japan have directly included the UN Regulations into their domestic legislations). Whileautomotive parts and vehicle systems are regulated by the UN regulations, there are currently no regulations withrespect to International Whole Vehicle Type Approval (IWVTA) such as those in Europe. Japan proposedlegislation establishing WVTA under the United Nations in 2016, and the matter is being deliberated by the
43
United Nations. If IWVTA is established, integration of global approval administrative regulations of eachcountry and simplification of vehicle construction regulations are expected but IWVTA, if finalized, would onlybe partially applicable at the time of its establishment in 2016 and deliberation toward the full application wouldcontinue after establishment.
An amendment to the 1958 Agreement is being considered with an aim towards finalization of R0 in 2016.Such amendment will increase the flexibility of the regulations, enabling approvals to be granted for the oldseries of regulations according to the needs of the signatory countries to the 1958 Agreement. The percentage ofrequired votes for voting in connection with proposed UN regulations will also be considered, and if thepercentage of required votes is increased from the current two-thirds, the 1958 Agreement is expected to becomefairer. Such amendment is expected to make the 1958 Agreement more attractive to countries that are notcurrently party to the 1958 Agreement, and aims to increase the number of signatory countries.
The 1998 Agreement (“Agreement Concerning the Establishing of Global Technical Regulations forWheeled Vehicles, Equipment and Parts which can be Fitted and/or be Used on Wheeled Vehicles”) is a U.S.-ledagreement that aims to harmonize technical regulations, and defines each regulation as a Global TechnicalRegulation (“GTR”). At present, there are 16 GTRs in total. Currently, numerous provisions are under discussionin order to include more regulations. The countries bound by the 1998 agreement are required to incorporate theGTRs into their domestic laws. The parties to the 1998 agreement include the United States, Canada, China andIndia, which are not parties to the 1958 agreement, so GTRs will also influence those countries.
Chinese Standards
Vehicle safety regulations in China were drafted with reference to the UN regulations and cover almost thesame matters as the UN regulations. However, these regulations also include unique provisions which take intoaccount the distinctive characteristics of the Chinese market environment and the rules differ from the latest UNregulations. As for future safety regulations, standards related to airbag technologies and standards related tobatteries, motors and the charging of electric vehicles are currently being planned.
Standards of Other Countries
Vehicle safety regulations in Canada are basically similar to those in the United States. In regions outside ofNorth America, adoption and conformity with the UN regulations is widespread, including in those countrieswithout automotive manufacturing industries. The list of signatories to the 1958 agreement of the United Nationscontinues to grow, and now includes Korea, Thailand and Malaysia in Asia, as well as Russia, South Africa,Egypt and Morocco. In addition, ASEAN, pursuant to its economic community mission, has decided to adopt theUN regulations as its regional agreement. Latin America, India and countries in the Middle East that are notsignatories to the 1958 agreement of the United Nations are also moving forward to conform their respectiveregulations to the UN regulations or to adopt new regulations consistent with the UN regulations.
Environmental Matters
Japanese Standards
Toyota’s automotive operations in Japan are subject to substantial environmental regulation under laws suchas the Air Pollution Law, the Water Pollution Control Law, the Noise Regulation Law and the Vibration ControlLaw. Under these laws, if a business entity establishes or alters any facility that is regulated by these laws, thebusiness entity is required to give prior notice to regulators, and if a business entity discharges, uses or storessubstances that are environmental burdens or causes noise or vibration from such facility, the business entity isalso required to comply with the applicable standards. Toyota is also subject to local regulations, which in somecases impose more stringent obligations than the Japanese central government requirements. Toyota hascomplied with these regulations. Under the Waste Disposal and Public Cleaning Law, producers of industrialwaste must dispose of industrial waste in the manner prescribed in the Waste Disposal and Public Cleaning Law.Toyota has also complied with the Waste Disposal and Public Cleaning Law.
44
The Soil Contamination Countermeasures Law of Japan requires that land owners conduct contaminationtesting and submit a report at the time they cease to use hazardous substances, such as in connection with the saleof a former factory, or if there is a possibility of health hazards due to land contamination. If it is found that landcontamination exceeds a certain level, the relevant prefectural authority designates the area considered to becontaminated and orders the land owner to take necessary measures. Toyota is suitably managing its land inaccordance with the same law. In addition, under the Law on Recycling of End-of-Life Vehicles, vehiclemanufacturers are required to take back and recycle specified materials (automotive shredder residues, air bagsand fluorocarbons) of end-of-life vehicles and the provisions concerning such obligations of vehiclemanufacturers became effective in January 2005. Toyota has coordinated with relevant parties to establish avehicle take-back and recycle system throughout Japan. As a result, in fiscal 2016, Toyota achieved a recycling/recovery rate of 97% for automobile shredder residue (the legal requirement being 70%) and 93% for air bags(the legal requirement being 85%) and reached the targets set forth in this law.
U.S. Standards
Toyota’s assembly, manufacturing and other operations in the United States are subject to a wide range ofenvironmental regulation under the Clean Air Act, the Clean Water Act, the Resource Conservation andRecovery Act, the Pollution Prevention Act and the Toxic Substances Control Act. Toyota is also subject to avariety of state legislation that parallels, and in some cases imposes more stringent obligations than, federalrequirements. These federal and state regulations impose severe restrictions on air- and water-borne discharges ofpollution from Toyota facilities, the handling of hazardous materials at Toyota facilities and the disposal ofwastes from Toyota operations. Toyota is subject to many similar requirements in its operations in Europe,Canada and other countries.
Pursuant to the Clean Air Act, the EPA has promulgated National Ambient Air Quality Standards(“NAAQS”) for six “criteria” pollutants, including for ozone and particulate matter. The Clean Air Act requiresthat the EPA review and possibly revise these NAAQS every five years. On December 14, 2012, the EPA madethe annual health-based particulate matter NAAQS more stringent, and the EPA is scheduled to complete itsreview and possible revision of the ozone NAAQS in 2015. The revised annual health-based particulate matterNAAQS, as well as any future NAAQS revisions, could lead to additional pollution control requirements on theindustry, including on Toyota’s manufacturing operations.
Toyota expects growing pressure in the next several years to further reduce emissions from motor vehiclesand manufacturing facilities.
European Standards
In October 2000, the European Union brought into effect a directive that requires member states topromulgate regulations implementing the following:
• automotive manufacturers shall bear all or a significant part of the costs for taking back end-of-lifevehicles sold after July 1, 2002 and dismantling and recycling those vehicles. Beginning January 1,2007, this requirement became applicable to vehicles sold before July 1, 2002 as well;
• automotive manufacturers may not use certain hazardous materials in vehicles sold after July 1, 2003;
• certified vehicle models sold after December 15, 2008 shall be re-usable and/or recyclable to aminimum of 85% by weight per vehicle and shall be re-usable and/or re-use as material or energy to aminimum of 95% by weight per vehicle; and
• end-of-life vehicles must meet actual re-use and/or recycling of 80% and re-use and/or recovery of 85%,respectively, of vehicle weight by 2006, rising respectively to 85% and 95% by 2015.
Laws to implement this directive came into effect in each of the EU member states. Currently, there areuncertainties surrounding the implementation of the applicable regulations in different EU member states,particularly regarding automotive manufacturer responsibilities and resultant expenses that may be incurred.
45
In addition, under this directive, the member states must take measures to ensure that car manufacturers,distributors and other auto-related economic operators establish adequate used vehicle collection and treatmentfacilities and to ensure that hazardous materials and recyclable parts are removed from vehicles prior toshredding. This directive impacts Toyota’s vehicles sold in the EU. Toyota accommodated, in offering itsproducts, any measures the EU member states chose to implement in order to comply with this directive.
The EU has also issued directives and made proposals relating to the following subjects on environmentalmatters:
• emission standards that include a framework permitting member states to introduce fiscal incentives topromote early compliance; and
• reform of rules governing automotive distribution and service. The block exemption on distribution hasbeen amended so that dealers may engage in cross-border sales actively within the EU and openadditional facilities for sales and services. Additionally, dealers may no longer be required bymanufacturers to operate both sales and service facilities side by side.
In December 2011, the European Commission proposed to reduce noise produced by cars, vans, buses,coaches and light and heavy trucks. As proposed, noise limit values would ultimately be lowered by fourA-weighted decibels for vehicles other than trucks, and three A-weighted decibels for trucks. Compliance wouldbe achieved in three steps over a 10 to 12 year period. In May 2014, a regulation adopting the proposal waspublished in final form in the EU Official Journal.
Toyota believes that its operations are materially in compliance with environmental regulatory requirementsconcerning its facilities and products in each of the markets in which it operates. Toyota continuously monitorsthese requirements and takes necessary operational measures to ensure that it remains in material compliancewith all of these requirements.
Toyota believes that environmental regulatory requirements have not had a material adverse effect on itsoperations. However, compliance with environmental regulations and standards has increased costs and isexpected to lead to higher costs in the future. Therefore, Toyota recognizes that effective environmental costmanagement will become increasingly important. Moreover, innovation and leadership in the area ofenvironmental protection are becoming increasingly important to remain competitive in the market. As a result,Toyota has proceeded with the development and production of environmentally friendly technologies, such ashybrid vehicles, fuel cell vehicles and high fuel efficiency, low emission engines.
In addressing environmental issues, based on an assessment of the environmental impact of its productsthrough their entire life cycles, from production through sales, disposal and recycling, Toyota, as a manufacturer,strives to take all possible measures from development stage and continues to work toward technologicalinnovations to make efficient use of resources and to reduce the burden on the environment.
Disclosure of Iranian Activities under Section 13(r) of the Securities Exchange Act of 1934
None.
Research and Development
The overriding goals of Toyota’s technology and product development activities are to minimize thenegative aspects of cars, such as traffic accidents and impact on the environment, and maximize the positiveaspects, such as driving pleasure, comfort and convenience. By achieving these sometimes conflicting goals to ahigh degree, Toyota seeks to open the door to the automobile society of the future. To ensure efficient progress inresearch and development activities, Toyota coordinates and integrates all research and development phases,from basic research and advanced research to forward-looking technology and product development. With
46
respect to long-term basic research in areas such as energy, the environment, information technology,telecommunications and materials, projects are regularly reviewed and evaluated in consultation with outsideexperts to achieve research and development cost control. With respect to forward-looking, leading-edgetechnology and product development, Toyota establishes cost-performance benchmarks on a project-by-projectbasis to ensure efficient development investment.
The chart below provides an overview of Toyota’s R&D at each phase.
Phase Description
Basic research Phase to discover development theme
Research on basic vehicle-related technology
Forward-looking andleading-edge technologydevelopment
Phase requiring technological breakthroughs such as components and systems
Development of leading-edge components and systems that are moreadvanced than those of competitors
Product development Phase mainly for development of new models
Development of all-new models and existing-model upgrades
Toyota is promoting research and development into the early commercialization of next generationenvironmentally friendly, energy-efficient and safe-vehicle technology and is making efforts to produce vehiclesthat are friendly to people and the environment by focusing on the following areas:
• further improvements in hybrid technologies, including in functions and cost, and contributions to theenvironment through advancements;
• improvement in gasoline engine fuel economy technology as well as improvement in technology inconnection with more stringent emission standards;
• promoting improvements in functions and fuel economy of clean diesel engines;
• development of electric vehicles, fuel cell vehicles and other alternative fuel vehicles; and
• development of technology designed to promote driving and vehicle safety.
For a detailed discussion of the company’s research and development infrastructure, see “Operating andFinancial Review and Prospects — Research and Development, Patents and Licenses.”
Components and Parts, Raw Materials and Sources of Supply
Toyota purchases parts, components, raw materials, equipment and other supplies from multiple competingsuppliers located around the world. Toyota works closely with its suppliers to pursue the most optimalpurchasing possible. Toyota believes that this policy encourages technological innovation, cost reduction andother measures to strengthen its vehicle competitiveness. Toyota plans to continue purchases based on the sameprinciple and does not anticipate any difficulty in obtaining stable supplies in the foreseeable future. Althoughoperation of plants were temporarily halted due to the explosion accident at AICHI STEEL CORPORATION inJanuary 2016 and the Kumamoto Earthquakes in April 2016, they were resumed quickly because the supplychain as a whole worked on a quick initial response and recovery.
Because Toyota had more than 50 overseas operations in 28 countries and regions as of December 31, 2015,procurement of parts and components is being carried out not only locally in the country of the production sitebut also from third countries, and the distribution network has become increasingly more complex. In order torealize timely and efficient distribution at the same time as keeping total costs at a minimum, Toyota ispromoting efforts to optimize each stage of the supply-chain. To this end, Toyota has developed a standardizedsystem of global distribution and is supporting the operation of the system at each production base. The use of
47
the global distribution system aims at implementing parts procurement that meets changes in vehicle productionin a timely manner. These varying efforts, combined together, have led to maximized customer satisfaction, aswell as to building a good working relationship with Toyota’s suppliers.
Toyota aims to share information and collaborate among the procurement divisions in each of the regionsthroughout the world in order to procure parts and materials from the most competitive suppliers among Toyotafactories located in various areas worldwide. At the same time, Toyota carries out streamlining effortsundertaken together with suppliers in each country in order to achieve sustainable growth. In particular, Toyotahas been working on a cost reduction measure referred to as RR-CI activities. RR-CI activities aim to improvecompetitive power through thorough localization, sharing parts and components and manufacturing reformstogether with producing products matching customers’ needs in each region and vehicle category. Toyota isadvancing RR-CI activities in conjunction with the TNGA. Urgent VA (value analysis) Activities began in fiscal2008 and developed into All-Toyota VA Activities at the beginning of fiscal 2010 as part of Toyota’s ongoingunified cost reduction effort with suppliers for the various types of vehicles already on sale. In addition, Toyotahas been working on the TNGA to achieve sweeping advances in basic performance and product appeal of partsand units as well as seeking cost reductions by sharing more parts and implementing manufacturing reforms.
In fiscal 2016, market prices of raw materials such as steel generally decreased in comparison to the priorfiscal year due in part to decreased demand in China. The direction of prices is still unforeseeable. Toyota iscontinually promoting cost reduction efforts, such as reducing the amount of raw materials it uses.
Toyota’s ability to continue to obtain supplies in an efficient manner is subject to a number of factors, someof which are not in Toyota’s control. These factors include the ability of its suppliers to provide a continuedsource of supplies and the effect on Toyota of competition by other users in obtaining the supplies.
Intellectual Property
Toyota holds numerous Japanese and foreign patents, trademarks, design patents and some utility modelregistrations. It also has a number of applications pending for Japanese and foreign patents. While Toyotaconsiders all of its intellectual property to be important, it does not consider any one or group of patents,trademarks, design patents or utility model registrations to be so important that their expiration or terminationwould materially affect Toyota’s business.
48
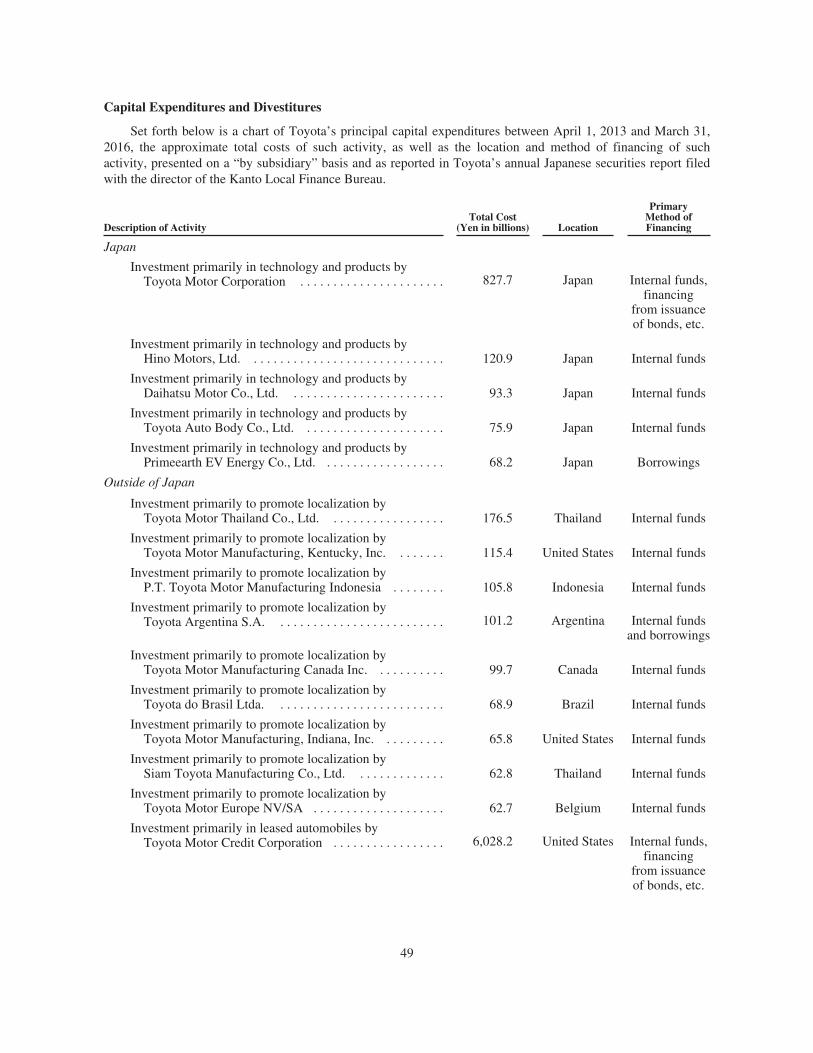
Capital Expenditures and Divestitures
Set forth below is a chart of Toyota’s principal capital expenditures between April 1, 2013 and March 31,2016, the approximate total costs of such activity, as well as the location and method of financing of suchactivity, presented on a “by subsidiary” basis and as reported in Toyota’s annual Japanese securities report filedwith the director of the Kanto Local Finance Bureau.
Description of ActivityTotal Cost
(Yen in billions) Location
PrimaryMethod ofFinancing
Japan
Investment primarily in technology and products byToyota Motor Corporation . . . . . . . . . . . . . . . . . . . . . . 827.7 Japan Internal funds,
financingfrom issuanceof bonds, etc.
Investment primarily in technology and products byHino Motors, Ltd. . . . . . . . . . . . . . . . . . . . . . . . . . . . . . 120.9 Japan Internal funds
Investment primarily in technology and products byDaihatsu Motor Co., Ltd. . . . . . . . . . . . . . . . . . . . . . . . 93.3 Japan Internal funds
Investment primarily in technology and products byToyota Auto Body Co., Ltd. . . . . . . . . . . . . . . . . . . . . . 75.9 Japan Internal funds
Investment primarily in technology and products byPrimeearth EV Energy Co., Ltd. . . . . . . . . . . . . . . . . . . 68.2 Japan Borrowings
Outside of Japan
Investment primarily to promote localization byToyota Motor Thailand Co., Ltd. . . . . . . . . . . . . . . . . . 176.5 Thailand Internal funds
Investment primarily to promote localization byToyota Motor Manufacturing, Kentucky, Inc. . . . . . . . 115.4 United States Internal funds
Investment primarily to promote localization byP.T. Toyota Motor Manufacturing Indonesia . . . . . . . . 105.8 Indonesia Internal funds
Investment primarily to promote localization byToyota Argentina S.A. . . . . . . . . . . . . . . . . . . . . . . . . . 101.2 Argentina Internal funds
and borrowings
Investment primarily to promote localization byToyota Motor Manufacturing Canada Inc. . . . . . . . . . . 99.7 Canada Internal funds
Investment primarily to promote localization byToyota do Brasil Ltda. . . . . . . . . . . . . . . . . . . . . . . . . . 68.9 Brazil Internal funds
Investment primarily to promote localization byToyota Motor Manufacturing, Indiana, Inc. . . . . . . . . . 65.8 United States Internal funds
Investment primarily to promote localization bySiam Toyota Manufacturing Co., Ltd. . . . . . . . . . . . . . 62.8 Thailand Internal funds
Investment primarily to promote localization byToyota Motor Europe NV/SA . . . . . . . . . . . . . . . . . . . . 62.7 Belgium Internal funds
Investment primarily in leased automobiles byToyota Motor Credit Corporation . . . . . . . . . . . . . . . . . 6,028.2 United States Internal funds,
financingfrom issuanceof bonds, etc.
49
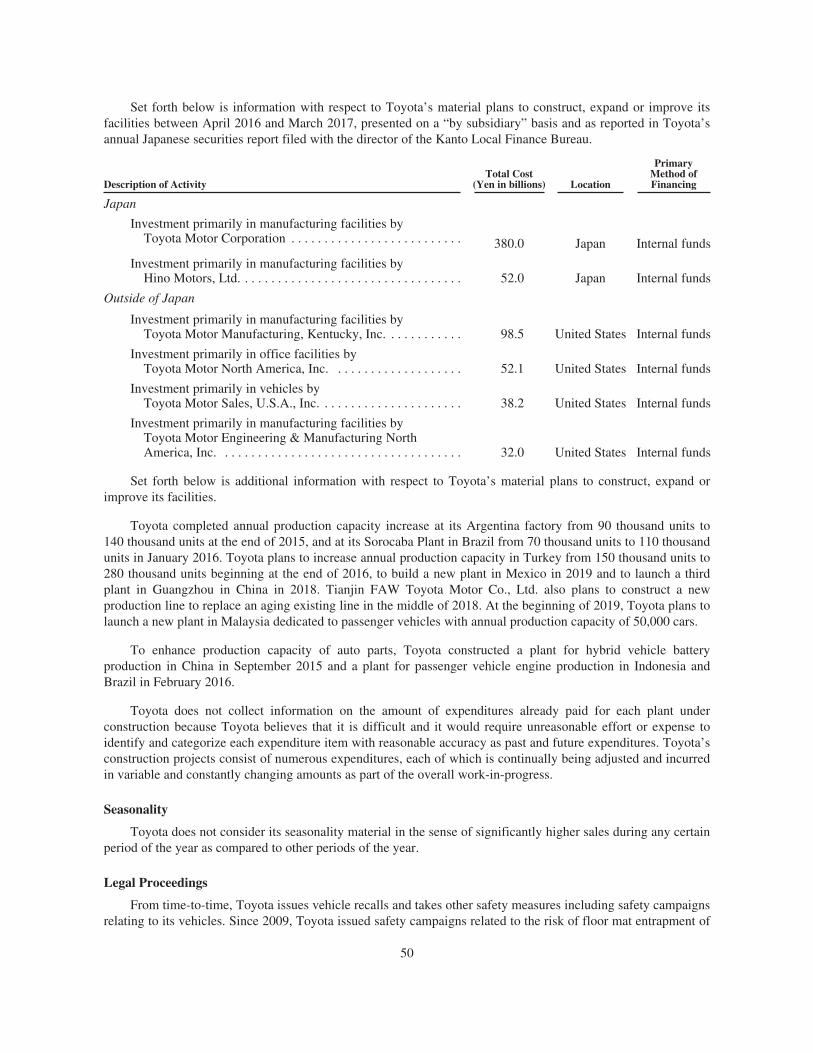
Set forth below is information with respect to Toyota’s material plans to construct, expand or improve itsfacilities between April 2016 and March 2017, presented on a “by subsidiary” basis and as reported in Toyota’sannual Japanese securities report filed with the director of the Kanto Local Finance Bureau.
Description of ActivityTotal Cost
(Yen in billions) Location
PrimaryMethod ofFinancing
Japan
Investment primarily in manufacturing facilities byToyota Motor Corporation . . . . . . . . . . . . . . . . . . . . . . . . . . 380.0 Japan Internal funds
Investment primarily in manufacturing facilities byHino Motors, Ltd. . . . . . . . . . . . . . . . . . . . . . . . . . . . . . . . . . 52.0 Japan Internal funds
Outside of Japan
Investment primarily in manufacturing facilities byToyota Motor Manufacturing, Kentucky, Inc. . . . . . . . . . . . 98.5 United States Internal funds
Investment primarily in office facilities byToyota Motor North America, Inc. . . . . . . . . . . . . . . . . . . . 52.1 United States Internal funds
Investment primarily in vehicles byToyota Motor Sales, U.S.A., Inc. . . . . . . . . . . . . . . . . . . . . . 38.2 United States Internal funds
Investment primarily in manufacturing facilities byToyota Motor Engineering & Manufacturing NorthAmerica, Inc. . . . . . . . . . . . . . . . . . . . . . . . . . . . . . . . . . . . . 32.0 United States Internal funds
Set forth below is additional information with respect to Toyota’s material plans to construct, expand orimprove its facilities.
Toyota completed annual production capacity increase at its Argentina factory from 90 thousand units to140 thousand units at the end of 2015, and at its Sorocaba Plant in Brazil from 70 thousand units to 110 thousandunits in January 2016. Toyota plans to increase annual production capacity in Turkey from 150 thousand units to280 thousand units beginning at the end of 2016, to build a new plant in Mexico in 2019 and to launch a thirdplant in Guangzhou in China in 2018. Tianjin FAW Toyota Motor Co., Ltd. also plans to construct a newproduction line to replace an aging existing line in the middle of 2018. At the beginning of 2019, Toyota plans tolaunch a new plant in Malaysia dedicated to passenger vehicles with annual production capacity of 50,000 cars.
To enhance production capacity of auto parts, Toyota constructed a plant for hybrid vehicle batteryproduction in China in September 2015 and a plant for passenger vehicle engine production in Indonesia andBrazil in February 2016.
Toyota does not collect information on the amount of expenditures already paid for each plant underconstruction because Toyota believes that it is difficult and it would require unreasonable effort or expense toidentify and categorize each expenditure item with reasonable accuracy as past and future expenditures. Toyota’sconstruction projects consist of numerous expenditures, each of which is continually being adjusted and incurredin variable and constantly changing amounts as part of the overall work-in-progress.
Seasonality
Toyota does not consider its seasonality material in the sense of significantly higher sales during any certainperiod of the year as compared to other periods of the year.
Legal Proceedings
From time-to-time, Toyota issues vehicle recalls and takes other safety measures including safety campaignsrelating to its vehicles. Since 2009, Toyota issued safety campaigns related to the risk of floor mat entrapment of
50
accelerator pedals and vehicle recalls related to slow-to-return or sticky accelerator pedals. In March 2014,Toyota entered into a Deferred Prosecution Agreement (“DPA”) to resolve an investigation by the U.S. Attorneyfor the Southern District of New York (“SDNY”) related to unintended acceleration in certain of its vehicles. TheDPA provides for an independent monitor to review and assess policies and procedures relating to Toyota’ssafety communications process, its process for sharing vehicle accident information internally and its process forpreparing and sharing certain technical reports.
In 2010, there was a recall related to the software program that controls the antilock braking system incertain models, including the Prius, which led to putative class action lawsuits on behalf of owners of recalledvehicles and owners of vehicles which were not recalled. The United States District Court for the Central Districtof California denied the plaintiffs’ motions for class certification and granted summary judgment in Toyota’sfavor denying the plaintiffs’ claims related to both the recalled vehicles and the non-recalled vehicles.Proceedings involving the recalled vehicles have concluded; the appeals of the granting of summary judgmentand the denial of class certification of the claims for the non-recalled vehicles are still pending.
Personal injury and wrongful death claims involving allegations of unintended acceleration are pending inseveral consolidated proceedings in federal and state courts, as well as in individual cases in various other states.The judges in the consolidated federal action and the consolidated California state action have approved anIntensive Settlement Process (“ISP”) for such claims in those actions. Under the ISP, all individual claims withinthe consolidated actions are stayed pending completion of a process to assess whether they can be resolved onterms acceptable to the parties. Cases not resolved after completion of the ISP will then proceed to discovery andtoward trial. Toyota has offered the ISP process to plaintiffs in other consolidated actions and in individual cases,as well.
Toyota has been named as a defendant in 33 economic loss class action lawsuits, which, together withsimilar lawsuits against Takata and other automakers, have been made part of a multi-district litigationproceeding in the United States District Court for the Southern District of Florida, arising out of allegations thatairbag inflators manufactured by Takata are defective. These lawsuits are at an early stage.
Toyota has received a request for information from the SDNY related to statements concerning one or morereported injuries sustained in Toyota vehicles following deployments of Takata airbags. Toyota is cooperatingwith the request.
Toyota self-reported a process gap in fulfilling certain emissions defect information reporting requirementswith the U.S. Environmental Protection Agency (“EPA”) and California Air Resources Board, including updateson its repair completion rates for recalled emissions components and certain other reports concerning emissionsrelated defects. Toyota is involved in discussions with these agencies. The SDNY and EPA have requestedcertain follow-up information regarding this reporting issue, and Toyota is cooperating with the request.
Toyota also has various other pending legal actions and claims, including without limitation personal injuryand wrongful death lawsuits and claims in the United States, and is subject to government investigationsfrom-time-to-time.
Beyond the amounts accrued with respect to all aforementioned matters, Toyota is unable to estimate arange of reasonably possible loss, if any, for the pending legal matters because (i) many of the proceedings are inevidence gathering stages, (ii) significant factual issues need to be resolved, (iii) the legal theory or nature of theclaims is unclear, (iv) the outcome of future motions or appeals is unknown and/or (v) the outcomes of othermatters of these types vary widely and do not appear sufficiently similar to offer meaningful guidance. Basedupon information currently available to Toyota, however, Toyota believes that its losses from these matters, ifany, beyond the amounts accrued, would not have a material adverse effect on Toyota’s financial position, resultsof operations or cash flows.
51
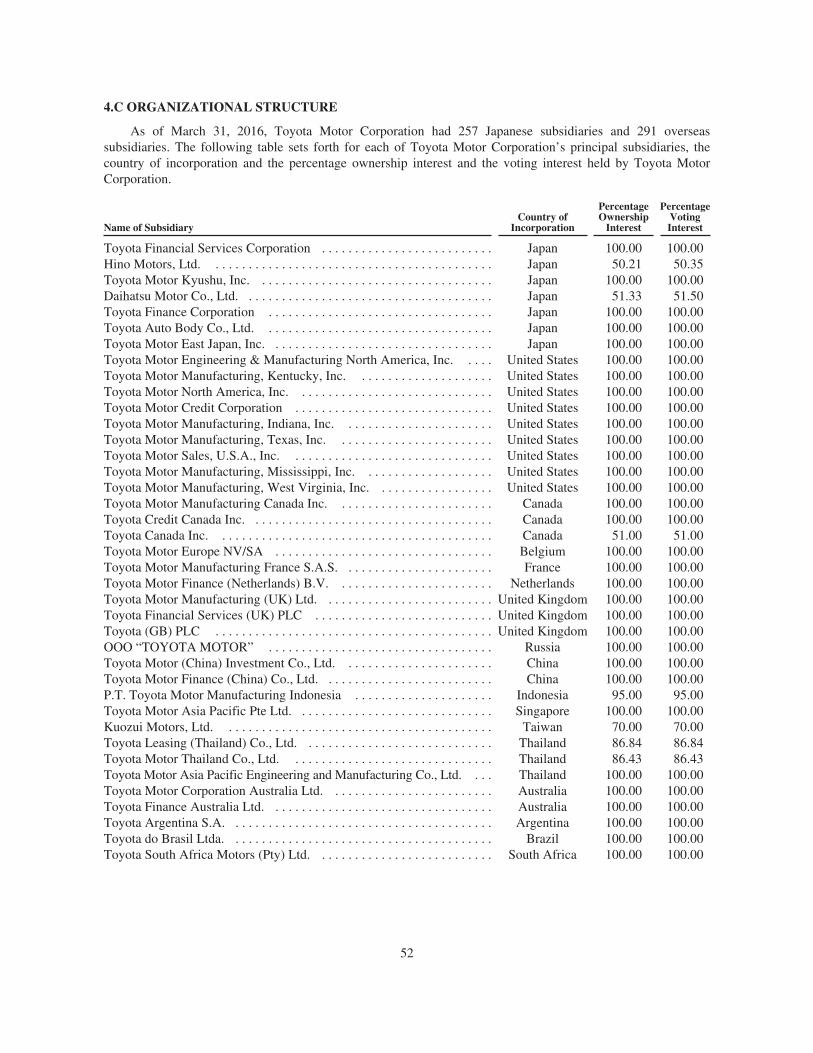
4.C ORGANIZATIONAL STRUCTURE
As of March 31, 2016, Toyota Motor Corporation had 257 Japanese subsidiaries and 291 overseassubsidiaries. The following table sets forth for each of Toyota Motor Corporation’s principal subsidiaries, thecountry of incorporation and the percentage ownership interest and the voting interest held by Toyota MotorCorporation.
Name of SubsidiaryCountry of
Incorporation
PercentageOwnership
Interest
PercentageVotingInterest
Toyota Financial Services Corporation . . . . . . . . . . . . . . . . . . . . . . . . . . Japan 100.00 100.00Hino Motors, Ltd. . . . . . . . . . . . . . . . . . . . . . . . . . . . . . . . . . . . . . . . . . . Japan 50.21 50.35Toyota Motor Kyushu, Inc. . . . . . . . . . . . . . . . . . . . . . . . . . . . . . . . . . . . Japan 100.00 100.00Daihatsu Motor Co., Ltd. . . . . . . . . . . . . . . . . . . . . . . . . . . . . . . . . . . . . . Japan 51.33 51.50Toyota Finance Corporation . . . . . . . . . . . . . . . . . . . . . . . . . . . . . . . . . . Japan 100.00 100.00Toyota Auto Body Co., Ltd. . . . . . . . . . . . . . . . . . . . . . . . . . . . . . . . . . . Japan 100.00 100.00Toyota Motor East Japan, Inc. . . . . . . . . . . . . . . . . . . . . . . . . . . . . . . . . . Japan 100.00 100.00Toyota Motor Engineering & Manufacturing North America, Inc. . . . . United States 100.00 100.00Toyota Motor Manufacturing, Kentucky, Inc. . . . . . . . . . . . . . . . . . . . . United States 100.00 100.00Toyota Motor North America, Inc. . . . . . . . . . . . . . . . . . . . . . . . . . . . . . United States 100.00 100.00Toyota Motor Credit Corporation . . . . . . . . . . . . . . . . . . . . . . . . . . . . . . United States 100.00 100.00Toyota Motor Manufacturing, Indiana, Inc. . . . . . . . . . . . . . . . . . . . . . . United States 100.00 100.00Toyota Motor Manufacturing, Texas, Inc. . . . . . . . . . . . . . . . . . . . . . . . United States 100.00 100.00Toyota Motor Sales, U.S.A., Inc. . . . . . . . . . . . . . . . . . . . . . . . . . . . . . . United States 100.00 100.00Toyota Motor Manufacturing, Mississippi, Inc. . . . . . . . . . . . . . . . . . . . United States 100.00 100.00Toyota Motor Manufacturing, West Virginia, Inc. . . . . . . . . . . . . . . . . . United States 100.00 100.00Toyota Motor Manufacturing Canada Inc. . . . . . . . . . . . . . . . . . . . . . . . Canada 100.00 100.00Toyota Credit Canada Inc. . . . . . . . . . . . . . . . . . . . . . . . . . . . . . . . . . . . . Canada 100.00 100.00Toyota Canada Inc. . . . . . . . . . . . . . . . . . . . . . . . . . . . . . . . . . . . . . . . . . Canada 51.00 51.00Toyota Motor Europe NV/SA . . . . . . . . . . . . . . . . . . . . . . . . . . . . . . . . . Belgium 100.00 100.00Toyota Motor Manufacturing France S.A.S. . . . . . . . . . . . . . . . . . . . . . . France 100.00 100.00Toyota Motor Finance (Netherlands) B.V. . . . . . . . . . . . . . . . . . . . . . . . Netherlands 100.00 100.00Toyota Motor Manufacturing (UK) Ltd. . . . . . . . . . . . . . . . . . . . . . . . . . United Kingdom 100.00 100.00Toyota Financial Services (UK) PLC . . . . . . . . . . . . . . . . . . . . . . . . . . . United Kingdom 100.00 100.00Toyota (GB) PLC . . . . . . . . . . . . . . . . . . . . . . . . . . . . . . . . . . . . . . . . . . United Kingdom 100.00 100.00OOO “TOYOTA MOTOR” . . . . . . . . . . . . . . . . . . . . . . . . . . . . . . . . . . Russia 100.00 100.00Toyota Motor (China) Investment Co., Ltd. . . . . . . . . . . . . . . . . . . . . . . China 100.00 100.00Toyota Motor Finance (China) Co., Ltd. . . . . . . . . . . . . . . . . . . . . . . . . . China 100.00 100.00P.T. Toyota Motor Manufacturing Indonesia . . . . . . . . . . . . . . . . . . . . . Indonesia 95.00 95.00Toyota Motor Asia Pacific Pte Ltd. . . . . . . . . . . . . . . . . . . . . . . . . . . . . . Singapore 100.00 100.00Kuozui Motors, Ltd. . . . . . . . . . . . . . . . . . . . . . . . . . . . . . . . . . . . . . . . . Taiwan 70.00 70.00Toyota Leasing (Thailand) Co., Ltd. . . . . . . . . . . . . . . . . . . . . . . . . . . . . Thailand 86.84 86.84Toyota Motor Thailand Co., Ltd. . . . . . . . . . . . . . . . . . . . . . . . . . . . . . . Thailand 86.43 86.43Toyota Motor Asia Pacific Engineering and Manufacturing Co., Ltd. . . . Thailand 100.00 100.00Toyota Motor Corporation Australia Ltd. . . . . . . . . . . . . . . . . . . . . . . . . Australia 100.00 100.00Toyota Finance Australia Ltd. . . . . . . . . . . . . . . . . . . . . . . . . . . . . . . . . . Australia 100.00 100.00Toyota Argentina S.A. . . . . . . . . . . . . . . . . . . . . . . . . . . . . . . . . . . . . . . . Argentina 100.00 100.00Toyota do Brasil Ltda. . . . . . . . . . . . . . . . . . . . . . . . . . . . . . . . . . . . . . . . Brazil 100.00 100.00Toyota South Africa Motors (Pty) Ltd. . . . . . . . . . . . . . . . . . . . . . . . . . . South Africa 100.00 100.00
52
4.D PROPERTY, PLANTS AND EQUIPMENT
As of March 31, 2016, Toyota and its affiliated companies produced automobiles and related componentsthrough more than 50 overseas manufacturing organizations in 28 countries and regions besides Japan. Thefacilities are located principally in Japan, the United States, Canada, the United Kingdom, France, Turkey,Thailand, China, Taiwan, India, Indonesia, South Africa, Australia, Argentina and Brazil.
In addition to its manufacturing facilities, Toyota’s properties include sales offices and other sales facilitiesin major cities, repair service facilities and research and development facilities.
The following table sets forth information, as of March 31, 2016, with respect to Toyota’s principalfacilities and organizations, all of which are owned by Toyota Motor Corporation or its subsidiaries. However,small portions, all under approximately 20%, of some facilities are on leased premises.
Facility or Subsidiary Name Location
Land Area(thousand
squaremeters)
Number ofEmployees
PrincipalProducts orFunctions
Japan (Toyota Motor Corporation)Tahara Plant . . . . . . . . . . . . . . . . . . . . . Tahara City, Aichi Pref. 4,029 6,756 AutomobilesHigashi-Fuji Technical Center . . . . . . . Susono City, Shizuoka Pref. 2,041 3,082 Research and
DevelopmentToyota Head Office and Technical
Center . . . . . . . . . . . . . . . . . . . . . . . . Toyota City, Aichi Pref. 1,930 23,954 Research andDevelopment
Motomachi Plant . . . . . . . . . . . . . . . . . Toyota City, Aichi Pref. 1,593 7,352 AutomobilesTakaoka Plant . . . . . . . . . . . . . . . . . . . Toyota City, Aichi Pref. 1,312 3,989 AutomobilesTsutsumi Plant . . . . . . . . . . . . . . . . . . . Toyota City, Aichi Pref. 937 5,467 AutomobilesKamigo Plant . . . . . . . . . . . . . . . . . . . . Toyota City, Aichi Pref. 868 2,790 Automobile partsKinu-ura Plant . . . . . . . . . . . . . . . . . . . Hekinan City, Aichi Pref. 836 2,854 Automobile partsHonsha Plant . . . . . . . . . . . . . . . . . . . . Toyota City, Aichi Pref. 551 1,967 Automobile partsNagoya Office . . . . . . . . . . . . . . . . . . . Nagoya City, Aichi Pref. 3 2,207 Office
Japan (Subsidiaries)
Daihatsu Motor Co., Ltd. . . . . . . . . . . . Ikeda City, Osaka, etc. 7,893 11,154 AutomobilesHino Motors, Ltd. . . . . . . . . . . . . . . . . Hino City, Tokyo, etc. 6,044 12,253 AutomobilesToyota Auto Body Co., Ltd. . . . . . . . . Kariya City, Aichi Pref., etc. 2,256 11,158 AutomobilesToyota Motor East Japan, Inc. . . . . . . . Kurokawa-gun, Miyagi Pref.,
etc.2,582 7,193 Automobiles
Toyota Motor Kyushu, Inc. . . . . . . . . . Miyawaka City, Fukuoka Pref.,etc.
1,940 7,385 Automobiles
Outside Japan (Subsidiaries)
Toyota Motor Thailand Co., Ltd. . . . . . Samutprakan, Thailand 4,414 10,203 AutomobilesToyota Motor Manufacturing Canada,
Inc. . . . . . . . . . . . . . . . . . . . . . . . . . . Ontario, Canada 4,756 7,031 AutomobilesToyota Motor Sales, U.S.A., Inc. . . . . California, U.S.A. 3,755 6,567 Sales facilitiesP.T. Toyota Motor Manufacturing,
Indonesia . . . . . . . . . . . . . . . . . . . . . Jakarta, Indonesia 2,801 5,479 AutomobilesToyota Motor Manufacturing,
Kentucky, Inc. . . . . . . . . . . . . . . . . . Kentucky, U.S.A. 5,161 7,507 Automobiles
53
Toyota is constantly engaged in upgrading, modernizing and revamping the operations of its manufacturingfacilities based on its assessment of market needs and prospects. To respond flexibly to fluctuations in demand ineach of its production operations throughout the world, Toyota continually reviews and implements appropriateproduction measures such as revising takt time and adjusting days of operation. As a result, Toyota believes itwould require unreasonable effort to track the exact productive capacity and the extent of utilization of each of itsmanufacturing facilities with a reasonable degree of accuracy.
As of March 31, 2016, property, plant and equipment having a net book value of approximately¥335.3 billion was pledged as collateral securing indebtedness incurred by Toyota Motor Corporation’sconsolidated subsidiaries. Toyota believes that there does not exist any material environmental issues that mayaffect the company’s utilization of its assets.
Toyota considers all its principal manufacturing facilities and other significant properties to be in goodcondition and adequate to meet the needs of its operations.
See “— Business Overview — Capital Expenditures and Divestitures” for a description of Toyota’s materialplans to construct, expand or improve facilities.
ITEM 4A. UNRESOLVED STAFF COMMENTS
None.
ITEM 5. OPERATING AND FINANCIAL REVIEW AND PROSPECTS
5.A OPERATING RESULTS
Financial information discussed in this section is derived from Toyota’s consolidated financial statementsthat appear elsewhere in this annual report. The financial statements have been prepared in conformity withaccounting principles generally accepted in the United States of America.
Overview
The business segments of Toyota include automotive operations, financial services operations and all otheroperations. Automotive operations are Toyota’s most significant business segment, accounting for 89% ofToyota’s total revenues before the elimination of intersegment revenues for fiscal 2016. Toyota’s primarymarkets based on vehicle unit sales for fiscal 2016 were: Japan (24%), North America (33%), Europe (10%) andAsia (15%).
Automotive Market Environment
The worldwide automotive market is highly competitive and volatile. The demand for automobiles isaffected by a number of factors including social, political and general economic conditions; introduction of newvehicles and technologies; and costs incurred by customers to purchase or operate vehicles. These factors cancause consumer demand to vary substantially in different geographic markets and for different types ofautomobiles.
During fiscal 2016, although markets have progressed in a steady manner, especially in the U.S., markets insome emerging countries have become stagnant, and the Japanese market has slowed down mainly in the sales ofmini-vehicles due to the tax increase. Meanwhile, the development of automated driving technology, as well asefforts toward improvement in environmental friendliness and safety, has made significant progress.
54
The following table sets forth Toyota’s consolidated vehicle unit sales by geographic market based onlocation of customers for the past three fiscal years.
Thousands of units
Year Ended March 31,
2014 2015 2016
Japan . . . . . . . . . . . . . . . . . . . . . . . . . . . . . . . . . . . . . . . . . . . . . . . . . . . . . . . . . . . . . . . . . . . 2,365 2,154 2,059North America . . . . . . . . . . . . . . . . . . . . . . . . . . . . . . . . . . . . . . . . . . . . . . . . . . . . . . . . . . . 2,529 2,715 2,839Europe . . . . . . . . . . . . . . . . . . . . . . . . . . . . . . . . . . . . . . . . . . . . . . . . . . . . . . . . . . . . . . . . . 844 859 844Asia . . . . . . . . . . . . . . . . . . . . . . . . . . . . . . . . . . . . . . . . . . . . . . . . . . . . . . . . . . . . . . . . . . . . 1,609 1,489 1,345Other* . . . . . . . . . . . . . . . . . . . . . . . . . . . . . . . . . . . . . . . . . . . . . . . . . . . . . . . . . . . . . . . . . . 1,769 1,755 1,594
Overseas total . . . . . . . . . . . . . . . . . . . . . . . . . . . . . . . . . . . . . . . . . . . . . . . . . . . . . . . . . . . . 6,751 6,818 6,622
Total . . . . . . . . . . . . . . . . . . . . . . . . . . . . . . . . . . . . . . . . . . . . . . . . . . . . . . . . . . . . . . . . . . . 9,116 8,972 8,681
* “Other” consists of Central and South America, Oceania, Africa and the Middle East, etc.
In each of fiscal 2015 and fiscal 2016, during which the market in Japan experienced downturns, Toyota’sconsolidated vehicle unit sales in Japan decreased compared to the previous fiscal year. Through the efforts ofdealers nationwide, for fiscal 2015 and fiscal 2016, the Toyota and Lexus brands’ market share excludingmini-vehicles was 46.0% and 46.8%, and the market share (including Daihatsu and Hino brands) includingmini-vehicles was 41.8% and 43.2%, each remaining at a high level, as was the case in fiscal 2014. Overseasconsolidated vehicle unit sales increased as a whole during fiscal 2015, due to increased sales in North Americaand Europe, while vehicle unit sales decreased as a whole during fiscal 2016, due mainly to decreases in Asia andthe Middle East, despite an increase in North America.
Toyota’s share of total vehicle unit sales in each market is influenced by the quality, safety, reliability, price,design, performance, economy and utility of Toyota’s vehicles compared with those offered by othermanufacturers. The timely introduction of new or redesigned vehicles is also an important factor in satisfyingcustomer needs. Toyota’s ability to satisfy changing customer preferences can affect its revenues and earningssignificantly.
The profitability of Toyota’s automotive operations is affected by many factors. These factors include:
• vehicle unit sales volumes,
• the mix of vehicle models and options sold,
• the level of parts and service sales,
• the levels of price discounts and other sales incentives and marketing costs,
• the cost of customer warranty claims and other customer satisfaction actions,
• the cost of research and development and other fixed costs,
• the prices of raw materials,
• the ability to control costs,
• the efficient use of production capacity,
• the adverse effect on production due to the reliance on various suppliers for the provision of supplies,
• the adverse effect on market, sales and productions of natural calamities and interruptions of socialinfrastructure, and
• changes in the value of the Japanese yen and other currencies in which Toyota conducts business.
55
Changes in laws, regulations, policies and other governmental actions can also materially impact theprofitability of Toyota’s automotive operations. These laws, regulations and policies include those attributed toenvironmental matters, vehicle safety, fuel economy and emissions that can add significantly to the cost of vehicles.
Many governments also impose local content requirements, impose tariffs and other trade barriers, and enactprice or exchange controls that can limit an automaker’s operations and can make the repatriation of profitsunpredictable. Changes in these laws, regulations, policies and other governmental actions may affect theproduction, licensing, distribution or sale of Toyota’s products, cost of products or applicable tax rates. Fromtime-to-time when potential safety problems arise, Toyota issues vehicle recalls and takes other safety measuresincluding safety campaigns relating to its vehicles. Since 2009, Toyota issued safety campaigns related to the riskof floor mat entrapment of accelerator pedals and vehicle recalls related to slow-to-return or sticky acceleratorpedals. In 2010, Toyota announced a recall related to the software program that controls the antilock brakingsystem in certain models including the Prius. The recalls and other safety measures described above have led to anumber of claims and lawsuits against Toyota. For a more detailed description of these claims and lawsuits, see“Information on the Company — Business Overview — Legal Proceedings” and note 24 to the consolidatedfinancial statements.
The worldwide automotive industry is in a period of global competition which may continue for theforeseeable future, and in general the competitive environment in which Toyota operates is likely to intensify.Toyota believes it has the resources, strategies and technologies in place to compete effectively in the industry asan independent company for the foreseeable future.
Financial Services Operations
The competition in the worldwide automobile financial services industry is intensifying. As competitionincreases, margins on financing transactions may decrease and market share may also decline as customersobtain financing for Toyota vehicles from alternative sources.
Toyota’s financial services operations mainly include loans and leasing programs for customers and dealers.Toyota believes that its ability to provide financing to its customers is an important value added service.Therefore, Toyota has expanded its network of finance subsidiaries in order to offer financial services in manycountries.
Toyota’s competitors for retail financing and retail leasing include commercial banks, credit unions andother finance companies. Meanwhile, commercial banks and other captive automobile finance companies alsocompete against Toyota’s wholesale financing activities.
Toyota’s total finance receivables decreased during fiscal 2016 mainly due to the unfavorable impact offluctuations in foreign currency translation rates. Also, vehicles and equipment on operating leases, net increasedduring fiscal 2016 mainly due to an increase in the number of operating leases in financial services subsidiariesin North America.
56
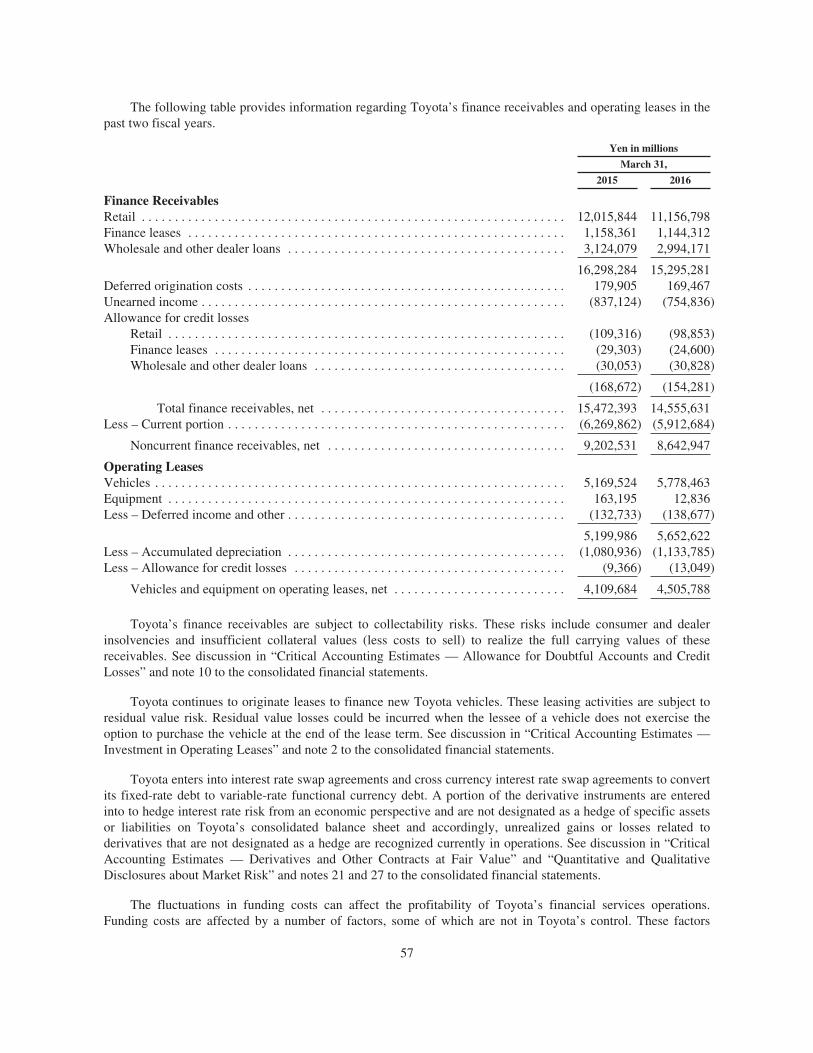
The following table provides information regarding Toyota’s finance receivables and operating leases in thepast two fiscal years.
Yen in millions
March 31,
2015 2016
Finance ReceivablesRetail . . . . . . . . . . . . . . . . . . . . . . . . . . . . . . . . . . . . . . . . . . . . . . . . . . . . . . . . . . . . . . . . 12,015,844 11,156,798Finance leases . . . . . . . . . . . . . . . . . . . . . . . . . . . . . . . . . . . . . . . . . . . . . . . . . . . . . . . . . 1,158,361 1,144,312Wholesale and other dealer loans . . . . . . . . . . . . . . . . . . . . . . . . . . . . . . . . . . . . . . . . . . 3,124,079 2,994,171
16,298,284 15,295,281Deferred origination costs . . . . . . . . . . . . . . . . . . . . . . . . . . . . . . . . . . . . . . . . . . . . . . . . 179,905 169,467Unearned income . . . . . . . . . . . . . . . . . . . . . . . . . . . . . . . . . . . . . . . . . . . . . . . . . . . . . . . (837,124) (754,836)Allowance for credit losses
Retail . . . . . . . . . . . . . . . . . . . . . . . . . . . . . . . . . . . . . . . . . . . . . . . . . . . . . . . . . . . . (109,316) (98,853)Finance leases . . . . . . . . . . . . . . . . . . . . . . . . . . . . . . . . . . . . . . . . . . . . . . . . . . . . . (29,303) (24,600)Wholesale and other dealer loans . . . . . . . . . . . . . . . . . . . . . . . . . . . . . . . . . . . . . . (30,053) (30,828)
(168,672) (154,281)
Total finance receivables, net . . . . . . . . . . . . . . . . . . . . . . . . . . . . . . . . . . . . . 15,472,393 14,555,631Less – Current portion . . . . . . . . . . . . . . . . . . . . . . . . . . . . . . . . . . . . . . . . . . . . . . . . . . . (6,269,862) (5,912,684)
Noncurrent finance receivables, net . . . . . . . . . . . . . . . . . . . . . . . . . . . . . . . . . . . . 9,202,531 8,642,947
Operating LeasesVehicles . . . . . . . . . . . . . . . . . . . . . . . . . . . . . . . . . . . . . . . . . . . . . . . . . . . . . . . . . . . . . . 5,169,524 5,778,463Equipment . . . . . . . . . . . . . . . . . . . . . . . . . . . . . . . . . . . . . . . . . . . . . . . . . . . . . . . . . . . . 163,195 12,836Less – Deferred income and other . . . . . . . . . . . . . . . . . . . . . . . . . . . . . . . . . . . . . . . . . . (132,733) (138,677)
5,199,986 5,652,622Less – Accumulated depreciation . . . . . . . . . . . . . . . . . . . . . . . . . . . . . . . . . . . . . . . . . . (1,080,936) (1,133,785)Less – Allowance for credit losses . . . . . . . . . . . . . . . . . . . . . . . . . . . . . . . . . . . . . . . . . (9,366) (13,049)
Vehicles and equipment on operating leases, net . . . . . . . . . . . . . . . . . . . . . . . . . . 4,109,684 4,505,788
Toyota’s finance receivables are subject to collectability risks. These risks include consumer and dealerinsolvencies and insufficient collateral values (less costs to sell) to realize the full carrying values of thesereceivables. See discussion in “Critical Accounting Estimates — Allowance for Doubtful Accounts and CreditLosses” and note 10 to the consolidated financial statements.
Toyota continues to originate leases to finance new Toyota vehicles. These leasing activities are subject toresidual value risk. Residual value losses could be incurred when the lessee of a vehicle does not exercise theoption to purchase the vehicle at the end of the lease term. See discussion in “Critical Accounting Estimates —Investment in Operating Leases” and note 2 to the consolidated financial statements.
Toyota enters into interest rate swap agreements and cross currency interest rate swap agreements to convertits fixed-rate debt to variable-rate functional currency debt. A portion of the derivative instruments are enteredinto to hedge interest rate risk from an economic perspective and are not designated as a hedge of specific assetsor liabilities on Toyota’s consolidated balance sheet and accordingly, unrealized gains or losses related toderivatives that are not designated as a hedge are recognized currently in operations. See discussion in “CriticalAccounting Estimates — Derivatives and Other Contracts at Fair Value” and “Quantitative and QualitativeDisclosures about Market Risk” and notes 21 and 27 to the consolidated financial statements.
The fluctuations in funding costs can affect the profitability of Toyota’s financial services operations.Funding costs are affected by a number of factors, some of which are not in Toyota’s control. These factors
57
include general economic conditions, prevailing interest rates and Toyota’s financial strength. Funding costsdecreased during fiscal 2015 and 2016, mainly as a result of lower interest rates.
Toyota launched its credit card business in Japan in April 2001. As of March 31, 2015, Toyota had13.5 million cardholders, an increase of 0.8 million cardholders compared with March 31, 2014. As of March 31,2016, Toyota had 14.3 million cardholders, an increase of 0.8 million cardholders compared with March 31,2015. Credit card receivables as of March 31, 2015 was ¥380.9 billion nearly equal to March 31, 2014, and thatas of March 31, 2016 increased by ¥2.7 billion from March 31, 2015 to ¥383.6 billion.
Other Business Operations
Toyota’s other business operations consist of housing (including the manufacture and sale of prefabricatedhomes), information technology related businesses (including information technology and telecommunications,intelligent transport systems and GAZOO) and other businesses.
Toyota does not expect its other business operations to materially contribute to Toyota’s consolidated resultsof operations.
Currency Fluctuations
Toyota is affected by fluctuations in foreign currency exchange rates. Toyota is exposed to fluctuations inthe value of the Japanese yen against the U.S. dollar and the euro as well as the Australian dollar, the Russianruble, the Canadian dollar, the British pound, and others. Toyota’s consolidated financial statements, which arepresented in Japanese yen, are affected by foreign currency exchange fluctuations through both translation riskand transaction risk.
Translation risk is the risk that Toyota’s consolidated financial statements for a particular period or for aparticular date will be affected by changes in the prevailing exchange rates of the currencies in those countries inwhich Toyota does business compared with the Japanese yen. Even though the fluctuations of currency exchangerates to the Japanese yen can be substantial, and, therefore, significantly impact comparisons with prior periodsand among the various geographic markets, the translation risk is a reporting consideration and does not reflectToyota’s underlying results of operations. Toyota does not hedge against translation risk.
Transaction risk is the risk that the currency structure of Toyota’s costs and liabilities will deviate from thecurrency structure of sales proceeds and assets. Transaction risk relates primarily to sales proceeds from Toyota’snon-domestic operations from vehicles produced in Japan.
Toyota believes that the location of its production facilities in different parts of the world has significantlyreduced the level of transaction risk. As part of its globalization strategy, Toyota has continued to localizeproduction by constructing production facilities in the major markets in which it sells its vehicles. In calendar2014 and 2015, Toyota produced 76.5% and 75.1%, respectively, of its non-domestic sales outside Japan. InNorth America, 74.4% and 72.2% of vehicles sold in calendar 2014 and 2015, respectively, were producedlocally. In Europe, 73.7% and 76.3% of vehicles sold in calendar 2014 and 2015, respectively, were producedlocally. Localizing production enables Toyota to locally purchase many of the supplies and resources used in theproduction process, which allows for a better match of local currency revenues with local currency expenses.
Toyota also enters into foreign currency transactions and other hedging instruments to address a portion ofits transaction risk. This has reduced, but not eliminated, the effects of foreign currency exchange ratefluctuations, which in some years can be significant. See notes 21 and 27 to the consolidated financial statementsfor additional information.
58
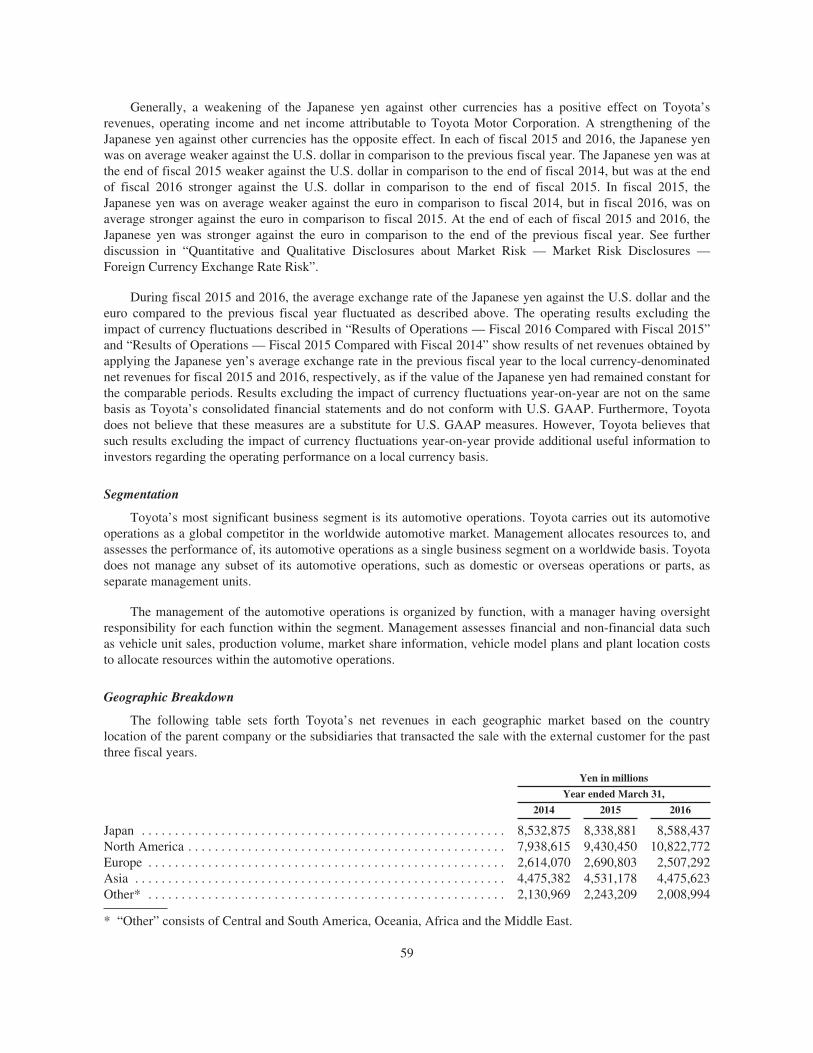
Generally, a weakening of the Japanese yen against other currencies has a positive effect on Toyota’srevenues, operating income and net income attributable to Toyota Motor Corporation. A strengthening of theJapanese yen against other currencies has the opposite effect. In each of fiscal 2015 and 2016, the Japanese yenwas on average weaker against the U.S. dollar in comparison to the previous fiscal year. The Japanese yen was atthe end of fiscal 2015 weaker against the U.S. dollar in comparison to the end of fiscal 2014, but was at the endof fiscal 2016 stronger against the U.S. dollar in comparison to the end of fiscal 2015. In fiscal 2015, theJapanese yen was on average weaker against the euro in comparison to fiscal 2014, but in fiscal 2016, was onaverage stronger against the euro in comparison to fiscal 2015. At the end of each of fiscal 2015 and 2016, theJapanese yen was stronger against the euro in comparison to the end of the previous fiscal year. See furtherdiscussion in “Quantitative and Qualitative Disclosures about Market Risk — Market Risk Disclosures —Foreign Currency Exchange Rate Risk”.
During fiscal 2015 and 2016, the average exchange rate of the Japanese yen against the U.S. dollar and theeuro compared to the previous fiscal year fluctuated as described above. The operating results excluding theimpact of currency fluctuations described in “Results of Operations — Fiscal 2016 Compared with Fiscal 2015”and “Results of Operations — Fiscal 2015 Compared with Fiscal 2014” show results of net revenues obtained byapplying the Japanese yen’s average exchange rate in the previous fiscal year to the local currency-denominatednet revenues for fiscal 2015 and 2016, respectively, as if the value of the Japanese yen had remained constant forthe comparable periods. Results excluding the impact of currency fluctuations year-on-year are not on the samebasis as Toyota’s consolidated financial statements and do not conform with U.S. GAAP. Furthermore, Toyotadoes not believe that these measures are a substitute for U.S. GAAP measures. However, Toyota believes thatsuch results excluding the impact of currency fluctuations year-on-year provide additional useful information toinvestors regarding the operating performance on a local currency basis.
Segmentation
Toyota’s most significant business segment is its automotive operations. Toyota carries out its automotiveoperations as a global competitor in the worldwide automotive market. Management allocates resources to, andassesses the performance of, its automotive operations as a single business segment on a worldwide basis. Toyotadoes not manage any subset of its automotive operations, such as domestic or overseas operations or parts, asseparate management units.
The management of the automotive operations is organized by function, with a manager having oversightresponsibility for each function within the segment. Management assesses financial and non-financial data suchas vehicle unit sales, production volume, market share information, vehicle model plans and plant location coststo allocate resources within the automotive operations.
Geographic Breakdown
The following table sets forth Toyota’s net revenues in each geographic market based on the countrylocation of the parent company or the subsidiaries that transacted the sale with the external customer for the pastthree fiscal years.
Yen in millions
Year ended March 31,
2014 2015 2016
Japan . . . . . . . . . . . . . . . . . . . . . . . . . . . . . . . . . . . . . . . . . . . . . . . . . . . . . . . 8,532,875 8,338,881 8,588,437North America . . . . . . . . . . . . . . . . . . . . . . . . . . . . . . . . . . . . . . . . . . . . . . . . 7,938,615 9,430,450 10,822,772Europe . . . . . . . . . . . . . . . . . . . . . . . . . . . . . . . . . . . . . . . . . . . . . . . . . . . . . . 2,614,070 2,690,803 2,507,292Asia . . . . . . . . . . . . . . . . . . . . . . . . . . . . . . . . . . . . . . . . . . . . . . . . . . . . . . . . 4,475,382 4,531,178 4,475,623Other* . . . . . . . . . . . . . . . . . . . . . . . . . . . . . . . . . . . . . . . . . . . . . . . . . . . . . . 2,130,969 2,243,209 2,008,994
* “Other” consists of Central and South America, Oceania, Africa and the Middle East.
59
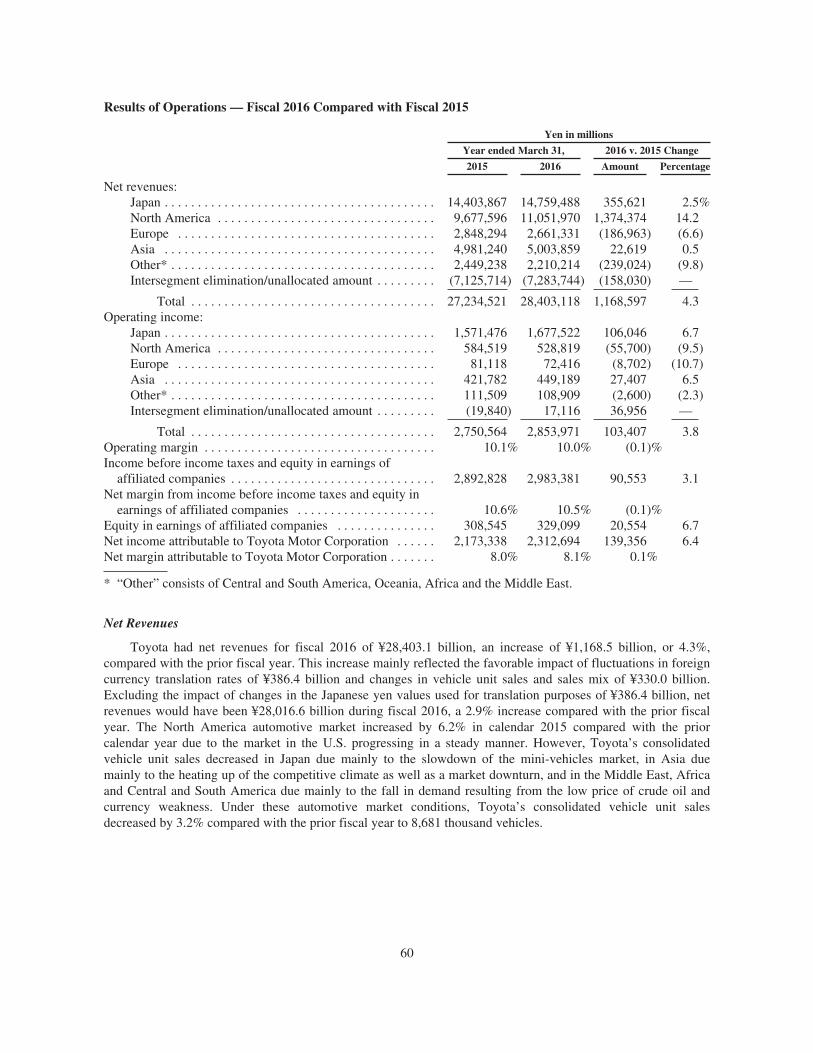
Results of Operations — Fiscal 2016 Compared with Fiscal 2015
Yen in millions
Year ended March 31, 2016 v. 2015 Change
2015 2016 Amount Percentage
Net revenues:Japan . . . . . . . . . . . . . . . . . . . . . . . . . . . . . . . . . . . . . . . . . 14,403,867 14,759,488 355,621 2.5%North America . . . . . . . . . . . . . . . . . . . . . . . . . . . . . . . . . 9,677,596 11,051,970 1,374,374 14.2Europe . . . . . . . . . . . . . . . . . . . . . . . . . . . . . . . . . . . . . . . 2,848,294 2,661,331 (186,963) (6.6)Asia . . . . . . . . . . . . . . . . . . . . . . . . . . . . . . . . . . . . . . . . . 4,981,240 5,003,859 22,619 0.5Other* . . . . . . . . . . . . . . . . . . . . . . . . . . . . . . . . . . . . . . . . 2,449,238 2,210,214 (239,024) (9.8)Intersegment elimination/unallocated amount . . . . . . . . . (7,125,714) (7,283,744) (158,030) —
Total . . . . . . . . . . . . . . . . . . . . . . . . . . . . . . . . . . . . . 27,234,521 28,403,118 1,168,597 4.3Operating income:
Japan . . . . . . . . . . . . . . . . . . . . . . . . . . . . . . . . . . . . . . . . . 1,571,476 1,677,522 106,046 6.7North America . . . . . . . . . . . . . . . . . . . . . . . . . . . . . . . . . 584,519 528,819 (55,700) (9.5)Europe . . . . . . . . . . . . . . . . . . . . . . . . . . . . . . . . . . . . . . . 81,118 72,416 (8,702) (10.7)Asia . . . . . . . . . . . . . . . . . . . . . . . . . . . . . . . . . . . . . . . . . 421,782 449,189 27,407 6.5Other* . . . . . . . . . . . . . . . . . . . . . . . . . . . . . . . . . . . . . . . . 111,509 108,909 (2,600) (2.3)Intersegment elimination/unallocated amount . . . . . . . . . (19,840) 17,116 36,956 —
Total . . . . . . . . . . . . . . . . . . . . . . . . . . . . . . . . . . . . . 2,750,564 2,853,971 103,407 3.8Operating margin . . . . . . . . . . . . . . . . . . . . . . . . . . . . . . . . . . . 10.1% 10.0% (0.1)%Income before income taxes and equity in earnings of
affiliated companies . . . . . . . . . . . . . . . . . . . . . . . . . . . . . . . 2,892,828 2,983,381 90,553 3.1Net margin from income before income taxes and equity in
earnings of affiliated companies . . . . . . . . . . . . . . . . . . . . . 10.6% 10.5% (0.1)%Equity in earnings of affiliated companies . . . . . . . . . . . . . . . 308,545 329,099 20,554 6.7Net income attributable to Toyota Motor Corporation . . . . . . 2,173,338 2,312,694 139,356 6.4Net margin attributable to Toyota Motor Corporation . . . . . . . 8.0% 8.1% 0.1%
* “Other” consists of Central and South America, Oceania, Africa and the Middle East.
Net Revenues
Toyota had net revenues for fiscal 2016 of ¥28,403.1 billion, an increase of ¥1,168.5 billion, or 4.3%,compared with the prior fiscal year. This increase mainly reflected the favorable impact of fluctuations in foreigncurrency translation rates of ¥386.4 billion and changes in vehicle unit sales and sales mix of ¥330.0 billion.Excluding the impact of changes in the Japanese yen values used for translation purposes of ¥386.4 billion, netrevenues would have been ¥28,016.6 billion during fiscal 2016, a 2.9% increase compared with the prior fiscalyear. The North America automotive market increased by 6.2% in calendar 2015 compared with the priorcalendar year due to the market in the U.S. progressing in a steady manner. However, Toyota’s consolidatedvehicle unit sales decreased in Japan due mainly to the slowdown of the mini-vehicles market, in Asia duemainly to the heating up of the competitive climate as well as a market downturn, and in the Middle East, Africaand Central and South America due mainly to the fall in demand resulting from the low price of crude oil andcurrency weakness. Under these automotive market conditions, Toyota’s consolidated vehicle unit salesdecreased by 3.2% compared with the prior fiscal year to 8,681 thousand vehicles.
60
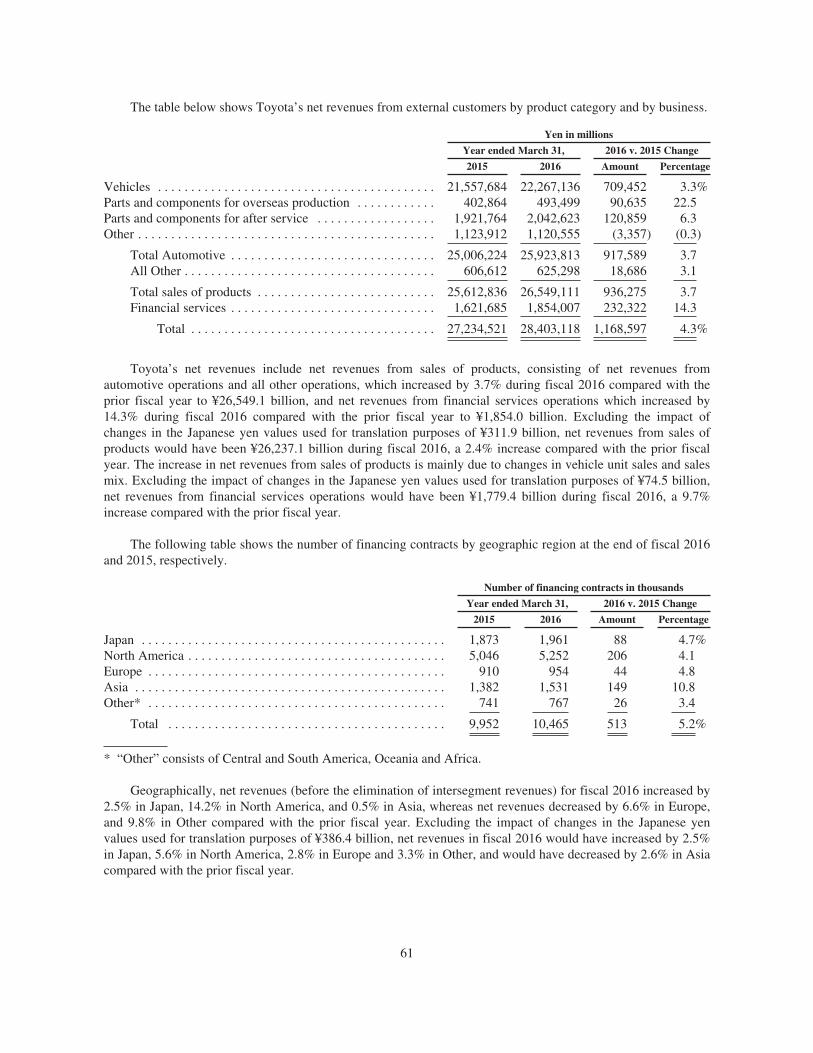
The table below shows Toyota’s net revenues from external customers by product category and by business.
Yen in millions
Year ended March 31, 2016 v. 2015 Change
2015 2016 Amount Percentage
Vehicles . . . . . . . . . . . . . . . . . . . . . . . . . . . . . . . . . . . . . . . . . . 21,557,684 22,267,136 709,452 3.3%Parts and components for overseas production . . . . . . . . . . . . 402,864 493,499 90,635 22.5Parts and components for after service . . . . . . . . . . . . . . . . . . 1,921,764 2,042,623 120,859 6.3Other . . . . . . . . . . . . . . . . . . . . . . . . . . . . . . . . . . . . . . . . . . . . . 1,123,912 1,120,555 (3,357) (0.3)
Total Automotive . . . . . . . . . . . . . . . . . . . . . . . . . . . . . . . 25,006,224 25,923,813 917,589 3.7All Other . . . . . . . . . . . . . . . . . . . . . . . . . . . . . . . . . . . . . . 606,612 625,298 18,686 3.1
Total sales of products . . . . . . . . . . . . . . . . . . . . . . . . . . . 25,612,836 26,549,111 936,275 3.7Financial services . . . . . . . . . . . . . . . . . . . . . . . . . . . . . . . 1,621,685 1,854,007 232,322 14.3
Total . . . . . . . . . . . . . . . . . . . . . . . . . . . . . . . . . . . . . 27,234,521 28,403,118 1,168,597 4.3%
Toyota’s net revenues include net revenues from sales of products, consisting of net revenues fromautomotive operations and all other operations, which increased by 3.7% during fiscal 2016 compared with theprior fiscal year to ¥26,549.1 billion, and net revenues from financial services operations which increased by14.3% during fiscal 2016 compared with the prior fiscal year to ¥1,854.0 billion. Excluding the impact ofchanges in the Japanese yen values used for translation purposes of ¥311.9 billion, net revenues from sales ofproducts would have been ¥26,237.1 billion during fiscal 2016, a 2.4% increase compared with the prior fiscalyear. The increase in net revenues from sales of products is mainly due to changes in vehicle unit sales and salesmix. Excluding the impact of changes in the Japanese yen values used for translation purposes of ¥74.5 billion,net revenues from financial services operations would have been ¥1,779.4 billion during fiscal 2016, a 9.7%increase compared with the prior fiscal year.
The following table shows the number of financing contracts by geographic region at the end of fiscal 2016and 2015, respectively.
Number of financing contracts in thousands
Year ended March 31, 2016 v. 2015 Change
2015 2016 Amount Percentage
Japan . . . . . . . . . . . . . . . . . . . . . . . . . . . . . . . . . . . . . . . . . . . . . . 1,873 1,961 88 4.7%North America . . . . . . . . . . . . . . . . . . . . . . . . . . . . . . . . . . . . . . . 5,046 5,252 206 4.1Europe . . . . . . . . . . . . . . . . . . . . . . . . . . . . . . . . . . . . . . . . . . . . . 910 954 44 4.8Asia . . . . . . . . . . . . . . . . . . . . . . . . . . . . . . . . . . . . . . . . . . . . . . . 1,382 1,531 149 10.8Other* . . . . . . . . . . . . . . . . . . . . . . . . . . . . . . . . . . . . . . . . . . . . . 741 767 26 3.4
Total . . . . . . . . . . . . . . . . . . . . . . . . . . . . . . . . . . . . . . . . . . 9,952 10,465 513 5.2%
* “Other” consists of Central and South America, Oceania and Africa.
Geographically, net revenues (before the elimination of intersegment revenues) for fiscal 2016 increased by2.5% in Japan, 14.2% in North America, and 0.5% in Asia, whereas net revenues decreased by 6.6% in Europe,and 9.8% in Other compared with the prior fiscal year. Excluding the impact of changes in the Japanese yenvalues used for translation purposes of ¥386.4 billion, net revenues in fiscal 2016 would have increased by 2.5%in Japan, 5.6% in North America, 2.8% in Europe and 3.3% in Other, and would have decreased by 2.6% in Asiacompared with the prior fiscal year.
61
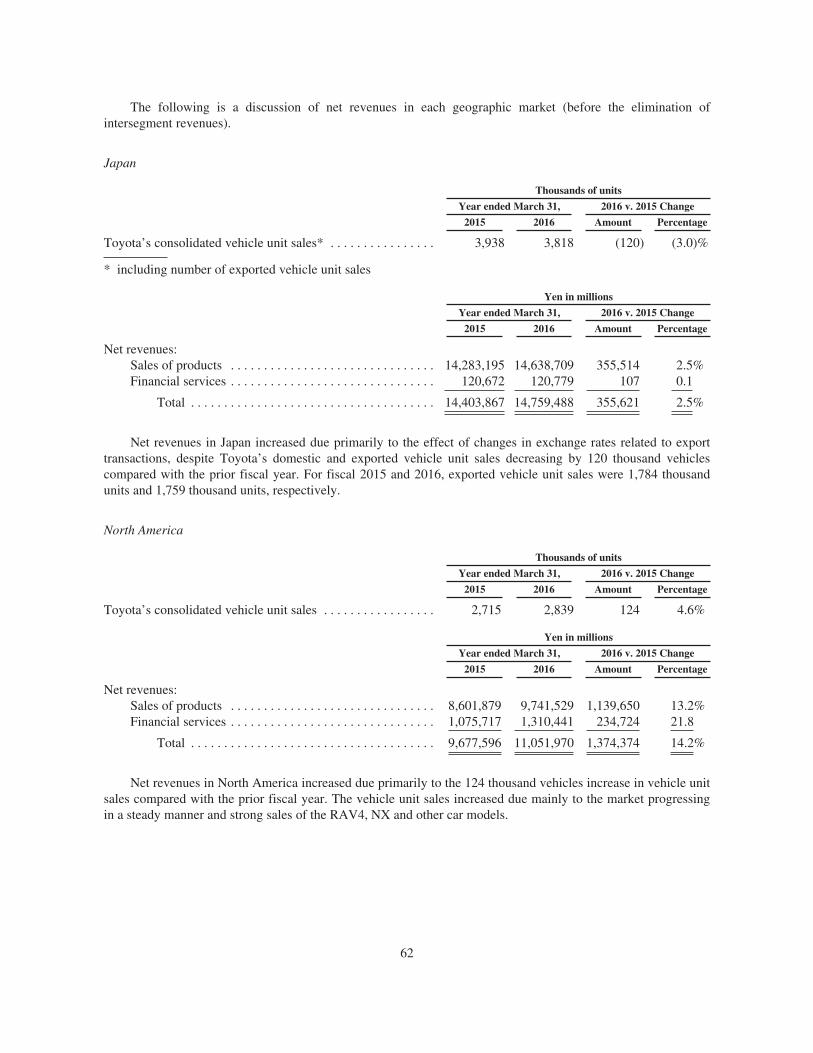
The following is a discussion of net revenues in each geographic market (before the elimination ofintersegment revenues).
Japan
Thousands of units
Year ended March 31, 2016 v. 2015 Change
2015 2016 Amount Percentage
Toyota’s consolidated vehicle unit sales* . . . . . . . . . . . . . . . . 3,938 3,818 (120) (3.0)%
* including number of exported vehicle unit sales
Yen in millions
Year ended March 31, 2016 v. 2015 Change
2015 2016 Amount Percentage
Net revenues:Sales of products . . . . . . . . . . . . . . . . . . . . . . . . . . . . . . . 14,283,195 14,638,709 355,514 2.5%Financial services . . . . . . . . . . . . . . . . . . . . . . . . . . . . . . . 120,672 120,779 107 0.1
Total . . . . . . . . . . . . . . . . . . . . . . . . . . . . . . . . . . . . . 14,403,867 14,759,488 355,621 2.5%
Net revenues in Japan increased due primarily to the effect of changes in exchange rates related to exporttransactions, despite Toyota’s domestic and exported vehicle unit sales decreasing by 120 thousand vehiclescompared with the prior fiscal year. For fiscal 2015 and 2016, exported vehicle unit sales were 1,784 thousandunits and 1,759 thousand units, respectively.
North America
Thousands of units
Year ended March 31, 2016 v. 2015 Change
2015 2016 Amount Percentage
Toyota’s consolidated vehicle unit sales . . . . . . . . . . . . . . . . . 2,715 2,839 124 4.6%
Yen in millions
Year ended March 31, 2016 v. 2015 Change
2015 2016 Amount Percentage
Net revenues:Sales of products . . . . . . . . . . . . . . . . . . . . . . . . . . . . . . . 8,601,879 9,741,529 1,139,650 13.2%Financial services . . . . . . . . . . . . . . . . . . . . . . . . . . . . . . . 1,075,717 1,310,441 234,724 21.8
Total . . . . . . . . . . . . . . . . . . . . . . . . . . . . . . . . . . . . . 9,677,596 11,051,970 1,374,374 14.2%
Net revenues in North America increased due primarily to the 124 thousand vehicles increase in vehicle unitsales compared with the prior fiscal year. The vehicle unit sales increased due mainly to the market progressingin a steady manner and strong sales of the RAV4, NX and other car models.
62
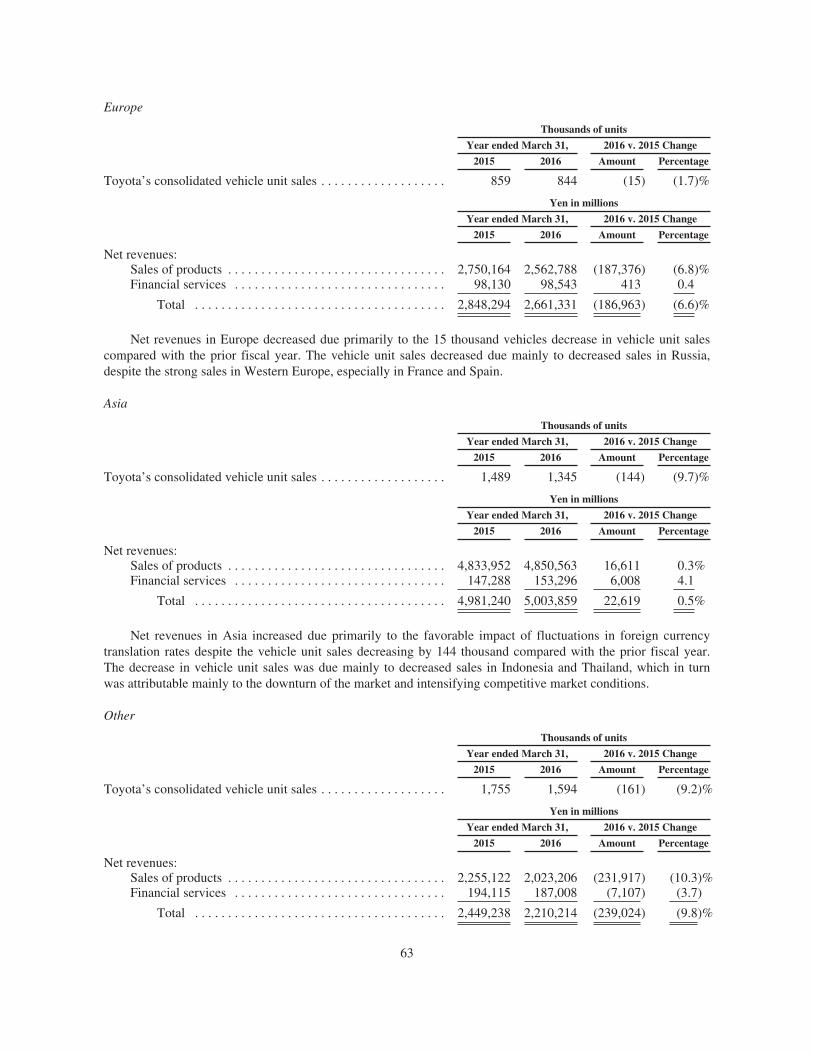
Europe
Thousands of units
Year ended March 31, 2016 v. 2015 Change
2015 2016 Amount Percentage
Toyota’s consolidated vehicle unit sales . . . . . . . . . . . . . . . . . . . 859 844 (15) (1.7)%
Yen in millions
Year ended March 31, 2016 v. 2015 Change
2015 2016 Amount Percentage
Net revenues:Sales of products . . . . . . . . . . . . . . . . . . . . . . . . . . . . . . . . . 2,750,164 2,562,788 (187,376) (6.8)%Financial services . . . . . . . . . . . . . . . . . . . . . . . . . . . . . . . . 98,130 98,543 413 0.4
Total . . . . . . . . . . . . . . . . . . . . . . . . . . . . . . . . . . . . . . 2,848,294 2,661,331 (186,963) (6.6)%
Net revenues in Europe decreased due primarily to the 15 thousand vehicles decrease in vehicle unit salescompared with the prior fiscal year. The vehicle unit sales decreased due mainly to decreased sales in Russia,despite the strong sales in Western Europe, especially in France and Spain.
Asia
Thousands of units
Year ended March 31, 2016 v. 2015 Change
2015 2016 Amount Percentage
Toyota’s consolidated vehicle unit sales . . . . . . . . . . . . . . . . . . . 1,489 1,345 (144) (9.7)%
Yen in millions
Year ended March 31, 2016 v. 2015 Change
2015 2016 Amount Percentage
Net revenues:Sales of products . . . . . . . . . . . . . . . . . . . . . . . . . . . . . . . . . 4,833,952 4,850,563 16,611 0.3%Financial services . . . . . . . . . . . . . . . . . . . . . . . . . . . . . . . . 147,288 153,296 6,008 4.1
Total . . . . . . . . . . . . . . . . . . . . . . . . . . . . . . . . . . . . . . 4,981,240 5,003,859 22,619 0.5%
Net revenues in Asia increased due primarily to the favorable impact of fluctuations in foreign currencytranslation rates despite the vehicle unit sales decreasing by 144 thousand compared with the prior fiscal year.The decrease in vehicle unit sales was due mainly to decreased sales in Indonesia and Thailand, which in turnwas attributable mainly to the downturn of the market and intensifying competitive market conditions.
Other
Thousands of units
Year ended March 31, 2016 v. 2015 Change
2015 2016 Amount Percentage
Toyota’s consolidated vehicle unit sales . . . . . . . . . . . . . . . . . . . 1,755 1,594 (161) (9.2)%
Yen in millions
Year ended March 31, 2016 v. 2015 Change
2015 2016 Amount Percentage
Net revenues:Sales of products . . . . . . . . . . . . . . . . . . . . . . . . . . . . . . . . . 2,255,122 2,023,206 (231,917) (10.3)%Financial services . . . . . . . . . . . . . . . . . . . . . . . . . . . . . . . . 194,115 187,008 (7,107) (3.7)
Total . . . . . . . . . . . . . . . . . . . . . . . . . . . . . . . . . . . . . . 2,449,238 2,210,214 (239,024) (9.8)%
63
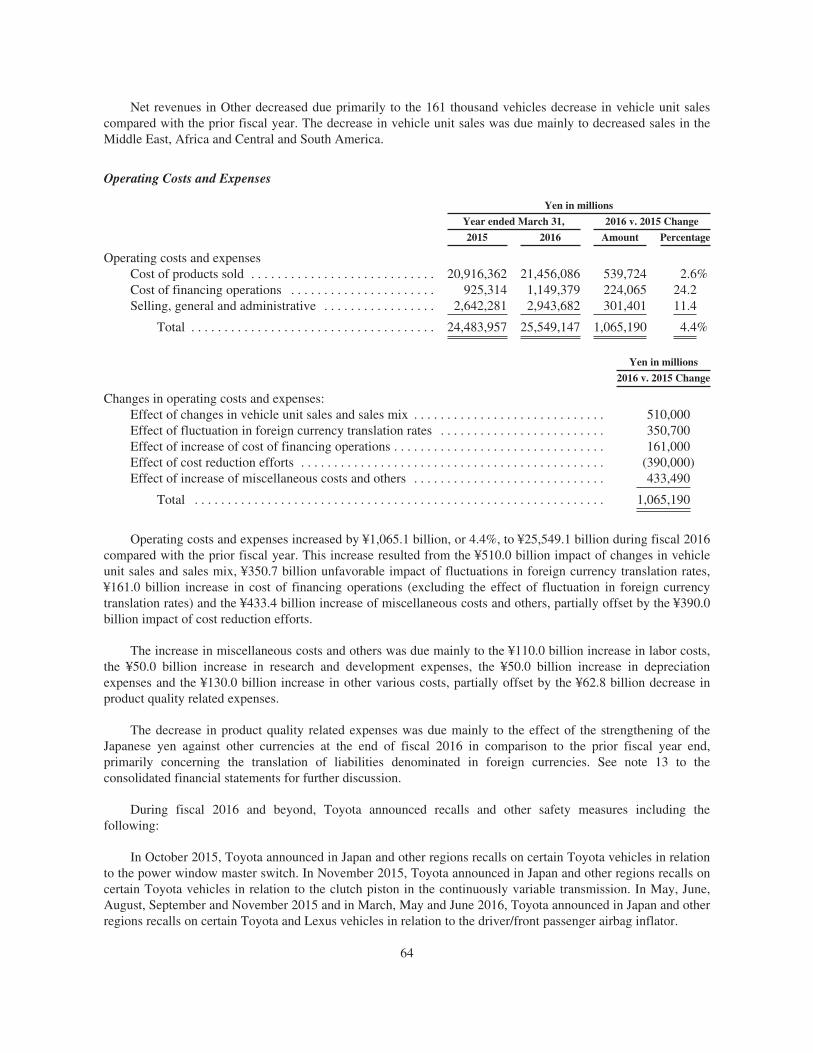
Net revenues in Other decreased due primarily to the 161 thousand vehicles decrease in vehicle unit salescompared with the prior fiscal year. The decrease in vehicle unit sales was due mainly to decreased sales in theMiddle East, Africa and Central and South America.
Operating Costs and Expenses
Yen in millions
Year ended March 31, 2016 v. 2015 Change
2015 2016 Amount Percentage
Operating costs and expensesCost of products sold . . . . . . . . . . . . . . . . . . . . . . . . . . . . 20,916,362 21,456,086 539,724 2.6%Cost of financing operations . . . . . . . . . . . . . . . . . . . . . . 925,314 1,149,379 224,065 24.2Selling, general and administrative . . . . . . . . . . . . . . . . . 2,642,281 2,943,682 301,401 11.4
Total . . . . . . . . . . . . . . . . . . . . . . . . . . . . . . . . . . . . . 24,483,957 25,549,147 1,065,190 4.4%
Yen in millions
2016 v. 2015 Change
Changes in operating costs and expenses:Effect of changes in vehicle unit sales and sales mix . . . . . . . . . . . . . . . . . . . . . . . . . . . . . 510,000Effect of fluctuation in foreign currency translation rates . . . . . . . . . . . . . . . . . . . . . . . . . 350,700Effect of increase of cost of financing operations . . . . . . . . . . . . . . . . . . . . . . . . . . . . . . . . 161,000Effect of cost reduction efforts . . . . . . . . . . . . . . . . . . . . . . . . . . . . . . . . . . . . . . . . . . . . . . (390,000)Effect of increase of miscellaneous costs and others . . . . . . . . . . . . . . . . . . . . . . . . . . . . . 433,490
Total . . . . . . . . . . . . . . . . . . . . . . . . . . . . . . . . . . . . . . . . . . . . . . . . . . . . . . . . . . . . . . 1,065,190
Operating costs and expenses increased by ¥1,065.1 billion, or 4.4%, to ¥25,549.1 billion during fiscal 2016compared with the prior fiscal year. This increase resulted from the ¥510.0 billion impact of changes in vehicleunit sales and sales mix, ¥350.7 billion unfavorable impact of fluctuations in foreign currency translation rates,¥161.0 billion increase in cost of financing operations (excluding the effect of fluctuation in foreign currencytranslation rates) and the ¥433.4 billion increase of miscellaneous costs and others, partially offset by the ¥390.0billion impact of cost reduction efforts.
The increase in miscellaneous costs and others was due mainly to the ¥110.0 billion increase in labor costs,the ¥50.0 billion increase in research and development expenses, the ¥50.0 billion increase in depreciationexpenses and the ¥130.0 billion increase in other various costs, partially offset by the ¥62.8 billion decrease inproduct quality related expenses.
The decrease in product quality related expenses was due mainly to the effect of the strengthening of theJapanese yen against other currencies at the end of fiscal 2016 in comparison to the prior fiscal year end,primarily concerning the translation of liabilities denominated in foreign currencies. See note 13 to theconsolidated financial statements for further discussion.
During fiscal 2016 and beyond, Toyota announced recalls and other safety measures including thefollowing:
In October 2015, Toyota announced in Japan and other regions recalls on certain Toyota vehicles in relationto the power window master switch. In November 2015, Toyota announced in Japan and other regions recalls oncertain Toyota vehicles in relation to the clutch piston in the continuously variable transmission. In May, June,August, September and November 2015 and in March, May and June 2016, Toyota announced in Japan and otherregions recalls on certain Toyota and Lexus vehicles in relation to the driver/front passenger airbag inflator.
64
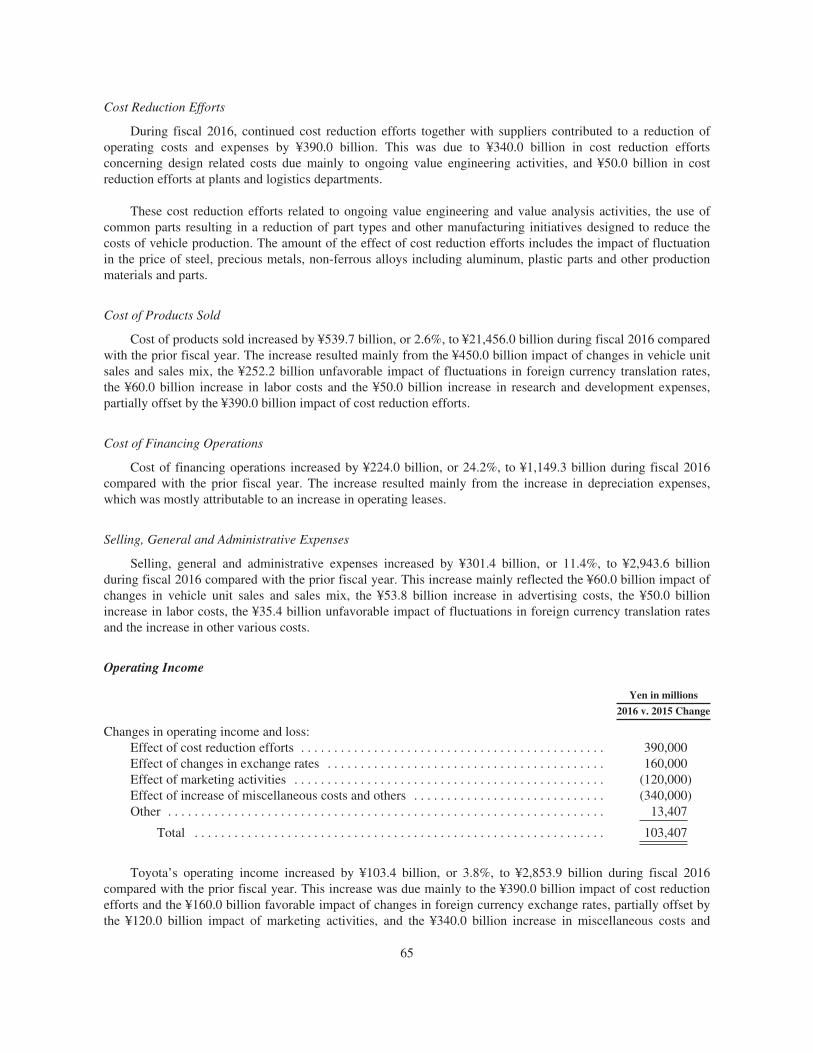
Cost Reduction Efforts
During fiscal 2016, continued cost reduction efforts together with suppliers contributed to a reduction ofoperating costs and expenses by ¥390.0 billion. This was due to ¥340.0 billion in cost reduction effortsconcerning design related costs due mainly to ongoing value engineering activities, and ¥50.0 billion in costreduction efforts at plants and logistics departments.
These cost reduction efforts related to ongoing value engineering and value analysis activities, the use ofcommon parts resulting in a reduction of part types and other manufacturing initiatives designed to reduce thecosts of vehicle production. The amount of the effect of cost reduction efforts includes the impact of fluctuationin the price of steel, precious metals, non-ferrous alloys including aluminum, plastic parts and other productionmaterials and parts.
Cost of Products Sold
Cost of products sold increased by ¥539.7 billion, or 2.6%, to ¥21,456.0 billion during fiscal 2016 comparedwith the prior fiscal year. The increase resulted mainly from the ¥450.0 billion impact of changes in vehicle unitsales and sales mix, the ¥252.2 billion unfavorable impact of fluctuations in foreign currency translation rates,the ¥60.0 billion increase in labor costs and the ¥50.0 billion increase in research and development expenses,partially offset by the ¥390.0 billion impact of cost reduction efforts.
Cost of Financing Operations
Cost of financing operations increased by ¥224.0 billion, or 24.2%, to ¥1,149.3 billion during fiscal 2016compared with the prior fiscal year. The increase resulted mainly from the increase in depreciation expenses,which was mostly attributable to an increase in operating leases.
Selling, General and Administrative Expenses
Selling, general and administrative expenses increased by ¥301.4 billion, or 11.4%, to ¥2,943.6 billionduring fiscal 2016 compared with the prior fiscal year. This increase mainly reflected the ¥60.0 billion impact ofchanges in vehicle unit sales and sales mix, the ¥53.8 billion increase in advertising costs, the ¥50.0 billionincrease in labor costs, the ¥35.4 billion unfavorable impact of fluctuations in foreign currency translation ratesand the increase in other various costs.
Operating Income
Yen in millions
2016 v. 2015 Change
Changes in operating income and loss:Effect of cost reduction efforts . . . . . . . . . . . . . . . . . . . . . . . . . . . . . . . . . . . . . . . . . . . . . . 390,000Effect of changes in exchange rates . . . . . . . . . . . . . . . . . . . . . . . . . . . . . . . . . . . . . . . . . . 160,000Effect of marketing activities . . . . . . . . . . . . . . . . . . . . . . . . . . . . . . . . . . . . . . . . . . . . . . . (120,000)Effect of increase of miscellaneous costs and others . . . . . . . . . . . . . . . . . . . . . . . . . . . . . (340,000)Other . . . . . . . . . . . . . . . . . . . . . . . . . . . . . . . . . . . . . . . . . . . . . . . . . . . . . . . . . . . . . . . . . . 13,407
Total . . . . . . . . . . . . . . . . . . . . . . . . . . . . . . . . . . . . . . . . . . . . . . . . . . . . . . . . . . . . . . 103,407
Toyota’s operating income increased by ¥103.4 billion, or 3.8%, to ¥2,853.9 billion during fiscal 2016compared with the prior fiscal year. This increase was due mainly to the ¥390.0 billion impact of cost reductionefforts and the ¥160.0 billion favorable impact of changes in foreign currency exchange rates, partially offset bythe ¥120.0 billion impact of marketing activities, and the ¥340.0 billion increase in miscellaneous costs and
65
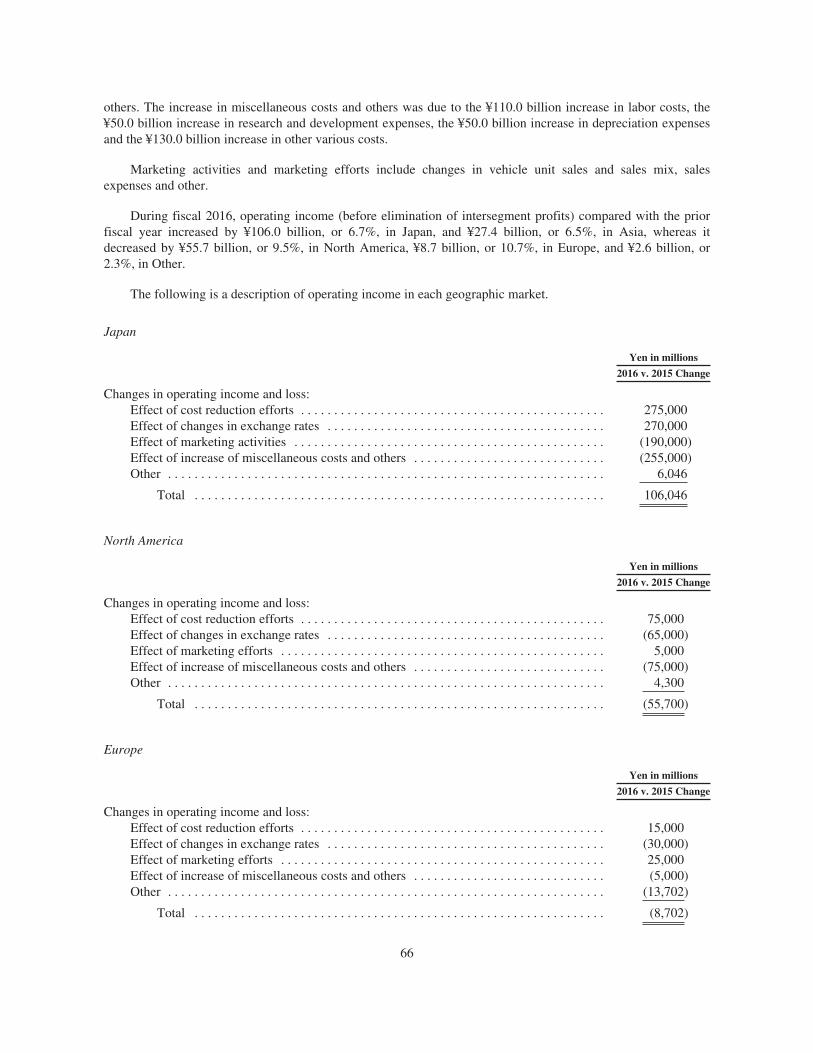
others. The increase in miscellaneous costs and others was due to the ¥110.0 billion increase in labor costs, the¥50.0 billion increase in research and development expenses, the ¥50.0 billion increase in depreciation expensesand the ¥130.0 billion increase in other various costs.
Marketing activities and marketing efforts include changes in vehicle unit sales and sales mix, salesexpenses and other.
During fiscal 2016, operating income (before elimination of intersegment profits) compared with the priorfiscal year increased by ¥106.0 billion, or 6.7%, in Japan, and ¥27.4 billion, or 6.5%, in Asia, whereas itdecreased by ¥55.7 billion, or 9.5%, in North America, ¥8.7 billion, or 10.7%, in Europe, and ¥2.6 billion, or2.3%, in Other.
The following is a description of operating income in each geographic market.
Japan
Yen in millions
2016 v. 2015 Change
Changes in operating income and loss:Effect of cost reduction efforts . . . . . . . . . . . . . . . . . . . . . . . . . . . . . . . . . . . . . . . . . . . . . . 275,000Effect of changes in exchange rates . . . . . . . . . . . . . . . . . . . . . . . . . . . . . . . . . . . . . . . . . . 270,000Effect of marketing activities . . . . . . . . . . . . . . . . . . . . . . . . . . . . . . . . . . . . . . . . . . . . . . . (190,000)Effect of increase of miscellaneous costs and others . . . . . . . . . . . . . . . . . . . . . . . . . . . . . (255,000)Other . . . . . . . . . . . . . . . . . . . . . . . . . . . . . . . . . . . . . . . . . . . . . . . . . . . . . . . . . . . . . . . . . . 6,046
Total . . . . . . . . . . . . . . . . . . . . . . . . . . . . . . . . . . . . . . . . . . . . . . . . . . . . . . . . . . . . . . 106,046
North America
Yen in millions
2016 v. 2015 Change
Changes in operating income and loss:Effect of cost reduction efforts . . . . . . . . . . . . . . . . . . . . . . . . . . . . . . . . . . . . . . . . . . . . . . 75,000Effect of changes in exchange rates . . . . . . . . . . . . . . . . . . . . . . . . . . . . . . . . . . . . . . . . . . (65,000)Effect of marketing efforts . . . . . . . . . . . . . . . . . . . . . . . . . . . . . . . . . . . . . . . . . . . . . . . . . 5,000Effect of increase of miscellaneous costs and others . . . . . . . . . . . . . . . . . . . . . . . . . . . . . (75,000)Other . . . . . . . . . . . . . . . . . . . . . . . . . . . . . . . . . . . . . . . . . . . . . . . . . . . . . . . . . . . . . . . . . . 4,300
Total . . . . . . . . . . . . . . . . . . . . . . . . . . . . . . . . . . . . . . . . . . . . . . . . . . . . . . . . . . . . . . (55,700)
Europe
Yen in millions
2016 v. 2015 Change
Changes in operating income and loss:Effect of cost reduction efforts . . . . . . . . . . . . . . . . . . . . . . . . . . . . . . . . . . . . . . . . . . . . . . 15,000Effect of changes in exchange rates . . . . . . . . . . . . . . . . . . . . . . . . . . . . . . . . . . . . . . . . . . (30,000)Effect of marketing efforts . . . . . . . . . . . . . . . . . . . . . . . . . . . . . . . . . . . . . . . . . . . . . . . . . 25,000Effect of increase of miscellaneous costs and others . . . . . . . . . . . . . . . . . . . . . . . . . . . . . (5,000)Other . . . . . . . . . . . . . . . . . . . . . . . . . . . . . . . . . . . . . . . . . . . . . . . . . . . . . . . . . . . . . . . . . . (13,702)
Total . . . . . . . . . . . . . . . . . . . . . . . . . . . . . . . . . . . . . . . . . . . . . . . . . . . . . . . . . . . . . . (8,702)
66
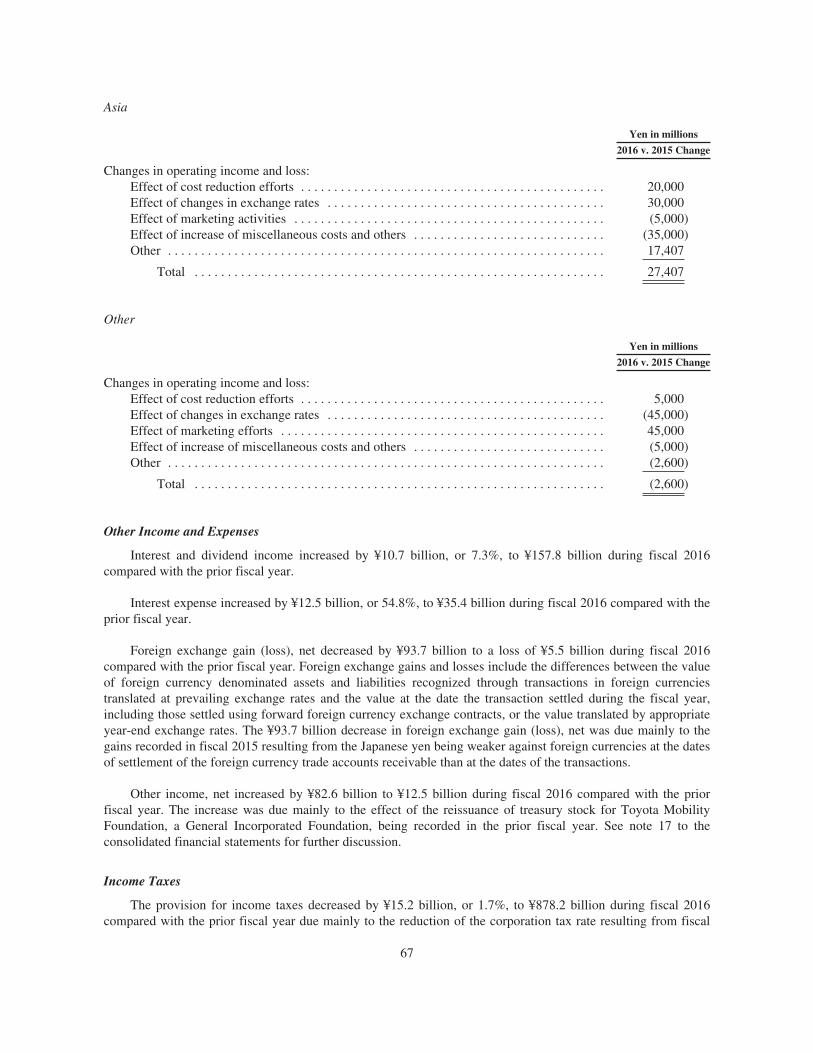
Asia
Yen in millions
2016 v. 2015 Change
Changes in operating income and loss:Effect of cost reduction efforts . . . . . . . . . . . . . . . . . . . . . . . . . . . . . . . . . . . . . . . . . . . . . . 20,000Effect of changes in exchange rates . . . . . . . . . . . . . . . . . . . . . . . . . . . . . . . . . . . . . . . . . . 30,000Effect of marketing activities . . . . . . . . . . . . . . . . . . . . . . . . . . . . . . . . . . . . . . . . . . . . . . . (5,000)Effect of increase of miscellaneous costs and others . . . . . . . . . . . . . . . . . . . . . . . . . . . . . (35,000)Other . . . . . . . . . . . . . . . . . . . . . . . . . . . . . . . . . . . . . . . . . . . . . . . . . . . . . . . . . . . . . . . . . . 17,407
Total . . . . . . . . . . . . . . . . . . . . . . . . . . . . . . . . . . . . . . . . . . . . . . . . . . . . . . . . . . . . . . 27,407
Other
Yen in millions
2016 v. 2015 Change
Changes in operating income and loss:Effect of cost reduction efforts . . . . . . . . . . . . . . . . . . . . . . . . . . . . . . . . . . . . . . . . . . . . . . 5,000Effect of changes in exchange rates . . . . . . . . . . . . . . . . . . . . . . . . . . . . . . . . . . . . . . . . . . (45,000)Effect of marketing efforts . . . . . . . . . . . . . . . . . . . . . . . . . . . . . . . . . . . . . . . . . . . . . . . . . 45,000Effect of increase of miscellaneous costs and others . . . . . . . . . . . . . . . . . . . . . . . . . . . . . (5,000)Other . . . . . . . . . . . . . . . . . . . . . . . . . . . . . . . . . . . . . . . . . . . . . . . . . . . . . . . . . . . . . . . . . . (2,600)
Total . . . . . . . . . . . . . . . . . . . . . . . . . . . . . . . . . . . . . . . . . . . . . . . . . . . . . . . . . . . . . . (2,600)
Other Income and Expenses
Interest and dividend income increased by ¥10.7 billion, or 7.3%, to ¥157.8 billion during fiscal 2016compared with the prior fiscal year.
Interest expense increased by ¥12.5 billion, or 54.8%, to ¥35.4 billion during fiscal 2016 compared with theprior fiscal year.
Foreign exchange gain (loss), net decreased by ¥93.7 billion to a loss of ¥5.5 billion during fiscal 2016compared with the prior fiscal year. Foreign exchange gains and losses include the differences between the valueof foreign currency denominated assets and liabilities recognized through transactions in foreign currenciestranslated at prevailing exchange rates and the value at the date the transaction settled during the fiscal year,including those settled using forward foreign currency exchange contracts, or the value translated by appropriateyear-end exchange rates. The ¥93.7 billion decrease in foreign exchange gain (loss), net was due mainly to thegains recorded in fiscal 2015 resulting from the Japanese yen being weaker against foreign currencies at the datesof settlement of the foreign currency trade accounts receivable than at the dates of the transactions.
Other income, net increased by ¥82.6 billion to ¥12.5 billion during fiscal 2016 compared with the priorfiscal year. The increase was due mainly to the effect of the reissuance of treasury stock for Toyota MobilityFoundation, a General Incorporated Foundation, being recorded in the prior fiscal year. See note 17 to theconsolidated financial statements for further discussion.
Income Taxes
The provision for income taxes decreased by ¥15.2 billion, or 1.7%, to ¥878.2 billion during fiscal 2016compared with the prior fiscal year due mainly to the reduction of the corporation tax rate resulting from fiscal
67
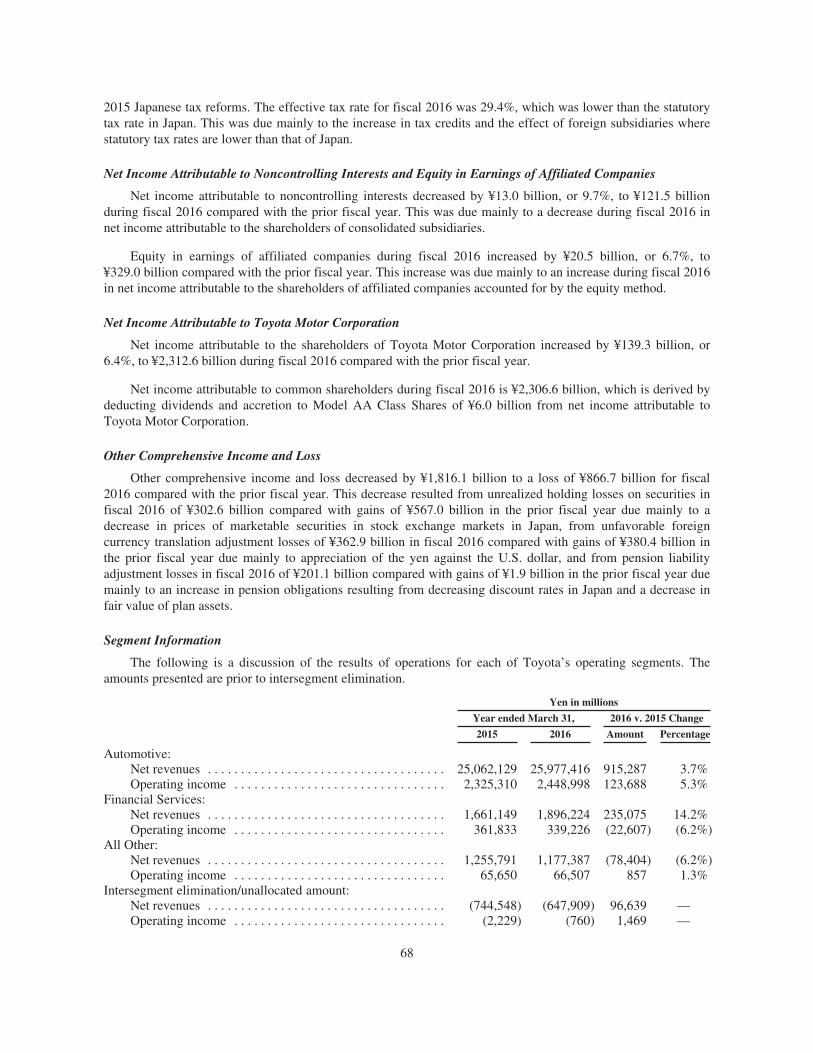
2015 Japanese tax reforms. The effective tax rate for fiscal 2016 was 29.4%, which was lower than the statutorytax rate in Japan. This was due mainly to the increase in tax credits and the effect of foreign subsidiaries wherestatutory tax rates are lower than that of Japan.
Net Income Attributable to Noncontrolling Interests and Equity in Earnings of Affiliated Companies
Net income attributable to noncontrolling interests decreased by ¥13.0 billion, or 9.7%, to ¥121.5 billionduring fiscal 2016 compared with the prior fiscal year. This was due mainly to a decrease during fiscal 2016 innet income attributable to the shareholders of consolidated subsidiaries.
Equity in earnings of affiliated companies during fiscal 2016 increased by ¥20.5 billion, or 6.7%, to¥329.0 billion compared with the prior fiscal year. This increase was due mainly to an increase during fiscal 2016in net income attributable to the shareholders of affiliated companies accounted for by the equity method.
Net Income Attributable to Toyota Motor Corporation
Net income attributable to the shareholders of Toyota Motor Corporation increased by ¥139.3 billion, or6.4%, to ¥2,312.6 billion during fiscal 2016 compared with the prior fiscal year.
Net income attributable to common shareholders during fiscal 2016 is ¥2,306.6 billion, which is derived bydeducting dividends and accretion to Model AA Class Shares of ¥6.0 billion from net income attributable toToyota Motor Corporation.
Other Comprehensive Income and Loss
Other comprehensive income and loss decreased by ¥1,816.1 billion to a loss of ¥866.7 billion for fiscal2016 compared with the prior fiscal year. This decrease resulted from unrealized holding losses on securities infiscal 2016 of ¥302.6 billion compared with gains of ¥567.0 billion in the prior fiscal year due mainly to adecrease in prices of marketable securities in stock exchange markets in Japan, from unfavorable foreigncurrency translation adjustment losses of ¥362.9 billion in fiscal 2016 compared with gains of ¥380.4 billion inthe prior fiscal year due mainly to appreciation of the yen against the U.S. dollar, and from pension liabilityadjustment losses in fiscal 2016 of ¥201.1 billion compared with gains of ¥1.9 billion in the prior fiscal year duemainly to an increase in pension obligations resulting from decreasing discount rates in Japan and a decrease infair value of plan assets.
Segment Information
The following is a discussion of the results of operations for each of Toyota’s operating segments. Theamounts presented are prior to intersegment elimination.
Yen in millions
Year ended March 31, 2016 v. 2015 Change
2015 2016 Amount Percentage
Automotive:Net revenues . . . . . . . . . . . . . . . . . . . . . . . . . . . . . . . . . . . . 25,062,129 25,977,416 915,287 3.7%Operating income . . . . . . . . . . . . . . . . . . . . . . . . . . . . . . . . 2,325,310 2,448,998 123,688 5.3%
Financial Services:Net revenues . . . . . . . . . . . . . . . . . . . . . . . . . . . . . . . . . . . . 1,661,149 1,896,224 235,075 14.2%Operating income . . . . . . . . . . . . . . . . . . . . . . . . . . . . . . . . 361,833 339,226 (22,607) (6.2%)
All Other:Net revenues . . . . . . . . . . . . . . . . . . . . . . . . . . . . . . . . . . . . 1,255,791 1,177,387 (78,404) (6.2%)Operating income . . . . . . . . . . . . . . . . . . . . . . . . . . . . . . . . 65,650 66,507 857 1.3%
Intersegment elimination/unallocated amount:Net revenues . . . . . . . . . . . . . . . . . . . . . . . . . . . . . . . . . . . . (744,548) (647,909) 96,639 —Operating income . . . . . . . . . . . . . . . . . . . . . . . . . . . . . . . . (2,229) (760) 1,469 —
68
Automotive Operations Segment
The automotive operations segment is Toyota’s largest operating segment by net revenues. Net revenues forthe automotive segment increased during fiscal 2016 by ¥915.2 billion, or 3.7%, to ¥25,977.4 billion comparedwith the prior fiscal year. The increase mainly reflects the ¥330.0 billion favorable impact of changes in vehicleunit sales and sales mix and the ¥307.5 billion favorable impact of fluctuations in foreign currency translationrates.
Operating income from the automotive operations increased by ¥123.6 billion, or 5.3%, to ¥2,448.9 billionduring fiscal 2016 compared with the prior fiscal year. This increase in operating income was due mainly to the¥390.0 billion impact of cost reduction efforts and the ¥160.0 billion favorable impact of changes in foreigncurrency exchange rates, partially offset by the ¥110.0 billion impact of marketing activities and the¥340.0 billion increase in miscellaneous costs and others.
The impact of marketing activities was due primarily to the decrease in Toyota’s vehicle unit sales by291 thousand vehicles compared with the prior fiscal year. The vehicle unit sales decreased due mainly to theslowdown of the mini-vehicles market in Japan, the heating up of the competitive climate, as well as the marketdownturn, in Asia, the fall in demand resulting from the low price of crude oil and currency weakness in theMiddle East, Africa, and Central and South America despite the increase in sales in the steady North Americanmarket. The increase in miscellaneous costs and others was due mainly to the ¥110.0 billion increase in laborcosts, the ¥50.0 billion increase in research and development expenses, the ¥50.0 billion increase in depreciationexpenses and the ¥110.0 billion increase in other various costs.
Financial Services Operations Segment
Net revenues for the financial services operations increased during fiscal 2016 by ¥235.0 billion, or 14.2%,to ¥1,896.2 billion compared with the prior fiscal year. This increase was primarily due to the ¥74.8 billionfavorable impact of fluctuations in foreign currency translation rates.
Operating income from financial services operations decreased by ¥22.6 billion, or 6.2%, to ¥339.2 billionduring fiscal 2016 compared with the prior fiscal year. This decrease was due primarily to a ¥19.7 billionworsening overall of valuation gains or losses on interest rate swaps stated at fair value, mainly in NorthAmerica.
All Other Operations Segment
Net revenues for Toyota’s other operations segments decreased by ¥78.4 billion, or 6.2%, to ¥1,177.3 billionduring fiscal 2016 compared with the prior fiscal year.
Operating income from Toyota’s other operations segments increased by ¥0.8 billion, or 1.3%, to¥66.5 billion during fiscal 2016 compared with the prior fiscal year.
69
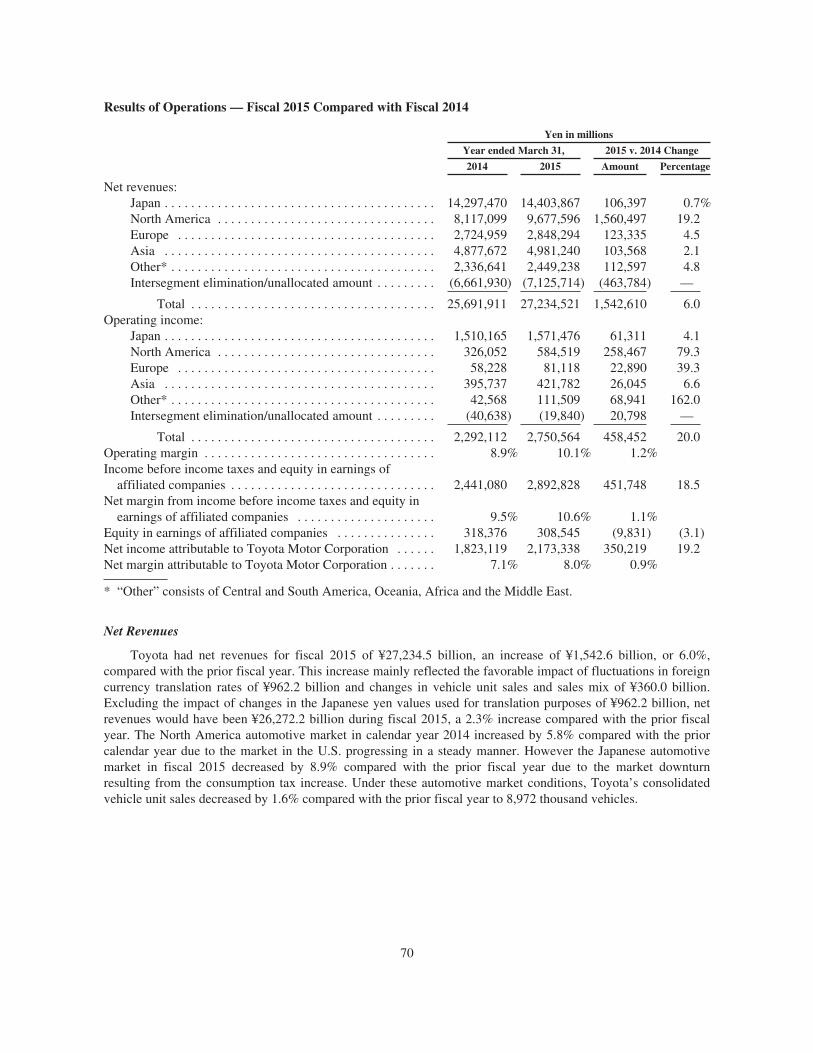
Results of Operations — Fiscal 2015 Compared with Fiscal 2014
Yen in millions
Year ended March 31, 2015 v. 2014 Change
2014 2015 Amount Percentage
Net revenues:Japan . . . . . . . . . . . . . . . . . . . . . . . . . . . . . . . . . . . . . . . . . 14,297,470 14,403,867 106,397 0.7%North America . . . . . . . . . . . . . . . . . . . . . . . . . . . . . . . . . 8,117,099 9,677,596 1,560,497 19.2Europe . . . . . . . . . . . . . . . . . . . . . . . . . . . . . . . . . . . . . . . 2,724,959 2,848,294 123,335 4.5Asia . . . . . . . . . . . . . . . . . . . . . . . . . . . . . . . . . . . . . . . . . 4,877,672 4,981,240 103,568 2.1Other* . . . . . . . . . . . . . . . . . . . . . . . . . . . . . . . . . . . . . . . . 2,336,641 2,449,238 112,597 4.8Intersegment elimination/unallocated amount . . . . . . . . . (6,661,930) (7,125,714) (463,784) —
Total . . . . . . . . . . . . . . . . . . . . . . . . . . . . . . . . . . . . . 25,691,911 27,234,521 1,542,610 6.0Operating income:
Japan . . . . . . . . . . . . . . . . . . . . . . . . . . . . . . . . . . . . . . . . . 1,510,165 1,571,476 61,311 4.1North America . . . . . . . . . . . . . . . . . . . . . . . . . . . . . . . . . 326,052 584,519 258,467 79.3Europe . . . . . . . . . . . . . . . . . . . . . . . . . . . . . . . . . . . . . . . 58,228 81,118 22,890 39.3Asia . . . . . . . . . . . . . . . . . . . . . . . . . . . . . . . . . . . . . . . . . 395,737 421,782 26,045 6.6Other* . . . . . . . . . . . . . . . . . . . . . . . . . . . . . . . . . . . . . . . . 42,568 111,509 68,941 162.0Intersegment elimination/unallocated amount . . . . . . . . . (40,638) (19,840) 20,798 —
Total . . . . . . . . . . . . . . . . . . . . . . . . . . . . . . . . . . . . . 2,292,112 2,750,564 458,452 20.0Operating margin . . . . . . . . . . . . . . . . . . . . . . . . . . . . . . . . . . . 8.9% 10.1% 1.2%Income before income taxes and equity in earnings of
affiliated companies . . . . . . . . . . . . . . . . . . . . . . . . . . . . . . . 2,441,080 2,892,828 451,748 18.5Net margin from income before income taxes and equity in
earnings of affiliated companies . . . . . . . . . . . . . . . . . . . . . 9.5% 10.6% 1.1%Equity in earnings of affiliated companies . . . . . . . . . . . . . . . 318,376 308,545 (9,831) (3.1)Net income attributable to Toyota Motor Corporation . . . . . . 1,823,119 2,173,338 350,219 19.2Net margin attributable to Toyota Motor Corporation . . . . . . . 7.1% 8.0% 0.9%
* “Other” consists of Central and South America, Oceania, Africa and the Middle East.
Net Revenues
Toyota had net revenues for fiscal 2015 of ¥27,234.5 billion, an increase of ¥1,542.6 billion, or 6.0%,compared with the prior fiscal year. This increase mainly reflected the favorable impact of fluctuations in foreigncurrency translation rates of ¥962.2 billion and changes in vehicle unit sales and sales mix of ¥360.0 billion.Excluding the impact of changes in the Japanese yen values used for translation purposes of ¥962.2 billion, netrevenues would have been ¥26,272.2 billion during fiscal 2015, a 2.3% increase compared with the prior fiscalyear. The North America automotive market in calendar year 2014 increased by 5.8% compared with the priorcalendar year due to the market in the U.S. progressing in a steady manner. However the Japanese automotivemarket in fiscal 2015 decreased by 8.9% compared with the prior fiscal year due to the market downturnresulting from the consumption tax increase. Under these automotive market conditions, Toyota’s consolidatedvehicle unit sales decreased by 1.6% compared with the prior fiscal year to 8,972 thousand vehicles.
70
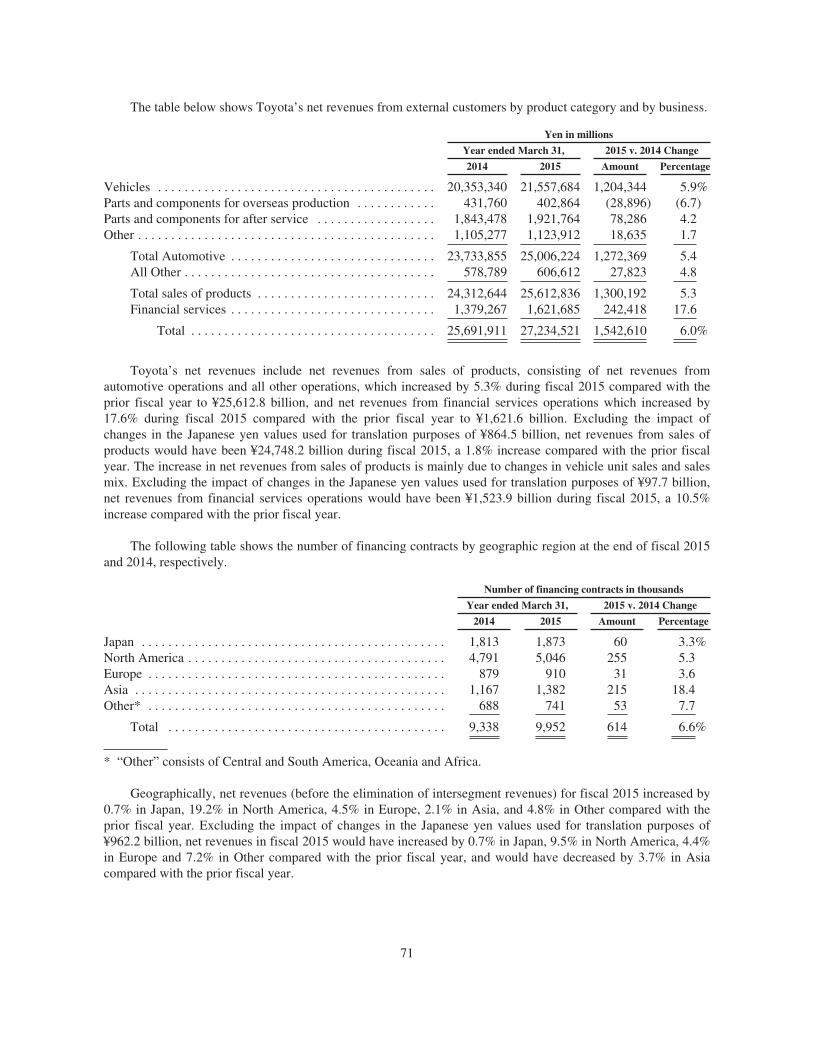
The table below shows Toyota’s net revenues from external customers by product category and by business.
Yen in millions
Year ended March 31, 2015 v. 2014 Change
2014 2015 Amount Percentage
Vehicles . . . . . . . . . . . . . . . . . . . . . . . . . . . . . . . . . . . . . . . . . . 20,353,340 21,557,684 1,204,344 5.9%Parts and components for overseas production . . . . . . . . . . . . 431,760 402,864 (28,896) (6.7)Parts and components for after service . . . . . . . . . . . . . . . . . . 1,843,478 1,921,764 78,286 4.2Other . . . . . . . . . . . . . . . . . . . . . . . . . . . . . . . . . . . . . . . . . . . . . 1,105,277 1,123,912 18,635 1.7
Total Automotive . . . . . . . . . . . . . . . . . . . . . . . . . . . . . . . 23,733,855 25,006,224 1,272,369 5.4All Other . . . . . . . . . . . . . . . . . . . . . . . . . . . . . . . . . . . . . . 578,789 606,612 27,823 4.8
Total sales of products . . . . . . . . . . . . . . . . . . . . . . . . . . . 24,312,644 25,612,836 1,300,192 5.3Financial services . . . . . . . . . . . . . . . . . . . . . . . . . . . . . . . 1,379,267 1,621,685 242,418 17.6
Total . . . . . . . . . . . . . . . . . . . . . . . . . . . . . . . . . . . . . 25,691,911 27,234,521 1,542,610 6.0%
Toyota’s net revenues include net revenues from sales of products, consisting of net revenues fromautomotive operations and all other operations, which increased by 5.3% during fiscal 2015 compared with theprior fiscal year to ¥25,612.8 billion, and net revenues from financial services operations which increased by17.6% during fiscal 2015 compared with the prior fiscal year to ¥1,621.6 billion. Excluding the impact ofchanges in the Japanese yen values used for translation purposes of ¥864.5 billion, net revenues from sales ofproducts would have been ¥24,748.2 billion during fiscal 2015, a 1.8% increase compared with the prior fiscalyear. The increase in net revenues from sales of products is mainly due to changes in vehicle unit sales and salesmix. Excluding the impact of changes in the Japanese yen values used for translation purposes of ¥97.7 billion,net revenues from financial services operations would have been ¥1,523.9 billion during fiscal 2015, a 10.5%increase compared with the prior fiscal year.
The following table shows the number of financing contracts by geographic region at the end of fiscal 2015and 2014, respectively.
Number of financing contracts in thousands
Year ended March 31, 2015 v. 2014 Change
2014 2015 Amount Percentage
Japan . . . . . . . . . . . . . . . . . . . . . . . . . . . . . . . . . . . . . . . . . . . . . . 1,813 1,873 60 3.3%North America . . . . . . . . . . . . . . . . . . . . . . . . . . . . . . . . . . . . . . . 4,791 5,046 255 5.3Europe . . . . . . . . . . . . . . . . . . . . . . . . . . . . . . . . . . . . . . . . . . . . . 879 910 31 3.6Asia . . . . . . . . . . . . . . . . . . . . . . . . . . . . . . . . . . . . . . . . . . . . . . . 1,167 1,382 215 18.4Other* . . . . . . . . . . . . . . . . . . . . . . . . . . . . . . . . . . . . . . . . . . . . . 688 741 53 7.7
Total . . . . . . . . . . . . . . . . . . . . . . . . . . . . . . . . . . . . . . . . . . 9,338 9,952 614 6.6%
* “Other” consists of Central and South America, Oceania and Africa.
Geographically, net revenues (before the elimination of intersegment revenues) for fiscal 2015 increased by0.7% in Japan, 19.2% in North America, 4.5% in Europe, 2.1% in Asia, and 4.8% in Other compared with theprior fiscal year. Excluding the impact of changes in the Japanese yen values used for translation purposes of¥962.2 billion, net revenues in fiscal 2015 would have increased by 0.7% in Japan, 9.5% in North America, 4.4%in Europe and 7.2% in Other compared with the prior fiscal year, and would have decreased by 3.7% in Asiacompared with the prior fiscal year.
71
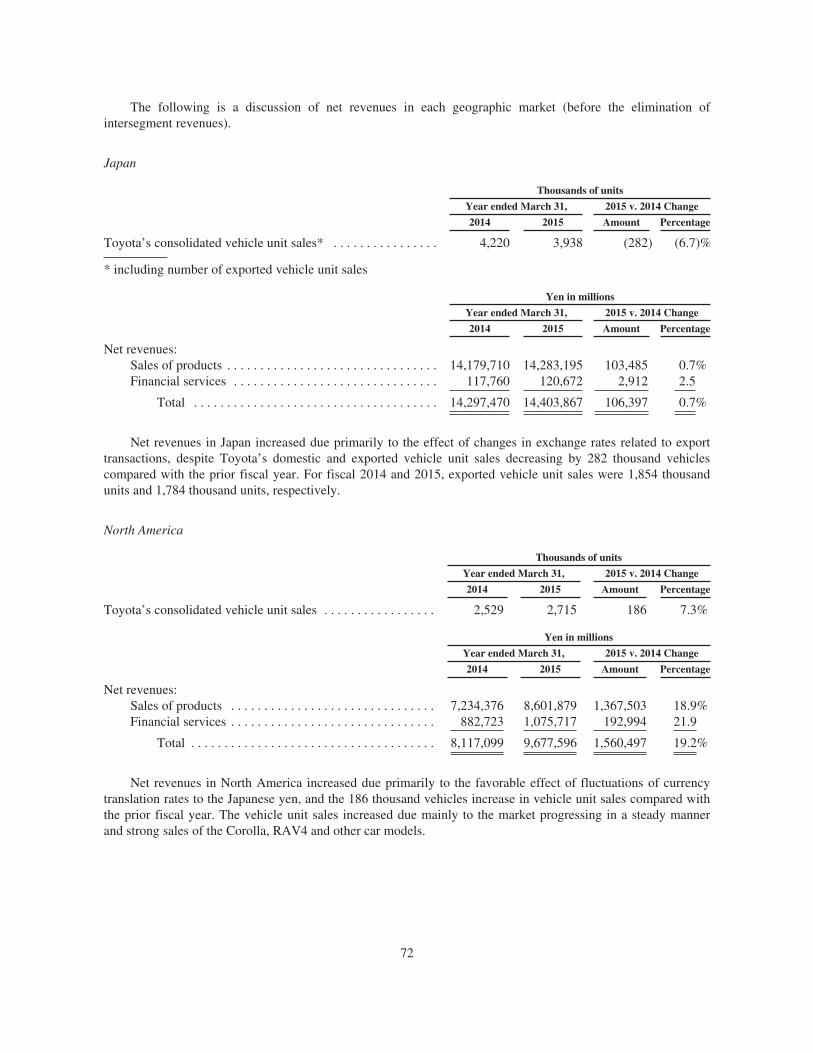
The following is a discussion of net revenues in each geographic market (before the elimination ofintersegment revenues).
Japan
Thousands of units
Year ended March 31, 2015 v. 2014 Change
2014 2015 Amount Percentage
Toyota’s consolidated vehicle unit sales* . . . . . . . . . . . . . . . . 4,220 3,938 (282) (6.7)%
* including number of exported vehicle unit sales
Yen in millions
Year ended March 31, 2015 v. 2014 Change
2014 2015 Amount Percentage
Net revenues:Sales of products . . . . . . . . . . . . . . . . . . . . . . . . . . . . . . . . 14,179,710 14,283,195 103,485 0.7%Financial services . . . . . . . . . . . . . . . . . . . . . . . . . . . . . . . 117,760 120,672 2,912 2.5
Total . . . . . . . . . . . . . . . . . . . . . . . . . . . . . . . . . . . . . 14,297,470 14,403,867 106,397 0.7%
Net revenues in Japan increased due primarily to the effect of changes in exchange rates related to exporttransactions, despite Toyota’s domestic and exported vehicle unit sales decreasing by 282 thousand vehiclescompared with the prior fiscal year. For fiscal 2014 and 2015, exported vehicle unit sales were 1,854 thousandunits and 1,784 thousand units, respectively.
North America
Thousands of units
Year ended March 31, 2015 v. 2014 Change
2014 2015 Amount Percentage
Toyota’s consolidated vehicle unit sales . . . . . . . . . . . . . . . . . 2,529 2,715 186 7.3%
Yen in millions
Year ended March 31, 2015 v. 2014 Change
2014 2015 Amount Percentage
Net revenues:Sales of products . . . . . . . . . . . . . . . . . . . . . . . . . . . . . . . 7,234,376 8,601,879 1,367,503 18.9%Financial services . . . . . . . . . . . . . . . . . . . . . . . . . . . . . . . 882,723 1,075,717 192,994 21.9
Total . . . . . . . . . . . . . . . . . . . . . . . . . . . . . . . . . . . . . 8,117,099 9,677,596 1,560,497 19.2%
Net revenues in North America increased due primarily to the favorable effect of fluctuations of currencytranslation rates to the Japanese yen, and the 186 thousand vehicles increase in vehicle unit sales compared withthe prior fiscal year. The vehicle unit sales increased due mainly to the market progressing in a steady mannerand strong sales of the Corolla, RAV4 and other car models.
72
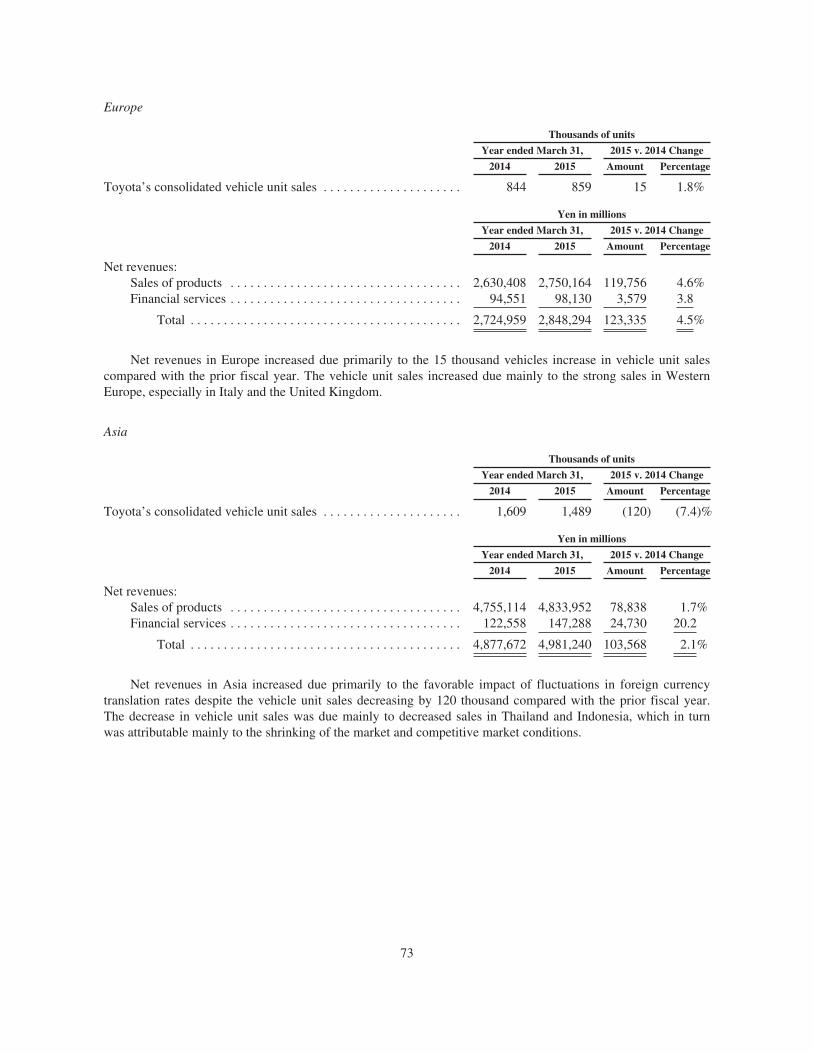
Europe
Thousands of units
Year ended March 31, 2015 v. 2014 Change
2014 2015 Amount Percentage
Toyota’s consolidated vehicle unit sales . . . . . . . . . . . . . . . . . . . . . 844 859 15 1.8%
Yen in millions
Year ended March 31, 2015 v. 2014 Change
2014 2015 Amount Percentage
Net revenues:Sales of products . . . . . . . . . . . . . . . . . . . . . . . . . . . . . . . . . . . 2,630,408 2,750,164 119,756 4.6%Financial services . . . . . . . . . . . . . . . . . . . . . . . . . . . . . . . . . . . 94,551 98,130 3,579 3.8
Total . . . . . . . . . . . . . . . . . . . . . . . . . . . . . . . . . . . . . . . . . 2,724,959 2,848,294 123,335 4.5%
Net revenues in Europe increased due primarily to the 15 thousand vehicles increase in vehicle unit salescompared with the prior fiscal year. The vehicle unit sales increased due mainly to the strong sales in WesternEurope, especially in Italy and the United Kingdom.
Asia
Thousands of units
Year ended March 31, 2015 v. 2014 Change
2014 2015 Amount Percentage
Toyota’s consolidated vehicle unit sales . . . . . . . . . . . . . . . . . . . . . 1,609 1,489 (120) (7.4)%
Yen in millions
Year ended March 31, 2015 v. 2014 Change
2014 2015 Amount Percentage
Net revenues:Sales of products . . . . . . . . . . . . . . . . . . . . . . . . . . . . . . . . . . . 4,755,114 4,833,952 78,838 1.7%Financial services . . . . . . . . . . . . . . . . . . . . . . . . . . . . . . . . . . . 122,558 147,288 24,730 20.2
Total . . . . . . . . . . . . . . . . . . . . . . . . . . . . . . . . . . . . . . . . . 4,877,672 4,981,240 103,568 2.1%
Net revenues in Asia increased due primarily to the favorable impact of fluctuations in foreign currencytranslation rates despite the vehicle unit sales decreasing by 120 thousand compared with the prior fiscal year.The decrease in vehicle unit sales was due mainly to decreased sales in Thailand and Indonesia, which in turnwas attributable mainly to the shrinking of the market and competitive market conditions.
73
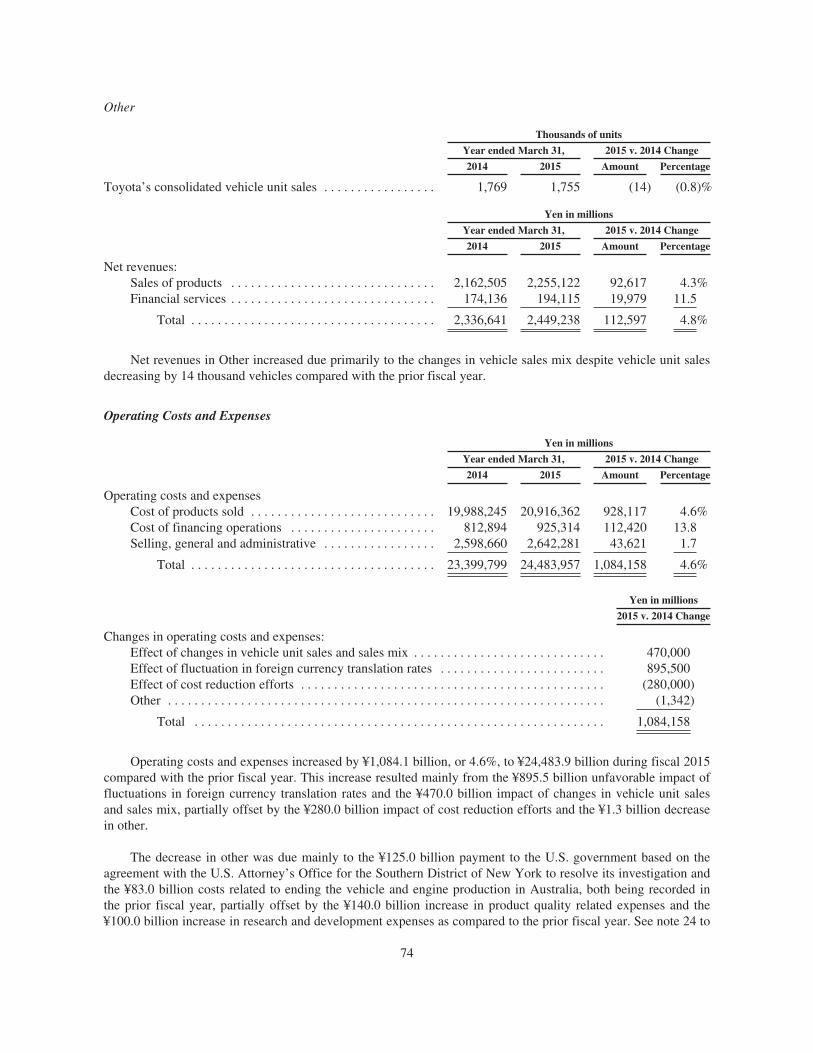
Other
Thousands of units
Year ended March 31, 2015 v. 2014 Change
2014 2015 Amount Percentage
Toyota’s consolidated vehicle unit sales . . . . . . . . . . . . . . . . . 1,769 1,755 (14) (0.8)%
Yen in millions
Year ended March 31, 2015 v. 2014 Change
2014 2015 Amount Percentage
Net revenues:Sales of products . . . . . . . . . . . . . . . . . . . . . . . . . . . . . . . 2,162,505 2,255,122 92,617 4.3%Financial services . . . . . . . . . . . . . . . . . . . . . . . . . . . . . . . 174,136 194,115 19,979 11.5
Total . . . . . . . . . . . . . . . . . . . . . . . . . . . . . . . . . . . . . 2,336,641 2,449,238 112,597 4.8%
Net revenues in Other increased due primarily to the changes in vehicle sales mix despite vehicle unit salesdecreasing by 14 thousand vehicles compared with the prior fiscal year.
Operating Costs and Expenses
Yen in millions
Year ended March 31, 2015 v. 2014 Change
2014 2015 Amount Percentage
Operating costs and expensesCost of products sold . . . . . . . . . . . . . . . . . . . . . . . . . . . . 19,988,245 20,916,362 928,117 4.6%Cost of financing operations . . . . . . . . . . . . . . . . . . . . . . 812,894 925,314 112,420 13.8Selling, general and administrative . . . . . . . . . . . . . . . . . 2,598,660 2,642,281 43,621 1.7
Total . . . . . . . . . . . . . . . . . . . . . . . . . . . . . . . . . . . . . 23,399,799 24,483,957 1,084,158 4.6%
Yen in millions
2015 v. 2014 Change
Changes in operating costs and expenses:Effect of changes in vehicle unit sales and sales mix . . . . . . . . . . . . . . . . . . . . . . . . . . . . . 470,000Effect of fluctuation in foreign currency translation rates . . . . . . . . . . . . . . . . . . . . . . . . . 895,500Effect of cost reduction efforts . . . . . . . . . . . . . . . . . . . . . . . . . . . . . . . . . . . . . . . . . . . . . . (280,000)Other . . . . . . . . . . . . . . . . . . . . . . . . . . . . . . . . . . . . . . . . . . . . . . . . . . . . . . . . . . . . . . . . . . (1,342)
Total . . . . . . . . . . . . . . . . . . . . . . . . . . . . . . . . . . . . . . . . . . . . . . . . . . . . . . . . . . . . . . 1,084,158
Operating costs and expenses increased by ¥1,084.1 billion, or 4.6%, to ¥24,483.9 billion during fiscal 2015compared with the prior fiscal year. This increase resulted mainly from the ¥895.5 billion unfavorable impact offluctuations in foreign currency translation rates and the ¥470.0 billion impact of changes in vehicle unit salesand sales mix, partially offset by the ¥280.0 billion impact of cost reduction efforts and the ¥1.3 billion decreasein other.
The decrease in other was due mainly to the ¥125.0 billion payment to the U.S. government based on theagreement with the U.S. Attorney’s Office for the Southern District of New York to resolve its investigation andthe ¥83.0 billion costs related to ending the vehicle and engine production in Australia, both being recorded inthe prior fiscal year, partially offset by the ¥140.0 billion increase in product quality related expenses and the¥100.0 billion increase in research and development expenses as compared to the prior fiscal year. See note 24 to
74
the consolidated financial statements for further discussion on the payment to the U.S. government based on theagreement with the U.S. Attorney’s Office for the Southern District of New York to resolve its investigation, andsee note 28 to the consolidated financial statements for further discussion on the costs related to ending thevehicle and engine production in Australia.
The increase in product quality related expenses was due mainly to the increase in provisions for recalls andother safety measures resulting from increase in actual payments during fiscal 2015 and the weakening of theJapanese yen against other currencies at the end of fiscal 2015 in comparison to the prior fiscal year. See note 13to the consolidated financial statements for further discussion.
During fiscal 2015 and beyond, Toyota announced recalls and other safety measures including thefollowing:
In April 2014, Toyota announced in Japan and other regions recall on certain Toyota vehicles in relation tothe electrical wiring (spiral cable) assembled in the steering column. In April 2014, Toyota announced in Japanand other regions recall on certain Toyota vehicles in relation to the slide and lock mechanism of the driver’sseat, the windshield wiper motor and the steering column mounting bracket beneath the instrument panel. InJune, October, November and December 2014 and in May and June 2015, Toyota announced in Japan and otherregions recall on certain Toyota and Lexus vehicles in relation to the driver/front passenger airbag inflator.
The increase in research and development expenses was due mainly to active investments in advancedtechnology development to support Toyota’s future growth.
Cost Reduction Efforts
During fiscal 2015, continued cost reduction efforts together with suppliers contributed to a reduction ofoperating costs and expenses by ¥280.0 billion. This was due to ¥220.0 billion in cost reduction effortsconcerning design related costs due mainly to ongoing value engineering activities, and ¥60.0 billion in costreduction efforts at plants and logistics department.
These cost reduction efforts related to ongoing value engineering and value analysis activities, the use ofcommon parts resulting in a reduction of part types and other manufacturing initiatives designed to reduce thecosts of vehicle production. The amount of the effect of cost reduction efforts includes the impact of fluctuationin the price of steel, precious metals, non-ferrous alloys including aluminum, plastic parts and other productionmaterials and parts.
Cost of Products Sold
Cost of products sold increased by ¥928.1 billion, or 4.6%, to ¥20,916.3 billion during fiscal 2015 comparedwith the prior fiscal year. The increase resulted mainly from the ¥691.0 billion unfavorable impact of fluctuationsin foreign currency translation rates, the ¥420.0 billion impact of changes in vehicle unit sales and sales mix, andthe ¥140.0 billion increase in product quality related expenses, partially offset by the ¥280.0 billion impact ofcost reduction efforts and the ¥80.0 billion costs related to ending the vehicle and engine production in Australiarecorded in the prior fiscal year.
Cost of Financing Operations
Cost of financing operations increased by ¥112.4 billion, or 13.8%, to ¥925.3 billion during fiscal 2015compared with the prior fiscal year. The increase resulted mainly from the ¥90.7 billion unfavorable impact offluctuations in foreign currency translation rates.
75
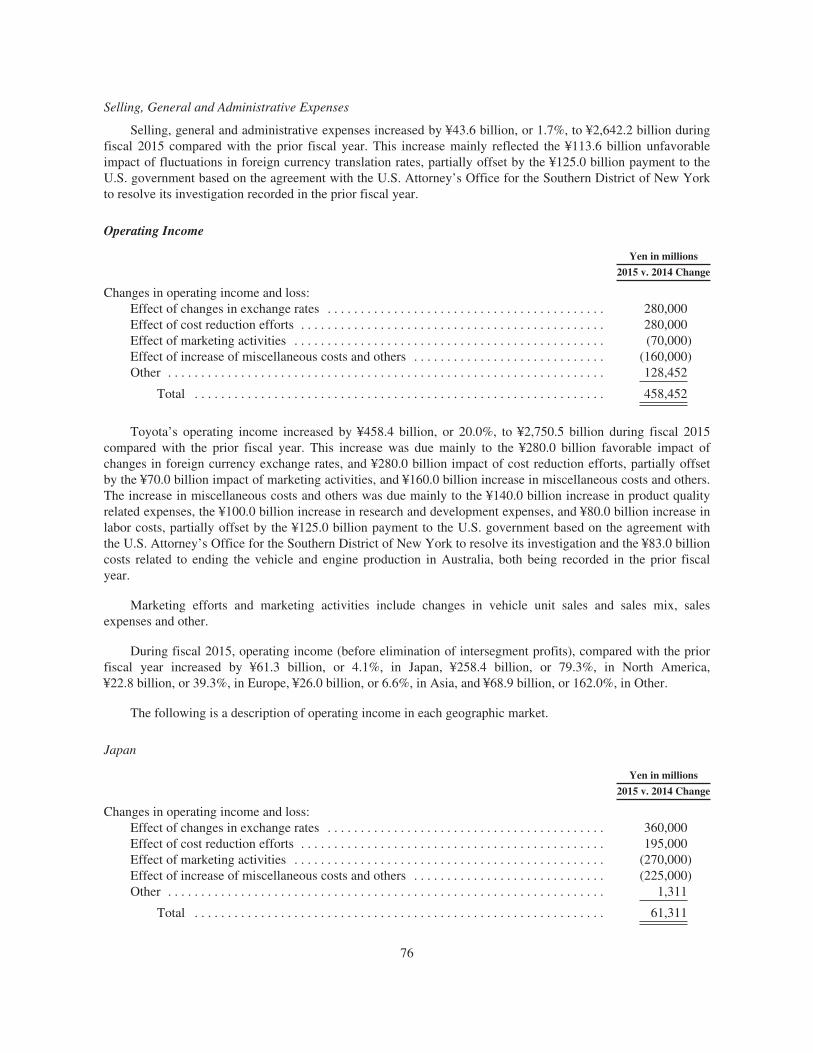
Selling, General and Administrative Expenses
Selling, general and administrative expenses increased by ¥43.6 billion, or 1.7%, to ¥2,642.2 billion duringfiscal 2015 compared with the prior fiscal year. This increase mainly reflected the ¥113.6 billion unfavorableimpact of fluctuations in foreign currency translation rates, partially offset by the ¥125.0 billion payment to theU.S. government based on the agreement with the U.S. Attorney’s Office for the Southern District of New Yorkto resolve its investigation recorded in the prior fiscal year.
Operating Income
Yen in millions
2015 v. 2014 Change
Changes in operating income and loss:Effect of changes in exchange rates . . . . . . . . . . . . . . . . . . . . . . . . . . . . . . . . . . . . . . . . . . 280,000Effect of cost reduction efforts . . . . . . . . . . . . . . . . . . . . . . . . . . . . . . . . . . . . . . . . . . . . . . 280,000Effect of marketing activities . . . . . . . . . . . . . . . . . . . . . . . . . . . . . . . . . . . . . . . . . . . . . . . (70,000)Effect of increase of miscellaneous costs and others . . . . . . . . . . . . . . . . . . . . . . . . . . . . . (160,000)Other . . . . . . . . . . . . . . . . . . . . . . . . . . . . . . . . . . . . . . . . . . . . . . . . . . . . . . . . . . . . . . . . . . 128,452
Total . . . . . . . . . . . . . . . . . . . . . . . . . . . . . . . . . . . . . . . . . . . . . . . . . . . . . . . . . . . . . . 458,452
Toyota’s operating income increased by ¥458.4 billion, or 20.0%, to ¥2,750.5 billion during fiscal 2015compared with the prior fiscal year. This increase was due mainly to the ¥280.0 billion favorable impact ofchanges in foreign currency exchange rates, and ¥280.0 billion impact of cost reduction efforts, partially offsetby the ¥70.0 billion impact of marketing activities, and ¥160.0 billion increase in miscellaneous costs and others.The increase in miscellaneous costs and others was due mainly to the ¥140.0 billion increase in product qualityrelated expenses, the ¥100.0 billion increase in research and development expenses, and ¥80.0 billion increase inlabor costs, partially offset by the ¥125.0 billion payment to the U.S. government based on the agreement withthe U.S. Attorney’s Office for the Southern District of New York to resolve its investigation and the ¥83.0 billioncosts related to ending the vehicle and engine production in Australia, both being recorded in the prior fiscalyear.
Marketing efforts and marketing activities include changes in vehicle unit sales and sales mix, salesexpenses and other.
During fiscal 2015, operating income (before elimination of intersegment profits), compared with the priorfiscal year increased by ¥61.3 billion, or 4.1%, in Japan, ¥258.4 billion, or 79.3%, in North America,¥22.8 billion, or 39.3%, in Europe, ¥26.0 billion, or 6.6%, in Asia, and ¥68.9 billion, or 162.0%, in Other.
The following is a description of operating income in each geographic market.
Japan
Yen in millions
2015 v. 2014 Change
Changes in operating income and loss:Effect of changes in exchange rates . . . . . . . . . . . . . . . . . . . . . . . . . . . . . . . . . . . . . . . . . . 360,000Effect of cost reduction efforts . . . . . . . . . . . . . . . . . . . . . . . . . . . . . . . . . . . . . . . . . . . . . . 195,000Effect of marketing activities . . . . . . . . . . . . . . . . . . . . . . . . . . . . . . . . . . . . . . . . . . . . . . . (270,000)Effect of increase of miscellaneous costs and others . . . . . . . . . . . . . . . . . . . . . . . . . . . . . (225,000)Other . . . . . . . . . . . . . . . . . . . . . . . . . . . . . . . . . . . . . . . . . . . . . . . . . . . . . . . . . . . . . . . . . . 1,311
Total . . . . . . . . . . . . . . . . . . . . . . . . . . . . . . . . . . . . . . . . . . . . . . . . . . . . . . . . . . . . . . 61,311
76
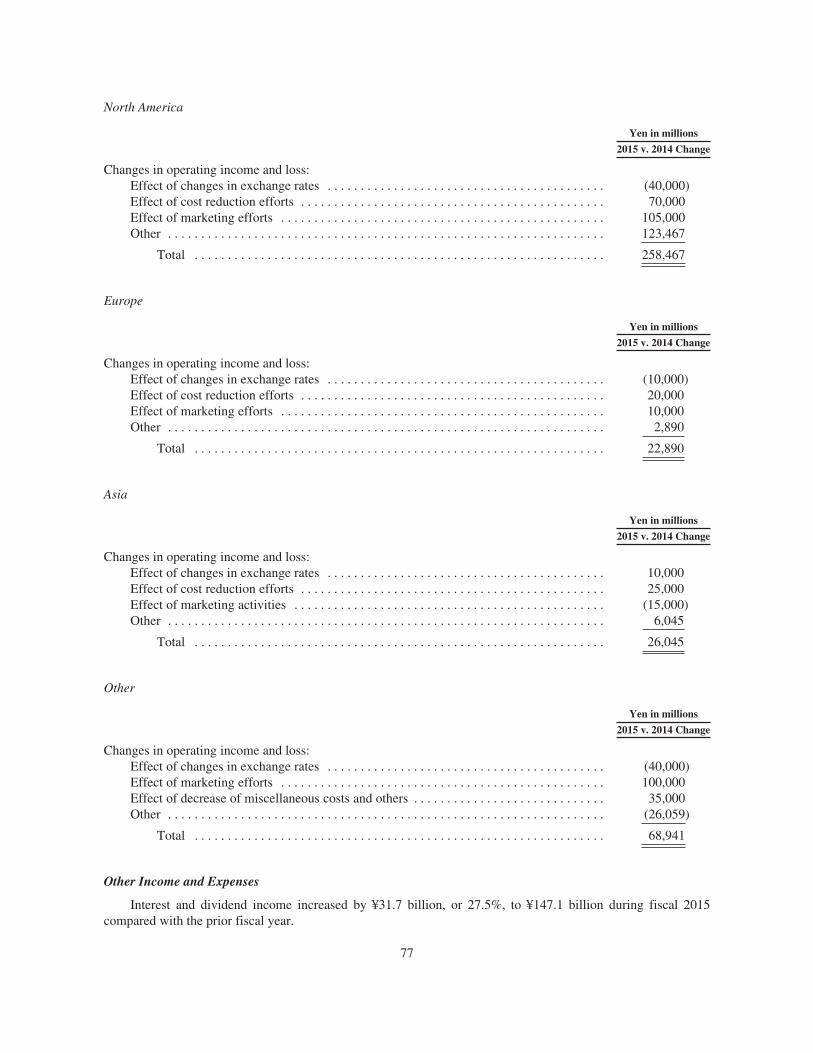
North America
Yen in millions
2015 v. 2014 Change
Changes in operating income and loss:Effect of changes in exchange rates . . . . . . . . . . . . . . . . . . . . . . . . . . . . . . . . . . . . . . . . . . (40,000)Effect of cost reduction efforts . . . . . . . . . . . . . . . . . . . . . . . . . . . . . . . . . . . . . . . . . . . . . . 70,000Effect of marketing efforts . . . . . . . . . . . . . . . . . . . . . . . . . . . . . . . . . . . . . . . . . . . . . . . . . 105,000Other . . . . . . . . . . . . . . . . . . . . . . . . . . . . . . . . . . . . . . . . . . . . . . . . . . . . . . . . . . . . . . . . . . 123,467
Total . . . . . . . . . . . . . . . . . . . . . . . . . . . . . . . . . . . . . . . . . . . . . . . . . . . . . . . . . . . . . . 258,467
Europe
Yen in millions
2015 v. 2014 Change
Changes in operating income and loss:Effect of changes in exchange rates . . . . . . . . . . . . . . . . . . . . . . . . . . . . . . . . . . . . . . . . . . (10,000)Effect of cost reduction efforts . . . . . . . . . . . . . . . . . . . . . . . . . . . . . . . . . . . . . . . . . . . . . . 20,000Effect of marketing efforts . . . . . . . . . . . . . . . . . . . . . . . . . . . . . . . . . . . . . . . . . . . . . . . . . 10,000Other . . . . . . . . . . . . . . . . . . . . . . . . . . . . . . . . . . . . . . . . . . . . . . . . . . . . . . . . . . . . . . . . . . 2,890
Total . . . . . . . . . . . . . . . . . . . . . . . . . . . . . . . . . . . . . . . . . . . . . . . . . . . . . . . . . . . . . . 22,890
Asia
Yen in millions
2015 v. 2014 Change
Changes in operating income and loss:Effect of changes in exchange rates . . . . . . . . . . . . . . . . . . . . . . . . . . . . . . . . . . . . . . . . . . 10,000Effect of cost reduction efforts . . . . . . . . . . . . . . . . . . . . . . . . . . . . . . . . . . . . . . . . . . . . . . 25,000Effect of marketing activities . . . . . . . . . . . . . . . . . . . . . . . . . . . . . . . . . . . . . . . . . . . . . . . (15,000)Other . . . . . . . . . . . . . . . . . . . . . . . . . . . . . . . . . . . . . . . . . . . . . . . . . . . . . . . . . . . . . . . . . . 6,045
Total . . . . . . . . . . . . . . . . . . . . . . . . . . . . . . . . . . . . . . . . . . . . . . . . . . . . . . . . . . . . . . 26,045
Other
Yen in millions
2015 v. 2014 Change
Changes in operating income and loss:Effect of changes in exchange rates . . . . . . . . . . . . . . . . . . . . . . . . . . . . . . . . . . . . . . . . . . (40,000)Effect of marketing efforts . . . . . . . . . . . . . . . . . . . . . . . . . . . . . . . . . . . . . . . . . . . . . . . . . 100,000Effect of decrease of miscellaneous costs and others . . . . . . . . . . . . . . . . . . . . . . . . . . . . . 35,000Other . . . . . . . . . . . . . . . . . . . . . . . . . . . . . . . . . . . . . . . . . . . . . . . . . . . . . . . . . . . . . . . . . . (26,059)
Total . . . . . . . . . . . . . . . . . . . . . . . . . . . . . . . . . . . . . . . . . . . . . . . . . . . . . . . . . . . . . . 68,941
Other Income and Expenses
Interest and dividend income increased by ¥31.7 billion, or 27.5%, to ¥147.1 billion during fiscal 2015compared with the prior fiscal year.
77
Interest expense increased by ¥3.2 billion, or 16.5%, to ¥22.8 billion during fiscal 2015 compared with theprior fiscal year.
Foreign exchange gain, net increased by ¥37.8 billion, or 75.4%, to ¥88.1 billion during fiscal 2015compared with the prior fiscal year. Foreign exchange gains and losses include the differences between the valueof foreign currency denominated assets and liabilities recognized through transactions in foreign currenciestranslated at prevailing exchange rates and the value at the date the transaction settled during the fiscal year,including those settled using forward foreign currency exchange contracts, or the value translated by appropriateyear-end exchange rates. The ¥37.8 billion increase in foreign exchange gain, net was due mainly to the gainsrecorded in fiscal 2015 resulting from the Japanese yen being weaker against foreign currencies at the dates ofsettlement of the foreign currency trade accounts receivable than at the dates of the transactions.
Other income (loss), net decreased by ¥73.0 billion to a loss of ¥70.1 billion during fiscal 2015 comparedwith the prior fiscal year. The decrease was due mainly to the effect of the reissuance of treasury stock forToyota Mobility Foundation, a General Incorporated Foundation. See note 17 to the consolidated financialstatements for further discussion.
Income Taxes
The provision for income taxes increased by ¥125.6 billion, or 16.4%, to ¥893.4 billion during fiscal 2015compared with the prior fiscal year due mainly to the increase in income before income taxes and equity inearnings of affiliated companies. The effective tax rate for fiscal 2015 was 30.9%, which was lower than thestatutory tax rate in Japan. This was due mainly to the increase in tax credits and the effect of foreign subsidiarieswhere statutory tax rates are lower than that of Japan.
Net Income Attributable to Noncontrolling Interests and Equity in Earnings of Affiliated Companies
Net income attributable to noncontrolling interests decreased by ¥33.9 billion, or 20.2%, to ¥134.5 billionduring fiscal 2015 compared with the prior fiscal year. This was due mainly to a decrease during fiscal 2015 innet income attributable to the shareholders of consolidated subsidiaries.
Equity in earnings of affiliated companies during fiscal 2015 decreased by ¥9.8 billion, or 3.1%, to¥308.5 billion compared with the prior fiscal year. This decrease was due mainly to a decrease during fiscal 2015in net income attributable to the shareholders of affiliated companies accounted for by the equity method.
Net Income Attributable to Toyota Motor Corporation
Net income attributable to the shareholders of Toyota Motor Corporation increased by ¥350.2 billion, or19.2%, to ¥2,173.3 billion during fiscal 2015 compared with the prior fiscal year.
Other Comprehensive Income and Loss
Other comprehensive income increased by ¥65.1 billion, or 7.4%, to ¥949.3 billion for fiscal 2015 comparedwith the prior fiscal year. This increase resulted from unrealized holding gains on securities in fiscal 2015 of¥567.0 billion compared with gains of ¥493.7 billion in the prior fiscal year due mainly to an increase in prices ofmarketable securities in stock exchange markets in Japan, and from favorable foreign currency translationadjustments gains of ¥380.4 billion in fiscal 2015 compared with gains of ¥296.9 billion in the prior fiscal yeardue mainly to depreciation of the yen against the U.S. dollar, partially offset by pension liability adjustments infiscal 2015 of ¥1.9 billion compared with gains of ¥93.5 billion in the prior fiscal year.
78
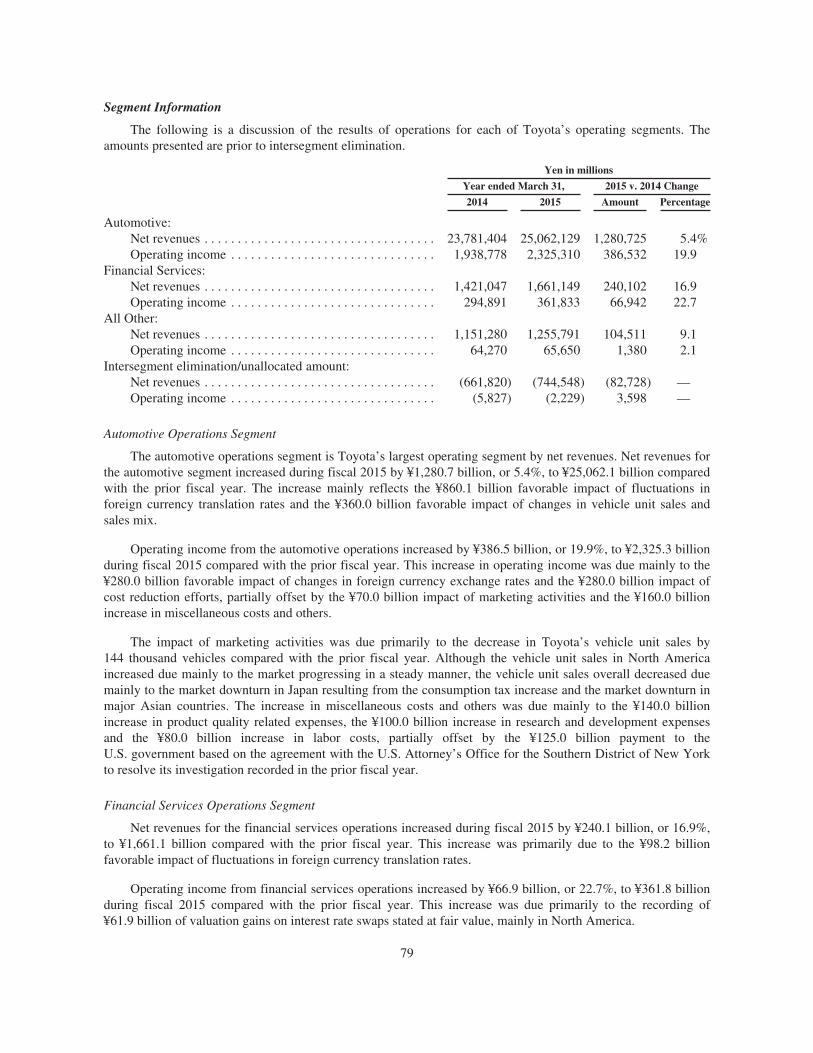
Segment Information
The following is a discussion of the results of operations for each of Toyota’s operating segments. Theamounts presented are prior to intersegment elimination.
Yen in millions
Year ended March 31, 2015 v. 2014 Change
2014 2015 Amount Percentage
Automotive:Net revenues . . . . . . . . . . . . . . . . . . . . . . . . . . . . . . . . . . . 23,781,404 25,062,129 1,280,725 5.4%Operating income . . . . . . . . . . . . . . . . . . . . . . . . . . . . . . . 1,938,778 2,325,310 386,532 19.9
Financial Services:Net revenues . . . . . . . . . . . . . . . . . . . . . . . . . . . . . . . . . . . 1,421,047 1,661,149 240,102 16.9Operating income . . . . . . . . . . . . . . . . . . . . . . . . . . . . . . . 294,891 361,833 66,942 22.7
All Other:Net revenues . . . . . . . . . . . . . . . . . . . . . . . . . . . . . . . . . . . 1,151,280 1,255,791 104,511 9.1Operating income . . . . . . . . . . . . . . . . . . . . . . . . . . . . . . . 64,270 65,650 1,380 2.1
Intersegment elimination/unallocated amount:Net revenues . . . . . . . . . . . . . . . . . . . . . . . . . . . . . . . . . . . (661,820) (744,548) (82,728) —Operating income . . . . . . . . . . . . . . . . . . . . . . . . . . . . . . . (5,827) (2,229) 3,598 —
Automotive Operations Segment
The automotive operations segment is Toyota’s largest operating segment by net revenues. Net revenues forthe automotive segment increased during fiscal 2015 by ¥1,280.7 billion, or 5.4%, to ¥25,062.1 billion comparedwith the prior fiscal year. The increase mainly reflects the ¥860.1 billion favorable impact of fluctuations inforeign currency translation rates and the ¥360.0 billion favorable impact of changes in vehicle unit sales andsales mix.
Operating income from the automotive operations increased by ¥386.5 billion, or 19.9%, to ¥2,325.3 billionduring fiscal 2015 compared with the prior fiscal year. This increase in operating income was due mainly to the¥280.0 billion favorable impact of changes in foreign currency exchange rates and the ¥280.0 billion impact ofcost reduction efforts, partially offset by the ¥70.0 billion impact of marketing activities and the ¥160.0 billionincrease in miscellaneous costs and others.
The impact of marketing activities was due primarily to the decrease in Toyota’s vehicle unit sales by144 thousand vehicles compared with the prior fiscal year. Although the vehicle unit sales in North Americaincreased due mainly to the market progressing in a steady manner, the vehicle unit sales overall decreased duemainly to the market downturn in Japan resulting from the consumption tax increase and the market downturn inmajor Asian countries. The increase in miscellaneous costs and others was due mainly to the ¥140.0 billionincrease in product quality related expenses, the ¥100.0 billion increase in research and development expensesand the ¥80.0 billion increase in labor costs, partially offset by the ¥125.0 billion payment to theU.S. government based on the agreement with the U.S. Attorney’s Office for the Southern District of New Yorkto resolve its investigation recorded in the prior fiscal year.
Financial Services Operations Segment
Net revenues for the financial services operations increased during fiscal 2015 by ¥240.1 billion, or 16.9%,to ¥1,661.1 billion compared with the prior fiscal year. This increase was primarily due to the ¥98.2 billionfavorable impact of fluctuations in foreign currency translation rates.
Operating income from financial services operations increased by ¥66.9 billion, or 22.7%, to ¥361.8 billionduring fiscal 2015 compared with the prior fiscal year. This increase was due primarily to the recording of¥61.9 billion of valuation gains on interest rate swaps stated at fair value, mainly in North America.
79
All Other Operations Segment
Net revenues for Toyota’s other operations segments increased by ¥104.5 billion, or 9.1%, to¥1,255.7 billion during fiscal 2015 compared with the prior fiscal year.
Operating income from Toyota’s other operations segments increased by ¥1.3 billion, or 2.1%, to¥65.6 billion during fiscal 2015 compared with the prior fiscal year.
Related Party Transactions
Toyota does not have any significant related party transactions other than transactions with affiliatedcompanies in the ordinary course of business. See note 11 to the consolidated financial statements for furtherdiscussion.
Recent Accounting Pronouncements in the United States
In May 2014, the Financial Accounting Standards Board (“FASB”) issued updated guidance on therecognition of revenue from contracts with customers. This guidance will supersede the current revenuerecognition guidance. In August 2015, the FASB issued updated guidance on the deferral of the effective date.As a result, this guidance is effective for annual reporting periods beginning after December 15, 2017, includinginterim periods within that reporting period. Management is evaluating the impact of adopting this guidance onToyota’s consolidated financial statements.
In February 2015, the FASB issued updated guidance that amends the analysis a reporting entity mustperform to determine whether it should consolidate certain legal entities. This guidance is effective for fiscalyears, and for interim periods within those fiscal years, beginning after December 15, 2015. Management isevaluating the impact of adopting this guidance on Toyota’s consolidated financial statements.
In April 2015, the FASB issued updated guidance that requires debt issuance costs related to a recognizeddebt liability be presented in the balance sheet as a direct deduction from the carrying amount of the related debtliability instead of being presented as an asset. In August 2015, the FASB issued an additional update whichclarifies that debt issuance costs for line of credit agreements may continue to be deferred and amortized. Thisguidance is effective for fiscal years beginning after December 15, 2015, and interim periods within those fiscalyears. Management does not expect this guidance to have a material impact on Toyota’s consolidated financialstatements.
In April 2015, the FASB issued updated guidance to help entities evaluate the accounting for fees paid by acustomer in a cloud computing arrangement. This guidance is effective for annual periods, including interimperiods within those annual periods, beginning after December 15, 2015. Management is evaluating the impact ofadopting this guidance on Toyota’s consolidated financial statements.
In May 2015, the FASB issued updated guidance on disclosures for investments in certain entities thatcalculate net asset value per share. This guidance removes the requirement to categorize within the fair valuehierarchy all investments for which fair value is measured using the net asset value per share practical expedient.This guidance is effective for fiscal years beginning after December 15, 2015, including interim periods withinthose fiscal years. Management is evaluating the impact of adopting this guidance on Toyota’s consolidatedfinancial statements.
In July 2015, the FASB issued updated guidance to simplify the measurement of inventory. This guidance iseffective for fiscal years beginning after December 15, 2016, including interim periods within those fiscal years.Management is evaluating the impact of adopting this guidance on Toyota’s consolidated financial statements.
80
In November 2015, the FASB issued updated guidance to simplify the balance sheet classification ofdeferred taxes. This guidance will require that deferred tax assets and liabilities be classified as noncurrent on thebalance sheet. This guidance is effective for annual periods beginning after December 15, 2016, and interimperiods within those annual periods. Current deferred tax assets were ¥967.6 billion and current deferred taxliabilities were ¥28.1 billion, as of March 31, 2016.
In January 2016, the FASB issued updated guidance for financial instruments. This guidance addressescertain aspects of recognition, measurement, presentation, and disclosure of financial instruments and willrequire entities to measure equity investments at fair value and recognize any changes in fair value in net income.This guidance is effective for fiscal years beginning after December 15, 2017, including interim periods withinthose fiscal years. Management is evaluating the impact of adopting this guidance on Toyota’s consolidatedfinancial statements.
In February 2016, the FASB issued updated guidance for leases. This guidance will require lessees torecognize almost all leases on their balance sheet as a right-of-use asset and a lease liability. This guidance iseffective for fiscal years beginning after December 15, 2018, including interim periods within those fiscal years.Management is evaluating the impact of adopting this guidance on Toyota’s consolidated financial statements.
In March 2016, the FASB issued updated guidance for effect of derivative contract novations on existinghedge accounting relationships. This guidance clarifies that a change in the counterparty to a designatedderivative hedging instrument does not, in and of itself, require dedesignation of that hedging relationshipprovided that all other hedge accounting criteria continue to be met. This guidance is effective for fiscal yearsbeginning after December 15, 2016, including interim periods within those fiscal years. Management isevaluating the impact of adopting this guidance on Toyota’s consolidated financial statements.
In March 2016, the FASB issued updated guidance for contingent put and call options in debt instruments.This guidance clarifies whether embedded contingent put and call options are clearly and closely related to thedebt host when bifurcating embedded derivatives. This guidance is effective for fiscal years beginning afterDecember 15, 2016, including interim periods within those fiscal years. Management is evaluating the impact ofadopting this guidance on Toyota’s consolidated financial statements.
In June 2016, the FASB issued updated guidance for measurement of credit losses on financial instruments.This guidance introduces an approach to estimate credit losses on certain types of financial instruments based onexpected losses. It also modifies the impairment model for available-for-sale debt securities. This guidance iseffective for fiscal years beginning after December 15, 2019, including interim periods within those fiscal years.Management is evaluating the impact of adopting this guidance on Toyota’s consolidated financial statements.
Critical Accounting Estimates
The consolidated financial statements of Toyota are prepared in conformity with accounting principlesgenerally accepted in the United States of America. The preparation of these financial statements requires the useof estimates, judgments and assumptions that affect the reported amounts of assets and liabilities at the date ofthe financial statements and the reported amounts of revenues and expenses during the periods presented. Toyotabelieves that of its significant accounting policies, the following may involve a higher degree of judgments,estimates and assumptions:
Product Warranties and Recalls and Other Safety Measures
Toyota generally warrants its products against certain manufacturing and other defects. Provisions forproduct warranties are provided for specific periods of time and/or usage of the product and vary depending uponthe nature of the product, the geographic location of the sale and other factors. All product warranties areconsistent with commercial practices. Toyota includes a provision for estimated product warranty costs as a
81
component of cost of sales at the time the related sale is recognized. The accrued warranty costs representmanagement’s best estimate at the time of sale of the total costs that Toyota will incur to repair or replaceproduct parts that fail while still under warranty. The amount of accrued estimated warranty costs is primarilybased on historical experience of product failures as well as current information on repair costs. The amount ofwarranty costs accrued also contains an estimate of warranty claim recoveries to be received from suppliers. Theforegoing evaluations are inherently uncertain, as they require material estimates and some products’ warrantiesextend for several years. Consequently, actual warranty costs may differ from the estimated amounts and couldrequire additional warranty provisions. If these factors require a significant increase in Toyota’s accruedestimated warranty costs, it would negatively affect future operating results of the automotive operations.
An estimate of warranty claim accrued for each fiscal year is calculated based on the estimate of warrantyclaim per unit. The estimate of warranty claim per unit is calculated by dividing the actual amounts of warrantyclaim, net of claim recovery cost received from suppliers, by the number of sales units for the fiscal year.
As the historical recovery amounts received from suppliers is used as a factor in Toyota’s calculation ofestimated accrued warranty cost, the estimated accrued warranty cost may change depending on the averagerecovery amounts received from suppliers in the past. However, Toyota believes that there is not a significantuncertainty of estimated amounts based on historical experience regarding recoveries received from suppliers.Toyota may seek recovery to suppliers over the life of the warranty, and there are no other significant specialterms and conditions including cap on amounts that can be recovered.
Toyota accrues for costs of recalls and other safety measures, as well as product warranty cost describedabove, included as a component of cost of sales at the time of vehicle sale. Toyota provides for such “liabilitiesfor recalls and other safety measures” at the time of vehicle sales comprehensively by aggregate sales of variousmodels in a certain period by geographical regions instead of by individual models. While there is no differencein the calculation method among geographical regions, Toyota believes it is reasonable to calculate the liabilitiesby geographical regions because of factors such as varying labor costs among geographical regions.
The “liabilities for the costs of recalls and other safety measures” recorded in the balance sheet is calculatedby deducting the “accumulated amount of repair cost paid” from the “expected liability for the cost of recalls andother safety measures”. As such, this liability is evaluated every period based on new data and are adjusted asappropriate. Toyota calculates these liabilities for units sold in the current period and each of the past 10 fiscalyears, and aggregates such liabilities in determining the final liability amount.
The “expected liability for the cost of recalls and other safety measures” are calculated by multiplying the“sales unit” by the “expected average repair cost per unit”. The “expected average repair cost per unit” iscalculated based on dividing the “accumulated amount of repair cost paid per unit” by the “pattern of paymentoccurrences”. The “pattern of payment occurrence” represents a ratio that shows the measure of paymentoccurrence over 10 years based on actual payments with regard to units sold within 10 years.
Factors that may cause a difference between the amount accrued at the time of vehicle sale and actualpayment on individual recalls and other safety measures mainly include actual cost of recalls and safety measuresduring the period being significantly different from the accumulated amount of repair cost paid per unit(generally comprised of parts and labor) and the actual pattern of payment occurrence during the period beingsignificantly different from the pattern of the payment occurrence in the past, which is considered as part of ourestimation process for future recalls and other safety measures.
As described above, in estimating the comprehensive provision, the actual cost of individual recalls andother safety measures is included as a component of the calculation such as the accumulated amount of repaircost paid per unit. Thus, an individual recall announcement generally does not directly impact the financialstatements when it occurs.
82
Allowance for Doubtful Accounts and Credit Losses
Natures of estimates and assumptions
Retail receivables and finance lease receivables consist of retail installment sales contracts secured bypassenger cars and commercial vehicles. Collectability risks include consumer and dealer insolvencies andinsufficient collateral values (less costs to sell) to realize the full carrying values of these receivables. As a matterof policy, Toyota maintains an allowance for doubtful accounts and credit losses representing management’sestimate of the amount of asset impairment in the portfolios of finance, trade and other receivables. Toyotadetermines the allowance for doubtful accounts and credit losses based on a systematic, ongoing review andevaluation performed as part of the credit-risk evaluation process, historical loss experience, the size andcomposition of the portfolios, current economic events and conditions, the estimated fair value and adequacy ofcollateral, and other pertinent factors. This evaluation is inherently judgmental and requires material estimates,including the amounts and timing of future cash flows expected to be received, which may be susceptible tosignificant change. Although management considers the allowance for doubtful accounts and credit losses to beadequate based on information currently available, additional provisions may be necessary due to (i) changes inmanagement estimates and assumptions about asset impairments, (ii) information that indicates changes inexpected future cash flows, or (iii) changes in economic and other events and conditions. To the extent that salesincentives remain an integral part of sales promotion with the effect of reducing new vehicle prices, resale pricesof used vehicles and, correspondingly, the collateral value of Toyota’s retail receivables and finance leasereceivables could experience further downward pressure. If these factors require a significant increase inToyota’s allowance for doubtful accounts and credit losses, it could negatively affect future operating results ofthe financial services operations. The level of credit losses, which has a greater impact on Toyota’s results ofoperations, is influenced by two factors: frequency of occurrence and expected severity of loss. For evaluationpurposes, exposures to credit losses are segmented into the two primary categories of “consumer” and “dealer”.Toyota’s “consumer” category consists of smaller balances that are homogenous retail receivables and financelease receivables. The “dealer” category consists of wholesale and other dealer loan receivables. The overallallowance for credit losses is evaluated at least quarterly, considering a variety of assumptions and factors todetermine whether reserves are considered adequate to cover probable losses.
Sensitivity analysis
The level of credit losses, which could significantly impact Toyota’s results of operations, is influenced bytwo factors: frequency of occurrence and expected severity of loss. The overall allowance for credit losses isevaluated at least quarterly, considering a variety of assumptions and factors to determine whether reserves areconsidered adequate to cover probable losses. The following table illustrates the effect of an assumed change infrequency of occurrence or expected severity of loss mainly in the United States, assuming all other assumptionsare held consistent. The table below represents the impact on the allowance for credit losses in Toyota’s financialservices operations of the change in frequency of occurrence or expected severity of loss as any change impactsmost significantly on the financial services operations.
Yen in millions
Effect on the allowancefor credit losses
as of March 31, 2016
10 percent change in frequency of occurrence or expected severity of loss . . . . . . . . . . . . . . 4,507
Investment in Operating Leases
Natures of estimates and assumptions
Vehicles on operating leases, where Toyota is the lessor, are valued at cost and depreciated over theirestimated useful lives using the straight-line method to their estimated residual values. Toyota utilizes industrypublished information and its own historical experience to determine estimated residual values for these vehicles.
83
Toyota evaluates the recoverability of the carrying values of its leased vehicles for impairment when there areindications of declines in residual values, and if impaired, Toyota recognizes an allowance for losses on itsresidual values.
Throughout the life of the lease, management performs periodic evaluations of estimated end-of-term fairvalues to determine whether estimates used in the determination of the contractual residual value are stillconsidered reasonable. Factors affecting the estimated residual value at lease maturity include, but are not limitedto, new vehicle incentive programs, new vehicle pricing, used vehicle supply, projected vehicle return rates, andprojected loss severity. The vehicle return rate represents the number of leased vehicles actually returned atcontract maturity as a percentage of the number of lease contracts originally scheduled to mature in the sameperiod less lease contracts subject to early terminations. A higher rate of vehicle returns exposes Toyota to higherpotential losses incurred at lease termination. Severity of loss is the extent to which the end-of-term fair value ofa lease is less than its carrying value at lease end.
To the extent that sales incentives remain an integral part of sales promotion, resale prices of used vehiclesand, correspondingly, the fair value of Toyota’s leased vehicles could be subject to downward pressure. Theextent of the impact this will have on the end of term residual value depends on the significance of the incentiveprograms and whether they are sustained over a number of periods. This in turn can impact the projection offuture used vehicle values, adversely impacting the expected residual value of the current operating leaseportfolio and increasing the provision for residual value losses. However, various other factors impact usedvehicle values and the projection of future residual values, including the supply of and demand for used vehicles,interest rates, inflation, the actual or perceived quality, safety and reliability of vehicles, the general economicoutlook, new vehicle pricing, projected vehicle return rates and projected loss severity, which may offset thiseffect. Such factors may adversely affect the results of operations for financial services due to significant chargesreducing the estimated residual value.
Sensitivity analysis
The following table illustrates the effect of an assumed change in the vehicle return rate and end-of-termmarket values mainly in the United States, which Toyota believes are the critical estimates, in determining theresidual value losses, holding all other assumptions constant. The following table represents the impact on theresidual value losses in Toyota’s financial services operations of the change in vehicle return rate andend-of-term market values as those changes have a significant impact on financial services operations.
Yen in millions
Effect on the residual value lossesover the remaining terms
of the operating leaseson and after April 1, 2016
1 percent increase in vehicle return rate . . . . . . . . . . . . . . . . . . . . . . . . . . . . . . . . . . 2,5921 percent increase in end-of-term market values . . . . . . . . . . . . . . . . . . . . . . . . . . . . 10,592
Impairment of Long-Lived Assets
Toyota periodically reviews the carrying value of its long-lived assets held and used and assets to bedisposed of, including intangible assets, when events and circumstances warrant such a review. This review isperformed using estimates of future cash flows. If the carrying value of a long-lived asset is considered impaired,an impairment charge is recorded for the amount by which the carrying value of the long-lived asset exceeds itsfair value. Management believes that the estimates of future cash flows and fair values are reasonable. However,changes in estimates of such cash flows and fair values would affect the evaluations and negatively affect futureoperating results of the automotive operations. In fiscal 2014, Toyota recorded long-lived assets impairmentcharges relating to the end of production in Australia and recorded additional charges in fiscal 2015. See note 28to the consolidated financial statements for further discussion.
84
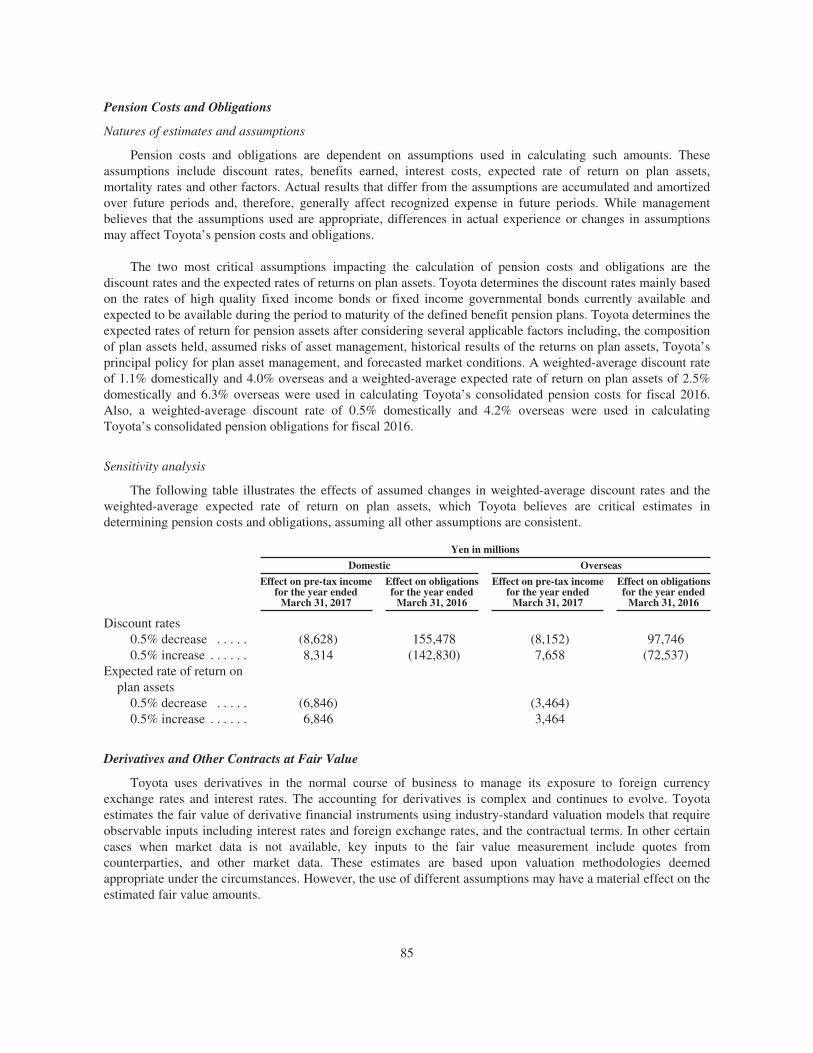
Pension Costs and Obligations
Natures of estimates and assumptions
Pension costs and obligations are dependent on assumptions used in calculating such amounts. Theseassumptions include discount rates, benefits earned, interest costs, expected rate of return on plan assets,mortality rates and other factors. Actual results that differ from the assumptions are accumulated and amortizedover future periods and, therefore, generally affect recognized expense in future periods. While managementbelieves that the assumptions used are appropriate, differences in actual experience or changes in assumptionsmay affect Toyota’s pension costs and obligations.
The two most critical assumptions impacting the calculation of pension costs and obligations are thediscount rates and the expected rates of returns on plan assets. Toyota determines the discount rates mainly basedon the rates of high quality fixed income bonds or fixed income governmental bonds currently available andexpected to be available during the period to maturity of the defined benefit pension plans. Toyota determines theexpected rates of return for pension assets after considering several applicable factors including, the compositionof plan assets held, assumed risks of asset management, historical results of the returns on plan assets, Toyota’sprincipal policy for plan asset management, and forecasted market conditions. A weighted-average discount rateof 1.1% domestically and 4.0% overseas and a weighted-average expected rate of return on plan assets of 2.5%domestically and 6.3% overseas were used in calculating Toyota’s consolidated pension costs for fiscal 2016.Also, a weighted-average discount rate of 0.5% domestically and 4.2% overseas were used in calculatingToyota’s consolidated pension obligations for fiscal 2016.
Sensitivity analysis
The following table illustrates the effects of assumed changes in weighted-average discount rates and theweighted-average expected rate of return on plan assets, which Toyota believes are critical estimates indetermining pension costs and obligations, assuming all other assumptions are consistent.
Yen in millions
Domestic Overseas
Effect on pre-tax incomefor the year ended
March 31, 2017
Effect on obligationsfor the year ended
March 31, 2016
Effect on pre-tax incomefor the year ended
March 31, 2017
Effect on obligationsfor the year ended
March 31, 2016
Discount rates0.5% decrease . . . . . (8,628) 155,478 (8,152) 97,7460.5% increase . . . . . . 8,314 (142,830) 7,658 (72,537)
Expected rate of return onplan assets
0.5% decrease . . . . . (6,846) (3,464)0.5% increase . . . . . . 6,846 3,464
Derivatives and Other Contracts at Fair Value
Toyota uses derivatives in the normal course of business to manage its exposure to foreign currencyexchange rates and interest rates. The accounting for derivatives is complex and continues to evolve. Toyotaestimates the fair value of derivative financial instruments using industry-standard valuation models that requireobservable inputs including interest rates and foreign exchange rates, and the contractual terms. In other certaincases when market data is not available, key inputs to the fair value measurement include quotes fromcounterparties, and other market data. These estimates are based upon valuation methodologies deemedappropriate under the circumstances. However, the use of different assumptions may have a material effect on theestimated fair value amounts.
85
Marketable Securities and Investments in Affiliated Companies
Toyota’s accounting policy is to record a write-down of such investments to net realizable value when adecline in fair value below the carrying value is other-than-temporary. In determining if a decline in value isother-than-temporary, Toyota considers the length of time and the extent to which the fair value has been lessthan the carrying value, the financial condition and prospects of the company and Toyota’s ability and intent toretain its investment in the company for a period of time sufficient to allow for any anticipated recovery in fairvalue.
Reissuance of treasury stock for Toyota Mobility Foundation, a General Incorporated Foundation
In fiscal 2015, Toyota Motor Corporation reissued treasury stock for Toyota Mobility Foundation, a GeneralIncorporated Foundation (the “Foundation”), and the difference between amount of proceeds and fair value oftreasury stock on reissuance was included in “Other income (expense)”. The fair value of treasury stock wasmeasured using a dividend discount model due to the restrictions on transfer in the reissued stock for theFoundation. These estimates were based upon valuation methodologies deemed appropriate under thecircumstances. See note 17 to the consolidated financial statements for further discussion.
Deferred Tax Assets
The factors used to assess the likelihood of realization of the deferred tax assets are the future reversal ofexisting taxable temporary differences, the future taxable income and available tax planning strategies that areprudent and feasible. All available evidence, both positive and negative, is considered to determine whether,based on the weight of that evidence, a valuation allowance is needed for deferred tax assets which are notmore-likely-than-not to be realized.
The accounting for deferred tax assets represents Toyota’s current best estimate based on all availableevidence. Unanticipated events or changes could result in re-evaluating the realizability of deferred tax assets.
Outlook
As for the future business environment, the U.S. is expected to continue recovering and Europe, chiefly inthe eurozone, is expected to continue its moderate recovery. Meanwhile, China and other emerging countries areshowing a risk of a slowdown. With regards to the Japanese economy, attention needs to be paid to an economicdecline caused by a slowdown in emerging countries. The automotive market is expected to progress steadily indeveloped countries, though concerns over slowdowns in emerging countries continue. In addition, measures torespond to environmental and fuel consumption regulations in various countries and to reinforce efforts towardthe development of safety technologies are required, while companies in other businesses are newly venturinginto the development of automated driving technology. Fierce competition is thus intensifying on a global scale.Taking the foregoing external factors into account, Toyota expects that net revenues for fiscal 2017 will decreasecompared with fiscal 2016 due to an unfavorable impact of fluctuations in foreign currency translation rates,partially offset by an increase in vehicle unit sales and other factors. Toyota expects that operating income willdecrease in fiscal 2017 compared with fiscal 2016 due mainly to the unfavorable impact of fluctuations in foreigncurrency translation rates and an increase in miscellaneous costs, partially offset by a favorable impact of costreduction efforts and an increase in vehicle unit sales. Toyota expects that income before income taxes and equityin earnings of affiliated companies and net income attributable to Toyota Motor Corporation will also decrease infiscal 2017.
For the purposes of this outlook discussion, Toyota is assuming an average exchange rate of ¥105 to theU.S. dollar and ¥120 to the euro. Exchange rate fluctuations can materially affect Toyota’s operating results. Inparticular, a strengthening of the Japanese yen against the U.S. dollar can have a material adverse effect onToyota’s operating results. See “Operating and Financial Review and Prospects — Operating Results —Overview — Currency Fluctuations” for further discussion.
86
The foregoing statements are forward-looking statements based upon Toyota’s management’s assumptionsand beliefs regarding exchange rates, market demand for Toyota’s products, economic conditions and others. See“Cautionary Statement Concerning Forward-Looking Statements”. Toyota’s actual results of operations couldvary significantly from those described above as a result of unanticipated changes in the factors described aboveor other factors, including those described in “Risk Factors”.
5.B LIQUIDITY AND CAPITAL RESOURCES
Historically, Toyota has funded its capital expenditures and research and development activities throughcash generated by operations.
In fiscal 2017, Toyota expects to sufficiently fund its capital expenditures and research and developmentactivities through cash and cash equivalents on hand, and cash generated by operations. Toyota will use its fundsfor the development of environment technologies, maintenance and replacement of manufacturing facilities, andthe introduction of new products. See “Information on the Company — Business Overview — CapitalExpenditures and Divestitures” for information regarding Toyota’s material capital expenditures and divestituresfor fiscal 2014, 2015 and 2016, and information concerning Toyota’s principal capital expenditures anddivestitures currently in progress.
Toyota funds its financing programs for customers and dealers, including loans and leasing programs, fromboth cash generated by operations and borrowings by its sales finance subsidiaries. Toyota seeks to expand itsability to raise funds locally in markets throughout the world by expanding its network of finance subsidiaries.
Net cash provided by operating activities increased by ¥775.1 billion to ¥4,460.8 billion for fiscal 2016,compared with ¥3,685.7 billion for fiscal 2015.
The increase was primarily attributable to the ¥103.4 billion increase in operating income and the¥216.7 billion increase in depreciation expenses, i.e. noncash expenses, resulting from an increase in capitalexpenditures. Results of operations are recorded on an accrual basis and are therefore different from cashprovided or used in operating activities. Other than the operating income increase, net cash provided by operatingactivities increased primarily due to the ¥240.5 billion decrease in cash payments for income taxes for fiscal 2016resulting mainly from a decrease in provisional tax payment.
Net cash provided by operating activities increased by ¥39.7 billion to ¥3,685.7 billion for fiscal 2015,compared with ¥3,646.0 billion for fiscal 2014.
The increase was primarily attributable to the ¥458.4 billion increase in operating income and the¥158.2 billion increase in depreciation expenses, i.e. noncash expenses, resulting from an increase in capitalexpenditures. Results of operations are recorded on an accrual basis and are therefore different from cashprovided or used in operating activities. Accordingly the ¥52.4 billion decrease in accrued trade receivablesresulting from a decrease in vehicle unit sales in March in Japan and ¥84.7 billion increase in accrued accountspayables resulting from the consumption tax increase in Japan are attributed to the increase in net cash providedby operating activities. On the other hand the ¥734.6 billion increase in cash payments for income taxes for fiscal2015 resulting from an increase of provisional tax payment partially offset the increase.
Net cash used in investing activities decreased by ¥630.9 billion to ¥3,182.5 billion for fiscal 2016,compared with ¥3,813.4 billion for fiscal 2015. The decrease was primarily attributable to the ¥1,729.6 billiondecrease in purchases of marketable securities and security investments, partially offset by the ¥565.4 billionincrease in purchases of equipment leased to others and the ¥948.7 billion increase in investments and otherassets.
87
Net cash used in investing activities decreased by ¥522.7 billion to ¥3,813.4 billion for fiscal 2015,compared with ¥4,336.2 billion for fiscal 2014. The decrease was primarily attributable to the ¥907.6 billiondecrease in purchases of marketable securities and security investments, partially offset by the ¥502.5 billionincrease in purchases of equipment leased to others.
Net cash used in financing activities was ¥423.5 billion for fiscal 2016, compared with net cash provided byfinancing activities of ¥306.0 billion for fiscal 2015, a ¥729.6 billion change. The change was primarilyattributable to the ¥713.9 billion increase in payments of long-term debt and a ¥430.3 billion increase inrepurchase and reissuance of treasury stock, partially offset by the ¥474.9 billion proceeds from the issuance ofModel AA Class Shares.
Net cash provided by financing activities decreased by ¥613.4 billion to ¥306.0 billion for fiscal 2015,compared with ¥919.4 billion for fiscal 2014. The decrease was primarily attributable to the ¥158.9 billionincrease in dividends paid and the ¥356.9 billion increase in repurchase and reissuance of treasury stock. Inaddition, the increase in payments of debt exceeded the increase in proceeds from issuance of debt.
Total capital expenditures for property, plant and equipment, excluding vehicles and equipment on operatingleases, were ¥1,282.5 billion during fiscal 2016, an increase of 11.9% from the ¥1,146.3 billion in total capitalexpenditures during the prior fiscal year. This increase was due primarily to an increase in investments in Japanand Asia.
Total capital expenditures for vehicles and equipment on operating leases were ¥2,776.6 billion during fiscal2016, an increase of 25.6% from the ¥2,211.2 billion in total capital expenditures during the prior fiscal year.This increase was due primarily to an increase in investments in the financial services operations.
Toyota expects investments in property, plant and equipment, excluding vehicles and equipment onoperating leases, to be approximately ¥1,350.0 billion during fiscal 2017.
Cash and cash equivalents were ¥2,939.4 billion as of March 31, 2016. Most of Toyota’s cash and cashequivalents are held in Japanese yen or in U.S. dollars. In addition, time deposits were ¥1,032.0 billion andmarketable securities were ¥1,511.3 billion as of March 31, 2016.
Liquid assets, which Toyota defines as cash and cash equivalents, time deposits, marketable debt securitiesand its investment in monetary trust funds, increased during fiscal 2016 by ¥634.1 billion, or 6.4%, to¥10,570.2 billion.
Trade accounts and notes receivable, less allowance for doubtful accounts decreased during fiscal 2016 by¥108.5 billion, or 5.1%, to ¥2,000.1 billion. This decrease was due mainly to the fluctuations in foreign currencytranslation rates.
Inventories decreased during fiscal 2016 by ¥76.1 billion, or 3.6%, to ¥2,061.5 billion. This decrease wasdue mainly to the fluctuations in foreign currency translation rates.
Total finance receivables, net decreased during fiscal 2016 by ¥916.7 billion, or 5.9%, to ¥14,555.6 billion.This decrease was due mainly to the fluctuations in foreign currency translation rates. As of March 31, 2016,finance receivables were geographically distributed as follows: in North America 59.1%, in Asia 11.9%, inEurope 10.3%, in Japan 8.3% and in Other 10.4%.
Marketable securities and other securities investments, including those included in current assets, decreasedduring fiscal 2016 by ¥1,463.0 billion, or 14.0%, reflecting the redemptions of marketable securities and securityinvestments, and the fluctuations in foreign currency translation rates.
88
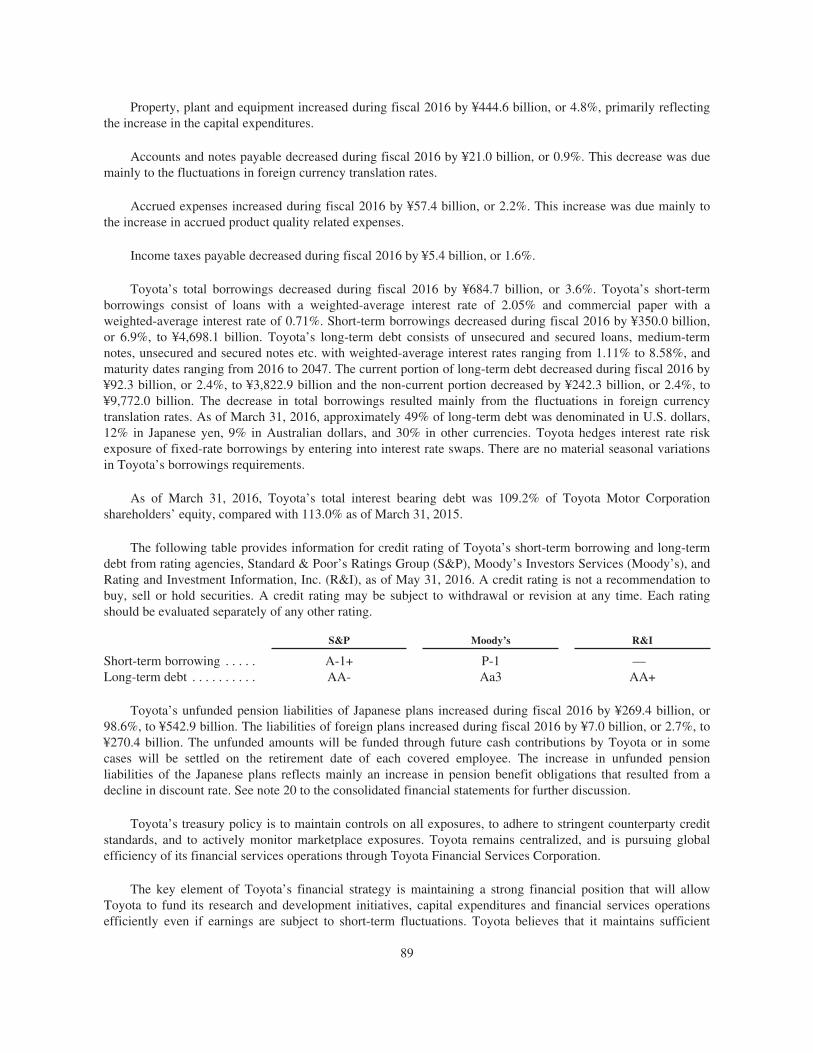
Property, plant and equipment increased during fiscal 2016 by ¥444.6 billion, or 4.8%, primarily reflectingthe increase in the capital expenditures.
Accounts and notes payable decreased during fiscal 2016 by ¥21.0 billion, or 0.9%. This decrease was duemainly to the fluctuations in foreign currency translation rates.
Accrued expenses increased during fiscal 2016 by ¥57.4 billion, or 2.2%. This increase was due mainly tothe increase in accrued product quality related expenses.
Income taxes payable decreased during fiscal 2016 by ¥5.4 billion, or 1.6%.
Toyota’s total borrowings decreased during fiscal 2016 by ¥684.7 billion, or 3.6%. Toyota’s short-termborrowings consist of loans with a weighted-average interest rate of 2.05% and commercial paper with aweighted-average interest rate of 0.71%. Short-term borrowings decreased during fiscal 2016 by ¥350.0 billion,or 6.9%, to ¥4,698.1 billion. Toyota’s long-term debt consists of unsecured and secured loans, medium-termnotes, unsecured and secured notes etc. with weighted-average interest rates ranging from 1.11% to 8.58%, andmaturity dates ranging from 2016 to 2047. The current portion of long-term debt decreased during fiscal 2016 by¥92.3 billion, or 2.4%, to ¥3,822.9 billion and the non-current portion decreased by ¥242.3 billion, or 2.4%, to¥9,772.0 billion. The decrease in total borrowings resulted mainly from the fluctuations in foreign currencytranslation rates. As of March 31, 2016, approximately 49% of long-term debt was denominated in U.S. dollars,12% in Japanese yen, 9% in Australian dollars, and 30% in other currencies. Toyota hedges interest rate riskexposure of fixed-rate borrowings by entering into interest rate swaps. There are no material seasonal variationsin Toyota’s borrowings requirements.
As of March 31, 2016, Toyota’s total interest bearing debt was 109.2% of Toyota Motor Corporationshareholders’ equity, compared with 113.0% as of March 31, 2015.
The following table provides information for credit rating of Toyota’s short-term borrowing and long-termdebt from rating agencies, Standard & Poor’s Ratings Group (S&P), Moody’s Investors Services (Moody’s), andRating and Investment Information, Inc. (R&I), as of May 31, 2016. A credit rating is not a recommendation tobuy, sell or hold securities. A credit rating may be subject to withdrawal or revision at any time. Each ratingshould be evaluated separately of any other rating.
S&P Moody’s R&I
Short-term borrowing . . . . . A-1+ P-1 —Long-term debt . . . . . . . . . . AA- Aa3 AA+
Toyota’s unfunded pension liabilities of Japanese plans increased during fiscal 2016 by ¥269.4 billion, or98.6%, to ¥542.9 billion. The liabilities of foreign plans increased during fiscal 2016 by ¥7.0 billion, or 2.7%, to¥270.4 billion. The unfunded amounts will be funded through future cash contributions by Toyota or in somecases will be settled on the retirement date of each covered employee. The increase in unfunded pensionliabilities of the Japanese plans reflects mainly an increase in pension benefit obligations that resulted from adecline in discount rate. See note 20 to the consolidated financial statements for further discussion.
Toyota’s treasury policy is to maintain controls on all exposures, to adhere to stringent counterparty creditstandards, and to actively monitor marketplace exposures. Toyota remains centralized, and is pursuing globalefficiency of its financial services operations through Toyota Financial Services Corporation.
The key element of Toyota’s financial strategy is maintaining a strong financial position that will allowToyota to fund its research and development initiatives, capital expenditures and financial services operationsefficiently even if earnings are subject to short-term fluctuations. Toyota believes that it maintains sufficient
89
liquidity for its present requirements and that by maintaining its high credit ratings, it will continue to be able toaccess funds from external sources in large amounts and at relatively low costs. Toyota’s ability to maintain itshigh credit ratings is subject to a number of factors, some of which are not within Toyota’s control. These factorsinclude general economic conditions in Japan and the other major markets in which Toyota does business, aswell as Toyota’s successful implementation of its business strategy.
5.C RESEARCH AND DEVELOPMENT, PATENTS AND LICENSES
Toyota’s research and development is dedicated to capturing the increasingly diverse and sophisticatedmarket through the development of attractive, affordable, high-quality products for customers worldwide. Theintellectual property that R&D generates is a vital management resource that Toyota utilizes and protects tomaximize its corporate value. For a more detailed discussion of the company’s research and developmentobjectives and policies, see “Information on the Company — Business Overview — Research andDevelopment.”
Toyota’s research and development expenditures were approximately ¥1,055.6 billion in fiscal 2016,¥1,004.5 billion in fiscal 2015 and ¥910.5 billion in fiscal 2014.
Toyota operates a global research and development organization with the primary goal of buildingautomobiles that meet the needs of customers in every region of the world. In Japan, research and developmentoperations are led by Toyota and Toyota Central Research & Development Laboratories, Inc., which worksclosely with Daihatsu Motor Co., Ltd., Hino Motors, Ltd., Toyota Auto Body Co., Ltd., Toyota Motor EastJapan, Inc., and many other Toyota group companies. Overseas, Toyota has a worldwide network of technicalcenters as well as design and motorsports research and development centers.
Toyota established Toyota Research Institute, Inc. in January 2016 to accelerate research and developmentof artificial intelligence technology, which has significant potential to support future industrial technologies.
90
The following table provides information on Toyota’s principal research and development facilities.
Facility Principal Activity
Japan
Toyota Technical Center . . . . . . . . . . . . . . . . Product planning, style, design and evaluation
Higashi-Fuji Technical Center . . . . . . . . . . . Advanced research and development
Tokyo Design Research & Laboratory . . . . . Research of advanced styling designs
Shibetsu Proving Ground . . . . . . . . . . . . . . . Vehicle testing and evaluation
Toyota Central R&D Labs., Inc. . . . . . . . . . . Basic research
United States
Toyota Motor Engineering andManufacturing North America, Inc. . . . . .
North American production and product planning,upper body planning, evaluation
Calty Design Research, Inc. . . . . . . . . . . . . . Design
Toyota Research Institute of North America(TRI-NA) . . . . . . . . . . . . . . . . . . . . . . . . .
Advanced research relating to “energy and environment,”“safety” and “mobility infrastructure”
Toyota Research Institute, Inc. . . . . . . . . . . . Research and development of artificial intelligencetechnology
Europe
Toyota Motor Europe NV/SA . . . . . . . . . . . . Upper body planning for European production, evaluationand advanced research
Toyota Europe Design DevelopmentS.A.R.L. . . . . . . . . . . . . . . . . . . . . . . . . . . Design
Toyota Motorsport GmbH . . . . . . . . . . . . . . Development of motor sports vehicles
Asia Pacific
Toyota Motor Asia Pacific Engineering andManufacturing Co., Ltd. . . . . . . . . . . . . . .
Upper body planning for Australian and Asian productionand evaluation
Toyota Technical Center Asia PacificAustralia Pty, Ltd.* . . . . . . . . . . . . . . . . . .
Upper body planning for Australian and Asian productionand evaluation
China
Toyota Motor Engineering andManufacturing (China) Co., Ltd. . . . . . . .
Research of new, low-energy vehicle technology, vehicleevaluation and quality assurance in China
FAW Toyota Research & Development Co.,Ltd . . . . . . . . . . . . . . . . . . . . . . . . . . . . . . . Design and evaluation of vehicles manufactured in China
GAC Toyota Motor Co., Ltd. R&DCenter . . . . . . . . . . . . . . . . . . . . . . . . . . . . Design and evaluation of vehicles manufactured in China
* Toyota Technical Center Asia Pacific Australia Pty, Ltd. is scheduled to be dissolved in September 2016.
Toyota reorganized its subsidiary and vehicle development partner Toyota Technical DevelopmentCorporation, integrating its vehicle development functions into Toyota in January 2016.
Toyota carefully analyzes patents and the need for patents in each area of research to formulate moreeffective research and development strategies. Toyota identifies research and development projects in which itshould acquire patents, and files relevant applications as necessary to help build a strong global patent portfolio.
In addition, Toyota wishes to contribute to sustainable mobility by promoting the spread of technologieswith environmental and safety benefits. This is why Toyota takes an open stance to patent licensing and grants
91
licenses when appropriate terms are met. For example, in March 2004, Toyota and Ford Motor Company enteredinto licensing agreements for patents related to hybrid systems and emissions purification. In addition, inMarch 2010, Toyota and Mazda Motor Corporation entered into a licensing agreement regarding the supply ofhybrid system technology.
Toyota does not consider any one group of patents or licenses to be so important that their expiration ortermination would materially affect Toyota’s business. For a further discussion of Toyota’s intellectual property,see “Information on the Company — Business Overview — Intellectual Property.”
5.D TREND INFORMATION
For a discussion of the trends that affect Toyota’s business and operating results, see “— Operating Results”and “— Liquidity and Capital Resources.”
5.E OFF-BALANCE SHEET ARRANGEMENTS
Toyota uses its securitization program as part of its funding through special purpose entities for its financialservices operations. Toyota is considered as the primary beneficiary of these special purpose entities andtherefore consolidates them. Toyota has not entered into any off-balance sheet securitization transactions duringfiscal 2016.
Lending Commitments
Credit Facilities with Credit Card Holders
Toyota’s financial services operations issue credit cards to customers. As customary for credit cardbusinesses, Toyota maintains credit facilities with holders of credit cards issued by Toyota. These facilities areused upon each holder’s requests up to the limits established on an individual holder’s basis. Although loansmade to customers through these facilities are not secured, for the purposes of minimizing credit risks and ofappropriately establishing credit limits for each individual credit card holder, Toyota employs its own riskmanagement policy which includes an analysis of information provided by financial institutions in alliance withToyota. Toyota periodically reviews and revises, as appropriate, these credit limits. Outstanding credit facilitieswith credit card holders were ¥218.5 billion as of March 31, 2016.
Credit Facilities with Dealers
Toyota’s financial services operations maintain credit facilities with dealers. These credit facilities may beused for business acquisitions, facilities refurbishment, real estate purchases, and working capital requirements.These loans are typically collateralized with liens on real estate, vehicle inventory, and/or other dealership assets,as appropriate. Toyota obtains a personal guarantee from the dealer or corporate guarantee from the dealershipwhen deemed prudent. Although the loans are typically collateralized or guaranteed, the value of the underlyingcollateral or guarantees may not be sufficient to cover Toyota’s exposure under such agreements. Toyotaevaluates the credit facilities according to the risks assumed in entering into the credit facility. Toyota’s financialservices operations also provide financing to various multi-franchise dealer organizations, referred to as dealergroups, often as part of a lending consortium, for wholesale inventory financing, business acquisitions, facilitiesrefurbishment, real estate purchases, and working capital requirements. Toyota’s outstanding credit facilities withdealers totaled ¥2,259.3 billion as of March 31, 2016.
Guarantees
Toyota enters into certain guarantee contracts with its dealers to guarantee customers’ payments of theirinstallment payables that arise from installment contracts between customers and Toyota dealers, as and when
92
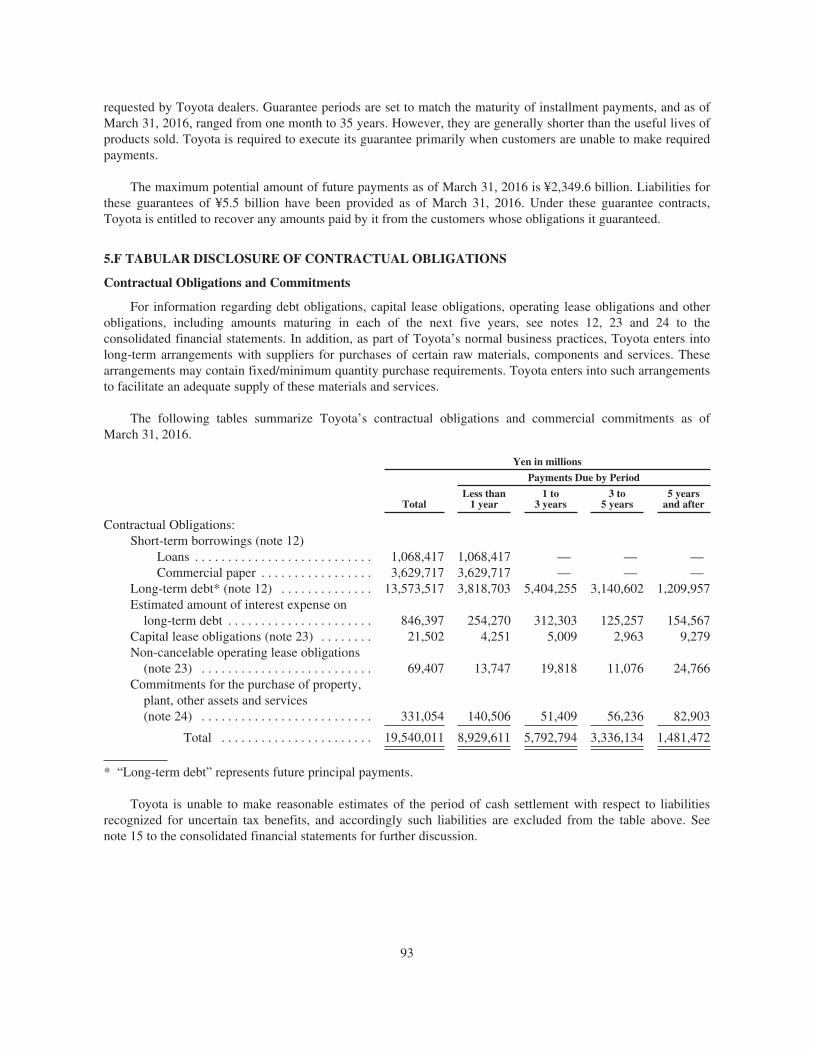
requested by Toyota dealers. Guarantee periods are set to match the maturity of installment payments, and as ofMarch 31, 2016, ranged from one month to 35 years. However, they are generally shorter than the useful lives ofproducts sold. Toyota is required to execute its guarantee primarily when customers are unable to make requiredpayments.
The maximum potential amount of future payments as of March 31, 2016 is ¥2,349.6 billion. Liabilities forthese guarantees of ¥5.5 billion have been provided as of March 31, 2016. Under these guarantee contracts,Toyota is entitled to recover any amounts paid by it from the customers whose obligations it guaranteed.
5.F TABULAR DISCLOSURE OF CONTRACTUAL OBLIGATIONS
Contractual Obligations and Commitments
For information regarding debt obligations, capital lease obligations, operating lease obligations and otherobligations, including amounts maturing in each of the next five years, see notes 12, 23 and 24 to theconsolidated financial statements. In addition, as part of Toyota’s normal business practices, Toyota enters intolong-term arrangements with suppliers for purchases of certain raw materials, components and services. Thesearrangements may contain fixed/minimum quantity purchase requirements. Toyota enters into such arrangementsto facilitate an adequate supply of these materials and services.
The following tables summarize Toyota’s contractual obligations and commercial commitments as ofMarch 31, 2016.
Yen in millions
Total
Payments Due by Period
Less than1 year
1 to3 years
3 to5 years
5 yearsand after
Contractual Obligations:Short-term borrowings (note 12)
Loans . . . . . . . . . . . . . . . . . . . . . . . . . . . 1,068,417 1,068,417 — — —Commercial paper . . . . . . . . . . . . . . . . . 3,629,717 3,629,717 — — —
Long-term debt* (note 12) . . . . . . . . . . . . . . 13,573,517 3,818,703 5,404,255 3,140,602 1,209,957Estimated amount of interest expense on
long-term debt . . . . . . . . . . . . . . . . . . . . . . 846,397 254,270 312,303 125,257 154,567Capital lease obligations (note 23) . . . . . . . . 21,502 4,251 5,009 2,963 9,279Non-cancelable operating lease obligations
(note 23) . . . . . . . . . . . . . . . . . . . . . . . . . . 69,407 13,747 19,818 11,076 24,766Commitments for the purchase of property,
plant, other assets and services(note 24) . . . . . . . . . . . . . . . . . . . . . . . . . . 331,054 140,506 51,409 56,236 82,903
Total . . . . . . . . . . . . . . . . . . . . . . . 19,540,011 8,929,611 5,792,794 3,336,134 1,481,472
* “Long-term debt” represents future principal payments.
Toyota is unable to make reasonable estimates of the period of cash settlement with respect to liabilitiesrecognized for uncertain tax benefits, and accordingly such liabilities are excluded from the table above. Seenote 15 to the consolidated financial statements for further discussion.
93
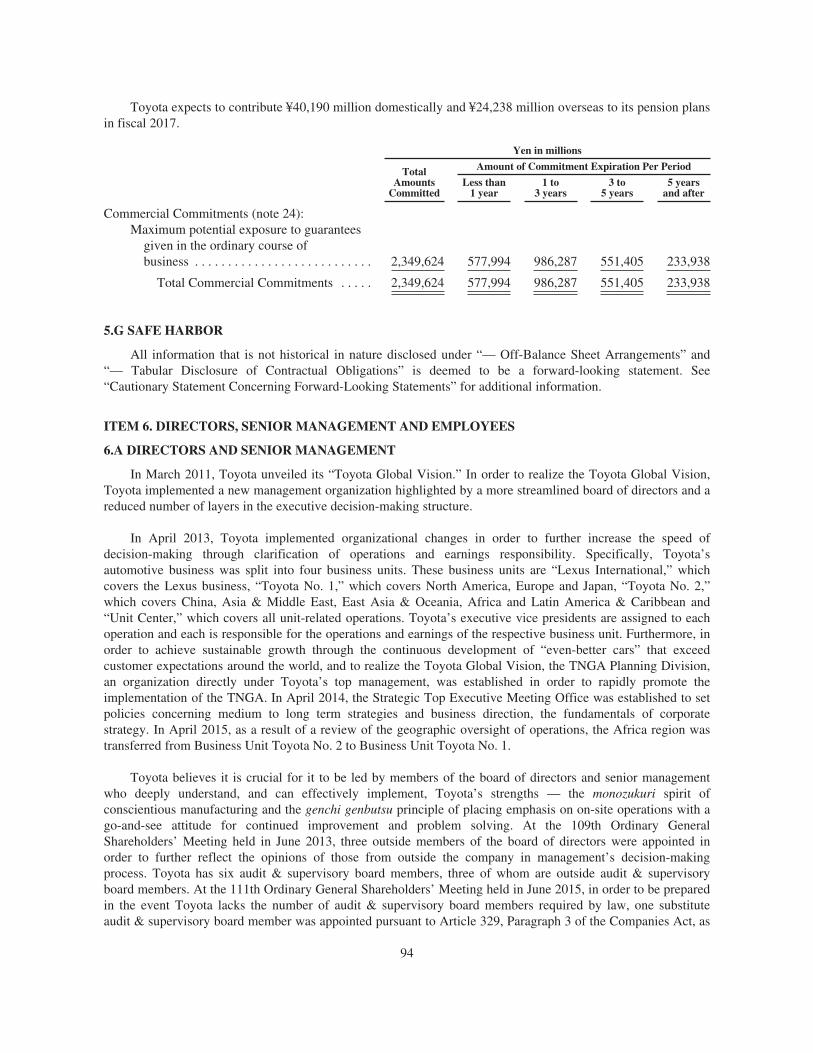
Toyota expects to contribute ¥40,190 million domestically and ¥24,238 million overseas to its pension plansin fiscal 2017.
Yen in millions
TotalAmounts
Committed
Amount of Commitment Expiration Per Period
Less than1 year
1 to3 years
3 to5 years
5 yearsand after
Commercial Commitments (note 24):Maximum potential exposure to guarantees
given in the ordinary course ofbusiness . . . . . . . . . . . . . . . . . . . . . . . . . . . 2,349,624 577,994 986,287 551,405 233,938
Total Commercial Commitments . . . . . 2,349,624 577,994 986,287 551,405 233,938
5.G SAFE HARBOR
All information that is not historical in nature disclosed under “— Off-Balance Sheet Arrangements” and“— Tabular Disclosure of Contractual Obligations” is deemed to be a forward-looking statement. See“Cautionary Statement Concerning Forward-Looking Statements” for additional information.
ITEM 6. DIRECTORS, SENIOR MANAGEMENT AND EMPLOYEES
6.A DIRECTORS AND SENIOR MANAGEMENT
In March 2011, Toyota unveiled its “Toyota Global Vision.” In order to realize the Toyota Global Vision,Toyota implemented a new management organization highlighted by a more streamlined board of directors and areduced number of layers in the executive decision-making structure.
In April 2013, Toyota implemented organizational changes in order to further increase the speed ofdecision-making through clarification of operations and earnings responsibility. Specifically, Toyota’sautomotive business was split into four business units. These business units are “Lexus International,” whichcovers the Lexus business, “Toyota No. 1,” which covers North America, Europe and Japan, “Toyota No. 2,”which covers China, Asia & Middle East, East Asia & Oceania, Africa and Latin America & Caribbean and“Unit Center,” which covers all unit-related operations. Toyota’s executive vice presidents are assigned to eachoperation and each is responsible for the operations and earnings of the respective business unit. Furthermore, inorder to achieve sustainable growth through the continuous development of “even-better cars” that exceedcustomer expectations around the world, and to realize the Toyota Global Vision, the TNGA Planning Division,an organization directly under Toyota’s top management, was established in order to rapidly promote theimplementation of the TNGA. In April 2014, the Strategic Top Executive Meeting Office was established to setpolicies concerning medium to long term strategies and business direction, the fundamentals of corporatestrategy. In April 2015, as a result of a review of the geographic oversight of operations, the Africa region wastransferred from Business Unit Toyota No. 2 to Business Unit Toyota No. 1.
Toyota believes it is crucial for it to be led by members of the board of directors and senior managementwho deeply understand, and can effectively implement, Toyota’s strengths — the monozukuri spirit ofconscientious manufacturing and the genchi genbutsu principle of placing emphasis on on-site operations with ago-and-see attitude for continued improvement and problem solving. At the 109th Ordinary GeneralShareholders’ Meeting held in June 2013, three outside members of the board of directors were appointed inorder to further reflect the opinions of those from outside the company in management’s decision-makingprocess. Toyota has six audit & supervisory board members, three of whom are outside audit & supervisoryboard members. At the 111th Ordinary General Shareholders’ Meeting held in June 2015, in order to be preparedin the event Toyota lacks the number of audit & supervisory board members required by law, one substituteaudit & supervisory board member was appointed pursuant to Article 329, Paragraph 3 of the Companies Act, as
94
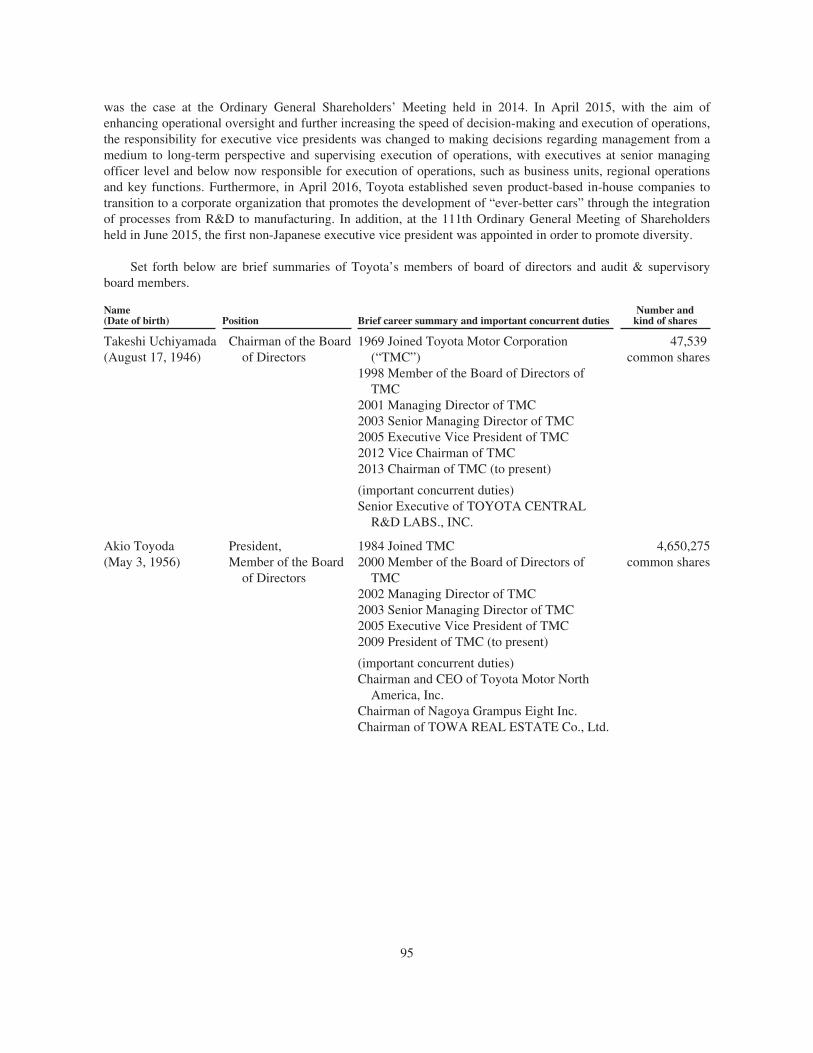
was the case at the Ordinary General Shareholders’ Meeting held in 2014. In April 2015, with the aim ofenhancing operational oversight and further increasing the speed of decision-making and execution of operations,the responsibility for executive vice presidents was changed to making decisions regarding management from amedium to long-term perspective and supervising execution of operations, with executives at senior managingofficer level and below now responsible for execution of operations, such as business units, regional operationsand key functions. Furthermore, in April 2016, Toyota established seven product-based in-house companies totransition to a corporate organization that promotes the development of “ever-better cars” through the integrationof processes from R&D to manufacturing. In addition, at the 111th Ordinary General Meeting of Shareholdersheld in June 2015, the first non-Japanese executive vice president was appointed in order to promote diversity.
Set forth below are brief summaries of Toyota’s members of board of directors and audit & supervisoryboard members.
Name(Date of birth) Position Brief career summary and important concurrent duties
Number andkind of shares
Takeshi Uchiyamada(August 17, 1946)
Chairman of the Boardof Directors
1969 Joined Toyota Motor Corporation(“TMC”)
1998 Member of the Board of Directors ofTMC
2001 Managing Director of TMC2003 Senior Managing Director of TMC2005 Executive Vice President of TMC2012 Vice Chairman of TMC2013 Chairman of TMC (to present)
(important concurrent duties)Senior Executive of TOYOTA CENTRAL
R&D LABS., INC.
47,539common shares
Akio Toyoda(May 3, 1956)
President,Member of the Board
of Directors
1984 Joined TMC2000 Member of the Board of Directors of
TMC2002 Managing Director of TMC2003 Senior Managing Director of TMC2005 Executive Vice President of TMC2009 President of TMC (to present)
(important concurrent duties)Chairman and CEO of Toyota Motor North
America, Inc.Chairman of Nagoya Grampus Eight Inc.Chairman of TOWA REAL ESTATE Co., Ltd.
4,650,275common shares
95
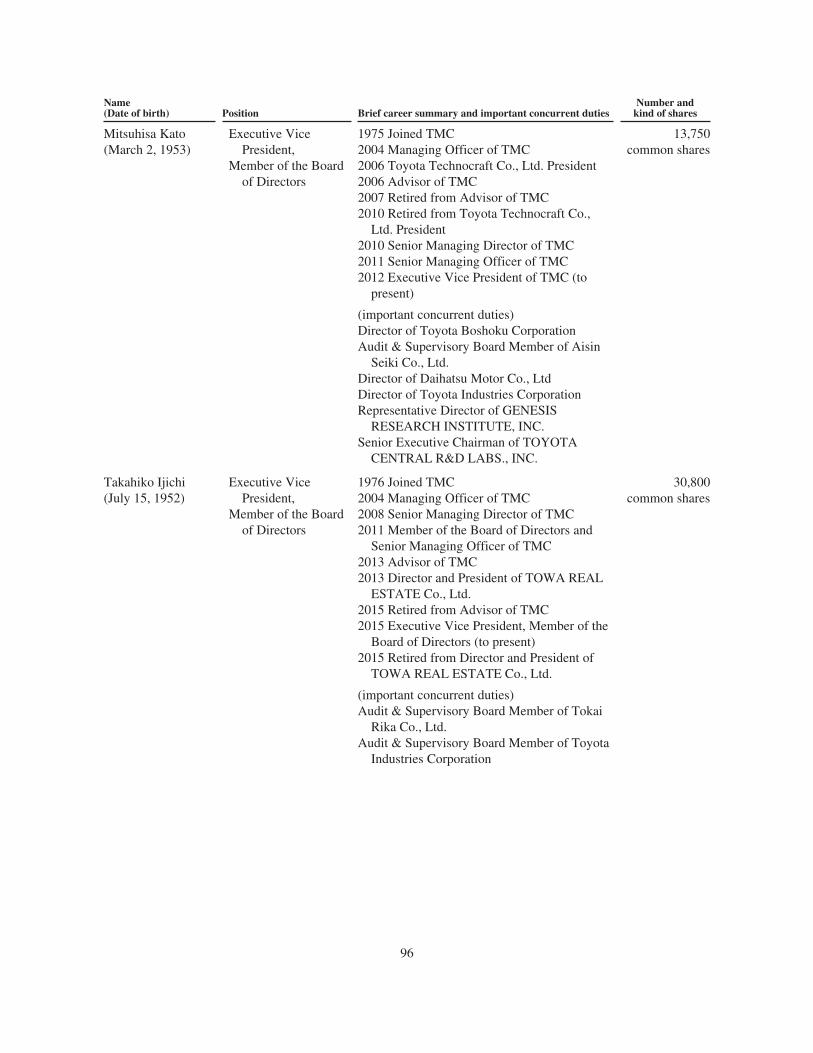
Name(Date of birth) Position Brief career summary and important concurrent duties
Number andkind of shares
Mitsuhisa Kato(March 2, 1953)
Executive VicePresident,
Member of the Boardof Directors
1975 Joined TMC2004 Managing Officer of TMC2006 Toyota Technocraft Co., Ltd. President2006 Advisor of TMC2007 Retired from Advisor of TMC2010 Retired from Toyota Technocraft Co.,
Ltd. President2010 Senior Managing Director of TMC2011 Senior Managing Officer of TMC2012 Executive Vice President of TMC (to
present)
(important concurrent duties)Director of Toyota Boshoku CorporationAudit & Supervisory Board Member of Aisin
Seiki Co., Ltd.Director of Daihatsu Motor Co., LtdDirector of Toyota Industries CorporationRepresentative Director of GENESIS
RESEARCH INSTITUTE, INC.Senior Executive Chairman of TOYOTA
CENTRAL R&D LABS., INC.
13,750common shares
Takahiko Ijichi(July 15, 1952)
Executive VicePresident,
Member of the Boardof Directors
1976 Joined TMC2004 Managing Officer of TMC2008 Senior Managing Director of TMC2011 Member of the Board of Directors and
Senior Managing Officer of TMC2013 Advisor of TMC2013 Director and President of TOWA REAL
ESTATE Co., Ltd.2015 Retired from Advisor of TMC2015 Executive Vice President, Member of the
Board of Directors (to present)2015 Retired from Director and President of
TOWA REAL ESTATE Co., Ltd.
(important concurrent duties)Audit & Supervisory Board Member of Tokai
Rika Co., Ltd.Audit & Supervisory Board Member of Toyota
Industries Corporation
30,800common shares
96
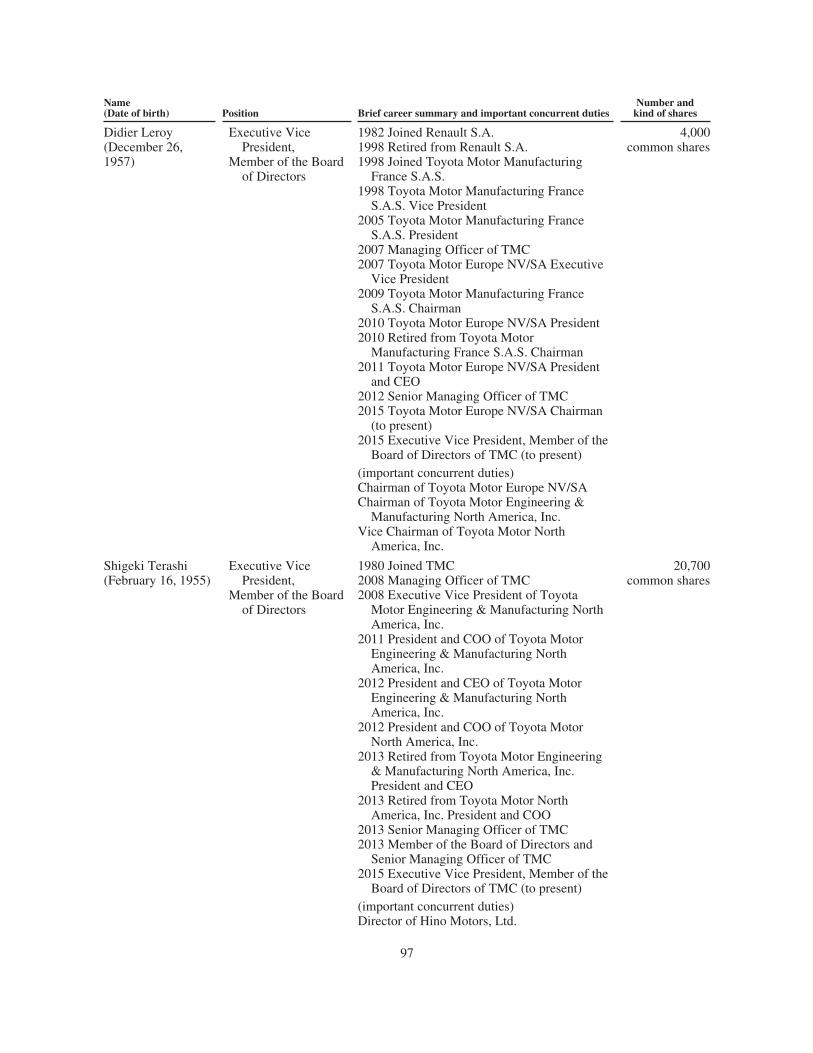
Name(Date of birth) Position Brief career summary and important concurrent duties
Number andkind of shares
Didier Leroy(December 26,1957)
Executive VicePresident,
Member of the Boardof Directors
1982 Joined Renault S.A.1998 Retired from Renault S.A.1998 Joined Toyota Motor Manufacturing
France S.A.S.1998 Toyota Motor Manufacturing France
S.A.S. Vice President2005 Toyota Motor Manufacturing France
S.A.S. President2007 Managing Officer of TMC2007 Toyota Motor Europe NV/SA Executive
Vice President2009 Toyota Motor Manufacturing France
S.A.S. Chairman2010 Toyota Motor Europe NV/SA President2010 Retired from Toyota Motor
Manufacturing France S.A.S. Chairman2011 Toyota Motor Europe NV/SA President
and CEO2012 Senior Managing Officer of TMC2015 Toyota Motor Europe NV/SA Chairman
(to present)2015 Executive Vice President, Member of the
Board of Directors of TMC (to present)(important concurrent duties)Chairman of Toyota Motor Europe NV/SAChairman of Toyota Motor Engineering &
Manufacturing North America, Inc.Vice Chairman of Toyota Motor North
America, Inc.
4,000common shares
Shigeki Terashi(February 16, 1955)
Executive VicePresident,
Member of the Boardof Directors
1980 Joined TMC2008 Managing Officer of TMC2008 Executive Vice President of Toyota
Motor Engineering & Manufacturing NorthAmerica, Inc.
2011 President and COO of Toyota MotorEngineering & Manufacturing NorthAmerica, Inc.
2012 President and CEO of Toyota MotorEngineering & Manufacturing NorthAmerica, Inc.
2012 President and COO of Toyota MotorNorth America, Inc.
2013 Retired from Toyota Motor Engineering& Manufacturing North America, Inc.President and CEO
2013 Retired from Toyota Motor NorthAmerica, Inc. President and COO
2013 Senior Managing Officer of TMC2013 Member of the Board of Directors and
Senior Managing Officer of TMC2015 Executive Vice President, Member of the
Board of Directors of TMC (to present)(important concurrent duties)Director of Hino Motors, Ltd.
20,700common shares
97
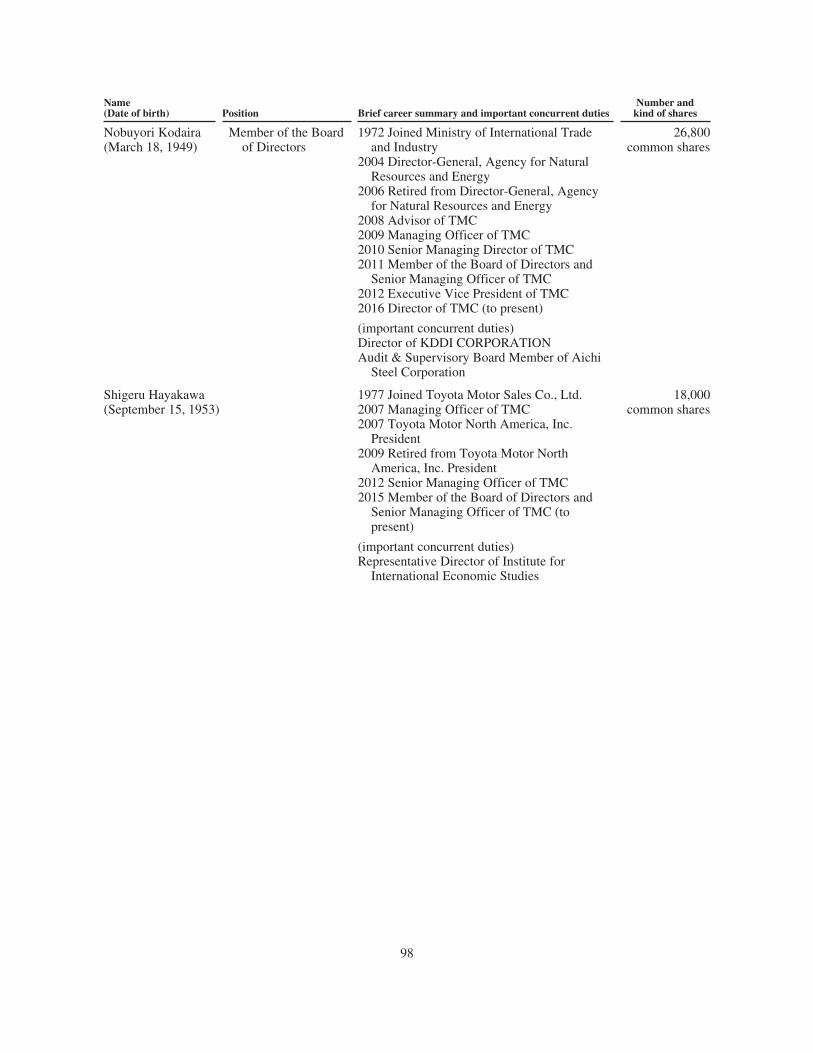
Name(Date of birth) Position Brief career summary and important concurrent duties
Number andkind of shares
Nobuyori Kodaira(March 18, 1949)
Member of the Boardof Directors
1972 Joined Ministry of International Tradeand Industry
2004 Director-General, Agency for NaturalResources and Energy
2006 Retired from Director-General, Agencyfor Natural Resources and Energy
2008 Advisor of TMC2009 Managing Officer of TMC2010 Senior Managing Director of TMC2011 Member of the Board of Directors and
Senior Managing Officer of TMC2012 Executive Vice President of TMC2016 Director of TMC (to present)
(important concurrent duties)Director of KDDI CORPORATIONAudit & Supervisory Board Member of Aichi
Steel Corporation
26,800common shares
Shigeru Hayakawa(September 15, 1953)
1977 Joined Toyota Motor Sales Co., Ltd.2007 Managing Officer of TMC2007 Toyota Motor North America, Inc.
President2009 Retired from Toyota Motor North
America, Inc. President2012 Senior Managing Officer of TMC2015 Member of the Board of Directors and
Senior Managing Officer of TMC (topresent)
(important concurrent duties)Representative Director of Institute for
International Economic Studies
18,000common shares
98
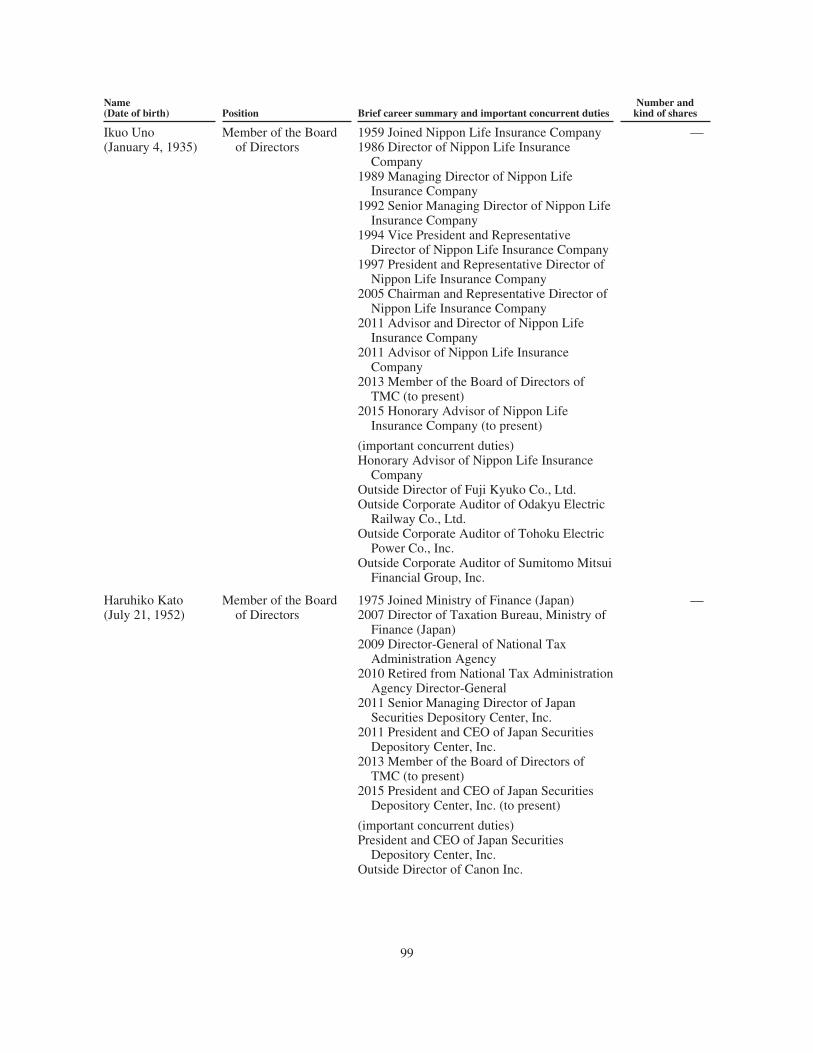
Name(Date of birth) Position Brief career summary and important concurrent duties
Number andkind of shares
Ikuo Uno(January 4, 1935)
Member of the Boardof Directors
1959 Joined Nippon Life Insurance Company1986 Director of Nippon Life Insurance
Company1989 Managing Director of Nippon Life
Insurance Company1992 Senior Managing Director of Nippon Life
Insurance Company1994 Vice President and Representative
Director of Nippon Life Insurance Company1997 President and Representative Director of
Nippon Life Insurance Company2005 Chairman and Representative Director of
Nippon Life Insurance Company2011 Advisor and Director of Nippon Life
Insurance Company2011 Advisor of Nippon Life Insurance
Company2013 Member of the Board of Directors of
TMC (to present)2015 Honorary Advisor of Nippon Life
Insurance Company (to present)
(important concurrent duties)Honorary Advisor of Nippon Life Insurance
CompanyOutside Director of Fuji Kyuko Co., Ltd.Outside Corporate Auditor of Odakyu Electric
Railway Co., Ltd.Outside Corporate Auditor of Tohoku Electric
Power Co., Inc.Outside Corporate Auditor of Sumitomo Mitsui
Financial Group, Inc.
—
Haruhiko Kato(July 21, 1952)
Member of the Boardof Directors
1975 Joined Ministry of Finance (Japan)2007 Director of Taxation Bureau, Ministry of
Finance (Japan)2009 Director-General of National Tax
Administration Agency2010 Retired from National Tax Administration
Agency Director-General2011 Senior Managing Director of Japan
Securities Depository Center, Inc.2011 President and CEO of Japan Securities
Depository Center, Inc.2013 Member of the Board of Directors of
TMC (to present)2015 President and CEO of Japan Securities
Depository Center, Inc. (to present)
(important concurrent duties)President and CEO of Japan Securities
Depository Center, Inc.Outside Director of Canon Inc.
—
99
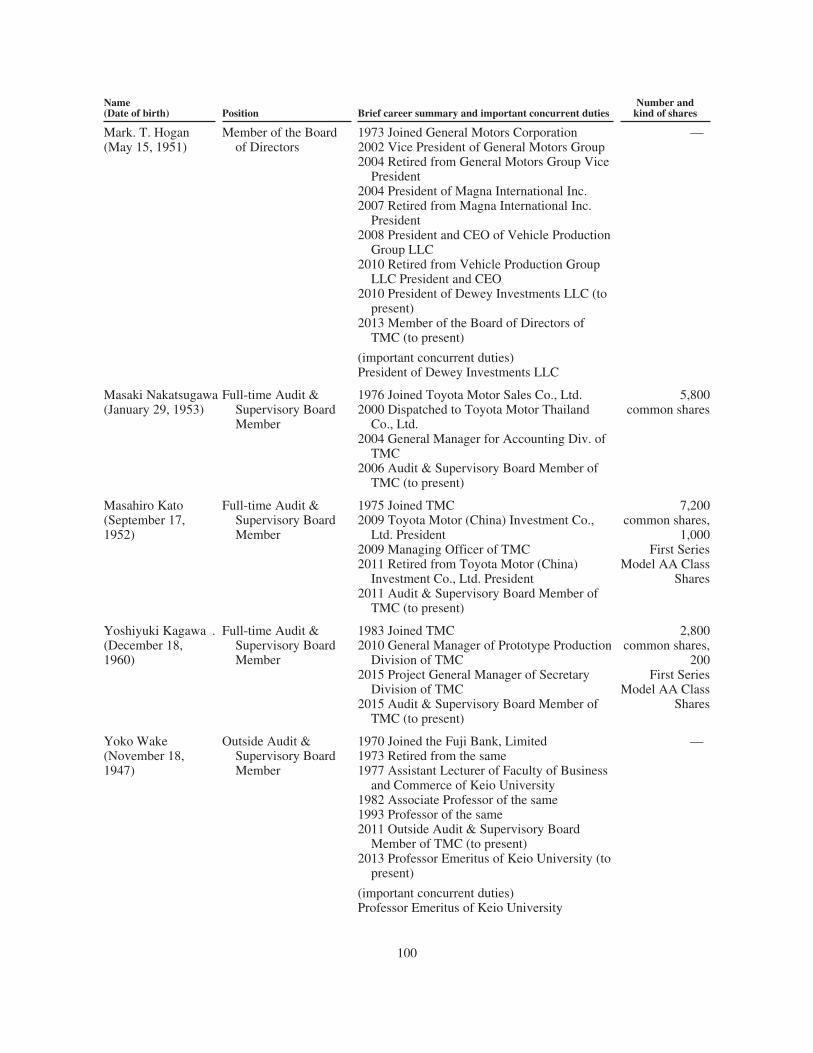
Name(Date of birth) Position Brief career summary and important concurrent duties
Number andkind of shares
Mark. T. Hogan(May 15, 1951)
Member of the Boardof Directors
1973 Joined General Motors Corporation2002 Vice President of General Motors Group2004 Retired from General Motors Group Vice
President2004 President of Magna International Inc.2007 Retired from Magna International Inc.
President2008 President and CEO of Vehicle Production
Group LLC2010 Retired from Vehicle Production Group
LLC President and CEO2010 President of Dewey Investments LLC (to
present)2013 Member of the Board of Directors of
TMC (to present)
(important concurrent duties)President of Dewey Investments LLC
—
Masaki Nakatsugawa(January 29, 1953)
Full-time Audit &Supervisory BoardMember
1976 Joined Toyota Motor Sales Co., Ltd.2000 Dispatched to Toyota Motor Thailand
Co., Ltd.2004 General Manager for Accounting Div. of
TMC2006 Audit & Supervisory Board Member of
TMC (to present)
5,800common shares
Masahiro Kato(September 17,1952)
Full-time Audit &Supervisory BoardMember
1975 Joined TMC2009 Toyota Motor (China) Investment Co.,
Ltd. President2009 Managing Officer of TMC2011 Retired from Toyota Motor (China)
Investment Co., Ltd. President2011 Audit & Supervisory Board Member of
TMC (to present)
7,200common shares,
1,000First Series
Model AA ClassShares
Yoshiyuki Kagawa .(December 18,1960)
Full-time Audit &Supervisory BoardMember
1983 Joined TMC2010 General Manager of Prototype Production
Division of TMC2015 Project General Manager of Secretary
Division of TMC2015 Audit & Supervisory Board Member of
TMC (to present)
2,800common shares,
200First Series
Model AA ClassShares
Yoko Wake(November 18,1947)
Outside Audit &Supervisory BoardMember
1970 Joined the Fuji Bank, Limited1973 Retired from the same1977 Assistant Lecturer of Faculty of Business
and Commerce of Keio University1982 Associate Professor of the same1993 Professor of the same2011 Outside Audit & Supervisory Board
Member of TMC (to present)2013 Professor Emeritus of Keio University (to
present)
(important concurrent duties)Professor Emeritus of Keio University
—
100
Name(Date of birth) Position Brief career summary and important concurrent duties
Number andkind of shares
Teisuke Kitayama(October 26, 1946)
Outside Audit &Supervisory BoardMember
1969 Joined Mitsui Bank1997 Director of The Sakura Bank, Limited1999 Executive Officer of the same2000 Managing Executive Officer of the same2000 Managing Director and Managing
Executive Officer of the same2001 Managing Director and Managing
Executive Officer of Sumitomo MitsuiBanking Corporation
2003 Senior Managing Director and SeniorExecutive Officer of the same
2003 Senior Executive Officer of SumitomoMitsui Financial Group, Inc.
2004 Vice President and Executive Officer ofthe same
2004 Retired from Director of SumitomoMitsui Banking Corporation
2004 Vice President and Director of SumitomoMitsui Financial Group, Inc.
2005 President and Director of the same2005 Chairman and Director of Sumitomo
Mitsui Banking Corporation2011 Retired from Director of Sumitomo
Mitsui Financial Group, Inc.2014 Outside Audit & Supervisory Board
Member of TMC (to present)
(important concurrent duties)Chairman of the Board of Sumitomo Mitsui
Banking CorporationOutside Director of FUJIFILM Holdings
Corporation
—
Hiroshi Ozu(July 21, 1949)
Outside Audit &Supervisory BoardMember
2012 Prosecutor-General2014 Retired from Prosecutor-General2014 Registered as Attorney2015 Outside Audit & Supervisory Board
Member of TMC (to present)
(important concurrent duties)AttorneyOutside Corporate Auditor of Mitsui & Co.,
Ltd.
—
None of the persons listed above was selected as member of board of directors, audit & supervisory boardmember or member of senior management pursuant to an arrangement or understanding with Toyota’s majorshareholders, customers, suppliers or others.
101
Set forth below is a brief summary of Toyota’s substitute audit & supervisory board member.
Name(Date of birth) Position Brief career summary and important concurrent duties
Number andkind of shares
Ryuji Sakai(August 7, 1957)
— 1985 Registered as attorney and joinedNagashima & Ohno
1990 Wilson Sonsini Goodrich & Rosati1995 Partner of Nagashima & Ohno2000 Partner of Nagashima Ohno & Tsunematsu
(to present)
(important concurrent duties)AttorneyOutside Audit & Supervisory Board Member of
Kobayashi Pharmaceutical Co., Ltd.Outside Audit & Supervisory Board Member of
Tokyo Electron Limited
—
6.B COMPENSATION
The aggregate amount of remuneration, including bonuses but excluding stock options, accrued for allmembers of the board of directors and audit & supervisory board members as a group by Toyota for services inall capacities during fiscal 2016 was approximately ¥2,333 million. Members of the Board of Directors of ToyotaMotor Corporation receive year-end bonuses, the aggregate amount of which is approved at Toyota MotorCorporation’s ordinary general shareholders’ meeting and is based on Toyota Motor Corporation’s financialperformance for the fiscal year. The amounts of the bonuses paid to individual members of the board of directorsand audit & supervisory board members are then determined based upon discussions at a meeting of ToyotaMotor Corporation’s board of directors and the meeting of audit & supervisory board members.
In addition to the above form of compensation, Toyota enacted stock option plans every year from 2008 until2010. Under the 2008 plan, Toyota issued to its members of the board of directors and audit & supervisory boardmembers stock acquisition rights to purchase 335,000 shares of common stock at an exercise price of ¥4,726 andwith an expiration date of July 31, 2016. Under the 2009 plan, Toyota issued to its members of the board ofdirectors and audit & supervisory board members stock acquisition rights to purchase 440,000 shares of commonstock at an exercise price of ¥4,193 and with an expiration date of July 31, 2017. Under the 2010 plan, Toyotaissued to its members of the board of directors stock acquisition rights to purchase 400,000 shares of common stockat an exercise price of ¥3,183 and with an expiration date of July 31, 2018. See “Share Ownership — StockOptions” for a more detailed discussion of Toyota’s stock option plans.
Toyota’s Annual Securities Report filed with the Kanto Local Bureau of Finance on June 24, 2016,contained the following information concerning compensation in fiscal 2016 on a consolidated basis for membersof the board of directors and audit & supervisory board members whose total compensation exceeded¥100 million during such period:
- Takeshi Uchiyamada, Member of the Board of Directors: ¥201 million (¥102 million in base compensationand ¥98 million in bonus)
- Akio Toyoda, Member of the Board of Directors: ¥351 million (¥102 million in base compensation and¥248 million in bonus)
- Nobuyori Kodaira, Member of the Board of Directors: ¥125 million (¥64 million in base compensation and¥61 million in bonus)
102
- Mitsuhisa Kato, Member of the Board of Directors: ¥144 million (¥83 million in base compensation and¥61 million in bonus)
- Seiichi Sudo, Member of the Board of Directors: ¥125 million (¥64 million in base compensation and¥61 million in bonus)
- Takahiko Ijichi, Member of the Board of Directors: ¥100 million (¥48 million in base compensation and¥52 million in bonus)
- Didier Leroy, Member of the Board of Directors: ¥696 million (¥163 million in base compensation and¥533 million in bonus)
- Shigeki Terashi, Member of the Board of Directors: ¥117 million (¥60 million in base compensation and¥57 million in bonus)
The amounts above were recorded as expenses in fiscal 2016.
6.C BOARD PRACTICES
Toyota’s articles of incorporation provide for a board of directors of not more than 20 members and for notmore than seven audit & supervisory board members. Shareholders elect the members of the board of directorsand audit & supervisory board members at the general shareholders’ meeting. The normal term of office of amember of the board of directors is one year and of an audit & supervisory board member is four years. Membersof the board of directors and audit & supervisory board members may serve any number of consecutive terms.
The board of directors may appoint one Chairman of the Board of Directors and one President, as well asone or more Vice Chairmen of the Board and Executive Vice Presidents. The board of directors elects, pursuantto its resolutions, one or more Representative Directors. Each Representative Director represents Toyotagenerally in the conduct of its affairs. The board of directors has the ultimate responsibility for the administrationof Toyota’s affairs. None of Toyota’s members of the board of directors is party to a service contract with Toyotaor any of its subsidiaries that provides for benefits upon termination of employment.
Under the Companies Act and Toyota’s articles of incorporation, Toyota may, by a resolution of its board ofdirectors, exempt members of the board of directors (including former members of the board of directors) fromtheir liabilities to Toyota arising in connection with their failure to execute their duties within the limitsstipulated by laws and regulations. In addition, Toyota may enter into a liability limitation agreement with eachmember of the board of directors (excluding executive members of the board of directors, among others) whichlimits the maximum amount of their liabilities owed to Toyota arising in connection with their failure to executetheir duties to an amount equal to the minimum liability limit amount prescribed in the laws and regulations.
Under the Companies Act, Toyota must have at least three audit & supervisory board members. At least halfof the audit & supervisory board members are required to be an “outside” audit & supervisory board member,which is any person who satisfies all of the following requirements:
(a) the person has never been a member of the board of directors, accounting counselor (in the case that anaccounting counselor is a legal entity, an employee of such entity who is in charge of its affairs), executiveofficer, manager or employee of Toyota or its subsidiaries during the 10 year period before becoming an outsideaudit & supervisory board member;
(b) if the person was an audit & supervisory board member of Toyota or any of its subsidiaries at any timeduring the 10 year period before becoming an outside audit & supervisory board member, such person has notbeen a member of the board of directors, accounting counselor (in the case that an accounting counselor is a legal
103
entity, an employee of such entity who is in charge of its affairs), executive officer, manager or employee ofToyota or any of its subsidiaries during the 10 year period before becoming an audit & supervisory boardmember of Toyota or any of its subsidiaries; and
(c) the person is not a spouse or relative within the second degree of kinship of any member of the board ofdirectors or manager or other key employee of Toyota.
The audit & supervisory board members may not at the same time be a member of the board of directors,accounting counselor (in case that an accounting counselor is a judicial person, a member of such judicial personwho is in charge of its affairs), executive officers, general managers or employees of Toyota or any of itssubsidiaries. Together, these audit & supervisory board members form the audit & supervisory board. Theaudit & supervisory board members have the duty to examine the financial statements and business reports whichare submitted by the board of directors to the general shareholders’ meeting. The audit & supervisory boardmembers also monitor the administration of Toyota’s affairs by the members of the board of directors. Audit &supervisory board members are not required to be, and Toyota’s audit & supervisory board members are not,certified public accountants. They are required to participate in meetings of the board of directors but are notentitled to vote.
Under the Companies Act and Toyota’s articles of incorporation, Toyota may, by a resolution of its board ofdirectors, exempt audit & supervisory board members (including former audit & supervisory board members)from their liabilities to Toyota arising in connection with their failure to execute their duties within the limitsstipulated by laws and regulations. In addition, Toyota may enter into a liability limitation agreement with eachaudit & supervisory board member which limits the maximum amount of their liabilities owed to Toyota arisingin connection with their failure to execute their duties to an amount equal to the minimum liability limit amountprescribed in the laws and regulations.
Toyota does not have a remuneration committee. However, members of Toyota’s “Executive CompensationMeeting,” consisting of the Chairman, President, Executive Vice President in charge of human resources and anoutside director, discuss recommendations to the board of directors concerning remuneration for members of theboard of directors.
6.D EMPLOYEES
The total number of Toyota employees, on a consolidated basis, was 348,877 as of March 31, 2016, 344,109as of March 31, 2015 and 338,875 as of March 31, 2014. The following tables set forth a breakdown of personsemployed by business segment and by geographic location as of March 31, 2016.
SegmentNumber ofEmployees Location
Number ofEmployees
Automotive . . . . . . . . . . . . . . . . . . . . . . . . . . 310,944 Japan . . . . . . . . . . . . . . . . . . . . . . . . . . . . . 198,745Financial services . . . . . . . . . . . . . . . . . . . . . 9,777 North America . . . . . . . . . . . . . . . . . . . . . . 45,475All other . . . . . . . . . . . . . . . . . . . . . . . . . . . . . 23,075 Europe . . . . . . . . . . . . . . . . . . . . . . . . . . . . 18,866Unallocated . . . . . . . . . . . . . . . . . . . . . . . . . . 5,081 Asia . . . . . . . . . . . . . . . . . . . . . . . . . . . . . . 62,424
Other* . . . . . . . . . . . . . . . . . . . . . . . . . . . . 23,367
Total . . . . . . . . . . . . . . . . . . . . . . . . . . . . . . . 348,877 Total . . . . . . . . . . . . . . . . . . . . . . . . . . . . . 348,877
* “Other” consists of Central and South America,Oceania, Africa and the Middle East.
Most regular employees of Toyota Motor Corporation and its consolidated subsidiaries in Japan, other thanmanagement, are required to become members of the labor unions that comprise the Federation of All ToyotaWorkers’ Unions. Approximately 86% of Toyota Motor Corporation’s regular employees in Japan are membersof this union.
104
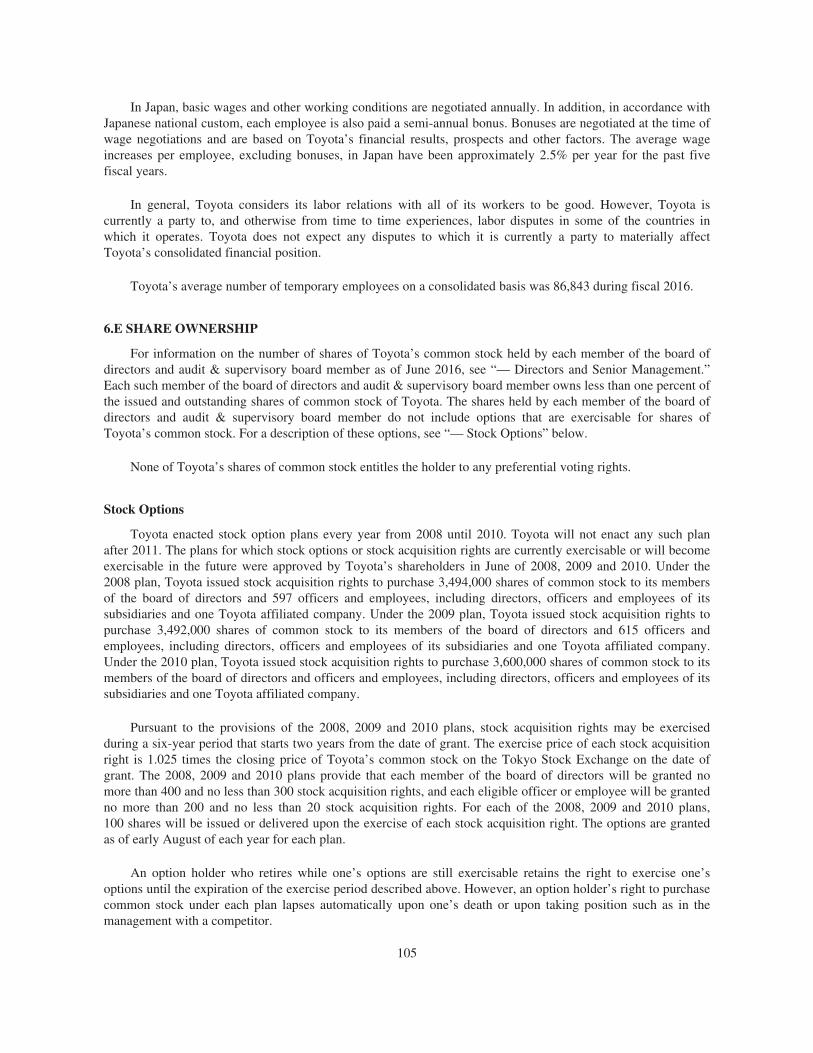
In Japan, basic wages and other working conditions are negotiated annually. In addition, in accordance withJapanese national custom, each employee is also paid a semi-annual bonus. Bonuses are negotiated at the time ofwage negotiations and are based on Toyota’s financial results, prospects and other factors. The average wageincreases per employee, excluding bonuses, in Japan have been approximately 2.5% per year for the past fivefiscal years.
In general, Toyota considers its labor relations with all of its workers to be good. However, Toyota iscurrently a party to, and otherwise from time to time experiences, labor disputes in some of the countries inwhich it operates. Toyota does not expect any disputes to which it is currently a party to materially affectToyota’s consolidated financial position.
Toyota’s average number of temporary employees on a consolidated basis was 86,843 during fiscal 2016.
6.E SHARE OWNERSHIP
For information on the number of shares of Toyota’s common stock held by each member of the board ofdirectors and audit & supervisory board member as of June 2016, see “— Directors and Senior Management.”Each such member of the board of directors and audit & supervisory board member owns less than one percent ofthe issued and outstanding shares of common stock of Toyota. The shares held by each member of the board ofdirectors and audit & supervisory board member do not include options that are exercisable for shares ofToyota’s common stock. For a description of these options, see “— Stock Options” below.
None of Toyota’s shares of common stock entitles the holder to any preferential voting rights.
Stock Options
Toyota enacted stock option plans every year from 2008 until 2010. Toyota will not enact any such planafter 2011. The plans for which stock options or stock acquisition rights are currently exercisable or will becomeexercisable in the future were approved by Toyota’s shareholders in June of 2008, 2009 and 2010. Under the2008 plan, Toyota issued stock acquisition rights to purchase 3,494,000 shares of common stock to its membersof the board of directors and 597 officers and employees, including directors, officers and employees of itssubsidiaries and one Toyota affiliated company. Under the 2009 plan, Toyota issued stock acquisition rights topurchase 3,492,000 shares of common stock to its members of the board of directors and 615 officers andemployees, including directors, officers and employees of its subsidiaries and one Toyota affiliated company.Under the 2010 plan, Toyota issued stock acquisition rights to purchase 3,600,000 shares of common stock to itsmembers of the board of directors and officers and employees, including directors, officers and employees of itssubsidiaries and one Toyota affiliated company.
Pursuant to the provisions of the 2008, 2009 and 2010 plans, stock acquisition rights may be exercisedduring a six-year period that starts two years from the date of grant. The exercise price of each stock acquisitionright is 1.025 times the closing price of Toyota’s common stock on the Tokyo Stock Exchange on the date ofgrant. The 2008, 2009 and 2010 plans provide that each member of the board of directors will be granted nomore than 400 and no less than 300 stock acquisition rights, and each eligible officer or employee will be grantedno more than 200 and no less than 20 stock acquisition rights. For each of the 2008, 2009 and 2010 plans,100 shares will be issued or delivered upon the exercise of each stock acquisition right. The options are grantedas of early August of each year for each plan.
An option holder who retires while one’s options are still exercisable retains the right to exercise one’soptions until the expiration of the exercise period described above. However, an option holder’s right to purchasecommon stock under each plan lapses automatically upon one’s death or upon taking position such as in themanagement with a competitor.
105
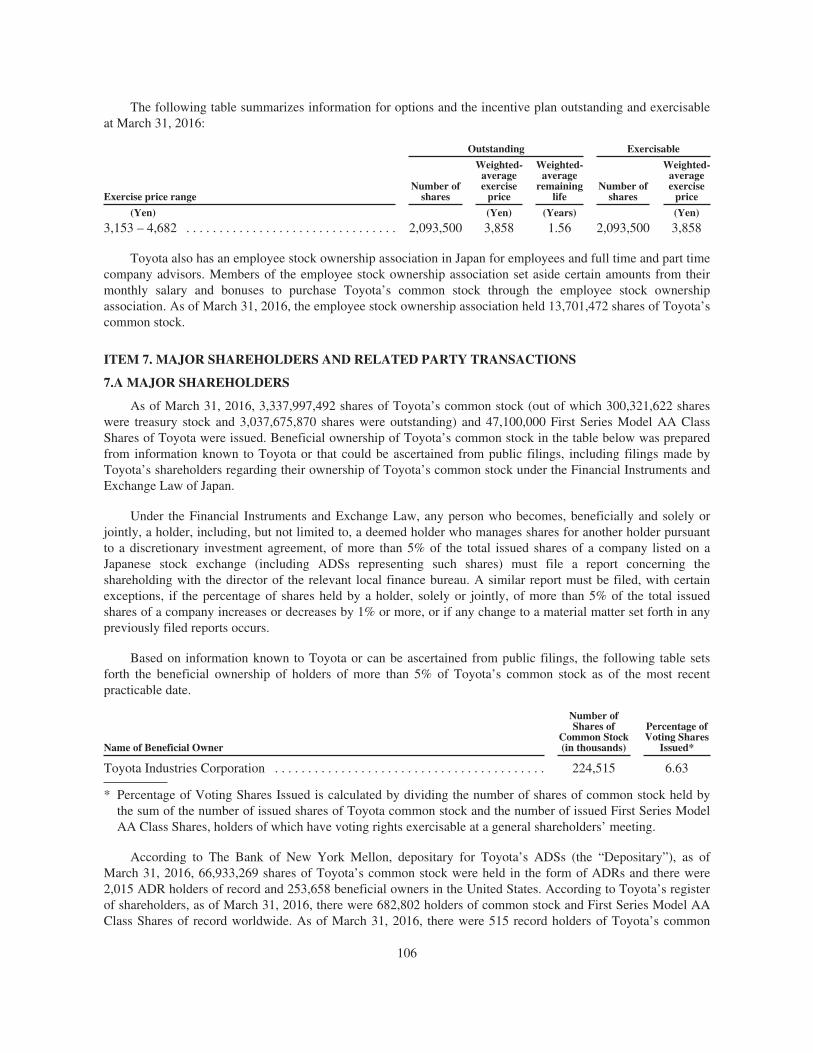
The following table summarizes information for options and the incentive plan outstanding and exercisableat March 31, 2016:
Outstanding Exercisable
Exercise price rangeNumber of
shares
Weighted-averageexercise
price
Weighted-average
remaininglife
Number ofshares
Weighted-averageexercise
price
(Yen) (Yen) (Years) (Yen)
3,153 – 4,682 . . . . . . . . . . . . . . . . . . . . . . . . . . . . . . . . 2,093,500 3,858 1.56 2,093,500 3,858
Toyota also has an employee stock ownership association in Japan for employees and full time and part timecompany advisors. Members of the employee stock ownership association set aside certain amounts from theirmonthly salary and bonuses to purchase Toyota’s common stock through the employee stock ownershipassociation. As of March 31, 2016, the employee stock ownership association held 13,701,472 shares of Toyota’scommon stock.
ITEM 7. MAJOR SHAREHOLDERS AND RELATED PARTY TRANSACTIONS
7.A MAJOR SHAREHOLDERS
As of March 31, 2016, 3,337,997,492 shares of Toyota’s common stock (out of which 300,321,622 shareswere treasury stock and 3,037,675,870 shares were outstanding) and 47,100,000 First Series Model AA ClassShares of Toyota were issued. Beneficial ownership of Toyota’s common stock in the table below was preparedfrom information known to Toyota or that could be ascertained from public filings, including filings made byToyota’s shareholders regarding their ownership of Toyota’s common stock under the Financial Instruments andExchange Law of Japan.
Under the Financial Instruments and Exchange Law, any person who becomes, beneficially and solely orjointly, a holder, including, but not limited to, a deemed holder who manages shares for another holder pursuantto a discretionary investment agreement, of more than 5% of the total issued shares of a company listed on aJapanese stock exchange (including ADSs representing such shares) must file a report concerning theshareholding with the director of the relevant local finance bureau. A similar report must be filed, with certainexceptions, if the percentage of shares held by a holder, solely or jointly, of more than 5% of the total issuedshares of a company increases or decreases by 1% or more, or if any change to a material matter set forth in anypreviously filed reports occurs.
Based on information known to Toyota or can be ascertained from public filings, the following table setsforth the beneficial ownership of holders of more than 5% of Toyota’s common stock as of the most recentpracticable date.
Name of Beneficial Owner
Number ofShares of
Common Stock(in thousands)
Percentage ofVoting Shares
Issued*
Toyota Industries Corporation . . . . . . . . . . . . . . . . . . . . . . . . . . . . . . . . . . . . . . . . . 224,515 6.63
* Percentage of Voting Shares Issued is calculated by dividing the number of shares of common stock held bythe sum of the number of issued shares of Toyota common stock and the number of issued First Series ModelAA Class Shares, holders of which have voting rights exercisable at a general shareholders’ meeting.
According to The Bank of New York Mellon, depositary for Toyota’s ADSs (the “Depositary”), as ofMarch 31, 2016, 66,933,269 shares of Toyota’s common stock were held in the form of ADRs and there were2,015 ADR holders of record and 253,658 beneficial owners in the United States. According to Toyota’s registerof shareholders, as of March 31, 2016, there were 682,802 holders of common stock and First Series Model AAClass Shares of record worldwide. As of March 31, 2016, there were 515 record holders of Toyota’s common
106
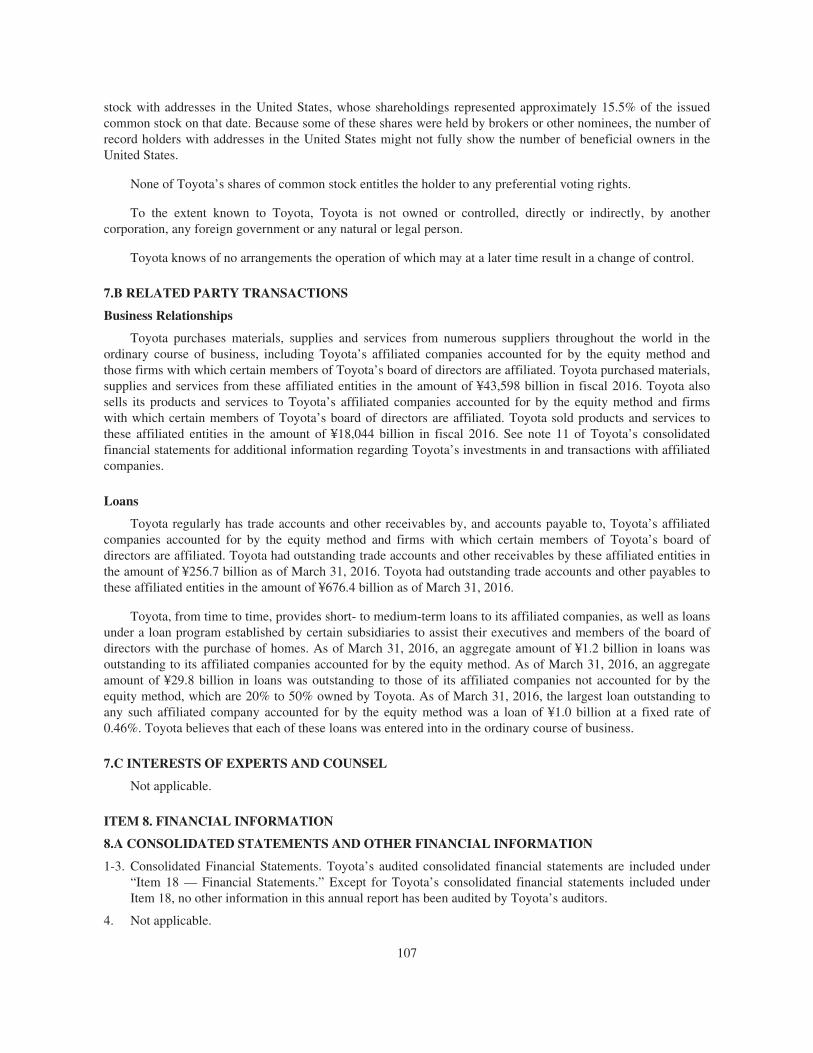
stock with addresses in the United States, whose shareholdings represented approximately 15.5% of the issuedcommon stock on that date. Because some of these shares were held by brokers or other nominees, the number ofrecord holders with addresses in the United States might not fully show the number of beneficial owners in theUnited States.
None of Toyota’s shares of common stock entitles the holder to any preferential voting rights.
To the extent known to Toyota, Toyota is not owned or controlled, directly or indirectly, by anothercorporation, any foreign government or any natural or legal person.
Toyota knows of no arrangements the operation of which may at a later time result in a change of control.
7.B RELATED PARTY TRANSACTIONS
Business Relationships
Toyota purchases materials, supplies and services from numerous suppliers throughout the world in theordinary course of business, including Toyota’s affiliated companies accounted for by the equity method andthose firms with which certain members of Toyota’s board of directors are affiliated. Toyota purchased materials,supplies and services from these affiliated entities in the amount of ¥43,598 billion in fiscal 2016. Toyota alsosells its products and services to Toyota’s affiliated companies accounted for by the equity method and firmswith which certain members of Toyota’s board of directors are affiliated. Toyota sold products and services tothese affiliated entities in the amount of ¥18,044 billion in fiscal 2016. See note 11 of Toyota’s consolidatedfinancial statements for additional information regarding Toyota’s investments in and transactions with affiliatedcompanies.
Loans
Toyota regularly has trade accounts and other receivables by, and accounts payable to, Toyota’s affiliatedcompanies accounted for by the equity method and firms with which certain members of Toyota’s board ofdirectors are affiliated. Toyota had outstanding trade accounts and other receivables by these affiliated entities inthe amount of ¥256.7 billion as of March 31, 2016. Toyota had outstanding trade accounts and other payables tothese affiliated entities in the amount of ¥676.4 billion as of March 31, 2016.
Toyota, from time to time, provides short- to medium-term loans to its affiliated companies, as well as loansunder a loan program established by certain subsidiaries to assist their executives and members of the board ofdirectors with the purchase of homes. As of March 31, 2016, an aggregate amount of ¥1.2 billion in loans wasoutstanding to its affiliated companies accounted for by the equity method. As of March 31, 2016, an aggregateamount of ¥29.8 billion in loans was outstanding to those of its affiliated companies not accounted for by theequity method, which are 20% to 50% owned by Toyota. As of March 31, 2016, the largest loan outstanding toany such affiliated company accounted for by the equity method was a loan of ¥1.0 billion at a fixed rate of0.46%. Toyota believes that each of these loans was entered into in the ordinary course of business.
7.C INTERESTS OF EXPERTS AND COUNSEL
Not applicable.
ITEM 8. FINANCIAL INFORMATION
8.A CONSOLIDATED STATEMENTS AND OTHER FINANCIAL INFORMATION
1-3. Consolidated Financial Statements. Toyota’s audited consolidated financial statements are included under“Item 18 — Financial Statements.” Except for Toyota’s consolidated financial statements included underItem 18, no other information in this annual report has been audited by Toyota’s auditors.
4. Not applicable.
107
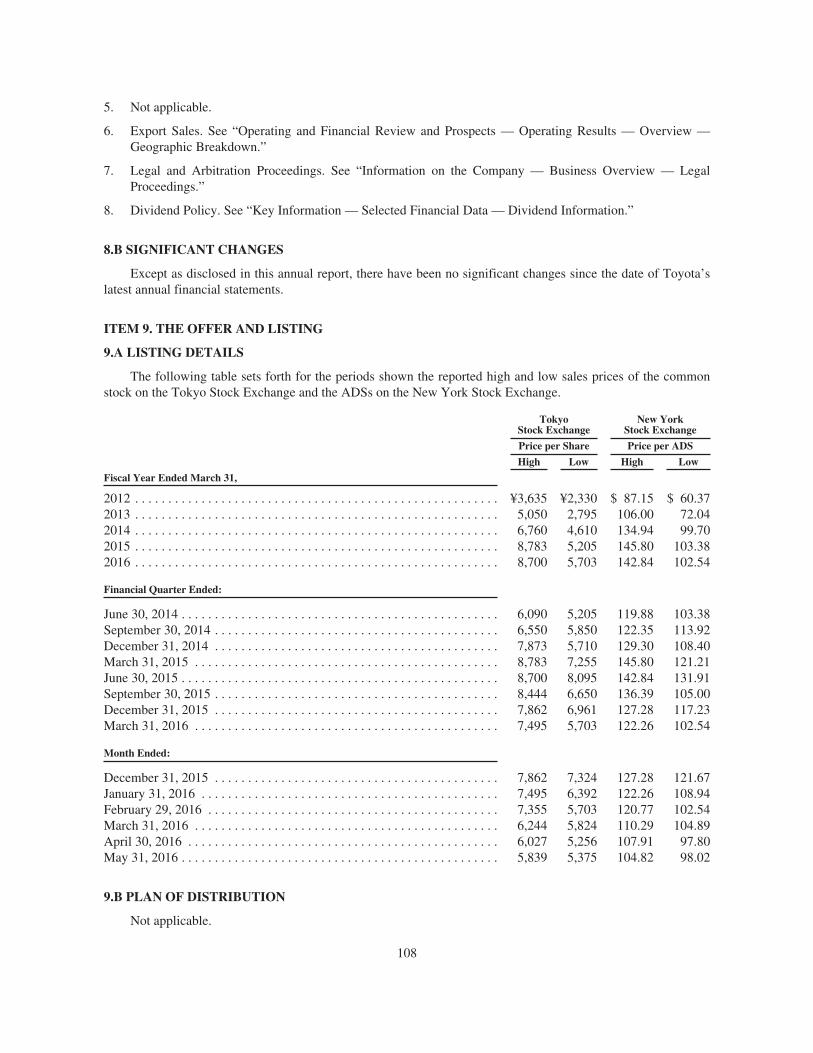
5. Not applicable.
6. Export Sales. See “Operating and Financial Review and Prospects — Operating Results — Overview —Geographic Breakdown.”
7. Legal and Arbitration Proceedings. See “Information on the Company — Business Overview — LegalProceedings.”
8. Dividend Policy. See “Key Information — Selected Financial Data — Dividend Information.”
8.B SIGNIFICANT CHANGES
Except as disclosed in this annual report, there have been no significant changes since the date of Toyota’slatest annual financial statements.
ITEM 9. THE OFFER AND LISTING
9.A LISTING DETAILS
The following table sets forth for the periods shown the reported high and low sales prices of the commonstock on the Tokyo Stock Exchange and the ADSs on the New York Stock Exchange.
TokyoStock Exchange
New YorkStock Exchange
Price per Share Price per ADS
High Low High Low
Fiscal Year Ended March 31,
2012 . . . . . . . . . . . . . . . . . . . . . . . . . . . . . . . . . . . . . . . . . . . . . . . . . . . . . . . ¥3,635 ¥2,330 $ 87.15 $ 60.372013 . . . . . . . . . . . . . . . . . . . . . . . . . . . . . . . . . . . . . . . . . . . . . . . . . . . . . . . 5,050 2,795 106.00 72.042014 . . . . . . . . . . . . . . . . . . . . . . . . . . . . . . . . . . . . . . . . . . . . . . . . . . . . . . . 6,760 4,610 134.94 99.702015 . . . . . . . . . . . . . . . . . . . . . . . . . . . . . . . . . . . . . . . . . . . . . . . . . . . . . . . 8,783 5,205 145.80 103.382016 . . . . . . . . . . . . . . . . . . . . . . . . . . . . . . . . . . . . . . . . . . . . . . . . . . . . . . . 8,700 5,703 142.84 102.54
Financial Quarter Ended:
June 30, 2014 . . . . . . . . . . . . . . . . . . . . . . . . . . . . . . . . . . . . . . . . . . . . . . . . 6,090 5,205 119.88 103.38September 30, 2014 . . . . . . . . . . . . . . . . . . . . . . . . . . . . . . . . . . . . . . . . . . . 6,550 5,850 122.35 113.92December 31, 2014 . . . . . . . . . . . . . . . . . . . . . . . . . . . . . . . . . . . . . . . . . . . 7,873 5,710 129.30 108.40March 31, 2015 . . . . . . . . . . . . . . . . . . . . . . . . . . . . . . . . . . . . . . . . . . . . . . 8,783 7,255 145.80 121.21June 30, 2015 . . . . . . . . . . . . . . . . . . . . . . . . . . . . . . . . . . . . . . . . . . . . . . . . 8,700 8,095 142.84 131.91September 30, 2015 . . . . . . . . . . . . . . . . . . . . . . . . . . . . . . . . . . . . . . . . . . . 8,444 6,650 136.39 105.00December 31, 2015 . . . . . . . . . . . . . . . . . . . . . . . . . . . . . . . . . . . . . . . . . . . 7,862 6,961 127.28 117.23March 31, 2016 . . . . . . . . . . . . . . . . . . . . . . . . . . . . . . . . . . . . . . . . . . . . . . 7,495 5,703 122.26 102.54
Month Ended:
December 31, 2015 . . . . . . . . . . . . . . . . . . . . . . . . . . . . . . . . . . . . . . . . . . . 7,862 7,324 127.28 121.67January 31, 2016 . . . . . . . . . . . . . . . . . . . . . . . . . . . . . . . . . . . . . . . . . . . . . 7,495 6,392 122.26 108.94February 29, 2016 . . . . . . . . . . . . . . . . . . . . . . . . . . . . . . . . . . . . . . . . . . . . 7,355 5,703 120.77 102.54March 31, 2016 . . . . . . . . . . . . . . . . . . . . . . . . . . . . . . . . . . . . . . . . . . . . . . 6,244 5,824 110.29 104.89April 30, 2016 . . . . . . . . . . . . . . . . . . . . . . . . . . . . . . . . . . . . . . . . . . . . . . . 6,027 5,256 107.91 97.80May 31, 2016 . . . . . . . . . . . . . . . . . . . . . . . . . . . . . . . . . . . . . . . . . . . . . . . . 5,839 5,375 104.82 98.02
9.B PLAN OF DISTRIBUTION
Not applicable.
108
9.C MARKETS
The primary trading market for Toyota’s common stock is the Tokyo Stock Exchange. The common stock isalso listed on the Nagoya Stock Exchange and two other regional stock exchanges in Japan.
Since September 29, 1999, American Depositary Shares, each equal to two shares of Toyota’s commonstock and evidenced by American Depositary Receipts, have been traded and listed on the New York StockExchange through a sponsored ADR facility operated by The Bank of New York Mellon, as Depositary. Prior tothat time, Toyota’s ADSs were listed on the Nasdaq SmallCap Market through five unsponsored ADR facilities.
Toyota’s common stock is also listed on the London Stock Exchange.
9.D SELLING SHAREHOLDERS
Not applicable.
9.E DILUTION
Not applicable.
9.F EXPENSES OF THE ISSUE
Not applicable.
ITEM 10. ADDITIONAL INFORMATION
10.A SHARE CAPITAL
Not applicable.
10.B MEMORANDUM AND ARTICLES OF ASSOCIATION
Except as otherwise stated, set forth below is information relating to Toyota’s common stock and Model AAClass Shares, including brief summaries of the relevant provisions of Toyota’s articles of incorporation and sharehandling regulations, as currently in effect, and of the Companies Act, Act Concerning Book-Entry Transfer ofCorporate Bonds, Shares and Other Securities (the “Book-Entry Transfer Act”) and related legislation.
General
Toyota’s authorized number of shares as of March 31, 2016 was 10,000,000,000 common shares, of which3,337,997,492 shares were issued. The articles of incorporation was amended at the 111th Ordinary GeneralShareholders’ Meeting held in June 2015 and Toyota’s authorized number of shares was changed to10,000,000,000 shares, with the total number of authorized shares per class, of 10,000,000,000 for commonshares, 50,000,000 for First Series Model AA Class Shares, 50,000,000 for Second Series Model AA ClassShares, 50,000,000 for Third Series Model AA Class Shares, 50,000,000 for Fourth Series Model AA ClassShares and 50,000,000 for Fifth Series Model AA Class Shares, and the total number of shares authorized to beissued with respect to First Series Model AA Class Shares through the Fifth Series Model AA Class Shares not toexceed 150,000,000 shares. As of June 24, 2015, there were 47,100,000 shares of First Series Model AA ClassShares issued and outstanding.
Toyota does not issue share certificates for its shares. In accordance with the Companies Act, the Book-Entry Transfer Act and Toyota’s articles of incorporation, Toyota’s common shares are recorded or registered on(i) Toyota’s register of shareholders and (ii) transfer account books of the Japan Securities Depository Center,Inc. (“JASDEC”) which is a book-entry transfer institution and securities firms, banks or other account
109
management institutions. The transfer of common shares will generally become effective once the transfer isrecorded in the transferee’s account. In order to assert shareholders’ rights against Toyota, a shareholder mustgenerally have his or her name and address recorded or registered on Toyota’s register of shareholders. A holderof common shares can assert minority shareholders’ rights (shareholders’ rights for which Toyota has not set arecord date) against Toyota if JASDEC provides an individual shareholder notice to Toyota upon theshareholder’s request. The shareholder of deposited shares underlying the ADSs is the Depositary for the ADSs.Accordingly, holders of ADSs will not be able directly to assert shareholders’ rights.
A holder of common shares must have a transfer account to transfer shares. Holders of common shares whodo not have a transfer account with JASDEC must have an account with an account management institution thatdirectly or indirectly has a transfer account with JASDEC. Once Toyota decides on the record date for itsshareholders’ meeting or makes a request to JASDEC based on justifiable grounds, JASDEC will promptlyprovide to Toyota names, addresses and other information with respect to the holders of Toyota’s common shareswho are recorded on the transfer account books of JASDEC or account management institutions. Upon receivingsuch information, Toyota will record or register such information received from JASDEC on its register ofshareholders. Accordingly, holders of common shares recorded or registered on Toyota’s register of shareholderswill be treated as holders of common shares of Toyota and may exercise rights, such as voting rights, and willreceive dividends (if any) and notices to holders of common shares directly from Toyota. Holders of commonshares wishing to assert minority shareholders’ rights against Toyota must request an individual shareholdernotice to JASDEC or the account management institution at which the shareholder has opened a transfer account.In response to such request, JASDEC will provide the individual shareholders notice to Toyota. A holder ofcommon shares may assert his or her minority shareholders’ rights against Toyota for a period of four weeksafter the date the individual shareholder notice is provided to Toyota. The shares held by a person who is deemedto hold additional shares according to the transfer account books are aggregated for these purposes.
Model AA Class Shares, once issued, will be recorded or registered on Toyota’s register of shareholders.The transfer of Model AA Class Shares, once issued, will be effective upon an agreement between the transferorand the transferee, but entry or record of a change of holder in the register of shareholders will require anapproval from the board of directors.
Corporate Purpose
Article 2 of Toyota’s articles of incorporation states that its purpose is to engage in the followingbusinesses:
• the manufacture, sale, leasing and repair of:
• motor vehicles, industrial vehicles, ships, aircraft, other transportation machinery and apparatus,spacecraft and space machinery and apparatus, and parts thereof;
• industrial machinery and apparatus, other general machinery and apparatus, and parts thereof;
• electrical machinery and apparatus, and parts thereof; and
• measuring machinery and apparatus, medical machinery and apparatus, and parts thereof.
• the manufacture and sale of ceramics and products of synthetic resins, and materials thereof;
• the manufacture, sale and repair of construction materials and equipment, furnishings and fixtures forresidential buildings;
• the planning, designing, supervision, execution and undertaking of construction works, civil engineeringworks, land development, urban development and regional development;
• the sale, purchase, leasing, brokerage and management of real estate;
• the service of information processing, information communications and information supply and thedevelopment, sale and leasing of software;
110
• the design and development of product sales systems that utilize networks such as the Internet, sale,leasing and maintenance of computers included within such systems, and sale of products by utilizingsuch systems;
• the inland transportation, marine transportation, air transportation, stevedoring, warehousing andtourism businesses;
• the printing, publishing, advertising and publicity, general leasing, security and workers dispatchbusinesses;
• the credit card operations, purchase and sale of securities, investment consulting, investment trustoperation, and other financial services;
• the operation and management of such facilities as parking lots, showrooms, educational facilities,medical care facilities, sports facilities, marinas, airfields, food and drink stands and restaurants, lodgingfacilities, retail stores and others;
• the non-life insurance agency business and the life insurance agency business;
• the production and processing by using biotechnology of agricultural products including trees, and thesale of such products;
• the sale of goods related to each of the preceding items and mineral oil;
• the conducting of engineering, consulting, invention and research relating to each of the preceding itemsand the utilization of such invention and research; and
• any businesses incidental to or related to any of the preceding items.
Dividends
Dividends — General
Toyota normally pays dividends twice per year, including an interim dividend and a year-end dividend.Toyota’s articles of incorporation provide that retained earnings can be distributed as dividends pursuant to aresolution of its board of directors. Toyota’s board of directors resolves to pay year-end dividends to holders ofcommon shares and registered pledgees of common shares of record as of March 31, the record date, in eachyear. In addition, the articles of incorporation provide that in the event that Toyota pays a year-end dividend toholders of common shares, it will pay AA Dividends in cash from surplus to any holders of Model AA ClassShares or registered pledgees of Model AA Class Shares entered or recorded in the final register of shareholdersas of the record date for the year-end dividend, in preference to holders of common shares or registered pledgeesof common shares. The amount of annual AA Dividends per Model AA Class Share is calculated by multiplyingthe amount per Model AA Class Share paid to Toyota as consideration by a rate determined by the board ofdirectors prior to the issuance of such Model AA Class Share, which rate is not to exceed 5%.
In addition to these year-end dividends, Toyota may pay an interim dividend in the form of cashdistributions from its distributable surplus to holders of common shares and pledgees of common shares of recordas of September 30, the record date, in each year by a resolution of its board of directors. The articles ofincorporation provide that in the event that Toyota pays such interim dividends, Toyota will pay AA InterimDividends in cash as interim dividend to any holders of Model AA Class Shares or registered pledgees of ModelAA Class Shares entered or recorded in the final register of shareholders as of the record date for the interimdividend, in preference to holders of common shares or registered pledgees of common shares. If AA InterimDividends are paid during the fiscal year in which the record date for the year-end dividend falls, the amount ofAA Interim Dividends is deducted from AA Dividends to be paid per the above paragraph.
If the amount of the dividends from surplus paid in cash to holders of Model AA Class Shares or registeredpledgees of Model AA Class Shares is less than the prescribed amount of AA Dividends in any fiscal year, theamount of the shortfall will be carried forward to and accumulate in the following fiscal year and thereafter.
111
Dividends from surplus will be paid in cash to holders of Model AA Class Shares or registered pledgees ofModel AA Class Shares in preference to the payment of interim and year-end dividends until such paymentreaches the amount of the accumulated unpaid dividends.
In addition, under the Companies Act, dividends may be paid to holders of common shares and pledgees ofrecord of common shares as of any record date, other than those specified above, as set forth by Toyota’s articlesof incorporation or as determined by its board of directors from time to time. Under the Companies Act,dividends may be distributed in cash or (except in the case of interim dividends mentioned in the secondpreceding paragraph) in kind, subject to limitations on distributable surplus and to certain other conditions.
Dividends — Distributable amount
Under the Companies Act, Toyota is permitted to make distributions of surplus to the extent that theaggregate book value of the assets to be distributed to shareholders does not exceed the distributable amountprovided for by the Companies Act and the ordinance of the Ministry of Justice as at the effective date of suchdistribution of surplus.
The amount of surplus at any given time shall be the amount of Toyota’s assets and the book value ofToyota’s treasury stock after subtracting and adding the amounts of items provided for by the Companies Act andthe ordinance of the Ministry of Justice, and the amount of surplus distributable for dividends is calculated byadding to and subtracting from this amount the amounts of items provided for by the Companies Act and theordinance of the Ministry of Justice.
Dividends — Prescription
Under its articles of incorporation, Toyota is not obligated to pay any dividends in cash which are leftunclaimed for a period of three years after the date on which they first became payable.
Capital Accounts
The amount of the cash or assets paid or contributed by subscribers for new shares (with certain exceptions)is required to be accounted for as stated capital, although Toyota may account for an amount not exceeding one-half of such cash or assets as additional paid-in capital.
Under the Companies Act, Toyota may reduce its additional paid-in capital and legal reserve withoutlimitation on the amount to be reduced, generally, by a resolution of a general shareholders’ meeting and if sodecided by the same resolution, may account for the whole or any part of the amount of the reduction ofadditional paid-in capital as stated capital. The whole or any part of surplus which may be distributed asdividends may also be transferred to stated capital by a resolution of a general shareholders’ meeting.
Stock Splits
Toyota may at any time split the outstanding shares into a greater number of shares by a resolution of theboard of directors. Toyota must give public notice of the stock split, specifying a record date for the stock split,not less than two weeks prior to the record date. Toyota shall conduct any stock split simultaneously and in thesame proportion with respect to the common shares and the Model AA Class Shares.
Consolidation of Shares
Toyota may at any time consolidate shares in issue into a smaller number of shares by a special shareholdersresolution (as defined in “Voting Rights”). When a consolidation of shares is to be made, Toyota must givepublic notice of certain matters two weeks prior to the effective date of the consolidation. Toyota must disclosethe reason for the consolidation of shares at a general shareholders’ meeting. Toyota shall conduct anyconsolidation of shares simultaneously and in the same proportion with respect to the common shares and theModel AA Class Shares.
112

Japanese Unit Share System
General. Consistent with the requirements of the Companies Act, Toyota’s articles of incorporation providethat 100 common shares or Model AA Class Shares each constitute one “unit.” Although the number of sharesconstituting a unit is included in the articles of incorporation, any amendment to the articles of incorporationreducing (but not increasing) the number of shares constituting a unit or eliminating the provisions for the unit ofshares may be made by a resolution of the board of directors rather than by a special shareholders resolution,which is otherwise required for amending the articles of incorporation.
Voting Rights under the Unit Share System. Under the unit share system, shareholders have one votingright for each unit of shares that they hold. Any number of common shares or Model AA Class Shares less than afull unit will carry no voting rights.
Purchase by Toyota of Shares Constituting Less Than a Unit. A holder of shares constituting less than afull unit may require Toyota to purchase those shares at their market value in the case of common shares and atfair price in the case of Model AA Class Shares in accordance with the provisions of Toyota’s share handlingregulations and the Companies Act.
Surrender of American Depositary Receipts. ADR holders will only be permitted to surrender ADRs andwithdraw underlying common shares constituting an integral number of a whole unit. If a holder surrenders anADR including ADRs representing common shares that do not constitute an integral number of whole units, theDepositary will deliver to that holder only those common shares which constitute a whole unit. The Depositarywill then issue to the holder a new ADR representing the remaining shares. Holders of an ADR that representsless than a whole unit of underlying shares will be unable to withdraw the underlying shares. As a result, thoseholders will be unable to require Toyota to purchase their common shares to the extent those common sharesconstitute less than one whole unit.
Voting Rights
Toyota holds its ordinary general shareholders’ meeting each year. In addition, Toyota may hold anextraordinary general shareholders’ meeting whenever necessary by giving at least two weeks’ advance notice.Under the Companies Act, notice of any shareholders’ meeting must be given to each shareholder having votingrights or, in the case of a non-resident shareholder, to his or her resident proxy or mailing address in Japan inaccordance with Toyota’s share handling regulations, at least two weeks prior to the date of the meeting.
Holders of common shares and holders of Model AA Class Shares shall have voting rights exercisable at ageneral shareholders’ meeting. A holder of shares constituting one or more whole units is entitled to one vote perunit of shares subject to the limitations on voting rights set forth in this paragraph. In general, under theCompanies Act, a resolution can be adopted at a general shareholders’ meeting by a majority of the shares havingvoting rights represented at the meeting. The Companies Act and Toyota’s articles of incorporation require aquorum for the election of members of the board of directors and audit & supervisory board members of not lessthan one-third of the total number of outstanding shares having voting rights. Toyota’s shareholders are notentitled to cumulative voting in the election of members of the board of directors. A corporate shareholder, themanagement of which is substantially under Toyota’s control as provided by an ordinance of the Ministry ofJustice, either through the holding of voting rights or for any other reason, does not have voting rights.
Shareholders may exercise their voting rights by attending the general shareholders’ meeting or in writingby mail. Shareholders who choose to exercise their voting rights by mail must fill out and return to Toyota thevoting right exercise form enclosed with the convocation notice of the general shareholders’ meeting by the datespecified in such convocation notice. In addition, from the general shareholders’ meeting for fiscal 2009,shareholders may exercise their voting rights through the internet. Shareholders electing to exercise their votingrights through the internet must log on to the “Website to Exercise Voting Rights” using the login ID andtemporary password provided in the voting right exercise form enclosed with the convocation notice and submit
113
their votes by a date specified in the convocation notice, following instructions appearing on the website.Institutional investors may also use the Electronic Proxy Voting Platform operated by Investor CommunicationsJapan (“ICJ”) to exercise their voting rights through the use of the Internet, if such institutional investor appliesto use the platform in advance. Shareholders may also exercise their voting rights through proxies, provided thatthose proxies are also shareholders who have voting rights. Toyota may refuse a shareholder having two or moreproxies attend a general shareholders’ meeting.
The Companies Act provides that a quorum of at least one-third of outstanding shares with voting rightsmust be present at a shareholders’ meeting to approve any material corporate actions such as:
(1) any amendment of the articles of incorporation with certain exceptions in which a shareholders’resolution is not required;
(2) acquisition of its own shares from a specific party;
(3) consolidation of shares;
(4) any issue or transfer of its shares at a “specially favorable” price (or any issue of stock acquisitionrights or bonds with stock acquisition rights at “specially favorable” conditions by Toyota) to anypersons other than shareholders;
(5) the removal of an audit & supervisory board member;
(6) the exemption of liability of a director or audit & supervisory board member with certainexceptions;
(7) a reduction of stated capital which meets certain requirements with certain exceptions;
(8) a distribution of in-kind dividends which meets certain requirements;
(9) dissolution, merger, or consolidation with certain exceptions in which a shareholders’ resolution isnot required;
(10) the transfer of the whole or a material part of the business;
(11) the transfer in entirety or in part of shares or equity interest of a subsidiary under certainconditions;
(12) the taking over of the entire business of any other corporation with certain exceptions in which ashareholders’ resolution is not required;
(13) share exchange or share transfer for the purpose of establishing 100% parent-subsidiaryrelationships with certain exceptions in which a shareholders’ resolution is not required; or
(14) company split with certain exceptions in which a shareholders’ resolution is not required.
At least two-thirds of the shares having voting rights represented at the meeting must approve these actions.
The voting rights of holders of ADSs are exercised by the Depositary based on instructions from thoseholders.
Rights to be Allotted Shares
Holders of common shares and Model AA Class Shares have no preemptive rights under Toyota’s articlesof incorporation. Under the Companies Act, the board of directors may, however, determine that shareholdersshall be given rights to be allotted shares or stock acquisition rights on request in connection with a particularissue or transfer of shares, or issue of stock acquisition rights, respectively. In this case, such rights must be givenon uniform terms to all shareholders as of a specified record date by at least two weeks’ prior public notice toshareholders of the record date.
114
Rights to be allotted shares are nontransferable. However, a shareholder may be allotted stock acquisitionrights without consideration thereto, and may transfer such rights.
Liquidation Rights
In the event of a liquidation of Toyota, the assets remaining after payment of all debts, liquidation expensesand taxes will be distributed as follows. First, an amount per First Series Model AA Class Share through FifthSeries Model AA Class Share, determined by resolution of the board of directors or calculated using a formuladetermined by a resolution of the board of directors prior to the issuance of such Model AA Class Shares basedon the amount per Model AA Class Shares paid to Toyota as consideration (the “Base Amount”), shall be paid incash to holders of Model AA Class Shares or registered pledgees of Model AA Class Shares. No otherdistribution of residual assets shall be made to holders of Model AA Class Shares or registered pledgees ofModel AA Class Shares. The remaining residual assets shall be distributed among the holders of common sharesor registered pledgees of common shares in proportion to the respective number of shares they own.
Liability to Further Calls or Assessments
All of Toyota’s currently outstanding shares, including shares represented by the ADSs, are fully paid andnonassessable.
Transfer Agent
Mitsubishi UFJ Trust and Banking Corporation is the transfer agent for all shares. Mitsubishi UFJ Trust andBanking Corporation’s office is located at 4-5, Marunouchi 1-chome, Chiyoda-ku, Tokyo, 100-8212 Japan.Mitsubishi UFJ Trust and Banking Corporation maintains Toyota’s register of shareholders and records transfersof record ownership (in the case of common shares, upon receiving notification from JASDEC).
Record Date
The close of business on March 31 is the record date for Toyota’s year-end dividends, if paid. A holder ofcommon shares or Model AA Class Shares constituting one or more whole units who is recorded or registered asa holder on Toyota’s register at the close of business as of March 31 is also entitled to exercise shareholders’voting rights at the ordinary general shareholders’ meeting with respect to the business year ending on March 31.The close of business on September 30 of each year is the record date for interim dividends, if paid. In addition,Toyota may set a record date for determining the shareholders entitled to other rights and for other purposes bygiving at least two weeks’ prior public notice.
The shares generally trade ex-dividend or ex-rights in the Japanese stock exchanges on the second businessday before a record date (or if the record date is not a business day, the third business day prior thereto), for thepurpose of dividends or rights offerings.
Acquisition by Toyota of Shares
Toyota may acquire its own common shares (i) through a stock exchange on which such shares are listed orby way of tender offer (pursuant to an ordinary resolution of a general shareholders’ meeting or a resolution ofthe board of directors), (ii) by purchase from a specific party (pursuant to a special resolution of a generalshareholders’ meeting) or (iii) from a subsidiary of Toyota (pursuant to a resolution of the board of directors). Inaddition, Toyota may acquire its own Model AA Class Shares (i) by purchase from all holders of the relevantseries of Model AA Class Shares who make an offer to transfer the shares to Toyota upon notice from Toyota toacquire the shares (pursuant to an ordinary resolution of a general shareholders’ meeting), (ii) by purchase from aspecific party (pursuant to a special resolution of a general shareholders’ meeting) or (iii) from a subsidiary ofToyota (pursuant to a resolution of the board of directors). When such acquisition of common shares is made byToyota from a specific party other than a subsidiary of Toyota, any other holder of common shares may make a
115
demand to a representative director, more than five calendar days prior to the relevant shareholders’ meeting, thatToyota also purchase the common shares held by such holder. However, the acquisition of its own commonshares at a price not exceeding the market price to be provided under an ordinance of the Ministry of Justice willnot trigger the right of any shareholder to include him/her as the seller of his/her shares in such proposedpurchase.
Any acquisition of shares must satisfy certain requirements that the total amount of the acquisition pricemay not exceed the amount of the distributable dividends. See “— Dividends.”
Shares acquired by Toyota may be held by it for any period or may be cancelled by resolution of the boardof directors. Toyota may also transfer to any person the shares held by it, subject to a resolution of the board ofdirectors, and subject also to other requirements applicable to the issuance of new shares. Toyota may also utilizeits treasury stock for the purpose of transfer to any person upon exercise of stock acquisition rights or for thepurpose of acquiring another company by way of merger, share exchange or corporate split through exchange oftreasury stock for shares or assets of the acquired company.
The Companies Act generally prohibits any subsidiary of Toyota from acquiring shares of Toyota.
Model AA Class Shareholder’s Conversion Right into Common Shares
Holders of Model AA Class Shares may, at certain times specified in resolution of the board of directors asthe conversion period at the time of the issuance of First Series Model AA Class Shares to Fifth SeriesModel AA Class Shares, demand that Toyota acquire some or all of such Model AA Class Shares held by suchholder of Model AA Class shares in exchange for common shares in a number determined by a formula specifiedin such board resolution. Any fractions of less than one common share to be delivered in exchange for suchModel AA Class Shares shall be disregarded, in which case payment of money as provided in the Companies Actshall not be made.
Model AA Class Shareholder’s Cash Put Option
Holders of Model AA Class Shares may, at certain times specified in resolution of the board of directors asthe cash put option period at the time of the issuance of First Series Model AA Class Shares to Fifth SeriesModel AA Class Shares, demand that Toyota acquire some or all of such Model AA Class Shares in exchangefor cash in an amount equivalent to the Base Amount. If demand for acquisition exceeds the amount availableunder the Companies Act for distribution as of the date of demand for such acquisition, Model AA Class Sharesto be acquired by Toyota shall be determined by a resolution of the board of directors, and the cash put option inrespect of Model AA Class Shares not so acquired shall be deemed not to have been exercised.
Toyota’s Cash Call Option
After the lapse of period specified in resolution of its board of directors at the time of the issuance of FirstSeries Model AA Class Shares to Fifth Series Model AA Class Shares, on an acquisition date separatelydetermined by a resolution of the board of directors, Toyota may acquire all of such Model AA Class Shares inexchange for cash in an amount equivalent to the Base Amount.
Acquisition or Disposition of Shares or ADS
Under the Foreign Exchange and Foreign Trade Law and the cabinet orders and ministerial ordinancesthereunder (collectively, the “Foreign Exchange Regulations”), all aspects of regulations on foreign exchangeand foreign trade transactions are, with minor exceptions (which are not generally applicable to the purchase andsale of Toyota’s shares), only subject to post transaction reporting requirements. Acquisitions and dispositions ofshares of common stock or ADS by non-residents of Japan (including foreign corporations not resident in Japan)are generally not subject to this reporting requirement. However, the Minister of Finance has the power toimpose a licensing requirement for transactions in limited circumstances.
116
Report of Substantial Shareholdings
The Financial Instruments and Exchange Law of Japan and regulations under the Law require any personwho has become a holder (together with its related persons) of more than 5% of the total issued shares of acompany listed on any Japanese stock exchange (including ADSs representing such shares) to file with theDirector of a competent Local Finance Bureau, within five business days, a report concerning thoseshareholdings. A similar report must also be filed to reflect any change of 1% or more in any shareholding or anychange in material matters set out in reports previously filed. Any such report shall be filed with the Director of acompetent Local Finance Bureau through the Electronic Disclosure for Investor’s Network (“EDINET”) system.For this purpose, shares issuable to a shareholder upon exercise of stock acquisition rights are taken into accountin determining both the number of shares held by that stock acquisition rights holder and the company’s totalissued shares.
10.C MATERIAL CONTRACTS
All contracts concluded by Toyota during the two years preceding this filing were entered into in theordinary course of business.
10.D EXCHANGE CONTROLS
The Foreign Exchange Regulations govern the acquisition and holding of shares of capital stock of Toyotaby “exchange non-residents” and by “foreign investors.” The Foreign Exchange Regulations currently in effectdo not, however, affect transactions between exchange non-residents to purchase or sell shares outside Japanusing currencies other than Japanese yen.
Exchange non-residents are:
• individuals who do not reside in Japan; and
• corporations whose principal offices are located outside Japan.
Generally, branches and other offices of non-resident corporations that are located within Japan are regardedas residents of Japan. Conversely, branches and other offices of Japanese corporations located outside Japan areregarded as exchange non-residents.
Foreign investors are:
• individuals who are exchange non-residents;
• corporations or other organizations that are organized under the laws of foreign countries or whoseprincipal offices are located outside of Japan; and
• corporations (1) of which 50% or more of their voting rights are held directly or indirectly byindividuals who are exchange non-residents and/or corporations or other organizations (a) that areorganized under the laws of foreign countries or (b) whose principal offices are located outside of Japanor (2) a majority of whose officers, or officers having the power of representation, are individuals whoare exchange non-residents.
In general, the acquisition of shares of a Japanese company (such as the shares of capital stock of Toyota)by an exchange non-resident from a resident of Japan is not subject to any prior filing requirements. In certainlimited circumstances, however, the Minister of Finance may require prior approval of an acquisition of this type.While prior approval, as described above, is not required, in the case where a resident of Japan transfers shares ofa Japanese company (such as the shares of capital stock of Toyota) for consideration exceeding ¥100 million toan exchange non-resident, the resident of Japan who transfers the shares is required to report the transfer to theMinister of Finance within 20 days from the date of the transfer or the date of receipt of payment, whichevercomes later, unless the transfer was made through a bank or financial instruments business operator licensed orregistered under Japanese law.
117
If a foreign investor acquires shares of a Japanese company that is listed on a Japanese stock exchange (suchas the shares of capital stock of Toyota) and, as a result of the acquisition, the foreign investor, in combinationwith any existing holdings, directly or indirectly holds 10% or more of the issued shares of the relevant company,the foreign investor, with certain exceptions, must file a report of the acquisition with the Minister of Finance andany other competent Ministers having jurisdiction over that Japanese company by the 15th day of the monthfollowing the month in which the date of the acquisition falls. In limited circumstances, such as where the foreigninvestor is in a country that is not listed on an exemption schedule in the Foreign Exchange Regulations, a priornotification of the acquisition must be filed with the Minister of Finance and any other competent Ministers, whomay then modify or prohibit the proposed acquisition.
Under the Foreign Exchange Regulations, dividends paid on, and the proceeds of sales in Japan of, sharesheld by non-residents of Japan may in general be converted into any foreign currency and repatriated abroad.Under the terms of the deposit agreement pursuant to which Toyota’s ADSs are issued, the Depositary isrequired, to the extent that in its judgment it can convert yen on a reasonable basis into dollars and transfer theresulting dollars to the United States, to convert all cash dividends that it receives in respect of deposited sharesinto dollars and to distribute the amount received (after deduction of applicable withholding taxes) to the holdersof ADSs.
10.E TAXATION
The following discussion is a general summary of the principal U.S. federal income and Japanese nationaltax consequences of the acquisition, ownership and disposition of shares of common stock or ADSs. Thissummary does not purport to address all material tax consequences that may be relevant to holders of shares ofcommon stock or ADSs, and does not take into account the specific circumstances of any particular investors,some of which (such as tax-exempt entities, banks, insurance companies, broker-dealers, traders in securities thatelect to use a mark-to-market method of accounting for their securities holdings, regulated investmentcompanies, real estate investment trusts, partnerships and other pass-through entities, investors liable for the U.S.alternative minimum tax, investors that own or are treated as owning 10% or more of Toyota’s voting stock,investors that hold shares of common stock or ADSs as part of a straddle, hedge, conversion transaction or otherintegrated transaction and U.S. Holders (as defined below) whose functional currency is not the U.S. dollar) maybe subject to special tax rules. This summary is based on the tax laws and regulations of the United States andJapan, judicial decisions, published rulings and administrative pronouncements all as in effect on the date hereof,as well as on the current income tax convention between the United States and Japan (the “Treaty”), as describedbelow, all of which are subject to change (possibly with retroactive effect), and to differing interpretations.
For purposes of this discussion, a “U.S. Holder” is any beneficial owner of shares of common stock orADSs that, for U.S. federal income tax purposes, is:
1. an individual who is a citizen or resident of the United States;
2. a corporation (or other entity taxable as a corporation for U.S. federal income tax purposes)organized in or under the laws of the United States, any state thereof, or the District of Columbia;
3. an estate the income of which is subject to U.S. federal income tax without regard to its source; or
4. a trust that is subject to the primary supervision of a U.S. court and the control of one or moreU.S. persons, or that has a valid election in effect under applicable Treasury regulations to betreated as a U.S. person.
An “Eligible U.S. Holder” is a U.S. Holder that:
1. is a resident of the United States for purposes of the Treaty;
118
2. does not maintain a permanent establishment in Japan (a) with which the shares of common stockor ADSs are effectively connected and through which the U.S. holder carries on or has carried onbusiness, or (b) of which the shares of common stock or ADSs form part of the business property;and
3. is eligible for benefits under the Treaty with respect to income and gain derived in connectionwith the shares of common stock or ADSs.
This summary does not address any aspects of U.S. federal tax law other than income taxation and does notdiscuss any aspects of Japanese tax law other than income taxation, as limited to national taxes, inheritance andgift taxation. This summary also does not cover any state or local, or non-U.S., non-Japanese tax considerations.Investors are urged to consult their tax advisors regarding the U.S. federal, state and local and Japanese and othertax consequences of acquiring, owning and disposing of shares of common stock or ADSs. In particular, whererelevant, investors are urged to confirm their status as Eligible U.S. Holders with their tax advisors and to discusswith their tax advisors any possible consequences of their failure to qualify as Eligible U.S. Holders. In addition,this summary is based in part upon the representations of the Depositary and the assumption that each obligationin the deposit agreement, and in any related agreement, will be performed in accordance with its terms.
In general, for purposes of the Treaty and for U.S. federal income and Japanese income tax purposes,owners of ADRs evidencing ADSs will be treated as the owners of the shares of common stock represented bythose ADSs, and exchanges of shares of common stock for ADSs, and exchanges of ADSs for shares of commonstock, will not be subject to U.S. federal income or Japanese income tax.
The discussion below is intended for general information only and does not constitute a complete analysisof all tax consequences relating to ownership of shares of common stock or ADSs. Prospective purchasers ofshares of common stock or ADSs should consult their own tax advisors concerning the tax consequences oftheir particular situations.
Japanese Taxation
The following is a summary of the principal Japanese tax consequences (limited to national taxes) to non-residents of Japan or non-Japanese corporations without permanent establishments in Japan (“non-residentHolders”) who are holders of shares of common stock or of ADSs of Toyota. The following informationregarding taxation in Japan is based on the tax treaties and tax laws in force and their interpretation by Japan’stax authorities as of the date of this annual report. Tax laws and treaties and their interpretations may change(including with retroactive effect). Toyota will not revise this summary on the basis of any such change occurringafter the date of this annual report.
Generally, non-resident Holders are subject to Japanese withholding tax on dividends paid by Japanesecorporations. Stock splits are, in general, not taxable events.
In the absence of an applicable income tax treaty, convention or agreement reducing the maximum rate ofJapanese withholding tax or allowing an exemption from Japanese withholding tax, the rate of Japanesewithholding tax applicable to dividends paid by Japanese corporations to non-resident Holders is generally20.42 percent, provided that, with respect to dividends paid on listed shares issued by a Japanese corporation(such as the shares of common stock or ADSs of Toyota) to non-resident Holders, other than any individualshareholder who holds 3 percent or more of the total issued shares of the relevant Japanese corporation, theaforementioned 20.42 percent withholding tax rate is reduced to 15.315 percent for dividends due and payable onor before December 31, 2037. These rates include a special additional withholding tax (2.1 percent of the originalwithholding tax amount) to secure funds for reconstruction from the Great East Japan Earthquake.
At the date of this annual report, Japan has income tax treaties, conventions or agreements whereby theabove-mentioned withholding tax rate is reduced, in most cases to 15 percent or 10 percent for portfolio investors(15 percent under the income tax treaties with, among other countries, Belgium, Canada, Denmark, Finland,
119
Germany, Ireland, Italy, Luxembourg, New Zealand, Norway, Singapore, and Spain, and 10 percent under theincome tax treaties with, among other countries, Australia, France, Hong Kong, the Netherlands, Portugal,Sweden, Switzerland, the U.K. and the United States).
Under the Treaty, the maximum rate of Japanese withholding tax which may be imposed on dividends paidby a Japanese corporation to an Eligible U.S. Holder that is a portfolio investor is generally reduced to 10 percentof the gross amount actually distributed, and dividends paid by a Japanese corporation to an Eligible U.S. Holderthat is a pension fund (as defined in the Treaty) are exempt from Japanese income tax by way of withholding orotherwise, provided that such dividends are not derived from the carrying on of a business, directly or indirectly,by such pension fund.
If the maximum tax rate provided for in the income tax treaty applicable to dividends paid by Toyota to anyparticular non-resident Holder is lower than the withholding tax rate otherwise applicable under Japanese tax lawor if any particular non-resident Holder is exempt from Japanese income tax with respect to such dividends underthe income tax treaty applicable to such particular non-resident Holder, such non-resident Holder who is entitledto a reduced rate of or exemption from Japanese withholding tax on the payment of dividends on shares ofcommon stock by Toyota is required to submit an Application Form for Income Tax Convention RegardingRelief from Japanese Income Tax and Special Income Tax for Reconstruction on Dividends (together with anyother required forms and documents) in advance through the withholding agent to the relevant tax authoritybefore the payment of dividends. A standing proxy for non-resident Holders of a Japanese corporation mayprovide this application service. In addition, a simplified special filing procedure is available for non-residentHolders to claim treaty benefits of exemption from or reduction of Japanese withholding tax by submitting aSpecial Application Form for Income Tax Convention Regarding Relief from Japanese Income Tax and SpecialIncome Tax for Reconstruction on Dividends of Listed Stock (together with any other required forms anddocuments). With respect to ADSs, this reduced rate or exemption is applicable if the Depositary or its agentsubmits, together with other documents, two Special Application Forms (one before payment of dividends, theother within eight months after the recording date concerning such payment of dividends) to the Japanese taxauthority. To claim this reduced rate or exemption, any relevant non-resident Holder of ADSs will be required tofile proof of taxpayer status, residence and beneficial ownership (as applicable) and to provide other informationor documents as may be required by the Depositary. A non-resident Holder who is entitled, under an applicableincome tax treaty, to a reduced treaty rate lower than the withholding tax rate otherwise applicable underJapanese tax law or an exemption from the withholding tax, but fails to submit the required application inadvance, will be entitled to claim the refund of Japanese taxes withheld in excess of the rate under an applicabletax treaty (if such non-resident Holder is entitled to a reduced treaty rate under the applicable income tax treaty)or the entire amount of Japanese tax withheld (if such non-resident Holder is entitled to an exemption under theapplicable income tax treaty) by complying with a certain subsequent filing procedure. Toyota does not assumeany responsibility to ensure withholding at the reduced rate, or exemption therefrom, for non-resident Holderswho would be so eligible under an applicable tax treaty, but where the required procedures as stated above arenot followed.
Gains derived from the sale of shares of common stock or ADSs outside Japan by a non-resident Holderholding such shares of common stock or ADSs as portfolio investors are, in general, not subject to Japaneseincome tax or corporation tax under Japanese law. Eligible U.S. Holders are not subject to Japanese income orcorporation tax with respect to such gains under the Treaty so long as filings required under Japanese law aremade.
Japanese inheritance and gift taxes at progressive rates may be payable by an individual who has acquiredfrom another individual shares of common stock or ADSs as a legatee, heir or donee even though neither theindividual, nor the deceased, nor donor is a Japanese resident.
Holders of shares of common stock or ADSs should consult their tax advisors regarding the effect of thesetaxes and, in the case of U.S. Holders, the possible application of the Estate and Gift Tax Treaty between theUnited States and Japan.
120
U.S. Federal Income Taxation
U.S. Holders
The following discussion is a summary of the principal U.S. federal income tax consequences toU.S. Holders that hold shares of common stock or ADSs as capital assets (generally, for investment purposes).
Taxation of Dividends
Subject to the passive foreign investment company (“PFIC”) rules discussed below, the gross amount of anydistribution made by Toyota in respect of shares of common stock or ADSs (without reduction for Japanesewithholding taxes) will constitute a taxable dividend to the extent paid out of current or accumulated earningsand profits, as determined under U.S. federal income tax principles. The U.S. dollar amount of such a dividendgenerally will be included in the gross income of a U.S. Holder, as ordinary income, when actually orconstructively received by the U.S. Holder, in the case of shares of common stock, or by the Depositary, in thecase of ADSs. Dividends paid by Toyota will not be eligible for the dividends-received deduction generallyallowed to U.S. corporations in respect of dividends received from other U.S. corporations.
Dividends received on shares and ADSs of certain foreign corporations by non-corporate U.S. investors maybe subject to U.S. federal income tax at lower rates than other types of ordinary income if certain conditions aremet. Dividends received by non-corporate U.S. Holders with respect to shares of common stock or ADSs ofToyota are expected to be eligible for these reduced rates of tax. U.S. Holders should consult their own taxadvisors regarding the eligibility of such dividends for a reduced rate of tax.
The U.S. dollar amount of a dividend paid in Japanese yen will be determined based on the Japanese yen/U.S. dollar exchange rate in effect on the date that the dividend is included in the gross income of theU.S. Holder, regardless of whether the payment is converted into U.S. dollars on that date. Generally, any gain orloss resulting from currency exchange fluctuations during the period from the date the dividend payment isincluded in the gross income of a U.S. Holder through the date that payment is converted into U.S. dollars (orotherwise disposed of) will be treated as U.S.-source ordinary income or loss. U.S. Holders should consult theirown tax advisors regarding the calculation and U.S. federal income tax treatment of foreign currency gain or loss.
To the extent, if any, that the amount of any distribution received by a U.S. Holder in respect of shares ofcommon stock or ADSs exceeds Toyota’s current and accumulated earnings and profits, as determined underU.S. federal income tax principles, the distribution first will be treated as a tax-free return of capital to the extentof the U.S. Holder’s adjusted tax basis in those shares or ADSs, and thereafter will be treated as U.S.-sourcecapital gain.
Distributions of additional shares of common stock that are made to U.S. Holders with respect to theirshares of common stock or ADSs, and that are part of a pro rata distribution to all of Toyota’s shareholders,generally will not be subject to U.S. federal income tax.
For U.S. foreign tax credit purposes, dividends included in gross income by a U.S. Holder in respect ofshares of common stock or ADSs will constitute income from sources outside the United States, and willgenerally be “passive category income” or, in the case of certain U.S. Holders, “general category income.”Subject to generally applicable limitations under U.S. federal income tax law and the Treaty, any Japanesewithholding tax imposed in respect of a Toyota dividend may be claimed as a credit against the U.S. federalincome tax liability of a U.S. Holder, or alternatively as a deduction in the computation of such U.S. Holder’staxable income if the U.S. Holder does not elect to claim a credit for any foreign taxes paid or accrued for thetaxable year. Special rules generally will apply to the calculation of foreign tax credits in respect of dividendincome that qualifies for preferential U.S. federal income tax rates. Additionally, special rules apply toindividuals whose foreign source income during the taxable year consists entirely of “qualified passive income”and whose creditable foreign taxes paid or accrued during the taxable year do not exceed $300 ($600 in the caseof a joint return). Further, under some circumstances, a U.S. Holder that:
(i) has held shares of common stock or ADSs for less than a specified minimum period; or
121
(ii) is obligated to make payments related to Toyota dividends,
will not be allowed a foreign tax credit for Japanese taxes imposed on Toyota dividends.
U.S. Holders are urged to consult their tax advisors regarding the availability of the foreign tax credit undertheir particular circumstances.
Taxation of Capital Gains and Losses
In general, upon a sale or other taxable disposition of shares of common stock or ADSs, a U.S. Holder willrecognize gain or loss for U.S. federal income tax purposes in an amount equal to the difference between theamount realized on the sale or other taxable disposition and the U.S. Holder’s adjusted tax basis in those sharesof common stock or ADSs. A U.S. Holder generally will have an adjusted tax basis in a share of common stockor an ADS equal to its U.S. dollar cost. Subject to the PFIC rules discussed below, gain or loss recognized on thesale or other taxable disposition of shares of common stock or ADSs generally will be capital gain or loss and, ifthe U.S. Holder’s holding period for those shares or ADSs exceeds one year, will be long-term capital gain orloss. Non-corporate U.S. Holders, including individuals, currently are eligible for preferential rates ofU.S. federal income tax in respect of long-term capital gains. Under U.S. federal income tax law, the deductionof capital losses is subject to limitations. Any gain or loss recognized by a U.S. Holder in respect of the sale orother disposition of shares of common stock or ADSs generally will be treated as U.S.-source income or loss forU.S. foreign tax credit purposes.
Deposits and withdrawals of common stock in exchange for ADSs will not result in the realization of gainor loss for U.S. federal income tax purposes.
Passive Foreign Investment Companies
A non-U.S. corporation generally will be classified as a PFIC for U.S. federal income tax purposes in anytaxable year in which, after applying look-through rules, either (1) at least 75% of its gross income is passiveincome or (2) on average at least 50% of the gross value of its assets is attributable to assets that produce passiveincome or are held for the production of passive income. Passive income for this purpose generally includesdividends, interest, royalties, rents and gains from commodities and securities transactions. The PFICdetermination is made annually and generally is based on the value of a non-U.S. corporation’s assets (includinggoodwill) and composition of its income.
Toyota does not believe that it was a PFIC for U.S. federal income tax purposes for its taxable year endedMarch 31, 2016, and currently intends to continue its operations in such a manner that it will not become a PFICin the future. Because the PFIC determination is made annually and the application of the PFIC rules to acorporation such as Toyota (which among other things is engaged in leasing and financing through severalsubsidiaries) is not entirely clear, no assurances can be made regarding determination of its PFIC status in thecurrent or any future taxable year. If Toyota is determined to be a PFIC, U.S. Holders could be subject toadditional U.S. federal income taxes on gain recognized with respect to the shares of common stock or ADSs andon certain distributions. In addition, an interest charge may apply to the portion of the U.S. federal income taxliability on such gains or distributions treated under the PFIC rules as having been deferred by the U.S. Holder.Moreover, dividends that a non-corporate U.S. Holder receives from Toyota will not be eligible for the reducedU.S. federal income tax rates on dividends described above if Toyota is a PFIC either in the taxable year of thedividend or the preceding taxable year. If a U.S. Holder owns shares of common stock or ADSs in any taxableyear in which Toyota is a PFIC, such U.S. Holder generally would be required to file Internal Revenue Service(“IRS”) Form 8621 (or other form specified by the U.S. Department of the Treasury) on an annual basis, subjectto certain exceptions based on the value of PFIC stock held. Toyota will inform U.S. Holders if it believes that itwill be classified as a PFIC in any taxable year.
Prospective investors should consult their own tax advisors regarding the potential application of the PFICrules to shares of common stock or ADSs.
122
Non-U.S. Holders
The following discussion is a summary of the principal U.S. federal income tax consequences to beneficialowners of shares of common stock or ADSs that are neither U.S. Holders, nor partnerships, nor entities taxable aspartnerships for U.S. federal income tax purposes (“Non-U.S. Holders”).
A Non-U.S. Holder generally will not be subject to any U.S. federal income or withholding tax ondistributions received in respect of shares of common stock or ADSs unless the distributions are effectivelyconnected with the conduct by the Non-U.S. Holder of a trade or business within the United States (and, if anapplicable tax treaty requires, are attributable to a U.S. permanent establishment or fixed base of suchNon-U.S. Holder).
A Non-U.S. Holder generally will not be subject to U.S. federal income tax in respect of gain recognized ona sale or other disposition of shares of common stock or ADSs, unless:
(i) the gain is effectively connected with a trade or business conducted by the Non-U.S. Holder within theUnited States (and, if an applicable tax treaty requires, is attributable to a U.S. permanent establishmentor fixed base of such Non-U.S. Holder); or
(ii) the Non-U.S. Holder is an individual who was present in the United States for 183 or more days in thetaxable year of the disposition and other conditions are met.
Income that is effectively connected with a U.S. trade or business of a Non-U.S. Holder, and, if an incometax treaty applies and so requires, is attributable to a U.S. permanent establishment or fixed base of theNon-U.S. Holder, generally will be taxed in the same manner as the income of a U.S. Holder. In addition, undercertain circumstances, any effectively connected earnings and profits realized by a corporate Non-U.S. Holdermay be subject to an additional “branch profits tax” at the rate of 30% or at a lower rate that may be prescribedby an applicable income tax treaty.
Backup Withholding and Information Reporting
In general, information reporting requirements will apply to dividends paid to a U.S. Holder in respect ofshares of common stock or ADSs, and to the proceeds received upon the sale, exchange or redemption of theshares of common stock or ADSs within the United States by U.S. Holders. Furthermore, backup withholdingmay apply to those amounts (currently at a 28% rate) if a U.S. Holder fails to provide an accurate taxpayeridentification number to certify that such U.S. Holder is not subject to backup withholding or to otherwisecomply with the applicable requirements of the backup withholding requirements.
Dividends paid to a Non-U.S. Holder in respect of shares of common stock or ADSs, and proceeds receivedupon the sale, exchange or redemption of shares of common stock or ADSs by a Non-U.S. Holder, generally areexempt from information reporting and backup withholding under current U.S. federal income tax law. However,a Non-U.S. Holder may be required to provide certification of non-U.S. status in order to obtain that exemption.
Persons required to establish their exempt status generally must provide such certification under penalty ofperjury on IRS Form W-9, entitled Request for Taxpayer Identification Number and Certification, in the case ofU.S. persons, and on IRS Form W-8BEN, entitled Certificate of Foreign Status of Beneficial Owner for UnitedStates Tax Withholding and Reporting (Individuals), or IRS Form W-8BEN-E, entitled Certificate of Status ofBeneficial Owner for United States Tax Withholding and Reporting (Entities) (or other appropriate IRS FormW-8), in the case of non-U.S. persons. Backup withholding is not an additional tax. The amount of backupwithholding imposed on a payment generally may be claimed as a credit against the holder’s U.S. federal incometax liability, provided that the required information is properly furnished to the IRS in a timely manner.
In addition, certain U.S. Holders who are individuals that hold certain foreign financial assets (which mayinclude shares of common stock or ADSs) are required to report information relating to such assets, subject to
123
certain exceptions. U.S. Holders should consult their tax advisors regarding the effect, if any, of this legislationon their ownership and disposition of shares of common stock or ADSs.
THE SUMMARY OF U.S. FEDERAL INCOME AND JAPANESE NATIONAL TAX CONSEQUENCESSET OUT ABOVE IS INTENDED FOR GENERAL INFORMATION PURPOSES ONLY. PROSPECTIVEPURCHASERS OF COMMON STOCK OR ADSs ARE URGED TO CONSULT WITH THEIR OWN TAXADVISORS WITH RESPECT TO THE PARTICULAR TAX CONSEQUENCES TO THEM OF OWNING ORDISPOSING OF COMMON STOCK OR ADSs, BASED ON THEIR PARTICULAR CIRCUMSTANCES.
10.F DIVIDENDS AND PAYING AGENTS
Not applicable.
10.G STATEMENT BY EXPERTS
Not applicable.
10.H DOCUMENTS ON DISPLAY
Toyota files annual reports on Form 20-F and reports on Form 6-K with the SEC. You may read and copythis information at the SEC’s Public Reference Room at 100 F Street, N.E., Room 1580, Washington,D.C. 20549 or by accessing the SEC’s home page (http://www.sec.gov). You can also request copies of thedocuments, upon payment of a duplicating fee, by writing to the Public Reference Section of the SEC. Please callthe SEC at 1-800-SEC-0330 for further information on the operation of the Public Reference Room. In addition,Toyota’s reports, proxy statements and other information may be inspected at the offices of the New York StockExchange, 20 Broad Street, New York, New York 10005. Copies of the documents referred to herein may also beinspected at Toyota’s offices by contacting Toyota at 1 Toyota-cho, Toyota City, Aichi Prefecture 471-8571,Japan, attention: Financial Reporting Department, Accounting Division, telephone number: 81-565-28-2121.
10.I SUBSIDIARY INFORMATION
Not applicable.
ITEM 11. QUANTITATIVE AND QUALITATIVE DISCLOSURES ABOUT MARKET RISK
Quantitative and Qualitative Disclosures about Market Risk
Toyota is exposed to market risk from changes in foreign currency exchange rates, interest rates, certaincommodity and equity security prices. In order to manage the risk arising from changes in foreign currencyexchange rates and interest rates, Toyota enters into a variety of derivative financial instruments.
A description of Toyota’s accounting policies for derivative instruments is included in note 2 to theconsolidated financial statements and further disclosure is provided in notes 21 and 27 to the consolidatedfinancial statements.
Toyota monitors and manages these financial exposures as an integral part of its overall risk managementprogram, which recognizes the unpredictability of financial markets, and seeks to reduce the potentially adverseeffects on Toyota’s operating results.
The financial instruments included in the market risk analysis consist of all of Toyota’s cash and cashequivalents, marketable securities, finance receivables, securities investments, long-term and short-term debt andall derivative financial instruments. Toyota’s portfolio of derivative financial instruments consists of forward
124
foreign currency exchange contracts, foreign currency options, interest rate swaps, interest rate currency swapagreements and interest rate options. Anticipated transactions denominated in foreign currencies that are coveredby Toyota’s derivative hedging are not included in the market risk analysis. Although operating leases are notrequired to be included, Toyota has included these instruments in determining interest rate risk.
Foreign Currency Exchange Rate Risk
Toyota has foreign currency exposures related to buying, selling and financing in currencies other than thelocal currencies in which it operates. Toyota is exposed to foreign currency risk related to future earnings orassets and liabilities that are exposed due to operating cash flows and various financial instruments that aredenominated in foreign currencies. Toyota’s most significant foreign currency exposures relate to the U.S. dollarand the euro.
Toyota uses a value-at-risk analysis (“VAR”) to evaluate its exposure to changes in foreign currencyexchange rates. The VAR of the combined foreign exchange position represents a potential loss in pre-taxearnings that was estimated to be ¥163.4 billion and ¥155.1 billion as of March 31, 2015 and 2016, respectively.Based on Toyota’s overall currency exposure (including derivative positions), the risk during fiscal 2016 topre-tax cash flow from currency movements was on average ¥164.7 billion, with a high of ¥172.2 billion and alow of ¥155.1 billion.
The VAR was estimated by using a Monte Carlo Simulation Method and assumed 95% confidence level onthe realization date and a 10-day holding period.
Interest Rate Risk
Toyota is subject to market risk from exposures to changes in interest rates based on its financing, investingand cash management activities. Toyota enters into various financial instrument transactions to maintain thedesired level of exposure to the risk of interest rate fluctuations and to minimize interest expense. The potentialdecrease in fair value resulting from a hypothetical 100 basis point upward shift in interest rates would beapproximately ¥244.9 billion as of March 31, 2015 and ¥231.2 billion as of March 31, 2016.
There are certain shortcomings inherent to the sensitivity analyses presented. The model assumes thatinterest rate changes are instantaneous parallel shifts in the yield curve. However, in reality, changes are rarelyinstantaneous. Although certain assets and liabilities may have similar maturities or periods to repricing, theymay not react correspondingly to changes in market interest rates. Also, the interest rates on certain types ofassets and liabilities may fluctuate with changes in market interest rates, while interest rates on other types ofassets may lag behind changes in market rates. Finance receivables are less susceptible to prepayments wheninterest rates change and, as a result, Toyota’s model does not address prepayment risk for automotive relatedfinance receivables. However, in the event of a change in interest rates, actual loan prepayments may deviatesignificantly from the assumptions used in the model.
Commodity Price Risk
Commodity price risk is the possibility of higher or lower costs due to changes in the prices of commodities,such as non-ferrous alloys (e.g., aluminum), precious metals (e.g., palladium, platinum and rhodium) and ferrousalloys, which Toyota uses in the production of motor vehicles. Toyota does not use derivative instruments tohedge the price risk associated with the purchase of those commodities and controls its commodity price risk byholding minimum stock levels.
Equity Price Risk
Toyota holds investments in various available-for-sale equity securities that are subject to price risk. Thefair value of available-for-sale equity securities was ¥2,704.8 billion as of March 31, 2015 and ¥2,558.9 billion as
125
of March 31, 2016. The potential change in the fair value of these investments, assuming a 10% change in prices,would be approximately ¥270.4 billion as of March 31, 2015 and ¥255.8 billion as of March 31, 2016.
ITEM 12. DESCRIPTION OF SECURITIES OTHER THAN EQUITY SECURITIES
12.A DEBT SECURITIES
Not applicable.
12.B WARRANTS AND RIGHTS
Not applicable.
12.C OTHER SECURITIES
Not applicable.
12.D AMERICAN DEPOSITARY SHARES
Fees and Charges for Holders of American Depositary Receipts
The Bank of New York Mellon, as Depositary for the ADSs, collects its fees for delivery and surrender ofADSs directly from investors depositing shares or surrendering ADSs for the purpose of withdrawal or fromintermediaries acting for them. The Depositary collects fees for making distributions to investors by deductingthose fees from the amounts distributed or by selling a portion of distributable property to pay the fees. TheDepositary may generally refuse to provide fee-attracting services until its fees for those services are paid.
Persons depositing or withdrawing shares must pay: For:
$5.00 (or less) per 100 ADSs (or portion of 100 ADSs) • Issuance of ADSs, including issuances resultingfrom a distribution, sale or exercise of shares orrights or other property
• Cancellation of ADSs for the purpose ofwithdrawal including if the deposit agreementterminates
$0.02 (or less) per ADS • Any cash distribution to ADS registered holders
A fee equivalent to the fee that would be payable ifsecurities distributed to the ADR holder had been sharesand the shares had been deposited for issuance of ADSs
• Distribution of securities distributed to holdersof deposited securities which are distributed bythe Depositary to ADS registered holders
Registration fees • Registration of transfer of shares on Toyota’sshare register to the name of the Depositary orits nominee or the custodian or its nomineewhen shares are deposited or withdrawn
Expenses of the Depositary • Cable, telex and facsimile transmissions (whenexpressly provided in the deposit agreement)
• Converting foreign currency to U.S. dollars
Taxes and other governmental charges the Depositary orthe custodian have to pay on any ADS or shareunderlying an ADS
• As necessary
126
Fees Incurred in Fiscal 2016
For fiscal 2016, Toyota received $326,319.23 from the Depositary for standard out-of-pocket maintenancecosts for the ADRs (consisting of the expenses of postage and envelopes for mailing annual reports, printing anddistributing dividend checks, stationery, postage, facsimile, and telephone calls) and expenses relating toToyota’s annual general shareholders’ meeting that are incurred with respect to Toyota’s ADR holders. TheDepositary also paid Toyota’s continuing annual stock exchange listing fees.
Fees to be Paid in the Future
With regards to the ADS program, the Depositary has agreed to pay the standard out-of-pocket maintenancecosts for the ADRs, which includes the expenses of postage and envelopes for mailing annual reports, printingand distributing dividend checks, stationery, postage, facsimile and telephone calls. It has also agreed to pay forinvestor relations expenses and any other program related expenses. The limit on the amount of expenses forwhich the Depositary will pay is the sum of $300,000 annually. In addition, the Depositary has agreed to payToyota 50% of the net dividend fees collected by the Depositary during each annual period towards theaforementioned expenses.
127
PART II
ITEM 13. DEFAULTS, DIVIDEND ARREARAGES AND DELINQUENCIES
None.
ITEM 14. MATERIAL MODIFICATIONS TO THE RIGHTS OF SECURITY HOLDERS AND USE OFPROCEEDS
On June 16, 2015, Toyota amended its articles of incorporation in connection with establishment of ModelAA Class Shares pursuant to resolutions adopted by its shareholders at the general shareholders’ meeting on thesame date. The amended articles of incorporation are incorporated by reference as Exhibit 1.1 to Toyota’sAnnual Report on Form 20-F for the fiscal year ended March 31, 2015, filed with the SEC on June 24, 2015 (fileno. 001-14948). For more information on Toyota’s articles of incorporation, please see Item 10.B “AdditionalInformation – Memorandum and Articles of Association.”
ITEM 15. CONTROLS AND PROCEDURES
(a) DISCLOSURE CONTROLS AND PROCEDURES
Toyota performed an evaluation of the effectiveness of the design and operation of its disclosure controlsand procedures as of the end of the fiscal 2016. Disclosure controls and procedures are designed to ensure thatinformation required to be disclosed in the Form 20-F that Toyota files under the Exchange Act is accumulatedand communicated to its management, including the chief executive officer and the principal accounting andfinancial officer, to allow timely decision regarding required disclosure. The disclosure controls and proceduresalso ensures that the Form 20-F that it files under the Exchange Act is recorded, processed, summarized andreported within the time periods specified in the Commission’s rules and forms. The evaluation was performedunder the supervision of Toyota’s Chairman of the Board of Directors and the Executive Vice President.Toyota’s disclosure controls and procedures are designed to provide reasonable assurance of achieving itsobjectives. Managerial judgment was necessary to evaluate the cost-benefit relationship of possible controls andprocedures. The Chairman of the Board of Directors and the Executive Vice President have concluded thatToyota’s disclosure controls and procedures are effective at the reasonable assurance level.
(b) MANAGEMENT’S ANNUAL REPORT ON INTERNAL CONTROL OVER FINANCIALREPORTING
Toyota’s management is responsible for establishing and maintaining effective internal control overfinancial reporting. Internal control over financial reporting is a process designed to provide reasonable assuranceregarding the reliability of financial reporting and the preparation of financial statements for external purposes inaccordance with U.S. GAAP. Toyota’s internal control over financial reporting includes those policies andprocedures that:
(i) pertain to the maintenance of records that in reasonable detail, accurately and fairly reflect thetransactions and dispositions of Toyota’s assets;
(ii) provide reasonable assurance that transactions are recorded as necessary to permit preparation offinancial statements in accordance with U.S. GAAP, and that Toyota’s receipts and expenditures arebeing made only in accordance with authorizations of Toyota’s management and members of the boardof directors; and
(iii) provide reasonable assurance regarding prevention or timely detection of unauthorized acquisition, use,or disposition of Toyota’s assets that could have a material effect on the financial statements.
Because of its inherent limitations, internal control over financial reporting may not prevent or detectmisstatements. Also, projections of any evaluation of effectiveness to future periods are subject to the risk thatcontrols may become inadequate because of changes in conditions, or that the degree of compliance with thepolicies or procedures may deteriorate.
128
Toyota’s management conducted an evaluation of the effectiveness of internal control over financialreporting based on the framework in “Internal Control — Integrated Framework (2013)” issued by theCommittee of Sponsoring Organizations of the Treadway Commission.
Based on this evaluation, management concluded that Toyota’s internal control over financial reporting waseffective as of March 31, 2016.
PricewaterhouseCoopers Aarata, an independent registered public accounting firm that audited theconsolidated financial statements included in this report, has also audited the effectiveness of Toyota’s internalcontrol over financial reporting as of March 31, 2016, as stated in its report included herein.
(c) ATTESTATION REPORT OF THE REGISTERED PUBLIC ACCOUNTING FIRM
Toyota’s independent registered public accounting firm, PricewaterhouseCoopers Aarata, has issued anaudit report on the effectiveness of Toyota’s internal control over financial reporting. This report appears inItem 18.
(d) CHANGES IN INTERNAL CONTROL OVER FINANCIAL REPORTING
There have been no changes in Toyota’s internal control over financial reporting during fiscal 2016 thathave materially affected, or are reasonably likely to materially affect, Toyota’s internal control over financialreporting.
ITEM 16. [RESERVED]
ITEM 16A. AUDIT COMMITTEE FINANCIAL EXPERT
Toyota maintains an audit & supervisory board system, in accordance with the Companies Act. Toyota’saudit & supervisory board is comprised of six audit & supervisory board members, three of whom are outsideaudit & supervisory board members. Each audit & supervisory board member has been appointed at Toyota’smeetings of shareholders and has certain statutory powers independently, including auditing the business affairsand accounts of Toyota.
Toyota’s audit & supervisory board has determined that it does not have an “audit committee financialexpert” serving on the audit & supervisory board. The qualifications for, and powers of, the audit & supervisoryboard member delineated in the Companies Act are different from those anticipated for any audit committeefinancial expert. Audit & supervisory board members have the authority to be given reports from a certifiedpublic accountant or an accounting firm concerning audits, including technical accounting matters. At the sametime, each audit & supervisory board member has the authority to consult internal and external experts onaccounting matters. Each audit & supervisory board member must fulfill the requirements under Japanese lawsand regulations and otherwise follow Japanese corporate governance practices and, accordingly, Toyota’saudit & supervisory board has confirmed that it is not necessarily in Toyota’s best interest to nominate as audit &supervisory board member a person who meets the definition of audit committee financial experts. AlthoughToyota does not have an audit committee financial expert on its audit & supervisory board, Toyota believes thatToyota’s current corporate governance system, taken as a whole, including the audit & supervisory boardmembers’ ability to consult internal and external experts, is fully equivalent to a system having an auditcommittee financial expert on its audit & supervisory board.
ITEM 16B. CODE OF ETHICS
Toyota has adopted a code of ethics that applies to its members of the board of directors and managingofficers, including its principal executive officer, principal financial officer, principal accounting officer orcontroller, or persons performing similar functions. A copy of Toyota’s code of ethics is included as an exhibit tothis annual report on Form 20-F.
129
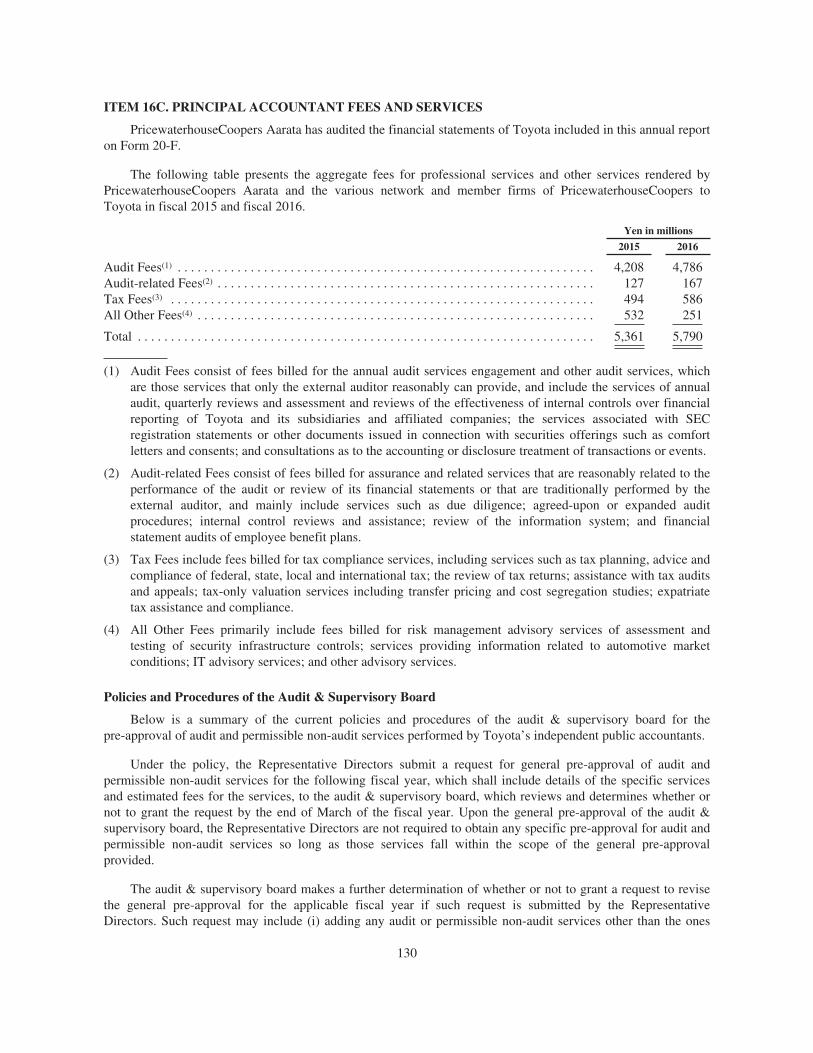
ITEM 16C. PRINCIPAL ACCOUNTANT FEES AND SERVICES
PricewaterhouseCoopers Aarata has audited the financial statements of Toyota included in this annual reporton Form 20-F.
The following table presents the aggregate fees for professional services and other services rendered byPricewaterhouseCoopers Aarata and the various network and member firms of PricewaterhouseCoopers toToyota in fiscal 2015 and fiscal 2016.
Yen in millions
2015 2016
Audit Fees(1) . . . . . . . . . . . . . . . . . . . . . . . . . . . . . . . . . . . . . . . . . . . . . . . . . . . . . . . . . . . . . . . 4,208 4,786Audit-related Fees(2) . . . . . . . . . . . . . . . . . . . . . . . . . . . . . . . . . . . . . . . . . . . . . . . . . . . . . . . . . 127 167Tax Fees(3) . . . . . . . . . . . . . . . . . . . . . . . . . . . . . . . . . . . . . . . . . . . . . . . . . . . . . . . . . . . . . . . . 494 586All Other Fees(4) . . . . . . . . . . . . . . . . . . . . . . . . . . . . . . . . . . . . . . . . . . . . . . . . . . . . . . . . . . . . 532 251
Total . . . . . . . . . . . . . . . . . . . . . . . . . . . . . . . . . . . . . . . . . . . . . . . . . . . . . . . . . . . . . . . . . . . . . 5,361 5,790
(1) Audit Fees consist of fees billed for the annual audit services engagement and other audit services, whichare those services that only the external auditor reasonably can provide, and include the services of annualaudit, quarterly reviews and assessment and reviews of the effectiveness of internal controls over financialreporting of Toyota and its subsidiaries and affiliated companies; the services associated with SECregistration statements or other documents issued in connection with securities offerings such as comfortletters and consents; and consultations as to the accounting or disclosure treatment of transactions or events.
(2) Audit-related Fees consist of fees billed for assurance and related services that are reasonably related to theperformance of the audit or review of its financial statements or that are traditionally performed by theexternal auditor, and mainly include services such as due diligence; agreed-upon or expanded auditprocedures; internal control reviews and assistance; review of the information system; and financialstatement audits of employee benefit plans.
(3) Tax Fees include fees billed for tax compliance services, including services such as tax planning, advice andcompliance of federal, state, local and international tax; the review of tax returns; assistance with tax auditsand appeals; tax-only valuation services including transfer pricing and cost segregation studies; expatriatetax assistance and compliance.
(4) All Other Fees primarily include fees billed for risk management advisory services of assessment andtesting of security infrastructure controls; services providing information related to automotive marketconditions; IT advisory services; and other advisory services.
Policies and Procedures of the Audit & Supervisory Board
Below is a summary of the current policies and procedures of the audit & supervisory board for thepre-approval of audit and permissible non-audit services performed by Toyota’s independent public accountants.
Under the policy, the Representative Directors submit a request for general pre-approval of audit andpermissible non-audit services for the following fiscal year, which shall include details of the specific servicesand estimated fees for the services, to the audit & supervisory board, which reviews and determines whether ornot to grant the request by the end of March of the fiscal year. Upon the general pre-approval of the audit &supervisory board, the Representative Directors are not required to obtain any specific pre-approval for audit andpermissible non-audit services so long as those services fall within the scope of the general pre-approvalprovided.
The audit & supervisory board makes a further determination of whether or not to grant a request to revisethe general pre-approval for the applicable fiscal year if such request is submitted by the RepresentativeDirectors. Such request may include (i) adding any audit or permissible non-audit services other than the ones
130
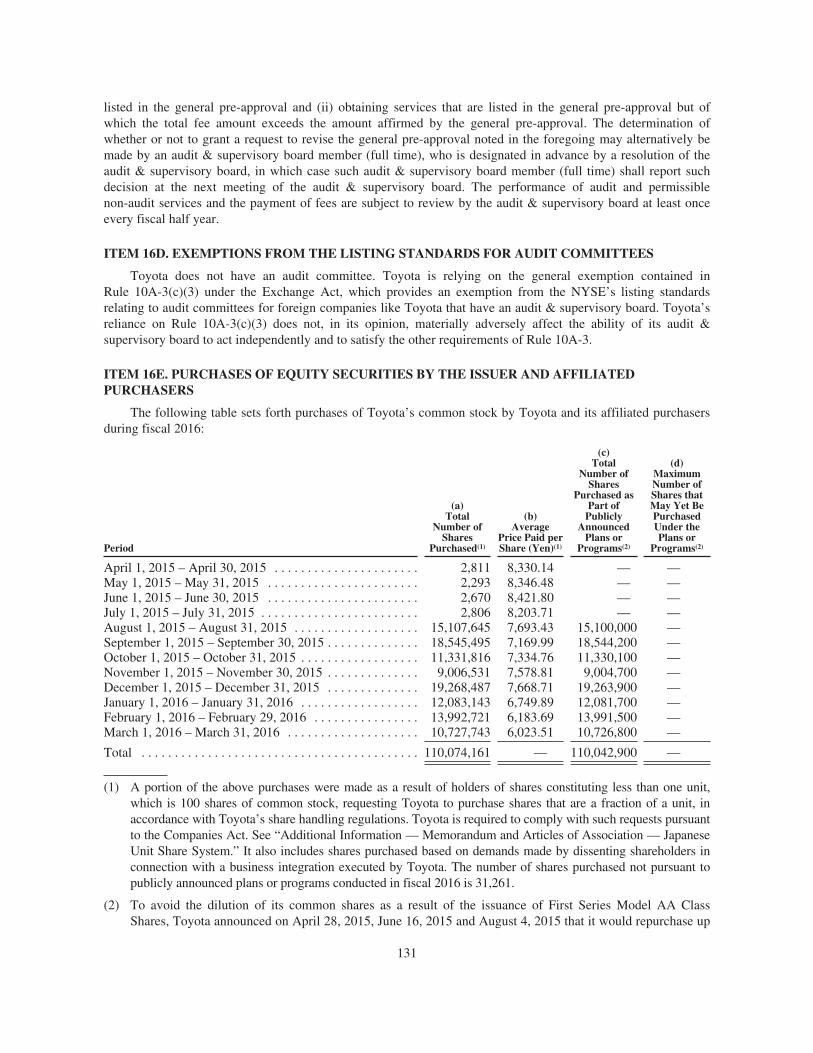
listed in the general pre-approval and (ii) obtaining services that are listed in the general pre-approval but ofwhich the total fee amount exceeds the amount affirmed by the general pre-approval. The determination ofwhether or not to grant a request to revise the general pre-approval noted in the foregoing may alternatively bemade by an audit & supervisory board member (full time), who is designated in advance by a resolution of theaudit & supervisory board, in which case such audit & supervisory board member (full time) shall report suchdecision at the next meeting of the audit & supervisory board. The performance of audit and permissiblenon-audit services and the payment of fees are subject to review by the audit & supervisory board at least onceevery fiscal half year.
ITEM 16D. EXEMPTIONS FROM THE LISTING STANDARDS FOR AUDIT COMMITTEES
Toyota does not have an audit committee. Toyota is relying on the general exemption contained inRule 10A-3(c)(3) under the Exchange Act, which provides an exemption from the NYSE’s listing standardsrelating to audit committees for foreign companies like Toyota that have an audit & supervisory board. Toyota’sreliance on Rule 10A-3(c)(3) does not, in its opinion, materially adversely affect the ability of its audit &supervisory board to act independently and to satisfy the other requirements of Rule 10A-3.
ITEM 16E. PURCHASES OF EQUITY SECURITIES BY THE ISSUER AND AFFILIATEDPURCHASERS
The following table sets forth purchases of Toyota’s common stock by Toyota and its affiliated purchasersduring fiscal 2016:
Period
(a)Total
Number ofShares
Purchased(1)
(b)Average
Price Paid perShare (Yen)(1)
(c)Total
Number ofShares
Purchased asPart of
PubliclyAnnounced
Plans orPrograms(2)
(d)MaximumNumber ofShares thatMay Yet BePurchasedUnder thePlans or
Programs(2)
April 1, 2015 – April 30, 2015 . . . . . . . . . . . . . . . . . . . . . . 2,811 8,330.14 — —May 1, 2015 – May 31, 2015 . . . . . . . . . . . . . . . . . . . . . . . 2,293 8,346.48 — —June 1, 2015 – June 30, 2015 . . . . . . . . . . . . . . . . . . . . . . . 2,670 8,421.80 — —July 1, 2015 – July 31, 2015 . . . . . . . . . . . . . . . . . . . . . . . . 2,806 8,203.71 — —August 1, 2015 – August 31, 2015 . . . . . . . . . . . . . . . . . . . 15,107,645 7,693.43 15,100,000 —September 1, 2015 – September 30, 2015 . . . . . . . . . . . . . . 18,545,495 7,169.99 18,544,200 —October 1, 2015 – October 31, 2015 . . . . . . . . . . . . . . . . . . 11,331,816 7,334.76 11,330,100 —November 1, 2015 – November 30, 2015 . . . . . . . . . . . . . . 9,006,531 7,578.81 9,004,700 —December 1, 2015 – December 31, 2015 . . . . . . . . . . . . . . 19,268,487 7,668.71 19,263,900 —January 1, 2016 – January 31, 2016 . . . . . . . . . . . . . . . . . . 12,083,143 6,749.89 12,081,700 —February 1, 2016 – February 29, 2016 . . . . . . . . . . . . . . . . 13,992,721 6,183.69 13,991,500 —March 1, 2016 – March 31, 2016 . . . . . . . . . . . . . . . . . . . . 10,727,743 6,023.51 10,726,800 —
Total . . . . . . . . . . . . . . . . . . . . . . . . . . . . . . . . . . . . . . . . . . 110,074,161 — 110,042,900 —
(1) A portion of the above purchases were made as a result of holders of shares constituting less than one unit,which is 100 shares of common stock, requesting Toyota to purchase shares that are a fraction of a unit, inaccordance with Toyota’s share handling regulations. Toyota is required to comply with such requests pursuantto the Companies Act. See “Additional Information — Memorandum and Articles of Association — JapaneseUnit Share System.” It also includes shares purchased based on demands made by dissenting shareholders inconnection with a business integration executed by Toyota. The number of shares purchased not pursuant topublicly announced plans or programs conducted in fiscal 2016 is 31,261.
(2) To avoid the dilution of its common shares as a result of the issuance of First Series Model AA ClassShares, Toyota announced on April 28, 2015, June 16, 2015 and August 4, 2015 that it would repurchase up
131
to 47.1 million common shares between August 10, 2015 and November 30, 2015 at a total price up to¥600 billion. In addition, Toyota announced on May 8, 2015, August 4, 2015 and November 5, 2015 that itwould repurchase up to 40 million common shares between November 16, 2015 and January 29, 2016 at atotal price up to ¥300 billion, in order to return to shareholders the profits derived in the fiscal year endedMarch 31, 2015. Toyota also announced on November 5, 2015 and February 5, 2016 that it wouldrepurchase up to 23 million common shares between February 8, 2016 and March 24, 2016 at a total priceup to ¥150 billion in order to return to shareholders the profits derived in the interim period endedSeptember 30, 2015.
ITEM 16F. CHANGE IN REGISTRANT’S CERTIFYING ACCOUNTANT
Not applicable.
ITEM 16G. CORPORATE GOVERNANCE
Significant Differences in Corporate Governance Practices between Toyota and U.S. Companies Listed onthe NYSE
Pursuant to home country practices exemptions granted by the NYSE, Toyota is permitted to follow certaincorporate governance practices complying with Japanese laws, regulations and stock exchange rules in lieu of theNYSE’s listing standards. The SEC approved changes to the NYSE’s listing standards related to corporategovernance practices of listed companies (the “NYSE Corporate Governance Rules”) in November 2003, asfurther amended in November 2004. Toyota is exempt from the approved changes, except for requirements that(a) Toyota’s audit & supervisory board satisfies the requirements of Rule 10A-3 under the Securities ExchangeAct of 1934, as amended (the “Exchange Act”), (b) Toyota must disclose significant differences in its corporategovernance practices as compared to those followed by domestic companies under the NYSE listing standards,(c) Toyota’s principal executive officer must notify the NYSE in writing after any executive officer of Toyotabecomes aware of any non-compliance with (a) and (b), and (d) Toyota must submit annual and interim writtenaffirmations to the NYSE. Toyota’s corporate governance practices and those followed by domestic companiesunder the NYSE Corporate Governance Rules have the following significant differences:
1. Members of the Board of Directors. Toyota currently does not have any members of the board ofdirectors who will be deemed an “independent director” as required under the NYSE Corporate GovernanceRules for U.S. listed companies. Unlike the NYSE Corporate Governance Rules, the Companies Act does notrequire Japanese companies with an audit & supervisory board such as Toyota to have any independent directorson its board of directors. While the NYSE Corporate Governance Rules require that the non-managementdirectors of each listed company meet at regularly scheduled executive sessions without management, Toyotacurrently has no non-management member on its board of directors. Unlike the NYSE Corporate GovernanceRules, the Companies Act does not require, and accordingly Toyota does not have, an internal corporate organ orcommittee comprised solely of independent directors.
Toyota currently has three outside members of the board of directors under the Companies Act. An“outside” member of the board of directors refers to:
(a) the person who is not, and has never been during the 10 year period before becoming an outside memberof the board of directors, an executive director (a member of the board of directors who engages in the executionof business), executive officer, manager or employee (collectively, “Executive Director, etc.”) of Toyota or itssubsidiaries;
(b) if the person was a member of the board of directors, accounting counselor (in the case that anaccounting counselor is a legal entity, an employee of such entity who is in charge of its affairs) or audit &supervisory board member (excluding those who have ever been Executive Directors, etc.) of Toyota or any of itssubsidiaries at any time during the 10 year period before becoming an outside member of the board of directors,
132
such person who has not been an Executive Director, etc. of Toyota or any of its subsidiaries during the 10 yearperiod before becoming a member of the board of directors, accounting counselor or audit & supervisory boardmember; and
(c) the person who is not a spouse or relative within the second degree of kinship of any member of theboard of directors or manager or other key employee of Toyota.
Such qualifications for an “outside” member of the board of directors are different from the directorindependence requirements under the NYSE Corporate Governance Rules.
In addition, pursuant to the regulations of the Japanese stock exchanges, Toyota is required to have one ormore “independent director(s)/audit & supervisory board member(s),” defined under the relevant regulations ofthe Japanese stock exchanges as “outside directors” or “outside audit & supervisory board members” (as definedunder the Companies Act), who are unlikely to have any conflicts of interests with Toyota’s generalshareholders, and is also required to make efforts to have at least one “independent director(s)/audit &supervisory board member(s)” who is also a director. Each of the outside members of the board of directors ofToyota satisfies the “independent director/audit & supervisory board member” requirements under theregulations of the Japanese stock exchanges. Japan’s Corporate Governance Code provides that companiesshould appoint at least two “independent outside directors” as defined based on the criteria for assessing directorindependence established by Toyota in line with the independence standards of the Japanese stock exchanges.The content of the criteria for assessing director independence established by Toyota is the same as that of theindependence standards of the Japanese stock exchanges, and each of the outside members of the board ofdirectors of Toyota satisfies the “independent outside director” requirements under such independence standards.The definition of “independent director/audit & supervisory board member” and “independent outside director”is different from that of the definition of independent director under the NYSE Corporate Governance Rules.
2. Committees. Under the Companies Act, Toyota has elected to structure its corporate governance systemas a company with audit & supervisory board members who are under a statutory duty to monitor, review andreport on the management of the affairs of Toyota. Toyota, as with other Japanese companies with an audit &supervisory board, does not have certain committees that are required of U.S. listed companies subject to theNYSE Corporate Governance Rules, including those that are responsible for director nomination, corporategovernance and executive compensation. However, members of Toyota’s “Executive Appointment Meeting” and“Executive Compensation Meeting,” both consisting of the Chairman, President, Executive Vice President incharge of human resources and an outside director, discuss recommendations to the board of directors concerningnominees and remuneration for members of the board of directors, respectively.
Pursuant to the Companies Act, Toyota’s board of directors nominates and submits a proposal for theappointment of members of the board of directors for shareholder approval. The shareholders vote on suchnomination at the general shareholders’ meeting. The Companies Act requires that the limits or calculationformula and kind (in case that the remuneration, bonus and any other benefits in compensation for the executionof duties (“remuneration, etc.”) are to be paid in other than cash) of remuneration, etc. to be paid to directors aswell as limits of remuneration, etc. to be paid to audit & supervisory board members must be determined by aresolution of the general shareholders’ meeting, unless their remuneration, etc. is provided for in the articles ofincorporation. The distribution of remuneration, etc. among each member of the board of directors is broadlydelegated to the board of directors and the distribution of remuneration among each audit & supervisory boardmember is determined by consultation among the audit & supervisory board members.
3. Audit Committee. Toyota avails itself of paragraph (c)(3) of Rule 10A-3 of the Exchange Act, whichprovides a general exemption from the audit committee requirements to a foreign private issuer with an audit &supervisory board, subject to certain requirements which continue to be applicable under Rule 10A-3.
133
Pursuant to the requirements of the Companies Act, Toyota elects its audit & supervisory board membersthrough a resolution adopted at a general shareholders’ meeting. Toyota currently has six audit & supervisoryboard members, which exceeds the minimum number of audit & supervisory board members required pursuant tothe Companies Act.
Unlike the NYSE Corporate Governance Rules, the Companies Act, among others, does not require audit &supervisory board members to establish an expertise in accounting or financial management nor are they requiredto present other special knowledge and experience. Therefore, none of Toyota’s audit & supervisory boardmembers has “an expertise in accounting or financial management” as set forth in the NYSE CorporateGovernance Rules. The Japanese Corporate Governance Code indicates that one or more audit & supervisoryboard members who have appropriate knowledge of finance and accounting matters should be appointed. Toyotahas appointed persons who are able to provide opinions and advice regarding management based on their broaderexperience and discretion beyond finance and accounting. Under the Companies Act, the audit & supervisoryboard may determine the auditing policies and methods of investigating the conditions of Toyota’s business andassets, and may resolve other matters concerning the execution of the audit & supervisory board member’sduties. The audit & supervisory board also prepares auditors’ reports, gives consent to proposals of thenomination of audit & supervisory board members and makes decisions concerning proposals relating to theappointment and dismissal of accounting auditors.
Toyota currently has three outside audit & supervisory board members under the Companies Act. Under theCompanies Act, at least half of the audit & supervisory board members must be an “outside” audit & supervisoryboard member, which is any person who satisfies all of the following requirements:
(a) the person has never been a member of the board of directors, accounting counselor (in the case that anaccounting counselor is a legal entity, an employee of such entity who is in charge of its affairs),executive officer, manager or employee of Toyota or its subsidiaries during the 10 year period beforebecoming an outside audit & supervisory board member;
(b) if the person was an audit & supervisory board member of Toyota or any of its subsidiaries at any timeduring the 10 year period before becoming an outside audit & supervisory board member, such personhas not been a member of the board of directors, accounting counselor (in the case that an accountingcounselor is a legal entity, an employee of such entity who is in charge of its affairs), executive officer,manager or employee of Toyota or any of its subsidiaries during the 10 year period before becoming anaudit & supervisory board member of Toyota or any of its subsidiaries; and
(c) the person is not a spouse or relative within the second degree of kinship of any member of the boardof directors or manager or other key employee of Toyota.
Such qualifications for an “outside” audit & supervisory board member are different from the auditcommittee independence requirement under the NYSE Corporate Governance Rules.
Each of the outside audit & supervisory board members of Toyota satisfies the “independent director/audit & supervisory board member” requirements under the regulations of the Japanese stock exchanges, asdescribed above in “1. Members of the Board of Directors.”
4. Corporate Governance Guidelines. Unlike the NYSE Corporate Governance Rules, Toyota is notrequired to adopt Japan’s Corporate Governance Code under Japanese laws and regulations, including theCompanies Act, the Financial Instruments and Exchange Law of Japan and stock exchange rules. However, ifToyota does not comply with Japan’s Corporate Governance Code, it is required to explain the reasons why itdoes not do so in accordance with the regulations of the Japanese stock exchanges. In addition, Toyota isrequired to resolve at the board of directors matters relating to a system, which is required under the ordinance ofthe Ministry of Justice (“internal control system” or “naibu-tosei”), to ensure the execution of duties of themembers of the board of directors to comply with laws, regulations and articles of incorporation, and any othersystems to ensure the adequacy of the business, and to disclose such matters resolved, policies and the present
134
status of its corporate governance in its business reports, annual securities report and certain other disclosuredocuments in accordance with the regulations under the Financial Instruments and Exchange Law and stockexchange rules in respect of timely disclosure.
5. Code of Business Conduct and Ethics. Similar to the NYSE Corporate Governance Rules, under Japan’sCorporate Governance Code, Toyota is encouraged to adopt a code of conduct regarding ethical businessactivities for members of the board of directors, officers and employees. Toyota has resolved matters relating tomaintenance of an “internal control system,” or “naibu-tosei,” in order to ensure its employees comply with laws,regulations and the articles of incorporation, etc. pursuant to the Companies Act, and Toyota maintainsguidelines and internal regulations such as “Guiding Principles at Toyota,” “Toyota Code of Conduct” and a codeof ethics pursuant to Section 406 of the Sarbanes-Oxley Act. Please see “Code of Ethics” for additionalinformation.
ITEM 16H. MINE SAFETY DISCLOSURE
Not applicable.
135

PART III
ITEM 17. FINANCIAL STATEMENTS
Not applicable.
ITEM 18. FINANCIAL STATEMENTS
The following financial statements are filed as part of this annual report on Form 20-F.
136
TOYOTA MOTOR CORPORATION
INDEX TO CONSOLIDATED FINANCIAL STATEMENTS
Page
Report of Independent Registered Public Accounting Firm . . . . . . . . . . . . . . . . . . . . . . . . . . . . . . . . . . . . . F-2
Consolidated balance sheets at March 31, 2015 and 2016 . . . . . . . . . . . . . . . . . . . . . . . . . . . . . . . . . . . . . . . F-3
Consolidated statements of income for the years endedMarch 31, 2014, 2015 and 2016 . . . . . . . . . . . . . . . . . . . . . . . . . . . . . . . . . . . . . . . . . . . . . . . . . . . . . . . . . F-5
Consolidated statements of comprehensive income for the years endedMarch 31, 2014, 2015 and 2016 . . . . . . . . . . . . . . . . . . . . . . . . . . . . . . . . . . . . . . . . . . . . . . . . . . . . . . . . . F-6
Consolidated statements of shareholders’ equity for the years endedMarch 31, 2014, 2015 and 2016 . . . . . . . . . . . . . . . . . . . . . . . . . . . . . . . . . . . . . . . . . . . . . . . . . . . . . . . . . F-7
Consolidated statements of cash flows for the years endedMarch 31, 2014, 2015 and 2016 . . . . . . . . . . . . . . . . . . . . . . . . . . . . . . . . . . . . . . . . . . . . . . . . . . . . . . . . . F-9
Notes to consolidated financial statements . . . . . . . . . . . . . . . . . . . . . . . . . . . . . . . . . . . . . . . . . . . . . . . . . . . F-10
All financial statements schedules are omitted because they are not applicable or the required information isshown in the financial statements or the notes thereto.
Financial statements of 50% or less owned persons accounted for by the equity method have been omittedbecause the registrant’s proportionate share of the income from continuing operations before income taxes is lessthan 20% of consolidated income from continuing operations before income taxes and the investment in andadvances to each company is less than 20% of consolidated total assets.
F-1
Report of Independent Registered Public Accounting Firm
To the Shareholders and Board of Directors ofToyota Jidosha Kabushiki Kaisha(“Toyota Motor Corporation”)
In our opinion, the consolidated financial statements listed in the accompanying index present fairly, in allmaterial respects, the financial position of Toyota Motor Corporation and its subsidiaries at March 31, 2015 and2016, and the results of their operations and their cash flows for each of the three years in the period endedMarch 31, 2016 in conformity with accounting principles generally accepted in the United States of America.Also in our opinion, the Company maintained, in all material respects, effective internal control over financialreporting as of March 31, 2016, based on criteria established in Internal Control—Integrated Framework (2013)issued by the Committee of Sponsoring Organizations of the Treadway Commission (COSO). The Company’smanagement is responsible for these financial statements, for maintaining effective internal control over financialreporting and for its assessment of the effectiveness of internal control over financial reporting, included inManagement’s Annual Report on Internal Control Over Financial Reporting appearing under Item 15(b). Ourresponsibility is to express opinions on these financial statements, and on the Company’s internal control overfinancial reporting based on our integrated audits. We conducted our audits in accordance with the standards ofthe Public Company Accounting Oversight Board (United States). Those standards require that we plan andperform the audits to obtain reasonable assurance about whether the financial statements are free of materialmisstatement and whether effective internal control over financial reporting was maintained in all materialrespects. Our audits of the financial statements included examining, on a test basis, evidence supporting theamounts and disclosures in the financial statements, assessing the accounting principles used and significantestimates made by management, and evaluating the overall financial statement presentation. Our audit of internalcontrol over financial reporting included obtaining an understanding of internal control over financial reporting,assessing the risk that a material weakness exists, and testing and evaluating the design and operatingeffectiveness of internal control based on the assessed risk. Our audits also included performing such otherprocedures as we considered necessary in the circumstances. We believe that our audits provide a reasonablebasis for our opinions.
A company’s internal control over financial reporting is a process designed to provide reasonable assuranceregarding the reliability of financial reporting and the preparation of financial statements for external purposes inaccordance with generally accepted accounting principles. A company’s internal control over financial reportingincludes those policies and procedures that (i) pertain to the maintenance of records that, in reasonable detail,accurately and fairly reflect the transactions and dispositions of the assets of the company; (ii) provide reasonableassurance that transactions are recorded as necessary to permit preparation of financial statements in accordancewith generally accepted accounting principles, and that receipts and expenditures of the company are being madeonly in accordance with authorizations of management and directors of the company; and (iii) provide reasonableassurance regarding prevention or timely detection of unauthorized acquisition, use, or disposition of thecompany’s assets that could have a material effect on the financial statements.
Because of its inherent limitations, internal control over financial reporting may not prevent or detectmisstatements. Also, projections of any evaluation of effectiveness to future periods are subject to the risk thatcontrols may become inadequate because of changes in conditions, or that the degree of compliance with thepolicies or procedures may deteriorate.
/s/ PricewaterhouseCoopers AarataNagoya, JapanJune 24, 2016
F-2
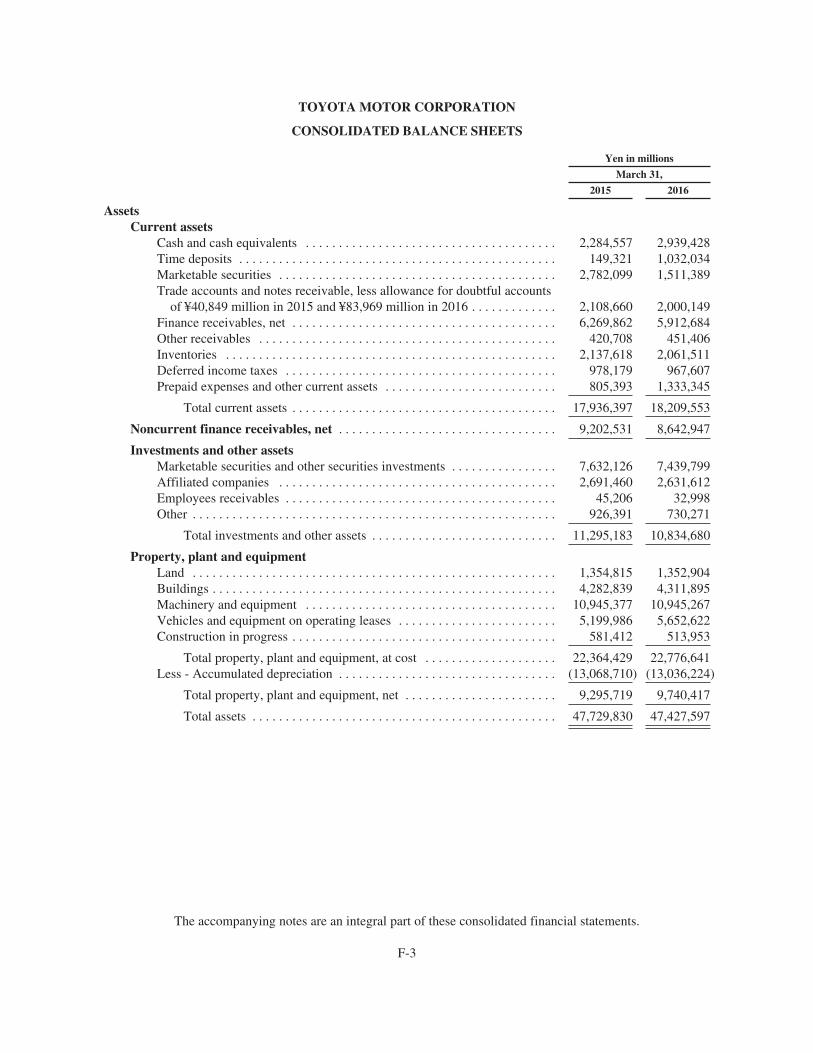
TOYOTA MOTOR CORPORATION
CONSOLIDATED BALANCE SHEETS
Yen in millions
March 31,
2015 2016
AssetsCurrent assets
Cash and cash equivalents . . . . . . . . . . . . . . . . . . . . . . . . . . . . . . . . . . . . . . 2,284,557 2,939,428Time deposits . . . . . . . . . . . . . . . . . . . . . . . . . . . . . . . . . . . . . . . . . . . . . . . . 149,321 1,032,034Marketable securities . . . . . . . . . . . . . . . . . . . . . . . . . . . . . . . . . . . . . . . . . . 2,782,099 1,511,389Trade accounts and notes receivable, less allowance for doubtful accounts
of ¥40,849 million in 2015 and ¥83,969 million in 2016 . . . . . . . . . . . . . 2,108,660 2,000,149Finance receivables, net . . . . . . . . . . . . . . . . . . . . . . . . . . . . . . . . . . . . . . . . 6,269,862 5,912,684Other receivables . . . . . . . . . . . . . . . . . . . . . . . . . . . . . . . . . . . . . . . . . . . . . 420,708 451,406Inventories . . . . . . . . . . . . . . . . . . . . . . . . . . . . . . . . . . . . . . . . . . . . . . . . . . 2,137,618 2,061,511Deferred income taxes . . . . . . . . . . . . . . . . . . . . . . . . . . . . . . . . . . . . . . . . . 978,179 967,607Prepaid expenses and other current assets . . . . . . . . . . . . . . . . . . . . . . . . . . 805,393 1,333,345
Total current assets . . . . . . . . . . . . . . . . . . . . . . . . . . . . . . . . . . . . . . . . 17,936,397 18,209,553
Noncurrent finance receivables, net . . . . . . . . . . . . . . . . . . . . . . . . . . . . . . . . . 9,202,531 8,642,947
Investments and other assetsMarketable securities and other securities investments . . . . . . . . . . . . . . . . 7,632,126 7,439,799Affiliated companies . . . . . . . . . . . . . . . . . . . . . . . . . . . . . . . . . . . . . . . . . . 2,691,460 2,631,612Employees receivables . . . . . . . . . . . . . . . . . . . . . . . . . . . . . . . . . . . . . . . . . 45,206 32,998Other . . . . . . . . . . . . . . . . . . . . . . . . . . . . . . . . . . . . . . . . . . . . . . . . . . . . . . . 926,391 730,271
Total investments and other assets . . . . . . . . . . . . . . . . . . . . . . . . . . . . 11,295,183 10,834,680
Property, plant and equipmentLand . . . . . . . . . . . . . . . . . . . . . . . . . . . . . . . . . . . . . . . . . . . . . . . . . . . . . . . 1,354,815 1,352,904Buildings . . . . . . . . . . . . . . . . . . . . . . . . . . . . . . . . . . . . . . . . . . . . . . . . . . . . 4,282,839 4,311,895Machinery and equipment . . . . . . . . . . . . . . . . . . . . . . . . . . . . . . . . . . . . . . 10,945,377 10,945,267Vehicles and equipment on operating leases . . . . . . . . . . . . . . . . . . . . . . . . 5,199,986 5,652,622Construction in progress . . . . . . . . . . . . . . . . . . . . . . . . . . . . . . . . . . . . . . . . 581,412 513,953
Total property, plant and equipment, at cost . . . . . . . . . . . . . . . . . . . . 22,364,429 22,776,641Less - Accumulated depreciation . . . . . . . . . . . . . . . . . . . . . . . . . . . . . . . . . (13,068,710) (13,036,224)
Total property, plant and equipment, net . . . . . . . . . . . . . . . . . . . . . . . 9,295,719 9,740,417
Total assets . . . . . . . . . . . . . . . . . . . . . . . . . . . . . . . . . . . . . . . . . . . . . . 47,729,830 47,427,597
The accompanying notes are an integral part of these consolidated financial statements.
F-3
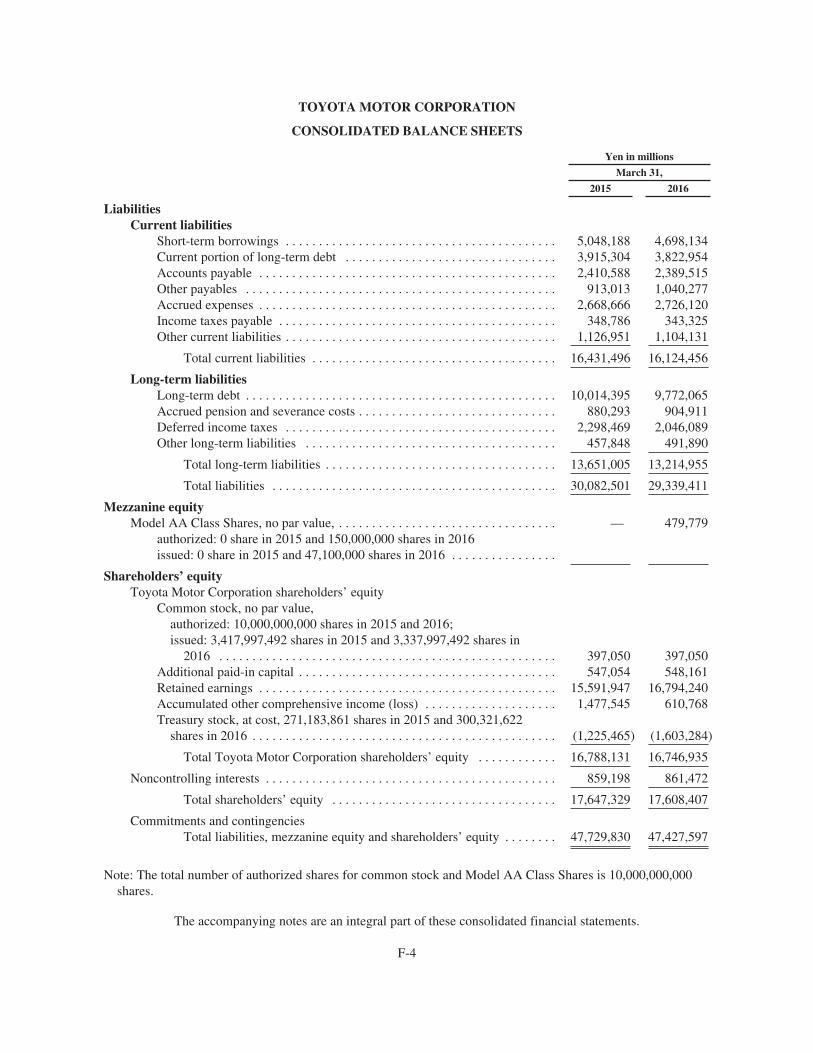
TOYOTA MOTOR CORPORATION
CONSOLIDATED BALANCE SHEETS
Yen in millions
March 31,
2015 2016
LiabilitiesCurrent liabilities
Short-term borrowings . . . . . . . . . . . . . . . . . . . . . . . . . . . . . . . . . . . . . . . . . 5,048,188 4,698,134Current portion of long-term debt . . . . . . . . . . . . . . . . . . . . . . . . . . . . . . . . 3,915,304 3,822,954Accounts payable . . . . . . . . . . . . . . . . . . . . . . . . . . . . . . . . . . . . . . . . . . . . . 2,410,588 2,389,515Other payables . . . . . . . . . . . . . . . . . . . . . . . . . . . . . . . . . . . . . . . . . . . . . . . 913,013 1,040,277Accrued expenses . . . . . . . . . . . . . . . . . . . . . . . . . . . . . . . . . . . . . . . . . . . . . 2,668,666 2,726,120Income taxes payable . . . . . . . . . . . . . . . . . . . . . . . . . . . . . . . . . . . . . . . . . . 348,786 343,325Other current liabilities . . . . . . . . . . . . . . . . . . . . . . . . . . . . . . . . . . . . . . . . . 1,126,951 1,104,131
Total current liabilities . . . . . . . . . . . . . . . . . . . . . . . . . . . . . . . . . . . . . 16,431,496 16,124,456
Long-term liabilitiesLong-term debt . . . . . . . . . . . . . . . . . . . . . . . . . . . . . . . . . . . . . . . . . . . . . . . 10,014,395 9,772,065Accrued pension and severance costs . . . . . . . . . . . . . . . . . . . . . . . . . . . . . . 880,293 904,911Deferred income taxes . . . . . . . . . . . . . . . . . . . . . . . . . . . . . . . . . . . . . . . . . 2,298,469 2,046,089Other long-term liabilities . . . . . . . . . . . . . . . . . . . . . . . . . . . . . . . . . . . . . . 457,848 491,890
Total long-term liabilities . . . . . . . . . . . . . . . . . . . . . . . . . . . . . . . . . . . 13,651,005 13,214,955
Total liabilities . . . . . . . . . . . . . . . . . . . . . . . . . . . . . . . . . . . . . . . . . . . 30,082,501 29,339,411
Mezzanine equityModel AA Class Shares, no par value, . . . . . . . . . . . . . . . . . . . . . . . . . . . . . . . . . — 479,779
authorized: 0 share in 2015 and 150,000,000 shares in 2016issued: 0 share in 2015 and 47,100,000 shares in 2016 . . . . . . . . . . . . . . . .
Shareholders’ equityToyota Motor Corporation shareholders’ equity
Common stock, no par value,authorized: 10,000,000,000 shares in 2015 and 2016;issued: 3,417,997,492 shares in 2015 and 3,337,997,492 shares in
2016 . . . . . . . . . . . . . . . . . . . . . . . . . . . . . . . . . . . . . . . . . . . . . . . . . . . 397,050 397,050Additional paid-in capital . . . . . . . . . . . . . . . . . . . . . . . . . . . . . . . . . . . . . . . 547,054 548,161Retained earnings . . . . . . . . . . . . . . . . . . . . . . . . . . . . . . . . . . . . . . . . . . . . . 15,591,947 16,794,240Accumulated other comprehensive income (loss) . . . . . . . . . . . . . . . . . . . . 1,477,545 610,768Treasury stock, at cost, 271,183,861 shares in 2015 and 300,321,622
shares in 2016 . . . . . . . . . . . . . . . . . . . . . . . . . . . . . . . . . . . . . . . . . . . . . . (1,225,465) (1,603,284)
Total Toyota Motor Corporation shareholders’ equity . . . . . . . . . . . . 16,788,131 16,746,935
Noncontrolling interests . . . . . . . . . . . . . . . . . . . . . . . . . . . . . . . . . . . . . . . . . . . . 859,198 861,472
Total shareholders’ equity . . . . . . . . . . . . . . . . . . . . . . . . . . . . . . . . . . 17,647,329 17,608,407
Commitments and contingenciesTotal liabilities, mezzanine equity and shareholders’ equity . . . . . . . . 47,729,830 47,427,597
Note: The total number of authorized shares for common stock and Model AA Class Shares is 10,000,000,000shares.
The accompanying notes are an integral part of these consolidated financial statements.
F-4
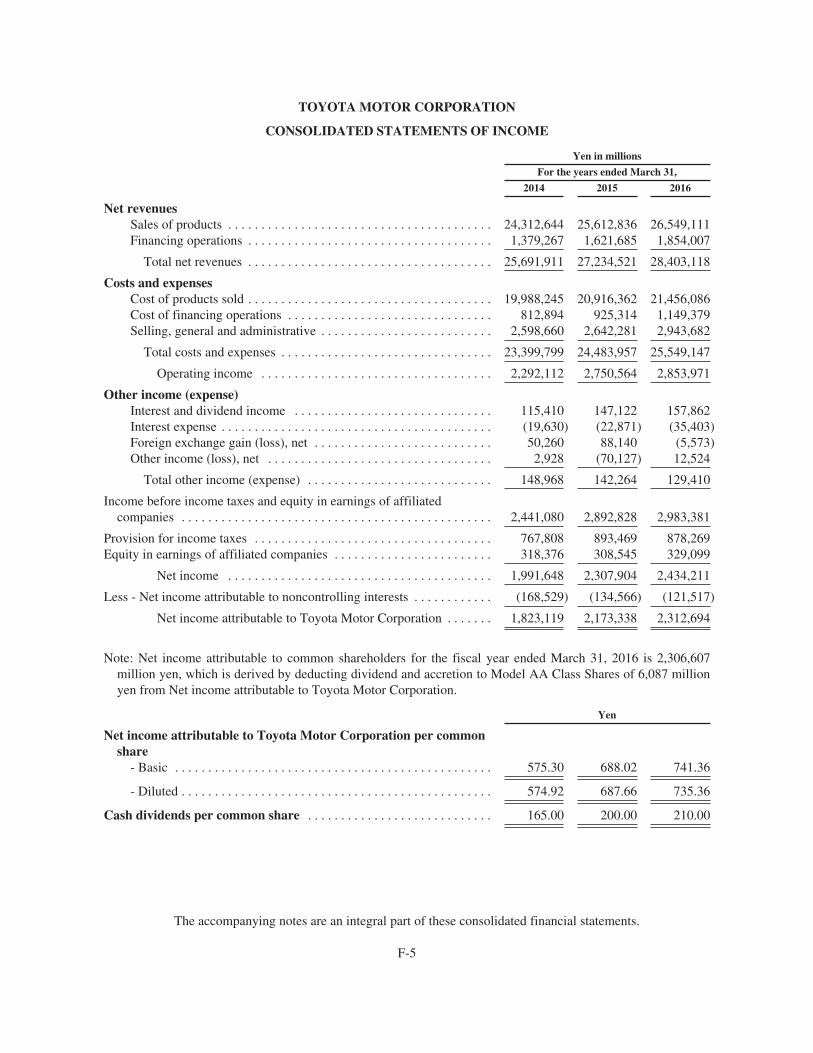
TOYOTA MOTOR CORPORATION
CONSOLIDATED STATEMENTS OF INCOME
Yen in millions
For the years ended March 31,
2014 2015 2016
Net revenuesSales of products . . . . . . . . . . . . . . . . . . . . . . . . . . . . . . . . . . . . . . . . 24,312,644 25,612,836 26,549,111Financing operations . . . . . . . . . . . . . . . . . . . . . . . . . . . . . . . . . . . . . 1,379,267 1,621,685 1,854,007
Total net revenues . . . . . . . . . . . . . . . . . . . . . . . . . . . . . . . . . . . . . 25,691,911 27,234,521 28,403,118
Costs and expensesCost of products sold . . . . . . . . . . . . . . . . . . . . . . . . . . . . . . . . . . . . . 19,988,245 20,916,362 21,456,086Cost of financing operations . . . . . . . . . . . . . . . . . . . . . . . . . . . . . . . 812,894 925,314 1,149,379Selling, general and administrative . . . . . . . . . . . . . . . . . . . . . . . . . . 2,598,660 2,642,281 2,943,682
Total costs and expenses . . . . . . . . . . . . . . . . . . . . . . . . . . . . . . . . 23,399,799 24,483,957 25,549,147
Operating income . . . . . . . . . . . . . . . . . . . . . . . . . . . . . . . . . . . 2,292,112 2,750,564 2,853,971
Other income (expense)Interest and dividend income . . . . . . . . . . . . . . . . . . . . . . . . . . . . . . 115,410 147,122 157,862Interest expense . . . . . . . . . . . . . . . . . . . . . . . . . . . . . . . . . . . . . . . . . (19,630) (22,871) (35,403)Foreign exchange gain (loss), net . . . . . . . . . . . . . . . . . . . . . . . . . . . 50,260 88,140 (5,573)Other income (loss), net . . . . . . . . . . . . . . . . . . . . . . . . . . . . . . . . . . 2,928 (70,127) 12,524
Total other income (expense) . . . . . . . . . . . . . . . . . . . . . . . . . . . . 148,968 142,264 129,410
Income before income taxes and equity in earnings of affiliatedcompanies . . . . . . . . . . . . . . . . . . . . . . . . . . . . . . . . . . . . . . . . . . . . . . . 2,441,080 2,892,828 2,983,381
Provision for income taxes . . . . . . . . . . . . . . . . . . . . . . . . . . . . . . . . . . . . 767,808 893,469 878,269Equity in earnings of affiliated companies . . . . . . . . . . . . . . . . . . . . . . . . 318,376 308,545 329,099
Net income . . . . . . . . . . . . . . . . . . . . . . . . . . . . . . . . . . . . . . . . 1,991,648 2,307,904 2,434,211
Less - Net income attributable to noncontrolling interests . . . . . . . . . . . . (168,529) (134,566) (121,517)
Net income attributable to Toyota Motor Corporation . . . . . . . 1,823,119 2,173,338 2,312,694
Note: Net income attributable to common shareholders for the fiscal year ended March 31, 2016 is 2,306,607million yen, which is derived by deducting dividend and accretion to Model AA Class Shares of 6,087 millionyen from Net income attributable to Toyota Motor Corporation.
Yen
Net income attributable to Toyota Motor Corporation per commonshare
- Basic . . . . . . . . . . . . . . . . . . . . . . . . . . . . . . . . . . . . . . . . . . . . . . . . 575.30 688.02 741.36
- Diluted . . . . . . . . . . . . . . . . . . . . . . . . . . . . . . . . . . . . . . . . . . . . . . . 574.92 687.66 735.36
Cash dividends per common share . . . . . . . . . . . . . . . . . . . . . . . . . . . . 165.00 200.00 210.00
The accompanying notes are an integral part of these consolidated financial statements.
F-5
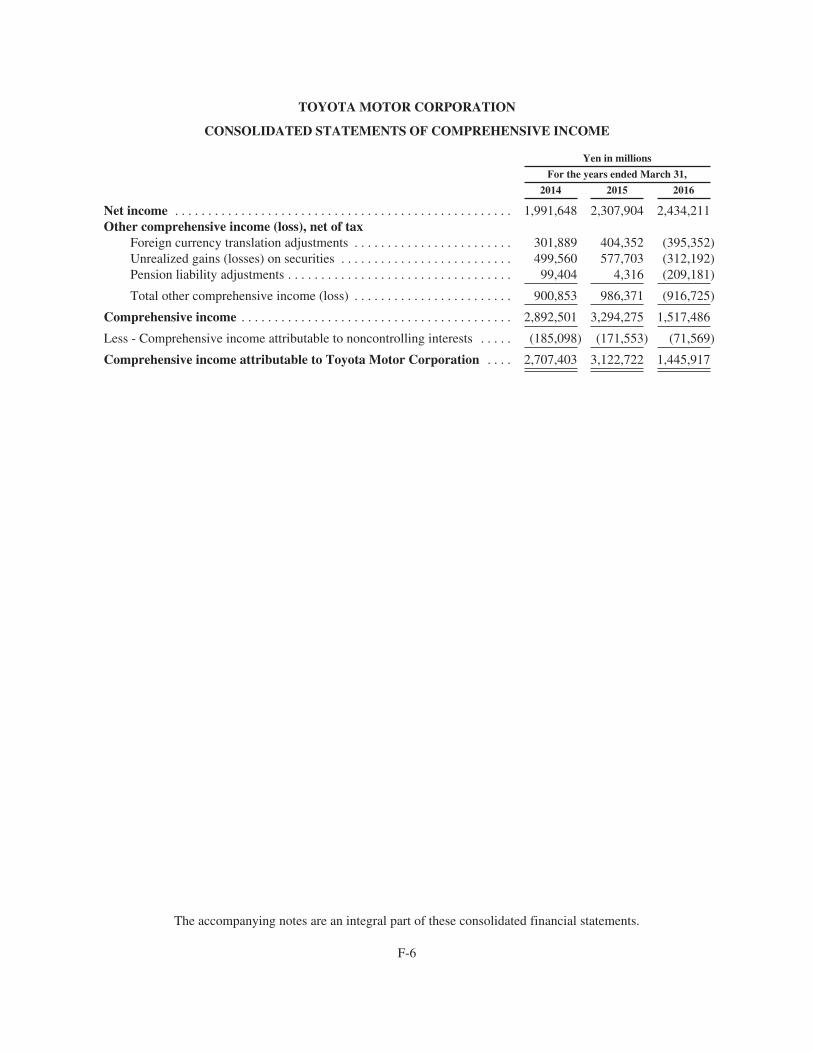
TOYOTA MOTOR CORPORATION
CONSOLIDATED STATEMENTS OF COMPREHENSIVE INCOME
Yen in millions
For the years ended March 31,
2014 2015 2016
Net income . . . . . . . . . . . . . . . . . . . . . . . . . . . . . . . . . . . . . . . . . . . . . . . . . . . 1,991,648 2,307,904 2,434,211Other comprehensive income (loss), net of tax
Foreign currency translation adjustments . . . . . . . . . . . . . . . . . . . . . . . . 301,889 404,352 (395,352)Unrealized gains (losses) on securities . . . . . . . . . . . . . . . . . . . . . . . . . . 499,560 577,703 (312,192)Pension liability adjustments . . . . . . . . . . . . . . . . . . . . . . . . . . . . . . . . . . 99,404 4,316 (209,181)
Total other comprehensive income (loss) . . . . . . . . . . . . . . . . . . . . . . . . 900,853 986,371 (916,725)
Comprehensive income . . . . . . . . . . . . . . . . . . . . . . . . . . . . . . . . . . . . . . . . . 2,892,501 3,294,275 1,517,486
Less - Comprehensive income attributable to noncontrolling interests . . . . . (185,098) (171,553) (71,569)
Comprehensive income attributable to Toyota Motor Corporation . . . . 2,707,403 3,122,722 1,445,917
The accompanying notes are an integral part of these consolidated financial statements.
F-6
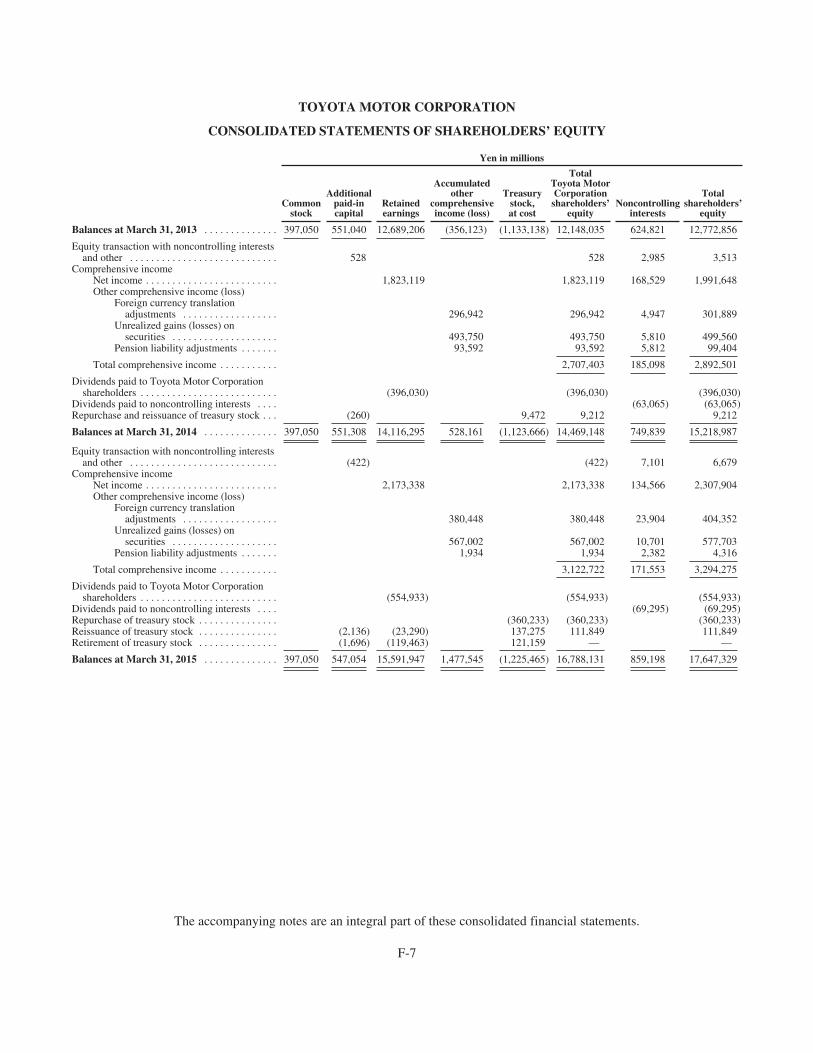
TOYOTA MOTOR CORPORATION
CONSOLIDATED STATEMENTS OF SHAREHOLDERS’ EQUITY
Yen in millions
Commonstock
Additionalpaid-incapital
Retainedearnings
Accumulatedother
comprehensiveincome (loss)
Treasurystock,at cost
TotalToyota MotorCorporationshareholders’
equityNoncontrolling
interests
Totalshareholders’
equity
Balances at March 31, 2013 . . . . . . . . . . . . . . 397,050 551,040 12,689,206 (356,123) (1,133,138) 12,148,035 624,821 12,772,856
Equity transaction with noncontrolling interestsand other . . . . . . . . . . . . . . . . . . . . . . . . . . . . 528 528 2,985 3,513
Comprehensive incomeNet income . . . . . . . . . . . . . . . . . . . . . . . . . 1,823,119 1,823,119 168,529 1,991,648Other comprehensive income (loss)
Foreign currency translationadjustments . . . . . . . . . . . . . . . . . . 296,942 296,942 4,947 301,889
Unrealized gains (losses) onsecurities . . . . . . . . . . . . . . . . . . . . 493,750 493,750 5,810 499,560
Pension liability adjustments . . . . . . . 93,592 93,592 5,812 99,404
Total comprehensive income . . . . . . . . . . . 2,707,403 185,098 2,892,501
Dividends paid to Toyota Motor Corporationshareholders . . . . . . . . . . . . . . . . . . . . . . . . . . (396,030) (396,030) (396,030)
Dividends paid to noncontrolling interests . . . . (63,065) (63,065)Repurchase and reissuance of treasury stock . . . (260) 9,472 9,212 9,212
Balances at March 31, 2014 . . . . . . . . . . . . . . 397,050 551,308 14,116,295 528,161 (1,123,666) 14,469,148 749,839 15,218,987
Equity transaction with noncontrolling interestsand other . . . . . . . . . . . . . . . . . . . . . . . . . . . . (422) (422) 7,101 6,679
Comprehensive incomeNet income . . . . . . . . . . . . . . . . . . . . . . . . . 2,173,338 2,173,338 134,566 2,307,904Other comprehensive income (loss)
Foreign currency translationadjustments . . . . . . . . . . . . . . . . . . 380,448 380,448 23,904 404,352
Unrealized gains (losses) onsecurities . . . . . . . . . . . . . . . . . . . . 567,002 567,002 10,701 577,703
Pension liability adjustments . . . . . . . 1,934 1,934 2,382 4,316
Total comprehensive income . . . . . . . . . . . 3,122,722 171,553 3,294,275
Dividends paid to Toyota Motor Corporationshareholders . . . . . . . . . . . . . . . . . . . . . . . . . . (554,933) (554,933) (554,933)
Dividends paid to noncontrolling interests . . . . (69,295) (69,295)Repurchase of treasury stock . . . . . . . . . . . . . . . (360,233) (360,233) (360,233)Reissuance of treasury stock . . . . . . . . . . . . . . . (2,136) (23,290) 137,275 111,849 111,849Retirement of treasury stock . . . . . . . . . . . . . . . (1,696) (119,463) 121,159 — —
Balances at March 31, 2015 . . . . . . . . . . . . . . 397,050 547,054 15,591,947 1,477,545 (1,225,465) 16,788,131 859,198 17,647,329
The accompanying notes are an integral part of these consolidated financial statements.
F-7
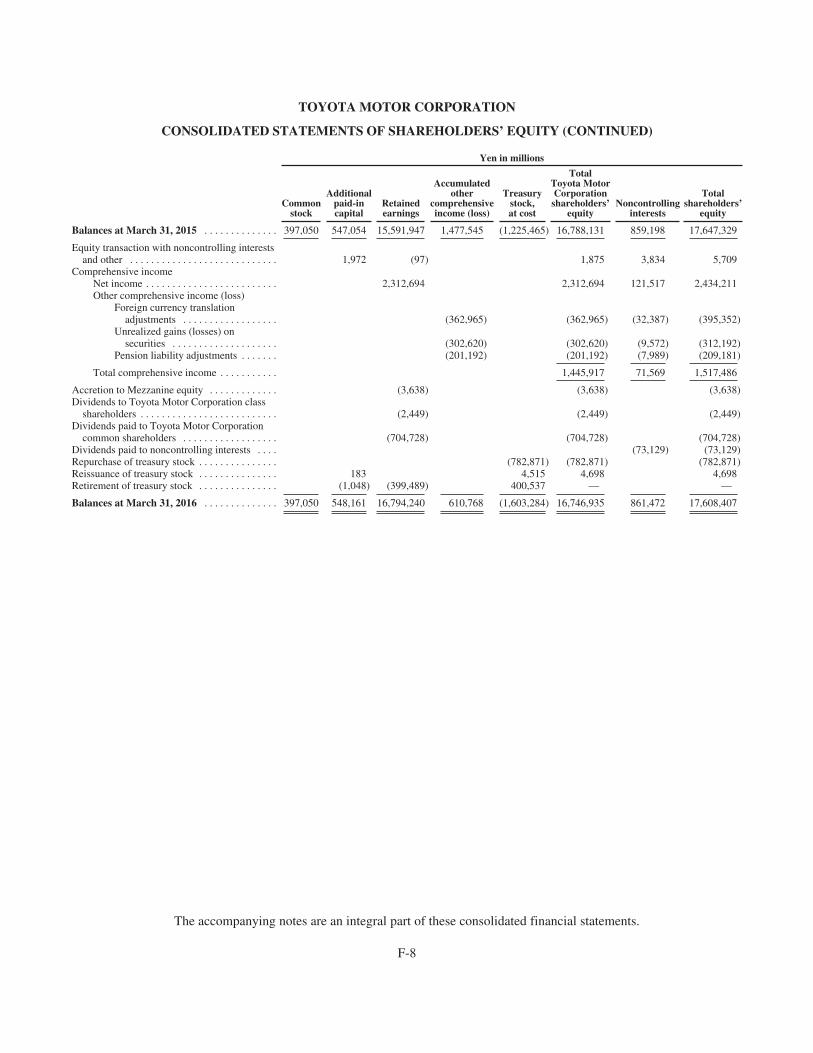
TOYOTA MOTOR CORPORATION
CONSOLIDATED STATEMENTS OF SHAREHOLDERS’ EQUITY (CONTINUED)
Yen in millions
Commonstock
Additionalpaid-incapital
Retainedearnings
Accumulatedother
comprehensiveincome (loss)
Treasurystock,at cost
TotalToyota MotorCorporationshareholders’
equityNoncontrolling
interests
Totalshareholders’
equity
Balances at March 31, 2015 . . . . . . . . . . . . . . 397,050 547,054 15,591,947 1,477,545 (1,225,465) 16,788,131 859,198 17,647,329
Equity transaction with noncontrolling interestsand other . . . . . . . . . . . . . . . . . . . . . . . . . . . . 1,972 (97) 1,875 3,834 5,709
Comprehensive incomeNet income . . . . . . . . . . . . . . . . . . . . . . . . . 2,312,694 2,312,694 121,517 2,434,211Other comprehensive income (loss)
Foreign currency translationadjustments . . . . . . . . . . . . . . . . . . (362,965) (362,965) (32,387) (395,352)
Unrealized gains (losses) onsecurities . . . . . . . . . . . . . . . . . . . . (302,620) (302,620) (9,572) (312,192)
Pension liability adjustments . . . . . . . (201,192) (201,192) (7,989) (209,181)
Total comprehensive income . . . . . . . . . . . 1,445,917 71,569 1,517,486
Accretion to Mezzanine equity . . . . . . . . . . . . . (3,638) (3,638) (3,638)Dividends to Toyota Motor Corporation class
shareholders . . . . . . . . . . . . . . . . . . . . . . . . . . (2,449) (2,449) (2,449)Dividends paid to Toyota Motor Corporation
common shareholders . . . . . . . . . . . . . . . . . . (704,728) (704,728) (704,728)Dividends paid to noncontrolling interests . . . . (73,129) (73,129)Repurchase of treasury stock . . . . . . . . . . . . . . . (782,871) (782,871) (782,871)Reissuance of treasury stock . . . . . . . . . . . . . . . 183 4,515 4,698 4,698Retirement of treasury stock . . . . . . . . . . . . . . . (1,048) (399,489) 400,537 — —
Balances at March 31, 2016 . . . . . . . . . . . . . . 397,050 548,161 16,794,240 610,768 (1,603,284) 16,746,935 861,472 17,608,407
The accompanying notes are an integral part of these consolidated financial statements.
F-8
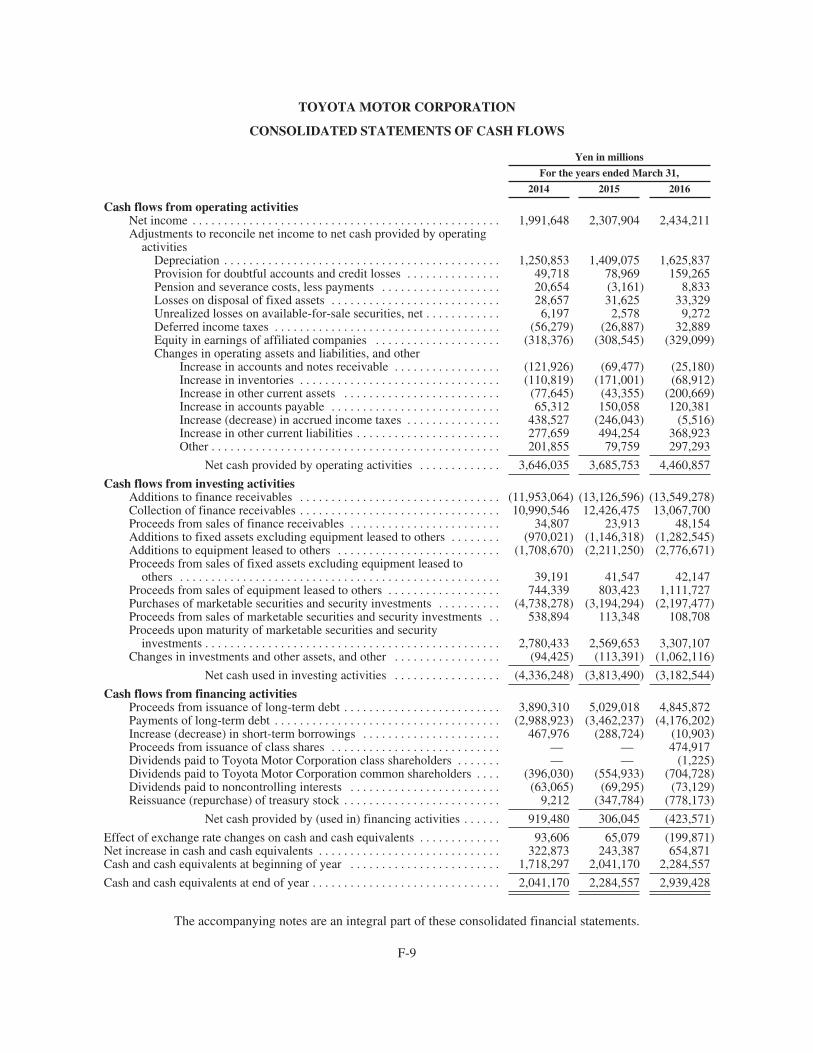
TOYOTA MOTOR CORPORATION
CONSOLIDATED STATEMENTS OF CASH FLOWS
Yen in millions
For the years ended March 31,
2014 2015 2016
Cash flows from operating activitiesNet income . . . . . . . . . . . . . . . . . . . . . . . . . . . . . . . . . . . . . . . . . . . . . . . . . 1,991,648 2,307,904 2,434,211Adjustments to reconcile net income to net cash provided by operating
activitiesDepreciation . . . . . . . . . . . . . . . . . . . . . . . . . . . . . . . . . . . . . . . . . . . . 1,250,853 1,409,075 1,625,837Provision for doubtful accounts and credit losses . . . . . . . . . . . . . . . 49,718 78,969 159,265Pension and severance costs, less payments . . . . . . . . . . . . . . . . . . . 20,654 (3,161) 8,833Losses on disposal of fixed assets . . . . . . . . . . . . . . . . . . . . . . . . . . . 28,657 31,625 33,329Unrealized losses on available-for-sale securities, net . . . . . . . . . . . . 6,197 2,578 9,272Deferred income taxes . . . . . . . . . . . . . . . . . . . . . . . . . . . . . . . . . . . . (56,279) (26,887) 32,889Equity in earnings of affiliated companies . . . . . . . . . . . . . . . . . . . . (318,376) (308,545) (329,099)Changes in operating assets and liabilities, and other
Increase in accounts and notes receivable . . . . . . . . . . . . . . . . . (121,926) (69,477) (25,180)Increase in inventories . . . . . . . . . . . . . . . . . . . . . . . . . . . . . . . . (110,819) (171,001) (68,912)Increase in other current assets . . . . . . . . . . . . . . . . . . . . . . . . . (77,645) (43,355) (200,669)Increase in accounts payable . . . . . . . . . . . . . . . . . . . . . . . . . . . 65,312 150,058 120,381Increase (decrease) in accrued income taxes . . . . . . . . . . . . . . . 438,527 (246,043) (5,516)Increase in other current liabilities . . . . . . . . . . . . . . . . . . . . . . . 277,659 494,254 368,923Other . . . . . . . . . . . . . . . . . . . . . . . . . . . . . . . . . . . . . . . . . . . . . . 201,855 79,759 297,293
Net cash provided by operating activities . . . . . . . . . . . . . 3,646,035 3,685,753 4,460,857
Cash flows from investing activitiesAdditions to finance receivables . . . . . . . . . . . . . . . . . . . . . . . . . . . . . . . . (11,953,064) (13,126,596) (13,549,278)Collection of finance receivables . . . . . . . . . . . . . . . . . . . . . . . . . . . . . . . . 10,990,546 12,426,475 13,067,700Proceeds from sales of finance receivables . . . . . . . . . . . . . . . . . . . . . . . . 34,807 23,913 48,154Additions to fixed assets excluding equipment leased to others . . . . . . . . (970,021) (1,146,318) (1,282,545)Additions to equipment leased to others . . . . . . . . . . . . . . . . . . . . . . . . . . (1,708,670) (2,211,250) (2,776,671)Proceeds from sales of fixed assets excluding equipment leased to
others . . . . . . . . . . . . . . . . . . . . . . . . . . . . . . . . . . . . . . . . . . . . . . . . . . . 39,191 41,547 42,147Proceeds from sales of equipment leased to others . . . . . . . . . . . . . . . . . . 744,339 803,423 1,111,727Purchases of marketable securities and security investments . . . . . . . . . . (4,738,278) (3,194,294) (2,197,477)Proceeds from sales of marketable securities and security investments . . 538,894 113,348 108,708Proceeds upon maturity of marketable securities and security
investments . . . . . . . . . . . . . . . . . . . . . . . . . . . . . . . . . . . . . . . . . . . . . . . 2,780,433 2,569,653 3,307,107Changes in investments and other assets, and other . . . . . . . . . . . . . . . . . (94,425) (113,391) (1,062,116)
Net cash used in investing activities . . . . . . . . . . . . . . . . . (4,336,248) (3,813,490) (3,182,544)
Cash flows from financing activitiesProceeds from issuance of long-term debt . . . . . . . . . . . . . . . . . . . . . . . . . 3,890,310 5,029,018 4,845,872Payments of long-term debt . . . . . . . . . . . . . . . . . . . . . . . . . . . . . . . . . . . . (2,988,923) (3,462,237) (4,176,202)Increase (decrease) in short-term borrowings . . . . . . . . . . . . . . . . . . . . . . 467,976 (288,724) (10,903)Proceeds from issuance of class shares . . . . . . . . . . . . . . . . . . . . . . . . . . . — — 474,917Dividends paid to Toyota Motor Corporation class shareholders . . . . . . . — — (1,225)Dividends paid to Toyota Motor Corporation common shareholders . . . . (396,030) (554,933) (704,728)Dividends paid to noncontrolling interests . . . . . . . . . . . . . . . . . . . . . . . . (63,065) (69,295) (73,129)Reissuance (repurchase) of treasury stock . . . . . . . . . . . . . . . . . . . . . . . . . 9,212 (347,784) (778,173)
Net cash provided by (used in) financing activities . . . . . . 919,480 306,045 (423,571)
Effect of exchange rate changes on cash and cash equivalents . . . . . . . . . . . . . 93,606 65,079 (199,871)Net increase in cash and cash equivalents . . . . . . . . . . . . . . . . . . . . . . . . . . . . . 322,873 243,387 654,871Cash and cash equivalents at beginning of year . . . . . . . . . . . . . . . . . . . . . . . . 1,718,297 2,041,170 2,284,557
Cash and cash equivalents at end of year . . . . . . . . . . . . . . . . . . . . . . . . . . . . . . 2,041,170 2,284,557 2,939,428
The accompanying notes are an integral part of these consolidated financial statements.
F-9
TOYOTA MOTOR CORPORATION
NOTES TO CONSOLIDATED FINANCIAL STATEMENTS
1. Nature of operations:
Toyota and its affiliated companies are primarily engaged in the design, manufacture, and sale of sedans,minivans, compact cars, sport-utility vehicles, trucks and related parts and accessories throughout the world. Inaddition, Toyota and its affiliated companies provide financing, vehicle and equipment leasing and certain otherfinancial services primarily to its dealers and their customers to support the sales of vehicles and other productsmanufactured by Toyota and its affiliated companies.
2. Summary of significant accounting policies:
The parent company and its subsidiaries in Japan and its foreign subsidiaries maintain their records andprepare their financial statements in accordance with Japanese generally accepted accounting principles andthose of their countries of domicile. Certain adjustments and reclassifications have been incorporated in theaccompanying consolidated financial statements to conform to U.S.GAAP.
Significant accounting policies after reflecting adjustments for the above are as follows:
Basis of consolidation and accounting for investments in affiliated companies -
The consolidated financial statements include the accounts of the parent company, its majority-ownedsubsidiary companies and variable interest entities of which Toyota is the primary beneficiary. All significantintercompany transactions and accounts have been eliminated. Investments in affiliated companies in whichToyota exercises significant influence, but which it does not control, are stated at cost plus equity inundistributed earnings. Consolidated net income includes Toyota’s equity in current earnings of such companies,after elimination of unrealized intercompany profits. Investments in such companies are reduced to net realizablevalue if a decline in market value is determined other-than-temporary. Investments in non-public companies inwhich Toyota does not exercise significant influence (generally less than a 20% ownership interest) are stated atcost.
Estimates -
The preparation of Toyota’s consolidated financial statements in conformity with U.S.GAAP requiresmanagement to make estimates and assumptions that affect the amounts reported in the consolidated financialstatements and accompanying notes. Actual results could differ from those estimates. The more significantestimates include: product warranties, liabilities accrued for recalls and other safety measures, allowance fordoubtful accounts and credit losses, residual values for leased assets, impairment of long-lived assets, pensioncosts and obligations, fair value of derivative financial instruments, other-than-temporary losses on marketablesecurities, litigation liabilities and valuation allowance for deferred tax assets.
Translation of foreign currencies -
All asset and liability accounts of foreign subsidiaries and affiliated companies are translated into Japaneseyen at appropriate year-end current exchange rates and all income and expense accounts of those subsidiaries aretranslated at the average exchange rates for each period. The foreign currency translation adjustments areincluded as a component of accumulated other comprehensive income.
Foreign currency receivables and payables are translated at appropriate year-end current exchange rates andthe resulting transaction gains or losses are recorded in operations currently.
F-10
TOYOTA MOTOR CORPORATION
NOTES TO CONSOLIDATED FINANCIAL STATEMENTS—(Continued)
Revenue recognition -
Revenues from sales of vehicles and parts are generally recognized upon delivery which is considered tohave occurred when the dealer has taken title to the product and the risk and reward of ownership have beensubstantively transferred, except as described below.
Toyota’s sales incentive programs principally consist of cash payments to dealers calculated based onvehicle volume or a model sold by a dealer during a certain period of time. Toyota accrues these incentives asrevenue reductions upon the sale of a vehicle corresponding to the program by the amount determined in therelated incentive program.
Revenues from the sales of vehicles under which Toyota conditionally guarantees the minimum resale valueare recognized on a pro rata basis from the date of sale to the first exercise date of the guarantee in a mannersimilar to operating lease accounting. The underlying vehicles of these transactions are recorded as assets and aredepreciated in accordance with Toyota’s depreciation policy.
Revenues from retail financing contracts and finance leases are recognized using the effective yield method.Revenues from operating leases are recognized on a straight-line basis over the lease term.
The sale of certain vehicles includes a determinable amount for the contract, which entitles customers tofree vehicle maintenance. Such revenues from free maintenance contracts are deferred and recognized as revenueover the period of the contract, which approximates the pattern of the related costs.
Other costs -
Advertising and sales promotion costs are expensed as incurred. Advertising costs were ¥419,409 million,¥435,150 million and ¥489,036 million for the years ended March 31, 2014, 2015 and 2016, respectively.
Toyota generally warrants its products against certain manufacturing and other defects. Provisions forproduct warranties are provided for specific periods of time and/or usage of the product and vary depending uponthe nature of the product, the geographic location of the sale and other factors. Toyota records a provision forestimated product warranty costs at the time the related sale is recognized based on estimates that Toyota willincur to repair or replace product parts that fail while under warranty. The amount of accrued estimated warrantycosts is primarily based on historical experience as to product failures as well as current information on repaircosts. The amount of warranty costs accrued also contains an estimate of warranty claim recoveries to bereceived from suppliers.
In addition to product warranties above, Toyota accrues for costs of recalls and other safety measures basedon management’s estimates when it is probable a liability has been incurred and the amount of loss can bereasonably estimated. Toyota employs an estimation model, to accrue at the time of vehicle sale, an amount thatrepresents management’s best estimate of expenses related to future recalls and other safety measures. Theestimation model for recalls and other safety measures takes into account Toyota’s historical experience ofrecalls and other safety measures.
Litigation liabilities are established to cover probable losses on various lawsuits based on the informationcurrently available. Attorneys’ fees are expensed as incurred.
Research and development costs are expensed as incurred. Research and development costs were¥910,517 million, ¥1,004,547 million and ¥1,055,672 million for the years ended March 31, 2014, 2015 and2016, respectively.
F-11
TOYOTA MOTOR CORPORATION
NOTES TO CONSOLIDATED FINANCIAL STATEMENTS—(Continued)
Cash and cash equivalents -
Cash and cash equivalents include all highly liquid investments with original maturities of three months orless, that are readily convertible to known amounts of cash and are so near maturity that they presentinsignificant risk of changes in value because of changes in interest rates.
Marketable securities -
Marketable securities consist of debt and equity securities. Debt and equity securities designated asavailable-for-sale are carried at fair value with unrealized gains or losses included as a component ofaccumulated other comprehensive income in shareholders’ equity, net of applicable taxes. Individual securitiesclassified as available-for-sale are reduced to net realizable value for other-than-temporary declines in marketvalue. In determining if a decline in value is other-than-temporary, Toyota considers the length of time and theextent to which the fair value has been less than the carrying value, the financial condition and prospects of thecompany and Toyota’s ability and intent to retain its investment in the company for a period of time sufficient toallow for any anticipated recovery in market value. Realized gains and losses, which are determined on theaverage-cost method, are reflected in the consolidated statements of income when realized.
Security investments in non-public companies -
Security investments in non-public companies are carried at cost as fair value is not readily determinable. Ifthe value of a non-public security investment is estimated to have declined and such decline is judged to beother-than-temporary, Toyota recognizes the impairment of the investment and the carrying value is reduced toits fair value. Determination of impairment is based on the consideration of such factors as operating results,business plans and estimated future cash flows. Fair value is determined principally through the use of the latestfinancial information.
Finance receivables -
Finance receivables recorded on Toyota’s consolidated balance sheets are comprised of the unpaid principalbalance, plus accrued interest, less charge-offs, net of any unearned income and deferred origination costs andthe allowance for credit losses. Deferred origination costs are amortized so as to approximate a level rate ofreturn over the term of the related contracts.
The determination of portfolio segments is based primarily on the qualitative consideration of the nature ofToyota’s business operations and finance receivables. The three portfolio segments within finance receivables areas follows:
Retail receivables portfolio segment -
The retail receivables portfolio segment consists of retail installment sales contracts acquired mainly fromdealers (“auto loans”) including credit card loans. These contracts acquired must first meet specified creditstandards. Thereafter, Toyota retains responsibility for contract collection and administration.
The contract periods of auto loans primarily range from 2 to 7 years. Toyota acquires security interests inthe vehicles financed and has the right to repossess vehicles if customers fail to meet their contractualobligations. Almost all auto loans are non-recourse, which relieves the dealers from financial responsibility in theevent of repossession.
F-12
TOYOTA MOTOR CORPORATION
NOTES TO CONSOLIDATED FINANCIAL STATEMENTS—(Continued)
Toyota classifies retail receivables portfolio segment into one class based on common risk characteristicsassociated with the underlying finance receivables, the similarity of the credit risks, and the quantitativemateriality.
Finance lease receivables portfolio segment -
Toyota acquires new vehicle lease contracts originated primarily through dealers. The contract periods ofthese primarily range from 2 to 5 years. Lease contracts acquired must first meet specified credit standards afterwhich Toyota assumes ownership of the leased vehicle. Toyota is responsible for contract collection andadministration during the lease period.
Toyota is generally permitted to take possession of the vehicle upon a default by the lessee. The residualvalue is estimated at the time the vehicle is first leased. Vehicles returned to Toyota at the end of their leases aresold by auction.
Toyota classifies finance lease receivables portfolio segment into one class based on common riskcharacteristics associated with the underlying finance receivables and the similarity of the credit risks.
Wholesale and other dealer loan receivables portfolio segment -
Toyota provides wholesale financing to qualified dealers to finance inventories. Toyota acquires securityinterests in vehicles financed at wholesale. In cases where additional security interests would be required, Toyotatakes dealership assets or personal assets, or both, as additional security. If a dealer defaults, Toyota has the rightto liquidate any assets acquired and seek legal remedies.
Toyota also makes term loans to dealers for business acquisitions, facilities refurbishment, real estatepurchases and working capital requirements. These loans are typically secured with liens on real estate, otherdealership assets and/or personal assets of the dealers.
Toyota classifies wholesale and other dealer loan receivables portfolio segment into three classes ofwholesale, real estate and working capital, based on the risk characteristics associated with the underlyingfinance receivables.
A receivable account balance is considered impaired when, based on current information and events, it isprobable that Toyota will be unable to collect all amounts due according to the terms of the contract. Factors suchas payment history, compliance with terms and conditions of the underlying loan agreement and other subjectivefactors related to the financial stability of the borrower are considered when determining whether a loan isimpaired. Impaired finance receivables include certain nonaccrual receivables for which a specific reserve hasbeen assessed. An account modified as a troubled debt restructuring is considered to be impaired. A troubled debtrestructuring occurs when an account is modified through a concession to a borrower experiencing financialdifficulty.
All classes of wholesale and other dealer loan receivables portfolio segment are placed on nonaccrual statuswhen full payment of principal or interest is in doubt, or when principal or interest is 90 days or morecontractually past due, whichever occurs first. Collateral dependent loans are placed on nonaccrual status ifcollateral is insufficient to cover principal and interest. Interest accrued but not collected at the date a receivableis placed on nonaccrual status is reversed against interest income. In addition, the amortization of net deferredfees is suspended.
F-13
TOYOTA MOTOR CORPORATION
NOTES TO CONSOLIDATED FINANCIAL STATEMENTS—(Continued)
Interest income on nonaccrual receivables is recognized only to the extent it is received in cash. Accountsare restored to accrual status only when interest and principal payments are brought current and future paymentsare reasonably assured. Receivable balances are written-off against the allowance for credit losses when it isprobable that a loss has been realized. Retail receivables class and finance lease receivables class are not placedgenerally on nonaccrual status when principal or interest is 90 days or more past due. However, these receivablesare generally written-off against the allowance for credit losses when payments due are no longer expected to bereceived or the account is 120 days contractually past due, whichever occurs first.
As of March 31, 2015 and 2016, finance receivables on nonaccrual status are as follows:
Yen in millions
March 31,
2015 2016
Retail . . . . . . . . . . . . . . . . . . . . . . . . . . . . . . . . . . . . . . . . . . . . . . . . . . . . . . . . . . . . . 7,629 8,107Finance leases . . . . . . . . . . . . . . . . . . . . . . . . . . . . . . . . . . . . . . . . . . . . . . . . . . . . . . 5,562 682Wholesale . . . . . . . . . . . . . . . . . . . . . . . . . . . . . . . . . . . . . . . . . . . . . . . . . . . . . . . . . 11,573 16,122Real estate . . . . . . . . . . . . . . . . . . . . . . . . . . . . . . . . . . . . . . . . . . . . . . . . . . . . . . . . . 8,592 16,801Working capital . . . . . . . . . . . . . . . . . . . . . . . . . . . . . . . . . . . . . . . . . . . . . . . . . . . . . 446 822
33,802 42,534
As of March 31, 2015 and 2016, finance receivables 90 days or more past due and accruing are as follows:
Yen in millions
March 31,
2015 2016
Retail . . . . . . . . . . . . . . . . . . . . . . . . . . . . . . . . . . . . . . . . . . . . . . . . . . . . . . . . . . . . . 28,147 23,419Finance leases . . . . . . . . . . . . . . . . . . . . . . . . . . . . . . . . . . . . . . . . . . . . . . . . . . . . . . 3,954 3,984
32,101 27,403
Allowance for credit losses -
Allowance for credit losses is established to cover probable losses on finance receivables and vehicles andequipment on operating leases, resulting from the inability of customers to make required payments. Provisionfor credit losses is included in selling, general and administrative expenses.
The allowance for credit losses is based on a systematic, ongoing review and evaluation performed as partof the credit-risk evaluation process, historical loss experience, the size and composition of the portfolios, currenteconomic events and conditions, the estimated fair value and adequacy of collateral and other pertinent factors.Vehicles and equipment on operating leases are not within the scope of accounting guidance governing thedisclosure of portfolio segments.
Retail receivables portfolio segment -
Toyota calculates allowance for credit losses to cover probable losses on retail receivables by applyingreserve rates to such receivables. Reserve rates are calculated mainly by historical loss experience, currenteconomic events and conditions and other pertinent factors.
F-14
TOYOTA MOTOR CORPORATION
NOTES TO CONSOLIDATED FINANCIAL STATEMENTS—(Continued)
Finance lease receivables portfolio segment -
Toyota calculates allowance for credit losses to cover probable losses on finance lease receivables byapplying reserve rates to such receivables. Reserve rates are calculated mainly by historical loss experience,current economic events and conditions and other pertinent factors such as used car markets.
Wholesale and other dealer loan receivables portfolio segment -
Toyota calculates allowance for credit losses to cover probable losses on wholesale and other dealer loanreceivables by applying reserve rates to such receivables. Reserve rates are calculated mainly by financialconditions of the dealers, terms of collateral setting, current economic events and conditions and other pertinentfactors.
Toyota establishes specific reserves to cover the estimated losses on individually impaired receivableswithin the wholesale and other dealer loan receivables portfolio segment. Specific reserves on impairedreceivables are determined by the present value of expected future cash flows or the fair value of collateral whenit is probable that such receivables will be unable to be fully collected. The fair value of the underlying collateralis used if the receivable is collateral-dependent. The receivable is determined collateral-dependent if therepayment of the loan is expected to be provided by the underlying collateral. For the receivables in which thefair value of the underlying collateral was in excess of the outstanding balance, no allowance was provided.
Troubled debt restructurings in the retail receivables and finance lease receivables portfolio segments arespecifically identified as impaired and aggregated with their respective portfolio segments when determining theallowance for credit losses. Impaired loans in the retail receivables and finance lease receivables portfoliosegments are insignificant for individual evaluation and Toyota has determined that allowance for credit lossesfor each of the retail receivables and finance lease receivables portfolio segments would not be materiallydifferent if they had been individually evaluated for impairment.
Specific reserves on impaired receivables within the wholesale and other dealer loan receivables portfoliosegment are recorded by an increase to the allowance for credit losses based on the related measurement ofimpairment. Related collateral, if recoverable, is repossessed and sold and the account balance is written-off.
Any shortfall between proceeds received and the carrying cost of repossessed collateral is charged to theallowance. Recoveries are reversed from the allowance for credit losses.
Allowance for residual value losses -
Toyota is exposed to risk of loss on the disposition of off-lease vehicles to the extent that sales proceeds arenot sufficient to cover the carrying value of the leased asset at lease termination. Toyota maintains an allowanceto cover probable estimated losses related to unguaranteed residual values on its owned portfolio. The allowanceis evaluated considering projected vehicle return rates and projected loss severity. Factors considered in thedetermination of projected return rates and loss severity include historical and market information on usedvehicle sales, trends in lease returns and new car markets, and general economic conditions. Managementevaluates the foregoing factors, develops several potential loss scenarios, and reviews allowance levels todetermine whether reserves are considered adequate to cover the probable range of losses.
The allowance for residual value losses is maintained in amounts considered by Toyota to be appropriate inrelation to the estimated losses on its owned portfolio. Upon disposal of the assets, the allowance for residuallosses is adjusted for the difference between the net book value and the proceeds from sale.
F-15
TOYOTA MOTOR CORPORATION
NOTES TO CONSOLIDATED FINANCIAL STATEMENTS—(Continued)
Inventories -
Inventories are valued at cost, not in excess of market, cost being determined on the “average-cost” basis,except for the cost of finished products carried by certain subsidiary companies which is determined on the“specific identification” basis or “last-in, first-out” (“LIFO”) basis. Inventories valued on the LIFO basis totaled¥402,180 million and ¥382,660 million at March 31, 2015 and 2016, respectively. Had the “first-in, first-out”basis been used for those companies using the LIFO basis, inventories would have been ¥39,165 million and¥13,297 million higher than reported at March 31, 2015 and 2016, respectively.
Property, plant and equipment -
Property, plant and equipment are stated at cost. Major renewals and improvements are capitalized; minorreplacements, maintenance and repairs are charged to current operations. Depreciation of property, plant andequipment is mainly computed on the declining-balance method for the parent company and Japanesesubsidiaries and on the straight-line method for foreign subsidiary companies at rates based on estimated usefullives of the respective assets according to general class, type of construction and use. The estimated useful livesrange from 2 to 65 years for buildings and from 2 to 20 years for machinery and equipment.
Vehicles and equipment on operating leases to third parties are originated by dealers and acquired by certainconsolidated subsidiaries. Such subsidiaries are also the lessors of certain property that they acquire directly.Vehicles and equipment on operating leases are depreciated primarily on a straight-line method over the leaseterm, generally from 2 to 5 years, to the estimated residual value. Incremental direct costs incurred in connectionwith the acquisition of operating lease contracts are capitalized and amortized on a straight-line method over thelease term.
Long-lived assets -
Toyota reviews its long-lived assets for impairment whenever events or changes in circumstances indicatethat the carrying amount of an asset group may not be recoverable. An impairment loss would be recognizedwhen the carrying amount of an asset group exceeds the estimated undiscounted cash flows expected to resultfrom the use of the asset and its eventual disposition. The amount of the impairment loss to be recorded iscalculated by the excess of the carrying value of the asset group over its fair value. Fair value is determinedmainly using a discounted cash flow valuation method.
Goodwill and intangible assets -
Goodwill is not material to Toyota’s consolidated balance sheets.
Intangible assets consist mainly of software. Intangible assets with a definite life are amortized on astraight-line basis with estimated useful lives mainly of 5 years. Intangible assets with an indefinite life are testedfor impairment whenever events or circumstances indicate that a carrying amount of an asset (asset group) maynot be recoverable.
An impairment loss would be recognized when the carrying amount of an asset exceeds the estimatedundiscounted cash flows used in determining the fair value of the asset. The amount of the impairment loss to berecorded is generally determined by the difference between the fair value of the asset using a discounted cashflow valuation method and the current book value.
Employee benefit obligations -
Toyota has both defined benefit and defined contribution plans for employees’ retirement benefits.Retirement benefit obligations are measured by actuarial calculations in accordance with U.S.GAAP. The funded
F-16
TOYOTA MOTOR CORPORATION
NOTES TO CONSOLIDATED FINANCIAL STATEMENTS—(Continued)
status of the defined benefit postretirement plans is recognized on the consolidated balance sheets as prepaidpension and severance costs or accrued pension and severance costs, and the funded status change is recognizedin the year in which it occurs through other comprehensive income.
Environmental matters -
Environmental expenditures relating to current operations are expensed or capitalized as appropriate.Expenditures relating to existing conditions caused by past operations, which do not contribute to current orfuture revenues, are expensed. Liabilities for remediation costs are recorded when they are probable andreasonably estimable, generally no later than the completion of feasibility studies or Toyota’s commitment to aplan of action. The cost of each environmental liability is estimated by using current technology available andvarious engineering, financial and legal specialists within Toyota based on current law. Such liabilities do notreflect any offset for possible recoveries from insurance companies and are not discounted. There were nomaterial changes in these liabilities for all periods presented.
Income taxes -
The provision for income taxes is computed based on the pretax income included in the consolidatedstatements of income. The asset and liability approach is used to recognize deferred tax assets and liabilities forthe expected future tax consequences of temporary differences between the carrying amounts and the tax bases ofassets and liabilities. Valuation allowances are recorded to reduce deferred tax assets when it is more likely thannot that a tax benefit will not be realized.
Derivative financial instruments -
Toyota employs derivative financial instruments, including forward foreign currency exchange contracts,foreign currency options, interest rate swaps, interest rate currency swap agreements and interest rate options tomanage its exposure to fluctuations in interest rates and foreign currency exchange rates. All derivative financialinstruments are recorded on the consolidated balance sheets at fair value, taking into consideration the effects oflegally enforceable master netting agreements that allow us to net settle positive and negative positions and offsetcash collateral held with the same counterparty on a net basis. Toyota does not use derivatives for speculation ortrading purposes. Changes in the fair value of derivatives are recorded each period in current earnings or throughother comprehensive income, depending on whether a derivative is designated as part of a hedge transaction andthe type of hedge transaction. The ineffective portion of all hedges is recognized currently in operations.
Net income attributable to Toyota Motor Corporation per common share -
Basic net income attributable to Toyota Motor Corporation per common share is calculated by dividing netincome attributable to common shareholders by the weighted-average number of common shares outstandingduring the reported period. The calculation of diluted net income attributable to Toyota Motor Corporation percommon share is done by adjusting net income attributable to common shareholders and the weighted-averagenumber of common shares outstanding, which includes the additional dilution from the assumed conversion ofmodel AA class shares and the assumed exercise of dilutive stock options.
Stock-based compensation -
Toyota measures compensation expense for its stock-based compensation plan based on the grant-date fairvalue of the award, and accounts for the award.
F-17
TOYOTA MOTOR CORPORATION
NOTES TO CONSOLIDATED FINANCIAL STATEMENTS—(Continued)
Other comprehensive income -
Other comprehensive income refers to revenues, expenses, gains and losses that, under U.S.GAAP areincluded in comprehensive income, but are excluded from net income as these amounts are recorded directly asan adjustment to shareholders’ equity. Toyota’s other comprehensive income is primarily comprised ofunrealized gains/losses on marketable securities designated as available-for-sale, foreign currency translationadjustments and adjustments attributed to pension liabilities associated with Toyota’s defined benefit pensionplans.
Accounting changes -
In April 2014, the FASB issued updated guidance on reporting discontinued operations and disclosures ofdisposals of components of an entity. Under the new guidance, only disposals that represent a strategic shift andthat have (or will have) a major effect on an entity’s operations and financial results should be presented asdiscontinued operations. Toyota adopted this guidance on April 1, 2015. The adoption of this guidance did nothave a material impact on Toyota’s consolidated financial statements.
Recent pronouncements to be adopted in future periods -
In May 2014, the FASB issued updated guidance on the recognition of revenue from contracts withcustomers. This guidance will supersede the current revenue recognition guidance. In August 2015, the FASBissued updated guidance on the deferral of the effective date. As a result, this guidance is effective for annualreporting periods beginning after December 15, 2017, including interim periods within that reporting period.Management is evaluating the impact of adopting this guidance on Toyota’s consolidated financial statements.
In February 2015, the FASB issued updated guidance that amends the analysis a reporting entity mustperform to determine whether it should consolidate certain legal entities. This guidance is effective for fiscalyears, and for interim periods within those fiscal years, beginning after December 15, 2015. Management isevaluating the impact of adopting this guidance on Toyota’s consolidated financial statements.
In April 2015, the FASB issued updated guidance that requires debt issuance costs related to a recognizeddebt liability be presented in the balance sheet as a direct deduction from the carrying amount of the related debtliability instead of being presented as an asset. In August 2015, the FASB issued an additional update whichclarifies that debt issuance costs for line of credit agreements may continue to be deferred and amortized. Thisguidance is effective for fiscal years beginning after December 15, 2015, and interim periods within those fiscalyears. Management does not expect this guidance to have a material impact on Toyota’s consolidated financialstatements.
In April 2015, the FASB issued updated guidance to help entities evaluate the accounting for fees paid by acustomer in a cloud computing arrangement. This guidance is effective for annual periods, including interimperiods within those annual periods, beginning after December 15, 2015. Management is evaluating the impact ofadopting this guidance on Toyota’s consolidated financial statements.
In May 2015, the FASB issued updated guidance on disclosures for investments in certain entities thatcalculate net asset value per share. This guidance removes the requirement to categorize within the fair valuehierarchy all investments for which fair value is measured using the net asset value per share practical expedient.This guidance is effective for fiscal years beginning after December 15, 2015, including interim periods withinthose fiscal years. Management is evaluating the impact of adopting this guidance on Toyota’s consolidatedfinancial statements.
F-18
TOYOTA MOTOR CORPORATION
NOTES TO CONSOLIDATED FINANCIAL STATEMENTS—(Continued)
In July 2015, the FASB issued updated guidance to simplify the measurement of inventory. This guidance iseffective for fiscal years beginning after December 15, 2016, including interim periods within those fiscal years.Management is evaluating the impact of adopting this guidance on Toyota’s consolidated financial statements.
In November 2015, the FASB issued updated guidance to simplify the balance sheet classification ofdeferred taxes. This guidance will require that deferred tax assets and liabilities be classified as noncurrent on thebalance sheet. This guidance is effective for annual periods beginning after December 15, 2016, and interimperiods within those annual periods. Current deferred tax assets were ¥967.6 billion and current deferred taxliabilities were ¥28.1 billion, as of March 31, 2016.
In January 2016, the FASB issued updated guidance for financial instruments. This guidance addressescertain aspects of recognition, measurement, presentation, and disclosure of financial instruments and willrequire entities to measure equity investments at fair value and recognize any changes in fair value in net income.This guidance is effective for fiscal years beginning after December 15, 2017, including interim periods withinthose fiscal years. Management is evaluating the impact of adopting this guidance on Toyota’s consolidatedfinancial statements.
In February 2016, the FASB issued updated guidance for leases. This guidance will require lessees torecognize almost all leases on their balance sheet as a right-of-use asset and a lease liability. This guidance iseffective for fiscal years beginning after December 15, 2018, including interim periods within those fiscal years.Management is evaluating the impact of adopting this guidance on Toyota’s consolidated financial statements.
In March 2016, the FASB issued updated guidance for effect of derivative contract novations on existinghedge accounting relationships. This guidance clarifies that a change in the counterparty to a designatedderivative hedging instrument does not, in and of itself, require dedesignation of that hedging relationshipprovided that all other hedge accounting criteria continue to be met. This guidance is effective for fiscal yearsbeginning after December 15, 2016, including interim periods within those fiscal years. Management isevaluating the impact of adopting this guidance on Toyota’s consolidated financial statements.
In March 2016, the FASB issued updated guidance for contingent put and call options in debt instruments.This guidance clarifies whether embedded contingent put and call options are clearly and closely related to thedebt host when bifurcating embedded derivatives. This guidance is effective for fiscal years beginning afterDecember 15, 2016, including interim periods within those fiscal years. Management is evaluating the impact ofadopting this guidance on Toyota’s consolidated financial statements.
In June 2016, the FASB issued updated guidance for measurement of credit losses on financial instruments.This guidance introduces an approach to estimate credit losses on certain types of financial instruments based onexpected losses. It also modifies the impairment model for available-for-sale debt securities. This guidance iseffective for fiscal years beginning after December 15, 2019, including interim periods within those fiscal years.Management is evaluating the impact of adopting this guidance on Toyota’s consolidated financial statements.
Reclassifications -
Certain prior year amounts have been reclassified to conform to the presentations as of and for the yearended March 31, 2016.
F-19
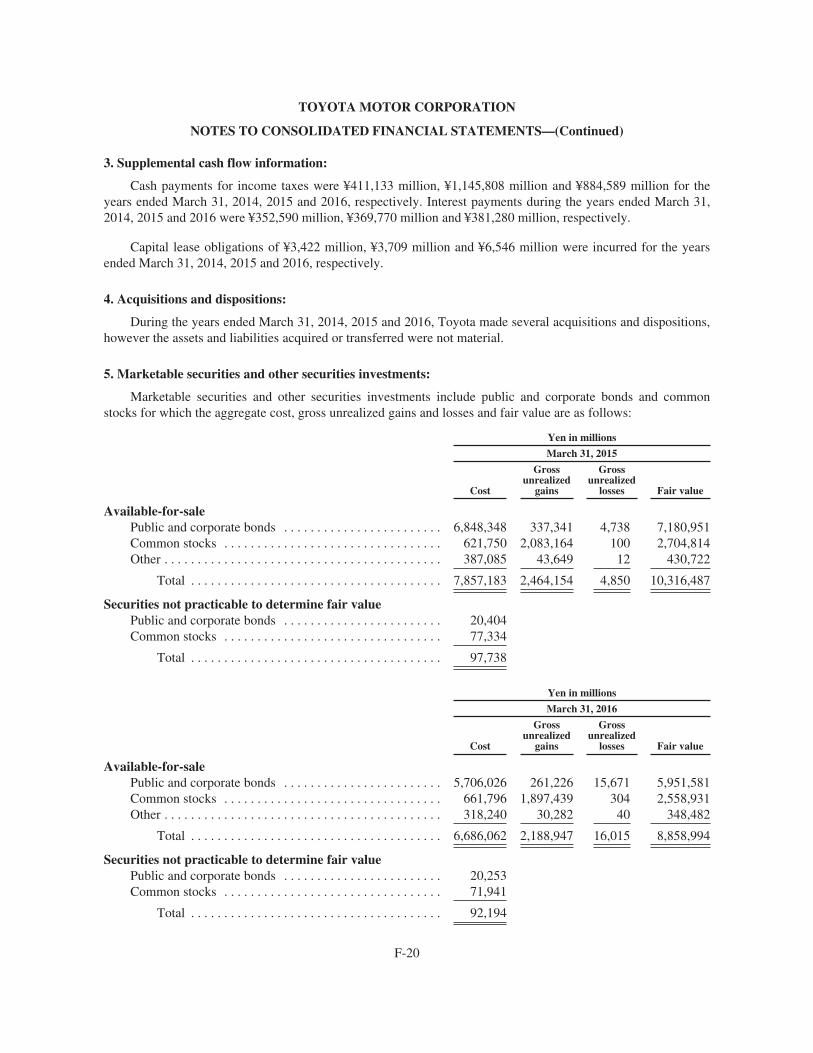
TOYOTA MOTOR CORPORATION
NOTES TO CONSOLIDATED FINANCIAL STATEMENTS—(Continued)
3. Supplemental cash flow information:
Cash payments for income taxes were ¥411,133 million, ¥1,145,808 million and ¥884,589 million for theyears ended March 31, 2014, 2015 and 2016, respectively. Interest payments during the years ended March 31,2014, 2015 and 2016 were ¥352,590 million, ¥369,770 million and ¥381,280 million, respectively.
Capital lease obligations of ¥3,422 million, ¥3,709 million and ¥6,546 million were incurred for the yearsended March 31, 2014, 2015 and 2016, respectively.
4. Acquisitions and dispositions:
During the years ended March 31, 2014, 2015 and 2016, Toyota made several acquisitions and dispositions,however the assets and liabilities acquired or transferred were not material.
5. Marketable securities and other securities investments:
Marketable securities and other securities investments include public and corporate bonds and commonstocks for which the aggregate cost, gross unrealized gains and losses and fair value are as follows:
Yen in millions
March 31, 2015
Cost
Grossunrealized
gains
Grossunrealized
losses Fair value
Available-for-salePublic and corporate bonds . . . . . . . . . . . . . . . . . . . . . . . . 6,848,348 337,341 4,738 7,180,951Common stocks . . . . . . . . . . . . . . . . . . . . . . . . . . . . . . . . . 621,750 2,083,164 100 2,704,814Other . . . . . . . . . . . . . . . . . . . . . . . . . . . . . . . . . . . . . . . . . . 387,085 43,649 12 430,722
Total . . . . . . . . . . . . . . . . . . . . . . . . . . . . . . . . . . . . . . 7,857,183 2,464,154 4,850 10,316,487
Securities not practicable to determine fair valuePublic and corporate bonds . . . . . . . . . . . . . . . . . . . . . . . . 20,404Common stocks . . . . . . . . . . . . . . . . . . . . . . . . . . . . . . . . . 77,334
Total . . . . . . . . . . . . . . . . . . . . . . . . . . . . . . . . . . . . . . 97,738
Yen in millions
March 31, 2016
Cost
Grossunrealized
gains
Grossunrealized
losses Fair value
Available-for-salePublic and corporate bonds . . . . . . . . . . . . . . . . . . . . . . . . 5,706,026 261,226 15,671 5,951,581Common stocks . . . . . . . . . . . . . . . . . . . . . . . . . . . . . . . . . 661,796 1,897,439 304 2,558,931Other . . . . . . . . . . . . . . . . . . . . . . . . . . . . . . . . . . . . . . . . . . 318,240 30,282 40 348,482
Total . . . . . . . . . . . . . . . . . . . . . . . . . . . . . . . . . . . . . . 6,686,062 2,188,947 16,015 8,858,994
Securities not practicable to determine fair valuePublic and corporate bonds . . . . . . . . . . . . . . . . . . . . . . . . 20,253Common stocks . . . . . . . . . . . . . . . . . . . . . . . . . . . . . . . . . 71,941
Total . . . . . . . . . . . . . . . . . . . . . . . . . . . . . . . . . . . . . . 92,194
F-20
TOYOTA MOTOR CORPORATION
NOTES TO CONSOLIDATED FINANCIAL STATEMENTS—(Continued)
Public and corporate bonds included in available-for-sale represent 43% of Japanese bonds, and 57% ofU.S., European and other bonds as of March 31, 2015, and 37% of Japanese bonds, and 63% of U.S., Europeanand other bonds as of March 31, 2016. Listed stocks on the Japanese stock markets represent 88% and 90% ofcommon stocks which are included in available-for-sale as of March 31, 2015 and 2016, respectively. Public andcorporate bonds include government bonds, and “Other” includes investment trusts.
Unrealized losses continuing over a 12 month period or more in the aggregate were not material as ofMarch 31, 2015 and 2016.
As of March 31, 2015 and 2016, maturities of public and corporate bonds included in available-for-sale aremainly from 1 to 10 years.
Proceeds from sales of available-for-sale securities were ¥538,894 million, ¥113,348 million and¥108,708 million for the years ended March 31, 2014, 2015 and 2016, respectively. On those sales, gross realizedgains were ¥25,099 million, ¥17,912 million and ¥9,500 million and gross realized losses were ¥404 million,¥161 million and ¥365 million, respectively.
During the years ended March 31, 2014, 2015 and 2016, Toyota recognized impairment losses on available-for-sale securities of ¥6,197 million, ¥2,578 million and ¥9,272 million, respectively, which are included in“Other income (loss), net” and other in the accompanying consolidated statements of income.
In the ordinary course of business, Toyota maintains long-term investment securities, included in“Marketable securities and other securities investments” and issued by a number of non-public companies whichare recorded at cost, as their fair values were not readily determinable. Management employs a systematicmethodology to assess the recoverability of such investments by reviewing the financial viability of theunderlying companies and the prevailing market conditions in which these companies operate to determine ifToyota’s investment in each individual company is impaired and whether the impairment is other-than-temporary. Toyota periodically performs this impairment test for significant investments recorded at cost. If theimpairment is determined to be other-than-temporary, the carrying value of the investment is written-down by theimpaired amount and the losses are recognized currently in operations.
F-21
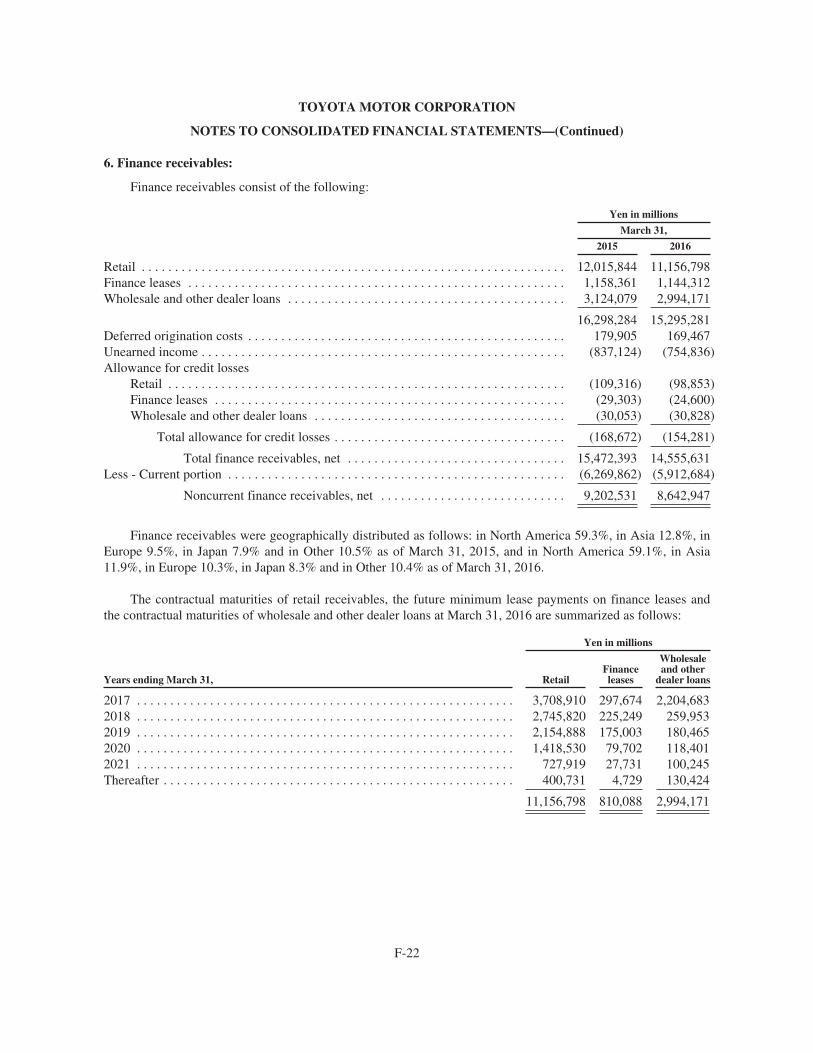
TOYOTA MOTOR CORPORATION
NOTES TO CONSOLIDATED FINANCIAL STATEMENTS—(Continued)
6. Finance receivables:
Finance receivables consist of the following:
Yen in millions
March 31,
2015 2016
Retail . . . . . . . . . . . . . . . . . . . . . . . . . . . . . . . . . . . . . . . . . . . . . . . . . . . . . . . . . . . . . . . . 12,015,844 11,156,798Finance leases . . . . . . . . . . . . . . . . . . . . . . . . . . . . . . . . . . . . . . . . . . . . . . . . . . . . . . . . . 1,158,361 1,144,312Wholesale and other dealer loans . . . . . . . . . . . . . . . . . . . . . . . . . . . . . . . . . . . . . . . . . . 3,124,079 2,994,171
16,298,284 15,295,281Deferred origination costs . . . . . . . . . . . . . . . . . . . . . . . . . . . . . . . . . . . . . . . . . . . . . . . . 179,905 169,467Unearned income . . . . . . . . . . . . . . . . . . . . . . . . . . . . . . . . . . . . . . . . . . . . . . . . . . . . . . . (837,124) (754,836)Allowance for credit losses
Retail . . . . . . . . . . . . . . . . . . . . . . . . . . . . . . . . . . . . . . . . . . . . . . . . . . . . . . . . . . . . (109,316) (98,853)Finance leases . . . . . . . . . . . . . . . . . . . . . . . . . . . . . . . . . . . . . . . . . . . . . . . . . . . . . (29,303) (24,600)Wholesale and other dealer loans . . . . . . . . . . . . . . . . . . . . . . . . . . . . . . . . . . . . . . (30,053) (30,828)
Total allowance for credit losses . . . . . . . . . . . . . . . . . . . . . . . . . . . . . . . . . . . (168,672) (154,281)
Total finance receivables, net . . . . . . . . . . . . . . . . . . . . . . . . . . . . . . . . . 15,472,393 14,555,631Less - Current portion . . . . . . . . . . . . . . . . . . . . . . . . . . . . . . . . . . . . . . . . . . . . . . . . . . . (6,269,862) (5,912,684)
Noncurrent finance receivables, net . . . . . . . . . . . . . . . . . . . . . . . . . . . . 9,202,531 8,642,947
Finance receivables were geographically distributed as follows: in North America 59.3%, in Asia 12.8%, inEurope 9.5%, in Japan 7.9% and in Other 10.5% as of March 31, 2015, and in North America 59.1%, in Asia11.9%, in Europe 10.3%, in Japan 8.3% and in Other 10.4% as of March 31, 2016.
The contractual maturities of retail receivables, the future minimum lease payments on finance leases andthe contractual maturities of wholesale and other dealer loans at March 31, 2016 are summarized as follows:
Yen in millions
Years ending March 31, RetailFinanceleases
Wholesaleand other
dealer loans
2017 . . . . . . . . . . . . . . . . . . . . . . . . . . . . . . . . . . . . . . . . . . . . . . . . . . . . . . . . . 3,708,910 297,674 2,204,6832018 . . . . . . . . . . . . . . . . . . . . . . . . . . . . . . . . . . . . . . . . . . . . . . . . . . . . . . . . . 2,745,820 225,249 259,9532019 . . . . . . . . . . . . . . . . . . . . . . . . . . . . . . . . . . . . . . . . . . . . . . . . . . . . . . . . . 2,154,888 175,003 180,4652020 . . . . . . . . . . . . . . . . . . . . . . . . . . . . . . . . . . . . . . . . . . . . . . . . . . . . . . . . . 1,418,530 79,702 118,4012021 . . . . . . . . . . . . . . . . . . . . . . . . . . . . . . . . . . . . . . . . . . . . . . . . . . . . . . . . . 727,919 27,731 100,245Thereafter . . . . . . . . . . . . . . . . . . . . . . . . . . . . . . . . . . . . . . . . . . . . . . . . . . . . . 400,731 4,729 130,424
11,156,798 810,088 2,994,171
F-22
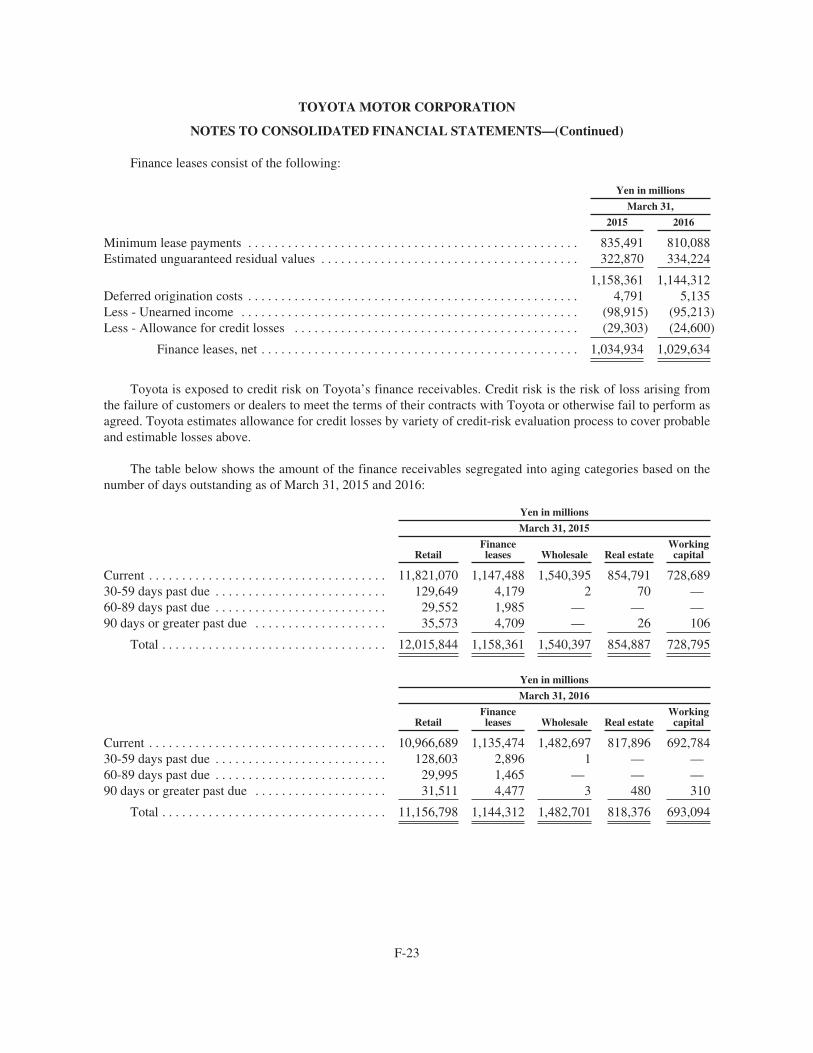
TOYOTA MOTOR CORPORATION
NOTES TO CONSOLIDATED FINANCIAL STATEMENTS—(Continued)
Finance leases consist of the following:
Yen in millions
March 31,
2015 2016
Minimum lease payments . . . . . . . . . . . . . . . . . . . . . . . . . . . . . . . . . . . . . . . . . . . . . . . . . . 835,491 810,088Estimated unguaranteed residual values . . . . . . . . . . . . . . . . . . . . . . . . . . . . . . . . . . . . . . . 322,870 334,224
1,158,361 1,144,312Deferred origination costs . . . . . . . . . . . . . . . . . . . . . . . . . . . . . . . . . . . . . . . . . . . . . . . . . . 4,791 5,135Less - Unearned income . . . . . . . . . . . . . . . . . . . . . . . . . . . . . . . . . . . . . . . . . . . . . . . . . . . (98,915) (95,213)Less - Allowance for credit losses . . . . . . . . . . . . . . . . . . . . . . . . . . . . . . . . . . . . . . . . . . . (29,303) (24,600)
Finance leases, net . . . . . . . . . . . . . . . . . . . . . . . . . . . . . . . . . . . . . . . . . . . . . . . . 1,034,934 1,029,634
Toyota is exposed to credit risk on Toyota’s finance receivables. Credit risk is the risk of loss arising fromthe failure of customers or dealers to meet the terms of their contracts with Toyota or otherwise fail to perform asagreed. Toyota estimates allowance for credit losses by variety of credit-risk evaluation process to cover probableand estimable losses above.
The table below shows the amount of the finance receivables segregated into aging categories based on thenumber of days outstanding as of March 31, 2015 and 2016:
Yen in millions
March 31, 2015
RetailFinanceleases Wholesale Real estate
Workingcapital
Current . . . . . . . . . . . . . . . . . . . . . . . . . . . . . . . . . . . . 11,821,070 1,147,488 1,540,395 854,791 728,68930-59 days past due . . . . . . . . . . . . . . . . . . . . . . . . . . 129,649 4,179 2 70 —60-89 days past due . . . . . . . . . . . . . . . . . . . . . . . . . . 29,552 1,985 — — —90 days or greater past due . . . . . . . . . . . . . . . . . . . . 35,573 4,709 — 26 106
Total . . . . . . . . . . . . . . . . . . . . . . . . . . . . . . . . . . 12,015,844 1,158,361 1,540,397 854,887 728,795
Yen in millions
March 31, 2016
RetailFinanceleases Wholesale Real estate
Workingcapital
Current . . . . . . . . . . . . . . . . . . . . . . . . . . . . . . . . . . . . 10,966,689 1,135,474 1,482,697 817,896 692,78430-59 days past due . . . . . . . . . . . . . . . . . . . . . . . . . . 128,603 2,896 1 — —60-89 days past due . . . . . . . . . . . . . . . . . . . . . . . . . . 29,995 1,465 — — —90 days or greater past due . . . . . . . . . . . . . . . . . . . . 31,511 4,477 3 480 310
Total . . . . . . . . . . . . . . . . . . . . . . . . . . . . . . . . . . 11,156,798 1,144,312 1,482,701 818,376 693,094
F-23
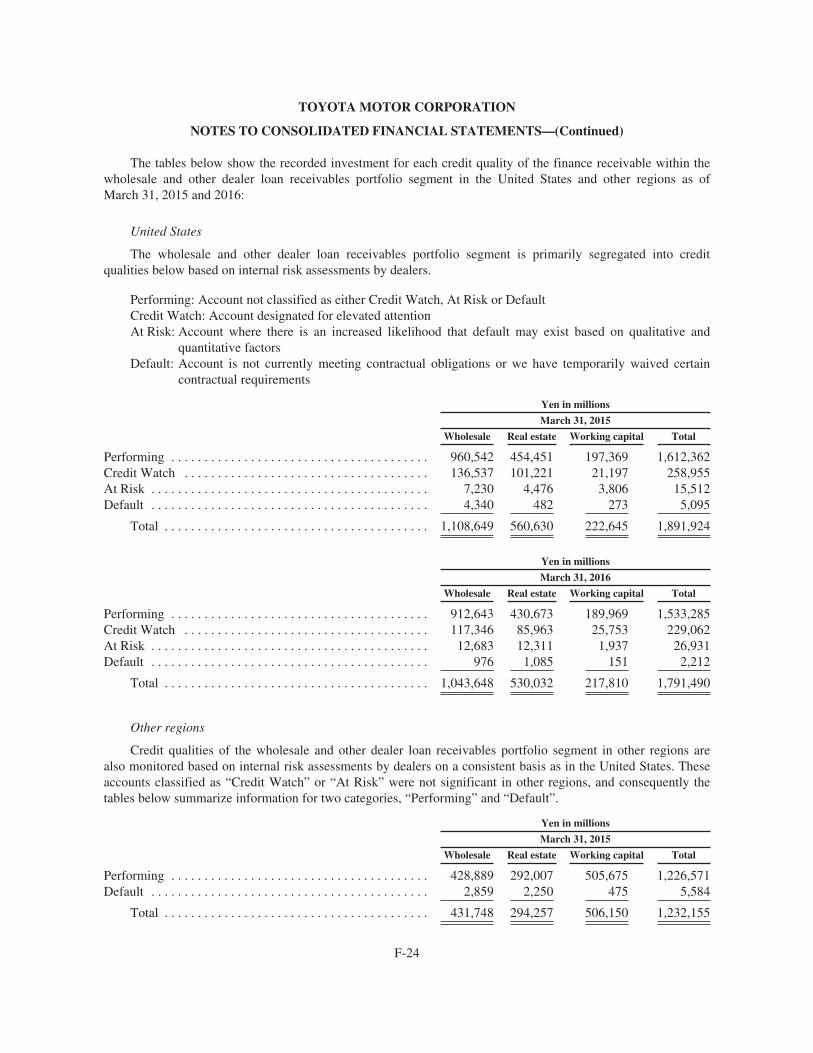
TOYOTA MOTOR CORPORATION
NOTES TO CONSOLIDATED FINANCIAL STATEMENTS—(Continued)
The tables below show the recorded investment for each credit quality of the finance receivable within thewholesale and other dealer loan receivables portfolio segment in the United States and other regions as ofMarch 31, 2015 and 2016:
United States
The wholesale and other dealer loan receivables portfolio segment is primarily segregated into creditqualities below based on internal risk assessments by dealers.
Performing: Account not classified as either Credit Watch, At Risk or DefaultCredit Watch: Account designated for elevated attentionAt Risk: Account where there is an increased likelihood that default may exist based on qualitative and
quantitative factorsDefault: Account is not currently meeting contractual obligations or we have temporarily waived certain
contractual requirements
Yen in millions
March 31, 2015
Wholesale Real estate Working capital Total
Performing . . . . . . . . . . . . . . . . . . . . . . . . . . . . . . . . . . . . . . . 960,542 454,451 197,369 1,612,362Credit Watch . . . . . . . . . . . . . . . . . . . . . . . . . . . . . . . . . . . . . 136,537 101,221 21,197 258,955At Risk . . . . . . . . . . . . . . . . . . . . . . . . . . . . . . . . . . . . . . . . . . 7,230 4,476 3,806 15,512Default . . . . . . . . . . . . . . . . . . . . . . . . . . . . . . . . . . . . . . . . . . 4,340 482 273 5,095
Total . . . . . . . . . . . . . . . . . . . . . . . . . . . . . . . . . . . . . . . . 1,108,649 560,630 222,645 1,891,924
Yen in millions
March 31, 2016
Wholesale Real estate Working capital Total
Performing . . . . . . . . . . . . . . . . . . . . . . . . . . . . . . . . . . . . . . . 912,643 430,673 189,969 1,533,285Credit Watch . . . . . . . . . . . . . . . . . . . . . . . . . . . . . . . . . . . . . 117,346 85,963 25,753 229,062At Risk . . . . . . . . . . . . . . . . . . . . . . . . . . . . . . . . . . . . . . . . . . 12,683 12,311 1,937 26,931Default . . . . . . . . . . . . . . . . . . . . . . . . . . . . . . . . . . . . . . . . . . 976 1,085 151 2,212
Total . . . . . . . . . . . . . . . . . . . . . . . . . . . . . . . . . . . . . . . . 1,043,648 530,032 217,810 1,791,490
Other regions
Credit qualities of the wholesale and other dealer loan receivables portfolio segment in other regions arealso monitored based on internal risk assessments by dealers on a consistent basis as in the United States. Theseaccounts classified as “Credit Watch” or “At Risk” were not significant in other regions, and consequently thetables below summarize information for two categories, “Performing” and “Default”.
Yen in millions
March 31, 2015
Wholesale Real estate Working capital Total
Performing . . . . . . . . . . . . . . . . . . . . . . . . . . . . . . . . . . . . . . . 428,889 292,007 505,675 1,226,571Default . . . . . . . . . . . . . . . . . . . . . . . . . . . . . . . . . . . . . . . . . . 2,859 2,250 475 5,584
Total . . . . . . . . . . . . . . . . . . . . . . . . . . . . . . . . . . . . . . . . 431,748 294,257 506,150 1,232,155
F-24
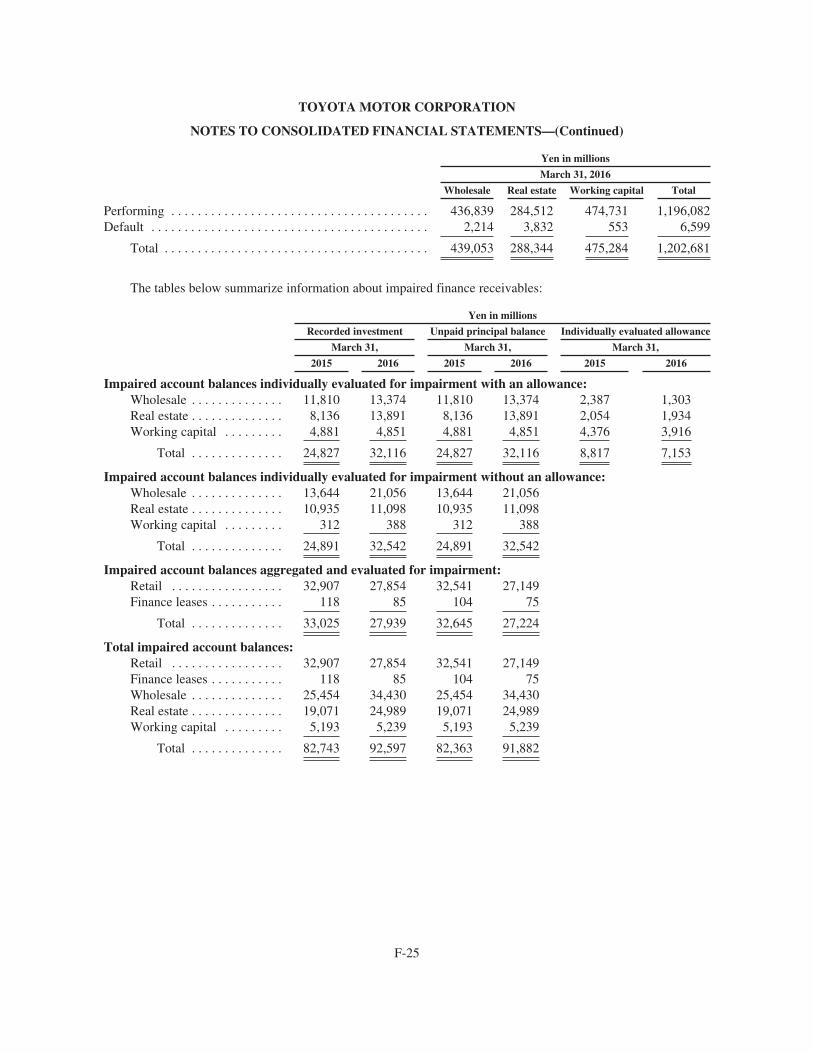
TOYOTA MOTOR CORPORATION
NOTES TO CONSOLIDATED FINANCIAL STATEMENTS—(Continued)
Yen in millions
March 31, 2016
Wholesale Real estate Working capital Total
Performing . . . . . . . . . . . . . . . . . . . . . . . . . . . . . . . . . . . . . . . 436,839 284,512 474,731 1,196,082Default . . . . . . . . . . . . . . . . . . . . . . . . . . . . . . . . . . . . . . . . . . 2,214 3,832 553 6,599
Total . . . . . . . . . . . . . . . . . . . . . . . . . . . . . . . . . . . . . . . . 439,053 288,344 475,284 1,202,681
The tables below summarize information about impaired finance receivables:
Yen in millions
Recorded investment Unpaid principal balance Individually evaluated allowance
March 31, March 31, March 31,
2015 2016 2015 2016 2015 2016
Impaired account balances individually evaluated for impairment with an allowance:Wholesale . . . . . . . . . . . . . . 11,810 13,374 11,810 13,374 2,387 1,303Real estate . . . . . . . . . . . . . . 8,136 13,891 8,136 13,891 2,054 1,934Working capital . . . . . . . . . 4,881 4,851 4,881 4,851 4,376 3,916
Total . . . . . . . . . . . . . . 24,827 32,116 24,827 32,116 8,817 7,153
Impaired account balances individually evaluated for impairment without an allowance:Wholesale . . . . . . . . . . . . . . 13,644 21,056 13,644 21,056Real estate . . . . . . . . . . . . . . 10,935 11,098 10,935 11,098Working capital . . . . . . . . . 312 388 312 388
Total . . . . . . . . . . . . . . 24,891 32,542 24,891 32,542
Impaired account balances aggregated and evaluated for impairment:Retail . . . . . . . . . . . . . . . . . 32,907 27,854 32,541 27,149Finance leases . . . . . . . . . . . 118 85 104 75
Total . . . . . . . . . . . . . . 33,025 27,939 32,645 27,224
Total impaired account balances:Retail . . . . . . . . . . . . . . . . . 32,907 27,854 32,541 27,149Finance leases . . . . . . . . . . . 118 85 104 75Wholesale . . . . . . . . . . . . . . 25,454 34,430 25,454 34,430Real estate . . . . . . . . . . . . . . 19,071 24,989 19,071 24,989Working capital . . . . . . . . . 5,193 5,239 5,193 5,239
Total . . . . . . . . . . . . . . 82,743 92,597 82,363 91,882
F-25
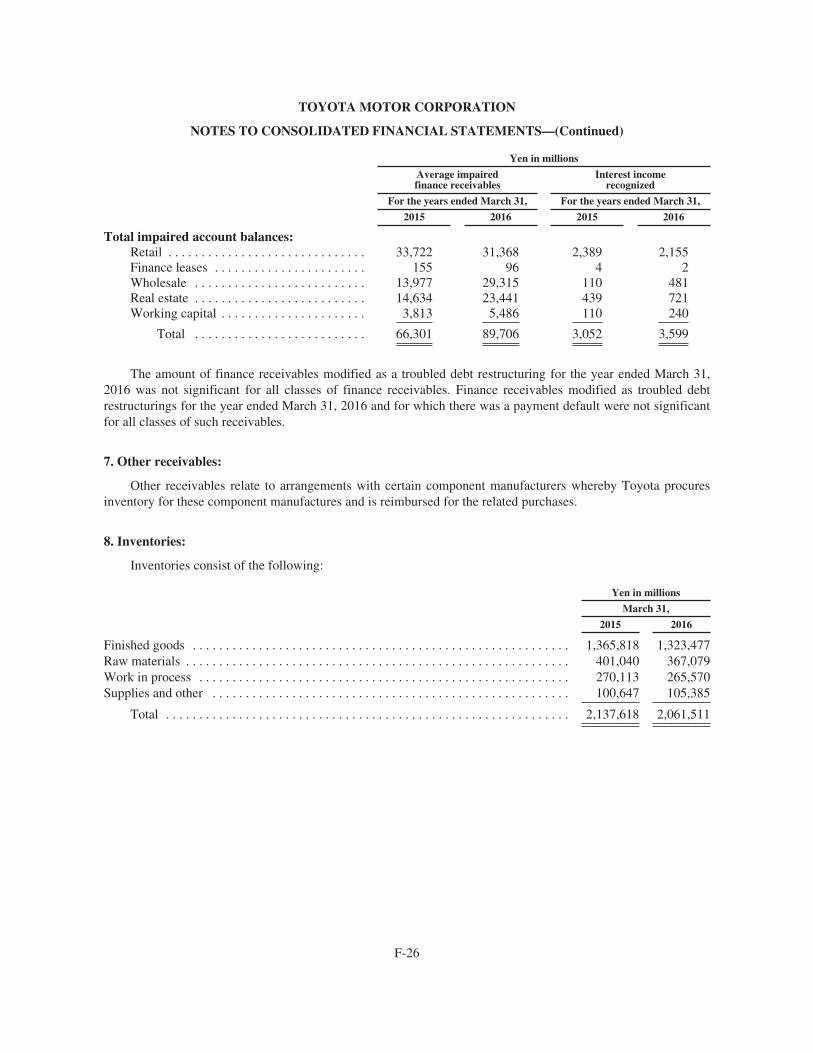
TOYOTA MOTOR CORPORATION
NOTES TO CONSOLIDATED FINANCIAL STATEMENTS—(Continued)
Yen in millions
Average impairedfinance receivables
Interest incomerecognized
For the years ended March 31, For the years ended March 31,
2015 2016 2015 2016
Total impaired account balances:Retail . . . . . . . . . . . . . . . . . . . . . . . . . . . . . . 33,722 31,368 2,389 2,155Finance leases . . . . . . . . . . . . . . . . . . . . . . . 155 96 4 2Wholesale . . . . . . . . . . . . . . . . . . . . . . . . . . 13,977 29,315 110 481Real estate . . . . . . . . . . . . . . . . . . . . . . . . . . 14,634 23,441 439 721Working capital . . . . . . . . . . . . . . . . . . . . . . 3,813 5,486 110 240
Total . . . . . . . . . . . . . . . . . . . . . . . . . . 66,301 89,706 3,052 3,599
The amount of finance receivables modified as a troubled debt restructuring for the year ended March 31,2016 was not significant for all classes of finance receivables. Finance receivables modified as troubled debtrestructurings for the year ended March 31, 2016 and for which there was a payment default were not significantfor all classes of such receivables.
7. Other receivables:
Other receivables relate to arrangements with certain component manufacturers whereby Toyota procuresinventory for these component manufactures and is reimbursed for the related purchases.
8. Inventories:
Inventories consist of the following:
Yen in millions
March 31,
2015 2016
Finished goods . . . . . . . . . . . . . . . . . . . . . . . . . . . . . . . . . . . . . . . . . . . . . . . . . . . . . . . . . 1,365,818 1,323,477Raw materials . . . . . . . . . . . . . . . . . . . . . . . . . . . . . . . . . . . . . . . . . . . . . . . . . . . . . . . . . . 401,040 367,079Work in process . . . . . . . . . . . . . . . . . . . . . . . . . . . . . . . . . . . . . . . . . . . . . . . . . . . . . . . . 270,113 265,570Supplies and other . . . . . . . . . . . . . . . . . . . . . . . . . . . . . . . . . . . . . . . . . . . . . . . . . . . . . . 100,647 105,385
Total . . . . . . . . . . . . . . . . . . . . . . . . . . . . . . . . . . . . . . . . . . . . . . . . . . . . . . . . . . . . . 2,137,618 2,061,511
F-26
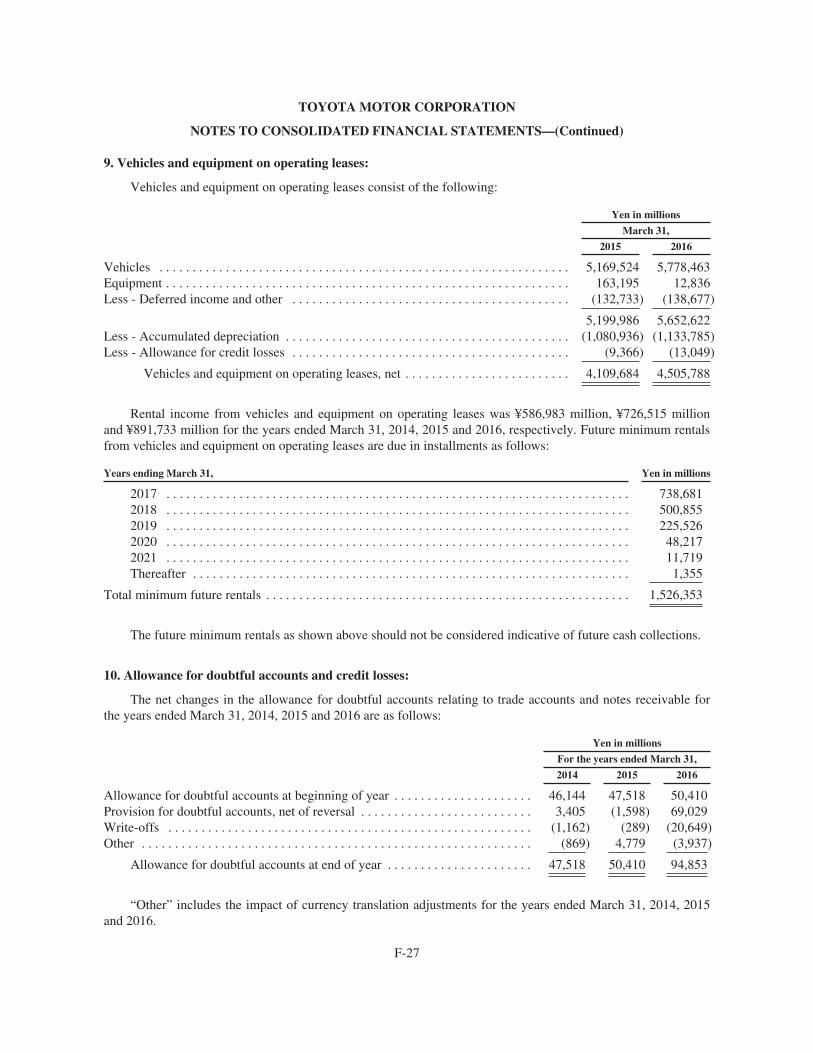
TOYOTA MOTOR CORPORATION
NOTES TO CONSOLIDATED FINANCIAL STATEMENTS—(Continued)
9. Vehicles and equipment on operating leases:
Vehicles and equipment on operating leases consist of the following:
Yen in millions
March 31,
2015 2016
Vehicles . . . . . . . . . . . . . . . . . . . . . . . . . . . . . . . . . . . . . . . . . . . . . . . . . . . . . . . . . . . . . . 5,169,524 5,778,463Equipment . . . . . . . . . . . . . . . . . . . . . . . . . . . . . . . . . . . . . . . . . . . . . . . . . . . . . . . . . . . . . 163,195 12,836Less - Deferred income and other . . . . . . . . . . . . . . . . . . . . . . . . . . . . . . . . . . . . . . . . . . (132,733) (138,677)
5,199,986 5,652,622Less - Accumulated depreciation . . . . . . . . . . . . . . . . . . . . . . . . . . . . . . . . . . . . . . . . . . . (1,080,936) (1,133,785)Less - Allowance for credit losses . . . . . . . . . . . . . . . . . . . . . . . . . . . . . . . . . . . . . . . . . . (9,366) (13,049)
Vehicles and equipment on operating leases, net . . . . . . . . . . . . . . . . . . . . . . . . . 4,109,684 4,505,788
Rental income from vehicles and equipment on operating leases was ¥586,983 million, ¥726,515 millionand ¥891,733 million for the years ended March 31, 2014, 2015 and 2016, respectively. Future minimum rentalsfrom vehicles and equipment on operating leases are due in installments as follows:
Years ending March 31, Yen in millions
2017 . . . . . . . . . . . . . . . . . . . . . . . . . . . . . . . . . . . . . . . . . . . . . . . . . . . . . . . . . . . . . . . . . . . . . . 738,6812018 . . . . . . . . . . . . . . . . . . . . . . . . . . . . . . . . . . . . . . . . . . . . . . . . . . . . . . . . . . . . . . . . . . . . . . 500,8552019 . . . . . . . . . . . . . . . . . . . . . . . . . . . . . . . . . . . . . . . . . . . . . . . . . . . . . . . . . . . . . . . . . . . . . . 225,5262020 . . . . . . . . . . . . . . . . . . . . . . . . . . . . . . . . . . . . . . . . . . . . . . . . . . . . . . . . . . . . . . . . . . . . . . 48,2172021 . . . . . . . . . . . . . . . . . . . . . . . . . . . . . . . . . . . . . . . . . . . . . . . . . . . . . . . . . . . . . . . . . . . . . . 11,719Thereafter . . . . . . . . . . . . . . . . . . . . . . . . . . . . . . . . . . . . . . . . . . . . . . . . . . . . . . . . . . . . . . . . . . 1,355
Total minimum future rentals . . . . . . . . . . . . . . . . . . . . . . . . . . . . . . . . . . . . . . . . . . . . . . . . . . . . . . . 1,526,353
The future minimum rentals as shown above should not be considered indicative of future cash collections.
10. Allowance for doubtful accounts and credit losses:
The net changes in the allowance for doubtful accounts relating to trade accounts and notes receivable forthe years ended March 31, 2014, 2015 and 2016 are as follows:
Yen in millions
For the years ended March 31,
2014 2015 2016
Allowance for doubtful accounts at beginning of year . . . . . . . . . . . . . . . . . . . . . 46,144 47,518 50,410Provision for doubtful accounts, net of reversal . . . . . . . . . . . . . . . . . . . . . . . . . . 3,405 (1,598) 69,029Write-offs . . . . . . . . . . . . . . . . . . . . . . . . . . . . . . . . . . . . . . . . . . . . . . . . . . . . . . . (1,162) (289) (20,649)Other . . . . . . . . . . . . . . . . . . . . . . . . . . . . . . . . . . . . . . . . . . . . . . . . . . . . . . . . . . . (869) 4,779 (3,937)
Allowance for doubtful accounts at end of year . . . . . . . . . . . . . . . . . . . . . . 47,518 50,410 94,853
“Other” includes the impact of currency translation adjustments for the years ended March 31, 2014, 2015and 2016.
F-27
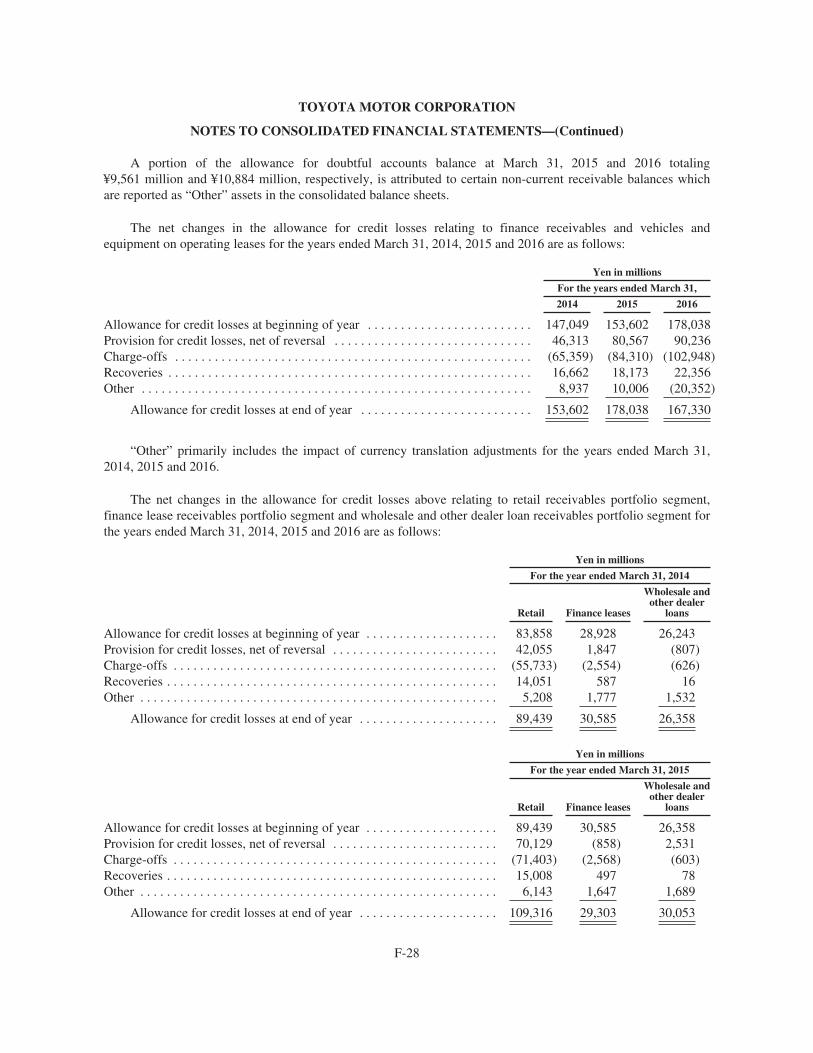
TOYOTA MOTOR CORPORATION
NOTES TO CONSOLIDATED FINANCIAL STATEMENTS—(Continued)
A portion of the allowance for doubtful accounts balance at March 31, 2015 and 2016 totaling¥9,561 million and ¥10,884 million, respectively, is attributed to certain non-current receivable balances whichare reported as “Other” assets in the consolidated balance sheets.
The net changes in the allowance for credit losses relating to finance receivables and vehicles andequipment on operating leases for the years ended March 31, 2014, 2015 and 2016 are as follows:
Yen in millions
For the years ended March 31,
2014 2015 2016
Allowance for credit losses at beginning of year . . . . . . . . . . . . . . . . . . . . . . . . . 147,049 153,602 178,038Provision for credit losses, net of reversal . . . . . . . . . . . . . . . . . . . . . . . . . . . . . . 46,313 80,567 90,236Charge-offs . . . . . . . . . . . . . . . . . . . . . . . . . . . . . . . . . . . . . . . . . . . . . . . . . . . . . . (65,359) (84,310) (102,948)Recoveries . . . . . . . . . . . . . . . . . . . . . . . . . . . . . . . . . . . . . . . . . . . . . . . . . . . . . . . 16,662 18,173 22,356Other . . . . . . . . . . . . . . . . . . . . . . . . . . . . . . . . . . . . . . . . . . . . . . . . . . . . . . . . . . . 8,937 10,006 (20,352)
Allowance for credit losses at end of year . . . . . . . . . . . . . . . . . . . . . . . . . . 153,602 178,038 167,330
“Other” primarily includes the impact of currency translation adjustments for the years ended March 31,2014, 2015 and 2016.
The net changes in the allowance for credit losses above relating to retail receivables portfolio segment,finance lease receivables portfolio segment and wholesale and other dealer loan receivables portfolio segment forthe years ended March 31, 2014, 2015 and 2016 are as follows:
Yen in millions
For the year ended March 31, 2014
Retail Finance leases
Wholesale andother dealer
loans
Allowance for credit losses at beginning of year . . . . . . . . . . . . . . . . . . . . 83,858 28,928 26,243Provision for credit losses, net of reversal . . . . . . . . . . . . . . . . . . . . . . . . . 42,055 1,847 (807)Charge-offs . . . . . . . . . . . . . . . . . . . . . . . . . . . . . . . . . . . . . . . . . . . . . . . . . (55,733) (2,554) (626)Recoveries . . . . . . . . . . . . . . . . . . . . . . . . . . . . . . . . . . . . . . . . . . . . . . . . . . 14,051 587 16Other . . . . . . . . . . . . . . . . . . . . . . . . . . . . . . . . . . . . . . . . . . . . . . . . . . . . . . 5,208 1,777 1,532
Allowance for credit losses at end of year . . . . . . . . . . . . . . . . . . . . . 89,439 30,585 26,358
Yen in millions
For the year ended March 31, 2015
Retail Finance leases
Wholesale andother dealer
loans
Allowance for credit losses at beginning of year . . . . . . . . . . . . . . . . . . . . 89,439 30,585 26,358Provision for credit losses, net of reversal . . . . . . . . . . . . . . . . . . . . . . . . . 70,129 (858) 2,531Charge-offs . . . . . . . . . . . . . . . . . . . . . . . . . . . . . . . . . . . . . . . . . . . . . . . . . (71,403) (2,568) (603)Recoveries . . . . . . . . . . . . . . . . . . . . . . . . . . . . . . . . . . . . . . . . . . . . . . . . . . 15,008 497 78Other . . . . . . . . . . . . . . . . . . . . . . . . . . . . . . . . . . . . . . . . . . . . . . . . . . . . . . 6,143 1,647 1,689
Allowance for credit losses at end of year . . . . . . . . . . . . . . . . . . . . . 109,316 29,303 30,053
F-28
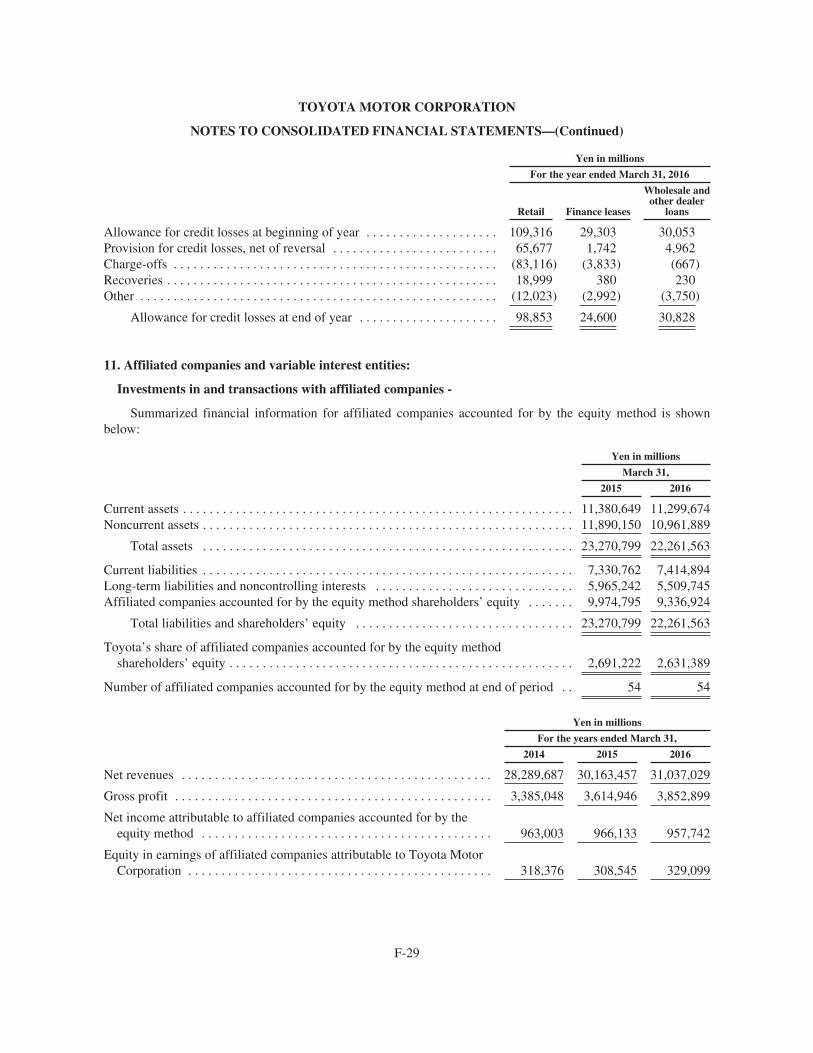
TOYOTA MOTOR CORPORATION
NOTES TO CONSOLIDATED FINANCIAL STATEMENTS—(Continued)
Yen in millions
For the year ended March 31, 2016
Retail Finance leases
Wholesale andother dealer
loans
Allowance for credit losses at beginning of year . . . . . . . . . . . . . . . . . . . . 109,316 29,303 30,053Provision for credit losses, net of reversal . . . . . . . . . . . . . . . . . . . . . . . . . 65,677 1,742 4,962Charge-offs . . . . . . . . . . . . . . . . . . . . . . . . . . . . . . . . . . . . . . . . . . . . . . . . . (83,116) (3,833) (667)Recoveries . . . . . . . . . . . . . . . . . . . . . . . . . . . . . . . . . . . . . . . . . . . . . . . . . . 18,999 380 230Other . . . . . . . . . . . . . . . . . . . . . . . . . . . . . . . . . . . . . . . . . . . . . . . . . . . . . . (12,023) (2,992) (3,750)
Allowance for credit losses at end of year . . . . . . . . . . . . . . . . . . . . . 98,853 24,600 30,828
11. Affiliated companies and variable interest entities:
Investments in and transactions with affiliated companies -
Summarized financial information for affiliated companies accounted for by the equity method is shownbelow:
Yen in millions
March 31,
2015 2016
Current assets . . . . . . . . . . . . . . . . . . . . . . . . . . . . . . . . . . . . . . . . . . . . . . . . . . . . . . . . . . . 11,380,649 11,299,674Noncurrent assets . . . . . . . . . . . . . . . . . . . . . . . . . . . . . . . . . . . . . . . . . . . . . . . . . . . . . . . . 11,890,150 10,961,889
Total assets . . . . . . . . . . . . . . . . . . . . . . . . . . . . . . . . . . . . . . . . . . . . . . . . . . . . . . . . 23,270,799 22,261,563
Current liabilities . . . . . . . . . . . . . . . . . . . . . . . . . . . . . . . . . . . . . . . . . . . . . . . . . . . . . . . . 7,330,762 7,414,894Long-term liabilities and noncontrolling interests . . . . . . . . . . . . . . . . . . . . . . . . . . . . . . 5,965,242 5,509,745Affiliated companies accounted for by the equity method shareholders’ equity . . . . . . . 9,974,795 9,336,924
Total liabilities and shareholders’ equity . . . . . . . . . . . . . . . . . . . . . . . . . . . . . . . . . 23,270,799 22,261,563
Toyota’s share of affiliated companies accounted for by the equity methodshareholders’ equity . . . . . . . . . . . . . . . . . . . . . . . . . . . . . . . . . . . . . . . . . . . . . . . . . . . . 2,691,222 2,631,389
Number of affiliated companies accounted for by the equity method at end of period . . 54 54
Yen in millions
For the years ended March 31,
2014 2015 2016
Net revenues . . . . . . . . . . . . . . . . . . . . . . . . . . . . . . . . . . . . . . . . . . . . . . . 28,289,687 30,163,457 31,037,029
Gross profit . . . . . . . . . . . . . . . . . . . . . . . . . . . . . . . . . . . . . . . . . . . . . . . . 3,385,048 3,614,946 3,852,899
Net income attributable to affiliated companies accounted for by theequity method . . . . . . . . . . . . . . . . . . . . . . . . . . . . . . . . . . . . . . . . . . . . 963,003 966,133 957,742
Equity in earnings of affiliated companies attributable to Toyota MotorCorporation . . . . . . . . . . . . . . . . . . . . . . . . . . . . . . . . . . . . . . . . . . . . . . 318,376 308,545 329,099
F-29
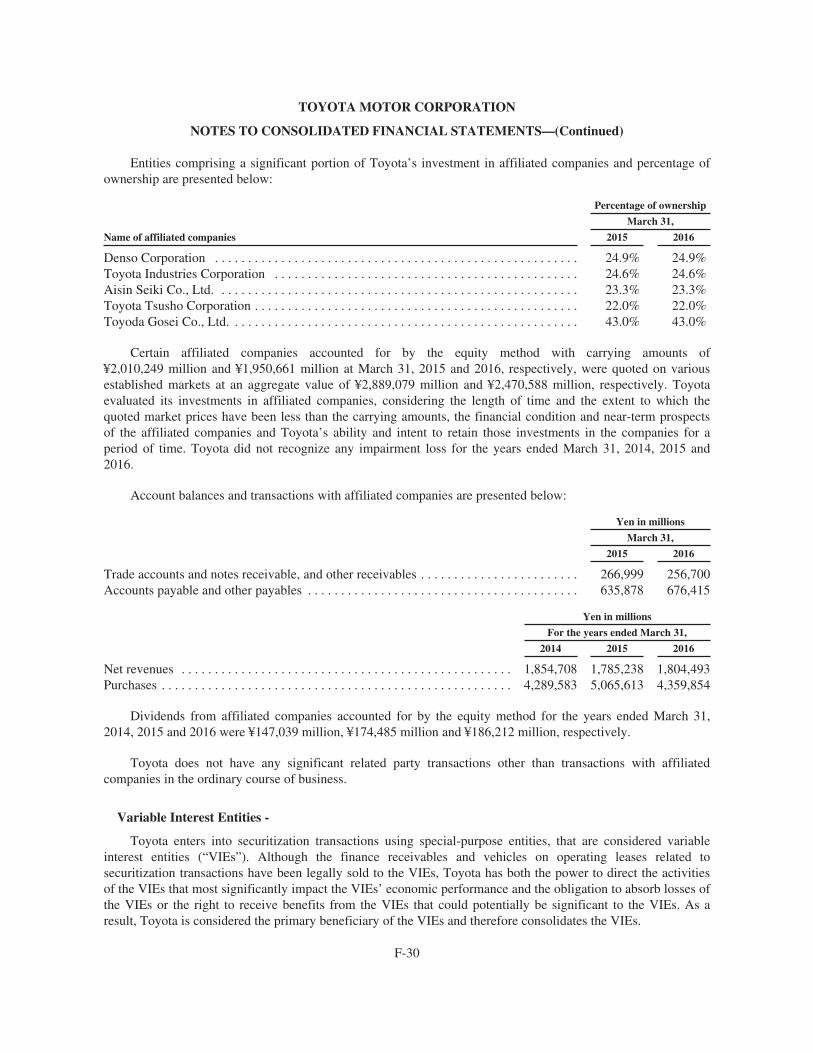
TOYOTA MOTOR CORPORATION
NOTES TO CONSOLIDATED FINANCIAL STATEMENTS—(Continued)
Entities comprising a significant portion of Toyota’s investment in affiliated companies and percentage ofownership are presented below:
Percentage of ownership
March 31,
Name of affiliated companies 2015 2016
Denso Corporation . . . . . . . . . . . . . . . . . . . . . . . . . . . . . . . . . . . . . . . . . . . . . . . . . . . . . . . 24.9% 24.9%Toyota Industries Corporation . . . . . . . . . . . . . . . . . . . . . . . . . . . . . . . . . . . . . . . . . . . . . . 24.6% 24.6%Aisin Seiki Co., Ltd. . . . . . . . . . . . . . . . . . . . . . . . . . . . . . . . . . . . . . . . . . . . . . . . . . . . . . . 23.3% 23.3%Toyota Tsusho Corporation . . . . . . . . . . . . . . . . . . . . . . . . . . . . . . . . . . . . . . . . . . . . . . . . . 22.0% 22.0%Toyoda Gosei Co., Ltd. . . . . . . . . . . . . . . . . . . . . . . . . . . . . . . . . . . . . . . . . . . . . . . . . . . . . 43.0% 43.0%
Certain affiliated companies accounted for by the equity method with carrying amounts of¥2,010,249 million and ¥1,950,661 million at March 31, 2015 and 2016, respectively, were quoted on variousestablished markets at an aggregate value of ¥2,889,079 million and ¥2,470,588 million, respectively. Toyotaevaluated its investments in affiliated companies, considering the length of time and the extent to which thequoted market prices have been less than the carrying amounts, the financial condition and near-term prospectsof the affiliated companies and Toyota’s ability and intent to retain those investments in the companies for aperiod of time. Toyota did not recognize any impairment loss for the years ended March 31, 2014, 2015 and2016.
Account balances and transactions with affiliated companies are presented below:
Yen in millions
March 31,
2015 2016
Trade accounts and notes receivable, and other receivables . . . . . . . . . . . . . . . . . . . . . . . . 266,999 256,700Accounts payable and other payables . . . . . . . . . . . . . . . . . . . . . . . . . . . . . . . . . . . . . . . . . 635,878 676,415
Yen in millions
For the years ended March 31,
2014 2015 2016
Net revenues . . . . . . . . . . . . . . . . . . . . . . . . . . . . . . . . . . . . . . . . . . . . . . . . . . 1,854,708 1,785,238 1,804,493Purchases . . . . . . . . . . . . . . . . . . . . . . . . . . . . . . . . . . . . . . . . . . . . . . . . . . . . . 4,289,583 5,065,613 4,359,854
Dividends from affiliated companies accounted for by the equity method for the years ended March 31,2014, 2015 and 2016 were ¥147,039 million, ¥174,485 million and ¥186,212 million, respectively.
Toyota does not have any significant related party transactions other than transactions with affiliatedcompanies in the ordinary course of business.
Variable Interest Entities -
Toyota enters into securitization transactions using special-purpose entities, that are considered variableinterest entities (“VIEs”). Although the finance receivables and vehicles on operating leases related tosecuritization transactions have been legally sold to the VIEs, Toyota has both the power to direct the activitiesof the VIEs that most significantly impact the VIEs’ economic performance and the obligation to absorb losses ofthe VIEs or the right to receive benefits from the VIEs that could potentially be significant to the VIEs. As aresult, Toyota is considered the primary beneficiary of the VIEs and therefore consolidates the VIEs.
F-30
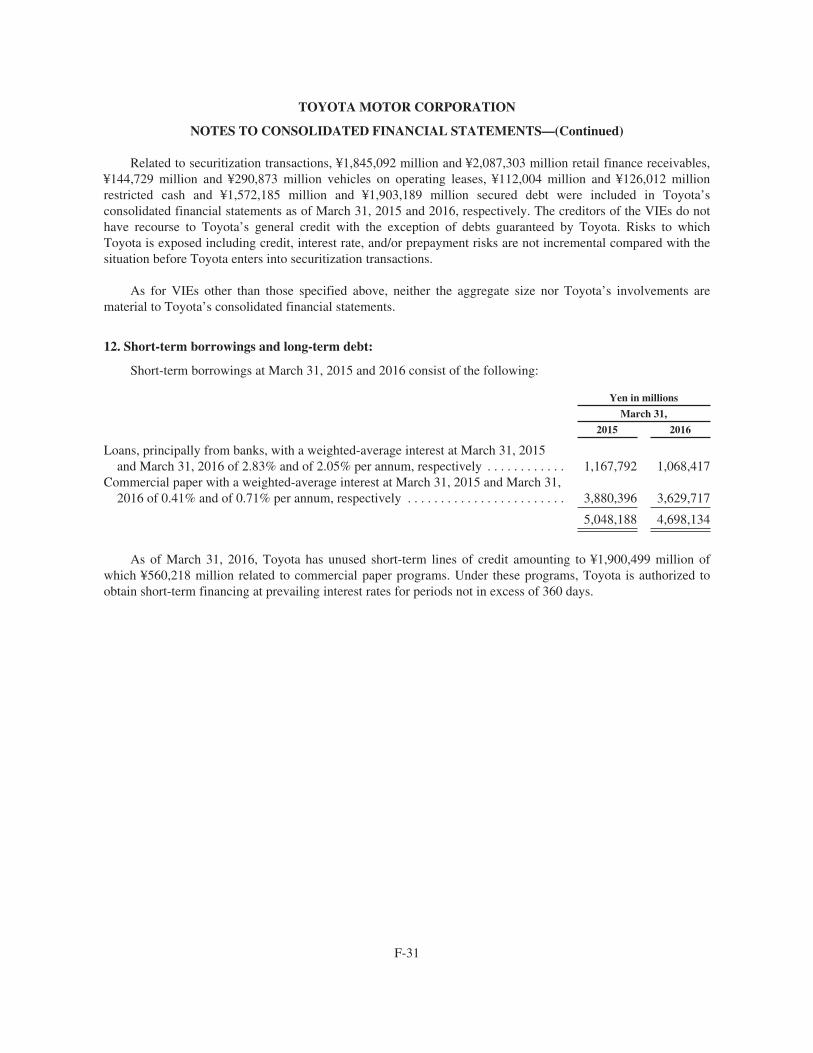
TOYOTA MOTOR CORPORATION
NOTES TO CONSOLIDATED FINANCIAL STATEMENTS—(Continued)
Related to securitization transactions, ¥1,845,092 million and ¥2,087,303 million retail finance receivables,¥144,729 million and ¥290,873 million vehicles on operating leases, ¥112,004 million and ¥126,012 millionrestricted cash and ¥1,572,185 million and ¥1,903,189 million secured debt were included in Toyota’sconsolidated financial statements as of March 31, 2015 and 2016, respectively. The creditors of the VIEs do nothave recourse to Toyota’s general credit with the exception of debts guaranteed by Toyota. Risks to whichToyota is exposed including credit, interest rate, and/or prepayment risks are not incremental compared with thesituation before Toyota enters into securitization transactions.
As for VIEs other than those specified above, neither the aggregate size nor Toyota’s involvements arematerial to Toyota’s consolidated financial statements.
12. Short-term borrowings and long-term debt:
Short-term borrowings at March 31, 2015 and 2016 consist of the following:
Yen in millions
March 31,
2015 2016
Loans, principally from banks, with a weighted-average interest at March 31, 2015and March 31, 2016 of 2.83% and of 2.05% per annum, respectively . . . . . . . . . . . . 1,167,792 1,068,417
Commercial paper with a weighted-average interest at March 31, 2015 and March 31,2016 of 0.41% and of 0.71% per annum, respectively . . . . . . . . . . . . . . . . . . . . . . . . 3,880,396 3,629,717
5,048,188 4,698,134
As of March 31, 2016, Toyota has unused short-term lines of credit amounting to ¥1,900,499 million ofwhich ¥560,218 million related to commercial paper programs. Under these programs, Toyota is authorized toobtain short-term financing at prevailing interest rates for periods not in excess of 360 days.
F-31
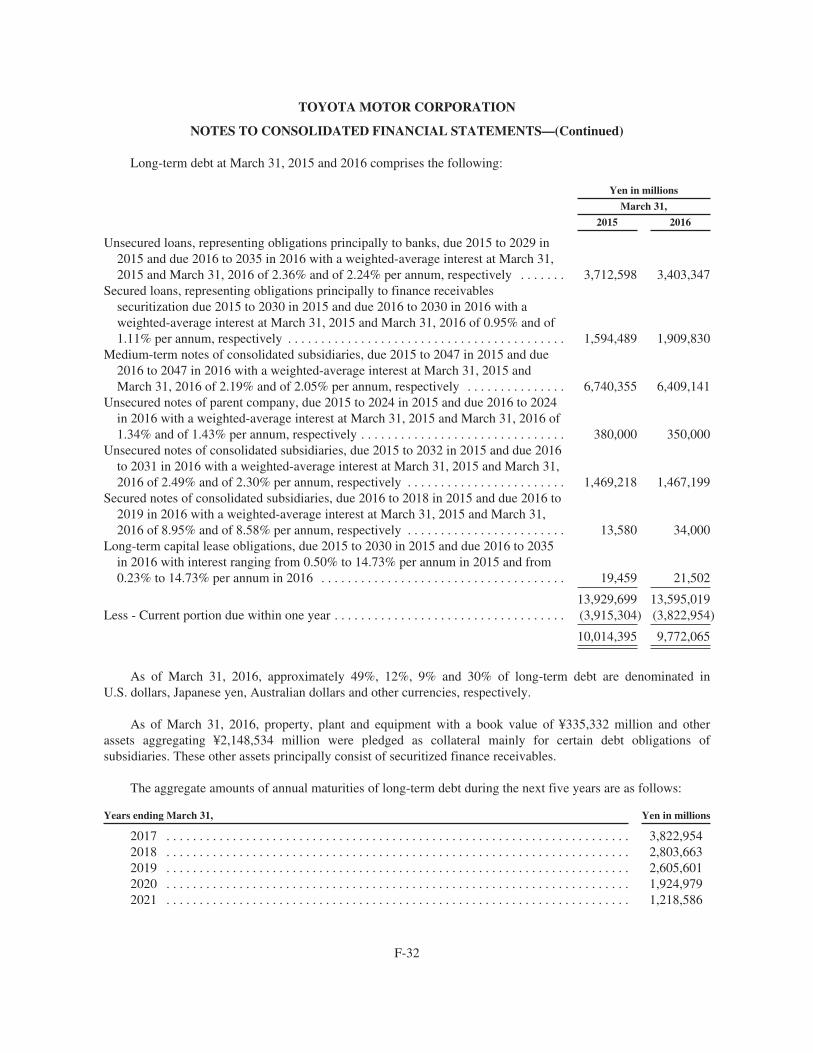
TOYOTA MOTOR CORPORATION
NOTES TO CONSOLIDATED FINANCIAL STATEMENTS—(Continued)
Long-term debt at March 31, 2015 and 2016 comprises the following:
Yen in millions
March 31,
2015 2016
Unsecured loans, representing obligations principally to banks, due 2015 to 2029 in2015 and due 2016 to 2035 in 2016 with a weighted-average interest at March 31,2015 and March 31, 2016 of 2.36% and of 2.24% per annum, respectively . . . . . . . 3,712,598 3,403,347
Secured loans, representing obligations principally to finance receivablessecuritization due 2015 to 2030 in 2015 and due 2016 to 2030 in 2016 with aweighted-average interest at March 31, 2015 and March 31, 2016 of 0.95% and of1.11% per annum, respectively . . . . . . . . . . . . . . . . . . . . . . . . . . . . . . . . . . . . . . . . . . 1,594,489 1,909,830
Medium-term notes of consolidated subsidiaries, due 2015 to 2047 in 2015 and due2016 to 2047 in 2016 with a weighted-average interest at March 31, 2015 andMarch 31, 2016 of 2.19% and of 2.05% per annum, respectively . . . . . . . . . . . . . . . 6,740,355 6,409,141
Unsecured notes of parent company, due 2015 to 2024 in 2015 and due 2016 to 2024in 2016 with a weighted-average interest at March 31, 2015 and March 31, 2016 of1.34% and of 1.43% per annum, respectively . . . . . . . . . . . . . . . . . . . . . . . . . . . . . . . 380,000 350,000
Unsecured notes of consolidated subsidiaries, due 2015 to 2032 in 2015 and due 2016to 2031 in 2016 with a weighted-average interest at March 31, 2015 and March 31,2016 of 2.49% and of 2.30% per annum, respectively . . . . . . . . . . . . . . . . . . . . . . . . 1,469,218 1,467,199
Secured notes of consolidated subsidiaries, due 2016 to 2018 in 2015 and due 2016 to2019 in 2016 with a weighted-average interest at March 31, 2015 and March 31,2016 of 8.95% and of 8.58% per annum, respectively . . . . . . . . . . . . . . . . . . . . . . . . 13,580 34,000
Long-term capital lease obligations, due 2015 to 2030 in 2015 and due 2016 to 2035in 2016 with interest ranging from 0.50% to 14.73% per annum in 2015 and from0.23% to 14.73% per annum in 2016 . . . . . . . . . . . . . . . . . . . . . . . . . . . . . . . . . . . . . 19,459 21,502
13,929,699 13,595,019Less - Current portion due within one year . . . . . . . . . . . . . . . . . . . . . . . . . . . . . . . . . . . (3,915,304) (3,822,954)
10,014,395 9,772,065
As of March 31, 2016, approximately 49%, 12%, 9% and 30% of long-term debt are denominated inU.S. dollars, Japanese yen, Australian dollars and other currencies, respectively.
As of March 31, 2016, property, plant and equipment with a book value of ¥335,332 million and otherassets aggregating ¥2,148,534 million were pledged as collateral mainly for certain debt obligations ofsubsidiaries. These other assets principally consist of securitized finance receivables.
The aggregate amounts of annual maturities of long-term debt during the next five years are as follows:
Years ending March 31, Yen in millions
2017 . . . . . . . . . . . . . . . . . . . . . . . . . . . . . . . . . . . . . . . . . . . . . . . . . . . . . . . . . . . . . . . . . . . . . . 3,822,9542018 . . . . . . . . . . . . . . . . . . . . . . . . . . . . . . . . . . . . . . . . . . . . . . . . . . . . . . . . . . . . . . . . . . . . . . 2,803,6632019 . . . . . . . . . . . . . . . . . . . . . . . . . . . . . . . . . . . . . . . . . . . . . . . . . . . . . . . . . . . . . . . . . . . . . . 2,605,6012020 . . . . . . . . . . . . . . . . . . . . . . . . . . . . . . . . . . . . . . . . . . . . . . . . . . . . . . . . . . . . . . . . . . . . . . 1,924,9792021 . . . . . . . . . . . . . . . . . . . . . . . . . . . . . . . . . . . . . . . . . . . . . . . . . . . . . . . . . . . . . . . . . . . . . . 1,218,586
F-32

TOYOTA MOTOR CORPORATION
NOTES TO CONSOLIDATED FINANCIAL STATEMENTS—(Continued)
Standard agreements with certain banks include provisions that collateral (including sums on deposit withsuch banks) or guarantees will be furnished upon the banks’ request and that any collateral furnished, pursuant tosuch agreements or otherwise, will be applicable to all present or future indebtedness to such banks. During theyear ended March 31, 2016, Toyota has not received any significant requests from these banks.
As of March 31, 2016, Toyota has unused long-term lines of credit amounting to ¥7,223,398 million.
Interest expense during the years ended March 31, 2014, 2015 and 2016 were ¥316,054 million, ¥347,030million and ¥377,310 million, respectively. Interest expense related to the financial services business is includedin “Cost of financing operations” in the accompanying consolidated statements of income.
13. Product warranties and recalls and other safety measures:
Toyota provides product warranties for certain defects mainly resulting from manufacturing based onwarranty contracts with its customers at the time of sale of products. Toyota accrues estimated warranty costs tobe incurred in the future in accordance with the warranty contracts. In addition to product warranties, Toyotainitiates recalls and other safety measures to repair or to replace parts which might be expected to fail fromproducts safety perspectives or customer satisfaction standpoints. Toyota accrues for costs of recalls and othersafety measures at the time of vehicle sale based on the amount estimated from historical experience.
Liabilities for product warranties and liabilities for recalls and other safety measures have been combinedinto a single table showing an aggregate liability for quality assurances due to the fact that both are liabilities forcosts to repair or replace defects of vehicles and the amounts incurred for recalls and other safety measures mayaffect the amounts incurred for product warranties and vice versa.
Liabilities for quality assurances are included in “Accrued expenses” in the consolidated balance sheets.
The net changes in liabilities for quality assurances above for the years ended March 31, 2014, 2015 and2016 consist of the following:
Yen in millions
For the years ended March 31,
2014 2015 2016
Liabilities for quality assurances at beginning of year . . . . . . . . . . . . . . . . . . 1,003,023 1,154,021 1,328,916Payments made during year . . . . . . . . . . . . . . . . . . . . . . . . . . . . . . . . . . . . . . (383,572) (509,488) (501,073)Provision for quality assurances . . . . . . . . . . . . . . . . . . . . . . . . . . . . . . . . . . . 524,442 686,006 636,719Changes relating to pre-existing quality assurances . . . . . . . . . . . . . . . . . . . . (7,248) (25,619) (39,225)Other . . . . . . . . . . . . . . . . . . . . . . . . . . . . . . . . . . . . . . . . . . . . . . . . . . . . . . . . 17,376 23,996 (21,573)
Liabilities for quality assurances at end of year . . . . . . . . . . . . . . . . . . . . . . . 1,154,021 1,328,916 1,403,764
“Other” primarily includes the impact of currency translation adjustments and the impact of consolidationand deconsolidation of certain entities due to changes in ownership interest.
F-33
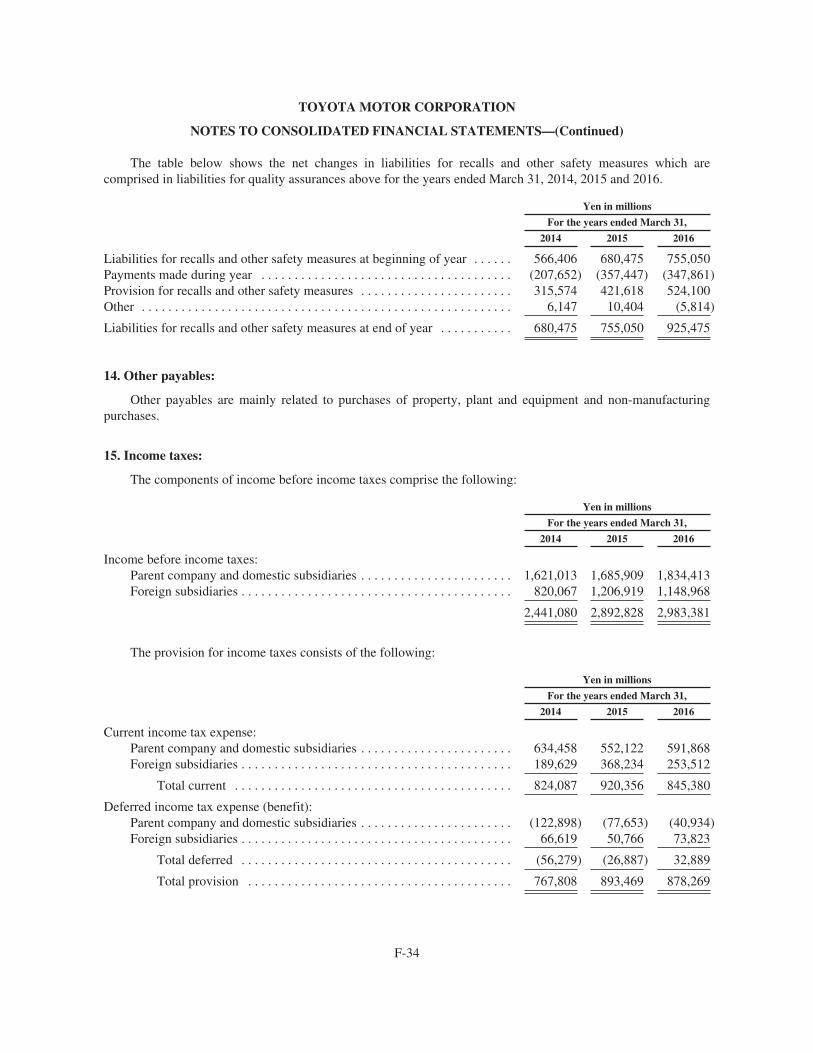
TOYOTA MOTOR CORPORATION
NOTES TO CONSOLIDATED FINANCIAL STATEMENTS—(Continued)
The table below shows the net changes in liabilities for recalls and other safety measures which arecomprised in liabilities for quality assurances above for the years ended March 31, 2014, 2015 and 2016.
Yen in millions
For the years ended March 31,
2014 2015 2016
Liabilities for recalls and other safety measures at beginning of year . . . . . . 566,406 680,475 755,050Payments made during year . . . . . . . . . . . . . . . . . . . . . . . . . . . . . . . . . . . . . . (207,652) (357,447) (347,861)Provision for recalls and other safety measures . . . . . . . . . . . . . . . . . . . . . . . 315,574 421,618 524,100Other . . . . . . . . . . . . . . . . . . . . . . . . . . . . . . . . . . . . . . . . . . . . . . . . . . . . . . . . 6,147 10,404 (5,814)
Liabilities for recalls and other safety measures at end of year . . . . . . . . . . . 680,475 755,050 925,475
14. Other payables:
Other payables are mainly related to purchases of property, plant and equipment and non-manufacturingpurchases.
15. Income taxes:
The components of income before income taxes comprise the following:
Yen in millions
For the years ended March 31,
2014 2015 2016
Income before income taxes:Parent company and domestic subsidiaries . . . . . . . . . . . . . . . . . . . . . . . 1,621,013 1,685,909 1,834,413Foreign subsidiaries . . . . . . . . . . . . . . . . . . . . . . . . . . . . . . . . . . . . . . . . . 820,067 1,206,919 1,148,968
2,441,080 2,892,828 2,983,381
The provision for income taxes consists of the following:
Yen in millions
For the years ended March 31,
2014 2015 2016
Current income tax expense:Parent company and domestic subsidiaries . . . . . . . . . . . . . . . . . . . . . . . 634,458 552,122 591,868Foreign subsidiaries . . . . . . . . . . . . . . . . . . . . . . . . . . . . . . . . . . . . . . . . . 189,629 368,234 253,512
Total current . . . . . . . . . . . . . . . . . . . . . . . . . . . . . . . . . . . . . . . . . . 824,087 920,356 845,380
Deferred income tax expense (benefit):Parent company and domestic subsidiaries . . . . . . . . . . . . . . . . . . . . . . . (122,898) (77,653) (40,934)Foreign subsidiaries . . . . . . . . . . . . . . . . . . . . . . . . . . . . . . . . . . . . . . . . . 66,619 50,766 73,823
Total deferred . . . . . . . . . . . . . . . . . . . . . . . . . . . . . . . . . . . . . . . . . (56,279) (26,887) 32,889
Total provision . . . . . . . . . . . . . . . . . . . . . . . . . . . . . . . . . . . . . . . . 767,808 893,469 878,269
F-34
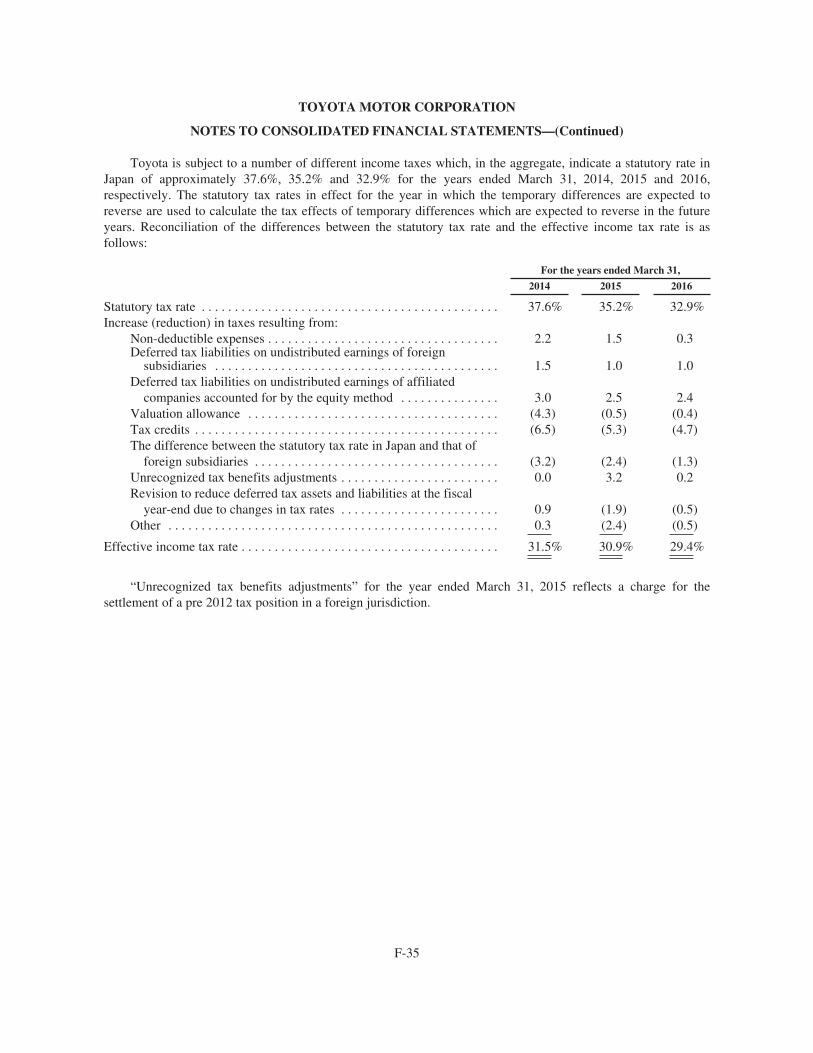
TOYOTA MOTOR CORPORATION
NOTES TO CONSOLIDATED FINANCIAL STATEMENTS—(Continued)
Toyota is subject to a number of different income taxes which, in the aggregate, indicate a statutory rate inJapan of approximately 37.6%, 35.2% and 32.9% for the years ended March 31, 2014, 2015 and 2016,respectively. The statutory tax rates in effect for the year in which the temporary differences are expected toreverse are used to calculate the tax effects of temporary differences which are expected to reverse in the futureyears. Reconciliation of the differences between the statutory tax rate and the effective income tax rate is asfollows:
For the years ended March 31,
2014 2015 2016
Statutory tax rate . . . . . . . . . . . . . . . . . . . . . . . . . . . . . . . . . . . . . . . . . . . . . 37.6% 35.2% 32.9%Increase (reduction) in taxes resulting from:
Non-deductible expenses . . . . . . . . . . . . . . . . . . . . . . . . . . . . . . . . . . . 2.2 1.5 0.3Deferred tax liabilities on undistributed earnings of foreign
subsidiaries . . . . . . . . . . . . . . . . . . . . . . . . . . . . . . . . . . . . . . . . . . . 1.5 1.0 1.0Deferred tax liabilities on undistributed earnings of affiliated
companies accounted for by the equity method . . . . . . . . . . . . . . . 3.0 2.5 2.4Valuation allowance . . . . . . . . . . . . . . . . . . . . . . . . . . . . . . . . . . . . . . (4.3) (0.5) (0.4)Tax credits . . . . . . . . . . . . . . . . . . . . . . . . . . . . . . . . . . . . . . . . . . . . . . (6.5) (5.3) (4.7)The difference between the statutory tax rate in Japan and that of
foreign subsidiaries . . . . . . . . . . . . . . . . . . . . . . . . . . . . . . . . . . . . . (3.2) (2.4) (1.3)Unrecognized tax benefits adjustments . . . . . . . . . . . . . . . . . . . . . . . . 0.0 3.2 0.2Revision to reduce deferred tax assets and liabilities at the fiscal
year-end due to changes in tax rates . . . . . . . . . . . . . . . . . . . . . . . . 0.9 (1.9) (0.5)Other . . . . . . . . . . . . . . . . . . . . . . . . . . . . . . . . . . . . . . . . . . . . . . . . . . 0.3 (2.4) (0.5)
Effective income tax rate . . . . . . . . . . . . . . . . . . . . . . . . . . . . . . . . . . . . . . . 31.5% 30.9% 29.4%
“Unrecognized tax benefits adjustments” for the year ended March 31, 2015 reflects a charge for thesettlement of a pre 2012 tax position in a foreign jurisdiction.
F-35
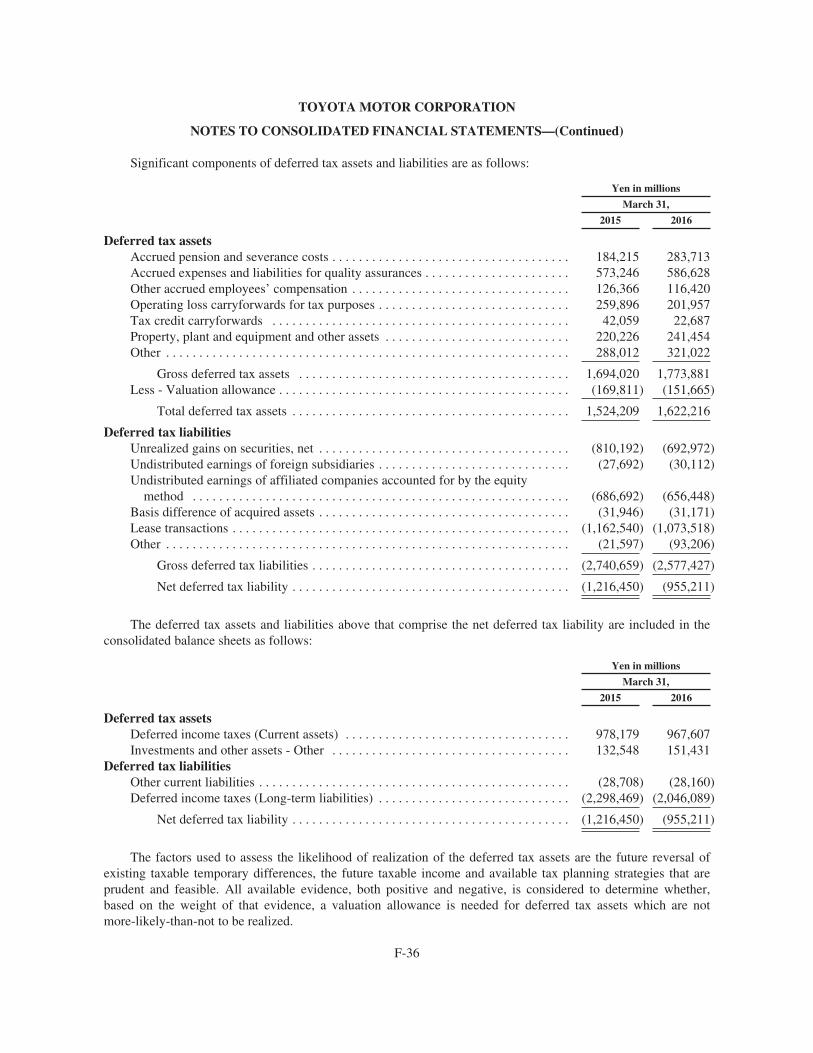
TOYOTA MOTOR CORPORATION
NOTES TO CONSOLIDATED FINANCIAL STATEMENTS—(Continued)
Significant components of deferred tax assets and liabilities are as follows:
Yen in millions
March 31,
2015 2016
Deferred tax assetsAccrued pension and severance costs . . . . . . . . . . . . . . . . . . . . . . . . . . . . . . . . . . . . 184,215 283,713Accrued expenses and liabilities for quality assurances . . . . . . . . . . . . . . . . . . . . . . 573,246 586,628Other accrued employees’ compensation . . . . . . . . . . . . . . . . . . . . . . . . . . . . . . . . . 126,366 116,420Operating loss carryforwards for tax purposes . . . . . . . . . . . . . . . . . . . . . . . . . . . . . 259,896 201,957Tax credit carryforwards . . . . . . . . . . . . . . . . . . . . . . . . . . . . . . . . . . . . . . . . . . . . . 42,059 22,687Property, plant and equipment and other assets . . . . . . . . . . . . . . . . . . . . . . . . . . . . 220,226 241,454Other . . . . . . . . . . . . . . . . . . . . . . . . . . . . . . . . . . . . . . . . . . . . . . . . . . . . . . . . . . . . . 288,012 321,022
Gross deferred tax assets . . . . . . . . . . . . . . . . . . . . . . . . . . . . . . . . . . . . . . . . . 1,694,020 1,773,881Less - Valuation allowance . . . . . . . . . . . . . . . . . . . . . . . . . . . . . . . . . . . . . . . . . . . . (169,811) (151,665)
Total deferred tax assets . . . . . . . . . . . . . . . . . . . . . . . . . . . . . . . . . . . . . . . . . . 1,524,209 1,622,216
Deferred tax liabilitiesUnrealized gains on securities, net . . . . . . . . . . . . . . . . . . . . . . . . . . . . . . . . . . . . . . (810,192) (692,972)Undistributed earnings of foreign subsidiaries . . . . . . . . . . . . . . . . . . . . . . . . . . . . . (27,692) (30,112)Undistributed earnings of affiliated companies accounted for by the equity
method . . . . . . . . . . . . . . . . . . . . . . . . . . . . . . . . . . . . . . . . . . . . . . . . . . . . . . . . . (686,692) (656,448)Basis difference of acquired assets . . . . . . . . . . . . . . . . . . . . . . . . . . . . . . . . . . . . . . (31,946) (31,171)Lease transactions . . . . . . . . . . . . . . . . . . . . . . . . . . . . . . . . . . . . . . . . . . . . . . . . . . . (1,162,540) (1,073,518)Other . . . . . . . . . . . . . . . . . . . . . . . . . . . . . . . . . . . . . . . . . . . . . . . . . . . . . . . . . . . . . (21,597) (93,206)
Gross deferred tax liabilities . . . . . . . . . . . . . . . . . . . . . . . . . . . . . . . . . . . . . . . (2,740,659) (2,577,427)
Net deferred tax liability . . . . . . . . . . . . . . . . . . . . . . . . . . . . . . . . . . . . . . . . . . (1,216,450) (955,211)
The deferred tax assets and liabilities above that comprise the net deferred tax liability are included in theconsolidated balance sheets as follows:
Yen in millions
March 31,
2015 2016
Deferred tax assetsDeferred income taxes (Current assets) . . . . . . . . . . . . . . . . . . . . . . . . . . . . . . . . . . 978,179 967,607Investments and other assets - Other . . . . . . . . . . . . . . . . . . . . . . . . . . . . . . . . . . . . 132,548 151,431
Deferred tax liabilitiesOther current liabilities . . . . . . . . . . . . . . . . . . . . . . . . . . . . . . . . . . . . . . . . . . . . . . . (28,708) (28,160)Deferred income taxes (Long-term liabilities) . . . . . . . . . . . . . . . . . . . . . . . . . . . . . (2,298,469) (2,046,089)
Net deferred tax liability . . . . . . . . . . . . . . . . . . . . . . . . . . . . . . . . . . . . . . . . . . (1,216,450) (955,211)
The factors used to assess the likelihood of realization of the deferred tax assets are the future reversal ofexisting taxable temporary differences, the future taxable income and available tax planning strategies that areprudent and feasible. All available evidence, both positive and negative, is considered to determine whether,based on the weight of that evidence, a valuation allowance is needed for deferred tax assets which are notmore-likely-than-not to be realized.
F-36
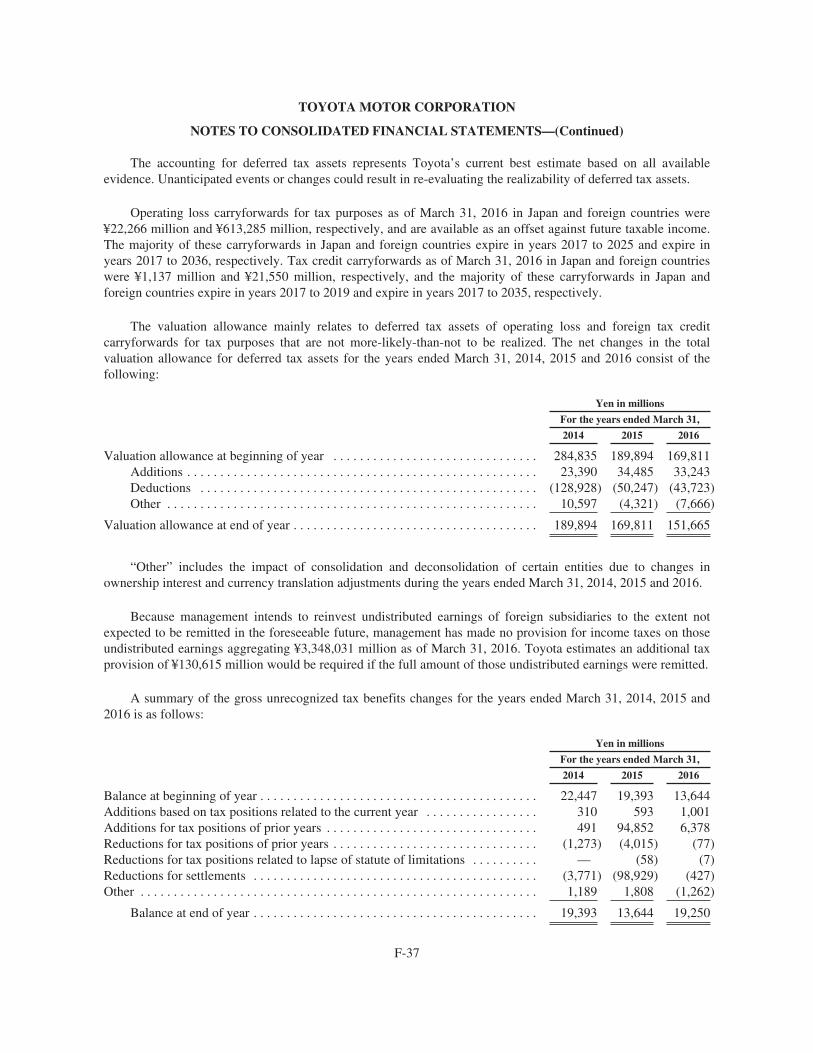
TOYOTA MOTOR CORPORATION
NOTES TO CONSOLIDATED FINANCIAL STATEMENTS—(Continued)
The accounting for deferred tax assets represents Toyota’s current best estimate based on all availableevidence. Unanticipated events or changes could result in re-evaluating the realizability of deferred tax assets.
Operating loss carryforwards for tax purposes as of March 31, 2016 in Japan and foreign countries were¥22,266 million and ¥613,285 million, respectively, and are available as an offset against future taxable income.The majority of these carryforwards in Japan and foreign countries expire in years 2017 to 2025 and expire inyears 2017 to 2036, respectively. Tax credit carryforwards as of March 31, 2016 in Japan and foreign countrieswere ¥1,137 million and ¥21,550 million, respectively, and the majority of these carryforwards in Japan andforeign countries expire in years 2017 to 2019 and expire in years 2017 to 2035, respectively.
The valuation allowance mainly relates to deferred tax assets of operating loss and foreign tax creditcarryforwards for tax purposes that are not more-likely-than-not to be realized. The net changes in the totalvaluation allowance for deferred tax assets for the years ended March 31, 2014, 2015 and 2016 consist of thefollowing:
Yen in millions
For the years ended March 31,
2014 2015 2016
Valuation allowance at beginning of year . . . . . . . . . . . . . . . . . . . . . . . . . . . . . . . 284,835 189,894 169,811Additions . . . . . . . . . . . . . . . . . . . . . . . . . . . . . . . . . . . . . . . . . . . . . . . . . . . . . 23,390 34,485 33,243Deductions . . . . . . . . . . . . . . . . . . . . . . . . . . . . . . . . . . . . . . . . . . . . . . . . . . . (128,928) (50,247) (43,723)Other . . . . . . . . . . . . . . . . . . . . . . . . . . . . . . . . . . . . . . . . . . . . . . . . . . . . . . . . 10,597 (4,321) (7,666)
Valuation allowance at end of year . . . . . . . . . . . . . . . . . . . . . . . . . . . . . . . . . . . . . 189,894 169,811 151,665
“Other” includes the impact of consolidation and deconsolidation of certain entities due to changes inownership interest and currency translation adjustments during the years ended March 31, 2014, 2015 and 2016.
Because management intends to reinvest undistributed earnings of foreign subsidiaries to the extent notexpected to be remitted in the foreseeable future, management has made no provision for income taxes on thoseundistributed earnings aggregating ¥3,348,031 million as of March 31, 2016. Toyota estimates an additional taxprovision of ¥130,615 million would be required if the full amount of those undistributed earnings were remitted.
A summary of the gross unrecognized tax benefits changes for the years ended March 31, 2014, 2015 and2016 is as follows:
Yen in millions
For the years ended March 31,
2014 2015 2016
Balance at beginning of year . . . . . . . . . . . . . . . . . . . . . . . . . . . . . . . . . . . . . . . . . . 22,447 19,393 13,644Additions based on tax positions related to the current year . . . . . . . . . . . . . . . . . 310 593 1,001Additions for tax positions of prior years . . . . . . . . . . . . . . . . . . . . . . . . . . . . . . . . 491 94,852 6,378Reductions for tax positions of prior years . . . . . . . . . . . . . . . . . . . . . . . . . . . . . . . (1,273) (4,015) (77)Reductions for tax positions related to lapse of statute of limitations . . . . . . . . . . — (58) (7)Reductions for settlements . . . . . . . . . . . . . . . . . . . . . . . . . . . . . . . . . . . . . . . . . . . (3,771) (98,929) (427)Other . . . . . . . . . . . . . . . . . . . . . . . . . . . . . . . . . . . . . . . . . . . . . . . . . . . . . . . . . . . . 1,189 1,808 (1,262)
Balance at end of year . . . . . . . . . . . . . . . . . . . . . . . . . . . . . . . . . . . . . . . . . . . 19,393 13,644 19,250
F-37
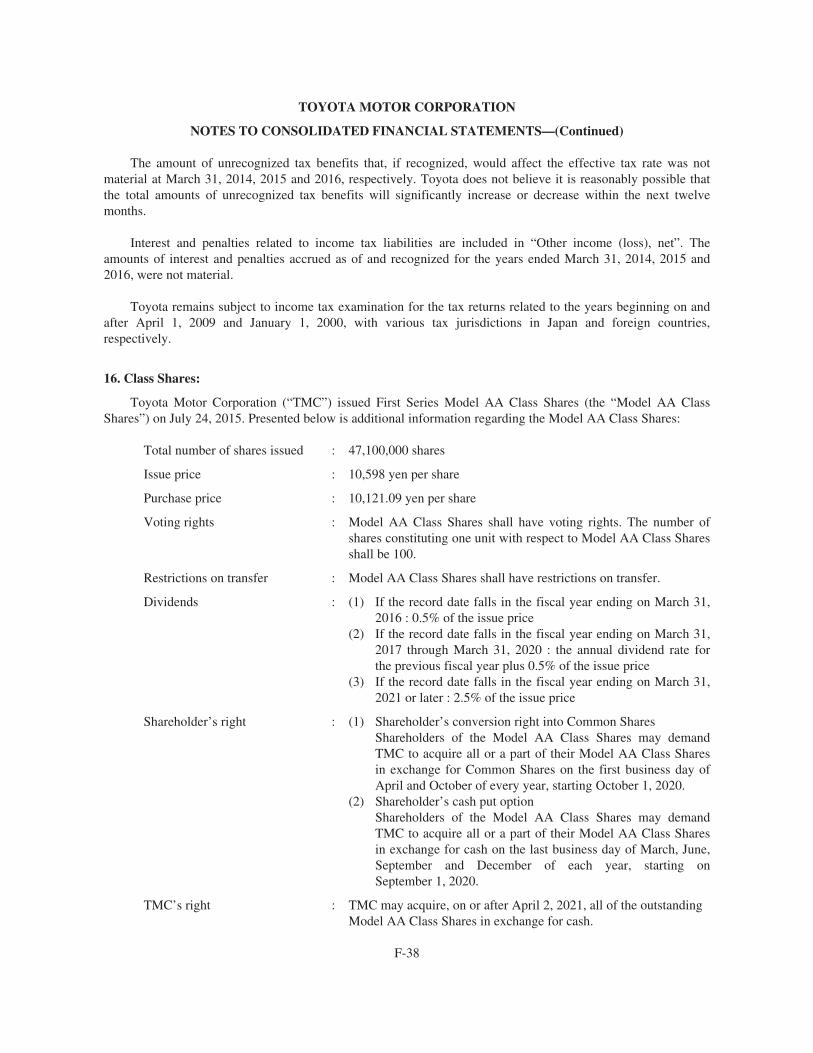
TOYOTA MOTOR CORPORATION
NOTES TO CONSOLIDATED FINANCIAL STATEMENTS—(Continued)
The amount of unrecognized tax benefits that, if recognized, would affect the effective tax rate was notmaterial at March 31, 2014, 2015 and 2016, respectively. Toyota does not believe it is reasonably possible thatthe total amounts of unrecognized tax benefits will significantly increase or decrease within the next twelvemonths.
Interest and penalties related to income tax liabilities are included in “Other income (loss), net”. Theamounts of interest and penalties accrued as of and recognized for the years ended March 31, 2014, 2015 and2016, were not material.
Toyota remains subject to income tax examination for the tax returns related to the years beginning on andafter April 1, 2009 and January 1, 2000, with various tax jurisdictions in Japan and foreign countries,respectively.
16. Class Shares:
Toyota Motor Corporation (“TMC”) issued First Series Model AA Class Shares (the “Model AA ClassShares”) on July 24, 2015. Presented below is additional information regarding the Model AA Class Shares:
Total number of shares issued : 47,100,000 shares
Issue price : 10,598 yen per share
Purchase price : 10,121.09 yen per share
Voting rights : Model AA Class Shares shall have voting rights. The number ofshares constituting one unit with respect to Model AA Class Sharesshall be 100.
Restrictions on transfer : Model AA Class Shares shall have restrictions on transfer.
Dividends : (1) If the record date falls in the fiscal year ending on March 31,2016 : 0.5% of the issue price
(2) If the record date falls in the fiscal year ending on March 31,2017 through March 31, 2020 : the annual dividend rate forthe previous fiscal year plus 0.5% of the issue price
(3) If the record date falls in the fiscal year ending on March 31,2021 or later : 2.5% of the issue price
Shareholder’s right : (1) Shareholder’s conversion right into Common SharesShareholders of the Model AA Class Shares may demandTMC to acquire all or a part of their Model AA Class Sharesin exchange for Common Shares on the first business day ofApril and October of every year, starting October 1, 2020.
(2) Shareholder’s cash put optionShareholders of the Model AA Class Shares may demandTMC to acquire all or a part of their Model AA Class Sharesin exchange for cash on the last business day of March, June,September and December of each year, starting onSeptember 1, 2020.
TMC’s right : TMC may acquire, on or after April 2, 2021, all of the outstandingModel AA Class Shares in exchange for cash.
F-38
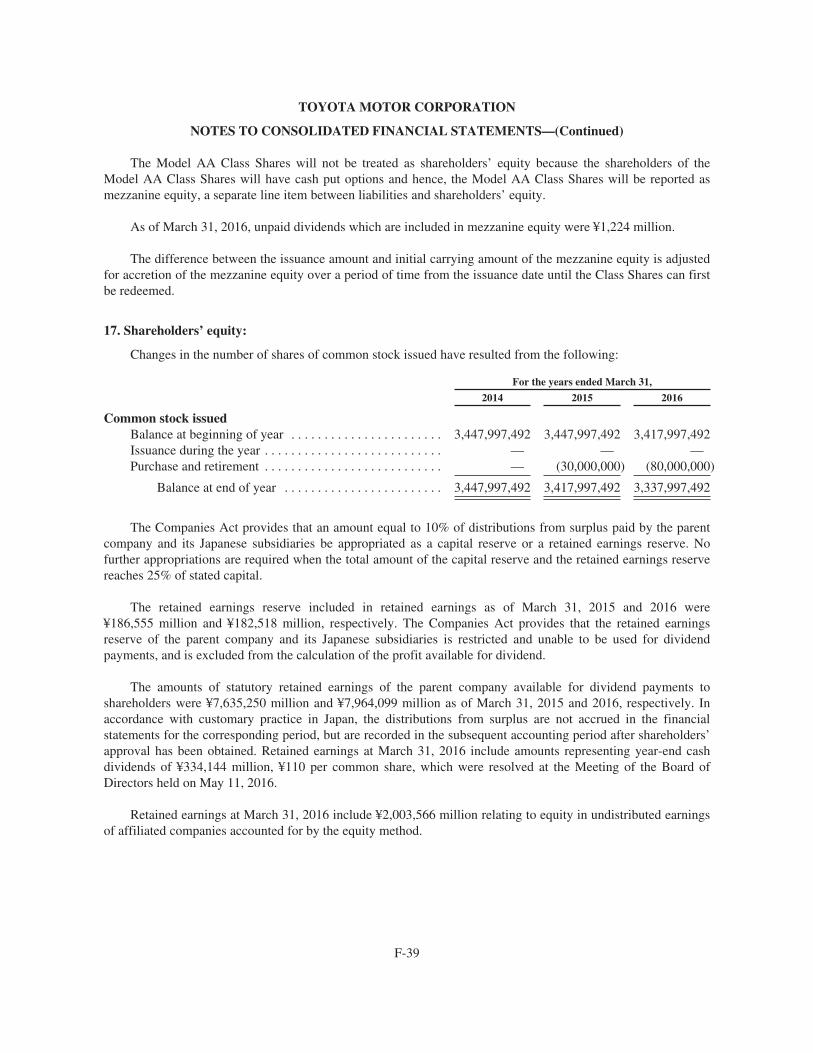
TOYOTA MOTOR CORPORATION
NOTES TO CONSOLIDATED FINANCIAL STATEMENTS—(Continued)
The Model AA Class Shares will not be treated as shareholders’ equity because the shareholders of theModel AA Class Shares will have cash put options and hence, the Model AA Class Shares will be reported asmezzanine equity, a separate line item between liabilities and shareholders’ equity.
As of March 31, 2016, unpaid dividends which are included in mezzanine equity were ¥1,224 million.
The difference between the issuance amount and initial carrying amount of the mezzanine equity is adjustedfor accretion of the mezzanine equity over a period of time from the issuance date until the Class Shares can firstbe redeemed.
17. Shareholders’ equity:
Changes in the number of shares of common stock issued have resulted from the following:
For the years ended March 31,
2014 2015 2016
Common stock issuedBalance at beginning of year . . . . . . . . . . . . . . . . . . . . . . . 3,447,997,492 3,447,997,492 3,417,997,492Issuance during the year . . . . . . . . . . . . . . . . . . . . . . . . . . . — — —Purchase and retirement . . . . . . . . . . . . . . . . . . . . . . . . . . . — (30,000,000) (80,000,000)
Balance at end of year . . . . . . . . . . . . . . . . . . . . . . . . 3,447,997,492 3,417,997,492 3,337,997,492
The Companies Act provides that an amount equal to 10% of distributions from surplus paid by the parentcompany and its Japanese subsidiaries be appropriated as a capital reserve or a retained earnings reserve. Nofurther appropriations are required when the total amount of the capital reserve and the retained earnings reservereaches 25% of stated capital.
The retained earnings reserve included in retained earnings as of March 31, 2015 and 2016 were¥186,555 million and ¥182,518 million, respectively. The Companies Act provides that the retained earningsreserve of the parent company and its Japanese subsidiaries is restricted and unable to be used for dividendpayments, and is excluded from the calculation of the profit available for dividend.
The amounts of statutory retained earnings of the parent company available for dividend payments toshareholders were ¥7,635,250 million and ¥7,964,099 million as of March 31, 2015 and 2016, respectively. Inaccordance with customary practice in Japan, the distributions from surplus are not accrued in the financialstatements for the corresponding period, but are recorded in the subsequent accounting period after shareholders’approval has been obtained. Retained earnings at March 31, 2016 include amounts representing year-end cashdividends of ¥334,144 million, ¥110 per common share, which were resolved at the Meeting of the Board ofDirectors held on May 11, 2016.
Retained earnings at March 31, 2016 include ¥2,003,566 million relating to equity in undistributed earningsof affiliated companies accounted for by the equity method.
F-39
TOYOTA MOTOR CORPORATION
NOTES TO CONSOLIDATED FINANCIAL STATEMENTS—(Continued)
The reissuance, repurchase and retirement of treasury stock for the years ended March 31, 2015 and 2016are as follows:
For the year ended March 31, 2015
Reissuance of treasury stock
Reason for reissuing treasury stock -
TMC resolved at the Meeting of the Board of Directors held on March 26, 2014 to establish ToyotaMobility Foundation, a General Incorporated Foundation (the “Foundation”). The reissuance of treasury stockwas made by way of third-party allotment to a trust that was established by TMC to provide funding for theactivities of the Foundation through dividends, etc. on TMC’s common stock.
Details of matters relating to reissuance -
Number of common shares reissued . . . . . . . . . . . . . . . . . . . . . . . . . . . . 30,000,000 sharesPrice of reissuance . . . . . . . . . . . . . . . . . . . . . . . . . . . . . . . . . . . . . . . . . . ¥1 per shareAmount of proceeds . . . . . . . . . . . . . . . . . . . . . . . . . . . . . . . . . . . . . . . . . ¥30 million
Repurchase of treasury stock
Reason for repurchasing treasury stock -
The repurchase was made to avoid the dilution of common share value triggered by the reissuance oftreasury stock described above, and to promote capital efficiency and agile capital policy in view of the businessenvironment.
Details of matters relating to repurchase -
Number of common shares repurchased . . . . . . . . . . . . . . . . . . . . . . . . . 55,521,900 sharesTotal purchase price for repurchase of shares . . . . . . . . . . . . . . . . . . . . . ¥359,994 million
Retirement of treasury stock
Reason for retiring treasury stock -
The retirement was made to relieve concerns regarding the dilution of common share value due toreissuance of treasury stock in the future.
Details of matters relating to retirement -
Number of common shares retired . . . . . . . . . . . . . . . . . . . . . . . . . . . . . . 30,000,000 shares
The amount on retirement of treasury stock and the amount of the difference between fair value and bookvalue of treasury stock on reissuance for the Foundation were treated as a reduction in additional paid-in capitaland retained earnings and the amount of the difference between amount of proceeds and fair value of treasurystock on reissuance was included in Other income (expense). The fair value of treasury stock was measured usinga dividend discount model due to the restrictions on transfer in the reissued stock for the Foundation. As a result,treasury stock, additional paid-in capital, retained earnings and Other income (expense) decreased by¥246,807 million, ¥4,624 million, ¥142,753 million and ¥99,400 million, respectively.
F-40
TOYOTA MOTOR CORPORATION
NOTES TO CONSOLIDATED FINANCIAL STATEMENTS—(Continued)
For the year ended March 31, 2016
Repurchase of treasury stock
Reason for repurchasing treasury stock -
The repurchase was made to avoid the dilution of common share value as a result of the issuance of the FirstSeries Model AA Class Shares.
Details of matters relating to repurchase -
Number of common shares repurchased . . . . . . . . . . . . . . . . . . . . . . . . . 47,100,000 sharesTotal purchase price for repurchase of shares . . . . . . . . . . . . . . . . . . . . . ¥349,935 million
Reason for repurchasing treasury stock -
The repurchase was made to return capital to shareholders in addition to promoting capital efficiency andagile capital policy in view of the business environment.
Details of matters relating to repurchase -
Number of common shares repurchased . . . . . . . . . . . . . . . . . . . . . . . . . 62,942,900 sharesTotal purchase price for repurchase of shares . . . . . . . . . . . . . . . . . . . . . ¥432,692 million
Retirement of treasury stock
Reason for retiring treasury stock -
The retirement was made to relieve concerns regarding the dilution of common share value due toreissuance of treasury stock in the future.
Details of matters relating to retirement -
Number of common shares retired . . . . . . . . . . . . . . . . . . . . . . . . . . . . . . 80,000,000 shares
The amount on retirement of treasury stock was treated as a reduction in additional paid-in capital andretained earnings. As a result, treasury stock, additional paid-in capital and retained earnings decreased by¥400,537 million, ¥1,048 million and ¥399,489 million, respectively.
F-41
TOYOTA MOTOR CORPORATION
NOTES TO CONSOLIDATED FINANCIAL STATEMENTS—(Continued)
18. Accumulated other comprehensive income:
Changes in accumulated other comprehensive income (loss) are as follows:
Yen in millions
Foreigncurrency
translationadjustments
Unrealizedgains (losses)on securities
Pensionliability
adjustments
Accumulatedother
comprehensiveincome (loss)
Balance at March 31, 2013 . . . . . . . . . . . . . . . . . . . . . . . (813,480) 666,813 (209,456) (356,123)Other comprehensive income (loss) before
reclassifications, net of taxes of ¥(25,139)million, ¥(255,959) million, ¥(44,987) millionand ¥(326,085) million . . . . . . . . . . . . . . . . . . . . . 301,889 507,566 91,507 900,962
Reclassifications, net of taxes of ¥— million,¥5,209 million, ¥(4,682) million and¥527 million . . . . . . . . . . . . . . . . . . . . . . . . . . . . . — (8,006) 7,897 (109)
Other comprehensive income (loss), net of tax . . . . . . . . 301,889 499,560 99,404 900,853Less - Other comprehensive income attributable to
noncontrolling interests . . . . . . . . . . . . . . . . . . . . . . . . (4,947) (5,810) (5,812) (16,569)
Balance at March 31, 2014 . . . . . . . . . . . . . . . . . . . . . . . (516,538) 1,160,563 (115,864) 528,161Other comprehensive income (loss) before
reclassifications, net of taxes of ¥(8,742) million,¥(309,767) million, ¥2,853 million and¥(315,656) million . . . . . . . . . . . . . . . . . . . . . . . . 404,352 596,417 621 1,001,390
Reclassifications, net of taxes of ¥— million,¥11,013 million, ¥(2,153) million and¥8,860 million . . . . . . . . . . . . . . . . . . . . . . . . . . . . — (18,714) 3,695 (15,019)
Other comprehensive income (loss), net of tax . . . . . . . . 404,352 577,703 4,316 986,371Less - Other comprehensive income attributable to
noncontrolling interests . . . . . . . . . . . . . . . . . . . . . . . . (23,904) (10,701) (2,382) (36,987)
Balance at March 31, 2015 . . . . . . . . . . . . . . . . . . . . . . . (136,090) 1,727,565 (113,930) 1,477,545Other comprehensive income (loss) before
reclassifications, net of taxes of ¥10,719 million,¥130,092 million, ¥93,210 million and¥234,021 million . . . . . . . . . . . . . . . . . . . . . . . . . . (423,404) (291,681) (214,600) (929,685)
Reclassifications, net of taxes of ¥— million,¥9,832 million, ¥(3,318) million and¥6,514 million . . . . . . . . . . . . . . . . . . . . . . . . . . . . 28,052 (20,511) 5,419 12,960
Other comprehensive income (loss), net of tax . . . . . . . . (395,352) (312,192) (209,181) (916,725)Less - Other comprehensive income attributable to
noncontrolling interests . . . . . . . . . . . . . . . . . . . . . . . . 32,387 9,572 7,989 49,948
Balance at March 31, 2016 . . . . . . . . . . . . . . . . . . . . . . . (499,055) 1,424,945 (315,122) 610,768
F-42
TOYOTA MOTOR CORPORATION
NOTES TO CONSOLIDATED FINANCIAL STATEMENTS—(Continued)
Reclassifications for the years ended March 31, 2014, 2015 and 2016 consist of the following:
Yen in millions
For the years ended March 31, Affected line itemsin the consolidated statements of income2014 2015 2016
Foreign currency translation adjustments:— — 28,052 Other income (loss), net
— — 28,052 Income before income taxes andequity in earnings of affiliatedcompanies
— — 28,052 Net income
Unrealized gains (losses) on securities:(29) (7,727) (779) Financing operations
5,079 (14,552) (27,275) Foreign exchange gain, net(18,469) (7,446) (6,185) Other income (loss), net
(13,419) (29,725) (34,239) Income before income taxes andequity in earnings of affiliatedcompanies
5,209 11,013 9,832 Provision for income taxes204 (2) 3,896 Equity in earnings of affiliated
companies
(8,006) (18,714) (20,511) Net income
Pension liability adjustments:Recognized net actuarial loss . . . . . . . . . 17,786 10,194 12,971 *1Amortization of prior service costs . . . . . (5,207) (4,346) (4,234) *1
12,579 5,848 8,737 Income before income taxes andequity in earnings of affiliatedcompanies
(4,682) (2,153) (3,318) Provision for income taxes
7,897 3,695 5,419 Net income
Total reclassifications, net of tax . . . . . . . . . . . (109) (15,019) 12,960
Amounts of reclassifications in parentheses indicate gains in the consolidated statements of income.
*1: These components are included in the computation of net periodic pension cost. See note 20 to theconsolidated financial statements for additional information.
19. Stock-based compensation:
In June 1997, the parent company’s shareholders approved a stock option plan for board members. In June2001, the shareholders approved an amendment of the plan to include both board members and key employees.Each year until June 2010, since the plans’ inception, the shareholders have approved the authorization for thegrant of options for the purchase of the parent company’s common stock. Authorized shares for each year thatremain ungranted are unavailable for grant in future years. Stock options granted in and after August 2006 haveterms of 8 years and an exercise price equal to 1.025 times the closing price of Toyota’s common stock on thedate of grant. These options generally vest 2 years from the date of grant.
F-43
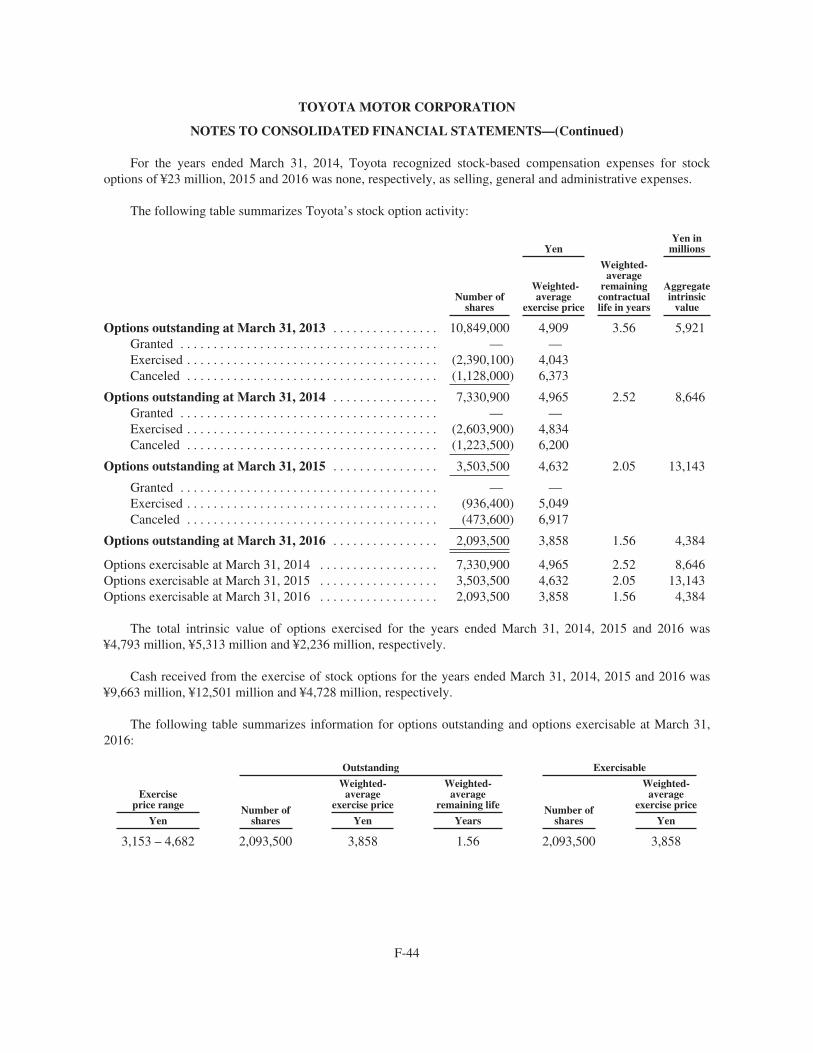
TOYOTA MOTOR CORPORATION
NOTES TO CONSOLIDATED FINANCIAL STATEMENTS—(Continued)
For the years ended March 31, 2014, Toyota recognized stock-based compensation expenses for stockoptions of ¥23 million, 2015 and 2016 was none, respectively, as selling, general and administrative expenses.
The following table summarizes Toyota’s stock option activity:
YenYen in
millions
Number ofshares
Weighted-average
exercise price
Weighted-average
remainingcontractuallife in years
Aggregateintrinsic
value
Options outstanding at March 31, 2013 . . . . . . . . . . . . . . . . 10,849,000 4,909 3.56 5,921Granted . . . . . . . . . . . . . . . . . . . . . . . . . . . . . . . . . . . . . . . — —Exercised . . . . . . . . . . . . . . . . . . . . . . . . . . . . . . . . . . . . . . (2,390,100) 4,043Canceled . . . . . . . . . . . . . . . . . . . . . . . . . . . . . . . . . . . . . . (1,128,000) 6,373
Options outstanding at March 31, 2014 . . . . . . . . . . . . . . . . 7,330,900 4,965 2.52 8,646Granted . . . . . . . . . . . . . . . . . . . . . . . . . . . . . . . . . . . . . . . — —Exercised . . . . . . . . . . . . . . . . . . . . . . . . . . . . . . . . . . . . . . (2,603,900) 4,834Canceled . . . . . . . . . . . . . . . . . . . . . . . . . . . . . . . . . . . . . . (1,223,500) 6,200
Options outstanding at March 31, 2015 . . . . . . . . . . . . . . . . 3,503,500 4,632 2.05 13,143
Granted . . . . . . . . . . . . . . . . . . . . . . . . . . . . . . . . . . . . . . . — —Exercised . . . . . . . . . . . . . . . . . . . . . . . . . . . . . . . . . . . . . . (936,400) 5,049Canceled . . . . . . . . . . . . . . . . . . . . . . . . . . . . . . . . . . . . . . (473,600) 6,917
Options outstanding at March 31, 2016 . . . . . . . . . . . . . . . . 2,093,500 3,858 1.56 4,384
Options exercisable at March 31, 2014 . . . . . . . . . . . . . . . . . . 7,330,900 4,965 2.52 8,646Options exercisable at March 31, 2015 . . . . . . . . . . . . . . . . . . 3,503,500 4,632 2.05 13,143Options exercisable at March 31, 2016 . . . . . . . . . . . . . . . . . . 2,093,500 3,858 1.56 4,384
The total intrinsic value of options exercised for the years ended March 31, 2014, 2015 and 2016 was¥4,793 million, ¥5,313 million and ¥2,236 million, respectively.
Cash received from the exercise of stock options for the years ended March 31, 2014, 2015 and 2016 was¥9,663 million, ¥12,501 million and ¥4,728 million, respectively.
The following table summarizes information for options outstanding and options exercisable at March 31,2016:
Outstanding Exercisable
Exerciseprice range Number of
shares
Weighted-average
exercise price
Weighted-average
remaining life Number ofshares
Weighted-average
exercise price
Yen Yen Years Yen
3,153 – 4,682 2,093,500 3,858 1.56 2,093,500 3,858
F-44
TOYOTA MOTOR CORPORATION
NOTES TO CONSOLIDATED FINANCIAL STATEMENTS—(Continued)
20. Employee benefit plans:
Pension and severance plans -
Upon terminations of employment, employees of the parent company and subsidiaries in Japan are entitled,under the retirement plans of each company, to lump-sum indemnities or pension payments, based on currentrates of pay and lengths of service or the number of “points” mainly determined by those. Under normalcircumstances, the minimum payment prior to retirement age is an amount based on voluntary retirement.Employees receive additional benefits on involuntary retirement, including retirement at the age limit.
Effective October 1, 2004, the parent company amended its retirement plan to introduce a “point” basedretirement benefit plan. Under the new plan, employees are entitled to lump-sum or pension paymentsdetermined based on accumulated “points” vested in each year of service.
There are three types of “points” that vest in each year of service consisting of “service period points” whichare attributed to the length of service, “job title points” which are attributed to the job title of each employee, and“performance points” which are attributed to the annual performance evaluation of each employee. Under normalcircumstances, the minimum payment prior to retirement age is an amount reflecting an adjustment rate appliedto represent voluntary retirement. Employees receive additional benefits upon involuntary retirement, includingretirement at the age limit.
Effective October 1, 2005, the parent company partly amended its retirement plan and introduced the quasicash-balance plan under which benefits are determined based on the variable-interest crediting rate rather thanthe fixed-interest crediting rate as was in the pre-amended plan.
The parent company and most subsidiaries in Japan have contributory funded defined benefit pension plans,which are pursuant to the Corporate Defined Benefit Pension Plan Law (CDBPPL). The contributions to theplans are funded with several financial institutions in accordance with the applicable laws and regulations. Thesepension plan assets consist principally of common stocks, government bonds and insurance contracts.
Most foreign subsidiaries have pension plans or severance indemnity plans covering substantially all of theiremployees under which the cost of benefits are currently invested or accrued. The benefits for these plans arebased primarily on lengths of service and current rates of pay.
Toyota uses a March 31 measurement date for its benefit plans.
F-45
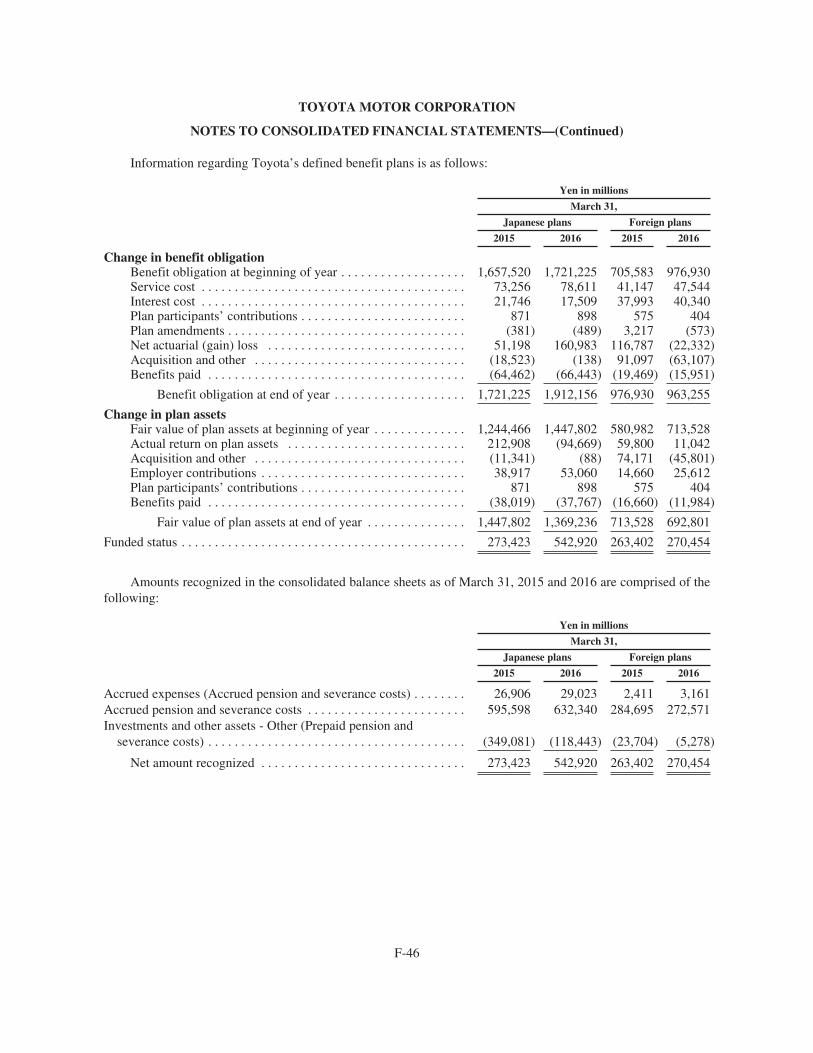
TOYOTA MOTOR CORPORATION
NOTES TO CONSOLIDATED FINANCIAL STATEMENTS—(Continued)
Information regarding Toyota’s defined benefit plans is as follows:
Yen in millions
March 31,
Japanese plans Foreign plans
2015 2016 2015 2016
Change in benefit obligationBenefit obligation at beginning of year . . . . . . . . . . . . . . . . . . . 1,657,520 1,721,225 705,583 976,930Service cost . . . . . . . . . . . . . . . . . . . . . . . . . . . . . . . . . . . . . . . . 73,256 78,611 41,147 47,544Interest cost . . . . . . . . . . . . . . . . . . . . . . . . . . . . . . . . . . . . . . . . 21,746 17,509 37,993 40,340Plan participants’ contributions . . . . . . . . . . . . . . . . . . . . . . . . . 871 898 575 404Plan amendments . . . . . . . . . . . . . . . . . . . . . . . . . . . . . . . . . . . . (381) (489) 3,217 (573)Net actuarial (gain) loss . . . . . . . . . . . . . . . . . . . . . . . . . . . . . . 51,198 160,983 116,787 (22,332)Acquisition and other . . . . . . . . . . . . . . . . . . . . . . . . . . . . . . . . (18,523) (138) 91,097 (63,107)Benefits paid . . . . . . . . . . . . . . . . . . . . . . . . . . . . . . . . . . . . . . . (64,462) (66,443) (19,469) (15,951)
Benefit obligation at end of year . . . . . . . . . . . . . . . . . . . . 1,721,225 1,912,156 976,930 963,255
Change in plan assetsFair value of plan assets at beginning of year . . . . . . . . . . . . . . 1,244,466 1,447,802 580,982 713,528Actual return on plan assets . . . . . . . . . . . . . . . . . . . . . . . . . . . 212,908 (94,669) 59,800 11,042Acquisition and other . . . . . . . . . . . . . . . . . . . . . . . . . . . . . . . . (11,341) (88) 74,171 (45,801)Employer contributions . . . . . . . . . . . . . . . . . . . . . . . . . . . . . . . 38,917 53,060 14,660 25,612Plan participants’ contributions . . . . . . . . . . . . . . . . . . . . . . . . . 871 898 575 404Benefits paid . . . . . . . . . . . . . . . . . . . . . . . . . . . . . . . . . . . . . . . (38,019) (37,767) (16,660) (11,984)
Fair value of plan assets at end of year . . . . . . . . . . . . . . . 1,447,802 1,369,236 713,528 692,801
Funded status . . . . . . . . . . . . . . . . . . . . . . . . . . . . . . . . . . . . . . . . . . . 273,423 542,920 263,402 270,454
Amounts recognized in the consolidated balance sheets as of March 31, 2015 and 2016 are comprised of thefollowing:
Yen in millions
March 31,
Japanese plans Foreign plans
2015 2016 2015 2016
Accrued expenses (Accrued pension and severance costs) . . . . . . . . 26,906 29,023 2,411 3,161Accrued pension and severance costs . . . . . . . . . . . . . . . . . . . . . . . . 595,598 632,340 284,695 272,571Investments and other assets - Other (Prepaid pension and
severance costs) . . . . . . . . . . . . . . . . . . . . . . . . . . . . . . . . . . . . . . . (349,081) (118,443) (23,704) (5,278)
Net amount recognized . . . . . . . . . . . . . . . . . . . . . . . . . . . . . . . 273,423 542,920 263,402 270,454
F-46
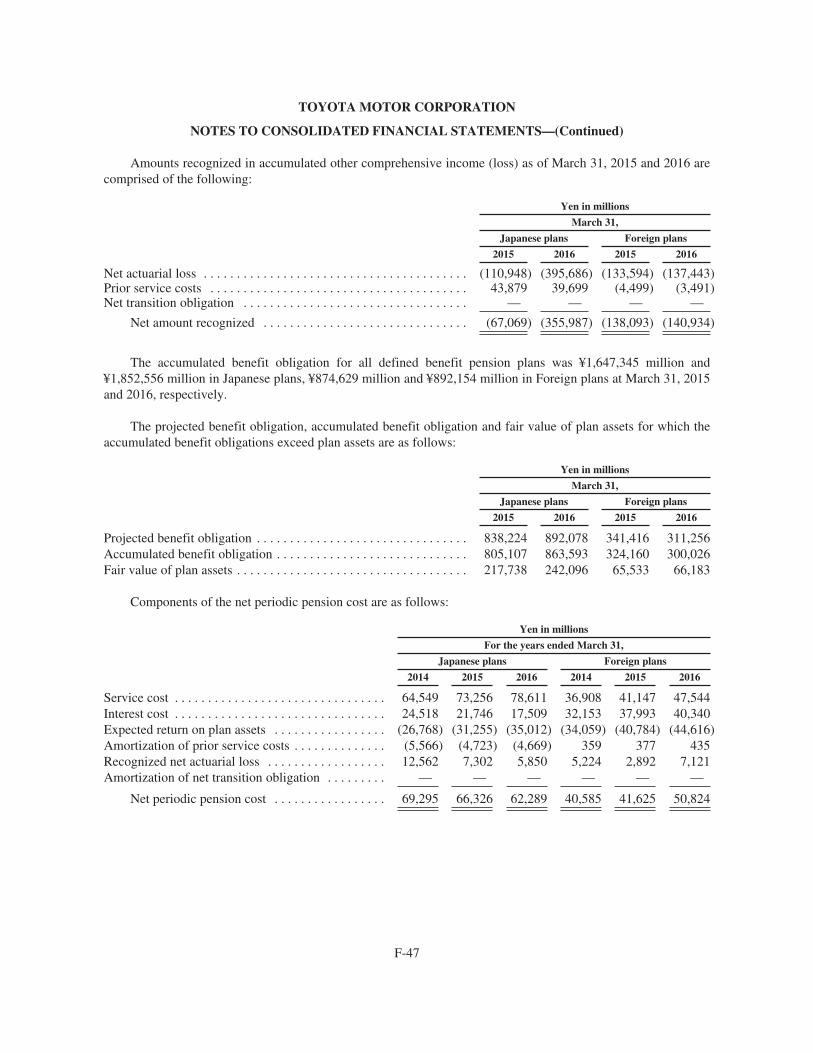
TOYOTA MOTOR CORPORATION
NOTES TO CONSOLIDATED FINANCIAL STATEMENTS—(Continued)
Amounts recognized in accumulated other comprehensive income (loss) as of March 31, 2015 and 2016 arecomprised of the following:
Yen in millions
March 31,
Japanese plans Foreign plans
2015 2016 2015 2016
Net actuarial loss . . . . . . . . . . . . . . . . . . . . . . . . . . . . . . . . . . . . . . . . (110,948) (395,686) (133,594) (137,443)Prior service costs . . . . . . . . . . . . . . . . . . . . . . . . . . . . . . . . . . . . . . . 43,879 39,699 (4,499) (3,491)Net transition obligation . . . . . . . . . . . . . . . . . . . . . . . . . . . . . . . . . . — — — —
Net amount recognized . . . . . . . . . . . . . . . . . . . . . . . . . . . . . . . (67,069) (355,987) (138,093) (140,934)
The accumulated benefit obligation for all defined benefit pension plans was ¥1,647,345 million and¥1,852,556 million in Japanese plans, ¥874,629 million and ¥892,154 million in Foreign plans at March 31, 2015and 2016, respectively.
The projected benefit obligation, accumulated benefit obligation and fair value of plan assets for which theaccumulated benefit obligations exceed plan assets are as follows:
Yen in millions
March 31,
Japanese plans Foreign plans
2015 2016 2015 2016
Projected benefit obligation . . . . . . . . . . . . . . . . . . . . . . . . . . . . . . . . 838,224 892,078 341,416 311,256Accumulated benefit obligation . . . . . . . . . . . . . . . . . . . . . . . . . . . . . 805,107 863,593 324,160 300,026Fair value of plan assets . . . . . . . . . . . . . . . . . . . . . . . . . . . . . . . . . . . 217,738 242,096 65,533 66,183
Components of the net periodic pension cost are as follows:
Yen in millions
For the years ended March 31,
Japanese plans Foreign plans
2014 2015 2016 2014 2015 2016
Service cost . . . . . . . . . . . . . . . . . . . . . . . . . . . . . . . . 64,549 73,256 78,611 36,908 41,147 47,544Interest cost . . . . . . . . . . . . . . . . . . . . . . . . . . . . . . . . 24,518 21,746 17,509 32,153 37,993 40,340Expected return on plan assets . . . . . . . . . . . . . . . . . (26,768) (31,255) (35,012) (34,059) (40,784) (44,616)Amortization of prior service costs . . . . . . . . . . . . . . (5,566) (4,723) (4,669) 359 377 435Recognized net actuarial loss . . . . . . . . . . . . . . . . . . 12,562 7,302 5,850 5,224 2,892 7,121Amortization of net transition obligation . . . . . . . . . — — — — — —
Net periodic pension cost . . . . . . . . . . . . . . . . . 69,295 66,326 62,289 40,585 41,625 50,824
F-47
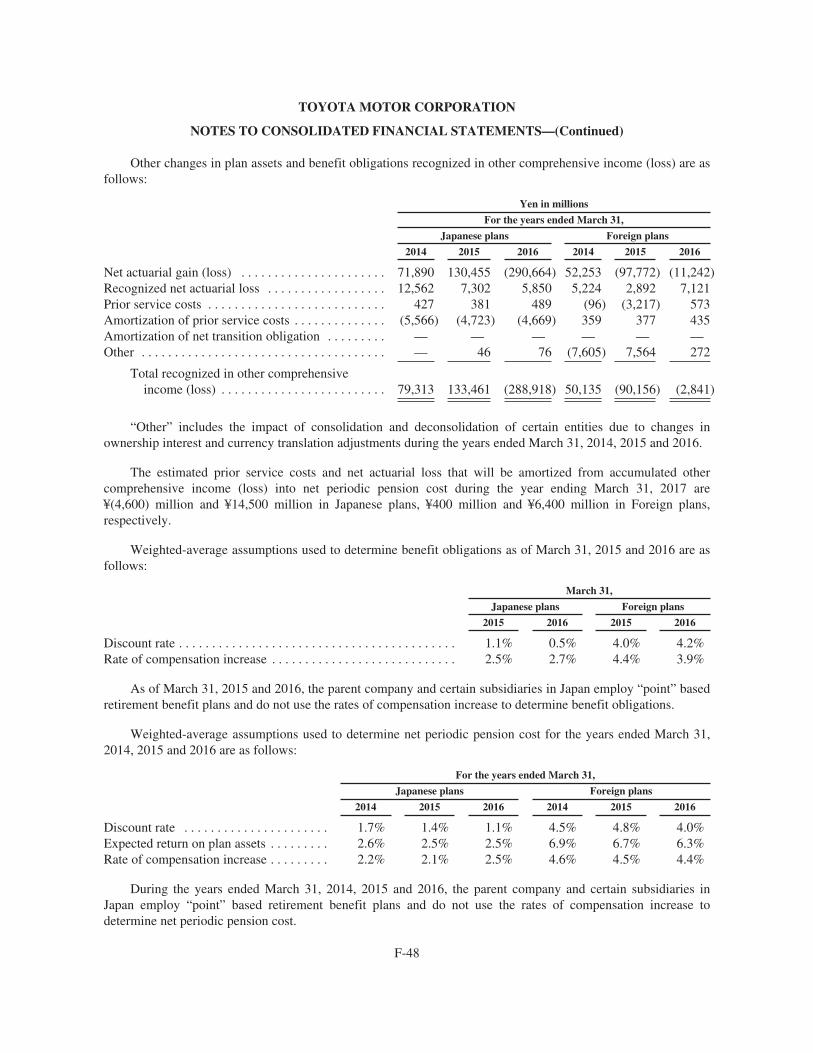
TOYOTA MOTOR CORPORATION
NOTES TO CONSOLIDATED FINANCIAL STATEMENTS—(Continued)
Other changes in plan assets and benefit obligations recognized in other comprehensive income (loss) are asfollows:
Yen in millions
For the years ended March 31,
Japanese plans Foreign plans
2014 2015 2016 2014 2015 2016
Net actuarial gain (loss) . . . . . . . . . . . . . . . . . . . . . . 71,890 130,455 (290,664) 52,253 (97,772) (11,242)Recognized net actuarial loss . . . . . . . . . . . . . . . . . . 12,562 7,302 5,850 5,224 2,892 7,121Prior service costs . . . . . . . . . . . . . . . . . . . . . . . . . . . 427 381 489 (96) (3,217) 573Amortization of prior service costs . . . . . . . . . . . . . . (5,566) (4,723) (4,669) 359 377 435Amortization of net transition obligation . . . . . . . . . — — — — — —Other . . . . . . . . . . . . . . . . . . . . . . . . . . . . . . . . . . . . . — 46 76 (7,605) 7,564 272
Total recognized in other comprehensiveincome (loss) . . . . . . . . . . . . . . . . . . . . . . . . . 79,313 133,461 (288,918) 50,135 (90,156) (2,841)
“Other” includes the impact of consolidation and deconsolidation of certain entities due to changes inownership interest and currency translation adjustments during the years ended March 31, 2014, 2015 and 2016.
The estimated prior service costs and net actuarial loss that will be amortized from accumulated othercomprehensive income (loss) into net periodic pension cost during the year ending March 31, 2017 are¥(4,600) million and ¥14,500 million in Japanese plans, ¥400 million and ¥6,400 million in Foreign plans,respectively.
Weighted-average assumptions used to determine benefit obligations as of March 31, 2015 and 2016 are asfollows:
March 31,
Japanese plans Foreign plans
2015 2016 2015 2016
Discount rate . . . . . . . . . . . . . . . . . . . . . . . . . . . . . . . . . . . . . . . . . . 1.1% 0.5% 4.0% 4.2%Rate of compensation increase . . . . . . . . . . . . . . . . . . . . . . . . . . . . 2.5% 2.7% 4.4% 3.9%
As of March 31, 2015 and 2016, the parent company and certain subsidiaries in Japan employ “point” basedretirement benefit plans and do not use the rates of compensation increase to determine benefit obligations.
Weighted-average assumptions used to determine net periodic pension cost for the years ended March 31,2014, 2015 and 2016 are as follows:
For the years ended March 31,
Japanese plans Foreign plans
2014 2015 2016 2014 2015 2016
Discount rate . . . . . . . . . . . . . . . . . . . . . . 1.7% 1.4% 1.1% 4.5% 4.8% 4.0%Expected return on plan assets . . . . . . . . . 2.6% 2.5% 2.5% 6.9% 6.7% 6.3%Rate of compensation increase . . . . . . . . . 2.2% 2.1% 2.5% 4.6% 4.5% 4.4%
During the years ended March 31, 2014, 2015 and 2016, the parent company and certain subsidiaries inJapan employ “point” based retirement benefit plans and do not use the rates of compensation increase todetermine net periodic pension cost.
F-48
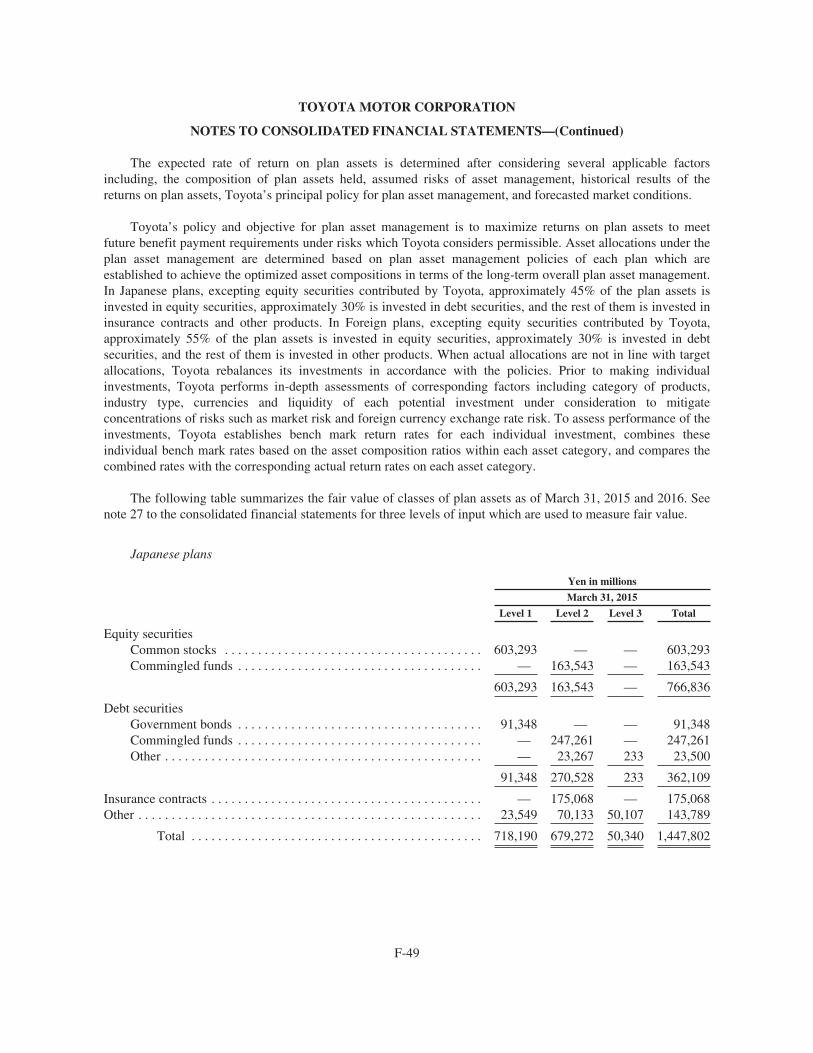
TOYOTA MOTOR CORPORATION
NOTES TO CONSOLIDATED FINANCIAL STATEMENTS—(Continued)
The expected rate of return on plan assets is determined after considering several applicable factorsincluding, the composition of plan assets held, assumed risks of asset management, historical results of thereturns on plan assets, Toyota’s principal policy for plan asset management, and forecasted market conditions.
Toyota’s policy and objective for plan asset management is to maximize returns on plan assets to meetfuture benefit payment requirements under risks which Toyota considers permissible. Asset allocations under theplan asset management are determined based on plan asset management policies of each plan which areestablished to achieve the optimized asset compositions in terms of the long-term overall plan asset management.In Japanese plans, excepting equity securities contributed by Toyota, approximately 45% of the plan assets isinvested in equity securities, approximately 30% is invested in debt securities, and the rest of them is invested ininsurance contracts and other products. In Foreign plans, excepting equity securities contributed by Toyota,approximately 55% of the plan assets is invested in equity securities, approximately 30% is invested in debtsecurities, and the rest of them is invested in other products. When actual allocations are not in line with targetallocations, Toyota rebalances its investments in accordance with the policies. Prior to making individualinvestments, Toyota performs in-depth assessments of corresponding factors including category of products,industry type, currencies and liquidity of each potential investment under consideration to mitigateconcentrations of risks such as market risk and foreign currency exchange rate risk. To assess performance of theinvestments, Toyota establishes bench mark return rates for each individual investment, combines theseindividual bench mark rates based on the asset composition ratios within each asset category, and compares thecombined rates with the corresponding actual return rates on each asset category.
The following table summarizes the fair value of classes of plan assets as of March 31, 2015 and 2016. Seenote 27 to the consolidated financial statements for three levels of input which are used to measure fair value.
Japanese plans
Yen in millions
March 31, 2015
Level 1 Level 2 Level 3 Total
Equity securitiesCommon stocks . . . . . . . . . . . . . . . . . . . . . . . . . . . . . . . . . . . . . . . 603,293 — — 603,293Commingled funds . . . . . . . . . . . . . . . . . . . . . . . . . . . . . . . . . . . . . — 163,543 — 163,543
603,293 163,543 — 766,836
Debt securitiesGovernment bonds . . . . . . . . . . . . . . . . . . . . . . . . . . . . . . . . . . . . . 91,348 — — 91,348Commingled funds . . . . . . . . . . . . . . . . . . . . . . . . . . . . . . . . . . . . . — 247,261 — 247,261Other . . . . . . . . . . . . . . . . . . . . . . . . . . . . . . . . . . . . . . . . . . . . . . . . — 23,267 233 23,500
91,348 270,528 233 362,109
Insurance contracts . . . . . . . . . . . . . . . . . . . . . . . . . . . . . . . . . . . . . . . . . — 175,068 — 175,068Other . . . . . . . . . . . . . . . . . . . . . . . . . . . . . . . . . . . . . . . . . . . . . . . . . . . . 23,549 70,133 50,107 143,789
Total . . . . . . . . . . . . . . . . . . . . . . . . . . . . . . . . . . . . . . . . . . . . 718,190 679,272 50,340 1,447,802
F-49
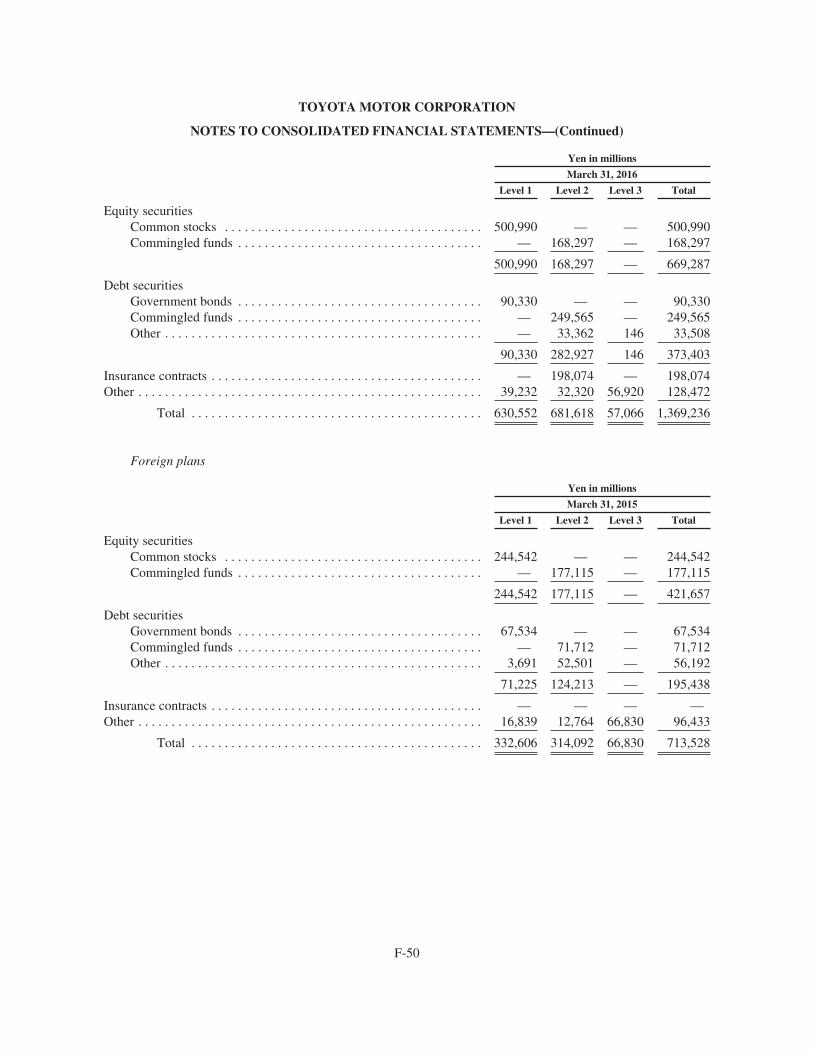
TOYOTA MOTOR CORPORATION
NOTES TO CONSOLIDATED FINANCIAL STATEMENTS—(Continued)
Yen in millions
March 31, 2016
Level 1 Level 2 Level 3 Total
Equity securitiesCommon stocks . . . . . . . . . . . . . . . . . . . . . . . . . . . . . . . . . . . . . . . 500,990 — — 500,990Commingled funds . . . . . . . . . . . . . . . . . . . . . . . . . . . . . . . . . . . . . — 168,297 — 168,297
500,990 168,297 — 669,287
Debt securitiesGovernment bonds . . . . . . . . . . . . . . . . . . . . . . . . . . . . . . . . . . . . . 90,330 — — 90,330Commingled funds . . . . . . . . . . . . . . . . . . . . . . . . . . . . . . . . . . . . . — 249,565 — 249,565Other . . . . . . . . . . . . . . . . . . . . . . . . . . . . . . . . . . . . . . . . . . . . . . . . — 33,362 146 33,508
90,330 282,927 146 373,403
Insurance contracts . . . . . . . . . . . . . . . . . . . . . . . . . . . . . . . . . . . . . . . . . — 198,074 — 198,074Other . . . . . . . . . . . . . . . . . . . . . . . . . . . . . . . . . . . . . . . . . . . . . . . . . . . . 39,232 32,320 56,920 128,472
Total . . . . . . . . . . . . . . . . . . . . . . . . . . . . . . . . . . . . . . . . . . . . 630,552 681,618 57,066 1,369,236
Foreign plans
Yen in millions
March 31, 2015
Level 1 Level 2 Level 3 Total
Equity securitiesCommon stocks . . . . . . . . . . . . . . . . . . . . . . . . . . . . . . . . . . . . . . . 244,542 — — 244,542Commingled funds . . . . . . . . . . . . . . . . . . . . . . . . . . . . . . . . . . . . . — 177,115 — 177,115
244,542 177,115 — 421,657
Debt securitiesGovernment bonds . . . . . . . . . . . . . . . . . . . . . . . . . . . . . . . . . . . . . 67,534 — — 67,534Commingled funds . . . . . . . . . . . . . . . . . . . . . . . . . . . . . . . . . . . . . — 71,712 — 71,712Other . . . . . . . . . . . . . . . . . . . . . . . . . . . . . . . . . . . . . . . . . . . . . . . . 3,691 52,501 — 56,192
71,225 124,213 — 195,438
Insurance contracts . . . . . . . . . . . . . . . . . . . . . . . . . . . . . . . . . . . . . . . . . — — — —Other . . . . . . . . . . . . . . . . . . . . . . . . . . . . . . . . . . . . . . . . . . . . . . . . . . . . 16,839 12,764 66,830 96,433
Total . . . . . . . . . . . . . . . . . . . . . . . . . . . . . . . . . . . . . . . . . . . . 332,606 314,092 66,830 713,528
F-50
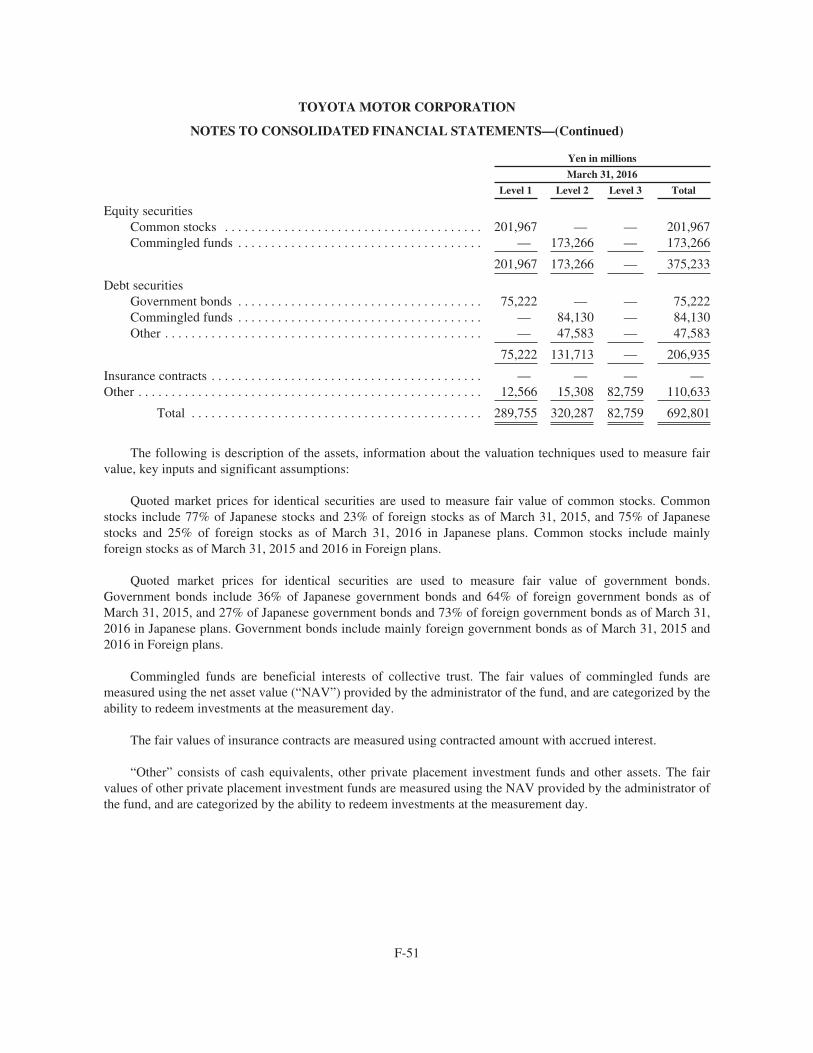
TOYOTA MOTOR CORPORATION
NOTES TO CONSOLIDATED FINANCIAL STATEMENTS—(Continued)
Yen in millions
March 31, 2016
Level 1 Level 2 Level 3 Total
Equity securitiesCommon stocks . . . . . . . . . . . . . . . . . . . . . . . . . . . . . . . . . . . . . . . 201,967 — — 201,967Commingled funds . . . . . . . . . . . . . . . . . . . . . . . . . . . . . . . . . . . . . — 173,266 — 173,266
201,967 173,266 — 375,233
Debt securitiesGovernment bonds . . . . . . . . . . . . . . . . . . . . . . . . . . . . . . . . . . . . . 75,222 — — 75,222Commingled funds . . . . . . . . . . . . . . . . . . . . . . . . . . . . . . . . . . . . . — 84,130 — 84,130Other . . . . . . . . . . . . . . . . . . . . . . . . . . . . . . . . . . . . . . . . . . . . . . . . — 47,583 — 47,583
75,222 131,713 — 206,935
Insurance contracts . . . . . . . . . . . . . . . . . . . . . . . . . . . . . . . . . . . . . . . . . — — — —Other . . . . . . . . . . . . . . . . . . . . . . . . . . . . . . . . . . . . . . . . . . . . . . . . . . . . 12,566 15,308 82,759 110,633
Total . . . . . . . . . . . . . . . . . . . . . . . . . . . . . . . . . . . . . . . . . . . . 289,755 320,287 82,759 692,801
The following is description of the assets, information about the valuation techniques used to measure fairvalue, key inputs and significant assumptions:
Quoted market prices for identical securities are used to measure fair value of common stocks. Commonstocks include 77% of Japanese stocks and 23% of foreign stocks as of March 31, 2015, and 75% of Japanesestocks and 25% of foreign stocks as of March 31, 2016 in Japanese plans. Common stocks include mainlyforeign stocks as of March 31, 2015 and 2016 in Foreign plans.
Quoted market prices for identical securities are used to measure fair value of government bonds.Government bonds include 36% of Japanese government bonds and 64% of foreign government bonds as ofMarch 31, 2015, and 27% of Japanese government bonds and 73% of foreign government bonds as of March 31,2016 in Japanese plans. Government bonds include mainly foreign government bonds as of March 31, 2015 and2016 in Foreign plans.
Commingled funds are beneficial interests of collective trust. The fair values of commingled funds aremeasured using the net asset value (“NAV”) provided by the administrator of the fund, and are categorized by theability to redeem investments at the measurement day.
The fair values of insurance contracts are measured using contracted amount with accrued interest.
“Other” consists of cash equivalents, other private placement investment funds and other assets. The fairvalues of other private placement investment funds are measured using the NAV provided by the administrator ofthe fund, and are categorized by the ability to redeem investments at the measurement day.
F-51
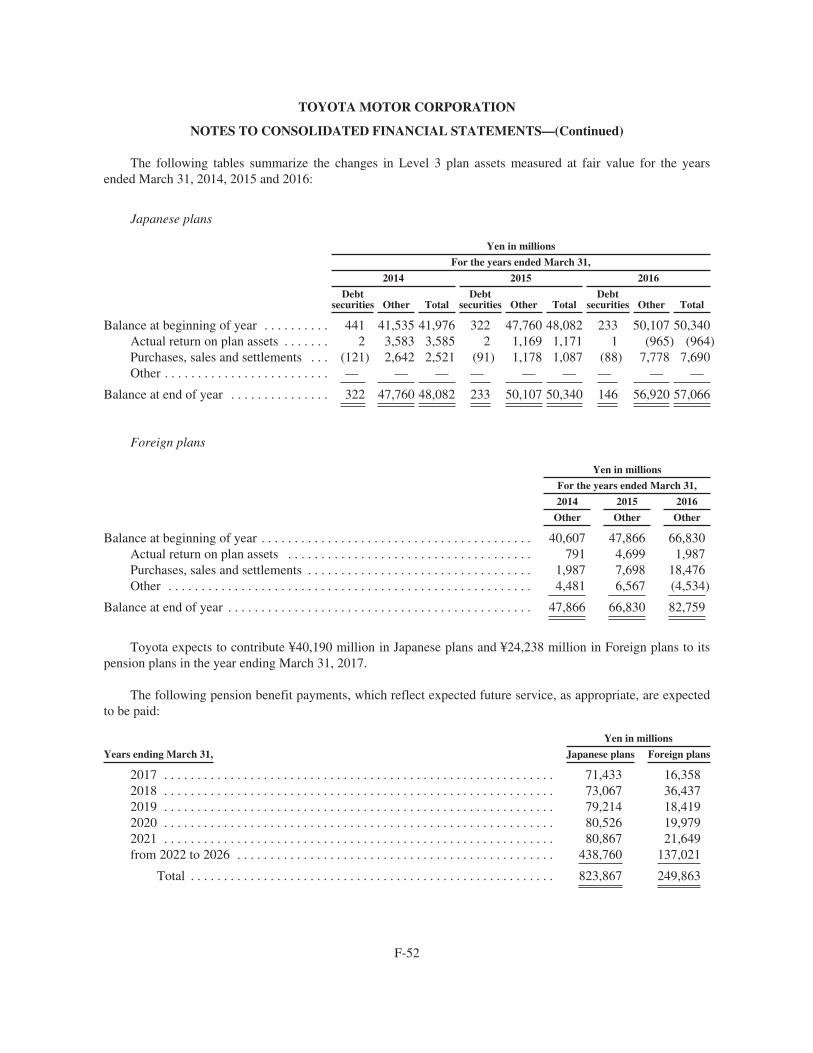
TOYOTA MOTOR CORPORATION
NOTES TO CONSOLIDATED FINANCIAL STATEMENTS—(Continued)
The following tables summarize the changes in Level 3 plan assets measured at fair value for the yearsended March 31, 2014, 2015 and 2016:
Japanese plans
Yen in millions
For the years ended March 31,
2014 2015 2016
Debtsecurities Other Total
Debtsecurities Other Total
Debtsecurities Other Total
Balance at beginning of year . . . . . . . . . . 441 41,535 41,976 322 47,760 48,082 233 50,107 50,340Actual return on plan assets . . . . . . . 2 3,583 3,585 2 1,169 1,171 1 (965) (964)Purchases, sales and settlements . . . (121) 2,642 2,521 (91) 1,178 1,087 (88) 7,778 7,690Other . . . . . . . . . . . . . . . . . . . . . . . . . — — — — — — — — —
Balance at end of year . . . . . . . . . . . . . . . 322 47,760 48,082 233 50,107 50,340 146 56,920 57,066
Foreign plans
Yen in millions
For the years ended March 31,
2014 2015 2016
Other Other Other
Balance at beginning of year . . . . . . . . . . . . . . . . . . . . . . . . . . . . . . . . . . . . . . . . . 40,607 47,866 66,830Actual return on plan assets . . . . . . . . . . . . . . . . . . . . . . . . . . . . . . . . . . . . . 791 4,699 1,987Purchases, sales and settlements . . . . . . . . . . . . . . . . . . . . . . . . . . . . . . . . . . 1,987 7,698 18,476Other . . . . . . . . . . . . . . . . . . . . . . . . . . . . . . . . . . . . . . . . . . . . . . . . . . . . . . . 4,481 6,567 (4,534)
Balance at end of year . . . . . . . . . . . . . . . . . . . . . . . . . . . . . . . . . . . . . . . . . . . . . . 47,866 66,830 82,759
Toyota expects to contribute ¥40,190 million in Japanese plans and ¥24,238 million in Foreign plans to itspension plans in the year ending March 31, 2017.
The following pension benefit payments, which reflect expected future service, as appropriate, are expectedto be paid:
Yen in millions
Years ending March 31, Japanese plans Foreign plans
2017 . . . . . . . . . . . . . . . . . . . . . . . . . . . . . . . . . . . . . . . . . . . . . . . . . . . . . . . . . . . 71,433 16,3582018 . . . . . . . . . . . . . . . . . . . . . . . . . . . . . . . . . . . . . . . . . . . . . . . . . . . . . . . . . . . 73,067 36,4372019 . . . . . . . . . . . . . . . . . . . . . . . . . . . . . . . . . . . . . . . . . . . . . . . . . . . . . . . . . . . 79,214 18,4192020 . . . . . . . . . . . . . . . . . . . . . . . . . . . . . . . . . . . . . . . . . . . . . . . . . . . . . . . . . . . 80,526 19,9792021 . . . . . . . . . . . . . . . . . . . . . . . . . . . . . . . . . . . . . . . . . . . . . . . . . . . . . . . . . . . 80,867 21,649from 2022 to 2026 . . . . . . . . . . . . . . . . . . . . . . . . . . . . . . . . . . . . . . . . . . . . . . . . 438,760 137,021
Total . . . . . . . . . . . . . . . . . . . . . . . . . . . . . . . . . . . . . . . . . . . . . . . . . . . . . . . 823,867 249,863
F-52
TOYOTA MOTOR CORPORATION
NOTES TO CONSOLIDATED FINANCIAL STATEMENTS—(Continued)
Postretirement benefits other than pensions and postemployment benefits -
Toyota’s U.S. subsidiaries provide certain health care and life insurance benefits to eligible retiredemployees. In addition, Toyota provides benefits to certain former or inactive employees after employment, butbefore retirement. These benefits are provided through various insurance companies, health care providers andothers. The costs of these benefits are recognized over the period the employee provides credited service toToyota. Toyota’s obligations under these arrangements are not material.
21. Derivative financial instruments:
Toyota employs derivative financial instruments, including foreign exchange forward contracts, foreigncurrency options, interest rate swaps, interest rate currency swap agreements and interest rate options to manageits exposure to fluctuations in interest rates and foreign currency exchange rates. Toyota does not use derivativesfor speculation or trading.
Fair value hedges -
Toyota enters into interest rate swaps and interest rate currency swap agreements mainly to convert itsfixed-rate debt to variable-rate debt. Toyota uses interest rate swap agreements in managing interest rate riskexposure. Interest rate swap agreements are executed as either an integral part of specific debt transactions or ona portfolio basis. Toyota uses interest rate currency swap agreements to hedge exposure to currency exchangerate fluctuations on principal and interest payments for borrowings denominated in foreign currencies. Notes andloans payable issued in foreign currencies are hedged by concurrently executing interest rate currency swapagreements, which involve the exchange of foreign currency principal and interest obligations for each functionalcurrency obligations at agreed-upon currency exchange and interest rates.
For the years ended March 31, 2014, 2015 and 2016, the ineffective portion of Toyota’s fair value hedgerelationships was not material. For fair value hedging relationships, the components of each derivative’s gain orloss are included in the assessment of hedge effectiveness.
Undesignated derivative financial instruments -
Toyota uses foreign exchange forward contracts, foreign currency options, interest rate swaps, interest ratecurrency swap agreements, and interest rate options, to manage its exposure to foreign currency exchange ratefluctuations and interest rate fluctuations from an economic perspective, and for some of which Toyota is unableto or has elected not to apply hedge accounting.
F-53
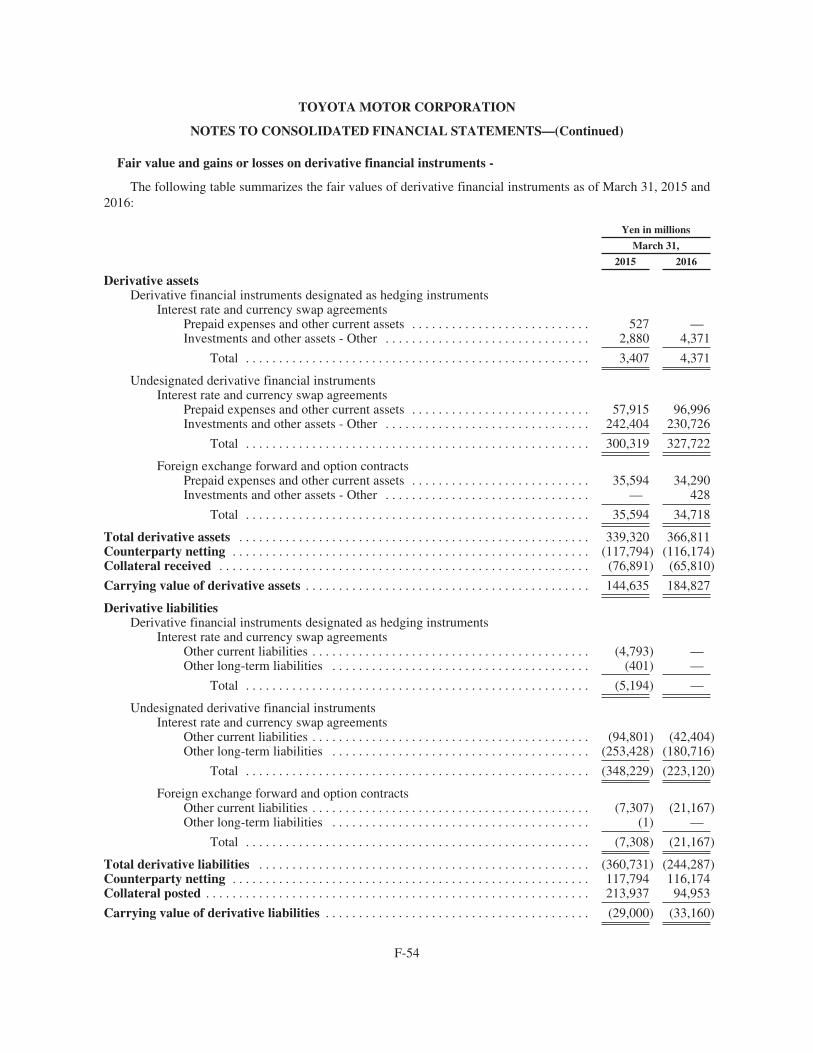
TOYOTA MOTOR CORPORATION
NOTES TO CONSOLIDATED FINANCIAL STATEMENTS—(Continued)
Fair value and gains or losses on derivative financial instruments -
The following table summarizes the fair values of derivative financial instruments as of March 31, 2015 and2016:
Yen in millions
March 31,
2015 2016
Derivative assetsDerivative financial instruments designated as hedging instruments
Interest rate and currency swap agreementsPrepaid expenses and other current assets . . . . . . . . . . . . . . . . . . . . . . . . . . . 527 —Investments and other assets - Other . . . . . . . . . . . . . . . . . . . . . . . . . . . . . . . 2,880 4,371
Total . . . . . . . . . . . . . . . . . . . . . . . . . . . . . . . . . . . . . . . . . . . . . . . . . . . . 3,407 4,371
Undesignated derivative financial instrumentsInterest rate and currency swap agreements
Prepaid expenses and other current assets . . . . . . . . . . . . . . . . . . . . . . . . . . . 57,915 96,996Investments and other assets - Other . . . . . . . . . . . . . . . . . . . . . . . . . . . . . . . 242,404 230,726
Total . . . . . . . . . . . . . . . . . . . . . . . . . . . . . . . . . . . . . . . . . . . . . . . . . . . . 300,319 327,722
Foreign exchange forward and option contractsPrepaid expenses and other current assets . . . . . . . . . . . . . . . . . . . . . . . . . . . 35,594 34,290Investments and other assets - Other . . . . . . . . . . . . . . . . . . . . . . . . . . . . . . . — 428
Total . . . . . . . . . . . . . . . . . . . . . . . . . . . . . . . . . . . . . . . . . . . . . . . . . . . . 35,594 34,718
Total derivative assets . . . . . . . . . . . . . . . . . . . . . . . . . . . . . . . . . . . . . . . . . . . . . . . . . . . . . 339,320 366,811Counterparty netting . . . . . . . . . . . . . . . . . . . . . . . . . . . . . . . . . . . . . . . . . . . . . . . . . . . . . . (117,794) (116,174)Collateral received . . . . . . . . . . . . . . . . . . . . . . . . . . . . . . . . . . . . . . . . . . . . . . . . . . . . . . . . (76,891) (65,810)
Carrying value of derivative assets . . . . . . . . . . . . . . . . . . . . . . . . . . . . . . . . . . . . . . . . . . . 144,635 184,827
Derivative liabilitiesDerivative financial instruments designated as hedging instruments
Interest rate and currency swap agreementsOther current liabilities . . . . . . . . . . . . . . . . . . . . . . . . . . . . . . . . . . . . . . . . . . (4,793) —Other long-term liabilities . . . . . . . . . . . . . . . . . . . . . . . . . . . . . . . . . . . . . . . (401) —
Total . . . . . . . . . . . . . . . . . . . . . . . . . . . . . . . . . . . . . . . . . . . . . . . . . . . . (5,194) —
Undesignated derivative financial instrumentsInterest rate and currency swap agreements
Other current liabilities . . . . . . . . . . . . . . . . . . . . . . . . . . . . . . . . . . . . . . . . . . (94,801) (42,404)Other long-term liabilities . . . . . . . . . . . . . . . . . . . . . . . . . . . . . . . . . . . . . . . (253,428) (180,716)
Total . . . . . . . . . . . . . . . . . . . . . . . . . . . . . . . . . . . . . . . . . . . . . . . . . . . . (348,229) (223,120)
Foreign exchange forward and option contractsOther current liabilities . . . . . . . . . . . . . . . . . . . . . . . . . . . . . . . . . . . . . . . . . . (7,307) (21,167)Other long-term liabilities . . . . . . . . . . . . . . . . . . . . . . . . . . . . . . . . . . . . . . . (1) —
Total . . . . . . . . . . . . . . . . . . . . . . . . . . . . . . . . . . . . . . . . . . . . . . . . . . . . (7,308) (21,167)
Total derivative liabilities . . . . . . . . . . . . . . . . . . . . . . . . . . . . . . . . . . . . . . . . . . . . . . . . . . (360,731) (244,287)Counterparty netting . . . . . . . . . . . . . . . . . . . . . . . . . . . . . . . . . . . . . . . . . . . . . . . . . . . . . . 117,794 116,174Collateral posted . . . . . . . . . . . . . . . . . . . . . . . . . . . . . . . . . . . . . . . . . . . . . . . . . . . . . . . . . . 213,937 94,953
Carrying value of derivative liabilities . . . . . . . . . . . . . . . . . . . . . . . . . . . . . . . . . . . . . . . . (29,000) (33,160)
F-54
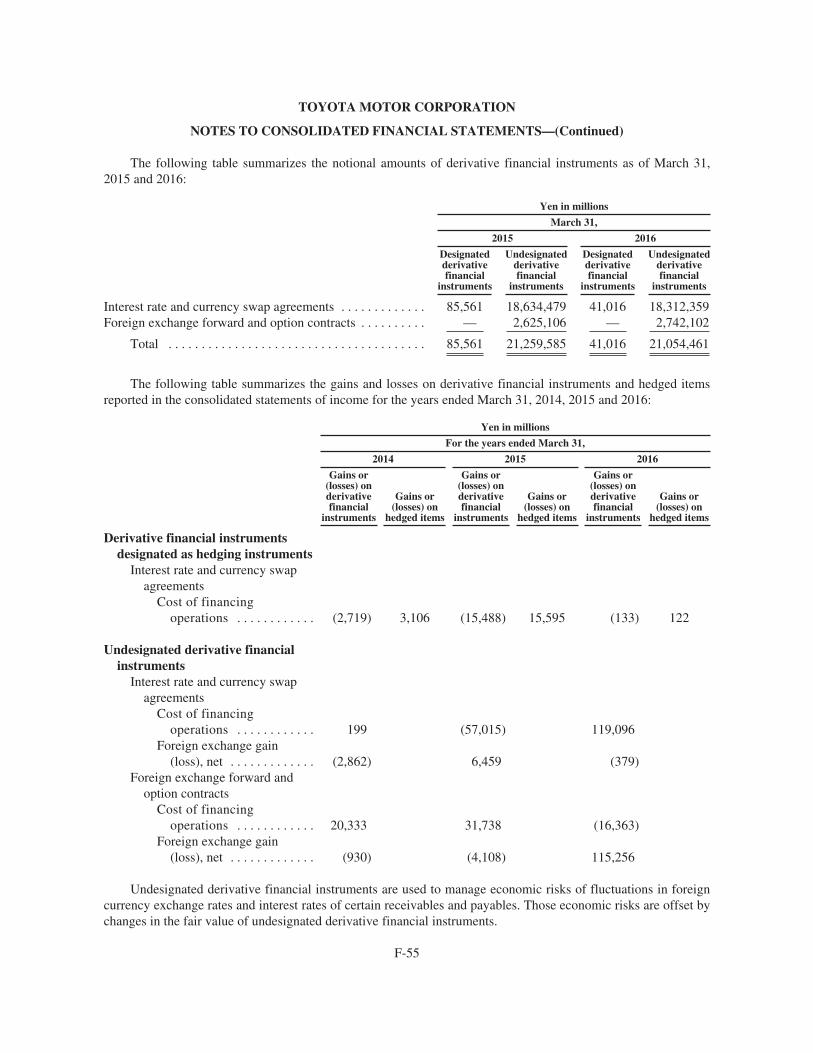
TOYOTA MOTOR CORPORATION
NOTES TO CONSOLIDATED FINANCIAL STATEMENTS—(Continued)
The following table summarizes the notional amounts of derivative financial instruments as of March 31,2015 and 2016:
Yen in millions
March 31,
2015 2016
Designatedderivativefinancial
instruments
Undesignatedderivativefinancial
instruments
Designatedderivativefinancial
instruments
Undesignatedderivativefinancial
instruments
Interest rate and currency swap agreements . . . . . . . . . . . . . 85,561 18,634,479 41,016 18,312,359Foreign exchange forward and option contracts . . . . . . . . . . — 2,625,106 — 2,742,102
Total . . . . . . . . . . . . . . . . . . . . . . . . . . . . . . . . . . . . . . . 85,561 21,259,585 41,016 21,054,461
The following table summarizes the gains and losses on derivative financial instruments and hedged itemsreported in the consolidated statements of income for the years ended March 31, 2014, 2015 and 2016:
Yen in millions
For the years ended March 31,
2014 2015 2016
Gains or(losses) onderivativefinancial
instruments
Gains or(losses) on
hedged items
Gains or(losses) onderivativefinancial
instruments
Gains or(losses) on
hedged items
Gains or(losses) onderivativefinancial
instruments
Gains or(losses) on
hedged items
Derivative financial instrumentsdesignated as hedging instruments
Interest rate and currency swapagreements
Cost of financingoperations . . . . . . . . . . . . (2,719) 3,106 (15,488) 15,595 (133) 122
Undesignated derivative financialinstruments
Interest rate and currency swapagreements
Cost of financingoperations . . . . . . . . . . . . 199 (57,015) 119,096
Foreign exchange gain(loss), net . . . . . . . . . . . . . (2,862) 6,459 (379)
Foreign exchange forward andoption contracts
Cost of financingoperations . . . . . . . . . . . . 20,333 31,738 (16,363)
Foreign exchange gain(loss), net . . . . . . . . . . . . . (930) (4,108) 115,256
Undesignated derivative financial instruments are used to manage economic risks of fluctuations in foreigncurrency exchange rates and interest rates of certain receivables and payables. Those economic risks are offset bychanges in the fair value of undesignated derivative financial instruments.
F-55
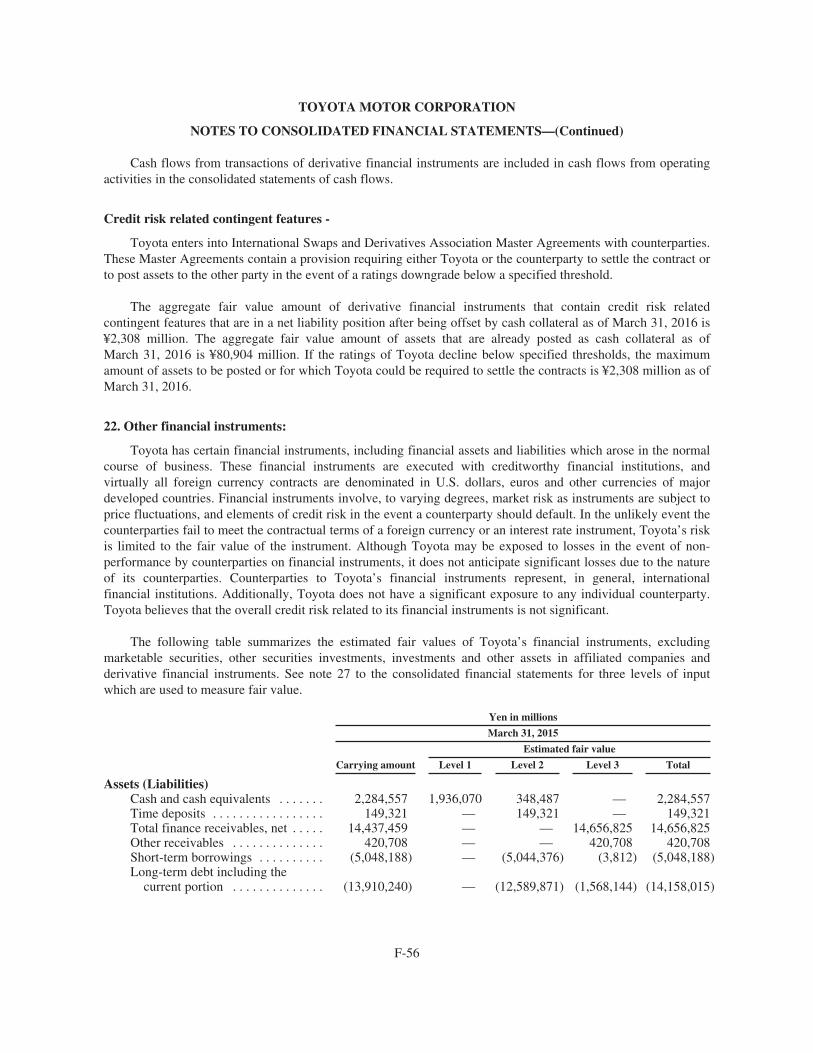
TOYOTA MOTOR CORPORATION
NOTES TO CONSOLIDATED FINANCIAL STATEMENTS—(Continued)
Cash flows from transactions of derivative financial instruments are included in cash flows from operatingactivities in the consolidated statements of cash flows.
Credit risk related contingent features -
Toyota enters into International Swaps and Derivatives Association Master Agreements with counterparties.These Master Agreements contain a provision requiring either Toyota or the counterparty to settle the contract orto post assets to the other party in the event of a ratings downgrade below a specified threshold.
The aggregate fair value amount of derivative financial instruments that contain credit risk relatedcontingent features that are in a net liability position after being offset by cash collateral as of March 31, 2016 is¥2,308 million. The aggregate fair value amount of assets that are already posted as cash collateral as ofMarch 31, 2016 is ¥80,904 million. If the ratings of Toyota decline below specified thresholds, the maximumamount of assets to be posted or for which Toyota could be required to settle the contracts is ¥2,308 million as ofMarch 31, 2016.
22. Other financial instruments:
Toyota has certain financial instruments, including financial assets and liabilities which arose in the normalcourse of business. These financial instruments are executed with creditworthy financial institutions, andvirtually all foreign currency contracts are denominated in U.S. dollars, euros and other currencies of majordeveloped countries. Financial instruments involve, to varying degrees, market risk as instruments are subject toprice fluctuations, and elements of credit risk in the event a counterparty should default. In the unlikely event thecounterparties fail to meet the contractual terms of a foreign currency or an interest rate instrument, Toyota’s riskis limited to the fair value of the instrument. Although Toyota may be exposed to losses in the event of non-performance by counterparties on financial instruments, it does not anticipate significant losses due to the natureof its counterparties. Counterparties to Toyota’s financial instruments represent, in general, internationalfinancial institutions. Additionally, Toyota does not have a significant exposure to any individual counterparty.Toyota believes that the overall credit risk related to its financial instruments is not significant.
The following table summarizes the estimated fair values of Toyota’s financial instruments, excludingmarketable securities, other securities investments, investments and other assets in affiliated companies andderivative financial instruments. See note 27 to the consolidated financial statements for three levels of inputwhich are used to measure fair value.
Yen in millions
March 31, 2015
Estimated fair value
Carrying amount Level 1 Level 2 Level 3 Total
Assets (Liabilities)Cash and cash equivalents . . . . . . . 2,284,557 1,936,070 348,487 — 2,284,557Time deposits . . . . . . . . . . . . . . . . . 149,321 — 149,321 — 149,321Total finance receivables, net . . . . . 14,437,459 — — 14,656,825 14,656,825Other receivables . . . . . . . . . . . . . . 420,708 — — 420,708 420,708Short-term borrowings . . . . . . . . . . (5,048,188) — (5,044,376) (3,812) (5,048,188)Long-term debt including the
current portion . . . . . . . . . . . . . . (13,910,240) — (12,589,871) (1,568,144) (14,158,015)
F-56
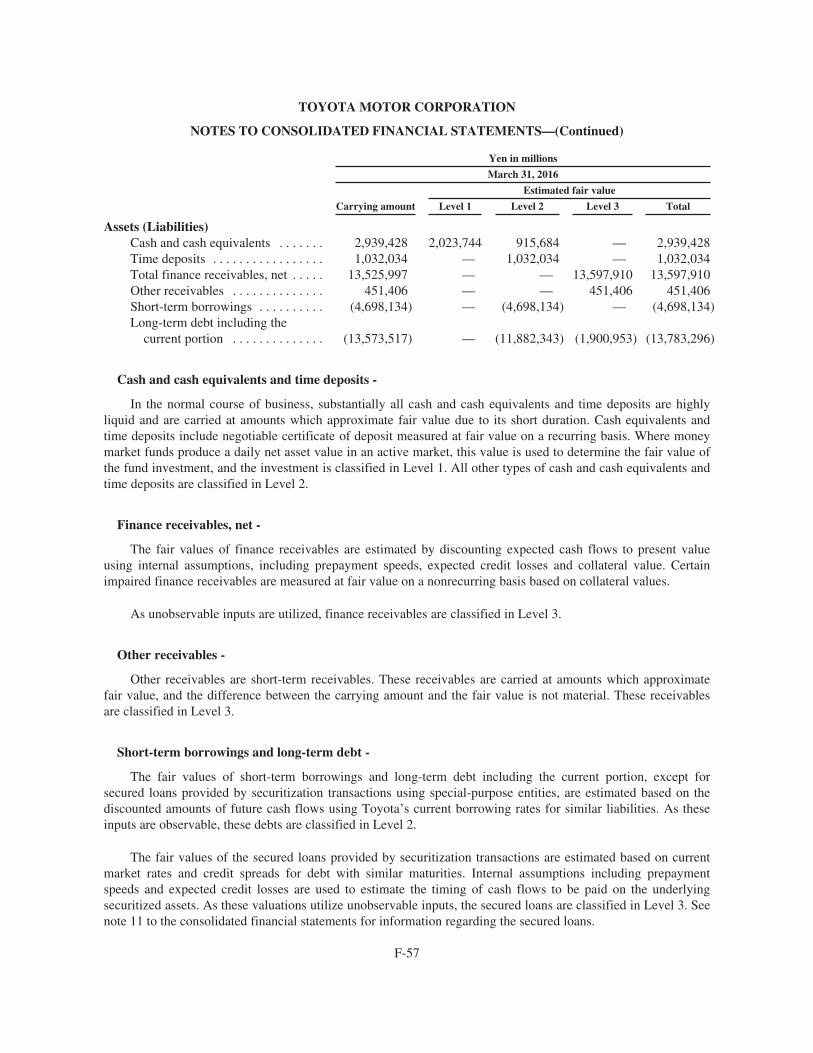
TOYOTA MOTOR CORPORATION
NOTES TO CONSOLIDATED FINANCIAL STATEMENTS—(Continued)
Yen in millions
March 31, 2016
Estimated fair value
Carrying amount Level 1 Level 2 Level 3 Total
Assets (Liabilities)Cash and cash equivalents . . . . . . . 2,939,428 2,023,744 915,684 — 2,939,428Time deposits . . . . . . . . . . . . . . . . . 1,032,034 — 1,032,034 — 1,032,034Total finance receivables, net . . . . . 13,525,997 — — 13,597,910 13,597,910Other receivables . . . . . . . . . . . . . . 451,406 — — 451,406 451,406Short-term borrowings . . . . . . . . . . (4,698,134) — (4,698,134) — (4,698,134)Long-term debt including the
current portion . . . . . . . . . . . . . . (13,573,517) — (11,882,343) (1,900,953) (13,783,296)
Cash and cash equivalents and time deposits -
In the normal course of business, substantially all cash and cash equivalents and time deposits are highlyliquid and are carried at amounts which approximate fair value due to its short duration. Cash equivalents andtime deposits include negotiable certificate of deposit measured at fair value on a recurring basis. Where moneymarket funds produce a daily net asset value in an active market, this value is used to determine the fair value ofthe fund investment, and the investment is classified in Level 1. All other types of cash and cash equivalents andtime deposits are classified in Level 2.
Finance receivables, net -
The fair values of finance receivables are estimated by discounting expected cash flows to present valueusing internal assumptions, including prepayment speeds, expected credit losses and collateral value. Certainimpaired finance receivables are measured at fair value on a nonrecurring basis based on collateral values.
As unobservable inputs are utilized, finance receivables are classified in Level 3.
Other receivables -
Other receivables are short-term receivables. These receivables are carried at amounts which approximatefair value, and the difference between the carrying amount and the fair value is not material. These receivablesare classified in Level 3.
Short-term borrowings and long-term debt -
The fair values of short-term borrowings and long-term debt including the current portion, except forsecured loans provided by securitization transactions using special-purpose entities, are estimated based on thediscounted amounts of future cash flows using Toyota’s current borrowing rates for similar liabilities. As theseinputs are observable, these debts are classified in Level 2.
The fair values of the secured loans provided by securitization transactions are estimated based on currentmarket rates and credit spreads for debt with similar maturities. Internal assumptions including prepaymentspeeds and expected credit losses are used to estimate the timing of cash flows to be paid on the underlyingsecuritized assets. As these valuations utilize unobservable inputs, the secured loans are classified in Level 3. Seenote 11 to the consolidated financial statements for information regarding the secured loans.
F-57
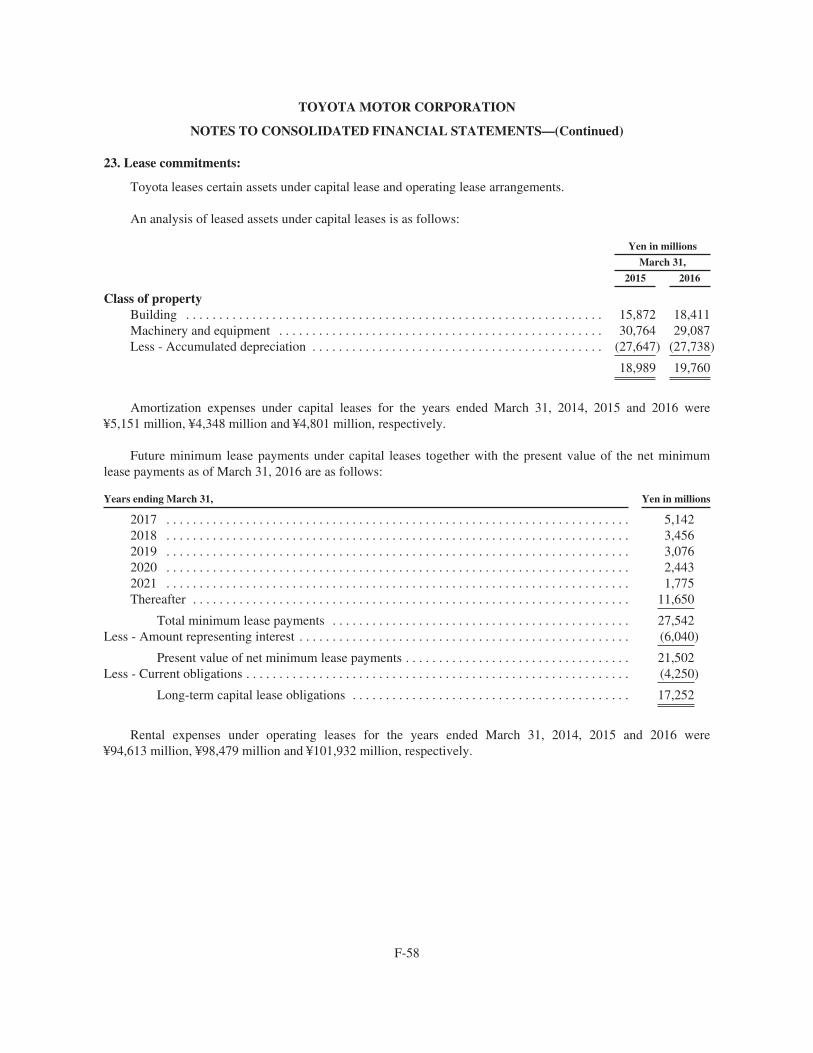
TOYOTA MOTOR CORPORATION
NOTES TO CONSOLIDATED FINANCIAL STATEMENTS—(Continued)
23. Lease commitments:
Toyota leases certain assets under capital lease and operating lease arrangements.
An analysis of leased assets under capital leases is as follows:
Yen in millions
March 31,
2015 2016
Class of propertyBuilding . . . . . . . . . . . . . . . . . . . . . . . . . . . . . . . . . . . . . . . . . . . . . . . . . . . . . . . . . . . . . . . 15,872 18,411Machinery and equipment . . . . . . . . . . . . . . . . . . . . . . . . . . . . . . . . . . . . . . . . . . . . . . . . . 30,764 29,087Less - Accumulated depreciation . . . . . . . . . . . . . . . . . . . . . . . . . . . . . . . . . . . . . . . . . . . . (27,647) (27,738)
18,989 19,760
Amortization expenses under capital leases for the years ended March 31, 2014, 2015 and 2016 were¥5,151 million, ¥4,348 million and ¥4,801 million, respectively.
Future minimum lease payments under capital leases together with the present value of the net minimumlease payments as of March 31, 2016 are as follows:
Years ending March 31, Yen in millions
2017 . . . . . . . . . . . . . . . . . . . . . . . . . . . . . . . . . . . . . . . . . . . . . . . . . . . . . . . . . . . . . . . . . . . . . . 5,1422018 . . . . . . . . . . . . . . . . . . . . . . . . . . . . . . . . . . . . . . . . . . . . . . . . . . . . . . . . . . . . . . . . . . . . . . 3,4562019 . . . . . . . . . . . . . . . . . . . . . . . . . . . . . . . . . . . . . . . . . . . . . . . . . . . . . . . . . . . . . . . . . . . . . . 3,0762020 . . . . . . . . . . . . . . . . . . . . . . . . . . . . . . . . . . . . . . . . . . . . . . . . . . . . . . . . . . . . . . . . . . . . . . 2,4432021 . . . . . . . . . . . . . . . . . . . . . . . . . . . . . . . . . . . . . . . . . . . . . . . . . . . . . . . . . . . . . . . . . . . . . . 1,775Thereafter . . . . . . . . . . . . . . . . . . . . . . . . . . . . . . . . . . . . . . . . . . . . . . . . . . . . . . . . . . . . . . . . . . 11,650
Total minimum lease payments . . . . . . . . . . . . . . . . . . . . . . . . . . . . . . . . . . . . . . . . . . . . . 27,542Less - Amount representing interest . . . . . . . . . . . . . . . . . . . . . . . . . . . . . . . . . . . . . . . . . . . . . . . . . . (6,040)
Present value of net minimum lease payments . . . . . . . . . . . . . . . . . . . . . . . . . . . . . . . . . . 21,502Less - Current obligations . . . . . . . . . . . . . . . . . . . . . . . . . . . . . . . . . . . . . . . . . . . . . . . . . . . . . . . . . . (4,250)
Long-term capital lease obligations . . . . . . . . . . . . . . . . . . . . . . . . . . . . . . . . . . . . . . . . . . 17,252
Rental expenses under operating leases for the years ended March 31, 2014, 2015 and 2016 were¥94,613 million, ¥98,479 million and ¥101,932 million, respectively.
F-58
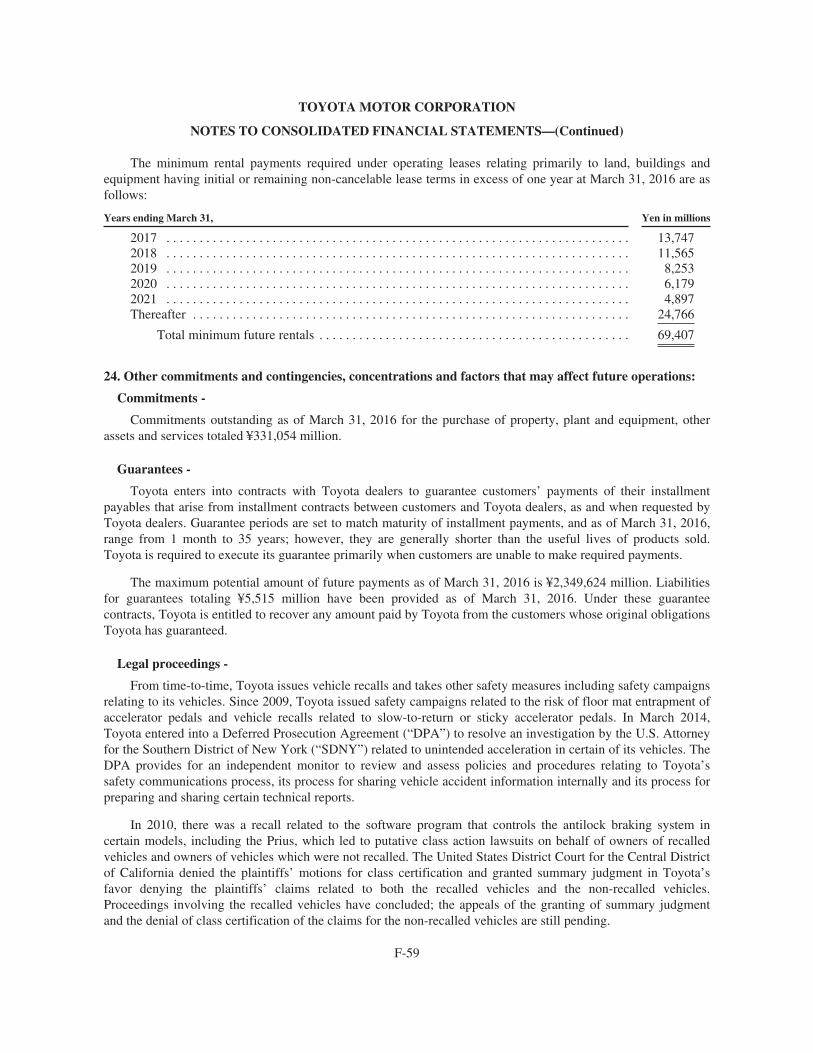
TOYOTA MOTOR CORPORATION
NOTES TO CONSOLIDATED FINANCIAL STATEMENTS—(Continued)
The minimum rental payments required under operating leases relating primarily to land, buildings andequipment having initial or remaining non-cancelable lease terms in excess of one year at March 31, 2016 are asfollows:
Years ending March 31, Yen in millions
2017 . . . . . . . . . . . . . . . . . . . . . . . . . . . . . . . . . . . . . . . . . . . . . . . . . . . . . . . . . . . . . . . . . . . . . . 13,7472018 . . . . . . . . . . . . . . . . . . . . . . . . . . . . . . . . . . . . . . . . . . . . . . . . . . . . . . . . . . . . . . . . . . . . . . 11,5652019 . . . . . . . . . . . . . . . . . . . . . . . . . . . . . . . . . . . . . . . . . . . . . . . . . . . . . . . . . . . . . . . . . . . . . . 8,2532020 . . . . . . . . . . . . . . . . . . . . . . . . . . . . . . . . . . . . . . . . . . . . . . . . . . . . . . . . . . . . . . . . . . . . . . 6,1792021 . . . . . . . . . . . . . . . . . . . . . . . . . . . . . . . . . . . . . . . . . . . . . . . . . . . . . . . . . . . . . . . . . . . . . . 4,897Thereafter . . . . . . . . . . . . . . . . . . . . . . . . . . . . . . . . . . . . . . . . . . . . . . . . . . . . . . . . . . . . . . . . . . 24,766
Total minimum future rentals . . . . . . . . . . . . . . . . . . . . . . . . . . . . . . . . . . . . . . . . . . . . . . . 69,407
24. Other commitments and contingencies, concentrations and factors that may affect future operations:
Commitments -
Commitments outstanding as of March 31, 2016 for the purchase of property, plant and equipment, otherassets and services totaled ¥331,054 million.
Guarantees -
Toyota enters into contracts with Toyota dealers to guarantee customers’ payments of their installmentpayables that arise from installment contracts between customers and Toyota dealers, as and when requested byToyota dealers. Guarantee periods are set to match maturity of installment payments, and as of March 31, 2016,range from 1 month to 35 years; however, they are generally shorter than the useful lives of products sold.Toyota is required to execute its guarantee primarily when customers are unable to make required payments.
The maximum potential amount of future payments as of March 31, 2016 is ¥2,349,624 million. Liabilitiesfor guarantees totaling ¥5,515 million have been provided as of March 31, 2016. Under these guaranteecontracts, Toyota is entitled to recover any amount paid by Toyota from the customers whose original obligationsToyota has guaranteed.
Legal proceedings -
From time-to-time, Toyota issues vehicle recalls and takes other safety measures including safety campaignsrelating to its vehicles. Since 2009, Toyota issued safety campaigns related to the risk of floor mat entrapment ofaccelerator pedals and vehicle recalls related to slow-to-return or sticky accelerator pedals. In March 2014,Toyota entered into a Deferred Prosecution Agreement (“DPA”) to resolve an investigation by the U.S. Attorneyfor the Southern District of New York (“SDNY”) related to unintended acceleration in certain of its vehicles. TheDPA provides for an independent monitor to review and assess policies and procedures relating to Toyota’ssafety communications process, its process for sharing vehicle accident information internally and its process forpreparing and sharing certain technical reports.
In 2010, there was a recall related to the software program that controls the antilock braking system incertain models, including the Prius, which led to putative class action lawsuits on behalf of owners of recalledvehicles and owners of vehicles which were not recalled. The United States District Court for the Central Districtof California denied the plaintiffs’ motions for class certification and granted summary judgment in Toyota’sfavor denying the plaintiffs’ claims related to both the recalled vehicles and the non-recalled vehicles.Proceedings involving the recalled vehicles have concluded; the appeals of the granting of summary judgmentand the denial of class certification of the claims for the non-recalled vehicles are still pending.
F-59
TOYOTA MOTOR CORPORATION
NOTES TO CONSOLIDATED FINANCIAL STATEMENTS—(Continued)
Personal injury and wrongful death claims involving allegations of unintended acceleration are pending inseveral consolidated proceedings in federal and state courts, as well as in individual cases in various other states.The judges in the consolidated federal action and the consolidated California state action have approved anIntensive Settlement Process (“ISP”) for such claims in those actions. Under the ISP, all individual claims withinthe consolidated actions are stayed pending completion of a process to assess whether they can be resolved onterms acceptable to the parties. Cases not resolved after completion of the ISP will then proceed to discovery andtoward trial. Toyota has offered the ISP process to plaintiffs in other consolidated actions and in individual cases,as well.
Toyota has been named as a defendant in 33 economic loss class action lawsuits, which, together withsimilar lawsuits against Takata and other automakers, have been made part of a multi-district litigationproceeding in the United States District Court for the Southern District of Florida, arising out of allegations thatairbag inflators manufactured by Takata are defective. These lawsuits are at an early stage.
Toyota has received a request for information from the SDNY related to statements concerning one or morereported injuries sustained in Toyota vehicles following deployments of Takata airbags. Toyota is cooperatingwith the request.
Toyota self-reported a process gap in fulfilling certain emissions defect information reporting requirementswith the U.S. Environmental Protection Agency (“EPA”) and California Air Resources Board, including updateson its repair completion rates for recalled emissions components and certain other reports concerning emissionsrelated defects. Toyota is involved in discussions with these agencies. The SDNY and EPA have requestedcertain follow-up information regarding this reporting issue, and Toyota is cooperating with the request.
Toyota also has various other pending legal actions and claims, including without limitation personal injuryand wrongful death lawsuits and claims in the United States, and is subject to government investigationsfrom-time-to-time.
Beyond the amounts accrued with respect to all aforementioned matters, Toyota is unable to estimate arange of reasonably possible loss, if any, for the pending legal matters because (i) many of the proceedings are inevidence gathering stages, (ii) significant factual issues need to be resolved, (iii) the legal theory or nature of theclaims is unclear, (iv) the outcome of future motions or appeals is unknown and/or (v) the outcomes of othermatters of these types vary widely and do not appear sufficiently similar to offer meaningful guidance. Basedupon information currently available to Toyota, however, Toyota believes that its losses from these matters, ifany, beyond the amounts accrued, would not have a material adverse effect on Toyota’s financial position, resultsof operations or cash flows.
The parent company has a concentration of labor supply in employees working under collective bargainingagreements and a substantial portion of these employees are working under the agreement that will expire onDecember 31, 2017.
25. Segment data:
The operating segments reported below are the segments of Toyota for which separate financial informationis available and for which operating income/loss amounts are evaluated regularly by executive management indeciding how to allocate resources and in assessing performance.
The major portions of Toyota’s operations on a worldwide basis are derived from the Automotive andFinancial Services business segments. The Automotive segment designs, manufactures and distributes sedans,minivans, compact cars, sport-utility vehicles, trucks and related parts and accessories. The Financial Services
F-60
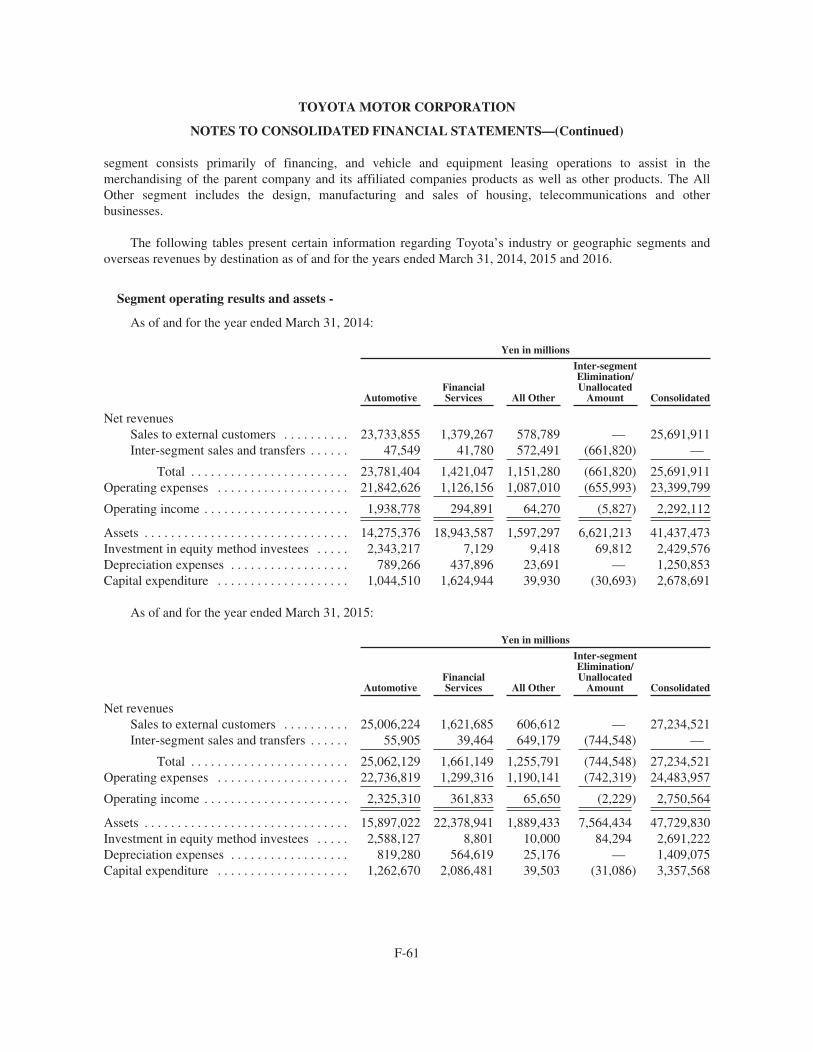
TOYOTA MOTOR CORPORATION
NOTES TO CONSOLIDATED FINANCIAL STATEMENTS—(Continued)
segment consists primarily of financing, and vehicle and equipment leasing operations to assist in themerchandising of the parent company and its affiliated companies products as well as other products. The AllOther segment includes the design, manufacturing and sales of housing, telecommunications and otherbusinesses.
The following tables present certain information regarding Toyota’s industry or geographic segments andoverseas revenues by destination as of and for the years ended March 31, 2014, 2015 and 2016.
Segment operating results and assets -
As of and for the year ended March 31, 2014:
Yen in millions
AutomotiveFinancialServices All Other
Inter-segmentElimination/Unallocated
Amount Consolidated
Net revenuesSales to external customers . . . . . . . . . . 23,733,855 1,379,267 578,789 — 25,691,911Inter-segment sales and transfers . . . . . . 47,549 41,780 572,491 (661,820) —
Total . . . . . . . . . . . . . . . . . . . . . . . . 23,781,404 1,421,047 1,151,280 (661,820) 25,691,911Operating expenses . . . . . . . . . . . . . . . . . . . . 21,842,626 1,126,156 1,087,010 (655,993) 23,399,799
Operating income . . . . . . . . . . . . . . . . . . . . . . 1,938,778 294,891 64,270 (5,827) 2,292,112
Assets . . . . . . . . . . . . . . . . . . . . . . . . . . . . . . . 14,275,376 18,943,587 1,597,297 6,621,213 41,437,473Investment in equity method investees . . . . . 2,343,217 7,129 9,418 69,812 2,429,576Depreciation expenses . . . . . . . . . . . . . . . . . . 789,266 437,896 23,691 — 1,250,853Capital expenditure . . . . . . . . . . . . . . . . . . . . 1,044,510 1,624,944 39,930 (30,693) 2,678,691
As of and for the year ended March 31, 2015:
Yen in millions
AutomotiveFinancialServices All Other
Inter-segmentElimination/Unallocated
Amount Consolidated
Net revenuesSales to external customers . . . . . . . . . . 25,006,224 1,621,685 606,612 — 27,234,521Inter-segment sales and transfers . . . . . . 55,905 39,464 649,179 (744,548) —
Total . . . . . . . . . . . . . . . . . . . . . . . . 25,062,129 1,661,149 1,255,791 (744,548) 27,234,521Operating expenses . . . . . . . . . . . . . . . . . . . . 22,736,819 1,299,316 1,190,141 (742,319) 24,483,957
Operating income . . . . . . . . . . . . . . . . . . . . . . 2,325,310 361,833 65,650 (2,229) 2,750,564
Assets . . . . . . . . . . . . . . . . . . . . . . . . . . . . . . . 15,897,022 22,378,941 1,889,433 7,564,434 47,729,830Investment in equity method investees . . . . . 2,588,127 8,801 10,000 84,294 2,691,222Depreciation expenses . . . . . . . . . . . . . . . . . . 819,280 564,619 25,176 — 1,409,075Capital expenditure . . . . . . . . . . . . . . . . . . . . 1,262,670 2,086,481 39,503 (31,086) 3,357,568
F-61
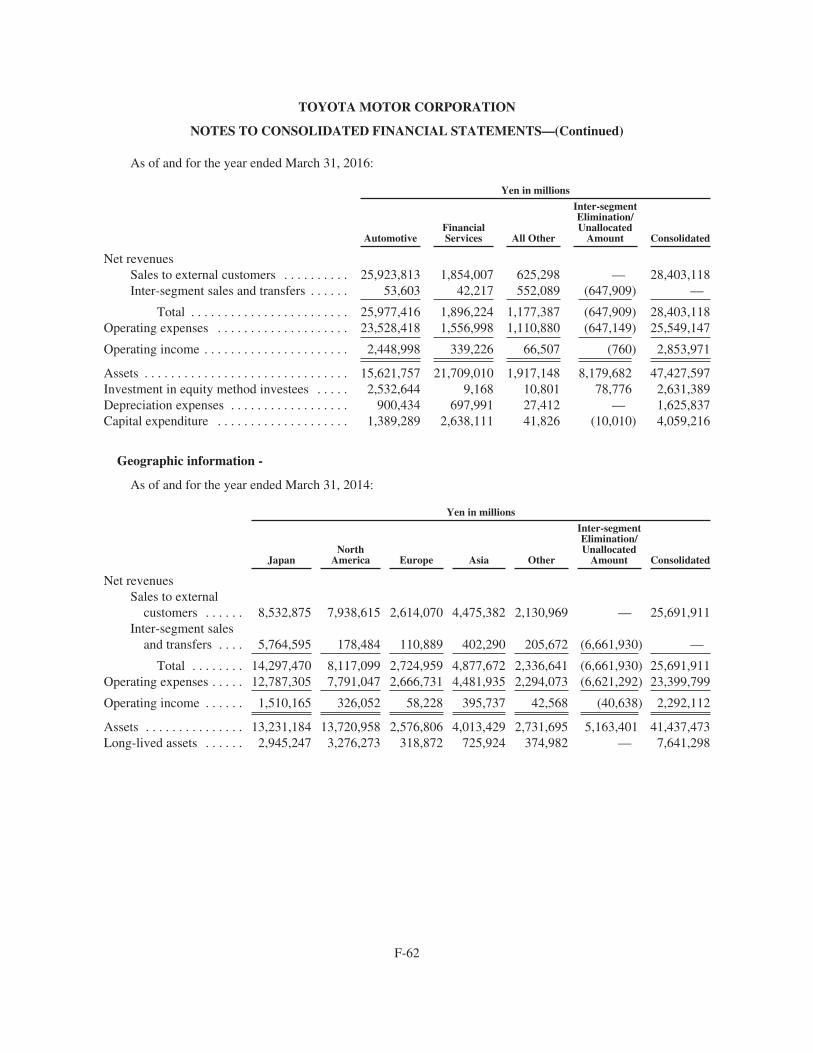
TOYOTA MOTOR CORPORATION
NOTES TO CONSOLIDATED FINANCIAL STATEMENTS—(Continued)
As of and for the year ended March 31, 2016:
Yen in millions
AutomotiveFinancialServices All Other
Inter-segmentElimination/Unallocated
Amount Consolidated
Net revenuesSales to external customers . . . . . . . . . . 25,923,813 1,854,007 625,298 — 28,403,118Inter-segment sales and transfers . . . . . . 53,603 42,217 552,089 (647,909) —
Total . . . . . . . . . . . . . . . . . . . . . . . . 25,977,416 1,896,224 1,177,387 (647,909) 28,403,118Operating expenses . . . . . . . . . . . . . . . . . . . . 23,528,418 1,556,998 1,110,880 (647,149) 25,549,147
Operating income . . . . . . . . . . . . . . . . . . . . . . 2,448,998 339,226 66,507 (760) 2,853,971
Assets . . . . . . . . . . . . . . . . . . . . . . . . . . . . . . . 15,621,757 21,709,010 1,917,148 8,179,682 47,427,597Investment in equity method investees . . . . . 2,532,644 9,168 10,801 78,776 2,631,389Depreciation expenses . . . . . . . . . . . . . . . . . . 900,434 697,991 27,412 — 1,625,837Capital expenditure . . . . . . . . . . . . . . . . . . . . 1,389,289 2,638,111 41,826 (10,010) 4,059,216
Geographic information -
As of and for the year ended March 31, 2014:
Yen in millions
JapanNorth
America Europe Asia Other
Inter-segmentElimination/Unallocated
Amount Consolidated
Net revenuesSales to external
customers . . . . . . 8,532,875 7,938,615 2,614,070 4,475,382 2,130,969 — 25,691,911Inter-segment sales
and transfers . . . . 5,764,595 178,484 110,889 402,290 205,672 (6,661,930) —
Total . . . . . . . . 14,297,470 8,117,099 2,724,959 4,877,672 2,336,641 (6,661,930) 25,691,911Operating expenses . . . . . 12,787,305 7,791,047 2,666,731 4,481,935 2,294,073 (6,621,292) 23,399,799
Operating income . . . . . . 1,510,165 326,052 58,228 395,737 42,568 (40,638) 2,292,112
Assets . . . . . . . . . . . . . . . 13,231,184 13,720,958 2,576,806 4,013,429 2,731,695 5,163,401 41,437,473Long-lived assets . . . . . . 2,945,247 3,276,273 318,872 725,924 374,982 — 7,641,298
F-62
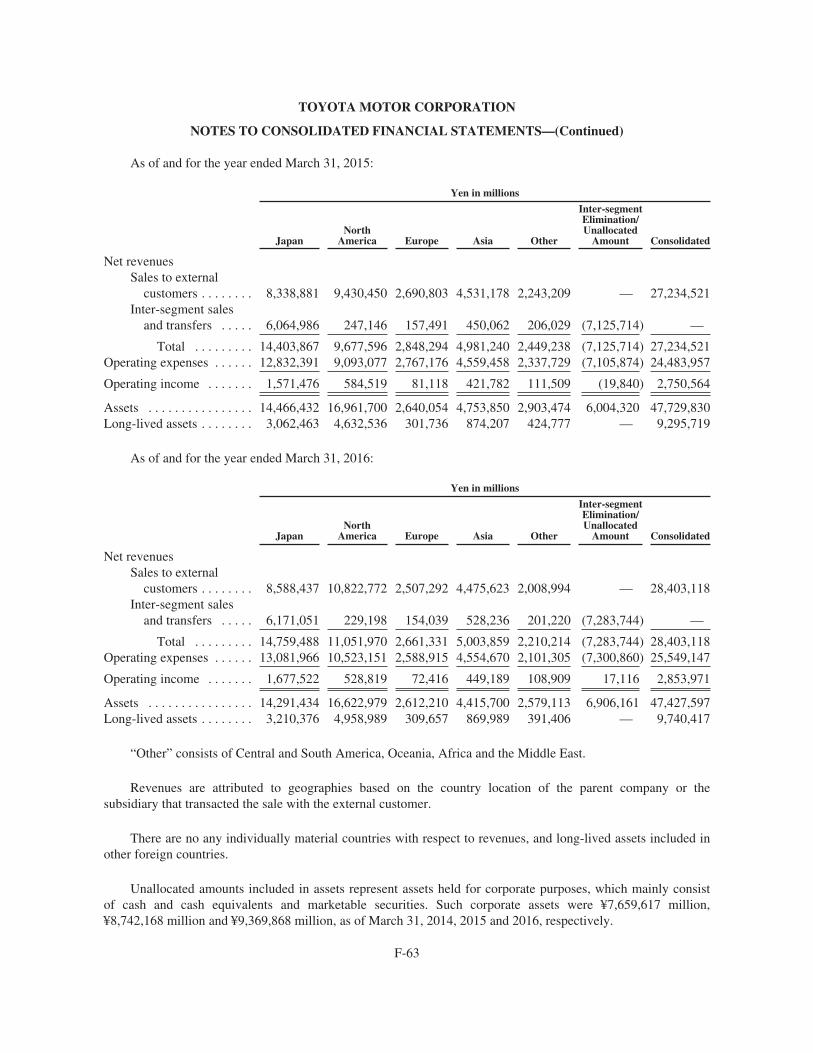
TOYOTA MOTOR CORPORATION
NOTES TO CONSOLIDATED FINANCIAL STATEMENTS—(Continued)
As of and for the year ended March 31, 2015:
Yen in millions
JapanNorth
America Europe Asia Other
Inter-segmentElimination/Unallocated
Amount Consolidated
Net revenuesSales to external
customers . . . . . . . . 8,338,881 9,430,450 2,690,803 4,531,178 2,243,209 — 27,234,521Inter-segment sales
and transfers . . . . . 6,064,986 247,146 157,491 450,062 206,029 (7,125,714) —
Total . . . . . . . . . 14,403,867 9,677,596 2,848,294 4,981,240 2,449,238 (7,125,714) 27,234,521Operating expenses . . . . . . 12,832,391 9,093,077 2,767,176 4,559,458 2,337,729 (7,105,874) 24,483,957
Operating income . . . . . . . 1,571,476 584,519 81,118 421,782 111,509 (19,840) 2,750,564
Assets . . . . . . . . . . . . . . . . 14,466,432 16,961,700 2,640,054 4,753,850 2,903,474 6,004,320 47,729,830Long-lived assets . . . . . . . . 3,062,463 4,632,536 301,736 874,207 424,777 — 9,295,719
As of and for the year ended March 31, 2016:
Yen in millions
JapanNorth
America Europe Asia Other
Inter-segmentElimination/Unallocated
Amount Consolidated
Net revenuesSales to external
customers . . . . . . . . 8,588,437 10,822,772 2,507,292 4,475,623 2,008,994 — 28,403,118Inter-segment sales
and transfers . . . . . 6,171,051 229,198 154,039 528,236 201,220 (7,283,744) —
Total . . . . . . . . . 14,759,488 11,051,970 2,661,331 5,003,859 2,210,214 (7,283,744) 28,403,118Operating expenses . . . . . . 13,081,966 10,523,151 2,588,915 4,554,670 2,101,305 (7,300,860) 25,549,147
Operating income . . . . . . . 1,677,522 528,819 72,416 449,189 108,909 17,116 2,853,971
Assets . . . . . . . . . . . . . . . . 14,291,434 16,622,979 2,612,210 4,415,700 2,579,113 6,906,161 47,427,597Long-lived assets . . . . . . . . 3,210,376 4,958,989 309,657 869,989 391,406 — 9,740,417
“Other” consists of Central and South America, Oceania, Africa and the Middle East.
Revenues are attributed to geographies based on the country location of the parent company or thesubsidiary that transacted the sale with the external customer.
There are no any individually material countries with respect to revenues, and long-lived assets included inother foreign countries.
Unallocated amounts included in assets represent assets held for corporate purposes, which mainly consistof cash and cash equivalents and marketable securities. Such corporate assets were ¥7,659,617 million,¥8,742,168 million and ¥9,369,868 million, as of March 31, 2014, 2015 and 2016, respectively.
F-63
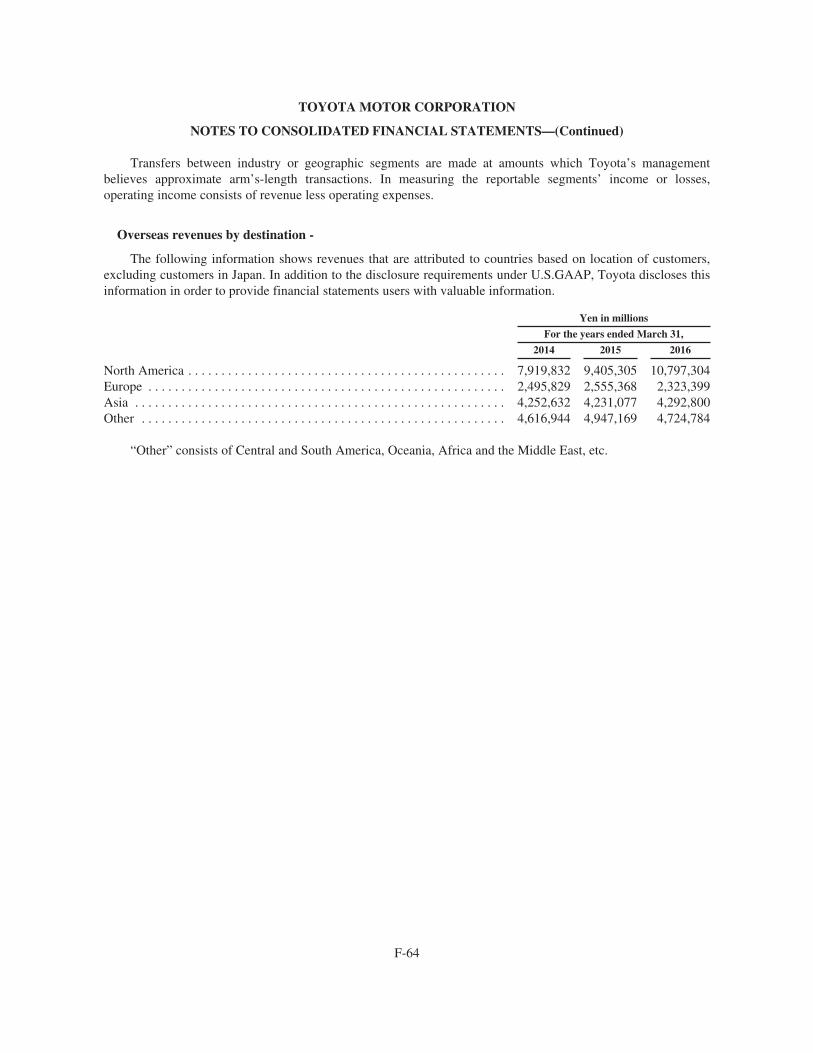
TOYOTA MOTOR CORPORATION
NOTES TO CONSOLIDATED FINANCIAL STATEMENTS—(Continued)
Transfers between industry or geographic segments are made at amounts which Toyota’s managementbelieves approximate arm’s-length transactions. In measuring the reportable segments’ income or losses,operating income consists of revenue less operating expenses.
Overseas revenues by destination -
The following information shows revenues that are attributed to countries based on location of customers,excluding customers in Japan. In addition to the disclosure requirements under U.S.GAAP, Toyota discloses thisinformation in order to provide financial statements users with valuable information.
Yen in millions
For the years ended March 31,
2014 2015 2016
North America . . . . . . . . . . . . . . . . . . . . . . . . . . . . . . . . . . . . . . . . . . . . . . . . 7,919,832 9,405,305 10,797,304Europe . . . . . . . . . . . . . . . . . . . . . . . . . . . . . . . . . . . . . . . . . . . . . . . . . . . . . . 2,495,829 2,555,368 2,323,399Asia . . . . . . . . . . . . . . . . . . . . . . . . . . . . . . . . . . . . . . . . . . . . . . . . . . . . . . . . 4,252,632 4,231,077 4,292,800Other . . . . . . . . . . . . . . . . . . . . . . . . . . . . . . . . . . . . . . . . . . . . . . . . . . . . . . . 4,616,944 4,947,169 4,724,784
“Other” consists of Central and South America, Oceania, Africa and the Middle East, etc.
F-64
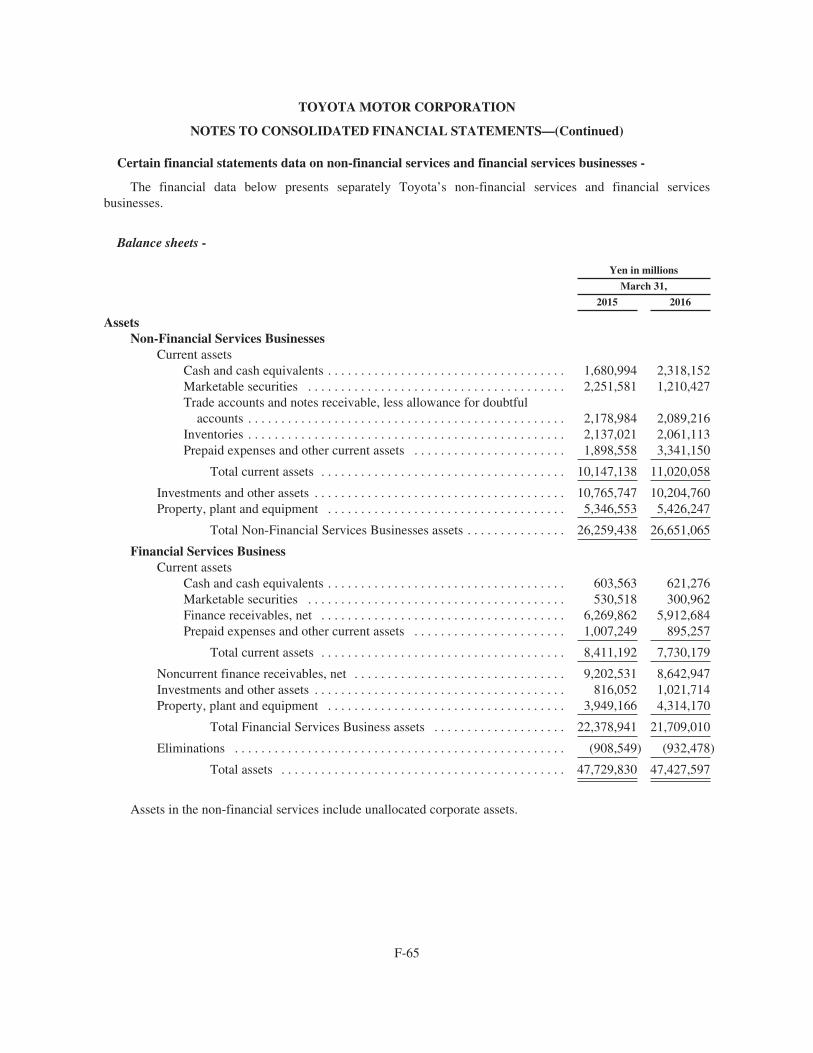
TOYOTA MOTOR CORPORATION
NOTES TO CONSOLIDATED FINANCIAL STATEMENTS—(Continued)
Certain financial statements data on non-financial services and financial services businesses -
The financial data below presents separately Toyota’s non-financial services and financial servicesbusinesses.
Balance sheets -
Yen in millions
March 31,
2015 2016
AssetsNon-Financial Services Businesses
Current assetsCash and cash equivalents . . . . . . . . . . . . . . . . . . . . . . . . . . . . . . . . . . . . 1,680,994 2,318,152Marketable securities . . . . . . . . . . . . . . . . . . . . . . . . . . . . . . . . . . . . . . . 2,251,581 1,210,427Trade accounts and notes receivable, less allowance for doubtful
accounts . . . . . . . . . . . . . . . . . . . . . . . . . . . . . . . . . . . . . . . . . . . . . . . . 2,178,984 2,089,216Inventories . . . . . . . . . . . . . . . . . . . . . . . . . . . . . . . . . . . . . . . . . . . . . . . . 2,137,021 2,061,113Prepaid expenses and other current assets . . . . . . . . . . . . . . . . . . . . . . . 1,898,558 3,341,150
Total current assets . . . . . . . . . . . . . . . . . . . . . . . . . . . . . . . . . . . . . 10,147,138 11,020,058
Investments and other assets . . . . . . . . . . . . . . . . . . . . . . . . . . . . . . . . . . . . . . 10,765,747 10,204,760Property, plant and equipment . . . . . . . . . . . . . . . . . . . . . . . . . . . . . . . . . . . . 5,346,553 5,426,247
Total Non-Financial Services Businesses assets . . . . . . . . . . . . . . . 26,259,438 26,651,065
Financial Services BusinessCurrent assets
Cash and cash equivalents . . . . . . . . . . . . . . . . . . . . . . . . . . . . . . . . . . . . 603,563 621,276Marketable securities . . . . . . . . . . . . . . . . . . . . . . . . . . . . . . . . . . . . . . . 530,518 300,962Finance receivables, net . . . . . . . . . . . . . . . . . . . . . . . . . . . . . . . . . . . . . 6,269,862 5,912,684Prepaid expenses and other current assets . . . . . . . . . . . . . . . . . . . . . . . 1,007,249 895,257
Total current assets . . . . . . . . . . . . . . . . . . . . . . . . . . . . . . . . . . . . . 8,411,192 7,730,179
Noncurrent finance receivables, net . . . . . . . . . . . . . . . . . . . . . . . . . . . . . . . . 9,202,531 8,642,947Investments and other assets . . . . . . . . . . . . . . . . . . . . . . . . . . . . . . . . . . . . . . 816,052 1,021,714Property, plant and equipment . . . . . . . . . . . . . . . . . . . . . . . . . . . . . . . . . . . . 3,949,166 4,314,170
Total Financial Services Business assets . . . . . . . . . . . . . . . . . . . . 22,378,941 21,709,010
Eliminations . . . . . . . . . . . . . . . . . . . . . . . . . . . . . . . . . . . . . . . . . . . . . . . . . . (908,549) (932,478)
Total assets . . . . . . . . . . . . . . . . . . . . . . . . . . . . . . . . . . . . . . . . . . . 47,729,830 47,427,597
Assets in the non-financial services include unallocated corporate assets.
F-65

TOYOTA MOTOR CORPORATION
NOTES TO CONSOLIDATED FINANCIAL STATEMENTS—(Continued)
Yen in millions
March 31,
2015 2016
LiabilitiesNon-Financial Services Businesses
Current liabilitiesShort-term borrowings . . . . . . . . . . . . . . . . . . . . . . . . . . . . . . . . . . . . . . 567,566 586,685Current portion of long-term debt . . . . . . . . . . . . . . . . . . . . . . . . . . . . . . 116,496 117,484Accounts payable . . . . . . . . . . . . . . . . . . . . . . . . . . . . . . . . . . . . . . . . . . 2,372,354 2,356,355Accrued expenses . . . . . . . . . . . . . . . . . . . . . . . . . . . . . . . . . . . . . . . . . . 2,567,998 2,640,128Income taxes payable . . . . . . . . . . . . . . . . . . . . . . . . . . . . . . . . . . . . . . . 338,680 334,490Other current liabilities . . . . . . . . . . . . . . . . . . . . . . . . . . . . . . . . . . . . . . 1,437,114 1,527,024
Total current liabilities . . . . . . . . . . . . . . . . . . . . . . . . . . . . . . . . . . 7,400,208 7,562,166
Long-term liabilitiesLong-term debt . . . . . . . . . . . . . . . . . . . . . . . . . . . . . . . . . . . . . . . . . . . . 564,746 584,793Accrued pension and severance costs . . . . . . . . . . . . . . . . . . . . . . . . . . . 866,930 891,405Other long-term liabilities . . . . . . . . . . . . . . . . . . . . . . . . . . . . . . . . . . . . 1,872,881 1,690,460
Total long-term liabilities . . . . . . . . . . . . . . . . . . . . . . . . . . . . . . . . 3,304,557 3,166,658
Total Non-Financial Services Businesses liabilities . . . . . . . . . . . . 10,704,765 10,728,824
Financial Services BusinessCurrent liabilities
Short-term borrowings . . . . . . . . . . . . . . . . . . . . . . . . . . . . . . . . . . . . . . 4,849,826 4,418,483Current portion of long-term debt . . . . . . . . . . . . . . . . . . . . . . . . . . . . . . 3,830,413 3,715,195Accounts payable . . . . . . . . . . . . . . . . . . . . . . . . . . . . . . . . . . . . . . . . . . 45,195 40,094Accrued expenses . . . . . . . . . . . . . . . . . . . . . . . . . . . . . . . . . . . . . . . . . . 116,868 109,246Income taxes payable . . . . . . . . . . . . . . . . . . . . . . . . . . . . . . . . . . . . . . . 10,106 8,835Other current liabilities . . . . . . . . . . . . . . . . . . . . . . . . . . . . . . . . . . . . . . 802,666 814,298
Total current liabilities . . . . . . . . . . . . . . . . . . . . . . . . . . . . . . . . . . 9,655,074 9,106,151
Long-term liabilitiesLong-term debt . . . . . . . . . . . . . . . . . . . . . . . . . . . . . . . . . . . . . . . . . . . . 9,526,991 9,343,632Accrued pension and severance costs . . . . . . . . . . . . . . . . . . . . . . . . . . . 13,363 13,506Other long-term liabilities . . . . . . . . . . . . . . . . . . . . . . . . . . . . . . . . . . . . 1,091,616 1,081,789
Total long-term liabilities . . . . . . . . . . . . . . . . . . . . . . . . . . . . . . . . 10,631,970 10,438,927
Total Financial Services Business liabilities . . . . . . . . . . . . . . . . . . 20,287,044 19,545,078
Eliminations . . . . . . . . . . . . . . . . . . . . . . . . . . . . . . . . . . . . . . . . . . . . . . . . . . (909,308) (934,491)
Total liabilities . . . . . . . . . . . . . . . . . . . . . . . . . . . . . . . . . . . . . . . . 30,082,501 29,339,411
Mezzanine equity . . . . . . . . . . . . . . . . . . . . . . . . . . . . . . . . . . . . . . . . . . . . . . — 479,779
Total Toyota Motor Corporation shareholders’ equity . . . . . . . . . . . . . . . . . . 16,788,131 16,746,935
Noncontrolling interests . . . . . . . . . . . . . . . . . . . . . . . . . . . . . . . . . . . . . . . . . 859,198 861,472
Total shareholders’ equity . . . . . . . . . . . . . . . . . . . . . . . . . . . . . . . . 17,647,329 17,608,407
Total liabilities, mezzanine equity and shareholders’ equity . . . . . 47,729,830 47,427,597
F-66
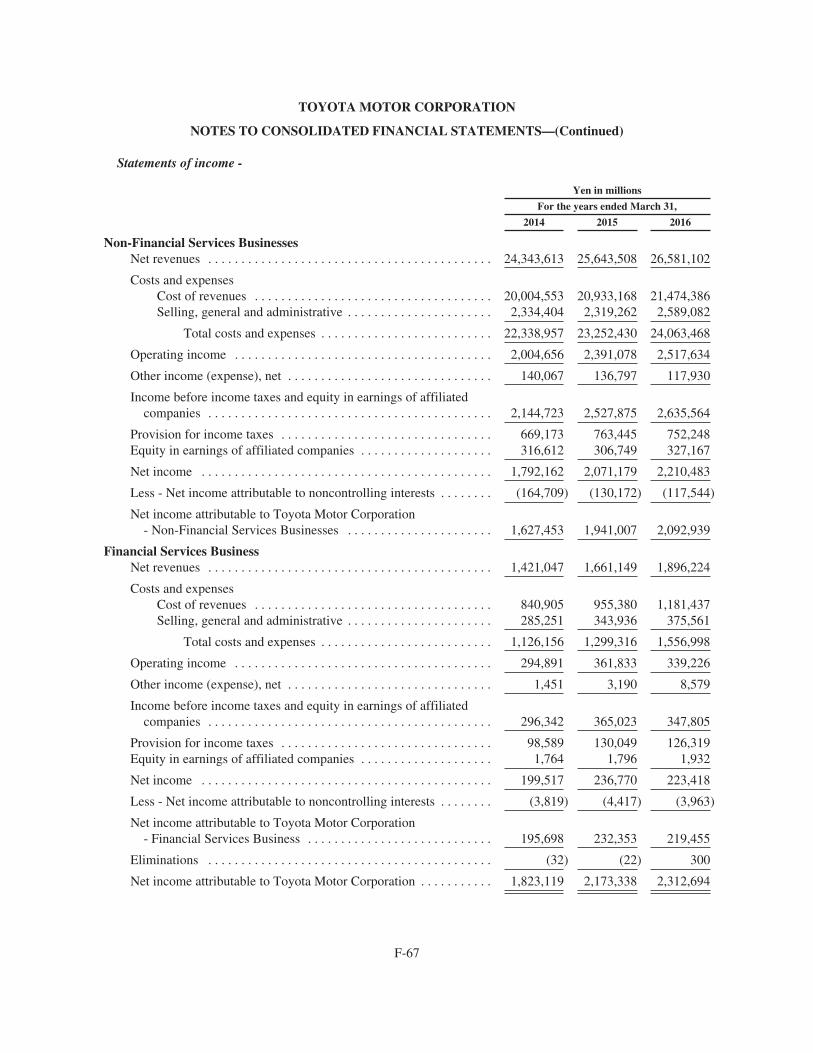
TOYOTA MOTOR CORPORATION
NOTES TO CONSOLIDATED FINANCIAL STATEMENTS—(Continued)
Statements of income -
Yen in millions
For the years ended March 31,
2014 2015 2016
Non-Financial Services BusinessesNet revenues . . . . . . . . . . . . . . . . . . . . . . . . . . . . . . . . . . . . . . . . . . . 24,343,613 25,643,508 26,581,102
Costs and expensesCost of revenues . . . . . . . . . . . . . . . . . . . . . . . . . . . . . . . . . . . . 20,004,553 20,933,168 21,474,386Selling, general and administrative . . . . . . . . . . . . . . . . . . . . . . 2,334,404 2,319,262 2,589,082
Total costs and expenses . . . . . . . . . . . . . . . . . . . . . . . . . . 22,338,957 23,252,430 24,063,468
Operating income . . . . . . . . . . . . . . . . . . . . . . . . . . . . . . . . . . . . . . . 2,004,656 2,391,078 2,517,634
Other income (expense), net . . . . . . . . . . . . . . . . . . . . . . . . . . . . . . . 140,067 136,797 117,930
Income before income taxes and equity in earnings of affiliatedcompanies . . . . . . . . . . . . . . . . . . . . . . . . . . . . . . . . . . . . . . . . . . . 2,144,723 2,527,875 2,635,564
Provision for income taxes . . . . . . . . . . . . . . . . . . . . . . . . . . . . . . . . 669,173 763,445 752,248Equity in earnings of affiliated companies . . . . . . . . . . . . . . . . . . . . 316,612 306,749 327,167
Net income . . . . . . . . . . . . . . . . . . . . . . . . . . . . . . . . . . . . . . . . . . . . 1,792,162 2,071,179 2,210,483
Less - Net income attributable to noncontrolling interests . . . . . . . . (164,709) (130,172) (117,544)
Net income attributable to Toyota Motor Corporation- Non-Financial Services Businesses . . . . . . . . . . . . . . . . . . . . . . 1,627,453 1,941,007 2,092,939
Financial Services BusinessNet revenues . . . . . . . . . . . . . . . . . . . . . . . . . . . . . . . . . . . . . . . . . . . 1,421,047 1,661,149 1,896,224
Costs and expensesCost of revenues . . . . . . . . . . . . . . . . . . . . . . . . . . . . . . . . . . . . 840,905 955,380 1,181,437Selling, general and administrative . . . . . . . . . . . . . . . . . . . . . . 285,251 343,936 375,561
Total costs and expenses . . . . . . . . . . . . . . . . . . . . . . . . . . 1,126,156 1,299,316 1,556,998
Operating income . . . . . . . . . . . . . . . . . . . . . . . . . . . . . . . . . . . . . . . 294,891 361,833 339,226
Other income (expense), net . . . . . . . . . . . . . . . . . . . . . . . . . . . . . . . 1,451 3,190 8,579
Income before income taxes and equity in earnings of affiliatedcompanies . . . . . . . . . . . . . . . . . . . . . . . . . . . . . . . . . . . . . . . . . . . 296,342 365,023 347,805
Provision for income taxes . . . . . . . . . . . . . . . . . . . . . . . . . . . . . . . . 98,589 130,049 126,319Equity in earnings of affiliated companies . . . . . . . . . . . . . . . . . . . . 1,764 1,796 1,932
Net income . . . . . . . . . . . . . . . . . . . . . . . . . . . . . . . . . . . . . . . . . . . . 199,517 236,770 223,418
Less - Net income attributable to noncontrolling interests . . . . . . . . (3,819) (4,417) (3,963)
Net income attributable to Toyota Motor Corporation- Financial Services Business . . . . . . . . . . . . . . . . . . . . . . . . . . . . 195,698 232,353 219,455
Eliminations . . . . . . . . . . . . . . . . . . . . . . . . . . . . . . . . . . . . . . . . . . . (32) (22) 300
Net income attributable to Toyota Motor Corporation . . . . . . . . . . . 1,823,119 2,173,338 2,312,694
F-67
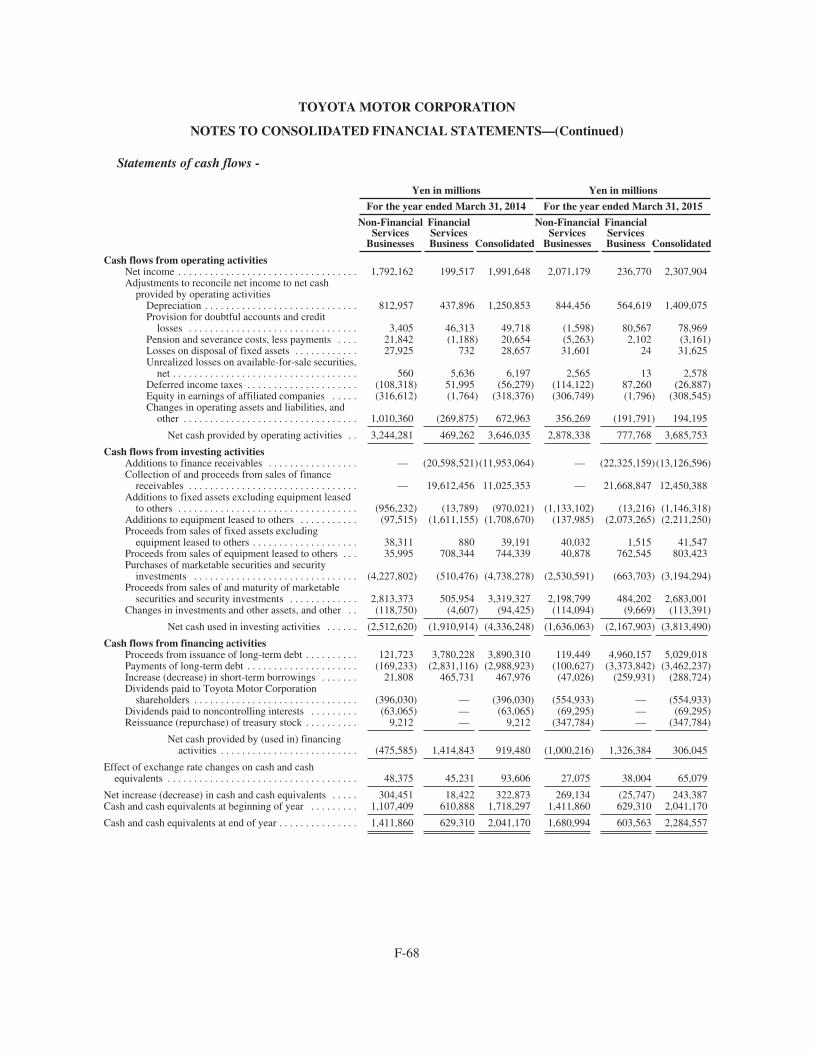
TOYOTA MOTOR CORPORATION
NOTES TO CONSOLIDATED FINANCIAL STATEMENTS—(Continued)
Statements of cash flows -
Yen in millions Yen in millions
For the year ended March 31, 2014 For the year ended March 31, 2015
Non-FinancialServices
Businesses
FinancialServicesBusiness Consolidated
Non-FinancialServices
Businesses
FinancialServicesBusiness Consolidated
Cash flows from operating activitiesNet income . . . . . . . . . . . . . . . . . . . . . . . . . . . . . . . . . . 1,792,162 199,517 1,991,648 2,071,179 236,770 2,307,904Adjustments to reconcile net income to net cash
provided by operating activitiesDepreciation . . . . . . . . . . . . . . . . . . . . . . . . . . . . . 812,957 437,896 1,250,853 844,456 564,619 1,409,075Provision for doubtful accounts and credit
losses . . . . . . . . . . . . . . . . . . . . . . . . . . . . . . . . 3,405 46,313 49,718 (1,598) 80,567 78,969Pension and severance costs, less payments . . . . 21,842 (1,188) 20,654 (5,263) 2,102 (3,161)Losses on disposal of fixed assets . . . . . . . . . . . . 27,925 732 28,657 31,601 24 31,625Unrealized losses on available-for-sale securities,
net . . . . . . . . . . . . . . . . . . . . . . . . . . . . . . . . . . . 560 5,636 6,197 2,565 13 2,578Deferred income taxes . . . . . . . . . . . . . . . . . . . . . (108,318) 51,995 (56,279) (114,122) 87,260 (26,887)Equity in earnings of affiliated companies . . . . . (316,612) (1,764) (318,376) (306,749) (1,796) (308,545)Changes in operating assets and liabilities, and
other . . . . . . . . . . . . . . . . . . . . . . . . . . . . . . . . . 1,010,360 (269,875) 672,963 356,269 (191,791) 194,195
Net cash provided by operating activities . . 3,244,281 469,262 3,646,035 2,878,338 777,768 3,685,753
Cash flows from investing activitiesAdditions to finance receivables . . . . . . . . . . . . . . . . . — (20,598,521)(11,953,064) — (22,325,159)(13,126,596)Collection of and proceeds from sales of finance
receivables . . . . . . . . . . . . . . . . . . . . . . . . . . . . . . . . — 19,612,456 11,025,353 — 21,668,847 12,450,388Additions to fixed assets excluding equipment leased
to others . . . . . . . . . . . . . . . . . . . . . . . . . . . . . . . . . . (956,232) (13,789) (970,021) (1,133,102) (13,216) (1,146,318)Additions to equipment leased to others . . . . . . . . . . . (97,515) (1,611,155) (1,708,670) (137,985) (2,073,265) (2,211,250)Proceeds from sales of fixed assets excluding
equipment leased to others . . . . . . . . . . . . . . . . . . . . 38,311 880 39,191 40,032 1,515 41,547Proceeds from sales of equipment leased to others . . . 35,995 708,344 744,339 40,878 762,545 803,423Purchases of marketable securities and security
investments . . . . . . . . . . . . . . . . . . . . . . . . . . . . . . . (4,227,802) (510,476) (4,738,278) (2,530,591) (663,703) (3,194,294)Proceeds from sales of and maturity of marketable
securities and security investments . . . . . . . . . . . . . 2,813,373 505,954 3,319,327 2,198,799 484,202 2,683,001Changes in investments and other assets, and other . . (118,750) (4,607) (94,425) (114,094) (9,669) (113,391)
Net cash used in investing activities . . . . . . (2,512,620) (1,910,914) (4,336,248) (1,636,063) (2,167,903) (3,813,490)
Cash flows from financing activitiesProceeds from issuance of long-term debt . . . . . . . . . . 121,723 3,780,228 3,890,310 119,449 4,960,157 5,029,018Payments of long-term debt . . . . . . . . . . . . . . . . . . . . . (169,233) (2,831,116) (2,988,923) (100,627) (3,373,842) (3,462,237)Increase (decrease) in short-term borrowings . . . . . . . 21,808 465,731 467,976 (47,026) (259,931) (288,724)Dividends paid to Toyota Motor Corporation
shareholders . . . . . . . . . . . . . . . . . . . . . . . . . . . . . . . (396,030) — (396,030) (554,933) — (554,933)Dividends paid to noncontrolling interests . . . . . . . . . (63,065) — (63,065) (69,295) — (69,295)Reissuance (repurchase) of treasury stock . . . . . . . . . . 9,212 — 9,212 (347,784) — (347,784)
Net cash provided by (used in) financingactivities . . . . . . . . . . . . . . . . . . . . . . . . . . (475,585) 1,414,843 919,480 (1,000,216) 1,326,384 306,045
Effect of exchange rate changes on cash and cashequivalents . . . . . . . . . . . . . . . . . . . . . . . . . . . . . . . . . . . . 48,375 45,231 93,606 27,075 38,004 65,079
Net increase (decrease) in cash and cash equivalents . . . . . 304,451 18,422 322,873 269,134 (25,747) 243,387Cash and cash equivalents at beginning of year . . . . . . . . . 1,107,409 610,888 1,718,297 1,411,860 629,310 2,041,170
Cash and cash equivalents at end of year . . . . . . . . . . . . . . . 1,411,860 629,310 2,041,170 1,680,994 603,563 2,284,557
F-68
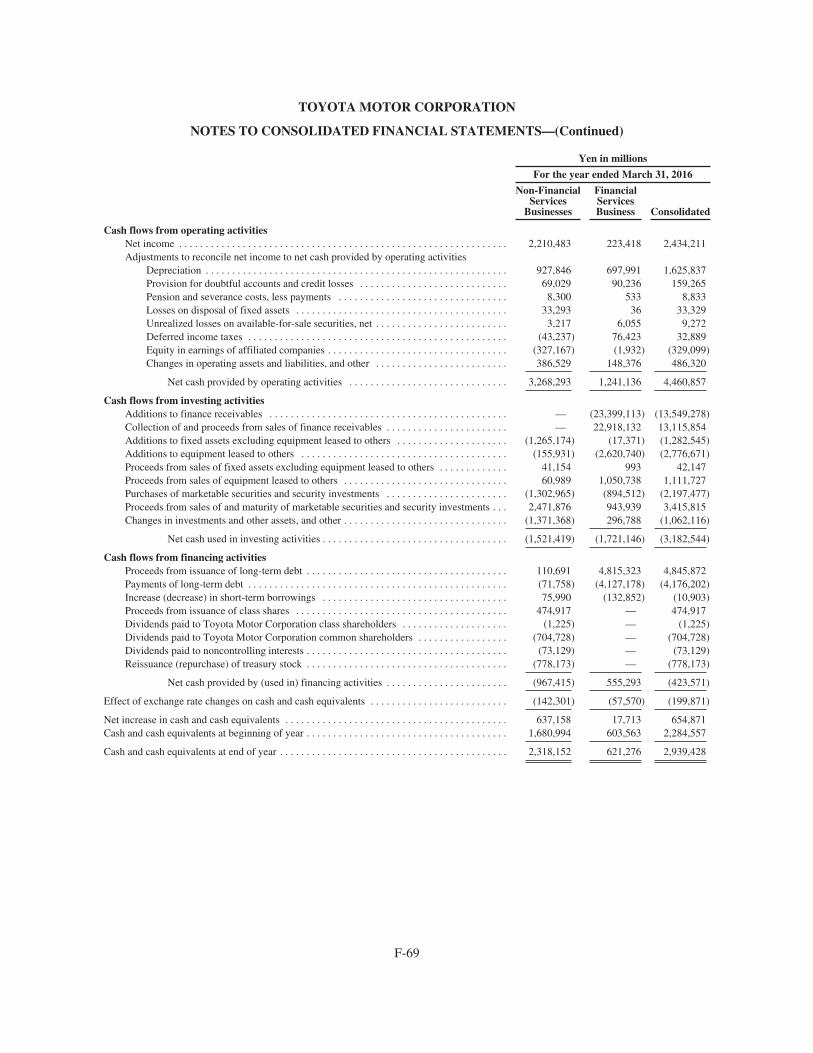
TOYOTA MOTOR CORPORATION
NOTES TO CONSOLIDATED FINANCIAL STATEMENTS—(Continued)
Yen in millions
For the year ended March 31, 2016
Non-FinancialServices
Businesses
FinancialServicesBusiness Consolidated
Cash flows from operating activitiesNet income . . . . . . . . . . . . . . . . . . . . . . . . . . . . . . . . . . . . . . . . . . . . . . . . . . . . . . . . . . . . . . 2,210,483 223,418 2,434,211Adjustments to reconcile net income to net cash provided by operating activities
Depreciation . . . . . . . . . . . . . . . . . . . . . . . . . . . . . . . . . . . . . . . . . . . . . . . . . . . . . . . . . 927,846 697,991 1,625,837Provision for doubtful accounts and credit losses . . . . . . . . . . . . . . . . . . . . . . . . . . . . 69,029 90,236 159,265Pension and severance costs, less payments . . . . . . . . . . . . . . . . . . . . . . . . . . . . . . . . 8,300 533 8,833Losses on disposal of fixed assets . . . . . . . . . . . . . . . . . . . . . . . . . . . . . . . . . . . . . . . . 33,293 36 33,329Unrealized losses on available-for-sale securities, net . . . . . . . . . . . . . . . . . . . . . . . . . 3,217 6,055 9,272Deferred income taxes . . . . . . . . . . . . . . . . . . . . . . . . . . . . . . . . . . . . . . . . . . . . . . . . . (43,237) 76,423 32,889Equity in earnings of affiliated companies . . . . . . . . . . . . . . . . . . . . . . . . . . . . . . . . . . (327,167) (1,932) (329,099)Changes in operating assets and liabilities, and other . . . . . . . . . . . . . . . . . . . . . . . . . 386,529 148,376 486,320
Net cash provided by operating activities . . . . . . . . . . . . . . . . . . . . . . . . . . . . . . 3,268,293 1,241,136 4,460,857
Cash flows from investing activitiesAdditions to finance receivables . . . . . . . . . . . . . . . . . . . . . . . . . . . . . . . . . . . . . . . . . . . . . — (23,399,113) (13,549,278)Collection of and proceeds from sales of finance receivables . . . . . . . . . . . . . . . . . . . . . . . — 22,918,132 13,115,854Additions to fixed assets excluding equipment leased to others . . . . . . . . . . . . . . . . . . . . . (1,265,174) (17,371) (1,282,545)Additions to equipment leased to others . . . . . . . . . . . . . . . . . . . . . . . . . . . . . . . . . . . . . . . (155,931) (2,620,740) (2,776,671)Proceeds from sales of fixed assets excluding equipment leased to others . . . . . . . . . . . . . 41,154 993 42,147Proceeds from sales of equipment leased to others . . . . . . . . . . . . . . . . . . . . . . . . . . . . . . . 60,989 1,050,738 1,111,727Purchases of marketable securities and security investments . . . . . . . . . . . . . . . . . . . . . . . (1,302,965) (894,512) (2,197,477)Proceeds from sales of and maturity of marketable securities and security investments . . . 2,471,876 943,939 3,415,815Changes in investments and other assets, and other . . . . . . . . . . . . . . . . . . . . . . . . . . . . . . . (1,371,368) 296,788 (1,062,116)
Net cash used in investing activities . . . . . . . . . . . . . . . . . . . . . . . . . . . . . . . . . . . (1,521,419) (1,721,146) (3,182,544)
Cash flows from financing activitiesProceeds from issuance of long-term debt . . . . . . . . . . . . . . . . . . . . . . . . . . . . . . . . . . . . . . 110,691 4,815,323 4,845,872Payments of long-term debt . . . . . . . . . . . . . . . . . . . . . . . . . . . . . . . . . . . . . . . . . . . . . . . . . (71,758) (4,127,178) (4,176,202)Increase (decrease) in short-term borrowings . . . . . . . . . . . . . . . . . . . . . . . . . . . . . . . . . . . 75,990 (132,852) (10,903)Proceeds from issuance of class shares . . . . . . . . . . . . . . . . . . . . . . . . . . . . . . . . . . . . . . . . 474,917 — 474,917Dividends paid to Toyota Motor Corporation class shareholders . . . . . . . . . . . . . . . . . . . . (1,225) — (1,225)Dividends paid to Toyota Motor Corporation common shareholders . . . . . . . . . . . . . . . . . (704,728) — (704,728)Dividends paid to noncontrolling interests . . . . . . . . . . . . . . . . . . . . . . . . . . . . . . . . . . . . . . (73,129) — (73,129)Reissuance (repurchase) of treasury stock . . . . . . . . . . . . . . . . . . . . . . . . . . . . . . . . . . . . . . (778,173) — (778,173)
Net cash provided by (used in) financing activities . . . . . . . . . . . . . . . . . . . . . . . (967,415) 555,293 (423,571)
Effect of exchange rate changes on cash and cash equivalents . . . . . . . . . . . . . . . . . . . . . . . . . . (142,301) (57,570) (199,871)
Net increase in cash and cash equivalents . . . . . . . . . . . . . . . . . . . . . . . . . . . . . . . . . . . . . . . . . . 637,158 17,713 654,871Cash and cash equivalents at beginning of year . . . . . . . . . . . . . . . . . . . . . . . . . . . . . . . . . . . . . . 1,680,994 603,563 2,284,557
Cash and cash equivalents at end of year . . . . . . . . . . . . . . . . . . . . . . . . . . . . . . . . . . . . . . . . . . . 2,318,152 621,276 2,939,428
F-69
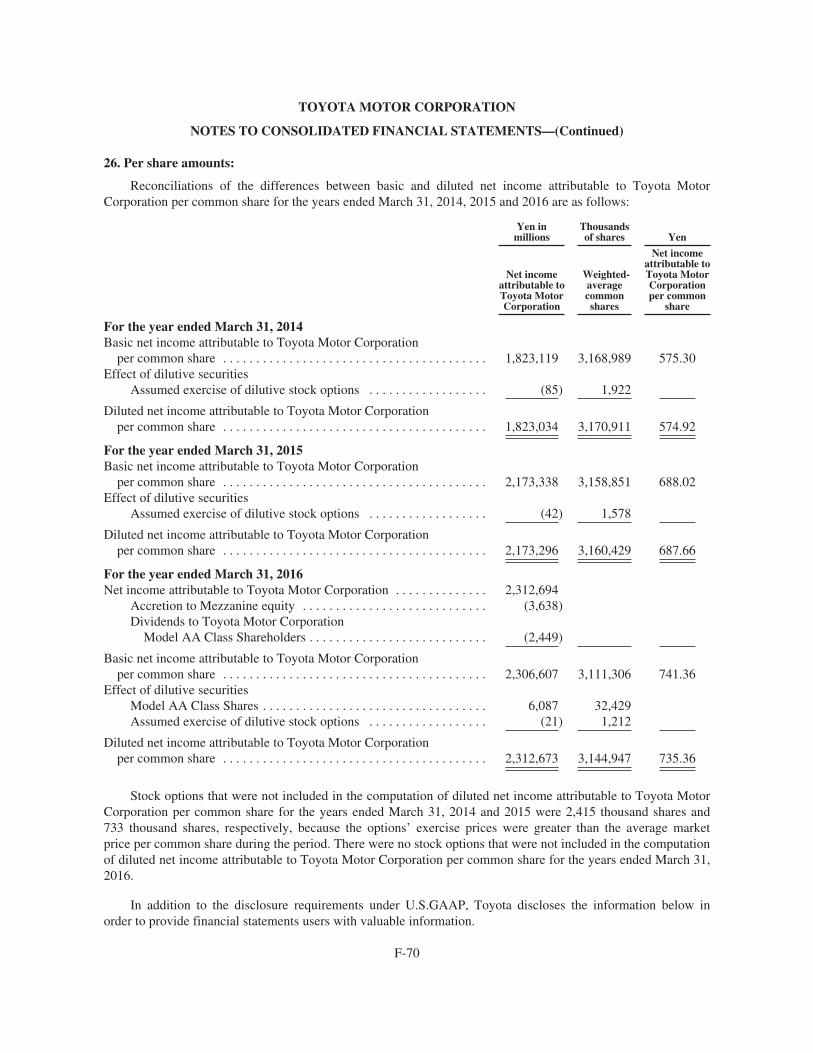
TOYOTA MOTOR CORPORATION
NOTES TO CONSOLIDATED FINANCIAL STATEMENTS—(Continued)
26. Per share amounts:
Reconciliations of the differences between basic and diluted net income attributable to Toyota MotorCorporation per common share for the years ended March 31, 2014, 2015 and 2016 are as follows:
Yen inmillions
Thousandsof shares Yen
Net incomeattributable toToyota MotorCorporation
Weighted-averagecommonshares
Net incomeattributable toToyota MotorCorporationper common
share
For the year ended March 31, 2014Basic net income attributable to Toyota Motor Corporation
per common share . . . . . . . . . . . . . . . . . . . . . . . . . . . . . . . . . . . . . . . . 1,823,119 3,168,989 575.30Effect of dilutive securities
Assumed exercise of dilutive stock options . . . . . . . . . . . . . . . . . . (85) 1,922
Diluted net income attributable to Toyota Motor Corporationper common share . . . . . . . . . . . . . . . . . . . . . . . . . . . . . . . . . . . . . . . . 1,823,034 3,170,911 574.92
For the year ended March 31, 2015Basic net income attributable to Toyota Motor Corporation
per common share . . . . . . . . . . . . . . . . . . . . . . . . . . . . . . . . . . . . . . . . 2,173,338 3,158,851 688.02Effect of dilutive securities
Assumed exercise of dilutive stock options . . . . . . . . . . . . . . . . . . (42) 1,578
Diluted net income attributable to Toyota Motor Corporationper common share . . . . . . . . . . . . . . . . . . . . . . . . . . . . . . . . . . . . . . . . 2,173,296 3,160,429 687.66
For the year ended March 31, 2016Net income attributable to Toyota Motor Corporation . . . . . . . . . . . . . . 2,312,694
Accretion to Mezzanine equity . . . . . . . . . . . . . . . . . . . . . . . . . . . . (3,638)Dividends to Toyota Motor Corporation
Model AA Class Shareholders . . . . . . . . . . . . . . . . . . . . . . . . . . . (2,449)
Basic net income attributable to Toyota Motor Corporationper common share . . . . . . . . . . . . . . . . . . . . . . . . . . . . . . . . . . . . . . . . 2,306,607 3,111,306 741.36
Effect of dilutive securitiesModel AA Class Shares . . . . . . . . . . . . . . . . . . . . . . . . . . . . . . . . . . 6,087 32,429Assumed exercise of dilutive stock options . . . . . . . . . . . . . . . . . . (21) 1,212
Diluted net income attributable to Toyota Motor Corporationper common share . . . . . . . . . . . . . . . . . . . . . . . . . . . . . . . . . . . . . . . . 2,312,673 3,144,947 735.36
Stock options that were not included in the computation of diluted net income attributable to Toyota MotorCorporation per common share for the years ended March 31, 2014 and 2015 were 2,415 thousand shares and733 thousand shares, respectively, because the options’ exercise prices were greater than the average marketprice per common share during the period. There were no stock options that were not included in the computationof diluted net income attributable to Toyota Motor Corporation per common share for the years ended March 31,2016.
In addition to the disclosure requirements under U.S.GAAP, Toyota discloses the information below inorder to provide financial statements users with valuable information.
F-70
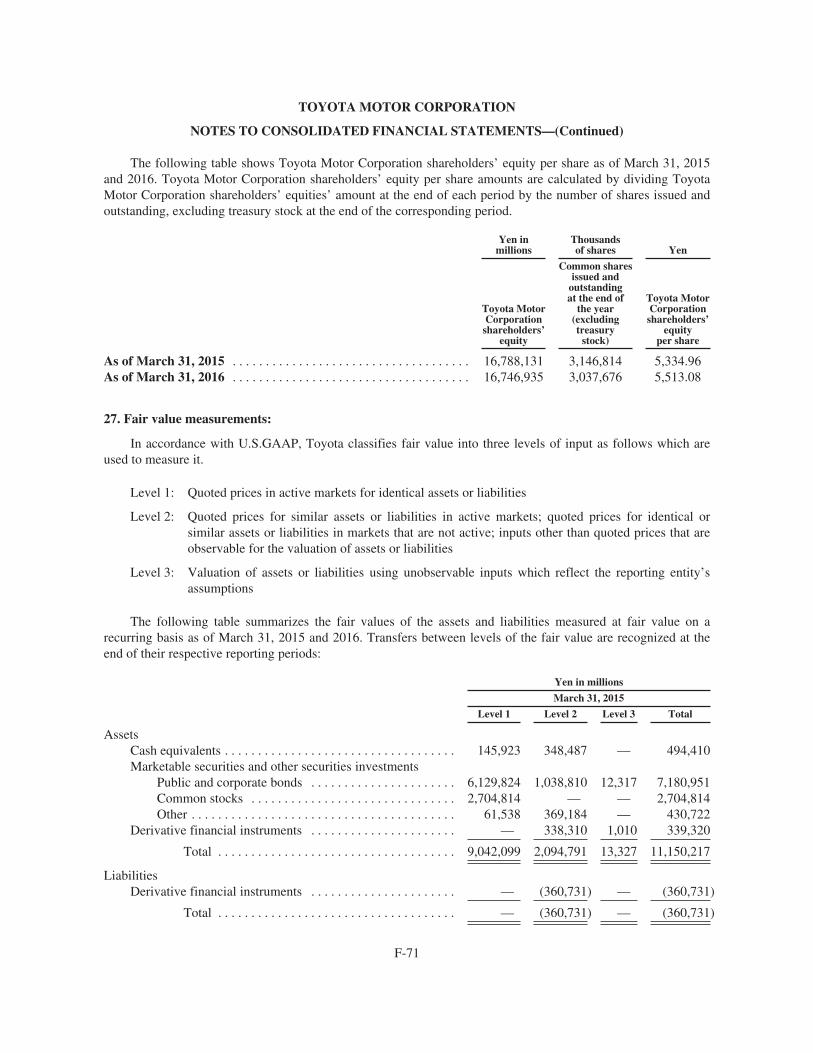
TOYOTA MOTOR CORPORATION
NOTES TO CONSOLIDATED FINANCIAL STATEMENTS—(Continued)
The following table shows Toyota Motor Corporation shareholders’ equity per share as of March 31, 2015and 2016. Toyota Motor Corporation shareholders’ equity per share amounts are calculated by dividing ToyotaMotor Corporation shareholders’ equities’ amount at the end of each period by the number of shares issued andoutstanding, excluding treasury stock at the end of the corresponding period.
Yen inmillions
Thousandsof shares Yen
Toyota MotorCorporationshareholders’
equity
Common sharesissued and
outstandingat the end of
the year(excludingtreasury
stock)
Toyota MotorCorporationshareholders’
equityper share
As of March 31, 2015 . . . . . . . . . . . . . . . . . . . . . . . . . . . . . . . . . . . . 16,788,131 3,146,814 5,334.96As of March 31, 2016 . . . . . . . . . . . . . . . . . . . . . . . . . . . . . . . . . . . . 16,746,935 3,037,676 5,513.08
27. Fair value measurements:
In accordance with U.S.GAAP, Toyota classifies fair value into three levels of input as follows which areused to measure it.
Level 1: Quoted prices in active markets for identical assets or liabilities
Level 2: Quoted prices for similar assets or liabilities in active markets; quoted prices for identical orsimilar assets or liabilities in markets that are not active; inputs other than quoted prices that areobservable for the valuation of assets or liabilities
Level 3: Valuation of assets or liabilities using unobservable inputs which reflect the reporting entity’sassumptions
The following table summarizes the fair values of the assets and liabilities measured at fair value on arecurring basis as of March 31, 2015 and 2016. Transfers between levels of the fair value are recognized at theend of their respective reporting periods:
Yen in millions
March 31, 2015
Level 1 Level 2 Level 3 Total
AssetsCash equivalents . . . . . . . . . . . . . . . . . . . . . . . . . . . . . . . . . . . 145,923 348,487 — 494,410Marketable securities and other securities investments
Public and corporate bonds . . . . . . . . . . . . . . . . . . . . . . 6,129,824 1,038,810 12,317 7,180,951Common stocks . . . . . . . . . . . . . . . . . . . . . . . . . . . . . . . 2,704,814 — — 2,704,814Other . . . . . . . . . . . . . . . . . . . . . . . . . . . . . . . . . . . . . . . . 61,538 369,184 — 430,722
Derivative financial instruments . . . . . . . . . . . . . . . . . . . . . . — 338,310 1,010 339,320
Total . . . . . . . . . . . . . . . . . . . . . . . . . . . . . . . . . . . . 9,042,099 2,094,791 13,327 11,150,217
LiabilitiesDerivative financial instruments . . . . . . . . . . . . . . . . . . . . . . — (360,731) — (360,731)
Total . . . . . . . . . . . . . . . . . . . . . . . . . . . . . . . . . . . . — (360,731) — (360,731)
F-71
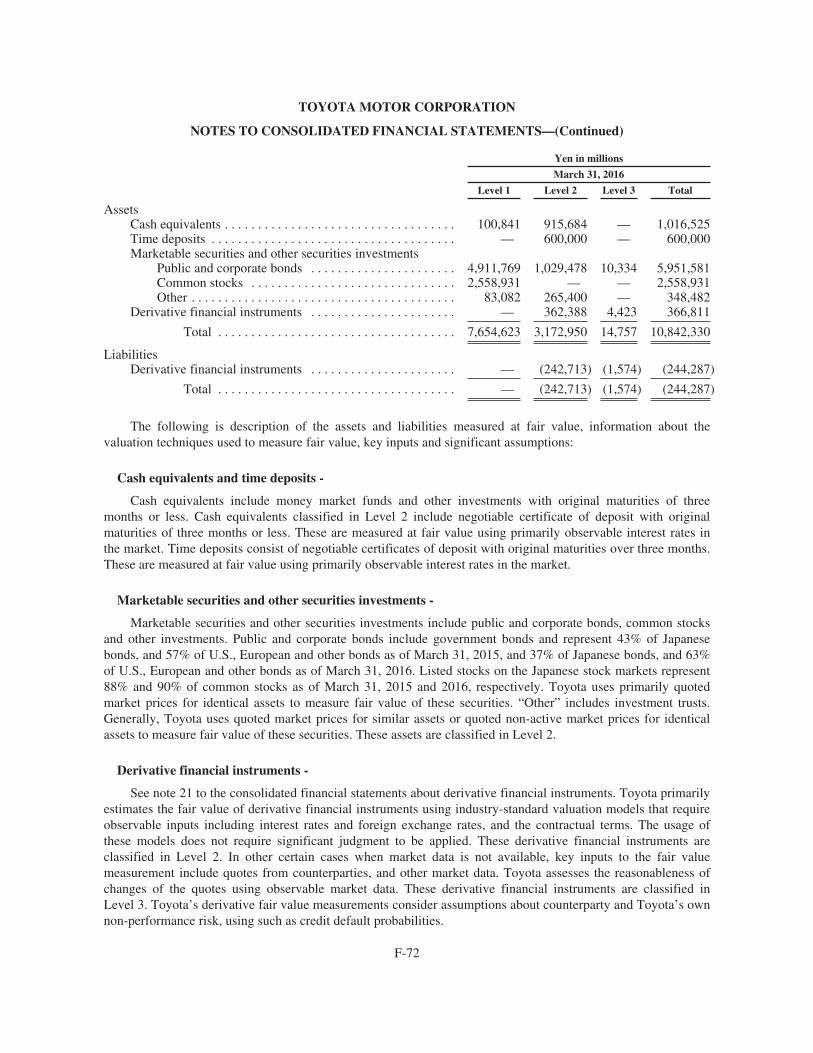
TOYOTA MOTOR CORPORATION
NOTES TO CONSOLIDATED FINANCIAL STATEMENTS—(Continued)
Yen in millions
March 31, 2016
Level 1 Level 2 Level 3 Total
AssetsCash equivalents . . . . . . . . . . . . . . . . . . . . . . . . . . . . . . . . . . . 100,841 915,684 — 1,016,525Time deposits . . . . . . . . . . . . . . . . . . . . . . . . . . . . . . . . . . . . . — 600,000 — 600,000Marketable securities and other securities investments
Public and corporate bonds . . . . . . . . . . . . . . . . . . . . . . 4,911,769 1,029,478 10,334 5,951,581Common stocks . . . . . . . . . . . . . . . . . . . . . . . . . . . . . . . 2,558,931 — — 2,558,931Other . . . . . . . . . . . . . . . . . . . . . . . . . . . . . . . . . . . . . . . . 83,082 265,400 — 348,482
Derivative financial instruments . . . . . . . . . . . . . . . . . . . . . . — 362,388 4,423 366,811
Total . . . . . . . . . . . . . . . . . . . . . . . . . . . . . . . . . . . . 7,654,623 3,172,950 14,757 10,842,330
LiabilitiesDerivative financial instruments . . . . . . . . . . . . . . . . . . . . . . — (242,713) (1,574) (244,287)
Total . . . . . . . . . . . . . . . . . . . . . . . . . . . . . . . . . . . . — (242,713) (1,574) (244,287)
The following is description of the assets and liabilities measured at fair value, information about thevaluation techniques used to measure fair value, key inputs and significant assumptions:
Cash equivalents and time deposits -
Cash equivalents include money market funds and other investments with original maturities of threemonths or less. Cash equivalents classified in Level 2 include negotiable certificate of deposit with originalmaturities of three months or less. These are measured at fair value using primarily observable interest rates inthe market. Time deposits consist of negotiable certificates of deposit with original maturities over three months.These are measured at fair value using primarily observable interest rates in the market.
Marketable securities and other securities investments -
Marketable securities and other securities investments include public and corporate bonds, common stocksand other investments. Public and corporate bonds include government bonds and represent 43% of Japanesebonds, and 57% of U.S., European and other bonds as of March 31, 2015, and 37% of Japanese bonds, and 63%of U.S., European and other bonds as of March 31, 2016. Listed stocks on the Japanese stock markets represent88% and 90% of common stocks as of March 31, 2015 and 2016, respectively. Toyota uses primarily quotedmarket prices for identical assets to measure fair value of these securities. “Other” includes investment trusts.Generally, Toyota uses quoted market prices for similar assets or quoted non-active market prices for identicalassets to measure fair value of these securities. These assets are classified in Level 2.
Derivative financial instruments -
See note 21 to the consolidated financial statements about derivative financial instruments. Toyota primarilyestimates the fair value of derivative financial instruments using industry-standard valuation models that requireobservable inputs including interest rates and foreign exchange rates, and the contractual terms. The usage ofthese models does not require significant judgment to be applied. These derivative financial instruments areclassified in Level 2. In other certain cases when market data is not available, key inputs to the fair valuemeasurement include quotes from counterparties, and other market data. Toyota assesses the reasonableness ofchanges of the quotes using observable market data. These derivative financial instruments are classified inLevel 3. Toyota’s derivative fair value measurements consider assumptions about counterparty and Toyota’s ownnon-performance risk, using such as credit default probabilities.
F-72
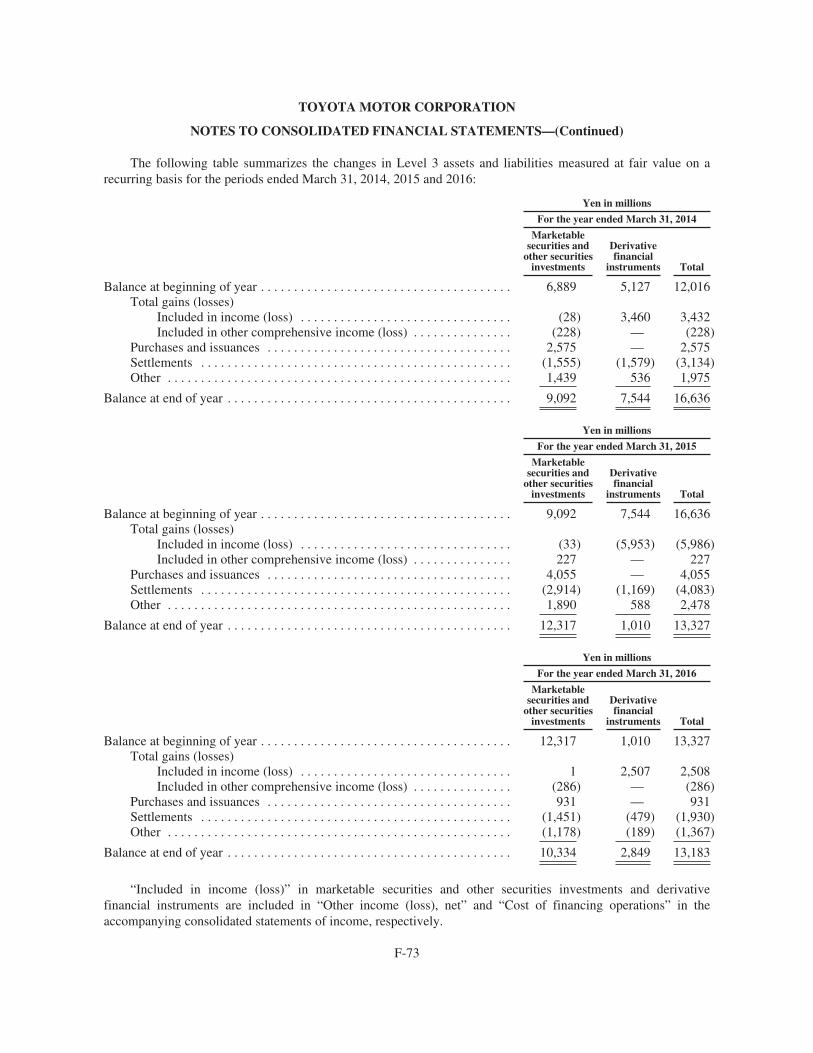
TOYOTA MOTOR CORPORATION
NOTES TO CONSOLIDATED FINANCIAL STATEMENTS—(Continued)
The following table summarizes the changes in Level 3 assets and liabilities measured at fair value on arecurring basis for the periods ended March 31, 2014, 2015 and 2016:
Yen in millions
For the year ended March 31, 2014
Marketablesecurities and
other securitiesinvestments
Derivativefinancial
instruments Total
Balance at beginning of year . . . . . . . . . . . . . . . . . . . . . . . . . . . . . . . . . . . . . . 6,889 5,127 12,016Total gains (losses)
Included in income (loss) . . . . . . . . . . . . . . . . . . . . . . . . . . . . . . . . (28) 3,460 3,432Included in other comprehensive income (loss) . . . . . . . . . . . . . . . (228) — (228)
Purchases and issuances . . . . . . . . . . . . . . . . . . . . . . . . . . . . . . . . . . . . . 2,575 — 2,575Settlements . . . . . . . . . . . . . . . . . . . . . . . . . . . . . . . . . . . . . . . . . . . . . . . (1,555) (1,579) (3,134)Other . . . . . . . . . . . . . . . . . . . . . . . . . . . . . . . . . . . . . . . . . . . . . . . . . . . . 1,439 536 1,975
Balance at end of year . . . . . . . . . . . . . . . . . . . . . . . . . . . . . . . . . . . . . . . . . . . 9,092 7,544 16,636
Yen in millions
For the year ended March 31, 2015
Marketablesecurities and
other securitiesinvestments
Derivativefinancial
instruments Total
Balance at beginning of year . . . . . . . . . . . . . . . . . . . . . . . . . . . . . . . . . . . . . . 9,092 7,544 16,636Total gains (losses)
Included in income (loss) . . . . . . . . . . . . . . . . . . . . . . . . . . . . . . . . (33) (5,953) (5,986)Included in other comprehensive income (loss) . . . . . . . . . . . . . . . 227 — 227
Purchases and issuances . . . . . . . . . . . . . . . . . . . . . . . . . . . . . . . . . . . . . 4,055 — 4,055Settlements . . . . . . . . . . . . . . . . . . . . . . . . . . . . . . . . . . . . . . . . . . . . . . . (2,914) (1,169) (4,083)Other . . . . . . . . . . . . . . . . . . . . . . . . . . . . . . . . . . . . . . . . . . . . . . . . . . . . 1,890 588 2,478
Balance at end of year . . . . . . . . . . . . . . . . . . . . . . . . . . . . . . . . . . . . . . . . . . . 12,317 1,010 13,327
Yen in millions
For the year ended March 31, 2016
Marketablesecurities and
other securitiesinvestments
Derivativefinancial
instruments Total
Balance at beginning of year . . . . . . . . . . . . . . . . . . . . . . . . . . . . . . . . . . . . . . 12,317 1,010 13,327Total gains (losses)
Included in income (loss) . . . . . . . . . . . . . . . . . . . . . . . . . . . . . . . . 1 2,507 2,508Included in other comprehensive income (loss) . . . . . . . . . . . . . . . (286) — (286)
Purchases and issuances . . . . . . . . . . . . . . . . . . . . . . . . . . . . . . . . . . . . . 931 — 931Settlements . . . . . . . . . . . . . . . . . . . . . . . . . . . . . . . . . . . . . . . . . . . . . . . (1,451) (479) (1,930)Other . . . . . . . . . . . . . . . . . . . . . . . . . . . . . . . . . . . . . . . . . . . . . . . . . . . . (1,178) (189) (1,367)
Balance at end of year . . . . . . . . . . . . . . . . . . . . . . . . . . . . . . . . . . . . . . . . . . . 10,334 2,849 13,183
“Included in income (loss)” in marketable securities and other securities investments and derivativefinancial instruments are included in “Other income (loss), net” and “Cost of financing operations” in theaccompanying consolidated statements of income, respectively.
F-73
TOYOTA MOTOR CORPORATION
NOTES TO CONSOLIDATED FINANCIAL STATEMENTS—(Continued)
In the reconciliation table above, derivative financial instruments are presented net of assets and liabilities.“Other” includes the currency translation adjustments for the years ended March 31, 2014, 2015 and 2016.
As of March 31, 2016, the Level 3 assets and liabilities measured at fair value on a recurring basis are notsignificant.
Certain assets and liabilities are measured at fair value on a nonrecurring basis. During the years endedMarch 31, 2015 and 2016, Toyota measured certain finance receivables at fair value of ¥40,901 million and¥57,505 million based on the collateral value, resulting in loss of ¥2,790 million and gain of ¥249 million,respectively. This fair value measurement on a nonrecurring basis is classified in Level 3. See note 22 to theconsolidated financial statements for the fair value measurement. These Level 3 financial assets are notsignificant.
28. Restructuring charges and asset impairments:
In February 2014, TMC and Toyota Motor Corporation Australia Ltd., its production and sales subsidiary inAustralia, decided to end their vehicle and engine production in Australia by the end of 2017. In fiscal 2014,Toyota recorded costs and expenses of ¥83,073 million relating to the end of production in Australia in theautomotive segment. These costs and expenses consist primarily of long-lived assets impairment charges of¥47,190 million and other restructuring charges of ¥35,883 million. In fiscal 2015 and 2016, Toyota recordedadditional charges which were not material. Toyota expects to incur additional charges in fiscal 2017 and 2018which are not material to Toyota.
29. Significant subsequent events:
Suspension of operations on vehicle assembly lines in Japan -
Due to parts shortages resulting from the Kumamoto Earthquake that struck Japan’s island of Kyushu inApril 2016, production on vehicle assembly lines in Japan was suspended in stages starting on April 18, 2016 andproduction has been restarted in stages starting on April 25. It is uncertain how this suspension will affectToyota’s financial results.
Repurchase of share -
At the Meeting of the Board of Directors held on May 11, 2016, TMC resolved to repurchase the CommonShares pursuant to Article 156 of the Companies Act as applied to Article 165, Paragraph 3 of the CompaniesAct, as set forth below.
Reason for repurchasing shares -
To return capital to shareholders in addition to promoting capital efficiency and agile capital policy in viewof the business environment.
Details of matters relating to repurchase -
Kind of stock to be repurchased . . . . . . . . . . . . . . . Common stock of TMCNumber of shares to be repurchased . . . . . . . . . . . . 100,000,000 shares (maximum)Total purchase price for repurchase of shares . . . . . ¥500,000 million (maximum)Method of acquisition . . . . . . . . . . . . . . . . . . . . . . . Market purchase through a trust bankPeriod of repurchase . . . . . . . . . . . . . . . . . . . . . . . . From May 18, 2016 to November 17, 2016
F-74
ITEM 19. EXHIBITS
Index to Exhibits
1.1 Amended and Restated Articles of Incorporation of the Registrant (English translation)(incorporated by reference to Exhibit 1.1 to Toyota’s Annual Report on Form 20-F for the fiscalyear ended March 31, 2015, filed with the SEC on June 24, 2015 (file no. 001-14948))
1.2 Amended and Restated Regulations of the Board of Directors of the Registrant (Englishtranslation) (incorporated by reference to Exhibit 1.2 to Toyota’s Annual Report on Form 20-Ffor the fiscal year ended March 31, 2015, filed with the SEC on June 24, 2015 (file no. 001-14948))
1.3 Amended and Restated Regulations of the Audit & Supervisory Board of the Registrant (Englishtranslation)
2.1 Amended and Restated Share Handling Regulations of the Registrant (English translation)(incorporated by reference to Exhibit 2.1 to Toyota’s Annual Report on Form 20-F for the fiscalyear ended March 31, 2015, filed with the SEC on June 24, 2015 (file no. 001-14948))
2.2 Form of Deposit Agreement among the Registrant, The Bank of New York (predecessor of TheBank of New York Mellon), as depositary, and the owners and beneficial owners from time totime of American Depositary Receipts, including the form of American Depositary Receipt(incorporated by reference to Exhibit 1 to Toyota’s Registration Statement on Form F-6, filedwith the SEC on November 7, 2006 (file no. 333-138477))
2.3 Form of ADR (included in Exhibit 2.2)
8.1 List of Principal Subsidiaries (See “Organizational Structure” in “Item 4. Information on theCompany”)
11.1 Code of Ethics of the Registrant applicable to its members of the board of directors and managingofficers, including its principal executive officer, principal financial officer, principal accountingofficer or controller, or persons performing similar functions (English translation)
12.1 Certifications of the Registrant’s Chairman of the Board of Directors and Executive VicePresident, Member of the Board pursuant to Section 302 of the Sarbanes-Oxley Act
13.1 Certifications of the Registrant’s Chairman of the Board of Directors and Executive VicePresident, Member of the Board pursuant to Section 906 of the Sarbanes-Oxley Act
15.1 Consent of Independent Registered Public Accounting Firm
101.INS XBRL Instance Document
101.SCH XBRL Taxonomy Extension Schema
101.CAL XBRL Taxonomy Extension Calculation Linkbase
101.DEF XBRL Taxonomy Extension Definition Linkbase
101.LAB XBRL Taxonomy Extension Label Linkbase
101.PRE XBRL Taxonomy Extension Presentation Linkbase
137
SIGNATURES
The registrant hereby certifies that it meets all of the requirements for filing on Form 20-F and that it hasduly caused and authorized the undersigned to sign this annual report on its behalf.
TOYOTA MOTOR CORPORATION
By: /s/ TETSUYA OTAKE
Name: Tetsuya Otake
Title: Managing Officer
Date: June 24, 2016
Exhibit 1.3
(TRANSLATION)
REGULATIONS OFTHE AUDIT & SUPERVISORY BOARD
OFTOYOTA MOTOR CORPORATION
Established: September 27, 1994As last amended on December 16, 2015
Article 1. (Regulations of the Audit & Supervisory Board)
Except as provided for by laws, ordinances or the Articles of Incorporation, the matters relating to the Audit& Supervisory Board of the Corporation shall be governed by the provisions of these Regulations.
Article 2. (Composition)
The Audit & Supervisory Board shall be composed of all the Audit & Supervisory Board Members.
Article 3. (Person Authorized to Convene the Meeting and Notice of the Meeting)
1. A meeting of the Audit & Supervisory Board shall be convened by the Audit & Supervisory Board Memberwho has been determined in advance by a resolution at the meeting of the Audit & Supervisory Board;provided, however, that the other Audit & Supervisory Board Members shall not be prevented fromconvening the meeting thereof.
2. In order to convene a meeting of the Audit & Supervisory Board, such Audit & Supervisory Board Memberreferred to in the preceding paragraph shall dispatch a notice thereof to each Audit & Supervisory BoardMember at least three (3) days before the date of the meeting, provided that, in the case of urgency, suchperiod may be shortened.
3. Notwithstanding the provision of the preceding paragraph, the meeting of the Audit & Supervisory Boardmay be held without the convening procedure, if so consented to by all the Audit & Supervisory BoardMembers.
Article 4. (Chairmanship and Method of Resolution)
1. The chairmanship of the meeting of the Audit & Supervisory Board shall be assumed by the Audit &Supervisory Board Member who has been determined in advance by a resolution at the meeting of the Audit& Supervisory Board.
2. The resolutions of the Audit & Supervisory Board shall be adopted at its meeting by a majority of the Audit& Supervisory Board Members.
3. The following matters may be unanimously resolved at the meeting of the Audit & Supervisory Boardinstead of the consent of all the Audit & Supervisory Board Members:
(1) Dismissal of the Accounting Auditor(s) in accordance with Article 340 of the Companies Act;
(2) Consent to a submission, by Member(s) of the Board of Directors, of the agenda at the general meetingof shareholders or the meeting of the Board of Directors concerning the exemption of Member(s) of theBoard of Directors from their liabilities (including any amendment to the Articles of Incorporation forsuch purpose) in accordance with Articles 425 to 427 of the Companies Act; and
(3) Consent to the participation of the Corporation in litigations as to the pursuit of liabilities of theMember(s) of the Board of Directors, etc. in order to support the Member(s) of the Board of Directorsin such litigations in accordance with Paragraph 2 of Article 849 of the Companies Act.
Article 5. (Matters to be Resolved)
1. The following matters shall be subject to the resolution at the meeting of the Audit & Supervisory Board:
(1) Matters so provided for by laws or ordinances;
(2) Matters so provided for in the Articles of Incorporation; and
(3) Other important matters pertaining to the execution of their duties by the Audit & Supervisory BoardMembers.
Article 6. (Matters to be Reported)
1. The Audit & Supervisory Board Members shall make reports at the meeting of the Audit & SupervisoryBoard on the following matters:
(1) Matters so provided for by laws or ordinances; and
(2) Other matters the Audit & Supervisory Board may deem necessary.
2. If any Audit & Supervisory Board Member receives a report of any matter(s) from Member(s) of the Boardof Directors and/or the Accounting Auditor(s) required by laws or ordinances to be reported to the Audit &Supervisory Board, he/she shall report the matter(s) to, or make such Member(s) of the Board of Directorsand/or the Accounting Auditor(s) report the matter(s) to, the Audit & Supervisory Board.
3. Notwithstanding the provisions of the preceding two (2) paragraphs, in case that the Audit & SupervisoryBoard Member(s), the Member(s) of the Board of Directors or the Accounting Auditor(s) notifies all theAudit & Supervisory Board Members of the matter(s), such matter(s) shall not be required to be reported atthe meeting of the Audit & Supervisory Board.
Article 7. (Audit Report)
1. Pursuant to laws or ordinances, the Audit & Supervisory Board shall make an audit report upon deliberationbased on the audit reports prepared by each Audit & Supervisory Board Member.
2. Any Audit & Supervisory Board Member may make note of his/her opinion in the audit report prepared bythe Audit & Supervisory Board if the details of his/her audit report differ from those of the Audit &Supervisory Board referred to in the preceding paragraph.
Article 8. (Minutes)
1. Pursuant to laws or ordinances, the minutes shall be prepared each time a meeting of the Audit &Supervisory Board is held.
2. With regards to the matters not required to be reported at the meeting of the Audit & Supervisory Boardpursuant to Paragraph 3 of Article 6 hereof, such Audit & Supervisory Board Member as separatelydetermined shall prepare the minutes thereon in accordance with laws or ordinances.
Supplementary Provisions
Article 1. (Effective Date)
These Regulations shall become effective as of December 16, 2015.
Article 2. (Amendment to these Regulations)
Any amendment to these Regulations shall be made by a resolution of the Audit & Supervisory Board.
MATTERS TO BE SUBMITTED TOTHE AUDIT & SUPERVISORY BOARD
Note: The Act: the Companies ActThe Enforcement Regulations: the Enforcement Regulations of the Companies ActThe Accounting Regulations: the Corporation Accounting Regulations
1. Matters to be resolved (Matters in relation to Article 5 of the Regulations of the Audit & Supervisory Board)
(1) Matters provided for in laws or ordinances
Items Relevant Articles of Applicable Law
(1) Principles and execution plan of auditing Article 390 (2)(c) of the Act
(2) Request for reports on the execution of theduties of the Audit & Supervisory BoardMember(s) to the Audit & Supervisory Board
Article 390 (4) of the Act
(3) Consent to the following actions taken byMembers of the Board of Directors (with respectto (ii), the reason for consent is also a matter tobe resolved)
(i) Submitting proposed resolution concerningthe appointment of an Audit & SupervisoryBoard Member or a substitute Audit &Supervisory Board Member to a generalmeeting of shareholders
Articles 343 (1) and (3), and 329 (3) of the Act
(ii) Determining the remuneration, etc. of anAccounting Auditor or a person who istemporarily acting as an AccountingAuditor
Article 399 (1) and (2) of the Act
(4) Request for Members of the Board of Directorsto take the following actions
(i) Making the appointment of an Audit &Supervisory Board Member or a substituteAudit & Supervisory Board Member theagenda of a general meeting ofshareholders
Article 343 (2) and (3) of the Act
(ii) Submitting proposed resolution concerningthe appointment of an Audit & SupervisoryBoard Member or a substitute Audit &Supervisory Board Member to a generalmeeting of shareholders
Article 343 (2) and (3) of the Act
(5) Determining the policy for determining thedismissal and non-reappointment of anAccounting Auditor
Article 126 (d) of the Enforcement Regulations
(6) Election of an Audit & Supervisory BoardMember to be in charge of reporting thedismissal of any Accounting Auditor at ageneral meeting of shareholders
Article 340 (3) and (4) of the Act
Items Relevant Articles of Applicable Law
(7) Determining the appropriateness ofreappointment of Accounting Auditor anddetermining the details of the agenda at ageneral meeting of shareholders concerning thedismissal and non-reappointment of anAccounting Auditor if such Accounting Auditoris not being reappointed
Article 344 (1) and (3) of the Act
(8) Determining the agenda at a general meeting ofshareholders concerning the appointment of anAccounting Auditor
Article 344 (1) and (3) of the Act
(9) Appointment and dismissal of any person who isto temporarily act as an Accounting Auditor
Article 346 (4), (5) and (6) of the Act
(10) Election and dismissal of a full-time Audit &Supervisory Board Member
Article 390 (2)(b) of the Act
(11) Election and dismissal of a Specific Audit &Supervisory Board Member (Tokutei-kansayaku)
Article 132 (5)(b)(i) of the EnforcementRegulations, Article 130 (5)(b)(i) of theAccounting Regulations
(2) Matters provided for in the Articles of Incorporation
Items Relevant Articles of the Articles of Incorporation
(1) Amendment to the Regulations of the Audit &Supervisory Board
Article 40 (3) of the Articles of Incorporation
(3) Other important matters pertaining to execution of the duties of Audit & Supervisory Board Member
Items
(1) Election of a Chairman of meetings of the Audit & Supervisory Board
(2) Election of a person authorized to convene a meeting of the Audit & Supervisory Board
(3) Election of the Audit & Supervisory Board Member to be in charge of giving prior consent to thechanges of the organization and personnel of the Audit & Supervisory Board Office
(4) Prior approval of auditing services and non-audit services pursuant to Section 202 of Sarbanes-Oxley Act
(5) Election of the Audit & Supervisory Board Member to be in charge of giving approval to a requestfor revisions to the pre-approval of auditing services and non-audit services pursuant toSection 202 of Sarbanes-Oxley Act
(6) Other significant matters with respect to the execution of the duties of the Audit & SupervisoryBoard Member
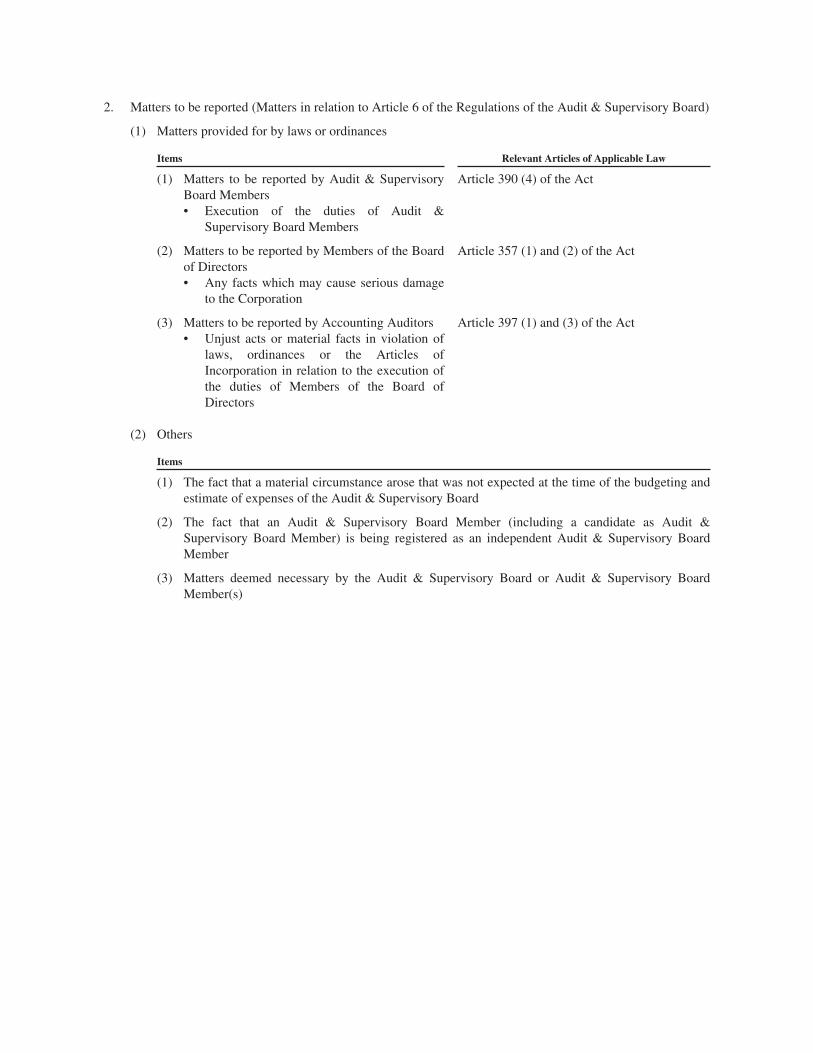
2. Matters to be reported (Matters in relation to Article 6 of the Regulations of the Audit & Supervisory Board)
(1) Matters provided for by laws or ordinances
Items Relevant Articles of Applicable Law
(1) Matters to be reported by Audit & SupervisoryBoard Members• Execution of the duties of Audit &
Supervisory Board Members
Article 390 (4) of the Act
(2) Matters to be reported by Members of the Boardof Directors• Any facts which may cause serious damage
to the Corporation
Article 357 (1) and (2) of the Act
(3) Matters to be reported by Accounting Auditors• Unjust acts or material facts in violation of
laws, ordinances or the Articles ofIncorporation in relation to the execution ofthe duties of Members of the Board ofDirectors
Article 397 (1) and (3) of the Act
(2) Others
Items
(1) The fact that a material circumstance arose that was not expected at the time of the budgeting andestimate of expenses of the Audit & Supervisory Board
(2) The fact that an Audit & Supervisory Board Member (including a candidate as Audit &Supervisory Board Member) is being registered as an independent Audit & Supervisory BoardMember
(3) Matters deemed necessary by the Audit & Supervisory Board or Audit & Supervisory BoardMember(s)
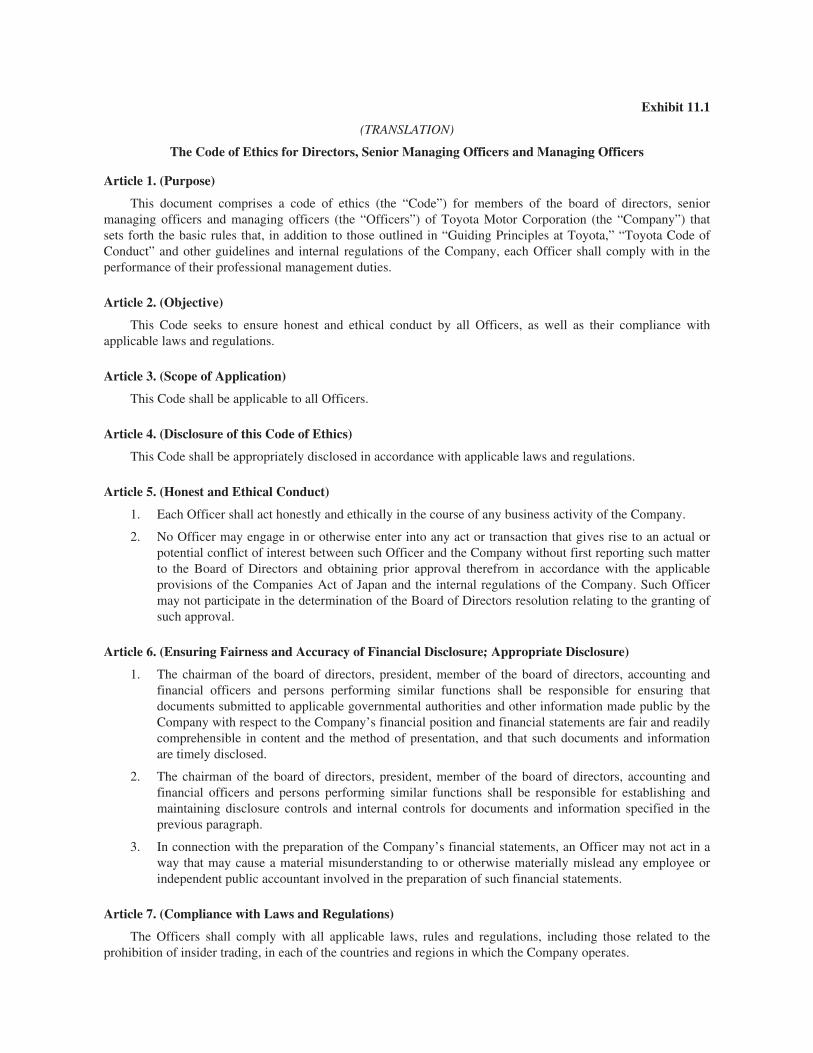
Exhibit 11.1
(TRANSLATION)
The Code of Ethics for Directors, Senior Managing Officers and Managing Officers
Article 1. (Purpose)
This document comprises a code of ethics (the “Code”) for members of the board of directors, seniormanaging officers and managing officers (the “Officers”) of Toyota Motor Corporation (the “Company”) thatsets forth the basic rules that, in addition to those outlined in “Guiding Principles at Toyota,” “Toyota Code ofConduct” and other guidelines and internal regulations of the Company, each Officer shall comply with in theperformance of their professional management duties.
Article 2. (Objective)
This Code seeks to ensure honest and ethical conduct by all Officers, as well as their compliance withapplicable laws and regulations.
Article 3. (Scope of Application)
This Code shall be applicable to all Officers.
Article 4. (Disclosure of this Code of Ethics)
This Code shall be appropriately disclosed in accordance with applicable laws and regulations.
Article 5. (Honest and Ethical Conduct)
1. Each Officer shall act honestly and ethically in the course of any business activity of the Company.
2. No Officer may engage in or otherwise enter into any act or transaction that gives rise to an actual orpotential conflict of interest between such Officer and the Company without first reporting such matterto the Board of Directors and obtaining prior approval therefrom in accordance with the applicableprovisions of the Companies Act of Japan and the internal regulations of the Company. Such Officermay not participate in the determination of the Board of Directors resolution relating to the granting ofsuch approval.
Article 6. (Ensuring Fairness and Accuracy of Financial Disclosure; Appropriate Disclosure)
1. The chairman of the board of directors, president, member of the board of directors, accounting andfinancial officers and persons performing similar functions shall be responsible for ensuring thatdocuments submitted to applicable governmental authorities and other information made public by theCompany with respect to the Company’s financial position and financial statements are fair and readilycomprehensible in content and the method of presentation, and that such documents and informationare timely disclosed.
2. The chairman of the board of directors, president, member of the board of directors, accounting andfinancial officers and persons performing similar functions shall be responsible for establishing andmaintaining disclosure controls and internal controls for documents and information specified in theprevious paragraph.
3. In connection with the preparation of the Company’s financial statements, an Officer may not act in away that may cause a material misunderstanding to or otherwise materially mislead any employee orindependent public accountant involved in the preparation of such financial statements.
Article 7. (Compliance with Laws and Regulations)
The Officers shall comply with all applicable laws, rules and regulations, including those related to theprohibition of insider trading, in each of the countries and regions in which the Company operates.
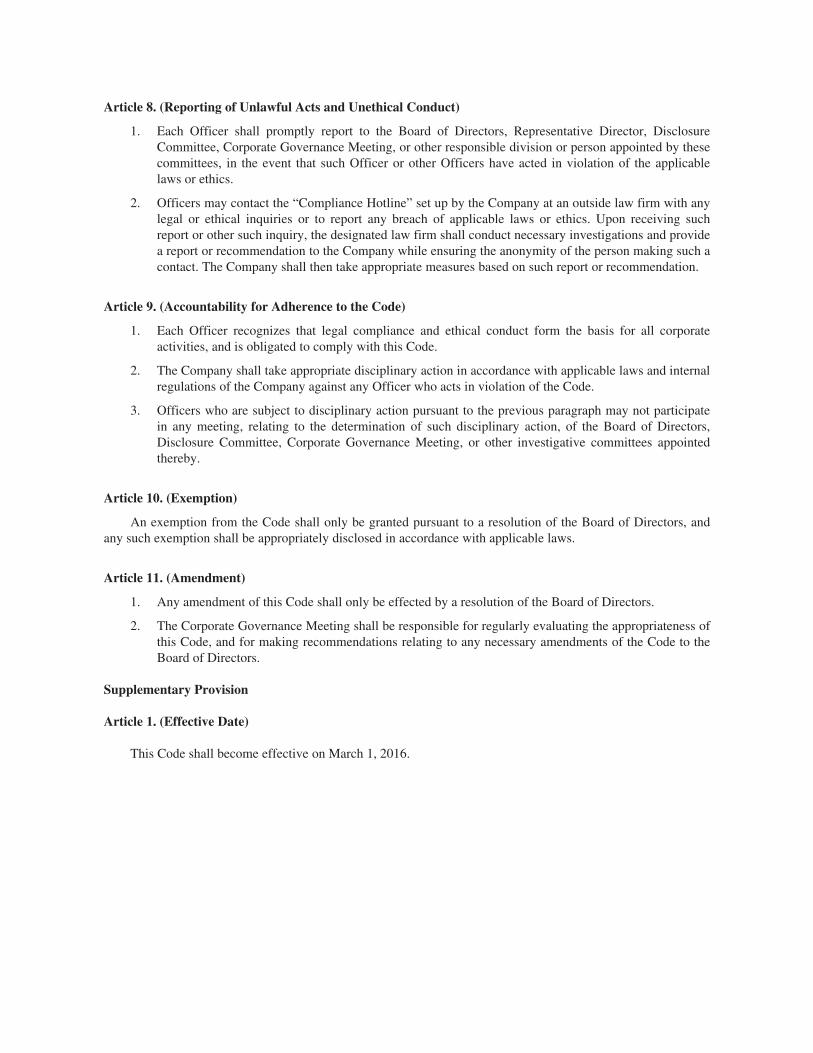
Article 8. (Reporting of Unlawful Acts and Unethical Conduct)
1. Each Officer shall promptly report to the Board of Directors, Representative Director, DisclosureCommittee, Corporate Governance Meeting, or other responsible division or person appointed by thesecommittees, in the event that such Officer or other Officers have acted in violation of the applicablelaws or ethics.
2. Officers may contact the “Compliance Hotline” set up by the Company at an outside law firm with anylegal or ethical inquiries or to report any breach of applicable laws or ethics. Upon receiving suchreport or other such inquiry, the designated law firm shall conduct necessary investigations and providea report or recommendation to the Company while ensuring the anonymity of the person making such acontact. The Company shall then take appropriate measures based on such report or recommendation.
Article 9. (Accountability for Adherence to the Code)
1. Each Officer recognizes that legal compliance and ethical conduct form the basis for all corporateactivities, and is obligated to comply with this Code.
2. The Company shall take appropriate disciplinary action in accordance with applicable laws and internalregulations of the Company against any Officer who acts in violation of the Code.
3. Officers who are subject to disciplinary action pursuant to the previous paragraph may not participatein any meeting, relating to the determination of such disciplinary action, of the Board of Directors,Disclosure Committee, Corporate Governance Meeting, or other investigative committees appointedthereby.
Article 10. (Exemption)
An exemption from the Code shall only be granted pursuant to a resolution of the Board of Directors, andany such exemption shall be appropriately disclosed in accordance with applicable laws.
Article 11. (Amendment)
1. Any amendment of this Code shall only be effected by a resolution of the Board of Directors.
2. The Corporate Governance Meeting shall be responsible for regularly evaluating the appropriateness ofthis Code, and for making recommendations relating to any necessary amendments of the Code to theBoard of Directors.
Supplementary Provision
Article 1. (Effective Date)
This Code shall become effective on March 1, 2016.
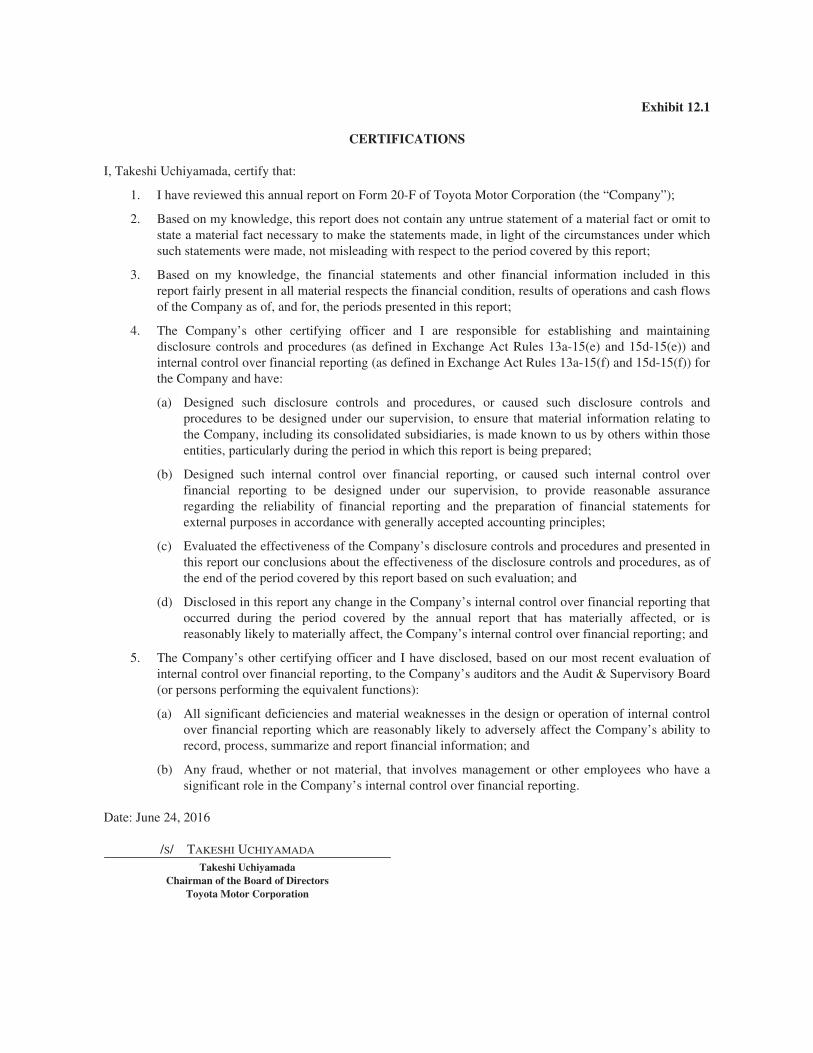
Exhibit 12.1
CERTIFICATIONS
I, Takeshi Uchiyamada, certify that:
1. I have reviewed this annual report on Form 20-F of Toyota Motor Corporation (the “Company”);
2. Based on my knowledge, this report does not contain any untrue statement of a material fact or omit tostate a material fact necessary to make the statements made, in light of the circumstances under whichsuch statements were made, not misleading with respect to the period covered by this report;
3. Based on my knowledge, the financial statements and other financial information included in thisreport fairly present in all material respects the financial condition, results of operations and cash flowsof the Company as of, and for, the periods presented in this report;
4. The Company’s other certifying officer and I are responsible for establishing and maintainingdisclosure controls and procedures (as defined in Exchange Act Rules 13a-15(e) and 15d-15(e)) andinternal control over financial reporting (as defined in Exchange Act Rules 13a-15(f) and 15d-15(f)) forthe Company and have:
(a) Designed such disclosure controls and procedures, or caused such disclosure controls andprocedures to be designed under our supervision, to ensure that material information relating tothe Company, including its consolidated subsidiaries, is made known to us by others within thoseentities, particularly during the period in which this report is being prepared;
(b) Designed such internal control over financial reporting, or caused such internal control overfinancial reporting to be designed under our supervision, to provide reasonable assuranceregarding the reliability of financial reporting and the preparation of financial statements forexternal purposes in accordance with generally accepted accounting principles;
(c) Evaluated the effectiveness of the Company’s disclosure controls and procedures and presented inthis report our conclusions about the effectiveness of the disclosure controls and procedures, as ofthe end of the period covered by this report based on such evaluation; and
(d) Disclosed in this report any change in the Company’s internal control over financial reporting thatoccurred during the period covered by the annual report that has materially affected, or isreasonably likely to materially affect, the Company’s internal control over financial reporting; and
5. The Company’s other certifying officer and I have disclosed, based on our most recent evaluation ofinternal control over financial reporting, to the Company’s auditors and the Audit & Supervisory Board(or persons performing the equivalent functions):
(a) All significant deficiencies and material weaknesses in the design or operation of internal controlover financial reporting which are reasonably likely to adversely affect the Company’s ability torecord, process, summarize and report financial information; and
(b) Any fraud, whether or not material, that involves management or other employees who have asignificant role in the Company’s internal control over financial reporting.
Date: June 24, 2016
/S/ TAKESHI UCHIYAMADA
Takeshi UchiyamadaChairman of the Board of Directors
Toyota Motor Corporation
CERTIFICATIONS
I, Takahiko Ijichi, certify that:
1. I have reviewed this annual report on Form 20-F of Toyota Motor Corporation (the “Company”);
2. Based on my knowledge, this report does not contain any untrue statement of a material fact or omit tostate a material fact necessary to make the statements made, in light of the circumstances under whichsuch statements were made, not misleading with respect to the period covered by this report;
3. Based on my knowledge, the financial statements and other financial information included in thisreport fairly present in all material respects the financial condition, results of operations and cash flowsof the Company as of, and for, the periods presented in this report;
4. The Company’s other certifying officer and I are responsible for establishing and maintainingdisclosure controls and procedures (as defined in Exchange Act Rules 13a-15(e) and 15d-15(e)) andinternal control over financial reporting (as defined in Exchange Act Rules 13a-15(f) and 15d-15(f)) forthe Company and have:
(a) Designed such disclosure controls and procedures, or caused such disclosure controls andprocedures to be designed under our supervision, to ensure that material information relating tothe Company, including its consolidated subsidiaries, is made known to us by others within thoseentities, particularly during the period in which this report is being prepared;
(b) Designed such internal control over financial reporting, or caused such internal control overfinancial reporting to be designed under our supervision, to provide reasonable assuranceregarding the reliability of financial reporting and the preparation of financial statements forexternal purposes in accordance with generally accepted accounting principles;
(c) Evaluated the effectiveness of the Company’s disclosure controls and procedures and presented inthis report our conclusions about the effectiveness of the disclosure controls and procedures, as ofthe end of the period covered by this report based on such evaluation; and
(d) Disclosed in this report any change in the Company’s internal control over financial reporting thatoccurred during the period covered by the annual report that has materially affected, or isreasonably likely to materially affect, the Company’s internal control over financial reporting; and
5. The Company’s other certifying officer and I have disclosed, based on our most recent evaluation ofinternal control over financial reporting, to the Company’s auditors and the Audit & Supervisory Board(or persons performing the equivalent functions):
(a) All significant deficiencies and material weaknesses in the design or operation of internal controlover financial reporting which are reasonably likely to adversely affect the Company’s ability torecord, process, summarize and report financial information; and
(b) Any fraud, whether or not material, that involves management or other employees who have asignificant role in the Company’s internal control over financial reporting.
Date: June 24, 2016
/S/ TAKAHIKO IJICHI
Takahiko IjichiExecutive Vice President, Member of the Board of Directors
Toyota Motor Corporation
Exhibit 13.1
CERTIFICATION
Pursuant to 18 U.S.C. Section 1350, as adopted pursuant to Section 906 of the Sarbanes-Oxley Act of 2002,each of the undersigned officers of Toyota Motor Corporation, a Japanese corporation (the “Company”), doeshereby certify that, to such officer’s knowledge:
1. The accompanying Annual Report of the Company on Form 20-F for the period ended March 31, 2016(the “Report”) fully complies with the requirements of Section 13(a) or 15(d) of the Securities Exchange Act of1934; and
2. Information contained in the Report fairly presents, in all material respects, the financial condition andresults of operations of the Company.
By: /S/ TAKESHI UCHIYAMADA
Name: Takeshi UchiyamadaTitle: Chairman of the Board of Directors
Date: June 24, 2016
By: /S/ TAKAHIKO IJICHI
Name: Takahiko IjichiTitle: Executive Vice President, Member of the Board of
Directors
Date: June 24, 2016
(A signed original of this written statement required by Section 906 has been provided to Toyota MotorCorporation and will be retained by Toyota Motor Corporation and furnished to the Securities and ExchangeCommission or its staff upon request.)
Exhibit 15.1
CONSENT OF INDEPENDENT REGISTERED PUBLIC ACCOUNTING FIRM
We hereby consent to the incorporation by reference in the Registration Statements on Form S-8(No. 333-125977, 333-107322, 333-143955, 333-160081 and 333-175377) of Toyota Motor Corporation of ourreport dated June 24, 2016 relating to the financial statements and the effectiveness of internal control overfinancial reporting, which appears in this Form 20-F.
/s/ PricewaterhouseCoopers AarataNagoya, JapanJune 24, 2016