trace level detection of pesticides on apple skin
TRANSCRIPT
Unlocking the Unknown with Applied Spectral Knowledge.
KEYWORDS• Pesticides
• Trace level detection
• Fruit skin
TECHNIQUES• Raman
• Surface Enhanced
Raman Spectroscopy
(SERS)
APPLICATIONS• Food quality and safety
• Fruit sorting
ApplicationNote
Trace Level Detection of Pesticides on Apple Skin
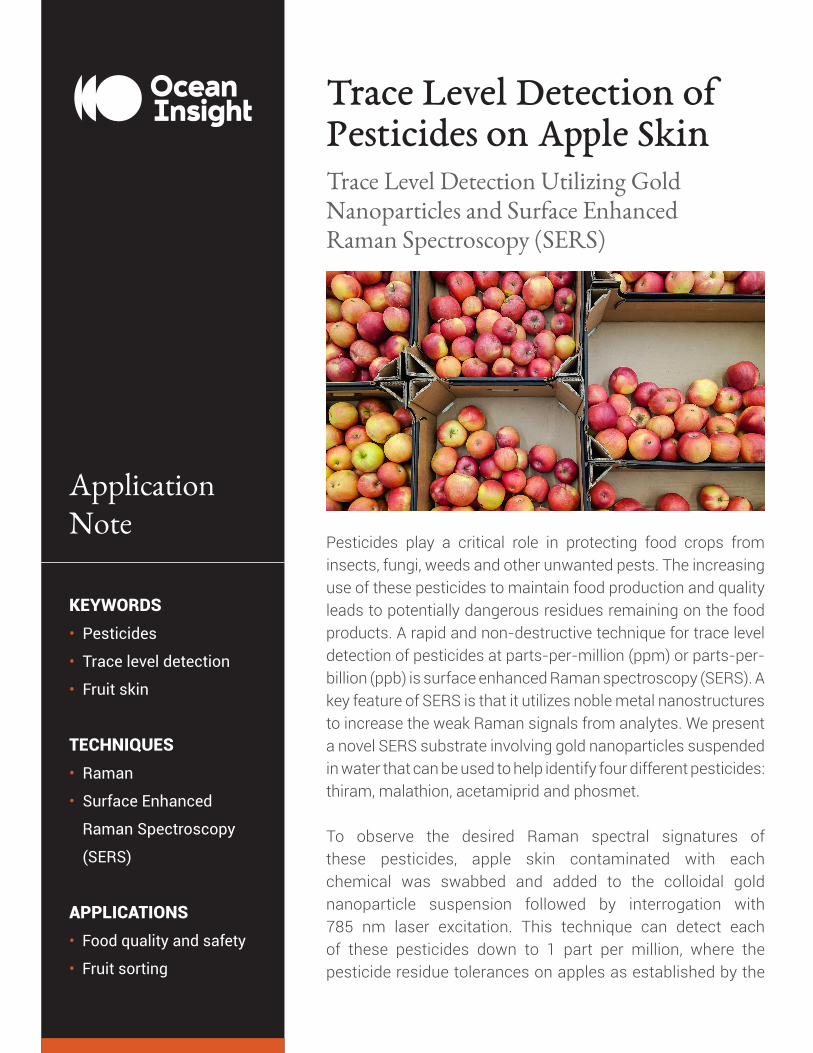
Pesticides play a critical role in protecting food crops from insects, fungi, weeds and other unwanted pests. The increasing use of these pesticides to maintain food production and quality leads to potentially dangerous residues remaining on the food products. A rapid and non-destructive technique for trace level detection of pesticides at parts-per-million (ppm) or parts-per-billion (ppb) is surface enhanced Raman spectroscopy (SERS). A key feature of SERS is that it utilizes noble metal nanostructures to increase the weak Raman signals from analytes. We present a novel SERS substrate involving gold nanoparticles suspended in water that can be used to help identify four different pesticides: thiram, malathion, acetamiprid and phosmet.
To observe the desired Raman spectral signatures of these pesticides, apple skin contaminated with each chemical was swabbed and added to the colloidal gold nanoparticle suspension followed by interrogation with 785 nm laser excitation. This technique can detect each of these pesticides down to 1 part per million, where the pesticide residue tolerances on apples as established by the
Trace Level Detection Utilizing Gold Nanoparticles and Surface EnhancedRaman Spectroscopy (SERS)

Unlocking the Unknown with Applied Spectral Knowledge.
2018 Code of Federal Regulations for thiram, malathion, acetamiprid, and phosmet are 5 ppm, 8 ppm, 1 ppm, and 10 ppm, respectively. The results presented here indicate that SERS is a potentially useful tool for identifying pesticide residues on the surface of fruits for food quality and safety control.
IntroductionCommonly used pesticides such as organophos-phates and fungicides can attack the central ner-vous system, posing a risk to humans and other animals upon exposure.1 Hence, accurate testing of pesticide residues is imperative to minimize potential health hazards to humans and wildlife. However, most of the current testing capabilities such as high-performance liquid chromatogra-phy (HPLC) and gas chromatography (GC) cou-pled with mass spectrometry (MS) are costly and time-consuming.2 Raman spectroscopy offers certain advantages over GC-MS or HPLC-MS such as reduced instrument size, portability for field use, fast measurement times, non-destruc-tive sampling, little to no sample preparation, and simple implementation.3-6
Raman spectroscopy is a vibrational spectro-scopic technique that provides molecular infor-mation about the analyte of interest but suffers from small signal intensities.3-4 Surface enhanced Raman spectroscopy (SERS) has been found to remedy this major shortcoming by introducing electromagnetic amplification effects by local-ized surface plasmon excitation. These ampli-fications are exploited by interactions between noble metals and analyte molecules. Depending on the size and shape of the metallic nanostruc-tures and the wavelength of incident light em-ployed in SERS measurements, Raman scatter-
ing of analyte molecules can be enhanced greater than 10,000x its normal intensity.6-8 Hence, SERS enables trace-level detection of certain analytes such as pesticides, where residue tolerances for food items are usually in the ppm to ppb range. In addition, SERS has strong potential to detect pesticides in both solid and liquid food samples, especially for field testing after simple extraction procedures have been carried out.2
Optimization of sampling parameters allows for low limits of detection to be achieved, and tech-nology continues to advance so that traditional Raman systems can be miniaturized into hand-held devices that are portable for use in the field. Some drawbacks to SERS as a semi-quantita-tive screening method include costly substrates and matrix interferences.6 The largest SERS enhancements are observed when the surface plasmon wavelength of the metallic substrate is located within ~120 nm of the laser excitation wavelength and the wavelength of the scattered photons.9 Typically, gold and silver nanoparticles that absorb in the visible part of the spectrum are used in SERS experiments with visible lasers at wavelengths such as 532, 633, and 785 nm, and often result in the highest SERS enhancement factors compared to other types of substrates.7-8
Several previous studies reported trace-level de-tection of various pesticides utilizing SERS and gold or silver nanostructures. One study by Fan et al. detected phosmet at 1 ug/g, which is equiv-alent to 1 ppm, in an apple extract using SERS and a solid gold nanosubstrate.10 Another study reported detection levels of 11.8 nM (2.8 ppb) thi-ram using dog bone-shaped gold nanoparticles and a solution-based direct readout SERS meth-od.11 Wong-ek et al. detected malathion at 90 pi-

Unlocking the Unknown with Applied Spectral Knowledge.
cograms using a silver nanorod film and SERS.12 Acetamiprid, a neonicotinoid, was detected on cucumbers using a silver nanorod array substrate to achieve a limit of detection of 0.05 ppm,13 and Hassan et al. developed a reduced graphene ox-ide and gold nanostar (rGO-NS) sensor to de-tect acetamiprid residue in green tea as low as 1.0 x 10⁻⁴ mg/mL (0.1 ppm).14 Imidacloprid, an-other neonicotinoid, is a commonly used pes-ticide that is the main culprit for declining bee populations15 and has also been studied us-ing SERS where the current limit of detection is 0.02 mg kg-1 on apple peels.16
As the above-mentioned studies demonstrate, there are several different ways to measure pes-ticide residues in or on food items using SERS, either by detecting the pesticide from an ex-tract,10 by adding the pure pesticide directly to the SERS substrate,11-12 or by probing the pesti-cide directly on the fruit surface.16 In this study, we instead utilize a swabbing technique that is non-destructive to the food item and has the potential to be a testing platform for field use. Specifically, this swab method is used to detect trace levels of pesticides on apple skin, including malathion, phosmet, acetamiprid, and thiram, at 1 ppm, which is less than or equal to the residue tolerance as established by the United States Code of Federal Regulations.17 The swab method involves a solution-based SERS form-factor uti-lizing colloidal gold nanoparticles and a Raman experimental setup that involves 785 nm laser excitation and a thermoelectrically cooled CCD spectrometer. Colloidal gold nanoparticles sus-pended in water are utilized with 785-nm laser excitation due to the spectral overlap of the local-ized surface plasmon band of the gold nanopar-ticle aggregates with the laser wavelength.18
MethodologyGold (III) chloride hydrate (HAuCl4 · H2O), sodium ci-trate tribasic dihydrate (HOC(COONa)(CH2COONa)2 · 2H2O), TraceSELECT® water, acetone, malathion, thiram, acetamiprid, and phosmet were purchased from Sigma-Aldrich. Fisherbrand cotton-tipped applicators (6-inch length) were used for swab-bing apple skin. Spherical gold nanoparticles were synthesized according to the method of Lee and Meisel.19 Briefly, 0.8 mL of 0.3 M HAuCl4 was added to 400 mL of TraceSELECT® water and heated to a vigorous boil in a beaker. At this point, 120 mg of sodium citrate in 1 mL of water was added to the gold solution, where the solution changed from colorless to reddish-purple within minutes, indicat-ing the formation of gold nanoparticles.
Thiram solutions at 1 ppm and 10 ppm concen-trations were prepared in acetone, while 1 ppm and 10 ppm solutions of malathion, phosmet, and acetamiprid were prepared in water. Organic “Red Delicious” apples were purchased from the supermarket and cleaned thoroughly by rinsing with copious amounts of purified water and dry-ing in air. Then, the apple skin was cut into an area of 2.5 cm2 and 50 µL of the pesticide was pipetted directly onto the apple skin piece and allowed to dry completely. The swab method in-volved pre-wetting a cotton swab with acetone or water (depending on the solvent used to dissolve the pesticide) and dragging the swab across the apple skin piece evenly for 30 seconds. The swab was immediately added to 1 mL of the colloidal gold nanoparticle suspension and allowed to sit for 1 minute. The swab was removed before col-lecting the Raman spectrum.

Unlocking the Unknown with Applied Spectral Knowledge.
The reference substrate for these experiments involved adding 50 µL of acetone or water to a separate piece of apple skin, allowing it to dry, and then swabbing for 30 seconds before add-ing the swab to the colloidal gold nanoparticles. Additionally, 50 µL of each pesticide were added to 1 mL of gold nanoparticles and the resulting SERS spectra were measured as a comparison (direct addition method). For both the swab and direct addition methods, 2 µL of 2M HCl were added to the gold colloids-pesticide mixture to induce nanoparticle aggregation, which creates the necessary “hot-spot” locations for optimal SERS response.7-8
Raman experiments were performed using an Ocean Insight Raman system comprising a QE Pro spectrometer, 785 nm laser, and Raman fi-ber optic probe. The laser power was 350 mW with 10 seconds integration time. The spot size of the focused laser was approximately 160 µm. Absorption measurements were carried out with an Ocean Insight Flame spectrometer. Trans-mission electron microscope (TEM) images were acquired by Dr. Emirov at the University of South Florida’s Nanotechnology Research & Education Center (NREC). ImageJ software was used to measure the size of the gold nanoparticles, and at least 200 particles were analyzed.
Results and DiscussionThe gold nanoparticles used in this study exhib-it the characteristic surface plasmon resonance (SPR) absorption peak at 533 nm (Figure 1A), and are mostly spherical with a diameter of 40 ± 10 nm based on TEM image analysis (Figure 1B). The peak position of the SPR is crucial for
the SERS technique to be effective, where there must be resonance between the excitation laser wavelength, the SPR of the nanoparticles, and the scattered Raman wavelengths of the tar-geted molecule.8-9 Here, 785 nm laser excitation is employed because upon aggregation of the nanoparticles in the presence of the pesticides and added HCl, the SPR of the nanoparticles shifts to redder wavelengths.
The surface swabbing technique is shown in Figure 2, where the cotton swab was immersed in the appropriate solvent, either acetone or wa-ter (Figure 2A), before being dragged across the sample surface for 30 seconds (Figure 2B). Then, the swab was immersed in a vial containing the colloidal gold nanoparticles (Figure 2C) for 1 min-ute. The swab was removed before collecting the SERS spectrum. The swabbing shown here was performed on a glass slide as a demonstration of the technique, but the experiments presented in
Figure 1. (A) Absorption spectrum and (B) representative TEM image of colloidal gold nanoparticles. The scale bar in (B) is 200 nm.
Figure 2. Swabbing technique where the cotton swab is (A) pre-wetted with the appropriate solvent, (B) swabbed across the surface for at least 30 seconds, and (C) immersed in colloidal gold nanoparticles for 1 minute. The cotton swab was removed before collecting the SERS spectrum.
Unlocking the Unknown with Applied Spectral Knowledge.
this study were conducted on 2.5 cm2 cut slices of apple skin.
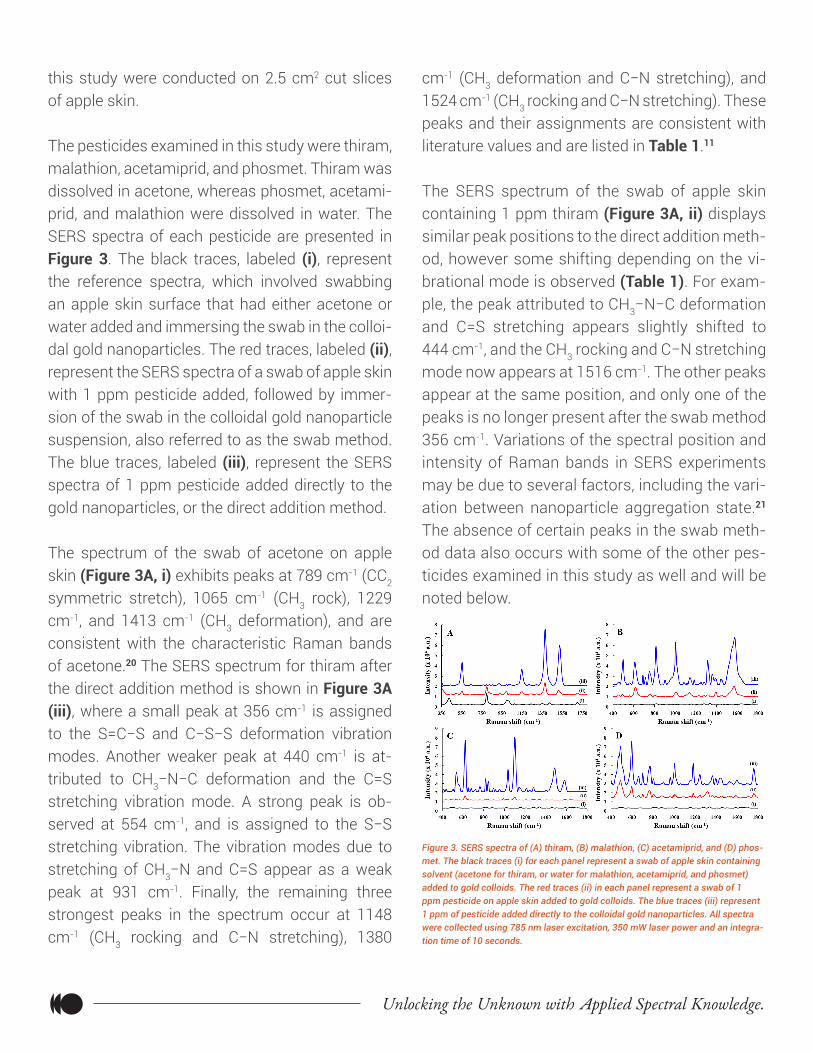
The pesticides examined in this study were thiram, malathion, acetamiprid, and phosmet. Thiram was dissolved in acetone, whereas phosmet, acetami-prid, and malathion were dissolved in water. The SERS spectra of each pesticide are presented in Figure 3. The black traces, labeled (i), represent the reference spectra, which involved swabbing an apple skin surface that had either acetone or water added and immersing the swab in the colloi-dal gold nanoparticles. The red traces, labeled (ii), represent the SERS spectra of a swab of apple skin with 1 ppm pesticide added, followed by immer-sion of the swab in the colloidal gold nanoparticle suspension, also referred to as the swab method. The blue traces, labeled (iii), represent the SERS spectra of 1 ppm pesticide added directly to the gold nanoparticles, or the direct addition method.
The spectrum of the swab of acetone on apple skin (Figure 3A, i) exhibits peaks at 789 cm-1 (CC2
symmetric stretch), 1065 cm-1 (CH3 rock), 1229 cm-1, and 1413 cm-1 (CH3 deformation), and are consistent with the characteristic Raman bands of acetone.20 The SERS spectrum for thiram after the direct addition method is shown in Figure 3A (iii), where a small peak at 356 cm-1 is assigned to the S=C−S and C−S−S deformation vibration modes. Another weaker peak at 440 cm-1 is at-tributed to CH3−N−C deformation and the C=S stretching vibration mode. A strong peak is ob-served at 554 cm-1, and is assigned to the S−S stretching vibration. The vibration modes due to stretching of CH3−N and C=S appear as a weak peak at 931 cm-1. Finally, the remaining three strongest peaks in the spectrum occur at 1148 cm-1 (CH3 rocking and C−N stretching), 1380
cm-1 (CH3 deformation and C−N stretching), and 1524 cm-1 (CH3 rocking and C−N stretching). These peaks and their assignments are consistent with literature values and are listed in Table 1.11
The SERS spectrum of the swab of apple skin containing 1 ppm thiram (Figure 3A, ii) displays similar peak positions to the direct addition meth-od, however some shifting depending on the vi-brational mode is observed (Table 1). For exam-ple, the peak attributed to CH3−N−C deformation and C=S stretching appears slightly shifted to 444 cm-1, and the CH3 rocking and C−N stretching mode now appears at 1516 cm-1. The other peaks appear at the same position, and only one of the peaks is no longer present after the swab method 356 cm-1. Variations of the spectral position and intensity of Raman bands in SERS experiments may be due to several factors, including the vari-ation between nanoparticle aggregation state.21 The absence of certain peaks in the swab meth-od data also occurs with some of the other pes-ticides examined in this study as well and will be noted below.
Figure 3. SERS spectra of (A) thiram, (B) malathion, (C) acetamiprid, and (D) phos-met. The black traces (i) for each panel represent a swab of apple skin containing solvent (acetone for thiram, or water for malathion, acetamiprid, and phosmet) added to gold colloids. The red traces (ii) in each panel represent a swab of 1 ppm pesticide on apple skin added to gold colloids. The blue traces (iii) represent 1 ppm of pesticide added directly to the colloidal gold nanoparticles. All spectra were collected using 785 nm laser excitation, 350 mW laser power and an integra-tion time of 10 seconds.
Unlocking the Unknown with Applied Spectral Knowledge.
In Figure 3B, the SERS spectra of (i) a water swab, (ii) a 1 ppm malathion swab, and (iii) di-rect addition of 1 ppm malathion are displayed. For malathion directly added to the colloidal gold nanoparticle suspension, the peak at 509 cm-1
is assigned to the P–S stretching vibration and 621 cm-1 is assigned to P=S stretching. Other stretching vibrations have peaks that appear at 826 cm-1, 1015 cm-1, 1126 cm-1, and 1721 cm-1, which are assigned to C–O–C, P–O–CH3, C−C, and C=O stretching, respectively. The peak at 1154 cm-1 is attributed to CH2 stretching, and the peak at 1371 cm-1 is due to CH3 stretching. Finally, the peak at 1456 cm-1 is assigned to CH2 and CH3 deformation vibration modes. The SERS peak positions and assignments for malathion detected by both the swab and direct addition methods are listed in Ta-ble 1 and resemble reported literature values.12,22 The peak positions for the swab of malathion are slightly shifted compared to the peak positions of the direct addition method, and occur at 501 cm-1, 629 cm-1, 813 cm-1, 1018 cm-1, 1107 cm-1, 1148 cm-1, 1368 cm-1, 1458 cm-1, and 1724 cm-1. These peaks have the same assignments as mentioned above for the direct addition of malathion.
In Figure 3C, the SERS spectra of (i) a swab of apple skin with water, (ii) a swab of apple skin with 1 ppm acetamiprid, and (iii) 1 ppm acetami-prid directly added to colloidal gold nanoparticles are shown. The SERS peak positions and assign-ments for (ii) and (iii) are listed in Table 1 and are similar to reported literature values for acet-amiprid.13-14 The peak at 512 cm-1 is attributed to the H−C−H rocking vibration mode. The peaks at 576 cm-1, 631 cm-1, and 728 cm-1 are assigned to the N−C=N, C−C−C, C−H wagging vibration modes, respectively. The peak that appears at 960 cm-1 is due to the C−C−N deformation vi-bration mode. Stretching vibration modes for
N−C and C−C are located at 1110 cm-1 and 1287 cm-1, respectively. Finally, the peak at 1347 cm-1 is due to the H−C−H antisymmetrical mode and the peak at 1591 cm-1 is assigned to ring breathing.
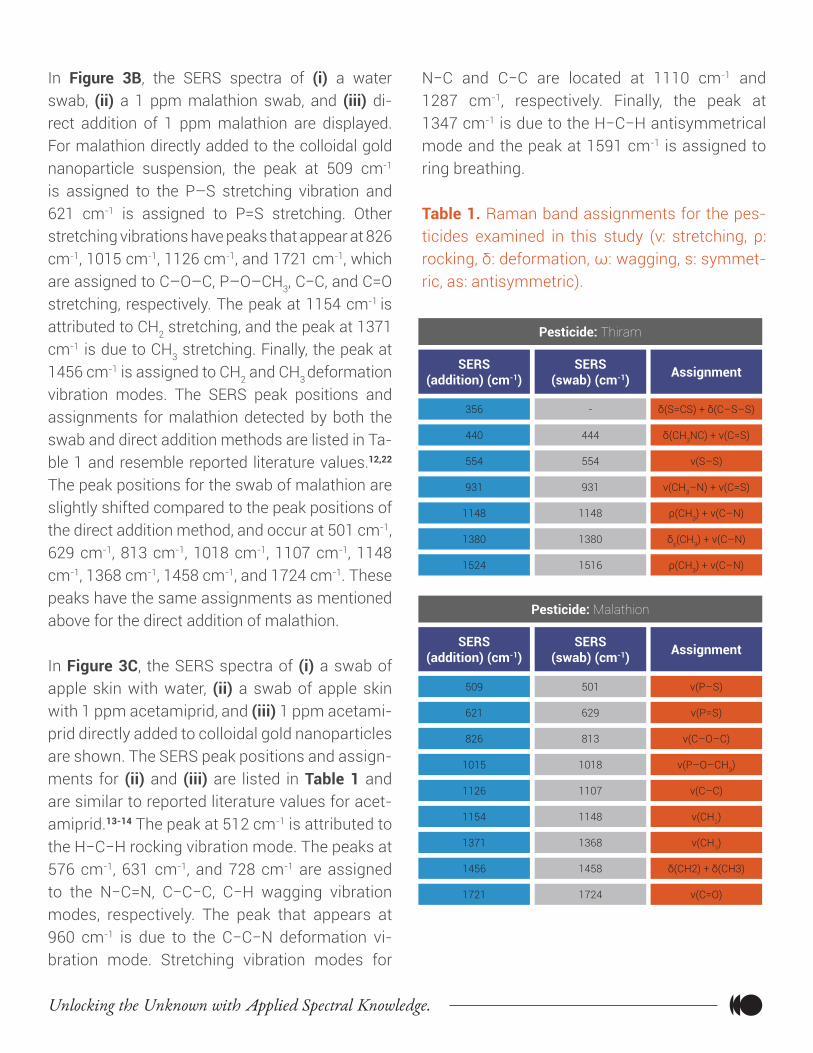
Table 1. Raman band assignments for the pes-ticides examined in this study (ν: stretching, ρ: rocking, δ: deformation, ω: wagging, s: symmet-ric, as: antisymmetric).
SERS(addition) (cm-1)
Pesticide: Thiram
SERS(swab) (cm-1)
356 -
Assignment
δ(S=CS) + δ(C–S–S)
440 444 δ(CH3NC) + ν(C=S)
554 554 ν(S–S)
931 931 ν(CH3–N) + ν(C=S)
1148 1148 ρ(CH3) + ν(C–N)
1380 1380 δs(CH3) + ν(C–N)
1524 1516 ρ(CH3) + ν(C–N)
SERS(addition) (cm-1)
Pesticide: Malathion
SERS(swab) (cm-1)
509 501
Assignment
ν(P–S)
621 629 ν(P=S)
826 813 ν(C–O–C)
1015 1018 ν(P–O–CH3)
1126 1107 ν(C–C)
1154 1148 ν(CH2)
1371 1368 ν(CH3)
1456 1458 δ(CH2) + δ(CH3)
1721 1724 ν(C=O)

Unlocking the Unknown with Applied Spectral Knowledge.
Most of the acetamiprid peaks that are pres-ent in the direct addition method appear in the spectrum of the apple skin swab. Some of the peaks are slightly shifted, but have the same assignments and appear at 576 cm-1, 631 cm-1, 1110 cm-1, 1287 cm-1, 1347 cm-1, and 1594 cm-1. The H−C−H rocking (512 cm-1), C−H wagging (728 cm-1), and C−C−N deformation (960 cm-1) vi-bration modes are not visible for the swab sam-ple. The absence of these peaks may be due to reasons like those responsible for the previously observed spectral shifting and variations in the SERS signal intensity. One additional explanation may involve the efficiency of the swab method. In general, the SERS intensities for the pesticides that were swabbed are lower compared to the direct addition method. Perhaps the swab meth-
od is not collecting the same amount of pesti-cide that is being added during the direct addi-tion method. To overcome this, optimization of the method may be needed, or longer integration times and spectral averaging could be used.
Figure 3D shows the SERS spectra of (i) a swab of apple skin with water, (ii) a swab of ap-ple skin containing 1 ppm phosmet, and (iii) 1 ppm phosmet directly added to a colloidal gold nanoparticle solution. The peak positions and assignments corresponding to (ii) and (iii) for phosmet are displayed in Table 1 and match what is reported in the literature.10 For the sam-ple where phosmet was directly added to the colloidal gold nanoparticle suspension, the peak at 498 cm-1 is attributed to CH2 and PO2 rocking vibration modes. The C=O and P=S deforma-tion vibrational modes for phosmet appear at 608 cm-1 and 670 cm-1, respectively. The peak at 711 cm-1 is assigned to benzene ring breathing. The strong peak located at 779 cm-1 is attribut-ed to P–O stretching and CH3 deformation. The peak at 908 cm-1 is assigned to antisymmetrical vibration of C−N. The P–O–C stretching vibration is indicated by the peak at 1015 cm-1. A stretching vibration mode of C−N appears at 1069 cm-1. The peaks at 1194 cm-1, 1300 cm-1, 1377 cm-1, and 1608 cm-1 are assigned to C–N deformation, C–C stretching, CH3 deformation, and C=C stretching, respectively. The peaks at 1255 cm-1 and 1409 cm-1 are attributed to C−N stretching and C–H de-formation in S–CH2–N, respectively. Finally, both peaks at 1707 cm-1 and 1772 cm-1 are attributed to the C=O stretching vibration mode.
Most of the peaks for the swab of phosmet (ii) oc-cur at similar positions to the sample with phos-met directly added to the colloidal gold nanopar-ticles (iii). The only peak that is slightly shifted is
SERS(addition) (cm-1)
Pesticide: Phosmet
SERS(swab) (cm-1)
498 498
Assignment
ρ(CH2) + ρ(PO2)
608 608 δ(C=O)
670 673 ν(P=S)
711 711 Benzene ring breathing
779 779 ν(P–O) + δ(CH3)
908 - νas(C−N)
1015 1015 νas(P−O−C)
1069 - ν(C−N)
1194 1194 δ(C–N)
1255 1255 ν(C−N) in S−CH2−N
1300 - ν(C–C)
1377 1377 δ(CH3)
1409 1409 δ(C–H) in S–CH2–N
1608 - ν(C=C)
1707 - ν(C=O)
1772 1772 ν(C=O)

Unlocking the Unknown with Applied Spectral Knowledge.
for the P=S deformation vibrational mode that is located at 673 cm-1 after swabbing, but appears closer to 670 cm-1 using the direct addition meth-od. Also, there are a few peaks that are present in the direct addition of phosmet that do not appear in the swab spectrum: 908 cm-1, 1069 cm-1, 1300 cm-1, 1608 cm-1 and 1707 cm-1. However, the in-tensities of these peaks are relatively low for the direct addition of phosmet, and it is likely they will not appear in the swab spectrum since the inten-sity of the swab data overall is usually lower com-pared to the direct addition of pesticide.
ConclusionsIn this study, a swabbing technique that is non-de-structive to the food item, and has the potential to be a testing platform for field use, is presented. The swab method utilizes colloidal gold nanopar-ticles to detect trace levels of several pesticides including thiram, malathion, acetamiprid, and phosmet on apple skin. This technique can detect each of these pesticides down to 1 ppm, where the pesticide residue tolerances on apples as es-tablished by the 2018 Code of Federal Regulations are 5 ppm, 8 ppm, 1 ppm, and 10 ppm for thiram, malathion, acetamiprid, and phosmet, respective-ly. Raman measurements were carried out using a cost-effective Raman spectrometer with 785 nm laser excitation and fast collection times of no greater than 10 seconds. Although some peaks are not present when comparing the swab method to the direct addition of pesticide to the nanopar-ticles, the main peaks for the pesticides are visible at sufficient intensity to indicate the presence of pesticide residue on the apple skin. The next steps will involve testing a mixture of pesticides applied to the food surface to see if the swab method coupled with SERS can distinguish more than one
pesticide. The results presented here indicate that SERS coupled with the swab method is a valuable tool and has significant potential for identifying pesticide residues on the surface of fruits for food quality and safety control.
References1. Stoytcheva, M., [Pesticides – The Impacts of Pesticide Expo-
sure], InTech, Rijeka, Croatia, 30-48 (2011).
2. Xu, M.L., Gao, Y., Han, X.X. and Zhao, B., “Detection of pesticide
residues in food using surface-enhanced Raman spectroscopy: a
review,” J. Agric. Food Chem. 65, 6719-6726 (2017).
3. Ellis, D.I., Muhamadali, H., Haughey, S.A., Elliott, C.T. and Gooda-
cre, R., “Point-and-shoot: rapid quantitative detection methods for
on-site food fraud analysis – moving out of the laboratory and into
the food supply chain,” Anal. Methods 7, 9401-9414 (2015).
4. Craig, A.P., Franca, A.S. and Irudayaraj, J., “Surface-enhanced
Raman spectroscopy applied to food safety,” Annu. Rev. Food Sci.
Technol. 4, 369-380 (2013).
5. Cordella, C., Moussa, I., Martel, A., Sbirrazzuoli, N. and Lizza-
ni-Cuvelier, L., “Recent developments in food characterization and
adulteration detection: technique-oriented perspectives,” J. Agric.
Food Chem. 50, 1751-1764 (2002).
6. Zheng, J. and He, L., “Surface‐enhanced Raman spectroscopy
for the chemical analysis of food,” Compr. Rev. Food Sci. Food Saf.
13, 317-328 (2013).
7. Haynes, C.L., McFarland, A.D. and Van Duyne, R.P., “Surface en-
hanced Raman spectroscopy,” Anal. Chem. 77, 338A-346A (2005).
8. Sharma, B., Frontiera, R.R., Henry, A., Ringe, E. and Van Duyne,
R.P., “SERS: materials, applications, and the future,” Mater. Today
15(1,2), 16-25 (2012).
9. Haynes, C.L. and Van Duyne, R.P., “Plasmon-sampled sur-
face-enhanced Raman excitation spectroscopy,” J. Phys. Chem. B
107(30), 7426-7433 (2003).
10. Fan, Y., Lai, K., Rasco, B.A. and Huang, Y., “Analyses of phosmet
residues in apples with surface-enhanced Raman spectroscopy,”
Food Control 37, 153-157 (2014).
Unlocking the Unknown with Applied Spectral Knowledge.
11. Saute, B. and Narayanan, R., “Solution-based direct readout
surface enhanced Raman spectroscopic (SERS) detection of ul-
tra-low levels of thiram with dogbone shaped gold nanoparticles”
Analyst 136, 527-532 (2011).
12. Wong-ek, K., Horprathum, M., Eiamchai, P., Limnonthakul, P.,
Patthanasettakul, V., Chindaudom, P. and Nuntawong, N., “Portable
surface-enhanced Raman spectroscopy for insecticide detection
using silver nanorod film fabricated by magnetron sputtering,”
Proc. SPIE 7911, 791108-1–791108-11 (2011).
13. Han, C.Q., Yao, Y., Wang, W., Tao, L.Q., Zhang, W.X., Ingram,
W.M., Tian, K.Z., Liu, Y., Lu, A.X., Wu, Y., Yan, C.C., Qu, L.L. and Li,
H.T., “Highly sensitive silver nanorod arrays for rapid surface en-
hanced Raman scattering detection of acetamiprid pesticides,”
Chin. J. Chem. Phys. 31(2), 152-158 (2018).
14. Hassan, M.M, Chen, Q., Kutsanedzie, F.Y.H., Li, H., Zareef, M.,
Xu, Y., Yang, M. and Agyekum, A.A., “rGO-NS SERS-based coupled
chemometric prediction of acetamiprid residue in green tea,” J.
Food Drug Anal. In Press, 1-9 (2018).
15. Henry, M., Beguin, M., Requier, F., Rollin, O., Odoux, J.F., Aupi-
nel, P., Aptel, J., Tchamitchain, S. and Decourtye, A., “A common
pesticide decreases foraging success and survival in honey bees,”
Science 336, 348-350 (2012).
16. Hou, R., Pang, S. and He, L., “In situ SERS detection of multi-
class insecticides on plant surfaces,” Anal. Methods 7, 6325-6330
(2015).
17. Office of the Federal Register, “Tolerances and exemptions for
pesticide chemical residues in food,” Electronic Code of Federal
Regulations, 20 December 2018, https://www.ecfr.gov (8 January
2019).
18. Hoppmann, E.P., Yu, W.W. and White, I.M., “Highly sensitive and
flexible inkjet-printed SERS sensors on paper,” Methods 63, 219-
224 (2013).
19. Lee, P.C. and Meisel, D., “Adsorption and surface-enhanced Ra-
man of dyes on silver and gold sols” J. Phys. Chem. 86, 3391-3395
(1982).
20. Wong, C.L., Dinish, U.S., Budharaju, K.D., Schmidt, M.S. and Ol-
ivo, M., “Surface-enhanced Raman scattering (SERS)-based vola-
tile organic compounds (VOCs) detection using plasmonic bime-
tallic nanogap substrate,” Appl. Phys. A 117, 687-692 (2014).
21. Yamamoto, Y.S. and Itoh, T., “Why and how do the shapes of
surface-enhanced Raman scattering spectra change? Recent
progress from mechanistic studies,” J. Raman Spectrosc. 47, 78-
88 (2016).
22. Liu, Y. and Liu, T., “Determination of pesticide residues on the
surface of fruits using micro-Raman spectroscopy,” Computer
and Computing Technologies in Agriculture IV. Springer Berlin Hei-
delberg 347, 427-434 (2011).
Portions of this material first appeared as part of Proceedings Vol-
ume 10907, Synthesis and Photonics of Nanoscale Materials XVI;
109070G (2019) https://doi.org/10.1117/12.2521296.
w w w . o c e a n i n s i g h t . c o m
[email protected] • US +1 727-733-2447
EUROPE +31 26-3190500 • ASIA +86 21-6295-6600 0624
20