tracking energy and climate investment flows
TRANSCRIPT

Erzeugung und Verbrauch lokal verknüpfen Simon Schäfer-Stradowsky 21. März 2018
Institute for Climate Protection, Energy and Mobility (IKEM)
Aleksandra Novikova, PhD
Tracking energy and climate investment flows
Part of the EUKI-funded project: Climate Investment Capacity 2030
EUKI Academy Webinar
14 February 2019

Outline
Why to track energy and climate investment at national level?
Regulation on the Energy Union Governance
• National Energy and Climate Plans
Paris Agreement
• Article 2.1c
Climate and energy investment maps
Concept, methodology and messages
Examples
Summary
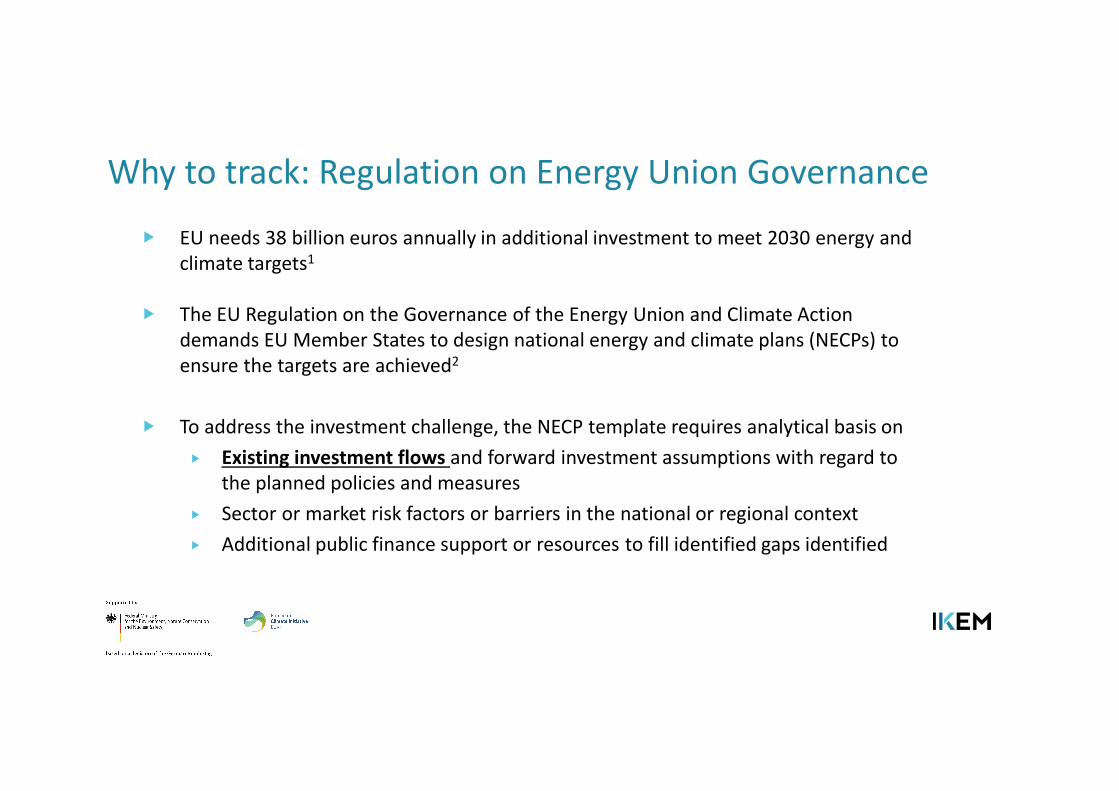
Why to track: Regulation on Energy Union Governance
EU needs 38 billion euros annually in additional investment to meet 2030 energy and
climate targets1
The EU Regulation on the Governance of the Energy Union and Climate Action
demands EU Member States to design national energy and climate plans (NECPs) to
ensure the targets are achieved2
To address the investment challenge, the NECP template requires analytical basis on
Existing investment flows and forward investment assumptions with regard to
the planned policies and measures
Sector or market risk factors or barriers in the national or regional context
Additional public finance support or resources to fill identified gaps identified

Why to track: Article 2 of Paris agreement3
Article 2 §1
This Agreement, in enhancing the implementation of the Convention [UNFCCC], including
its objective, aims to strengthen the global response to the threat of climate change, in
the context of sustainable development and efforts to eradicate poverty, including by
a. Holding the increase in the global average temperature to well below 2°C…
b. Increasing the ability to adapt …
c. Making finance flows consistent with a pathway towards low greenhouse gas
emissions and climate-resilient development
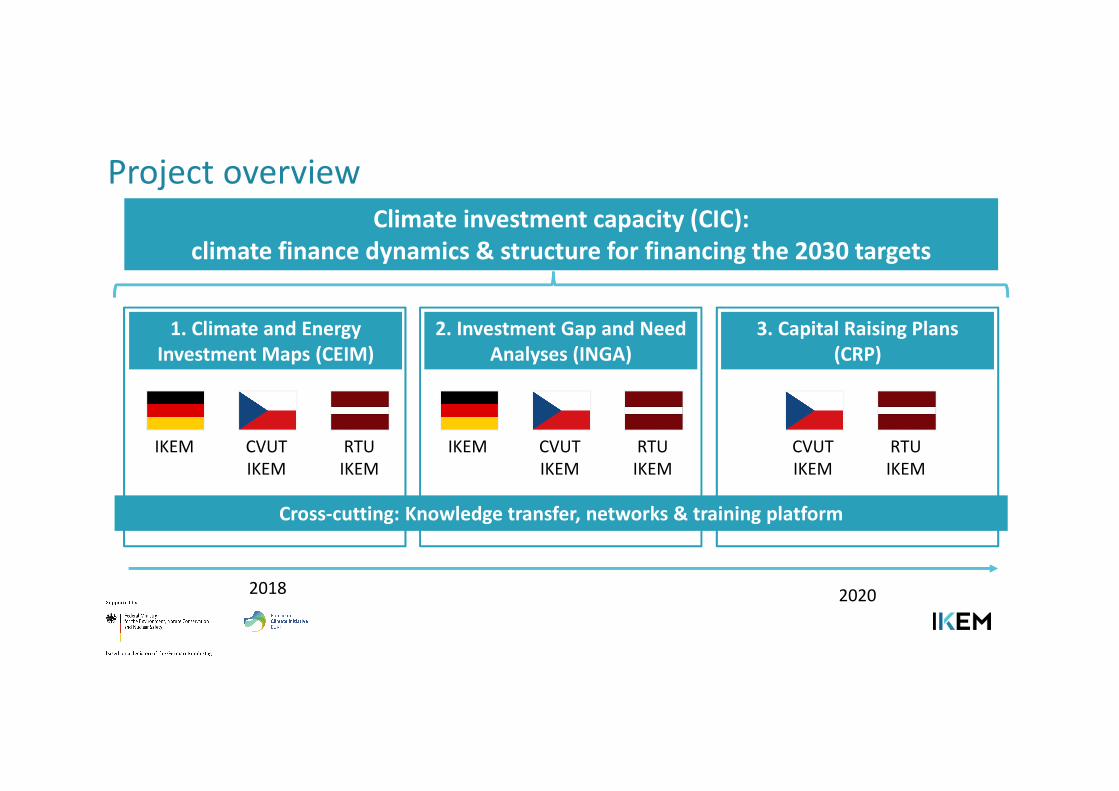
Project overview
1. Climate and Energy
Investment Maps (CEIM)
2. Investment Gap and Need
Analyses (INGA)
3. Capital Raising Plans
(CRP)
IKEM CVUT
IKEM
RTU
IKEM
IKEM CVUT
IKEM
RTU
IKEM
CVUT
IKEM
RTU
IKEM
Cross-cutting: Knowledge transfer, networks & training platform
Climate investment capacity (CIC):
climate finance dynamics & structure for financing the 2030 targets
20202018

Introduction into investment maps
The approach of tracking climate finance flows was introduced by Climate Policy
Initiative (CPI) in 2011 to track these at the global level using the Landscape of
Climate Finance diagram.4
Later, CPI-Berlin adopted the global approach into a framework suitable for analysing
the national level and applied it to the case study of Germany for the year 2010.5
The map allows understanding who invests how much into what kind of measures
and which intermediaries and financial instruments facilitate these flows.
The construction of the diagram uses a bottom-up approach tracking investment at a
technology/measure level, aggregating it on sector level and then on country level.

Source: CPI (2012)
Prototype: German climate finance landscape 2010

Germany 2016 –draft
Notes:
a) Figures represent mostly total capital cost of technologies and measures and they are
not comparable to the results of 2010 that represented both total and incremental
b) The figures cover only tangible investment into physical assets
c) Debt owed does not represent the actual finance flows (e.g. debt repayment), but is
shown to highlight the original investors or asset owners who make use of Public Banks
or Capital Markets as financial intermediaries.

Available and forthcoming maps
Existing studies:
2011 – 2017: Global CPI
2012: Germany CPI
2014: Indonesia CPI
2014 – 2017: France I4CE
2016: Belgium Trinomics
2017: Côte d’Ivoire CPI
CIC2030:
2019: Germany IKEM
2019: Czechia CVUT
2019: Latvia RTU
Other ongoing/forthcoming studies:
2019: Poland I4CE
… : Morocco I4CE
… : Indonesia CPI
… : … CPI

Advantages and limitations of the concept
Advantages:
A visual snapshot of stakeholders, finance flows, and recipient
Potential over- and underspending for further investigation
Comparing countries’ maps may help facilitate learning
Comparing maps for different years may help understand the progress
Limitations:
A significant amount of input data
The results do not permit to assess directly
• The impact or effectiveness of policies and actions
• Leverage of private money by public finance
• Gaps to reach climate targets
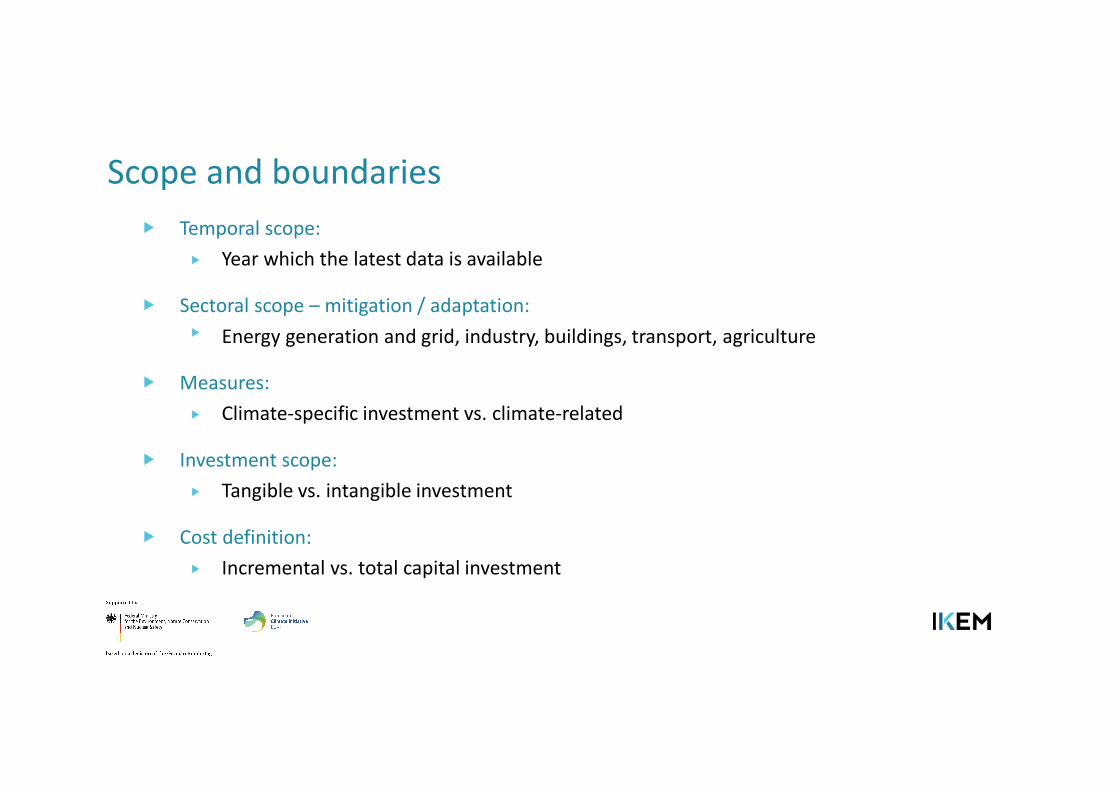
Scope and boundaries
Temporal scope:
Year which the latest data is available
Sectoral scope – mitigation / adaptation:
Energy generation and grid, industry, buildings, transport, agriculture
Measures:
Climate-specific investment vs. climate-related
Investment scope:
Tangible vs. intangible investment
Cost definition:
Incremental vs. total capital investment

Summary
Using climate and energy investment maps may help to address Chapter 5
of NECPs and Article 2.1 of the Paris Agreement
Their analysis help understand the pattern and progress of financing energy
transition with potential over- and underspending as well as facilitate
learning between countries
Specific challenges lie in data collection and methodology to estimate
specific and additional share
Ideally, maps have to be co-designed with policy-makers to tailor them for
policy- and decision-making

References 1 EC (2016): Communication from the Comission to the European Parliament, The Council, the European Economic
and Social Committee, The Committee of the Regions and the European Investment Bank – Clean Energy For All
Europeans, COM (2016) 860 final. Retrieved from http://eur-lex.europa.eu/resource.html?uri=cellar:fa6ea15b-
b7b0-11e6-9e3c-01aa75ed71a1.0001.02/DOC_1&format=PDF
2 EC (2018): Regulation (EU) 2018/1999 of the European Parliament and of the Council of 11 December 2018 on
the Governance of the Energy Union and Climate Action. Retrieved from https://eur-lex.europa.eu/legal-
content/EN/TXT/?uri=uriserv:OJ.L_.2018.328.01.0001.01.ENG&toc=OJ:L:2018:328:FULL
3 United Nations. 2015. Paris Agreement. Retrieved from
https://unfccc.int/sites/default/files/english_paris_agreement.pdf
4 Buchner, B., A. Falconer, M. Hervé-Mignucci, C. Trabacchi and M. Brinkman (2011). The landscape of climate
finance. Venice, Climate Policy Initiative (CPI). Retrieved from https://climatepolicyinitiative.org/publication/the-
landscape-of-climate-finance/
5 Juergens, I., Amecke, H., Boyd, R., Buchner, B., Novikova, A., Rosenberg, A., Vasa, A. (2012). The Landscape of
Climate Finance in Germany. Berlin: CPI (Climate Policy Initiative). Retrieved from
https://climatepolicyinitiative.org/publication/german-landscape-of-climate-finance/

Aleksandra Novikova: [email protected]
IKEM – Institute for Climate Protection, Energy and Mobility
www.ikem.de
CIC2030 project websites:
EUKI: www.euki.de/en/euki-projects/climate-investment-capacity-cic2030/
IKEM: www.ikem.de/en/portfolio/cic2030/
CVUT: https://ekonom.feld.cvut.cz/cs/katedra/lide/valenmi7/cic2030/
RTU: https://videszinatne.rtu.lv/en/science/project-and-research/cic2030/