tracking of the expected time to reinforcement in temporal conditioning procedures
TRANSCRIPT

Learning amp Behavior2003 31 (1) 3-21
The focus of empirical and theoretical developments inthe f ield of animal timing has been on the analysis offixed-interval performance If a rat is presented with a lightfor 30 sec after which pressing a lever will result in fooddelivery the rat will demonstrate an increasing rate of lev-erpressing as a function of time since light onset This re-sponse pattern indicates that the rat has learned the dura-tion of the light Timing theories such as scalar timingtheory (Gibbon amp Church 1984 Gibbon Church amp Meck1984) multiple oscillator model (Church amp Broadbent1990) behavioral theory of timing (Killeen amp Fetterman1988) and the learning to time model (Machado 1997)accurately predict fixed-interval timing
In the natural environment events rarely occur at pre-cise periodic intervals The focus on fixed intervals mayfail to disclose important features of the timing systembecause it has evolved under conditions of temporal un-certainty In a few studies variable-interval performance hasbeen examined and these studies have indicated that ex-ponential random intervals result in a relatively constant rateof responding as a function of time (Catania amp Reynolds
1968 Church amp Lacourse 2001 Kirkpatrick amp Church2000b LaBarbera amp Church 1974 Libby amp Church 1975Lund 1976) in contrast to the increasing response rate ob-served with fixed intervals
Various proposals have been made in an attempt to ex-plain the pattern of responding under fixed and random in-tervals The goal is to account for the pattern of responsesas a function of the pattern of delivery of reinforcers Thetop row of functions in Figure 1 are the density functionsfor three reinforcement schedules fixed time (FT) 90 inwhich food is delivered every 90 sec random-time (RT)90 in which food is delivered at exponentially distributedintervals with a mean of 90 sec and FT75ndashRT15 in whichfood is delivered after 75 sec plus an exponentially dis-tributed interval with a mean of 15 sec Alternative repre-sentations of these three density functions include the sur-vival function the hazard function and the conditionalexpected time function (shown in rows 2ndash4 of Figure 1)Appendix A provides the definitions of these functions
Scalar timing theory (Gibbon amp Church 1984 Gibbonet al 1984) assumes that responding in a fixed-intervalschedule is based on a random sample of the rememberedtimes of reinforcement but that responding in a variable-interval schedule is initiated by a random sample of theshortest remembered times of reinforcement and is termi-nated by a random sample of the longest rememberedtimes of reinforcement (Brunner Fairhurst Stolovitzky ampGibbon 1997 Brunner Kacelnik amp Gibbon 1996)
An alternative approach is to assume that respondingunder fixed intervals is based on the density function withadded sources of variance but that responding under ran-dom intervals is controlled by the hazard function whichreflects the conditional probability of receiving food
3 Copyright 2003 Psychonomic Society Inc
National Institute of Mental Health Grant MH44234 to Brown Uni-versity supported this research National Research Service AwardMH11691 from the National Institute of Mental Health supported K KSpecial thanks are extended to An Le for his assistance in formulatingthe explicit solution of the conditional expected time function The rawdata (time of occurrence of each response and reinforcer on each sessionfor each rat) are available at httpwwwBrowneduResearchTimelabCorrespondence concerning this article should be addressed to K Kirk-patrick Department of Psychology University of York York YO105DD England (e-mail kk12yorkacuk)
mdashAccepted by previous editorial team of Ralph R Miller
Tracking of the expected time to reinforcement intemporal conditioning procedures
KIMBERLY KIRKPATRICKUniversity of York York England
and
RUSSELL M CHURCHBrown University Providence Rhode Island
In one experiment the rate and pattern of responding (head entry into the food cup) under differentdistributions of intervals between food deliveries were examined Separate groups of rats receivedfixed-time (45 90 180 or 360 sec) random-time (45 90 180 or 360 sec) or tandem fixed-time (45 or90 sec) random-time (45 or 90 sec) schedules of reinforcement Schedule type affected the pattern of re-sponding as a function of time whereas mean interval duration affected the mean rate of responding Re-sponses occurred in bouts with characteristics that were invariant across conditions Packet theorywhich assumes that the momentary probability of bout occurrence is negatively related to the condi-tional expected time remaining until the next reinforcer accurately predicted global and local mea-sures of responding The success of the model advances the prediction of multiple measures of re-sponding across different types of time-based schedules
4 KIRKPATRICK AND CHURCH
given that food has not yet occurred (Catania amp Reynolds1968) (See Anger 1956 for the application of the hazardfunction to interresponse time [IRT] distributions in DRLschedules) As is shown in Figure 1 the hazard functionfor a random interval is constant over time and thereforecould explain the relatively constant rate of responding thatis observed However a different distribution form is re-quired for fixed-interval performance because the hazardfunction does not map onto response rate One could usethe hazard function with added variability to explain bothfixed- and random-interval performance but this wouldlead to a departure from constancy in the random-intervalcase and therefore would not accurately fit the data
A third proposal has been to assume that temporal con-trol over behavior decreases as variability increases so thatfixed intervals exhibit strong control but (exponential)random intervals exhibit no control over behavior (Lund1976)
All three approaches propose different processes in ran-dom and fixed intervals This leads to the unparsimoniousconclusion that there may be multiple timing systems eachtuned to a different distribution form A simpler alternativewould be to assume that temporal performance is controlledby some common aspect of different distribution forms
In addition to an examination of the effects of variabil-ity on responding the present experiment provided an as-
Figure 1 The density survival hazard and conditional expected time functions for a fixed-time(FT) 90-sec a random-time (RT) 90-sec or a tandem FT75ndashRT15-sec interval The horizontal axisof each panel of the figure is the time since an event such as stimulus onset or food delivery
EXPECTED TIME TO REINFORCEMENT 5
sessment of the role of mean interval duration Intervalduration usually is negatively related to measures of re-sponse rate or strength (Bitterman 1964 Black 1963de Villiers amp Herrnstein 1976 Gibbon Baldock LocurtoGold amp Terrace 1977 Herrnstein 1970 Salafia Terry ampDaston 1975 Schneiderman amp Gormezano 1964) Thisrelationship is often reported to be nonlinear in form (egHerrnstein 1970) Predictions of the rate of respondinghave traditionally required a separate explanation frompredictions of the pattern of responding in interval-basedprocedures For example Herrnsteinrsquos hyperbolic rule(de Villiers amp Herrnstein 1976 Herrnstein 1970) predictsthat the absolute rate of responding is a nonlinear functionof the rate of reinforcement (the reciprocal of interval du-ration) Herrnsteinrsquos rule provides a good quantitative fitto mean response rate data obtained under both fixed- andrandom-interval schedules of reinforcement (Davison ampMcCarthy 1988) but it does not make any predictionsabout the timing of responding during the interval
The main goal of the present paper is to integrate the effects of interval distribution form and mean interval du-ration with a theoretical framework that also predictsfixed-interval performance It has been proposed that theconditional expected time function could predict respond-ing under both fixed- and random-interval distributions(Kirkpatrick amp Church 2000b) Rats were trained with FT90-sec RT 90-sec or tandem FT75ndashRT15-sec schedulesof food delivery (In this tandem schedule food was de-livered after 75 sec plus a random time with a mean of15 sec) The form of the response rate function was nega-tively related to the form of the conditional expected timefunction (bottom of Figure 1) linearly increasing rates ofresponding for FT relatively constant response rates forRT and increasing response rates during the FT portionand relatively constant response rates during the RT por-tion of the tandem schedule
The conditional expected time function shown in thebottom row of Figure 1 is the mean expected time untilthe next food delivery at t sec after an event The condi-tional expected time function is given in Equation 1where f(x) is the density function of the variate x (Figure 1top row) and St is the survival function at time t (Fig-ure 1 second row) The density function f (x) is the prob-ability density of food delivery at x sec after an event Thesurvival function St is the probability that food will nothave occurred by time t in the interval
(1)
For simple density functions such as the ones used inthe present experiment the conditional expected timefunction can be calculated explicitly (see Appendix A)and for any empirical probability density function theconditional expected time function can be obtained by nu-merical integration with the duration of the units (dx) setat some short interval
The expected time functions may also predict the effectof interval duration on the mean rate of responding The
mean interval duration is equal to the expected time at in-terval onset In Figure 1 the expected time to food imme-diately after an event (such as food or stimulus onset) is90 sec for the FT90 RT90 and FT75ndashRT15 intervals Thusthe mean rate of responding on all three of these distribu-tion types should be the same even though the pattern ofresponding should be different
The present experiment attempted to expand on thefindings of Kirkpatrick and Church (2000b) by deliveringfour interval durations from each of three distributionforms fixed random and tandem The experiment as-sessed the generality of the expected time function in pre-dicting response rate and form across a range of intervaldurations and distribution forms If successful a single-process account could serve to unify a large set of empir-ical phenomena in both classical and operant conditioning
METHOD
SubjectsSixty male Sprague Dawley rats (Taconic Laboratories German-
town NY) were housed individually in a colony room on a 1212-hlightdark cycle (lights off at 845 am) Dim red lights provided il-lumination in the colony room and the testing room during the darkphase The rats were fed a daily ration that consisted of 45-mg Noyespellets (Improved Formula A) that were delivered during the exper-imental session and an additional 15 g of FormuLab 5008 food givenin the home cage shortly after the daily sessions Water was availablead lib in both the home cages and the experimental chambers Therats arrived in the colony at 49 days of age and began training whenthey were 67 days old
ApparatusEach of the 12 chambers (25 3 30 3 30 cm) was located inside
of a ventilated noise-attenuating box (74 3 38 3 60 cm) A cham-ber was equipped with a food cup and a water bottle A magazine pel-let dispenser (Model ENV-203) delivered 45-mg Noyes (ImprovedFormula A) pellets into the food cup Each head entry into the foodcup was transduced by an LED photocell The water bottle wasmounted outside the chamber water was available through a tubethat protruded through a hole in the back wall of the chamber TwoGateway 486 DX266 computers running the Med-PC Medstate No-tation Version 20 (Tatham amp Zurn 1989) controlled experimentalevents and recorded the time at which events occurred with 10-msecresolution
ProcedureThe rats received single food pellets on FT RT or tandem FTndashRT
schedules The pellets were delivered regardless of any behavior ofthe rats There were four FT schedules of FT45 FT90 FT180 andFT360 sec four RT schedules of RT45 RT90 RT180 and RT360sec and four tandem schedules of FT45ndashRT45 FT45ndashRT90FT90ndashRT45 and FT90ndashRT90 sec For the FT groups food was de-livered at regular intervals For the RT groups the foodndashfood inter-val was an exponential distribution with an appropriate mean whichis a standard and eff icient way of generating random variables 1
(Evans Hastings amp Peacock 1993) For the FTndashRT groups foodwas delivered after a fixed duration plus an exponential random du-ration For example in the FT45ndashRT45 condition once food was de-livered the next food could not occur for at least 45 sec and wouldoccur on average after 90 sec There were no external cues to sig-nal the fixed or random portions of the foodndashfood interval These in-tervals are expressed as an FT followed by a random waiting timebecause psychologically the fixed minimum delay would seem tooccur first However the schedule could be expressed as a random
Ex f x
Sdx tt
tx t
= eacuteeumlecirc
-=
yen
ograve( )
6 KIRKPATRICK AND CHURCH
duration followed by a fixed duration because the sum of two vari-ables is the same regardless of order
The rats were randomly assigned to the fixed random and tan-dem conditions There were a total of 6 rats per group in the fixedand random conditions and 3 rats per group in the tandem condi-tions Each session lasted for 2 h and each group was trained untilapproximately 320 reinforcements had been received This required2 4 6 8 and 16 sessions for groups that received mean interval du-rations of 45 90 135 180 and 360 sec respectively
Data AnalysisThe time of occurrence of each head entry into the food cup (each
time the photobeam was interrupted) and the time of each food de-livery were recorded with 10-msec accuracy Several measures ofperformance were calculated over the last half of training
Local response rate Local response rates were determined overthe foodndashfood interval by calculating the number of responses (N t)and the number of seconds of opportunity to response (Ot ) in each5-sec bin following food delivery When the intervals were fixedthe number of seconds of opportunity to respond in each 5-sec in-terval was equal to the total number of foodndashfood intervals includedin the analysis when the intervals contained a random componentthe number of seconds of opportunity to respond differed from binto bin Local rate expressed as responses per minute was then de-fined in each bin as 60Nt Ot
Bout analyses A bout should include responses that are suffi-ciently close to constitute a run of responding but should not in-clude longer pauses that indicate a break in responding Figure 2contains the distribution of IRTs across all the rats plotted in loga-rithmically spaced bins The distribution of IRTs was bimodal withone mode of about 1 sec a trough of about 10ndash20 sec and a secondmode of about 50 sec The mode of short IRTs primarily containspauses in responding during a bout and the mode of long IRTs con-tains pauses between bouts
The optimal criterion for defining bouts would lie between thetwo modes because it would include the short IRTs within the boutbut would exclude longer pauses between bouts The optimal crite-rion was determined using a method proposed by Tolkamp and Kyr-
iazakis (1999) First a distribution of log IRTs was obtained (Fig-ure 2) If responses occur in bouts this distribution should be bimodalSecond the bimodal IRT distribution was fit with a double-Gaussian(Equation 2) where p is the probability that an interresponse timefalls in the first distribution m1 is the mean of the first distributions1 is the standard deviation of the first distribution m2 is the meanof the second distribution and s2 is the standard deviation of the sec-ond distribution The parameter settings that yielded the best fit withan v2 of 98 were p 5 78 m1 5 017 s1 5 071 m2 5 166 and s2 5038 The means in seconds were m1 5 150 sec and m2 5 4586 secThe two underlying single distributions were determined from theparameter settings The cross point of the two distributions is the op-timal criterion that minimizes the probability of misclassifyingIRTs2 For the data in Figure 2 the optimal criterion was 178 secand the probability of misclassification was 07 Some misclassifi-cation is unavoidable because the distributions overlap
(2)
Within each foodndashfood interval the start of a bout was identifiedwhen the IRT between two consecutive responses was less than orequal to 178 sec the first response in the pair was tagged as the startof a bout The end of a bout was identified as the last response be-fore a pause in responding of 178 sec or longer Any number ofbouts could be identified in a foodndashfood interval but a bout couldnot continue beyond the time that food was delivered Responsesrarely occurred outside of bouts Across all of the groups the re-sponse rate between bouts was 03 responsesmin
Several summary measures of the bouts were calculated (1) thenumber of responses in a bout (2) bout duration (3) the responserate in a bout in responses per minute and (4) the IRT in a bout Inaddition analyses were conducted on the pauses between bouts de-fined as the time from the end of one bout until the start of the nextbout in a foodndashfood interval this analysis required at least two boutsin an interval
Probability of being in a bout Using the start and end times foreach bout a calculation was made of the probability of being in about during each second of the foodndashfood interval Each 5-sec binduring which the rat produced a bout was filled with a 1 If a boutstarted at 348 sec and ended at 412 sec the 5-sec bins starting with30 sec and ending with 45 sec would be filled The probability ofbeing in a bout was then the total number of 1s in each bin dividedby the total number of foodndashfood intervals
RESULTS
Local Response RatesThe local rate of responding was examined for each
group to determine the effect of interval duration and dis-tribution form on the rate and pattern of responding intime Figure 3 displays the response rate functions for thegroups that received fixed (top panel) random (middlepanel) or tandem (bottom panel) durations between suc-cessive food deliveries All of the groups produced an ini-tial high rate of responding probably owing to consump-tion of the previous food pellet Following that there werenoticeable differences in the response rate functions Thegroups that received fixed intervals produced increasingresponse rate functions the groups that received randomintervals produced relatively constant response rate func-
y pt
pt
t =- -aelig
egraveccedilouml
oslashdivide
+ -- -aelig
egraveccedilouml
oslashdivide
1
2 2
1 1
2 2
1
12
12
2
22
22
s p
m
s
s p
m
s
exp( )
( ) exp( )
Figure 2 Bimodal distribution of interresponse times in equal005-sec log10 time intervals The heavy line is the best-fitting double-Gaussian function The dashed lines are the underlying single-Gaussian functions The point where the two single-Gaussianfunctions cross (178 sec) is the optimal interresponse time crite-rion for determining the boundaries between bouts
EXPECTED TIME TO REINFORCEMENT 7
tions and the groups that received tandem intervals pro-duced response rate functions that contained an increasingportion followed by a relatively constant portion
Overall Response RatesShorter intervals resulted in higher response rates than
did longer intervals This effect is displayed more clearly
in Figure 4 plotted on double-log coordinates with dif-ferent distribution forms marked by different symbols Amean response rate was calculated for each rat beginningat 21 sec after food delivery and continuing until the nextfood delivery the first 20 sec were removed because theconsumption of the food resulted in a temporary increasein responding that was unrelated to the anticipatory re-sponse The points in Figure 4 are the means for the ratsin each group The mean rates fell along a single straight-line fit with a slope of 2098 and an intercept of 266 allof the data points fell within the 95 confidence intervalband (dashed lines) A regression analysis was conductedon the log response rates with the factors of log intervalduration and distribution form with factors entered si-multaneously The overall regression model was signifi-cant [F(29) 5 129 p 01] Log interval duration wasa predictor of log response rate [t(4) 5 251 p 01] butdistribution form was not [t(2) 5 205]
Response BoutsThe local response rate curves in Figure 3 were com-
posed of many individual bouts Figure 5 displays distri-butions of four measures of the response bouts the num-ber of responses per bout (top left panel) bout duration(bottom left panel) the IRTs in a bout3 (top right panel)and the response rate in a bout (bottom right panel) Eachpanel of the figure contains separate curves for the groupsthat received fixed random or tandem schedules Thecurves are averaged across interval duration which hadno effect on the shape of the curves The means of eachmeasure are presented in Table 1 for individual groups Onestriking feature of Figure 5 (and Table 1) is that interval
Figure 3 Effects of interval distribution form and mean inter-val duration on the response rate in responsesminute as a func-tion of time since food for the fixed random and tandem condi-tions
Figure 4 Mean response rate is negatively related to mean in-terval duration The mean response rate in log10 responsesmin-ute as a function of mean interval duration in log10 seconds Eachdata point is the mean of all the rats that received a particularcondition of training The solid line through the data points is thebest-fitting straight-line regression and the dashed lines show the95 confidence intervals
8 KIRKPATRICK AND CHURCH
distribution form and interval duration had no effect onthe characteristics of the response bouts This was con-firmed by an analysis of variance (ANOVA) conducted onthe mean number of responses bout duration responserate and IRTs (see Table 1) which revealed no effect ofinterval duration [all Fs(449) 1] or distribution form [allFs(249) 1] and no interaction [all Fs(449) 1]
The probability decreased geometrically as a functionof the number of responses in a bout with a minimum of2 responses (see the Data Analysis section) and a mean of57 responses (see Table 1) The probability decreased ex-ponentially as a function of bout duration with a mean of127 sec The probability decreased exponentially as a func-tion of IRT with a mean of 30 sec The probability in-creased as a function of the response rate (in responsesminute) up to approximately 15 responsesmin and thendecreased exponentially the median response rate was408 responsesmin A median was used instead of a meanbecause there were occasionally very large outliers at thetail of the distribution of response rates This was typically
caused by bouts that contained two responses very closetogether in time
Although the overall distribution of IRTs was approxi-mately exponentially distributed it is possible that suc-cessive IRTs were not randomly distributed For examplethere may have been a tendency to engage in shortndashlongoscillations in the time between responses or the IRT mayhave decreased or increased over the course of the boutFor each response bout containing at least four responsesan autocorrelation was calculated on the IRTs A secondautocorrelation was calculated on a random ordering ofthe IRTs in each bout4 If a pattern was present in the IRTsthe autocorrelation of the actual ordering of the IRTswould be different from the autocorrelation of the randomordering
For each rat the mean autocorrelation across packetscontaining at least four responses was determined thesemeans were entered into an ANOVA There was no dif-ference in the autocorrelation between original (r 5 222)and random (r 5 222) ordering of the IRTs [F(149) 1]
Figure 5 Invariance in the bout characteristics The curves for the fixed random and tandem condi-tions are the means across all the rats that received a particular interval distribution form Top left panelthe probability distribution of the number of responses per bout Top right panel the probability distrib-ution of interresponse times during a bout in successive 01-sec intervals Bottom left panel the probabil-ity distribution of bout durations in successive 1-sec intervals Bottom right panel the probability distri-bution of response rates in responsesminute during a bout
EXPECTED TIME TO REINFORCEMENT 9
There was also no effect of interval duration [F(449) 513] or distribution form [F(249) 1] and no interaction[F(449) 5 13] on the original autocorrelations
Time Between BoutsAlthough the response bouts were unaffected by inter-
val duration or distribution form both variables affectedthe form and rate of responding Therefore the differentconditions of training must have differentially affected themomentary rate of bout production Figure 6 contains theprobability distribution of pauses between bouts for thedifferent conditions The distribution of pauses fell moregradually as interval duration was increased The proba-bility of observing long pauses increased with interval du-ration and the probability of observing short pauses de-creased The mean duration between bouts increased as afunction of interval duration from around 22 sec in the 45-sec conditions to around 110 sec in the 360 sec conditionsOne-way ANOVAs conducted on the mean time betweenbouts revealed a significant effect of interval duration[F(449) 5 1400 p 001] but no effect of distributionform [F(249) 5 18] and no interval duration 3 distribu-tion form interaction [F(449) 1]
Probability of Being in a BoutA second measure that would reflect differences in the
momentary probability of bout occurrence is the proba-bility of being in a bout as a function of time in the inter-val (see the Data Analysis section) This is shown in Fig-ure 7 for the fixed random and tandem groups of ratsThe shape of these functions is essentially the same as theshape of the response rate functions Following the initialreaction to food delivery the fixed groups produced lin-early increasing functions the random groups producedconstant functions and the tandem groups produced lin-early increasing functions followed by constant functionsMoreover shorter interval durations resulted in a higherprobability of being in a bout
DISCUSSION
The Temporal Structure of BoutsThe present experiment identified two forms of tempo-
ral structure in the behavior of rats on temporal condi-tioning procedures First the response rate functions werecomposed of bouts that were unaffected by interval dura-tion or distribution form (Figure 5 and Table 1) The boutcharacteristics were consistent with a random generatingprocess containing approximately six responses emitted
Table 1Bout Characteristics for Each of the Fixed Random
and Tandem Interval Groups
Mean No of Mean Bout Response Rate MeanGroup Responses Duration (sec) (responsesmin) IRT
FT45 64 140 348 28FT90 55 119 413 27FT180 54 149 378 36FT360 48 104 400 26RT45 64 161 353 30RT90 80 144 433 25RT180 53 113 406 30RT360 50 119 329 30FT45ndashRT45 94 193 401 23FT45ndashRT90 45 121 377 37FT90ndashRT45 37 66 662 29FT90ndashRT90 41 96 390 33
Mean 57 127 408 30
NotemdashThe distributions of number of responses bout duration and in-terresponse time (IRT) were approximately exponential In an exponen-tial distribution about two thirds of the samples will fall below the mean(Evans Hastings amp Peacock 1993)
Figure 6 Probability distribution of pauses between bouts forfixed (top panel) random (middle panel) and tandem (bottompanel) intervals of different mean durations
10 KIRKPATRICK AND CHURCH
with an average IRT of about 3 sec The distributions ofthe number of responses in a bout bout duration and IRTin a bout were approximately exponential in form andthere were no sequential dependencies between the IRTsof successive response pairs This suggests that the struc-ture of the bouts is unpredictable
The observation of bouts of behavior was made by Skin-ner (1938) who found that bursting of responses was in-dependent of schedule type and attributed it to some char-acteristic inherent in the organisms themselves (p 125)Subsequently the bout-like nature of many operant andrespondent behaviors such as leverpresses keypecks ori-enting responses magazine behavior and drinking hascome to be well accepted (eg Blough 1963 Corbit ampLuschei 1969 Fagen amp Young 1978 Gilbert 1958 Mell-gren amp Elsmore 1991 Nevin amp Baum 1980 Pear amp Rec-tor 1979 Robinson Blumberg Lane amp Kreber 2000Schneider 1969 Shull Gaynor amp Grimes 2001 Skinner1938 Slater amp Lester 1982) Because bouts of behaviorare composed of short IRTs prior findings that short IRTsare relatively insensitive to experimental manipulationsas compared with longer IRTs (Blough 1963 Schaub1967 Shull amp Brownstein 1970) are consistent with thepresent findings regarding the invariance of bouts Thepresent analysis expands on earlier observations by demon-strating that many characteristics of bouts are invariantacross a range of interval durations and distribution forms
Organization of BoutsWhen rats were trained with fixed random and tandem
intervals of different durations between successive fooddeliveries the local response rate as a function of timesince food was affected by the distribution of intervals Onfixed intervals response rates increased linearly on randomintervals response rates were relatively constant on tan-dem intervals response rates increased linearly during theFT portion and then were constant during the RT portion(Figure 3) The forms of the response rate functions underthe fixed and the random durations are consistent withprevious reports in the literature (Catania amp Reynolds1968 Kirpatrick amp Church 2000a 2000b LaBarbera ampChurch 1974 Libby amp Church 1975 Lund 1976) Thepattern of responding under tandem schedules extends theearlier f inding of Kirkpatrick and Church (2000b) bydemonstrating that the shape of responding is the sameacross different FT and RT combinations The responserate gradients for the tandem groups indicate that the ratsdiscerned that there was a minimum delay until the nextfood after which food occurred at random times
Additional analyses indicated that the response ratefunctions were related to the conditional expected time tofood The mean response rate over the foodndashfood intervalwas negatively related to the mean interval duration (Fig-ure 4) which is encoded as the conditional expected timeto food at interval onset The effect of interval duration onmean response rate appeared to be due to a higher rate ofbout production (Figure 7) which was also seen in theshorter pause times between bouts with shorter interval
durations (Figure 6) Thus it appears that when the con-ditional expected time was shorter bouts of behavior oc-curred with higher probability and with shorter interbout
Figure 7 The effects of interval distribution form and mean in-terval duration on the probability of being in a bout as a functionof time since the previous food delivery for the fixed random andtandem conditions
EXPECTED TIME TO REINFORCEMENT 11
pauses and that this resulted in an increase in overall re-sponse rate In other words the mean foodndashfood intervalcontrolled the momentary rate of bout production not themomentary rate of responding or the rate of responding ina bout
Theoretical SignificanceThe invariance in the bout characteristics implies that the
response bout may be a basic unit of behavior The mostimportant feature of the bout analysis is that the externalcharacteristics of bouts (eg pause times between boutsrate of bout occurrence or time of occurrence of bouts) ofdifferent behaviors may be similar even though the inter-nal characteristics of the bouts (eg number of responsesIRTs duration and response rates) may be different fordifferent behaviors
One problem with conventional accounts of respondingunder different interval distribution forms has been thatdifferent explanations have been used to account for dif-ferent dependent variables such as the overall response rateand the form of the response gradient Given that thesetwo dependent variables are extracted from the same re-sponse stream it would be desirable to use a single processwith a single set of assumptions to predict these depen-dent measures Another problem with conventional ac-counts has been that different explanations have been usedto account for the different forms of responding underfixed- and random-interval schedules of reinforcement Itwould be desirable to use a single process with a single setof assumptions to predict the effects of different distribu-tion forms
The conditional expected time function provides a basisfor predicting both response rate and form under differentinterval distributions with a single mechanism The pat-tern of responding in the three different distribution formswas inversely related to the conditional expected timefunction which reflects the momentary expected time re-maining until food as a function of time since the last food(Figure 1) The conditional expected time function for afixed interval starts at the duration of the fixed intervaland decreases linearly until the time of food delivery theconditional expected time function for a random intervalis constant at the mean of the random-interval distribu-tion and the conditional expected time function for a tan-dem interval starts at the duration of the sum of the fixedinterval and the mean of the random interval decreaseslinearly during the fixed portion and then remains con-stant at the mean of the random interval The expectedtime function was the only characterization of the intervaldistributions in Figure 1 that consistently mapped onto theresponse forms under all three distributions
By using the conditional expected time function onecan invoke the same process for generating respondingunder fixed random tandem and all other interval distri-butions In other words all intervals are timed regardlessof distribution form but the distribution form determinesthe pattern of responding in time In both the timing andthe conditioning literatures responding that is generated
under fixed and random conditions is typically assumed tooccur via separate processes For example when food isdelivered at fixed intervals it is normally assumed that theincreasing rate of responding over the course of the USndashUS interval is due to temporal conditioning (Pavlov1927) or timing of the USndashUS interval On the otherhand when food is delivered at random intervals it is nor-mally assumed that responding is due to conditioning tothe experimental context through an associative mecha-nism (Balsam amp Tomie 1985) The application of differ-ent mechanisms to explain responding under conditionsin which food is delivered at fixed versus variable inter-vals has also been used with scalar timing theory (Brun-ner et al 1997 Brunner et al 1996) The different treat-ment of responding under fixed and random intervals isperhaps best exemplified by Gallistel and Gibbonrsquos (2000)time-based model of conditioning that involves multipledecision processes One of the processes in this modelldquodecides whether there is one or more (relatively) fixedlatencies of reinforcement as opposed to a random distri-bution of reinforcement latencies This fourth process me-diates the acquisition of a timed responserdquo (Gallistel ampGibbon 2000 p 307)
Packet TheoryThe conditional expected time function was imple-
mented in order to predict the effects of interval durationand distribution form on responding The implementationpacket theory used a single mechanism with the same as-sumptions and same parameter settings for all of the con-ditions
The two forms of temporal structure that were observedin the data form the fundamental architecture of the model(see also Kirkpatrick 2002) The basic principles of packettheory are that (1) responses occur in packets containinga random number of responses that occur at random in-terresponse intervals and the mean number of responses ina packet and the mean interresponse interval are invariantacross conditions of training and (2) the momentary prob-ability of producing a packet of responding is determinedby the conditional expected time function Note thechange in terminology from bout to packet Hereafterpackets will refer to bursts of responses issued by themodel and bouts will refer to the observed bursts pro-duced by the model and the rats This distinction is nec-essary because two or more packets may occur in closeenough succession to produce responses that would beclassified as a single long bout
Packet theory contains four modulesmdashperception mem-ory decision and packet generationmdashwhich are diagrammedin Figure 8 for fixed random and tandem intervals Spe-cific details about the implementation of the model arepresented in Appendix B
Perception The perceptual process generates an ex-pectation for each interval et at the time of food deliveryshown in the left portion of Figure 8 Each box displays anexpectation for an individual interval The individual ex-pectations encode the amount of time that has passed
12 KIRKPATRICK AND CHURCH
since a predictor event In the present study the predictorevent would be the prior food delivery but it could be anystimulus event The formation of the individual expecta-tion is triggered by the delivery of a to-be-predicted eventsuch as food Thus the expectations are not updated inreal time but are generated when an event such as food oc-curs (see Appendix B)
The individual expectations decrease linearly as a func-tion of time since the predictor event for each second
since the event the expectation decreases by 1 sec A fixedinterval of 90 sec would yield individual expectations thatalways decreased linearly from a value of 90 to 0 sec butthe expectations for a random or tandem interval wouldvary (see Figure 8) For example on one occasion the random interval might be 4 sec which would result in anexpectation that decreased from 4 to 0 sec On another oc-casion the random interval might be 52 sec which wouldresult in an expectation that decreased from 52 to 0 sec
Figure 8 Packet theory for determining the momentary probability of producing apacket of responding for a 90-sec fixed-time (FT) a 90-sec random-time (RT) and atandem schedule with a mean of 90 sec At the time of food delivery the expectationfor the previous interval (et ) is recorded as a function that decreases linearly over theduration of the interval The most recent interval is added to memory with a linearweighting rule producing the expected time function (Et ) which is the mean expectedtime to food as a function of time since an event (eg food) To determine the proba-bility of producing a packet (pt ) the expected time function is transformed using therule
and is multiplied by n the expected number of packets per interval (see Appendix Bfor details)
EE
Et
t
tt
D
=
=-[ ]
( ) - eacute
eumlecircaring
max( )
max
E
E0
EXPECTED TIME TO REINFORCEMENT 13
Packet theory assumes that subjective time is linearlyrelated to objective time For the present implementationthere were no sources of bias or error in subjective timebut error could be introduced by assuming that the currentinterval duration (d ) is perceived with some variance Forsimplicity of exposition sources of error were omittedfrom the present implementation because they were notneeded to predict the present results
Memory Once a new expectation is generated it isadded to the memory structure Et which contains theweighted sum of all intervals experienced in the past Theweight given to new expectations can be between 0 (no ef-fect) and 1 (maximum effect) A large weight generates anasymptote rapidly but with considerable variability a smallweight generates this asymptote more slowly but with lowvariability
With small to intermediate weights the asymptoticconditional expected time function in memory closely ap-proximates the functions in the bottom panels of Figure 1Thus fixed intervals decrease linearly random intervalsare constant at the level of the mean and tandem intervalsdecrease during the fixed portion and then remain con-stant at the level of the mean of the random portion
Decision The conditional expected time in memorypredicts the time of the upcoming food delivery The de-cision module produces packets on a probabilistic basisusing a transformed version of the conditional expectedtime function The probability of packet generation ( pt) isinversely related to the expected time in memory Theprobability function is calculated by reversing the direc-tion of the conditional expected time function and then byconverting the times into probabilities by dividing by thesum of all values in the function (see Appendix B) Theresulting probability is multiplied by n the expected num-ber of packets per interval The sum of all values in theprobability function is equal to n The expected number ofpackets is a responsiveness parameter that is presumablyaffected by the time and effort for making a response andthe quality or quantity of reinforcement Packets of foodcup behavior were generated in two ways (1) food deliverywhich immediately elicited a response packet with someprobability and (2) the anticipation of an upcoming fooddelivery which stochastically elicited response packets
The response rate functions produced by the model willclosely mirror the shape of the probability functions andwill be the inverse of the shape of the conditional expectedtime in memory (Figure 8) In addition the effect of in-terval duration on mean response rate falls directly out ofthe decision module If n were set to 40 then on a 45-secinterval there would be 0088 packets per second (4 packets45 sec) and on 90- 180- and 360-sec intervals therewould be 0044 0022 and 0011 packets per second re-spectively The mean response rate is a direct function ofthe number of packets per second in the interval which isinversely related to mean interval duration
Packet generation The characteristics of the responsepackets in the model were determined by the data from therats (see Figure 5 and Table 1) The top portion of each of
the decision panels in Figure 8 contains sample responsepackets The longer vertical lines are responses that startedand ended packets and the shorter lines are responses inthe middle of packets The packets contained a randomnumber of responses and lasted for a random duration Be-cause the response packets were the same for all the con-ditions there were only two parameters that affected theproduction of anticipatory response packets in the presentversion of packet theory (1) a which controlled the rela-tive weight given to new intervals stored in memory and(2) n the expected number of response packets in an in-terval Because all of the analyses from the rats and themodel were conducted at asymptote the parameter awould have little or no effect on the outcome A third pa-rameter was r the probability of producing a reactivepacket following food delivery (see the descriptionbelow)
Model SimulationsSimulations of packet theory were conducted in Mat-
Lab (The Mathworks Natick MA) using the implemen-tation procedures described in Appendix B The model re-ceived training on each of the procedures for a total of1920 intervals The number of intervals received by themodel was equal to the sum of the intervals received byeach of the fixed and random groups of rats (320 intervalsper rat 3 6 rats 5 1920 intervals) The same parametersettings for generating anticipatory packets were used forthe simulation of all 12 interval conditions that were de-livered to the rats with a 5 05 and n 5 19 The time ofeach food delivery passed to the model and each responsemade by the model was recorded with a time stamp with10-msec resolution
Anticipatory packets of responding were initiated bythe model if the probability of packet production pt ex-ceeded a random number X that was uniformly distributedbetween 0 and 1 Reactive packets were produced follow-ing food delivery these were initiated with some proba-bility r with a mean of 77 (range 55ndash10 for differentmodel simulations on different conditions) The rats onaverage produced reactive packets 75 of the time indi-cating that the food pellet was sometimes consumed dur-ing a packet that would be considered anticipatory of theupcoming food delivery Although the probability of a re-active packet was added as a parameter to the model itwas only required for an accurate description of headentry responding in the first few seconds following fooddelivery
Each packet contained a random number of responsesthat were approximately exponentially distributed andlasted for a random duration If the model called for a newpacket before a previous packet was finished the newpacket began while the previous packet continued Thisrule resulted in summation of the new packet with a por-tion of the old packet Thus two theoretical packets calledfor by the model may produce a single observed bout thatwould be detected using the data analysis routines (see theFT90 condition in Figure 8 for an example of two packets
14 KIRKPATRICK AND CHURCH
running together) Responses were not generated outsideof packets
The modelrsquos observed bout characteristics are shown inFigure 9 for the fixed random and tandem intervals Allfour distributions were similar to those for the rats (Fig-ure 5) The model produced bouts that contained 56 re-sponses emitted over a mean duration of 119 sec with amedian response rate of 378 responsesmin in a bout anda mean IRT of 26 sec in a bout The bout characteristicswere highly similar to those for the rats (mean v2 5 90)The fact that bouts closely approximating those of rats canbe obtained with a random generating process indicatesthat the bout characteristics probably emerge from a sim-ple process
Figure 10 contains the response rate functions producedby the model for each of the training conditions as a func-tion of time since food The fixed random and tandemschedules are displayed in separate panels of the figureThere are a number of similarities between the data fromthe rats (Figure 3) and the data from the model (1) The re-sponse rate functions were initially high and then de-creased for 5ndash10 sec following the receipt of food butthereafter the response rate functions differed between
conditions of training (2) response rates increased lin-early for FT schedules were relatively constant for RTschedules and increased linearly and then were relativelyconstant for the tandem schedules (3) shorter mean inter-val durations resulted in higher rates of responding thandid longer interval durations and (4) the overall responserates produced by the model were similar to the responserates produced by the rats (note that the same responserate scale was used for Figures 3 and 10) The v2 was cal-culated for each of the model fits to the group curves inFigure 3 The mean v2 for the fixed groups was 92 forthe random groups it was 87 and for the tandem groupsit was 86
The effect of mean interval duration on the mean re-sponse rate produced by the packet model is shown in Fig-ure 11 which is plotted on a logndashlog scale as were the ratdata in Figure 4 The mean response rate by the model wascalculated from 21 sec after food until the mean intervalduration as with the rats The solid line through the datapoints is the straight-line regression on the function relat-ing log mean response rate to log interval duration whichhad a slope of ndash10 and an intercept of 277 (r 2 5 99 p 001) The regression parameters for the model were sim-
Figure 9 Bout characteristics produced by simulations of packet theory Top left the probabil-ity distribution of the number of responses per bout Top right the probability distribution of in-terresponse times during a bout in successive 01-sec intervals Bottom left the probability distri-bution of bout durations in successive 1-sec intervals Bottom right the probability distribution ofresponse rates in responsesminute during a bout
EXPECTED TIME TO REINFORCEMENT 15
ilar to the regression parameters from the rat data whichhad a slope of ndash098 and an intercept of 266 However themodel predicted much less variability in responding todifferent interval distributions with the same mean inter-val duration The v2 for the model fits to the mean re-sponse rates in Figure 4 was 74 The poor fit of the modelto the data was due to the modelrsquos overpredicting responserates in the RT45-sec and tandem FT45ndashRT45-sec groupsIt is not clear why the RT45 sec condition failed to pro-duce a higher response rate than did the RT90-sec condi-
tion in the rats (Figure 3) given that the rate of reinforce-ment was doubled in the RT45-sec condition Doubling ofthe reinforcement rate would normally produce a notice-able increase in response rate (eg de Villiers amp Herrn-stein 1976)
Theory Evaluation and ExtensionsThere are at least four features that a good theory should
possess It should be simple inflexible accurate and gen-eral A simple theory should have a small number of freeparameters Packet theory contains three parameters forgenerating packets a n and r There were two additionalparameters for generating responses within packets butthese would be allowed to vary only across response typesand therefore would not be classified as free parametersThe responsiveness parameter n was the primary parame-ter that was adjusted in the present simulations the mem-ory updating parameter a is relatively unimportant forpredicting asymptotic behavior and the reactive packet pa-rameter r would be used only in situations in which mod-eling the unconditioned (reactive) response is desired Aninflexible theory should have a limited number of possi-ble outcomes for a given procedure (Cutting 2000) Packettheory is inflexible in that it predicts only a particular re-sponse form for a given distribution and a particular re-sponse rate for a given mean interval The overall respon-siveness can be manipulated by changing n but in thepresent implementation it was required that n be the samefor all the conditions If n were allowed to vary betweenconditions the goodness of fit would increase but themodel would become undesirably more flexible An ac-curate theory should fit data closely Packet theory ac-counted for a high percentage of the variance in the data
Figure 10 Results of the simulations of packet theory for thefixed random and tandem intervals received by the rats withthe parameters of a 5 05 and n 5 19 Each curve is the responserate produced by the model in responsesminute as a function oftime since food
Figure 11 Results of the simulations of packet theory Eachpoint in the curve is the log10 of the mean response rate producedby the model as a function of the log10 of the mean interval dura-tion
16 KIRKPATRICK AND CHURCH
accurately predicting the mean rate as a function of meaninterval duration the form of the response rate gradientsunder different conditions and the bout characteristicsThese data comprised more than 2000 points many ofwhich were independent A general theory should fit manymeasures of responding obtained under many differentprocedures Packet theory fit four dependent measures ofresponding obtained from 12 procedures However for thetheory to be considered truly general it will have to be ap-plied to a much wider range of procedures a task that isoutside the scope of the present article
A major strength of packet theory is that it provides aparsimonious single-process account of a variety of em-pirical phenomena that have traditionally involved sepa-rate explanations The most important contribution is theprediction of the rate and pattern of responding under anyinterval distribution using a single mechanism An impor-tant difference between packet theory and conventionalapproaches is the supposition that timing occurs under anyinterval distribution including random intervals and thatthe form and rate of responding in time is determined bythe intervals that have been received in training
A second contribution of the present approach is thatthe scalar property emerges automatically from the ex-pected time functions which are determined by the inter-val distribution form Response rate functions superposeif they are plotted on a relative time (and relative rate)scale This empirical observation has been referred to asthe scalar property (Gibbon 1977) Packet theory pro-duces the scalar property because a fixed 90-sec intervalwill have an expected time function that is three times aslong in duration as compared with a fixed 30-sec intervalTherefore the increasing portion of the response ratefunction will be three times as wide for a 90-sec intervalas for a 30-sec interval which is the scalar property oftime perception (see the Scalar Property in FT and FISchedules section in Appendix B for a more complete ex-planation) In contrast scalar timing theory (Gibbon ampChurch 1984 Gibbon et al 1984) which was developedto explain the scalar property produces scalar variation bythe addition of sources of variance in the perception mem-ory andor decision processes of the model which re-quires the parameters of mean and standard deviation foreach source of variance
The present data present considerable problems for the-ories of conditioning and timing Associative theories ofconditioning (eg Mackintosh 1975 Pearce amp Hall1980 Rescorla amp Wagner 1972) can produce respondingon temporal conditioning procedures if it is assumed thatconditioning occurs to the background but these modelsdo not produce temporal gradients of responding (Fig-ure 3) Real-time models of conditioning (eg Sutton ampBarto 1981 1990) can produce temporal gradients aswell as effects of the foodndashfood interval on mean responserate However these models have difficulty in producingthe scalar property and they do not produce the appropri-ate response form on random and tandem intervals Rateexpectancy theory (Gallistel amp Gibbon 2000) does not
predict any conditioning on temporal conditioning proce-dures because the critical factor is a comparison of ratesof reinforcement in the stimulus versus the backgroundGiven that the temporal conditioning procedure does notcontain a stimulus there is no basis for comparison andtherefore no basis for acquisition of responding Finallytiming theories (Church amp Broadbent 1990 Gibbon ampChurch 1984 Gibbon et al 1984 Machado 1997) accu-rately predict the pattern of responding on fixed intervalsbut they do not inherently predict interval duration effectson the mean response rate In many timing models re-sponse rates are adjusted after the simulations are con-ducted Temporal conditioning (also known as contextconditioning and magazine training) involves a single eventand a single distribution of interevent intervals and inmany respects is the simplest of conditioning proceduresThe failure of such a broad range of different theories topredict a small set of dependent variables in such a simpleprocedure motivates the search for new alternatives
Although packet theory provides a better account of thepresent data set than do alternative theories of condition-ing and timing it should be applied to a broader range ofphenomena to demonstrate generality Several extensionsare needed to expand the range of procedures that can bemodeled by packet theory
First the most natural and important extension of packettheory would be to implement the model to deal with twoor more intervals between events This extension is nec-essary to deal with a multitude of experimental proceduresin both operant and classical conditioning For example adelay conditioning procedure is defined by two intervalsfood to food and stimulus onset to food The extension ofpacket theory to the two-interval case requires two addi-tional assumptions but no additional parameters First isthe assumption that separate events such as food andstimulus onset establish separate expectations and sec-ond is the assumption that an expectation is activated atthe onset of its associated event and continues until fooddelivery In delay conditioning the food-initiated expec-tation would produce packets during the intertrial inter-val Following stimulus onset both food-initiated andstimulus-initiated expectations would be concurrently ac-tive and able to produce packets If a stimulus expectationinitiated a packet before a food-initiated packet was fin-ished temporal summation of packets would result in alonger observed bout One prediction of the model is thatif there are two sources of packet production responserate will be higher and observed bout durations will belonger than they would be if there were only one source ofpacket production (see Desmond amp Moore 1991 andKirkpatrick amp Church 2000a for evidence of summationof response strength during simultaneous timing of twointervals)
A limitation of the present version is that packet theorycannot predict the ogival mean response rate functionsthat are often observed under fixed intervals with moreextensive training This is a serious concern that may beaddressed by assuming that there is an ogival transforma-
EXPECTED TIME TO REINFORCEMENT 17
tion of the probability function by the decision module ofthe model An ogival transformation with the parametersof mean and slope can result in response forms includingrelatively constant linearly increasing ogival and stepfunctions The ogival transformation may prove particu-larly important in modeling dynamic changes in the formof the response rate function during acquisition (Machadoamp Cevik 1998) as well as in dealing with individual dif-ferences in the form of the response rate function Furtherwork will be needed to determine the effectiveness and va-lidity of adding two parameters to the model in order toproduce some flexibility in the response form from a sin-gle expected time function
Another limitation is that currently there is no meansof ceasing responding after the expected time of rein-forcement is surpassed as in the peak procedure (Roberts1981) One possibility would be to assume that packetscontinue to be initiated after the expected time of food haspassed but only until the expected number of packets nis reached Because packets are produced probabilisti-cally the expected number of packets may not be ex-hausted prior to the expected time of food These packetscould then be produced probabilistically after the ex-pected time of food which would lead to a decreasing re-sponse rate on the right side of the peak Further work willbe needed to determine whether this implementationwould be sufficient to produce peak functions of the ap-propriate form
Finally the present version produces packets of headentry behavior but it is possible that packet theory may beextended to other response systems The present analysismay be particularly applicable to discrete behaviors thatoccur in anticipation of upcoming food delivery such askeypecks leverpresses and orienting responses Themodel could be implemented for different responses bychanging the characteristics of the packets (number of re-sponses and IRT) The model may also be able to deal withsingle-response paradigms For example a packet of eye-blink responding would typically contain a single responsethat would change in magnitude over time The temporalcharacteristics of the eyeblink could be encoded in thepacket module Continuous responses such as conditionedfreezing or maze running may be modeled as a bout ofengagement with the relative time spent freezing or run-ning determined by the conditional expected time to foodFor example overall running speed in an alley is deter-mined by the relative time spent engaged in running thereis little change in running speed during a period of en-gagement (Cotton 1953 Drew 1939)
It is likely that the mechanics of the response affect thecharacteristics of the packet so these would need specify-ing for other response paradigms It is additionally possi-ble that experimental variables such as the size of thechambers sensitivity of the equipment (eg the amountof force required to close the switch when a lever is pressed)and the presence of a response contingency may affect thecharacteristics of the packets (Shull et al 2001)
Summary and ConclusionsThere are a number of important empirical observations
in the present data set that will need accounting for by cur-rent and future theories of timing and conditioning Firstis the effect of the form of the distribution of foodndashfoodintervals on the form of the response rate gradient Secondis the effect of interval duration on mean response rateThird is the observation that responding occurs in boutswith characteristics that are invariant across conditionsFourth is the observation that the bout characteristics ofnumber of responses IRT and bout duration appear toarise from a random generating process
The present article also provides some movement for-ward in the modeling of multiple dependent measures oneof which is usually considered a measure of conditioning(mean response rate) and one of which is traditionallyconsidered a measure of timing (response rate as a func-tion of time) within a single theoretical framework Al-though packet theory may require some extension to fit awide range of response forms under a wide range of pro-cedures the present implementation is a parsimonioussingle-process account of the rate and pattern of respond-ing on time-based schedules of reinforcement where a sin-gle interval is delivered with some mean and distributionform This approach challenges conventional accountswhich have required separate processes to explain the de-pendent measures of response rate and response form aswell as requiring separate assumptions to explain differentresponse forms obtained under different interval distribu-tions A single process with a limited set of parametersmay be sufficient to predict the results from a wide rangeof procedures in both operant and classical conditioning
REFERENCES
Anger D (1956) The dependence of interresponse times upon the rel-ative reinforcement of different interresponse times Journal of Ex-perimental Psychology 52 145-161
Balsam P D amp Tomie A (1985) Context and learning Hillsdale NJErlbaum
Bitterman M E (1964) Classical conditioning in the goldfish as afunction of the CSndashUCS interval Journal of Comparative amp Physio-logical Psychology 58 359-366
Black A H (1963) The effects of CSndashUS interval on avoidance con-ditioning in the rat Canadian Journal of Psychology 17 174-182
Blough D S (1963) Interresponse time as a function of continuousvariables A new method and some data Journal of the ExperimentalAnalysis of Behavior 6 237-246
Brunner D Fairhurst S Stolovitzky G amp Gibbon J (1997)Mnemonics for variability Remembering food delay Journal of Ex-perimental Psychology Animal Behavior Processes 23 68-83
Brunner D Kacelnik A amp Gibbon J (1996) Memory for inter-reinforcement interval variability and patch departure decisions in thestarling Sturnus vulgaris Animal Behaviour 51 1025-1045
Catania C A amp Reynolds G S (1968) A quantitative analysis ofthe responding maintained by interval schedules of reinforcementJournal of the Experimental Analysis of Behavior 11 327-383
Church R M amp Broadbent H A (1990) Alternative representa-tion of time number and rate Cognition 37 55-81
Church R M amp Lacourse D M (2001) Temporal memory of in-terfood interval distributions with the same mean and variance Learn-ing amp Motivation 32 2-21
18 KIRKPATRICK AND CHURCH
Corbit J D amp Luschei E S (1969) Invariance of the ratrsquos rate of drink-ing Journal of Comparative amp Physiological Psychology 69 119-125
Cotton J W (1953) Running time as a function of amount of food de-privation Journal of Experimental Psychology 46 188-198
Cutting J E (2000) Accuracy scope and flexibility of models Jour-nal of Mathematical Psychology 44 3-19
Davis J D (1996) Deterministic and probabilistic control of the be-havior of rats ingesting liquid diets American Journal of Psychology270 R793-R800
Davison M amp McCarthy D (1988) The matching law A researchreview Hillsdale NJ Erlbaum
Desmond J E amp Moore J W (1991) Altering the synchrony of stim-ulus trace processes Tests of a neural-network model Biological Cy-bernetics 65 161-169
de Villiers P A amp Herrnstein R J (1976) Toward a law of re-sponse strength Psychological Bulletin 83 1131-1153
Drew G C (1939) The speed of locomotion gradient and its relationto the goal gradient Journal of Comparative Psychology 27 333-372
Evans M Hastings N amp Peacock B (1993) Statistical distribu-tions New York Wiley
Fagen R M amp Young D Y (1978) Temporal patterns of behaviorsDurations intervals latencies and sequences In P W Colgan (Ed)Quantitative ethology (pp 79-114) New York Wiley
Gallistel R amp Gibbon J (2000) Time rate and conditioning Psy-chological Review 84 289-344
Gibbon J (1977) Scalar expectancy and Weberrsquos law in animal timingPsychological Review 84 279-325
Gibbon J Baldock M D Locurto C M Gold L amp Terrace H S(1977) Trial and intertrial durations in autoshaping Journal of Ex-perimental Psychology Animal Behavior Processes 3 264-284
Gibbon J amp Church R M (1984) Sources of variance in an infor-mation processing theory of timing In H L Roitblat T G Bever ampH S Terrace (Eds) Animal cognition (pp 465-488) Hillsdale NJErlbaum
Gibbon J Church R M amp Meck W H (1984) Scalar timing inmemory In J Gibbon amp L Allan (Eds) Timing and time perception(Annals of the New York Academy of Sciences Vol 423 pp 52-77)New York New York Academy of Sciences
Gilbert T F (1958) Fundamental dimensional properties of the oper-ant Psychological Review 65 371-380
Herrnstein R J (1970) On the law of effect Journal of the Experi-mental Analysis of Behavior 13 243-266
Killeen P R amp Fetterman J G (1988) A behavioral theory of tim-ing Psychological Review 95 274-285
Kirkpatrick K (2002) Packet theory of conditioning and timing Be-havioural Processes 57 89-106
Kirkpatrick K amp Church R M (2000a) Independent effects ofstimulus and cycle duration in conditioning The role of timingprocesses Animal Learning amp Behavior 28 373-388
Kirkpatrick K amp Church R M (2000b) Stimulus and temporalcues in classical conditioning Journal of Experimental PsychologyAnimal Behavior Processes 26 206-219
LaBarbera J D amp Church R M (1974) Magnitude of fear as afunction of expected time to an aversive event Animal Learning ampBehavior 2 199-202
Libby M E amp Church R M (1975) Fear gradients as a function of the temporal interval between signal and aversive event in the rat Journal of Comparative amp Physiological Psychology 88 911-916
Lund C A (1976) Effects of variations in the temporal distribution ofreinforcements on interval schedule performance Journal of the Ex-perimental Analysis of Behavior 26 155-164
Machado A (1997) Learning the temporal dynamics of behavior Psy-chological Review 104 241-265
Machado A amp Cevik M (1998) Acquisition and extinction underperiodic reinforcement Behavioural Processes 44 237-262
Mackintosh N J (1975) A theory of attention Variations in the as-sociability of stimuli with reinforcement Psychological Review 82276-298
Mellgren R L amp Elsmore T F (1991) Extinction of operant be-havior An analysis based on foraging considerations Animal Learn-ing amp Behavior 19 317-325
Nevin J A amp Baum W M (1980) Feedback functions for variable-interval reinforcement Journal of the Experimental Analysis of Be-havior 34 207-217
Pavlov I P (1927) Conditioned reflexes (G V Anrep Trans) NewYork Oxford University Press
Pear J J amp Rector B L (1979) Constituents of response rate Jour-nal of the Experimental Analysis of Behavior 32 341-362
Pearce J M amp Hall G (1980) A model for Pavlovian learningVariations in the effectiveness of conditioned but not unconditionedstimuli Psychological Review 87 532-552
Rescorla R A amp Wagner A R (1972) A theory of Pavlovian con-ditioning Variations in the effectiveness of reinforcement In A H Blackamp W F Prokasy (Eds) Classical conditioning II Current researchand theory (pp 64-99) New York Appleton-Century-Crofts
Roberts S (1981) Isolation of an internal clock Journal of Experi-mental Psychology Animal Behavior Processes 7 242-268
Robinson S R Blumberg M S Lane M S amp Kreber L A(2000) Spontaneous motor activity in fetal and infant rats is organizedinto discrete multilimb bouts Behavioral Neuroscience 114 328-336
Salafia W R Terry W S amp Daston A P (1975) Conditioning ofthe rabbit (Oryctolagus cuniculus) nictitating membrane response asa function of trials per session ISI and ITI Bulletin of the Psycho-nomic Society 6 505-508
Schaub R E (1967) Analysis of interresponse times with small classintervals Psychological Record 17 81-89
Schneider B A (1969) A two-state analysis of fixed-interval respond-ing in the pigeon Journal of the Experimental Analysis of Behavior12 677-687
Schneiderman N amp Gormezano I (1964) Conditioning of the nictitating membrane of the rabbit as a function of the CSndashUS inter-val Journal of Comparative and Physiological Psychology 57 188-195
Shull R L amp Brownstein A J (1970) Interresponse time durationin fixed-interval schedules of reinforcement Control by ordinal posi-tion and time since reinforcement Journal of the Experimental Analy-sis of Behavior 14 49-53
Shull R L Gaynor S T amp Grimes J A (2001) Response rateviewed as engagement bouts Effects of relative reinforcement andschedule type Journal of the Experimental Analysis of Behavior 75247-274
Skinner B F (1938) The behavior of organisms New York Appleton-Century-Crofts
Slater P J B amp Lester N P (1982) Minimizing errors in splittingbehaviour into bouts Behaviour 79 153-161
Sutton R S amp Barto A G (1981) Toward a modern theory ofadaptive networks Expectation and prediction Psychological Review88 135-170
Sutton R S amp Barto A G (1990) Time derivative models ofPavlovian reinforcement In M R Gabriel amp J W Moore (Eds)Learning and computational neuroscience Foundations of adaptivenetworks (pp 497-537) Cambridge MA MIT Press
Tatham T A amp Zurn K R (1989) The Med-PC experimental ap-paratus programming system Behavioral Research Methods Instru-ments amp Computers 21 294-302
Tolkamp B J amp Kyriazakis I (1999) To split behaviour into boutslog-transform the intervals Animal Behaviour 57 807-817
NOTES
1 Random intervals were sampled from an exponential distributionusing the equation R 5 2b ln X where R is the random interval in sec-onds with a resolution of 10 msec b is the mean of the exponential dis-tribution ln is the natural logarithm and X is a random number selectedfrom a uniform distribution ranging from 0 to 1 The exponential distri-bution has only a single parameter of the mean and the standard devia-tion is equal to the mean
EXPECTED TIME TO REINFORCEMENT 19
APPENDIX ADefinitions
Note c is duration of fixed interval and l is duration of random interval in seconds
Density Functions
Fixed f (x) 5 1 x 5 cf (x) 5 0 x THORN c
Random f (x) 5 le2lx 0 x yenTandem f (x) 5 0 0 x c
f (x) 5 le2l(x2c) c x yen
Survival Functions
Fixed S(x) 5 1 x cS(x) 5 0 x $ c
Random S(x) 5 e2lx 0 yenTandem S(x) 5 1 0 x c
S(x) 5 e2l(x-c) c x yenHazard Functions h(x) 5 f (x) S(x)
Fixed h(x) 5 1 x 5 ch(x) 5 0 x THORN c
Random h(x) 5 l 0 x yenTandem h(x) 5 0 0 x c
h(x) 5 l c x yen
Conditional Expected Time Functions
Fixed Et 5 c 2 x 0 x cRandom Et 5 l 0 x yenTandem Et 5 c 2 x 0 x c
Et 5 l c x yen
E xf x S dx tt tx t
= [ ] -=
yen
ograve ( )
S x f t dtt
x
( ) ( )= -=ograve1
0
f x dx a x ba
b
( ) Pr( )= lt poundograve
APPENDIX BPacket Theory Implementation
PerceptionEach interval in training produced an expectation implemented according to Equation B1 A
perceived expectation was determined by subtracting a series of 1-sec time steps in the intervalranging from time 0 (prior food delivery) to time d (next food delivery) from the total interval du-ration d This resulted in a linearly decreasing function from d to 0 over the interval duration Forexample a 45-sec interval would result in a perceived expectation that decreased from 45 to 0 in1-sec increments
et = d 2 t 0 t d et = 0 otherwise (B1)Memory
The memory module in packet theory consisted of a weighted sum of the perceived expecta-tions updated according to EquationB2 where et is the expectation from the current interval at timet Et is the expectation in memory at time t for all intervals prior to the current interval and a is aweighting parameter The function in memory is a close approximation to the conditional expected
2 The IRT distributions for the different groups of rats were highlysimilar until around 30 sec Thereafter mean interval duration deter-mined the width of the second peak A number of analyses were con-ducted to explore the effect of IRT criterion on features of the bouts Itwas discovered that longer criteria resulted in larger and longer durationbouts However the invariance in bout characteristics across experimen-tal conditions was unaffected by the choice of criterion provided thatthe criterion was less than 30 sec (the point at which the IRT distributionsdiverged)
3 The IRTs are displayed in 01-sec linearly spaced bins These IRTsare equivalent to the first mode of the double-peaked IRT distribution inFigure 2 The IRTs are displayed here in linearly spaced bins to demon-strate that the distribution is closely approximated by an exponential
4 The autocorrelation is a correlation coeff icient between x and y cal-culated with x equal to IRTs 1 to n21 and y equal to IRTs 2 to n Becausethe distribution of IRTs contains many short times and fewer long timeslong IRTs will rarely be followed by a long IRT Thus the expected au-tocorrelation of a random sample of IRTs would not be zero
20 KIRKPATRICK AND CHURCH
APPENDIX B (Continued)
time function (Equation 1) After the first interval the conditional expected time in memory wasset to the first perceived expectation Thereafter new intervals were added with weight a A newperceived interval was added to memory over time steps from 0 to d where d is the most recentinterval duration Thus a new expectation from a 45-sec interval would be added to memory overtime steps from 0 to 45 The conditional expected time function for time steps greater than 45 secwould remain unchanged on that update
DEt = a (et 2 Et ) 0 t d (B2)Decision
The decision rule for producing anticipatory response packets is determined by a probabilityfunction pt which is given in Equation B3a where n is the expected number of anticipatory re-sponse packets in an interval and E
t is a transformed expectation The probability function pt wascalcu-lated up to time step D and thereafter remained at the value that was reached at D for timesgreater than D (the mean interval duration) pt remained at the value that was achieved when thetime step was equal to D (Equation B3b) This is because the transformed expectation is definedonly over time steps 0 to D
pt = nE t 0 t D (B3a)
pt = pt5D t D (B3b)The transformed expectation E
t is calculated by subtracting the expectation at time t from themaximum of the expected time function (usually the value at time 0 which is equal to the meanof the interval duration) to get a transposed expectation (Ecent
t ) as in Equation B4a This results ina reversal in the direction of the expected time function which is intuitively plausible becausewhenever the conditional expected time to food is short (ie as the upcoming food delivery be-comes increasingly imminent) the probability of responding should be high For a fixed 90-secinterval the maximum conditional expected time to food would be 90 sec which occurs at inter-val onset The subtraction would result in the expected time at time 0 being 0 (90 ndash 90 5 0) theexpected time at time 1 being 1 (90 ndash 89 5 1) and so forth
Ecentt = max(Et ) 2 Et 0 t D (B4a)
(B4b)
The difference of the conditional expected time at each time step from the maximum is then di-vided by the sum of the differences which normalizes the function to create a probability whichis denoted as the transformed expectation E
t in Equation B4b The sum of the transformed ex-pectation from times 0 to D is equal to 10 The transformed expectation is only calculated overtime steps 0 to D where D is the mean interval duration This was necessary because on a random-time schedule intervals longer than D are relatively rare so that transformed expectation becomesunstable at intervals much greater than D This solution also works for a fixed interval where theexpectation is undefined beyond the time when food is expected to occur (time D)
The probability function pt is then determined by multiplying the responsiveness parameter nwith the transformed expectation function E
t The sum of the probability function is equal to thevalue of n so that n becomes the expected number of packets per interval
Packet GenerationA packet is generated from two functions the number of responses in the packet h and the IRT
in a packet d The number of responses in a packet is obtained from Equation B5 where ln is thenatural logarithm and X is a uniformly distributed random number between 0 and 1 All values ofh are rounded up to the nearest integer The distribution of the number of responses per packet pro-duced by the model is a geometrically decreasing function with a minimum of 2 and a mean of42 The mean of the geometric was 15 responses smaller than the mean of the distribution of re-sponse numbers produced by the rats This was because the geometric distribution has fewer largenumbers of responses as compared with the distribution of the rats that is the geometric ap-proaches zero more quickly Interestingly with the packet summation rule the model simulationsyielded bouts that contained a mean of 56 responses It is possible that the longer response boutsproduced by the rats also emerged from two smaller boutsrsquo running together A geometric distri-bution the discrete equivalent of the exponential distribution was used because the distributionof the number of responses is approximately exponential in shape but is composed only of integernumbers of responses The geometric is the discrete equivalent of the exponential distributionThe mean of the geometric distribution was determined by fitting a geometric function to the dis-tribution of number of responses in a bout that was produced by the rats (the mean of the curves
EE
Et
t
tt
D
=
=cent
centaring0
EXPECTED TIME TO REINFORCEMENT 21
APPENDIX B (Continued)
in the upper left panel of Figure 5) The geometric distribution has a single parameter ( p) that de-termines the mean of the distribution The parameter p of the best-fitting function to the rat datawas used to determine the number of responses in a packet in the model ( p 5 132 5 031)
(B5)
The IRTs were determined by Equation B6 where X is a uniformly distributed random numberbetween 0 and 1 and b is the mean The IRT distribution was determined by fitting a double ex-ponential function (the mean of two exponential density functions) to the mean IRT distributions across all of the rats The double exponential was necessary because there were more long IRTsthan would be predicted by a single exponential Double exponential functions have been used pre-viously to fit IRT functions (Davis 1996) The double exponential was the weighted sum of twoexponentials of different means with the relative weighting parameter p The resulting parame-ters were p 5 5 b1 5 08 and b2 5 52 The value of b for each exponential was substituted intoEquation B6 for generating random samples from the exponential distribution (b 5 08 or b 5 52)A random value was independently selected from one of the exponential distributions with a prob-ability of 5 In other words half the time the IRT was selected from the exponential with a meanof 08 and half of the time the IRT was selected from an exponential with a mean of 52
d 5 2bln(X ) (B6)
The Scalar Property in FT and FI SchedulesThe prediction of the scalar property emerges from Equations B4a and B4b For a FT (or fixed-
interval) schedule the conditional expected time Et is equal to D ndash t where D is the fixed intervalduration and t is the time in the interval (see Equations B1 and B2) at time 0 the conditional ex-pected time is equal to the duration of the fixed interval D The transposed expectation Ecent (Equa-tion B4a) therefore becomes D ndash (D ndash t) or t In other words the transposed expectation will in-crease linearly from 0 to D as t increases from 0 to D The transformed expectation E(Equation B4b) now becomes
The sum of all t values between 0 and D is
so that the transformed expectation is
Thus the transformed expectation function and resulting probability function ( pt) are proportionalto tD2 The scalar property is observed when the response rate functions are normalized by di-viding the response rate at each time by the maximum response rate In other words the proba-bility of response ( pt ) is divided by the maximum probability of response The maximum proba-bility of response occurs at time t 5 D so that the relative probability of response as a function oftime in an interval is determined by ptmax( pt ) which is proportional to (tD2)D or tD Thusthe relative probability of responding is proportional to the relative time in an interval tD whichis the scalar property
(Manuscript received January 12 2001revision accepted for publication September 13 2002)
Et
D Dt
( )
=+
2
1
D D( )
+ 1
2
E t
tt
t
D
=
=aring
0
h =-
-eacuteeumlecirc
+lnln
( )( )
X
p11 2
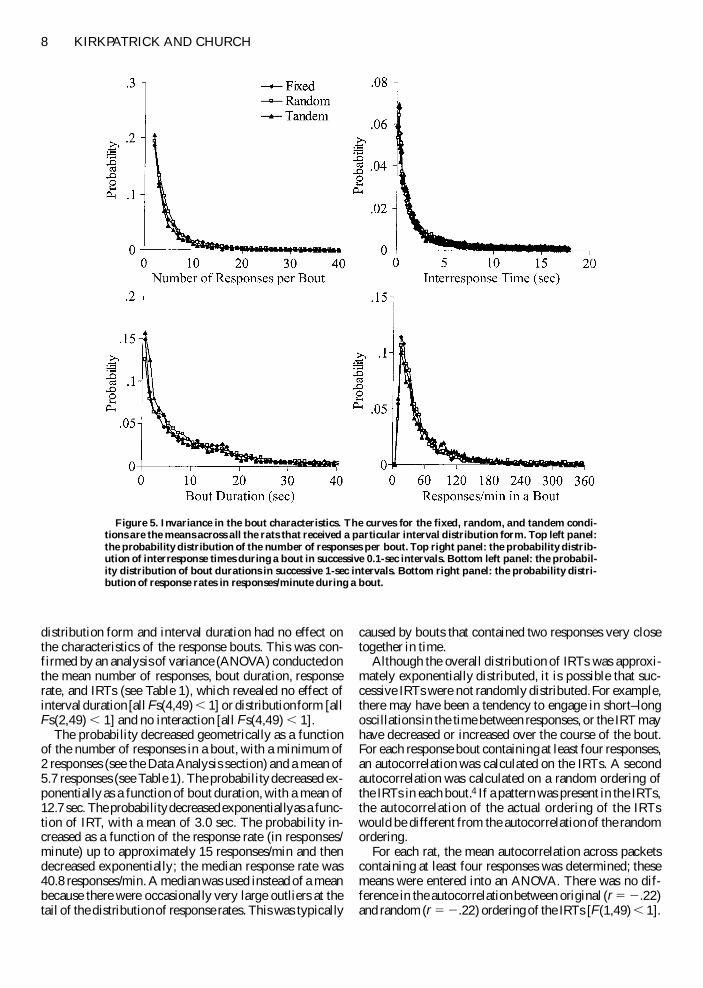
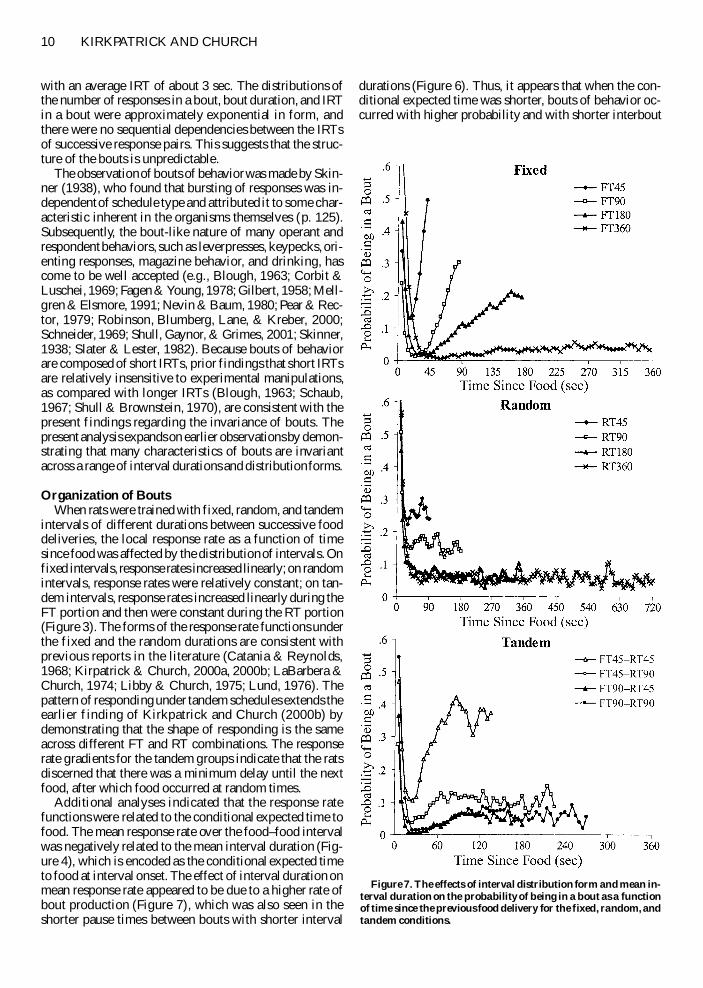
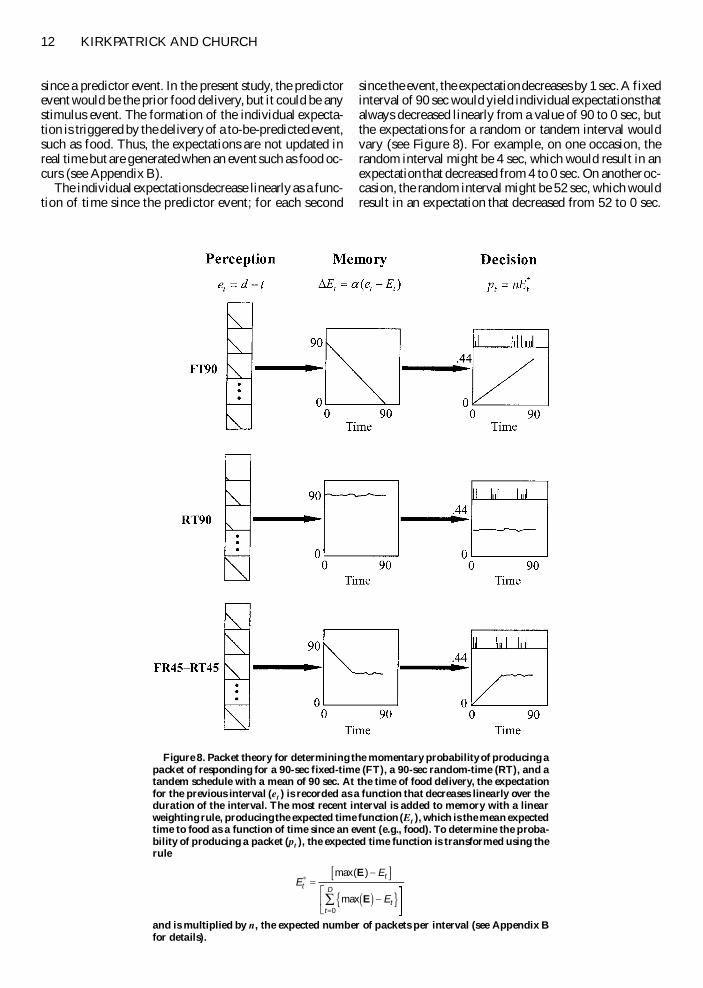
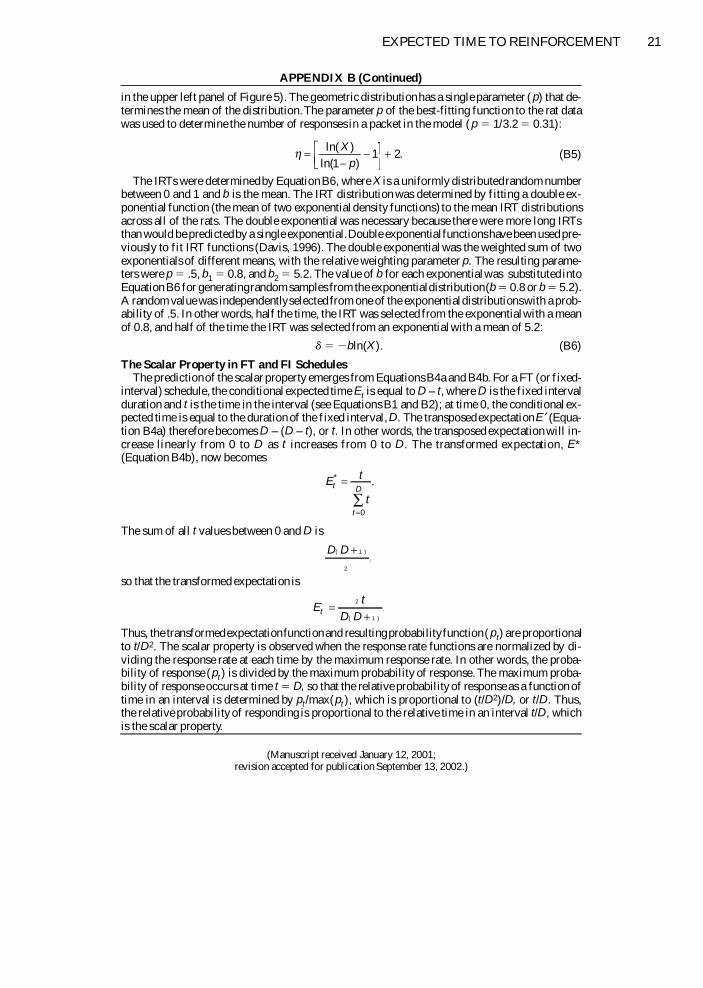