tracking the relationship between mountain uplift ... · the effects of uplift and erosion on...
TRANSCRIPT

Chemical Geology 341 (2013) 110–127
Contents lists available at SciVerse ScienceDirect
Chemical Geology
j ourna l homepage: www.e lsev ie r .com/ locate /chemgeo
Tracking the relationship between mountain uplift, silicate weathering,and long-term CO2 consumption with Ca isotopes: Southern Alps,New Zealand
Joel Moore a,⁎, Andrew D. Jacobson a, Chris Holmden b, Dave Craw c
a Department of Earth and Planetary Sciences, Northwestern University, Evanston, IL 60208, USAb Saskatchewan Isotope Laboratory, Department of Geological Sciences, University of Saskatchewan, Saskatoon, Canada SK S7N 5E2c Department of Geology, University of Otago, Dunedin, New Zealand
⁎ Corresponding author at: Towson University, TowsoE-mail addresses: [email protected], moore@to
0009-2541/$ – see front matter © 2013 Elsevier B.V. Allhttp://dx.doi.org/10.1016/j.chemgeo.2013.01.005
a b s t r a c t
a r t i c l e i n f oArticle history:Received 23 July 2012Received in revised form 21 December 2012Accepted 11 January 2013Available online 20 January 2013
Editor: J. Fein
Keywords:Silicate weatheringUpliftErosionCO2 consumptionCa isotopesGlacial weathering
Mountain uplift is frequently invoked as a mechanism that accelerates atmospheric CO2 consumption bychemical weathering, thereby cooling climate over geological timescales. Testing the uplift hypothesis re-quires quantifying whether Ca in rivers draining active mountain belts originates from silicate versus carbon-ate weathering because only silicate weathering affects long-term climate. Here, we examine whetherhigh-precision Ca isotope measurements (δ44/40Ca) can track Ca sources to rivers draining the SouthernAlps of New Zealand, where uplift and erosion rates span three orders of magnitude across a region of silicatebedrock hosting accessory calcite. We quantified the percentages and uncertainties of Ca originating from sil-icate and carbonate weathering using Ca isotope mixing equations (the δ44/40Ca method), and we comparedthe results to those obtained from a widely utilized method employing Ca/Na ratios (the Ca/Na method). Theδ44/40Ca method is less precise than the Ca/Na method owing to the limited variability of the Ca isotopesystem. Nonetheless, both methods reveal that riverine Ca largely originates from carbonate weatheringand that the fraction of Ca from carbonate weathering increases with increasing tectonic activity, from~50–60% in regions experiencing the lowest uplift rates to >90% in regions experiencing the highest upliftrates. Results agree within 2% for all non-glacial rivers, but the δ44/40Ca method yields up to 35% moresilicate-derived Ca for glacial rivers. We attribute the discrepancy to glacial grinding, which damages mineralgrains and causes non-stoichiometric release of silicate Ca.Total chemical weathering rates in the most rapidly uplifting region of the Southern Alps are about one order ofmagnitude higher than the global mean and rank among the highest chemical weathering rates in the world.However, because the proportion of riverine Ca from carbonate weathering increases as uplift and erosionrates increase, the highest long-term atmospheric CO2 consumption rates for non-glacial rivers are no higherthan the global mean. Source apportionment using the δ44/40Ca method suggests that glaciation yields higheratmospheric CO2 consumption rates than previously realized, but we find that the spatial extent of montaneglaciation is not large enough to make a difference globally. Extrapolated to the Himalaya Mountains, our datashow that atmospheric CO2 consumption in glacial watersheds accounts for b1% of the global CO2 consumptionflux, implying that >99% of CO2 consumption occurs in other regions of the world. We therefore conclude thatsilicate weathering in uplifting mountain ranges does not control long-term climate change.
© 2013 Elsevier B.V. All rights reserved.
1. Introduction
The coincidence between uplift of the Himalayan–Tibetan Plateau(HTP) and the onset of late Cenozoic cooling has been used to arguethat mountain uplift causes global cooling over geological timescales(Raymo et al., 1988; Raymo and Ruddiman, 1992). According to theuplift hypothesis, mountain building enhances mechanical erosion,which in turn accelerates chemical weathering reactions that reduce
n, MD 21252, USA.wson.edu (J. Moore).
rights reserved.
greenhouse warming by consuming atmospheric CO2. Indeed, riversdraining mountainous regions transport high loads of fine-grainedrock debris produced by landslides, glaciers, and other agents of me-chanical erosion (e.g., Milliman and Syvitski, 1992; Hovius et al., 1997;Gabet, 2007), and they exhibit high chemical weathering rates com-pared to rivers draining tectonically stable areas (Gaillardet et al.,1999; Millot et al., 2002; Jacobson and Blum, 2003; West et al., 2005).However, during the past few decades, numerous studies have shownthat carbonate weathering, rather than silicate weathering, dominatessolute fluxes emanating from the HTP and other active orogens (Blumet al., 1998; Jacobson and Blum, 2003; Quade et al., 2003; Hren et al.,

111J. Moore et al. / Chemical Geology 341 (2013) 110–127
2007; Wolff-Boenisch et al., 2009). These findings are significant be-cause only silicate weathering impacts long-term atmospheric CO2
concentrations (Urey, 1952; Walker et al., 1981; Berner et al., 1983).Carbonate weathering contributes the large majority of Ca fluxes
from active orogens, even from predominantly silicate watersheds(e.g., Mast et al., 1990; Blum et al., 1998; Jacobson and Blum, 2003).This phenomenon occurs because granite and other silicate rocksthat commonly compose mountains contain trace amounts of calcitedisseminated within and between co-existing silicate grains (Blumet al., 1998; Jacobson et al., 2003; White et al., 2005). Trace calciteforms during igneous petrogenesis and hydrothermal fluid flow(White et al., 2005), both inherent characteristics of orogenesis.Calcite dissolves ~6 orders of magnitude faster than silicate min-erals, such as plagioclase (Lerman and Wu, 2006), and uplift anderosion continuously expose new calcite, replacing that whichchemical weathering depletes in hillslope soils (e.g., Jacobson andBlum, 2003; Chamberlain et al., 2005). Silicate weathering has less in-fluence on river water geochemistry in upland watersheds becausemineral residence times in soils are short relative to the characteristictimescale of silicate mineral dissolution (Gabet, 2007; Yoo and Mudd,2008; Gabet and Mudd, 2009; Norton and von Blanckenburg, 2010;Dixon et al., 2012). The chemical weathering of silicate minerals con-tributes a greater proportion of dissolved cations in lowland floodplains(Galy and France-Lanord, 1999; West et al., 2002; Lupker et al., 2012)but at a relatively slow rate (Jacobson and Blum, 2003; Lupker et al.,2012). Rivers ultimately sweep much of the unaltered silicate detritusto submarine fans (e.g., Milliman and Syvitski, 1992), where it becomesisolated from additional reaction. The net implication is that uplift mayexert a much weaker control on silicate weathering and the long-termcarbon cycle than originally anticipated.
To a large extent, resolving the relationship between uplift,weathering, and climate involves apportioning riverine Ca among sil-icate versus carbonate sources. Most studies have indirectly constrainedmineralogical sources of riverine Ca usingmajor ion balances, normativemineral calculations, and Sr isotope ratios (e.g., Wadleigh et al., 1985;Miller et al., 1993; Négrel et al., 1993; Gaillardet et al., 1999; Jacobsonet al., 2003; Spence and Telmer, 2005; Wu et al., 2008; White et al.,2009). The most widely utilized method employs riverine Na to con-strain the Ca contribution from plagioclase dissolution (e.g., Blum etal., 1998; Gaillardet et al., 1999; Anderson et al., 2000; Millot et al.,2002; Jacobson and Blum, 2003; Quade et al., 2003; Lyons et al., 2005;West et al., 2005). This method works by multiplying riverine Na con-centrations (after correction for atmospheric inputs) by the bulk Ca/Naratios of the underlying silicate bedrock. While Ca/Na ratios for bulk sil-icate rocks and sediments effectively represent the Ca/Na ratio of plagio-clase (Blum et al., 1998), the method is subject to uncertainty. Watersinteracting with silicate rocks commonly have Ca/Na ratios that exceedtheCa/Na ratio of plagioclase. This conundrumof “excess Ca” has existedsince some of the earliest elemental accounting methods were devel-oped nearly a half-century ago (Garrels, 1967; Clow and Drever, 1996;Oliva et al., 2004). Preferential ion uptake during plant growth andsecondary mineral formation cannot explain the problem because themost extreme discrepancies often occur in glaciated watersheds whereplants are absent andwaters are undersaturatedwith respect to second-ary minerals (e.g., Drever and Hurcomb, 1986; Anderson et al., 1997;Anderson et al., 2000; Hodson et al., 2002; Tranter, 2004). Studiesoften attribute excess Ca to the dissolution of trace calcite (Mast et al.,1990; Blum et al., 1998; Jacobson et al., 2003;White et al., 2005). Relatedresearch has demonstrated that other Ca-bearing minerals, such as apa-tite, epidote, fluorite, and hornblende, may also contribute excess Ca(e.g., Blum et al., 2002; Oliva et al., 2004; Wu et al., 2008; Ryu et al.,2011). Alternatively, preferential leaching of surfaces, exsollution lamel-lae, and calcic coresmay cause plagioclase to release Ca overNa, especiallyduring the incipient stages of chemical weathering (Clayton, 1986;Whiteet al., 2008). Non-stoichiometric dissolution regularly occurs in laboratorystudies where silicate minerals are ground and pulverized prior to use
(e.g., Stillings and Brantley, 1995; Taylor et al., 2000). Likewise, glacialgrinding may cause non-stoichiometric silicate mineral dissolution (e.g.,Axtmann and Stallard, 1995; Anderson et al., 1997; Hodson et al., 2002;Tranter, 2004), potentially leading to higher than expected silicate Cafluxes (Mitchell and Brown, 2008). Owing to the similar geochemicalbehavior of Ca and Sr, measurement of Sr isotope and Ca/Sr ratios of-fers a way to circumvent some of the aforementioned difficulties, butthe technique has limited utility in active orogens where metamor-phism and hydrothermal circulation cause isotopic equilibration be-tween co-existing carbonate and silicate minerals (e.g., Jacobson etal., 2003; Bickle et al., 2005).
Through advances in methodology and instrumentation, an in-creasing number of studies are using Ca isotopes (δ44/40Ca) to traceCa sources and cycling in terrestrial ecosystems (e.g., Bullen et al.,2004; Perakis et al., 2006; Page et al., 2008; Holmden and Belanger,2010; Farkaš et al., 2011; Hindshaw et al., 2011; Fantle et al., 2012),aquifers (Jacobson and Holmden, 2008), rivers (e.g., Schmitt et al.,2003; Tipper et al., 2008; Cenki-Tok et al., 2009; Tipper et al., 2010),and the oceans (e.g., De La Rocha and DePaolo, 2000; Heuser et al.,2005; Kasemann et al., 2005; Farkas et al., 2007; Griffith et al., 2008;Fantle, 2010; Silva-Tamayo et al., 2010; Blättler et al., 2011, 2012;Holmden et al., 2012). Here, we test whether δ44/40Ca may be usedto directly apportion Ca sources to rivers draining the Southern Alpsof New Zealand. The Southern Alps are ideally suited for studyingthe effects of uplift and erosion on long-term climate change becausethe mountain range has large tectonic and hydrologic gradients but anearly uniform lithology consisting of silicate rocks hosting accessorycalcite (Jacobson and Blum, 2003; Jacobson et al., 2003). We collected31 water samples from 25 rivers, both non-glacial and glacial, and weanalyzed their major ion and Ca isotope geochemistry. We also ana-lyzed representative samples of likely Ca sources to the rivers,including bedrock, soil, and vegetation. Calcium isotope mixingmodels (hereafter the δ44/40Ca method) are used to apportion riverineCa between silicate and carbonate weathering, and we compare theoutput to results obtained with the traditional Ca/Na mass-balancemethod (hereafter the Ca/Namethod). To evaluate the global-scale sig-nificance of our findings, we calculate mechanical erosion, chemicalweathering, and long-term atmospheric CO2 consumption rates.
2. Geologic and hydrologic setting
The South Island of New Zealand straddles the boundary betweenthe Australian and Pacific plates (Fig. 1). The surface expression of theplate boundary is the Alpine Fault, along which strike-slip movementof ~500 km and vertical movement of >20 km has occurred (Norriset al., 1990). Within the past 5 Ma, the Alpine Fault has accommodated~90 km of convergence (Walcott, 1998). The Southern Alps trendnortheast for ~500 km parallel to the Alpine Fault and have an averageelevation of ~2200 m. The Southern Alps primarily consist ofgreywacke and medium- to high-grade schist derived from the meta-morphism of the greywacke. The greywacke contains ~75% quartz andfeldspars (5:1 plagioclase to potassium feldspar), ~24% lithic fragments,which are predominantly siliciclastic volcanics, and some minorCa-bearing minerals, including prehnite, pumpellyite, and epidote(Bishop, 1972;MacKinnon, 1983). The schist contains quartz, feldspars,and micas; lesser amounts of chlorite, biotite, and garnet; and trace ep-idote and actinolite (Grapes andWatanabe, 1992). Both rock types con-tain up to 3% hydrothermal and metamorphic calcite (e.g., Templetonet al., 1998). East of the main topographic divide of the Southern Alps(the Main Divide), uplift and runoff rates are low (0.1 to 1 mm/yrand 2600 mm/yr, respectively), and low-gradient, braided rivers primar-ily drain greywacke and to a lesser extent, schist (Wellman, 1979;Tomlinson, 1992; Teagle et al., 1998). West of the Main Divide, upliftand runoff rates are high (10 mm/yr and 8300 mm/yr, respectively)and short, steep rivers drain schist (Tomlinson, 1992; Simpson et al.,1994). Glacial watersheds occur throughout the Southern Alps.

Fig. 1. Locationmap. The Alpine Faultmarks the boundary between the Australian and Pacific plates. Areawith the lightest shading represents the topographic divide of the Southern Alps(the Main Divide). R=rock, RN=rain, SL=soil, W=water. Uplift rates are 10, 1, and 0.1 mm/yr for the high, medium, and low uplift regions, respectively.
112 J. Moore et al. / Chemical Geology 341 (2013) 110–127
3. Methods
3.1. Sample collection and field measurements
Water, rock, soil, and vegetation samples were collected in De-cember 2008. Sample locations were documented with a Garmin60CSx handheld GPS meter. The bedrock of each watershed was de-termined using geologic maps (Bishop and Turnbull, 1996; Turnbull,2000; Forsyth, 2001; Nathan et al., 2002; Cox and Barrell, 2007).River temperature (±0.1 °C) and pH (±0.02) were measured usingan Orion 3-Star portable meter equipped with an Orion ATC probeand a Ross glass-body combination pH electrode. River samples forthe analysis of cation and Si concentrations and Ca isotope ratioswere passed through 0.45 μm filters, collected in I-CHEM HDPEbottles, and acidified to pHb2 using concentrated, ultrapure HNO3.River samples for the analysis of total alkalinity and anion concentra-tions were passed through 0.45 μm filters and collected in LDPE bot-tles. Nitrile gloves were worn while sampling. Rainfall samples werecollected in I-CHEM HDPE bottles using an acid-cleaned HDPE funnel.After collection, rainfall samples were processed in the same way asriver samples. Total alkalinity (AT) in μeq/L was measured by Grantitration with standardized 0.02 N HCl. Rivers draining the SouthernAlps have relatively low concentrations of dissolved organic matter(Carey et al., 2005), and PO4 was below detection limit (~3.2 μmol/L)in all samples. Therefore, total alkalinity represents carbonate alkalinity(AT=HCO3+2CO3). The uncertainty of the method was less than±3%, as determined by repeated titrations of a gravimetrically pre-pared Na2CO3 standard. Rock samples were collected from outcropsand riverbeds. Samples of soil developed from greywacke parentmaterial were collected from pits dug at local topographic highswhere water predominantly flows downward with minimal hori-zontal transport. Soil was collected from the pit walls and placed
directly into plastic bags. Grass growing on the surface of thesoils was clipped and bagged.
3.2. Preparation of rock, soil, and vegetation samples
A saw was used to remove the outer portion of rock samples,and a jaw crusher was used to break the inner portion into smallerchips. Subsamples of the chips weighing ~25 g were powdered in ashatterbox. The carbonate and silicate fractions of the powderedsamples were isolated using a sequential leaching and digestion pro-cedure employing ultrapure reagents. Samples weighing 1.0 g werereacted with 10 mL of 4 M acetic acid (HAc) for 6 h to isolate the car-bonate fraction. The mixtures were centrifuged, and the superna-tants were passed through 0.45 μm polypropylene syringe filtersand collected in Teflon beakers. To ensure complete dissolution ofcarbonate, the procedure was performed two to three times untilthe leachate reached a constant pH value. The filtered leachateswere combined, dried, and re-dissolved in 5% HNO3. The remainingsample was reacted with 10 mL of cold 1 M HNO3 for 6 h. The mix-tures were centrifuged, and the supernatants were passed through0.45 μm polypropylene syringe filters, dried, and re-dissolved in 5%HNO3. The remaining sample was dried, and 0.08 g sub-sampleswere digested in a 5:3 mixture of HF and HNO3. The samples weredried and refluxed in concentrated HNO3 and subsequently driedand refluxed three times in 6 M HCl. After evaporating the final re-flux, the dried residue was re-dissolved in 5% HNO3. Soil sampleswere dried in an oven at 60 °C and sieved through a 2 mm nylonmesh. Subsamples of the b2 mm fraction weighing 1.0 g werereacted with 10 mL of 1 M ammonium chloride (NH4Cl) (adjustedto pH=8) for 6 h. The mixtures were centrifuged, and the superna-tants were passed through 0.45 μm polypropylene syringe filters,dried, and re-dissolved in 5% HNO3. Grass samples were dried in an

113J. Moore et al. / Chemical Geology 341 (2013) 110–127
oven at 60 °C. Samples were completely digested on a hot plate inconcentrated HNO3. Solutions were passed through 0.45 μm poly-propylene syringe filters, dried, and re-dissolved in 5% HNO3.
3.3. Elemental concentrations
Cation and Si concentrations in water samples, leachates, anddigestions were measured using a Varian Vista MPX inductivelycoupled plasma–optical emission spectrometer (ICP-OES) with si-multaneous charge-coupled device (CCD) detection. The NIST stan-dard reference material 1643e was repeatedly analyzed to monitorinstrumental performance and the overall quality of the method. Re-sults were within ±10% of reported concentrations. Anion concen-trations were measured using a Dionex DX-120 ion chromatographequipped with an AS15 anion-exchange column and an ASRS-300self-regenerating suppressor. Analyses of a NIST-traceable Dionexstandard were within 10% of reported concentrations. The averagecharge balance error for river water samples is −1.38%.
3.4. Ca-isotope ratios
Calcium isotope ratiosweremeasured using a TritonMC-TIMS at theSaskatchewan Isotope Laboratory. 44Ca/40Ca ratios were measuredusing a 43Ca–42Ca double-spike technique following a previously pub-lished procedure (Holmden and Belanger, 2010). In separate mass-spectrometer runs, 44Ca/42Ca ratios were measured for a small subsetof samples using a 48Ca–43Ca double-spike, as described in Ryu et al.(2011). Mass spectrometry, data reduction procedures, and quality as-surance protocols follow the same guidelines previously reported formeasurement of 44Ca/40Ca ratios (Holmden and Belanger, 2010). Carewas taken to ensure complete spike-sample equilibration before purifi-cation of Ca from matrix elements using Teflon columns packed withAG MP-50 cation exchange resin. Total procedural blanks were negligi-ble (~100 ng). Sample to blank ratios were 500:1. Approximately 5 to8 μg of purified Ca was loaded onto out-gassed Ta filaments, usingultrapure H3PO4 acid, and measurements were made using a single fil-ament assembly. The 41K beam was monitored to ensure that 40K didnot isobarically interfere with 40Ca. All 44Ca/40Ca and 44Ca/42Ca ratiosare reported in delta notation relative to seawater:
δ44=xCa ¼44
Ca.
xCa� �
sample44Ca
.xCa
� �seawater
−1
264
375� 1000; ð1Þ
where x=40 or 42. Repeated analyses of samples and internalstandards during the period of study yielded an external precision(2σ standard deviation) of ±0.07‰ for δ44/40Ca and ±0.08‰ forδ44/42Ca. The δ44/40Ca and δ44/42Ca values obtained for NIST 915arelative to seawater are −1.89 and −0.92‰, respectively.
3.5. Mineral saturation indices
For river water samples, major ion concentrations and field param-eters (T, pH, and AT) were input to PHREEQC (implemented with thellnl.dat thermodynamic database, Parkhurst andAppelo, 1999) to calcu-late ion activities, activity coefficients, and saturation states with re-spect to calcite (log Ωcal).
3.6. Correction of riverine data for atmospheric inputs
Riverine solute concentrations were corrected for atmosphericinputs using the following standard equation:
i½ ��riv ¼ i½ �riv− Cl½ �riv �iCl
� �atm
; ð2Þ
where [i]riv⁎ is the corrected concentration of element i in river water(μmol/L), [i]riv is the measured concentration of element i in riverwater (μmol/L), [Cl]riv is the measured concentration of Cl in riverwater (μmol/L), and (i/Cl)atm is themolar concentration ratio of elementi to Cl in rainfall. Eq. (2) assumes Cl in river water only originates fromatmospheric inputs, which is reasonable because neither Cl-rich evapo-rites nor hot springs occur in the study area. Eq. (2) further assumes thatCl behaves conservatively during transport (Feth, 1981). For rivers eastof theMain Divide, average (i/Cl)atm ratioswere calculated using rainfallsamples RN01 and RN02. For rivers west of the Main Divide, (i/Cl)atmratios were determined using rainfall sample RN04.
3.7. Quantification of rock weathering end-members (δ44/40Ca, Sr/Ca,and Ca/Na)
As described in Section 3.2, the carbonate fraction of rocks wasisolated by leaching powdered samples with acetic acid, and thecorresponding silicate fraction was determined by digesting theremaining residue. Ca and Sr concentrations as well as δ44/40Ca valuesin the acetic leachates were corrected for silicate mineral dissolutionfollowing a published procedure (Jacobson and Blum, 2000). To cal-culate end-member Sr/Ca and Ca/Na ratios, previously publisheddata for greywacke (n=17) and schist (n=9) collected from thestudy area (Jacobson et al., 2003) were included in the dataset. Aver-ages reported for the carbonate end-member are weighted by tracecalcite concentrations. The acetic acid leachate for R20B1, a clay-richargillite, was excluded from the carbonate end-member calculationsbecause some Ca likely originated from clay, but the correction proce-dure noted above only accounts for dissolution of primary silicateminerals. For the Sr/Ca and Ca/Na ratios of the silicate end-member,sample R44 from this study and sample W35 from Jacobson et al.(2003) were excluded because these samples represented significantoutliers with either very low (R44) or very high (W35) Ca concentra-tions. Uncertainties for all end-members are reported as two timesthe standard error of the average values.
4. Results
Table 1 reports data for river water and precipitation samples.The overall major ion geochemistry of the samples is consistentwith patterns previously described and interpreted by Jacobson etal. (2003). On an average molar basis, river water cation concentra-tions follow the order Ca (57%)>Si (16%)>Na (13%)>Mg (7%)>K(7%), and anion concentrations follow the order HCO3 (88%)>SO4
(9%)>Cl (3%). Rivers are dilute compared to global average riverwater (Gaillardet et al., 1999) but have higher relative proportionsof Ca and HCO3, with the exception of non-glacial rivers drainingschist in the least tectonically active area of the study site (Fig. 2).All water samples are significantly undersaturated with respect tocalcite (Table 1). The atmospheric inputs, calculated using Eq. (2),contribute relatively high proportions of riverine K, Na, and SO4 butlittle to no Ca, Mg, Si, and Sr (Table 2). After correction for atmo-spheric inputs, rivers draining schist have Sr/Ca⁎ ratios rangingfrom 1.3 to 4.6 nmol/μmol, and those draining greywacke have Sr/Ca⁎
ratios ranging from 2.4 to 5.8 nmol/μmol.Given the small contribution of atmospheric Ca, riverine δ44/40Ca
values do not require corrections for atmospheric inputs, with the ex-ception of the Taieri River (sample W02). Precipitation in this regionoriginates from the ocean to the east and from inland areas to thenorthwest and southwest (Craw and Beckett, 2004). Using the Ca/Clratio for seawater (Hem, 1985) in Eq. (2) yields an atmospheric Cainput of 3.04%, whereas using rainfall data from this study yields aninput of 15.3%. Using the average of the two results (9.17%) and aδ44/40Ca value of −0.50‰ for Ca in precipitation (Schmitt and Stille,2005; Cenki-Tok et al., 2009), we corrected the measured δ44/40Cavalue for the Taieri River from −0.94 to −1.13‰ using a standard

Table 1Elemental and Ca isotope geochemistry of rivers draining the New Zealand Southern Alps.a
Sample River Latitude Longitude T(°C)
pH Ba(nmol/L)
Ca(μmol/L)
K(μmol/L)
Mg(μmol/L)
Na(μmol/L)
Si(μmol/L)
Sr(nmol/L)
Cl(μmol/L)
SO4
(μmol/L)HCO3
b
(μmol/L)log Ωcal δ44/40Ca
(‰)δ44/42Ca(‰)
Schist riversHigh uplift, glacial c
W40 Fox −43.47767 170.00856 2.0 8.10 22.1 338 71.0 35.9 45.9 30.1 945 16.8 100 662 −0.84 −1.11 nmW41 Cook −43.49868 169.96639 7.4 7.94 27.8 353 52.4 31.9 44.5 51.1 1299 18.2 78.2 715 −0.85 −1.14 nmW43 Callery −43.40045 170.18498 5.8 7.94 17.3 313 26.5 16.6 44.2 32.8 1291 13.8 62.2 598 −1.00 −1.07 nmW45 Waiho −43.43427 170.17029 0.9 8.80 11.6 211 39.5 20.5 27.2 23.4 726 12.1 60.4 451 −0.54 −1.00 nm
−1.03W49 Waiho −43.41814 170.18043 2.3 8.07 14.9 258 50.0 25.1 31.2 26.4 853 12.4 64.7 490 −1.11 −1.12 nm
−1.05W50 Waiho −43.39181 170.17826 4.0 8.04 20.1 294 48.1 23.3 68.4 31.2 1022 23.6 58.4 583 −0.97 −1.01 nm
High uplift, non-glacialc
W44 “Franz Josef Falls” −43.43091 170.16873 7.8 7.99 39.2 343 82.4 45.3 56.6 68.1 440 29.1 74.6 783 −0.77 −0.97 nmW46 Waikakupa −43.44429 170.07028 8.8 8.00 37.3 293 56.3 37.2 44.4 50.2 658 22.4 64.2 627 −0.91 −1.11 nm
−0.96W47 Hugh −43.41897 170.18065 11.5 7.93 68.2 306 63.8 27.1 74.9 103 467 38.3 40.4 701 −0.86 −1.00 nmW48 Omoeroa −43.40485 170.09668 11.3 7.83 50.9 230 47.6 27.6 51.4 68 350 27.0 40.1 531 −1.21 −0.96 nmW55 Haast −44.09647 169.36315 10.3 6.94 10.5 43.6 4.87 6.64 15.3 20.1 72.7 10.0 6.29 122 −3.43 −0.96 nm
Medium uplift, non-glacialc
W05 Neck −44.43840 169.21563 8.4 7.90 25.1 289 13.5 53.8 56.2 80.7 604 9.81 44.1 584 −1.05 −0.97 nmW06 Big Hollywood Burn −44.42490 169.32840 11.1 7.88 23.2 282 16.0 49.4 69.4 96.5 465 12.9 49.7 617 −1.01 −0.98 nmW07 Sawyer Burn −44.44055 169.27154 12.1 7.91 17.1 302 13.9 56.2 67.9 98 610 12.2 54.4 622 −0.94 −0.99 nmW08 Timaru −44.53731 169.31765 16.8 7.92 18.4 216 15.7 38.2 80.7 131 324 12.1 38.1 493 −1.09 −1.01 nm
Low uplift, non-glacialc
W02 Taieri −45.19640 170.15327 18.8 7.98 36.6 170 36.2 132 387 71.7 712.5 270 50.2 633 −1.02 −0.94 nmW03 Manuherikia −44.77767 169.91555 16.5 7.49 13.5 50.9 5.87 21.4 78.5 129 219 12.9 7.79 175 −2.57 −1.23 nmW04 Dunstan −44.87445 169.79148 17.1 7.51 17.6 80.9 8.14 30.7 96.4 140 206 13.1 11.1 278 −2.14 −1.13 nm
Greywacke riversMedium uplift, glacialc
W21 Hooker −43.71524 170.10196 4.7 8.11 22.3 246 18.2 26.9 42.4 40.0 1362 9.27 62.5 477 −1.05 −1.30 −0.75−0.57
W22 Tasman −43.71463 170.15502 2.7 8.07 34.8 259 21.4 20.5 65.9 52.1 1495 8.63 95.0 459 −1.12 −1.35 −0.67W23 Hooker −43.73975 170.12766 4.7 7.92 20.5 244 17.8 26.1 41.7 40.0 1341 9.48 61.2 468 −1.25 −1.23 nm
−1.27W24 Tasman −43.77478 170.14778 4.7 8.01 25.7 264 20.5 21.9 60.3 50.5 1445 9.16 75.5 570 −1.04 −1.32 nm
Medium uplift, non-glacialc
W10 Canyon −44.23505 169.59760 7.1 7.09 20.7 144 9.05 12.4 51.0 81.8 610 11.4 27.0 317 −2.42 −1.37 nmW15 Jollie −43.86243 170.17538 10.7 7.59 5.12 116 7.75 13.7 41.6 84.0 395 9.60 26.4 248 −2.06 −1.32 −0.65W16 Landslip −43.92940 170.19710 13.1 7.47 3.61 64.0 5.47 12.8 38.6 88.6 206 11.3 8.81 154 −2.59 −1.20 −0.59W17 Cass −43.87354 170.46282 18.0 7.73 8.35 170 13.9 20.0 58.2 96.0 513 10.5 36.7 368 −1.48 −1.30 nm
−1.27W25 Bush −43.86263 170.10249 8.3 7.75 26.8 147 8.84 19.5 48.6 62.2 809 9.60 31.1 373 −1.67 −1.38 nmW28 Rakaia −43.29373 171.23939 12.5 7.83 13.0 221 13.2 24.8 61.2 75.6 807 11.9 49.6 462 −1.26 −1.32 nmW31 Waimakariri −43.28528 171.95501 14.4 7.89 15.6 234 12.9 30.6 89.0 112 561 20.8 49.1 489 −1.13 −1.02 nm
−0.96W32 Waimakariri −43.01881 171.81346 10.6 7.57 13.6 213 11.0 24.7 81.3 109 530 19.7 44.1 436 −1.59 −1.18 nmW33 Waimakariri −43.02089 171.59671 8.7 7.45 5.39 184 7.90 17.2 59.3 82.7 522 17.5 47.8 335 −1.92 −1.24 nm
PrecipitationRN01 East of Main Divide −44.26122 170.10208 nm nm bdl 0.788 1.70 0.274 2.94 0.161 bdl 9.24 3.12 nm n/a nm nmRN02 East of Main Divide −44.26122 170.10208 nm nm bdl 0.594 1.30 bdl 1.36 0.0622 bdl 5.56 2.27 nm n/a nm nmRN03 West of Main Divide −43.88225 169.04332 nm nm bdl 0.251 1.28 0.068 1.95 bdl bdl 6.86 3.29 nm n/a nm nm
a bdl=below detection limit; n/a=not applicable; nm=not measured.b HCO3≈AT.c High uplift≈10 mm/yr, medium uplift≈1 mm/yr, low uplift≈0.1 mm/yr.
114J.M
ooreet
al./Chem
icalGeology
341(2013)
110–127

Ca
Mg
Na + KRW
SW
HCO3
SO4
Cl
RW
SW
Med. uplift, glacialGreywacke rivers
Med. uplift, non-glacial
World average
Schist riversHigh uplift, glacialHigh uplift, non-glacialMed. uplift, non-glacialLow uplift, non-glacial
Fig. 2. Ternary diagrams (in equivalents) showing rainwater (RW), seawater (SW, Hem, 1985), and Southern Alps river water chemistry after correction for atmospheric inputs.For comparison, the black diamond shows the average of the world's 60 largest rivers (Gaillardet et al., 1999).
115J. Moore et al. / Chemical Geology 341 (2013) 110–127
isotope mass-balance equation (see Eqs. (3) and (4) below). If weuse a δ44/40Ca value of 0.00‰ (the seawater δ44/40Ca value) for theprecipitation input, then the corrected value negligibly changes to−1.09‰. Rivers draining schist therefore have δ44/40Ca valuesranging from −0.94 to −1.23‰, and those draining greywackehave δ44/40Ca values ranging from −0.96 to −1.38‰. Glacial rivershave lower δ44/40Ca values compared to non-glacial rivers experiencingthe same uplift rate. δ44/42Ca values analyzed for four rivers draininggreywacke range from −0.57 to−0.75‰.
Table 3 reports data for rock, soil, and vegetation samples. Rocksamples contain between 0.240 and 3.50 wt.% calcite. Trace calcite hasδ44/40Ca values ranging from −0.94 to −1.33‰ and Sr/Ca ratios rang-ing from 0.54 to 2.44 nmol/μmol. The silicate fraction of rocks haslower δ44/40Ca values and higher Sr/Ca ratios ranging from −1.14to −1.35‰ and from 9.88 to 18.7 nmol/μmol, respectively. Grassgrowing on the surface of greywacke soils east of the Main Dividehas very low δ44/40Ca values of −1.91 and −2.01‰ and Sr/Ca ratiosof 1.21 and 3.93 nmol/μmol. Exchangeable Ca in surface soils has thesame δ44/40Ca values as grass, but slightly higher Sr/Ca ratios, whileexchangeable Ca at 0.5 m depth has the same δ44/40Ca values andSr/Ca ratios as the silicate fraction of greywacke rocks. Table 4reports average end-member data for the carbonate and silicate frac-tion of rocks aswell as exchangeable Ca in shallow soils. δ44/40Ca valuesand Sr/Ca ratios for the greywacke silicate and carbonate end-membersdiffer by 0.19‰ and 10.61 nmol/μmol. δ44/40Ca values and Sr/Ca ratiosfor the schist silicate and carbonate end-members differ by 0.26‰ and8.94 nmol/μmol. Greywacke and schist have Ca/Na ratios of 0.349and 0.298 µmol/μmol. Within uncertainty, the greywacke and schistend-members are indistinguishable, consistent with the homogeneousbulk geochemistry of Southern Alps bedrock.
5. Discussion
5.1. General Ca isotope systematics
On a δ44/40Ca versus Sr/Ca diagram, silicate and carbonateend-members and their associated uncertainties define theoretical,two-component mixing envelopes (Fig. 3). We assume that Sr/Ca ra-tios are conservative, which is reasonable given the similar geochem-ical behavior of Sr and Ca. We further assume that any water sampleplotting within this envelope reflects conservative mixing of Ca fromsilicate and carbonate weathering because variations smaller than the
uncertainty of the mixing end-members cannot be confidently re-solved. After correction for atmospheric inputs, all rivers drainingschist plot within the schist mixing envelope (Fig. 3A and B), whereasmost rivers draining greywacke plot below the greywacke mixing en-velope (Fig. 3C and D). Fractionation of Ca isotopes during removal ofCa cannot explain the greywacke pattern because rivers do not dis-play evidence for Ca loss (e.g., waters are undersaturated with respectto calcite; Table 1) and moreover, calcite precipitation and otherCa uptake mechanisms would preferentially remove 40Ca, causingδ44/40Ca values to increase relative to the theoretical mixtures(Lemarchand et al., 2004; Tang et al., 2008; DePaolo, 2011). Nostudies have documented preferential release of 40Ca during mineraldissolution, and even if such release did occur, it is difficult to explainwhy this phenomenon would apply to rivers draining greywacke butnot schist. We measured δ44/42Ca values in a subset of samples to testwhether greywacke weathering yields lower δ44/40Ca values by re-leasing Ca enriched with radiogenic 40Ca (e.g., Farkaš et al., 2011;Ryu et al., 2011) but found no evidence to support this hypothesis(Fig. 4).
Both non-glacial and glacial rivers draining greywacke travelthrough broad grassland valleys. Soils developed from greywackecontain exchangeable Ca in deep horizons that is isotopically similarto the silicate weathering end-member, whereas exchangeable Ca inshallow horizons has the same isotopic composition as grass(Fig. 3C and D). Grasses and other plants preferentially incorporate40Ca during growth, and during vegetative decay, they release this40Ca to the uppermost soil exchange pool yielding low δ44/40Ca valuesrelative to bedrock (e.g., Bullen et al., 2004; Page et al., 2008;Holmden and Belanger, 2010). Because this Ca source plots furtherbelow the mixing envelope than the river water samples, we con-clude that soil water inputs transporting plant-fractionated Ca pro-vide a third mixing end-member. Plant-fractionated Ca mayinfluence rivers draining schist east of the Main Divide (i.e., thoseplotting toward the bottom of the mixing envelope; Fig. 3A and B),but grasslands are less extensive in these watersheds, particularly inthe headlands where most runoff originates. While it is certain thatbiological fractionation of Ca isotopes occurs in forest ecosystemswest of the Main Divide, we do not detect a plant-fractionated signal,presumably because shorter water residence times and thinner soilsyield a system dominated by rock weathering sources. A complemen-tary explanation is that soil inputs to rivers draining schist are toosmall to resolve within the uncertainty of the end-members.

Table 2Atmospheric inputs.a
Sample River Absolute concentrations in river water Relative proportions in river water Corrected river water concentrations
Ca K Mg Na Si SO4 Ca K Mg Na Si SO4 Ca* K* Mg* Na* Si* SO4*
(μmol/L) (%) (μmol/L)
Schist riversHigh uplift, glacialb
W40 Fox 0.615 3.13 0.166 4.78 n/a 8.07 0.182 4.42 0.462 10.4 n/a 8.07 337 67.8 35.7 41.1 n/a 92.0W41 Cook 0.663 3.38 0.179 5.15 n/a 8.70 0.188 6.44 0.561 11.6 n/a 11.1 352 49.1 31.7 39.3 n/a 69.5W43 Callery 0.503 2.56 0.136 3.91 n/a 6.60 0.161 9.67 0.816 8.85 n/a 10.6 313 23.9 16.5 40.3 n/a 55.6W45 Waiho 0.442 2.25 0.119 3.44 n/a 5.80 0.210 5.71 0.582 12.6 n/a 9.60 211 37.2 20.3 23.7 n/a 54.6W49 Waiho 0.453 2.31 0.122 3.52 n/a 5.95 0.176 4.62 0.487 11.3 n/a 9.19 257 47.7 24.9 27.7 n/a 58.7W50 Waiho 0.861 4.39 0.232 6.69 n/a 11.3 0.293 9.11 0.995 9.78 n/a 19.4 293 43.8 23.1 61.7 n/a 47.1
High uplift, non-glacialb
W44 “Franz JosefFalls”
1.06 5.41 0.286 8.25 n/a 13.9 0.309 6.56 0.631 14.6 n/a 18.7 342 77.0 45.0 48.4 n/a 60.6
W46 Waikakupa 0.817 4.16 0.220 6.35 n/a 10.7 0.279 7.40 0.592 14.3 n/a 16.7 292 52.1 36.9 38.0 n/a 53.5W47 Hugh 1.40 7.13 0.377 10.9 n/a 18.4 0.458 11.2 1.394 14.5 n/a 45.5 304 56.6 26.7 64.1 n/a 22.0W48 Omoeroa 0.985 5.02 0.265 7.66 n/a 12.9 0.429 10.6 0.962 14.9 n/a 32.2 229 42.5 27.3 43.8 n/a 27.2W55 Haast 0.367 1.87 0.099 2.85 n/a 4.81 0.842 38.4 1.488 18.6 n/a 76.6 43.2 3.00 6.54 12.5 n/a 1.47
Medium uplift, non-glacialb
W05 Neck 0.943 2.05 0.291 2.76 0.140 3.66 0.326 15.2 0.540 4.90 0.174 8.29 288 11.5 53.5 53.5 80.6 40.4W06 Big Hollywood
Burn1.23 2.69 0.381 3.61 0.184 4.79 0.438 16.9 0.770 5.21 0.190 9.64 280 13.3 49.1 65.8 96.3 44.9
W07 Sawyer Burn 1.17 2.55 0.361 3.42 0.174 4.54 0.388 18.4 0.642 5.04 0.178 8.34 300 11.3 55.8 64.5 97.8 49.9W08 Timaru 1.16 2.53 0.358 3.40 0.173 4.51 0.538 16.2 0.938 4.21 0.132 11.8 215 13.1 37.8 77.3 131 33.6
Low uplift, non-glacialb
W02 Taieri 15.6 30.8 18.0 153 1.93 50.2 9.17 85.1 13.6 39.7 2.69 100 154 5.39 114 233 69.8 0.00W03 Manuherikia 1.23 2.69 0.381 3.61 0.184 4.79 2.43 45.9 1.78 4.60 0.143 61.5 49.7 3.18 21.0 74.9 129 3.00W04 Dunstan 1.26 2.74 0.387 3.67 0.187 4.87 1.55 33.6 1.26 3.81 0.133 43.9 79.6 5.40 30.4 92.8 140 6.21
Greywacke riversMedium uplift, glacialb
W21 Hooker 0.890 1.94 0.274 2.60 0.132 3.45 0.361 10.7 1.02 6.13 0.331 5.53 245 16.2 26.7 39.8 39.9 59.0W22 Tasman 0.829 1.81 0.256 2.42 0.123 3.22 0.320 8.44 1.25 3.68 0.237 3.38 258 19.6 20.3 63.5 52.0 91.8W23 Hooker 0.910 1.98 0.281 2.66 0.135 3.53 0.373 11.1 1.08 6.38 0.339 5.77 243 15.8 25.8 39.1 39.9 57.6W24 Tasman 0.880 1.92 0.271 2.57 0.131 3.41 0.333 9.34 1.24 4.27 0.259 4.52 263 18.6 21.6 57.8 50.3 72.1
Medium uplift, non-glacialb
W10 Canyon 1.10 2.39 0.338 3.21 0.163 4.25 0.760 26.4 2.72 6.30 0.200 15.7 143 6.66 12.1 47.7 81.6 22.8W15 Jollie 0.922 2.01 0.284 2.70 0.137 3.58 0.793 25.9 2.07 6.48 0.163 13.6 115 5.74 13.5 38.9 83.9 22.8W16 Landslip 1.09 2.37 0.336 3.18 0.162 4.22 1.70 43.4 2.62 8.25 0.183 47.9 62.9 3.09 12.5 35.4 88.5 4.59W17 Cass 1.01 2.20 0.311 2.95 0.150 3.91 0.592 15.8 1.56 5.07 0.156 10.6 169 11.7 19.7 55.2 95.9 32.8W25 Bush 0.922 2.01 0.284 2.70 0.137 3.58 0.627 22.7 1.46 5.55 0.221 11.5 146 6.83 19.2 45.9 62.1 27.5W28 Rakaia 1.15 2.50 0.354 3.36 0.171 4.45 0.520 18.9 1.43 5.48 0.226 8.98 219 10.7 24.4 57.8 75.4 45.1W31 Waimakariri 2.00 4.35 0.615 5.84 0.297 7.74 0.853 33.7 2.01 6.56 0.265 15.8 232 8.54 30.0 83.1 112 41.3W32 Waimakariri 1.90 4.13 0.585 5.55 0.282 7.36 0.889 37.7 2.36 6.83 0.258 16.7 212 6.82 24.1 75.7 109 36.7W33 Waimakariri 1.68 3.66 0.517 4.91 0.250 6.51 0.913 46.3 3.02 8.28 0.302 13.6 182 4.24 16.6 54.4 82.4 41.3
a n/a=not applicable.b High uplift≈10 mm/yr, medium uplift≈1 mm/yr, low uplift≈0.1 mm/yr.
116 J. Moore et al. / Chemical Geology 341 (2013) 110–127
5.2. Apportionment of riverine Ca among silicate versus carbonateweathering
5.2.1. Application of the δ44/40Ca method
5.2.1.1. Schist rivers. As discussed above, data for rivers drainingschist appear consistent with two-component mixing. The follow-ing equations describe two-component mixing between silicateand carbonate weathering for the Ca isotope system:
δ44=40Cariv ¼ f silδ44=40Casil þ f carbδ
44=40Cacarb ð3Þ
1 ¼ f sil þ f carb; ð4Þ
where fsil and fcarb are the mole fractions of Ca from silicate andcarbonate weathering, respectively, δ44/40Cariv is the δ44/40Cavalue of river water, δ44/40Casil is the average silicate end-member δ44/40Ca value, and δ44/40Cacarb is the average carbonateend-member δ44/40Ca value. The concentrations of riverine Ca
from silicate and carbonate weathering are calculated with theequations:
Ca½ �sil ¼ Ca½ ��riv � f sil ð5Þ
Ca½ �carb ¼ Ca½ ��riv � f carb: ð6Þ
The following equation provides the uncertainty for the mixingfractions, fsil and fcarb (Genereux, 1998):
σ f carb¼
ffiffiffiffiffiffiffiffiffiffiffiffiffiffiffiffiffiffiffiffiffiffiffiffiffiffiffiffiffiffiffiffiffiffiffiffiffiffiffiffiffiffiffiffiffiffiffiffiffiffiffiffiffiffiffiffiffiffiffiffiffiffiffiffiffiffiffiffiffiffiffiffiffiffiffiffiffiffiffiffiffiffiffiffiffiffiffiffiffiffiδ44=40Casil−δ44=40Carivδ44=40Casil−δ44=40Cacarb� �2 σδ44=40Cacarb
" #2
þ δ44=40Cariv−δ44=40Cacarbδ44=40Casil−δ44=40Cacarb� �2 σδ44=40Casil
" #2
þ −1δ44=40Casil−δ44=40Cacarb
σδ44=40Cariv
2
vuuuuuuuuuuuutð7Þ
where σi is the uncertainty of parameter i.

Table 3Elemental and Ca isotope geochemistry of rocks, soil, and vegetation from the New Zealand Southern Alps.a
Sample Description Latitude Longitude Fraction Al(∝mol/g)
Ba(nmol/g)
Ca(∝mol/g)
Fe(∝mol/g)
K(∝mol/g)
Mg(∝mol/g)
Na(∝mol/g)
Rb(nmol/g)
Si(∝mol/g)
Sr(nmol/g)
δ44/40Ca CaCO b
(‰)Sr/Cac
(wt.%)δ44/40Cac
(‰)
RocksR19B Greywacke −43.78512 170.57169 HAc 51.1 52.3 35.5 46.9 6.78 37.2 4.11 17.4 26.0 104 −1.17 0.360 2.44 −1.10
HNO3 54.4 57.9 12.4 49.8 9.94 39.8 3.03 28.1 7.06 26.3 nmResidue 2848 5143 307 396 579 392 1195 1073 3.26 5739 −1.14
R20A2 Greywacke −44.28717 170.08745 HAc 24.0 56.3 23.5 14.9 4.53 15.0 2.61 9.93 13.6 43.7 nm 0.240 1.10 nmHNO3 29.8 33.03 22.8 19.6 4.33 18.6 1.4 11.8 24.6 18.0 nmResidue 2934 2913 570 561 347 453 1038 980 bdl 7723 −1.24
R20A4 Greywacke −44.28717 170.08745 HAc 28.4 89.9 35.2 18.2 3.45 18.6 2.74 8.35 20.4 73.9 −1.10 0.350 1.49 −0.98HNO3 29.2 31.4 22.2 16.6 3.90 15.2 1.21 10.12 25.5 17.3 −1.06Residue 3046 2873 710 572 336 436 1042 790 0.894 9248 −1.17
R20B Argillite −44.28717 170.08745 HAc 39.7 78.5 34.3 29.6 8.97 27.5 2.32 15.1 26.5 50.0 −1.36 0.340 1.13 −1.27HNO3 52.6 47.6 17.0 39.5 8.24 24.0 2.41 23.7 2.45 7.93 nmResidue 2840 3935 245 744 666 509 511 1107 bdl 2716 −1.35
R40 Schist −43.47767 170.00856 HAc 21.7 46.1 37.0 14.3 7.07 7.19 2.46 24.8 15.2 35.0 −1.23 0.370 0.75 −1.19HNO3 68.7 138 1.6 53.8 47.0 32.1 2.02 183 5.53 0.190 nmResidue 2024 1893 186 329 308 181 766 517 0.550 2367 −1.31
R44 Schist −43.43091 170.16873 HAc 21.3 40.2 147 97.4 7.19 34.0 4.57 44.3 15.8 539 nm 1.47 3.60 nmHNO3 38.1 43.9 29.9 71.8 14.2 30.8 1.44 49.4 25.3 102 nmResidue 3695 4893 38 445 612 346 1332 1170 3.52 2783 nm
R56E Schist −44.45418 169.23172 HAc 21.9 29.6 349 21.4 9.73 13.1 12.9 50.3 19.9 224 −1.10 3.50 0.54 −1.07HNO3 20.9 43.4 23.2 21.3 5.53 13.7 1.36 10.9 4.17 26.6 nmResidue 2586 2179 337 493 330 376 1258 659 1.58 3485 −1.32
NZ1 Schist −44.70d 169.10d HAc 17.0 25.6 271 14.5 3.52 10.9 4.58 12.5 13.6 182 −0.90 2.71 0.63 −0.90HNO3 17.1 36.7 10.8 15.5 5.63 12.0 4.12 29.7 4.67 3.14 nmResidue 2926 2913 307 715 337 562 1182 992 bdl 3035 −1.26
NZ2a Schist −44.10d 169.35d HAc 22.3 39.8 15.0 13.6 2.54 8.28 0.970 6.7 15.1 33.4 nm 0.150 2.04 nmHNO3 30.2 28.9 33.9 27.0 6.28 15.5 0.820 16.9 23.9 28.3 nmResidue 3470 3933 359 759 613 502 988 1206 1.73 3553 −1.21
SoilsSL01 0 - 5 cm −43.97495 170.31512 NH4Cl 0.610 121 15.6 bdl 5.16 3.59 0.440 8.57 0.080 94.0 −1.82
46 - 51 cm NH4Cl 0.590 50.6 0.340 bdl 0.460 bdl 0.540 5.14 0.110 4.04 −1.26SL04 0 - 5 cm −43.82542 170.60873 NH4Cl 0.650 123 12.9 bdl 2.03 3.33 0.440 3.90 0.150 86.5 −2.14
55 - 60 cm NH4Cl 0.540 36.4 4.03 bdl 0.640 0.760 0.560 5.17 0.080 39.3 −1.27
VegetationV06A grass −44.42490 169.32840 4.38 546 113 2.84 388 63.9 23.3 125 15.0 239 nmV10 grass −44.23505 169.59760 71.0 386 101 41.4 179 43.1 6.43 98.4 42.8 397 −2.01V23B grass −43.73975 170.12766 0.800 60.4 57.3 bdl 225 39.8 12.7 138 0.580 69.4 −1.91
a bdl = below detection limit; nm = not measuredb Calculated after correction for silicate mineral dissolution and assuming an ideal calcite Ca concentration of 10,000 umol/g (Jacobson and Blum, 2000).c Corrected for silicate dissolution.d Approximate locations.
117J.M
ooreet
al./Chem
icalGeology
341(2013)
110–127

Table 4Geochemistry of end-member Ca sources.
δ44/40Ca(‰)
2 SE n Sr/Ca(nmol/μmol)
2 SE n Ca/Na(μmol/μmol)
2 SE n
GreywackeCarbonate −1.039 0.125 2 1.590 0.639 4Silicate −1.225 0.092 4 12.171 1.122 21 0.349 0.049 21
SchistCarbonate −1.006 0.136 3 1.162 1.239 5Silicate −1.264 0.059 4 10.054 1.046 13 0.298 0.041 13
SoilShallow exchangeable pool −1.980 0.324 2 6.358 0.645 2
118 J. Moore et al. / Chemical Geology 341 (2013) 110–127
Apportionment calculations using Eqs. (3) and (4) cannot beperformed accurately unless mixtures plot precisely on a line definedby the end-members, and the uncertainty of the calculations intrinsi-cally depends on the uncertainties assigned to the mixtures and theend-members. While bedrock chemistry in the Southern Alps is re-markably uniform, it must be recognized that small compositional
Sr/Ca* (nmol/μmol)
25%
25%
50%
75%
25%
50%
75%
C
Carbonate end-memberSilicate end-member
δ44/4
0 Ca (s
eaw
ater
)δ44
/40 C
a (sea
wat
er)
25%
50%
A
50%75%
75%
Med. uplift, glacialGreywacke rivers
Med. uplift, non-glacial
Schist riversHigh uplift, glacialHigh uplift, non-glacialMed. uplift, non-glacialLow uplift, non-glacial
Shallow soil exch.Deep soil exch.Grass
-2.0
-1.8
-1.6
-1.4
-1.2
-1.0
-0.8
-0.6
0.0 5.0 10.0 15.0-2.0
-1.8
-1.6
-1.4
-1.2
-1.0
-0.8
-0.6
Fig. 3. δ44/40Ca versus Sr/Ca* (precipitation-corrected) for rivers draining A) and B) schist anand carbonate end-member values. Dashed lines show end-member uncertainties (Table 4silicate and carbonate weathering. Percentages correspond to relative mole fractions of rive
variations occur from watershed to watershed. Even for single water-shed studies, it is unrealistic to expect perfect characterization ofend-member compositions. We therefore assume that scatter in theriver water data shown in Fig. 3A and B occurs because the actualsilicate–carbonate mixing line for a given water sample slightly devi-ates from the average, theoretical one. This problem inherently occurs
Sr/Ca* (nmol/μmol)
90%
80%70%
60%
50%
90%80%
70%60%
D
B
90%
80%
70%
60%
-1.5
-1.4
-1.3
-1.2
-1.1
-1.0
-0.9
-0.8
0.0 1.0 2.0 3.0 4.0 5.0 6.0 7.0-1.5
-1.4
-1.3
-1.2
-1.1
-1.0
-0.9
-0.8
d C) and D) greywacke. Solid lines show theoretical mixtures between average silicate) and represent the outer bounds of envelopes defining conservative mixing betweenrine Ca from end-member sources.

δ42/4
4 Ca
(‰)
δ40/44Ca (‰)
Med. uplift, glacial
Greywacke
Med. uplift, non-glacial
0.4
0.5
0.6
0.7
0.8
0.9
0.8 1.0 1.2 1.4 1.6 1.8
Fig. 4. Plotting δ42/44Ca versus δ40/44Ca discriminates mass-dependent fractionation fromthe mass-independent effect of radioactive decay (Ryu et al., 2011). The solid line showsthe theoretical slope of 0.488 for mass-dependent fractionation, following an exponentiallaw. Release of Ca enriched with radiogenic 40Ca would cause data to plot to the right ofthe mass-dependent fractionation line. Because data lie on to the line, the “radiogenic40Ca effect” is not important for rivers draining greywacke bedrock.
Table 5River data projected onto average mixing line.
Sample River
Schist riversHigh uplift, glaciala
W40 FoxW41 CookW43 CalleryW45 WaihoW49 WaihoW50 Waiho
High uplift, non-glaciala
W44 “Franz Josef Falls”W46 WaikakupaW47 HughW48 OmoeroaW55 Haast
Medium uplift, non-glaciala
W05 NeckW06 Big Hollywood BurnW07 Sawyer BurnW08 Timaru
Low uplift, non-glaciala
W02 TaieriW03 ManuherikiaW04 Dunstan
Greywacke riversMedium uplift, glaciala
W21 HookerW22 TasmanW23 HookerW24 Tasman
Medium uplift, non-glaciala
W10 CanyonW15 JollieW16 LandslipW17 CassW25 BushW28 RakaiaW31 WaimakaririW32 WaimakaririW33 Waimakariri
a High uplift≈10 mm/yr, medium uplift≈1 mm/yr, low uplift≈0.1 mm/yr.
119J. Moore et al. / Chemical Geology 341 (2013) 110–127
for all isotope tracers but is especially problematic for δ44/40Ca owingto the small isotopic contrast of the end-members combined with therelatively large uncertainties of the measurements and the pooledend-member values.
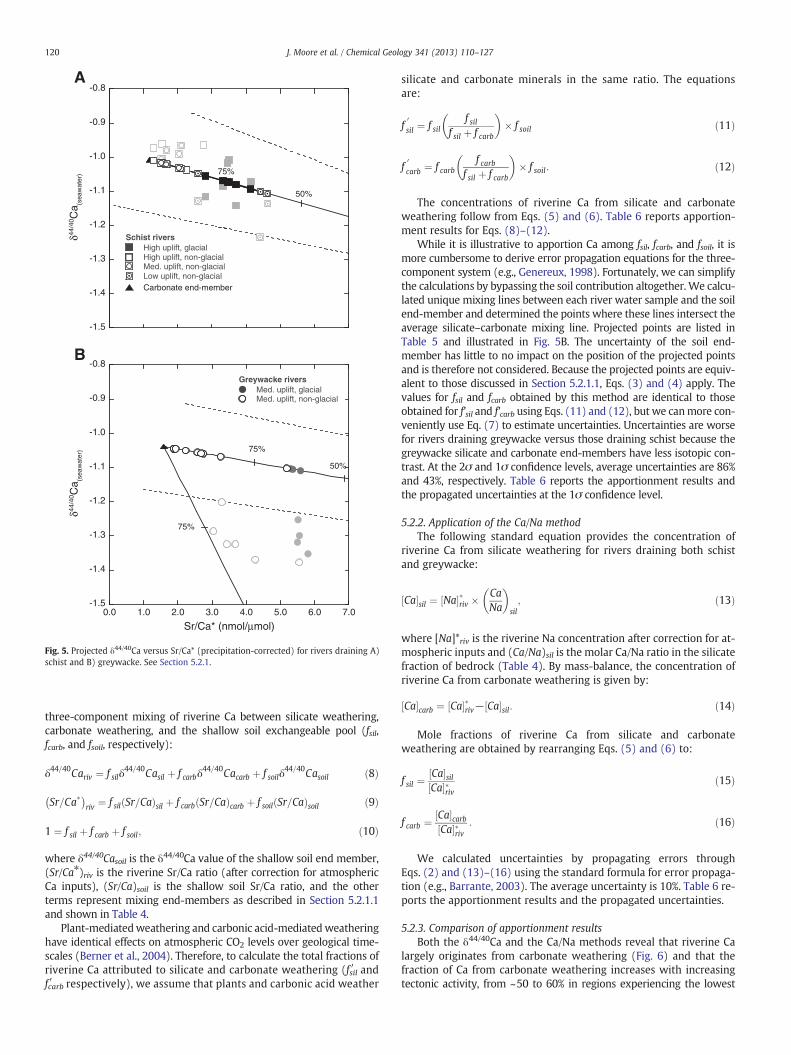
To confront theproblemof geological heterogeneity,we orthogonallyprojected the water data points onto the average silicate–carbonatemixing line using a distance minimization algorithm written in Python,and we substituted the projected points for δ44/40Cariv in Eqs. (3) and(7). The algorithm uses Brent's method to obtain the shortest distancebetween the data points and the averagemixing line along a lineperpen-dicular to the average mixing line. Projected points are listed in Table 5and illustrated in Fig. 5A. Brent's method and standard geometricalequations for orthogonal projections (e.g., Liu et al., 2004) yield identicalresults. At the 95% confidence level (i.e., using the 2σ end-memberuncertainties reported in Table 4 and the analytical uncertainty of0.07‰ for δ44/40Cariv), Eq. (7) yields an average uncertainty of 63%. Atthe 68% (1σ) confidence level, the average uncertainty improves to31%. Table 6 reports the apportionment results and the propagateduncertainties at the 1σ confidence level.
5.2.1.2. Greywacke rivers. We infer that geological heterogeneity alsocontributes to the greywacke river pattern. However, because additionof soil Ca shifts the greywacke data beyond the bounds of the theoreti-cal, silicate–carbonate mixing envelope (Fig. 3C), three-componentmixing equations are applicable. The following equations describe
Sr/Ca* δ44/40Ca
2.806 −1.0563.692 −1.0814.128 −1.0933.448 −1.0743.315 −1.0713.491 −1.076
1.285 −1.0142.255 −1.0411.536 −1.0211.527 −1.0201.681 −1.025
2.092 −1.0361.657 −1.0242.028 −1.0341.508 −1.020
4.622 −1.1074.419 −1.1022.586 −1.050
5.319 −1.1045.584 −1.1095.339 −1.1055.209 −1.102
3.219 −1.0682.200 −1.0502.717 −1.0591.870 −1.0445.167 −1.1022.586 −1.0562.685 −1.0581.860 −1.0441.948 −1.045
-1.5
-1.4
-1.3
-1.2
-1.1
-1.0
-0.9
-0.8
B
Sr/Ca* (nmol/μmol)
75%
Carbonate end-member
δ44/4
0 Ca (s
eaw
ater
)δ44
/40 C
a (sea
wat
er)
50%
75%
A
50%
75%
Med. uplift, glacialGreywacke rivers
Med. uplift, non-glacial
Schist riversHigh uplift, glacialHigh uplift, non-glacialMed. uplift, non-glacialLow uplift, non-glacial
0.0 1.0 2.0 3.0 4.0 5.0 6.0 7.0-1.5
-1.4
-1.3
-1.2
-1.1
-1.0
-0.9
-0.8
Fig. 5. Projected δ44/40Ca versus Sr/Ca* (precipitation-corrected) for rivers draining A)schist and B) greywacke. See Section 5.2.1.
120 J. Moore et al. / Chemical Geology 341 (2013) 110–127
three-component mixing of riverine Ca between silicate weathering,carbonate weathering, and the shallow soil exchangeable pool (fsil,fcarb, and fsoil, respectively):
δ44=40Cariv ¼ f silδ44=40Casil þ f carbδ
44=40Cacarb þ f soilδ44=40Casoil ð8Þ
Sr=Ca�� �
riv ¼ f sil Sr=Cað Þsil þ f carb Sr=Cað Þcarb þ f soil Sr=Cað Þsoil ð9Þ
1 ¼ f sil þ f carb þ f soil; ð10Þ
where δ44/40Casoil is the δ44/40Ca value of the shallow soil end member,(Sr/Ca⁎)riv is the riverine Sr/Ca ratio (after correction for atmosphericCa inputs), (Sr/Ca)soil is the shallow soil Sr/Ca ratio, and the otherterms represent mixing end-members as described in Section 5.2.1.1and shown in Table 4.
Plant-mediatedweathering and carbonic acid-mediatedweatheringhave identical effects on atmospheric CO2 levels over geological time-scales (Berner et al., 2004). Therefore, to calculate the total fractions ofriverine Ca attributed to silicate and carbonate weathering (fsil′ andfcarb′ respectively), we assume that plants and carbonic acid weather
silicate and carbonate minerals in the same ratio. The equationsare:
f0sil ¼ f sil
f silf sil þ f carb
� �� f soil ð11Þ
f0carb ¼ f carb
f carbf sil þ f carb
� �� f soil: ð12Þ
The concentrations of riverine Ca from silicate and carbonateweathering follow from Eqs. (5) and (6). Table 6 reports apportion-ment results for Eqs. (8)–(12).
While it is illustrative to apportion Ca among fsil, fcarb, and fsoil, it ismore cumbersome to derive error propagation equations for the three-component system (e.g., Genereux, 1998). Fortunately, we can simplifythe calculations by bypassing the soil contribution altogether. We calcu-lated unique mixing lines between each river water sample and the soilend-member and determined the points where these lines intersect theaverage silicate–carbonate mixing line. Projected points are listed inTable 5 and illustrated in Fig. 5B. The uncertainty of the soil end-member has little to no impact on the position of the projected pointsand is therefore not considered. Because the projected points are equiv-alent to those discussed in Section 5.2.1.1, Eqs. (3) and (4) apply. Thevalues for fsil and fcarb obtained by this method are identical to thoseobtained for f'sil and f'carb using Eqs. (11) and (12), but we canmore con-veniently use Eq. (7) to estimate uncertainties. Uncertainties are worsefor rivers draining greywacke versus those draining schist because thegreywacke silicate and carbonate end-members have less isotopic con-trast. At the 2σ and 1σ confidence levels, average uncertainties are 86%and 43%, respectively. Table 6 reports the apportionment results andthe propagated uncertainties at the 1σ confidence level.
5.2.2. Application of the Ca/Na methodThe following standard equation provides the concentration of
riverine Ca from silicate weathering for rivers draining both schistand greywacke:
Ca½ �sil ¼ Na½ ��riv �CaNa
� �sil; ð13Þ
where [Na]*riv is the riverine Na concentration after correction for at-mospheric inputs and (Ca/Na)sil is the molar Ca/Na ratio in the silicatefraction of bedrock (Table 4). By mass-balance, the concentration ofriverine Ca from carbonate weathering is given by:
Ca½ �carb ¼ Ca½ ��riv− Ca½ �sil: ð14Þ
Mole fractions of riverine Ca from silicate and carbonateweathering are obtained by rearranging Eqs. (5) and (6) to:
f sil ¼Ca½ �silCa½ ��riv
ð15Þ
f carb ¼ Ca½ �carbCa½ ��riv
: ð16Þ
We calculated uncertainties by propagating errors throughEqs. (2) and (13)–(16) using the standard formula for error propaga-tion (e.g., Barrante, 2003). The average uncertainty is 10%. Table 6 re-ports the apportionment results and the propagated uncertainties.
5.2.3. Comparison of apportionment resultsBoth the δ44/40Ca and the Ca/Na methods reveal that riverine Ca
largely originates from carbonate weathering (Fig. 6) and that thefraction of Ca from carbonate weathering increases with increasingtectonic activity, from ~50 to 60% in regions experiencing the lowest

Table 6Sources of riverine Ca.a
Sample River δ44Cab Ca/Na fcarb uncertainty
fcarb fsil fsoil fcarb′ c fsil′c fcarb fsil δ44Ca d Ca/Na
Schist riversHigh uplift, glaciale
W40 Fox 0.815 0.185 n/a n/a n/a 0.964 0.036 0.313 0.097W41 Cook 0.716 0.284 n/a n/a n/a 0.967 0.033 0.328 0.097W43 Callery 0.666 0.334 n/a n/a n/a 0.962 0.038 0.338 0.096W45 Waiho 0.743 0.257 n/a n/a n/a 0.966 0.034 0.323 0.097W49 Waiho 0.758 0.242 n/a n/a n/a 0.968 0.032 0.321 0.097W50 Waiho 0.738 0.262 n/a n/a n/a 0.937 0.063 0.324 0.094
High uplift, non-glaciale
W44 “Franz Josef Falls” 0.986 0.014 n/a n/a n/a 0.958 0.042 0.297 0.096W46 Waikakupa 0.877 0.123 n/a n/a n/a 0.961 0.039 0.306 0.096W47 Hugh 0.958 0.042 n/a n/a n/a 0.937 0.063 0.299 0.094W48 Omoeroa 0.959 0.041 n/a n/a n/a 0.943 0.057 0.299 0.095W55 Haast 0.942 0.058 n/a n/a n/a 0.914 0.086 0.300 0.092
Medium uplift, non-glaciale
W05 Neck 0.895 0.105 n/a n/a n/a 0.945 0.055 0.304 0.095W06 Big Hollywood Burn 0.944 0.056 n/a n/a n/a 0.930 0.070 0.300 0.094W07 Sawyer Burn 0.903 0.097 n/a n/a n/a 0.936 0.064 0.304 0.094W08 Timaru 0.961 0.039 n/a n/a n/a 0.893 0.107 0.299 0.091
Low uplift, non-glaciale
W02 Taieri 0.611 0.389 n/a n/a n/a 0.549 0.451 0.352 0.069W03 Manuherikia 0.634 0.366 n/a n/a n/a 0.551 0.449 0.346 0.069W04 Dunstan 0.840 0.160 n/a n/a n/a 0.653 0.347 0.310 0.076
Greywacke riversMedium uplift, glaciale
W21 Hooker 0.506 0.272 0.222 0.651 0.354 0.943 0.057 0.463 0.095W22 Tasman 0.450 0.271 0.279 0.624 0.376 0.914 0.086 0.476 0.092W23 Hooker 0.536 0.295 0.169 0.645 0.354 0.944 0.056 0.465 0.095W24 Tasman 0.499 0.255 0.246 0.661 0.343 0.923 0.077 0.458 0.093
Medium uplift, non-glaciale
W10 Canyon 0.566 0.104 0.330 0.844 0.152 0.884 0.116 0.406 0.090W15 Jollie 0.663 0.042 0.295 0.941 0.056 0.882 0.118 0.391 0.090W16 Landslip 0.755 0.091 0.154 0.892 0.107 0.803 0.197 0.398 0.085W17 Cass 0.721 0.020 0.259 0.973 0.028 0.886 0.114 0.388 0.090W25 Bush 0.454 0.233 0.313 0.661 0.337 0.890 0.110 0.458 0.091W28 Rakaia 0.645 0.065 0.290 0.909 0.096 0.908 0.092 0.395 0.092W31 Waimakariri 0.898 0.102 n/a 0.898 0.107 0.875 0.125 0.397 0.089W32 Waimakariri 0.834 0.023 0.143 0.973 0.028 0.875 0.125 0.388 0.089W33 Waimakariri 0.767 0.026 0.207 0.968 0.034 0.896 0.104 0.388 0.091
a n/a=not applicable.b Fractions calculated from average silicate–carbonate mixing line (see Section 5.2.1).c Total fraction after soil Ca is apportioned between silicate and carbonate weathering (see Section 5.2.1.2).d 1σ uncertainties (see Section 5.2.1).e High uplift≈10 mm/yr, medium uplift≈1 mm/yr, low uplift≈0.1 mm/yr.
fcarb (from Ca/Na)
f car
b (f
rom
δ44
/40 C
a)
0.5
0.6
0.7
0.8
0.9
1.0
0.5 0.6 0.7 0.8 0.9 1.0
Schist riversHigh uplift, glacialHigh uplift, non-glacialMed. uplift, non-glacialLow uplift, non-glacial
Med. uplift, glacial
Greywacke rivers
Med. uplift, non-glacial
Fig. 6. Fraction of Ca from carbonate weathering as determined by δ44/40Ca mixing ver-sus Ca/Na ratios. Dashed lines denote 10% deviation from 1:1 correlation.
121J. Moore et al. / Chemical Geology 341 (2013) 110–127
uplift rates (0.1 mm/yr) to>90% in regions experiencing the highest up-lift rates (10 mm/yr). These findings are consistentwith previous resultsreported for the Southern Alps (Jacobson and Blum, 2003; Jacobson etal., 2003) and other tectonically active areas, such as the HTP (Blum etal., 1998; Quade et al., 2003).While results for the δ44/40Camethod clear-ly have higher uncertainties than those obtainedwith theCa/Namethod,Fig. 6 provides compelling evidence that the former is accurate. Despitethe difficulties arising from geological heterogeneity and the small isoto-pic contrast between the silicate and carbonate end-members, agree-ment between the two methods is better than 10% (2% on average) forall rivers lacking glacial meltwater inputs, regardless of watershed size,lithology, climate, vegetation cover, and uplift conditions.
However, the δ44/40Camethod yields up to 35%more silicate-derivedCa (or 35% less carbonate-derived Ca) for glacial rivers compared to theCa/Namethod (Fig. 6). Although the δ44/40Ca method yields high uncer-tainties for individual samples, a one-way ANOVA test confirms that themean values for the non-glacial and glacial rivers are statistically differ-ent (pb0.001). Silicate Ca/Na ratios would have to be a factor of 5–9higher for the twomethods to agree, which is unrealistic.We cannot at-tribute the discrepancy to differences in the geochemistry, mineralogy,and metamorphic grade of Southern Alps bedrock because it occurs forglacial rivers draining both schist and greywacke. Likewise, there is no

122 J. Moore et al. / Chemical Geology 341 (2013) 110–127
evidence for secondary geochemical phenomena thatwould obscure theprimaryweathering signal in glacial rivers, such as isotope fractionation,biological cycling, clay mineral formation, or calcite precipitation. In theSouthern Alps, plagioclase predominantly weathers to kaolinite(Jacobson et al., 2003), which does not contain Ca. Given the excellentagreement between the δ44/40Ca and Ca/Namethods for non-glacial riv-ers, systematic bias in our calculations cannot explain the discrepancy,and nor is there any reason to consider nonlinear biases because all ev-idence points to conservative elemental behavior and simple linearmixing. By process of elimination, we infer that solute acquisition occursdifferently in glacial watersheds.
We attribute the effect to glacial grinding, whichmaintains an abun-dant supply of freshly eroded sediment hosting damagedmineral grainswith high reactive surface areas. Potentialmineralogical sources includeeither non-stoichiometric release of Ca from feldspar (e.g., Axtmannand Stallard, 1995; Anderson et al., 1997; Hodson et al., 2002; Tranter,2004), or simply greater contributions from other Ca-bearing silicateminerals that occur in Southern Alps bedrock, such as actinolite, epi-dote, prehnite, and pumpellyite. Given the limited range of δ44/40Ca var-iability, Ca-bearing minerals composing greywacke and schist likelyhave δ44/40Ca values very similar to the bulk rock values. Because Caand Sr share the same mineralogical sources and behave identicallyduring weathering, enhanced release of silicate Ca causes glacial riversto plot closer to the silicate end-member in Fig. 3. However, because dif-ferences exist for Ca and Na, Fig. 6 shows a large discrepancy betweenthe δ44/40Ca and Ca/Na apportionment methods. The only previousstudy to examine the relationship between glaciation and the Ca iso-tope geochemistry of weathering was conducted for the Damma glacierin the Swiss Alps, where the underlying bedrock does not contain tracecalcite and the Ca-bearing silicateminerals have nearly identical isotopecompositions due to recentmetamorphism (Hindshawet al., 2011). Theenhanced release of silicate Ca may occur in the Damma glacier water-shed but would be difficult to observe without a source of Ca isotopecontrast. We conclude that previous studies implementing the Ca/Namethod to apportion riverine Ca have overestimated the carbonateweathering contribution in glacial watersheds.
5.3. Global-scale implications
In this section, we examine the global-scale implications of ourfindings. First, we determine the predominant chemical weatheringpathways, namely those mediated by carbonic versus sulfuric acid;
HC
O3
(μeq
/L)
0
200
400
600
800
0 200 400 600 800
Ca* + Mg* (μeq/L)
A
1:1
1:2
B
Med. uplift, glacialGreywacke
Med. uplift, non-glacial
High uplift, glacialSchist
High uplift, non-glacialMed. uplift, non-glacialLow uplift, non-glacial
Fig. 7. A) HCO3 and B) SO4* versus Ca
next we calculate mechanical erosion, chemical weathering, and long-term atmospheric CO2 consumption rates; andfinally, we assess the sig-nificance of our findings with respect to the HTP.
5.3.1. Determination of chemical weathering pathwaysWhile the δ44/40Ca and Ca/Na methods reveal the contributions of
riverine Ca from silicate and carbonate weathering, they do not iden-tify the pathways by which the weathering reactions occurred. Sili-cate and carbonate weathering reactions involving carbonic acid aswell as sulfuric acid from sulfide oxidation often control the geo-chemistry of rivers draining orogenic belts (Anderson et al., 2000;Tranter et al., 2002; Spence and Telmer, 2005), but sulfuric acid reac-tions do not drawdown CO2 and may lead to net atmospheric CO2 ad-dition (Spence and Telmer, 2005; Ryu et al., 2008; Beaulieu et al.,2011). The following generalized equations illustrate key stoichio-metric relationships between elements involved in the long-term car-bon cycle (Ca and Mg), bicarbonate (HCO3) and sulfate (SO4):
carbonic acid-carbonate weathering (CACW)
CO2 þ H2Oþ CaxMg1−xCO3→
xCa2þ þ 1−xð ÞMg2þ þ 2HCO−3
ð17Þ
carbonic acid-silicate weathering (CASW)
2CO2 þ 3H2Oþ CaxMg1−xSiO3→
xCa2þ þ 1−xð ÞMg2þ þ 2HCO−3 þ H4SiO4
ð18Þ
sulfuric acid-carbonate weathering (SACW)
H2SO4 þ 2CaxMg1−xCO3→
2xCa2þ þ 2 1−xð ÞMg2þ þ SO2−4 þ 2HCO−
3
ð19Þ
sulfuric acid-silicate weathering (SASW)
H2SO4 þ H2Oþ CaxMg1−xSiO3→
xCa2þ þ 1−xð ÞMg2þ þ SO2−4 þ H4SiO4:
ð20Þ
If CACW and CASW dominate, then rivers should displayHCO3:(Ca+Mg) ratios of 1:1 (in equivalents), whereas if SACW dom-inates, then rivers should display HCO3:(Ca+Mg) ratios of 1:2. As
SO
4* (μ
eq/L
)
0 200 400 600 8000
200
400
600
800
Ca* + Mg* (μeq/L)
1:1
1:2
*+Mg* (μeq/L). See Section 5.3.1.

123J. Moore et al. / Chemical Geology 341 (2013) 110–127
shown in Fig. 7A, rivers analyzed in this study display HCO3:(Ca+Mg)ratios of 1:1. Similarly, SACWand SASW should yield SO4:(Ca+Mg) ra-tios of 1:2 and 1:1, respectively. As shown in Fig. 7B, rivers analyzed inthis study display SO4:(Ca+Mg) ratios of ~1:3. Fig. 7A and B show thatcarbonic acidweathering reactions dominate the geochemistry of riversdraining the New Zealand Southern Alps and that sulfuric acidweathering reactions are negligible.
5.3.2. Calculation of mechanical erosion, chemical weathering, and long-term atmospheric CO2 consumption rates
We determined mean annual runoff and suspended sedimentyields (a proxy for mechanical erosion rates) using WRENZ, a NewZealand National Institute of Water and Atmospheric Research(NIWA) empirical model, which is based on runoff and suspendedsediment concentrations from hundreds of New Zealand rivers, in-cluding those from the Southern Alps (Hicks et al., 2011). Suspendedsediment yields typically account for ≥90% of mechanical erosion(Stallard, 1995), but we note that the contribution of bedload trans-port may be higher in some larger rivers. We calculate total chemicalweathering rates, Rchem, with the equation:
Rchem ¼ CaþMg þ Naþ K þ Si½ ��riv � r ð21Þ
where Rchem has units of g/km2/yr when concentrations have units ofμg/L and runoff, r, has units of mm/yr.
Table 7Hydrological and rate data.
Sample River WRENZ streamID numbera
Catchment areaa
(km2)Runoffa
(mm/yr)
Schist riversHigh uplift, glacialb
W40 Fox 12045228 92.8 8516W41 Cook 12045501 132 7718W43 Callery 12044116 93.8 8418W45 Waiho 12044540 55.7 9428W49 Waiho 12044331 61.9 9216W50 Waiho 12043848 164 8650
High uplift, non-glacialb
W44 “Franz Josef Falls” 12044467 0.90 7582W46 Waikakupa 12044730 25.1 6541W47 Hugh 12044349 0.80 7062W48 Omoeroa 12044213 13.8 6570W55 Haast 12054920 13.6 4806
Medium uplift, non-glacialb
W05 Neck 14005873 9.0 1241W06 Big Hollywood Burn 14005448 33.4 874W07 Sawyer Burn 14005848 15.4 1047W08 Timaru 14008384 146 742
Low uplift, non-glacialb
W02 Taieri 14035378 1834 217W03 Manuherikia 14015980 200 477W04 Dunstan 14019290 187 467
Greywacke riversMedium uplift, glacialb
W21 Hooker 13502748 98.2 8821W22 Tasman 13502598 344 9599W23 Hooker 13503195 105 8579W24 Tasman 13503446 519 8650
Medium uplift, non-glacialb
W10 Canyon 14008384 28.0 3123W15 Jollie 13504882 145 2111W16 Landslip 13505880 33.0 1270W17 Cass 13504884 223 1818W25 Bush 13504926 27.7 1751W28 Rakaia 13038288 649 2544W31 Waimakariri 13038069 2173 1977W32 Waimakariri 13029311 627 3162W33 Waimakariri 13028834 164 4793
a Data from NIWA WRENZ database (Hicks et al., 2011).b High uplift≈10 mm/yr, medium uplift≈1 mm/yr, low uplift≈0.1 mm/yr.
As discussed above, carbonic acid is the predominant driver of sil-icate and carbonate weathering in the New Zealand Southern Alps. Bi-otite and chlorite, the most common Mg-bearing silicate minerals inthe Southern Alps, primarily weather to vermiculite, which retainsMg. Moreover, trace carbonate in the Southern Alps often occurs asankerite (Craw et al., 2009). Therefore, we attribute small amountsof riverine Mg (only 10.3% of the cationic charge on average) to car-bonate weathering (Jacobson and Blum, 2003; Jacobson et al.,2003). Atmospheric CO2 consumption rates by silicate and carbonateweathering (RCO2−sil and RCO2−carb, respectively) are calculated withthe equations:
RCO2−sil ¼ 2� Ca½ �sil � r ð22Þ
RCO2−carb ¼ Ca½ �carb þ Mg½ ��riv� �� r; ð23Þ
where RCO2−sil and RCO2−carb have units of mol/km2/yr when concen-trations have units of μmol/L and runoff, r, has units of mm/yr.Table 7 reports results for the preceding equations.
Fig. 8 shows chemical weathering and atmospheric CO2 consump-tion rates as a function of suspended sediment yield, a proxy for upliftandmechanical erosion rates. Note the y-axis displays log values plot-ted on a linear scale. In Fig. 8A, total chemical weathering and me-chanical erosion rates for all watersheds strongly correlate (R2=0.78) and yield a slope of 0.62 (pb0.05), consistent with the global
Mechanical erosiona
(108 g/km2/yr)Rchem(106 g/km2/yr)
RCO2-sil(105 mol/km2/yr)
RCO2-carb(105 mol/km2/yr)
52.7 160 10.6 26.469.6 148 15.5 21.9
197 132 17.6 18.9182 109 10.2 16.7170 131 11.5 20.3179 141 13.3 20.7
57.8 158 0.707 29.065.8 111 4.69 19.261.3 137 1.80 22.550.9 94.7 1.23 16.221.9 13.7 0.242 2.27
3.33 20.8 0.748 3.873.74 15.0 0.272 2.743.31 18.9 0.612 3.422.89 11.5 0.123 1.81
0.467 3.59 0.261 0.4530.772 3.80 0.174 0.2500.956 4.76 0.119 0.454
27.7 172 15.1 16.431.6 201 18.6 17.426.4 165 14.8 15.727.2 185 15.4 16.9
5.11 45.5 1.40 4.154.75 27.0 0.287 2.571.00 10.8 0.172 0.8712.54 33.3 0.166 3.351.99 23.2 1.73 2.03
25.8 54.0 1.02 5.6914.0 46.9 0.935 4.7122.4 70.9 0.361 7.2738.5 88.8 0.559 9.26

124 J. Moore et al. / Chemical Geology 341 (2013) 110–127
average value of 0.66 (Millot et al., 2002). Glacial watershedsthroughout the Southern Alps and nearly all non-glacial watershedswest of the Main Divide plot well above global average rates forchemical weathering and mechanical erosion, whereas non-glacial
A
B
C
log
Che
mic
al w
eath
erin
g flu
x (g
/km
2 /yr
)
log
Sili
cate
CO
2 co
nsum
ptio
n
(% o
f tot
al C
O2
cons
umpt
ion)
log
Sili
cate
CO
2 co
nsum
ptio
n (m
ol/k
m2 /
yr)
log Sediment yield (g/km2/yr)
6
7
8
9
-2
-1
0
3
4
5
6
7
7 8 9 10 11
Schist riversHigh uplift, glacialHigh uplift, non-glacialMed. uplift, non-glacialLow uplift, non-glacial
Med. uplift, glacialGreywacke rivers
Med. uplift, non-glacial
watersheds east of the Main Divide cluster around the global averagerates.
However, the key parameter for addressing the relationship be-tween uplift and climate is the ratio of silicate-to-carbonateweathering, expressed here as the percentage of CO2 consumed bysilicate weathering relative to the total amount of CO2 consumed bysilicate and carbonate weathering (Fig. 8B). In Section 5.2, we as-sumed that all watersheds share common silicate and carbonatemix end members according to their predominant bedrock type, ei-ther greywacke or schist. This introduces scatter in Fig. 8B (R2=0.34). Nonetheless, non-glacial watersheds define a highly significantnegative trend, with ratios of silicate-to-carbonate weathering de-creasing as uplift and mechanical erosion rates increase (pb0.01).This relationship reflects differences in the balance between rates ofcarbonate loss and supply (Chamberlain et al., 2005). East of theMain Divide, carbonate loss by weathering outpaces carbonate supplyfrom uplift and erosion, whereas west of the Main Divide, rates of lossand supply are more similar. The net effect shown in Fig. 8C is thatlong-term atmospheric CO2 consumption rates for non-glacial riversstill positively correlate with uplift and mechanical erosion rates andindeed increase by one order of magnitude over the range examined(R2=0.39, pb0.01), but the rates in the most rapidly uplifting regionof the Southern Alps are no higher than the global mean value of1.26×105 mol/km2/yr (Gaillardet et al., 1999). Glacial watershedsthroughout the region are unique because they exhibit mechanicalerosion rates similar to non-glacial watersheds west of the Main Di-vide, but the enhanced release of silicate Ca (Fig. 6) causes higher ra-tios of silicate-to-carbonate weathering. Thus, long-termatmospheric CO2 consumption rates in glacial watersheds are oneorder of magnitude higher than the global mean value (Fig. 8C).
5.3.3. Contribution of HTP glacial watersheds to the global-scale con-sumption of atmospheric CO2
TheNewZealand Southern Alps are too small to impact global atmo-spheric CO2 levels, but results from our study should apply generally toother tectonically active mountain belts. Because the HTP representsthe crux of the uplift hypothesis, we extrapolate our findings for theSouthern Alps to the HTP. To quantify the contribution of HTP glacialwatersheds to the global atmospheric CO2 consumption flux by silicateweathering on the continents, Fglobal (mol/yr), we adapt equationspresented in Dessert et al. (2003). The equation for Fglobal is:
Fglobal ¼ FHTP þ Fnon−HTP ; ð24Þ
where FHTP is the CO2flux attributed toHTP glacialwatersheds (mol/yr),and Fnon-HTP is the CO2 flux attributed to the rest of the continents (mol/yr). FHTP and Fnon-HTP are given by the equations:
FHTP ¼ xglaxHTPxsilAcontRgla ð25Þ
Fnon−HTP ¼ 1−xglaxHTPxsil� �
AcontRavg ; ð26Þ
where xgla is the area of HTP glacial watersheds relative to total HTPwatershed area, xHTP is the area of HTP watersheds relative to thetotal area of continental silicate rocks and sediments, xsil is the areaof continental silicate rocks and sediments relative to total continen-tal area, Acont is continental area (km2), and Rgla and Ravg are thelong-term atmospheric CO2 consumption rates for glacial water-sheds and average continental settings (mol/km2/yr).
Fig. 8. A) Total chemical weathering rate (Ca+K+Mg+Na+Si); B) silicate CO2 con-sumption rate as a percentage of total CO2 consumption; and C) silicate CO2 consumptionversus suspended sediment yield. Panels B) and C) represent results obtained from the Caisotope apportionment method. Error bars display average 1σ uncertainties. Solid lineshows best fit to all rivers in 8A but only non-glacial rivers in 8B and 8C. With the excep-tion of glacial rivers, the Ca/Namethod would yield an identical diagram but with smallererror bars. The black diamond represents global mean values (Gaillardet et al., 1999).
125J. Moore et al. / Chemical Geology 341 (2013) 110–127
Substituting Eqs. (25) and (26) into Eq. (24) yields an expressionfor the proportion of the global atmospheric CO2 consumption attrib-uted to silicate weathering in HTP glacial watersheds:
FHTPFglobal
¼xglaxHTPxsil Rgla=Ravg
� �1−xglaxHTPxsil
� �þ xglaxHTPxsil Rgla=Ravg
� � : ð27Þ
The HTP has a total watershed area of 3.70×10⁶ km2 (Whiteheadand Clift, 2009) with glaciers covering 1.15×10⁵ km2 (Zemp et al.,2008). The continents have an area of 1.49×10⁸ km2 (Lerman andWu, 2006) with silicate rocks and sediments composing 86.6%(Amiotte Suchet et al., 2003). According to the results presented inthis study, long-term atmospheric CO2 consumption rates in glacialwatersheds are a factor of 10 higher than those in average continentalsettings. Implemented in Eq. (27), these data yield a value of 0.88% forglacial HTP watersheds. Our finding implies that silicate weatheringin the HTP is not a major sink for atmospheric CO2.
We note that other studies have concluded the opposite, namely thatuplift-induced changes inweathering do regulate long-term atmosphericCO2 levels (Riebe et al., 2001;Hilley et al., 2010;Misra and Froelich, 2012).We reconcile this apparent discrepancy with three observations. The firstis that many studies have neglected the significant contribution of tracecalcite weathering. As a supply-limited mineral, calcite dissolves aboutas quickly as uplift and erosion deliver it to the Earth's surface. The pro-portion of riverine Ca from trace calcite weathering therefore increasesas erosion rates increase. The Ca contribution from plagioclase alsoincreases as erosion rates increase. However, as a kinetically-limitedmineral, plagioclase inherently contributes less Ca than calcite, and thecontribution eventually declines at very high erosion rates becauseshort soil residence times limit the extent of reaction (Gabet, 2007;Gabet and Mudd, 2009; Norton and von Blanckenburg, 2010; Dixon etal., 2012). The second pertains to the difference between a rate and aflux. For mountain uplift to significantly impact the global atmosphericCO2 consumption flux, active orogens must have exceptionally high at-mospheric CO2 consumption rates and/or compose a large fraction of con-tinental surface area. In the case of the HTP, neither of these conditions issatisfied. Third and finally, while there are many proxies for silicateweathering and atmospheric CO2 consumption, only Ca isotopes directlytrace Ca, the crustal element central to the uplift hypothesis. Data forthe Southern Alps of New Zealand are not consistent with the uplift hy-pothesis, even when uncertainties for the Ca isotope apportionmentmethod are carefully considered. Mountain uplift increases long-term at-mospheric CO2 consumption rates but only to levels marginally higherthan the global mean value.
6. Conclusions
Abundant evidence shows that Earth's climate began cooling~50 million years ago (Zachos et al., 2001). Many studies attributelate Cenozoic cooling to the lowering of atmospheric CO2 by in-creased silicate weathering in the HTP, which formed about thesame time that global temperatures began to drop (Raymo andRuddiman, 1992). However, assuming the New Zealand SouthernAlps are a proxy for HTP uplift (and other mountain building events),direct isotopic tracking of Ca—a key element involved in the long-term carbon cycle—counters this hypothesis. Tectonic uplift elevatesatmospheric CO2 consumption rates above those characterizingother Earth surface environments, but for most watersheds, thehighest rates are nearly equivalent to the global mean value due tothe pervasive contribution from trace calcite weathering. While gla-ciationmay yield higher silicate weathering rates than previously re-alized, the effect is insufficient to impact global atmospheric CO2
levels because glacial catchments within active mountain belts rep-resent a minor fraction of continental silicate surface area. Our datasuggest that the HTP glacial watersheds account for b1% of the
modern-day global CO2 consumption flux by silicate weathering, ingood agreement with HTP-wide estimates provided in previousstudies (Galy and France-Lanord, 1999). We conclude that silicateweathering during HTP uplift did not trigger, nor has it sustained,late Cenozoic cooling. Our findings support arguments for one ormore of the following drivers for Cenozic change: uplift-inducedchanges to the organic carbon subcycle (France-Lanord and Derry,1997; Galy et al., 2007), decreases in volcanic degassing rates from50 to 15 Ma (Li et al., 2009), changes in weathering intensity byplants and associated fungi (Taylor et al., 2011, 2012), weatheringof volcanic arcs in the tropics (Dessert et al., 2003; Rad et al., 2006;Schopka et al., 2011), or climatic feedbacks associated with elevatedCO2 (Elliot Smith et al., 2008; Wan et al., 2009).
Acknowledgements
We thank S. Hicks and T. Horton for assistance in the field, A. Wongfor help in the laboratory, D.McInerney for helpwith Python coding, theNew Zealand Department of Conservation for permitting sampling inconservation areas, and M. Hicks and K. Walter of NIWA for access to,and discussion of, runoff and suspended sediment data. We also thanktwo anonymous reviewers for their insightful comments and J. Feinfor excellent editorial handling. This work was supported by NSFEAR-0643317 and a David and Lucile Packard Foundation Fellowshipawarded to A.D.J.
References
Amiotte Suchet, P., Probst, J.L., Ludwig, W., 2003. Worldwide distribution of continentalrock lithology: implications for the atmospheric/soil CO2 uptake by continentalweathering and alkalinity river transport to the oceans. Global BiogeochemicalCycles 17, 1038.
Anderson, S.P., Drever, J.I., Humphrey, N.F., 1997. Chemical weathering in glacial envi-ronments. Geology 25, 399–402.
Anderson, S.P., Drever, J.I., Frost, C.D., Holden, P., 2000. Chemical weathering in theforeland of a retreating glacier. Geochimica et Cosmochimica Acta 64, 1173–1189.
Axtmann, E.V., Stallard, R.F., 1995. Chemical weathering in the South Cascade Glacierbasin, comparison of subglacial and extra-glacial weathering. Biogeochemistry ofSeasonally Snow-covered Catchments. International Association of HydrologicalSciences, Louvain, pp. 431–439.
Barrante, J.R., 2003. Applied Mathematics for Physical Chemistry. Prentice-Hall, Inc.,New Jersey.
Beaulieu, E., Godderis, Y., Labat, D., Roelandt, C., Calmels, D., Gaillardet, J., 2011. Model-ing of water–rock interaction in the Mackenzie basin: competition between sulfu-ric and carbonic acids. Chemical Geology 289, 114–123.
Berner, R.A., Lasaga, A.C., Garrels, R.M., 1983. The carbonate–silicate geochemical cycleand its effect on atmospheric carbon-dioxide over the past 100 million years.American Journal of Science 283, 641–683.
Berner, E.K., Berner, R.A., Moulton, K.L., 2004. Plants and mineral weathering: present andpast. In: Drever, J.I. (Ed.), Surface and Ground Water, Weathering, and Soils. Treatiseon Geochemistry. Pergamon, Oxford, pp. 169–188.
Bickle, M.J., Chapman, H.J., Bunbury, J., Harris, N.B.W., Fairchild, I.J., Ahmad, T., Pomies,C., 2005. Relative contributions of silicate and carbonate rocks to riverine Srfluxes in the headwaters of the Ganges. Geochimica et Cosmochimica Acta 69,2221–2240.
Bishop, D.G., 1972. ProgressiveMetamorphism from Prehnite–Pumpellyite to GreenschistFacies in the Dansey Pass Area, Otago, New Zealand. Geological Society of AmericaBulletin 83, 3177–3197.
Bishop, D.G., Turnbull, I.M., 1996. Geology of the Dunedin area: scale 1:250,000. Insti-tute of Geological & Nuclear Sciences Lower Hutt, New Zealand.
Blättler, C.L., Jenkyns, H.C., Reynard, L.M., Henderson, G.M., 2011. Significant increasesin global weathering during Oceanic Anoxic Events 1a and 2 indicated by calciumisotopes. Earth and Planetary Science Letters 309, 77–88.
Blättler, C.L., Henderson, G.M., Jenkyns, H.C., 2012. Explaining the phanerozoic Ca iso-tope history of seawater. Geology 40, 843–846.
Blum, J.D., Gazis, C.A., Jacobson, A.D., Chamberlain, C.P., 1998. Carbonate versus silicateweathering in the Raikhot watershed within the high Himalayan crystalline series.Geology 26, 411–414.
Blum, J.D., Klaue, A., Nezat, C.A., Driscoll, C.T., Johnson, C.E., Siccama, T.G., Eager, C.,Fahey, T.J., Likens, G.E., 2002. Mycorrhizal weathering of apatite as an importantcalcium source in base-poor forest ecosystems. Nature 417, 729–731.
Bullen, T., Fitzpatrick, J.A., White, A.F., Schulz, M.S., Vivit, D.V., 2004. Calcium stableisotope evidence for three soil calcium pools at a granitoid chronosequence. In:Wanty, R., Seal, R.I. (Eds.), Proceedings of the Eleventh International Symposiumon Water–Rock Interaction. A. A. Balkema Publishers, Philadelphia, pp. 813–817.
Carey, A.E., Gardner, C.B., Goldsmith, S.T., Lyons, W.B., Hicks, D.M., 2005. Organic carbonyields from small, mountainous rivers, New Zealand. Geophysical Research Letters32, L15404.

126 J. Moore et al. / Chemical Geology 341 (2013) 110–127
Cenki-Tok, B., Chabaux, F., Lemarchand, D., Schmitt, A.D., Pierret, M.C., Viville, D.,Bagard, M.L., Stille, P., 2009. The impact of water–rock interaction and vegeta-tion on calcium isotope fractionation in soil- and stream waters of a small, for-ested catchment (the Strengbach case). Geochimica et Cosmochimica Acta 73,2215–2228.
Chamberlain, C.P., Waldbauer, J.R., Jacobson, A.D., 2005. Strontium, hydrothermal sys-tems and steady-state chemical weathering in active mountain belts. Earth andPlanetary Science Letters 238, 351–366.
Clayton, J.L., 1986. An estimate of Plagioclase Weathering Rate in the Idaho BatholithBased upon Geochemical Transport Rates. Acad. Press, Orlando, FL, United States,United States, pp. 453–466.
Clow, D.W., Drever, J.I., 1996. Weathering rates as a function of flow through an alpinesoil. Chemical Geology 132, 131–141.
Cox, S.C., Barrell, D.J.A., 2007. Geology of the Aoraki area: scale 1:250,000. Institute ofGeological & Nuclear Sciences Lower Hutt, New Zealand.
Craw, D., Beckett, S., 2004. Water and sediment chemistry of Sutton Salt Lake, EastOtago, New Zealand. New Zealand Journal of Marine and Freshwater Research38, 315–328.
Craw, D., Upton, P., MacKenzie, D.J., 2009. Hydrothermal alteration styles in ancientand modern orogenic gold deposits, New Zealand. New Zealand Journal of Geologyand Geophysics 52 (11-11-26).
De La Rocha, C.L., DePaolo, D.J., 2000. Isotopic evidence for variations in the marinecalcium cycle over the Cenozoic. Science 289, 1176–1178.
DePaolo, D.J., 2011. Surface kinetic model for isotopic and trace element fractionationduring precipitation of calcite from aqueous solutions. Geochimica et CosmochimicaActa 75, 1039–1056.
Dessert, C., Dupre, B., Gaillardet, J., Francois, L.M., Allegre, C.J., 2003. Basalt weatheringlaws and the impact of basalt weathering on the global carbon cycle. ChemicalGeology 202, 257–273.
Dixon, J.L., Hartshorn, A.S., Heimsath, A.M., DiBiase, R.A., Whipple, K.X., 2012. Chemicalweathering response to tectonic forcing: a soils perspective from the San GabrielMountains, California. Earth and Planetary Science Letters 323–324, 40–49.
Drever, J.I., Hurcomb, D.R., 1986. Neutralization of atmospheric acidity by chemicalweathering in an alpine drainage basin in the North Cascade Mountains. Geology14, 221–224.
Elliot Smith, M., Carroll, A.R., Mueller, E.R., 2008. Elevated weathering rates in the rockymountains during the early eocene climatic optimum. Nature Geoscience 1, 370–374.
Fantle, M.S., 2010. Evaluating the Ca isotope proxy. American Journal of Science 310,194–230.
Fantle, M.S., Tollerud, H., Eisenhauer, A., Holmden, C., 2012. The Ca isotopic composi-tion of dust-producing regions: measurements of surface sediments in the BlackRock Desert, Nevada. Geochimica et Cosmochimica Acta 87, 178–193.
Farkas, J., Bohm, F., Wallmann, K., Blenkinsop, J., Eisenhauer, A., van Geldern, R.,Munnecke, A., Voigt, S., Veizer, J., 2007. Calcium isotope record of Phanerozoicoceans: implications for chemical evolution of seawater and its causative mech-anisms. Geochimica et Cosmochimica Acta 71, 5117–5134.
Farkaš, J., Déjeant, A., Novák, M., Jacobsen, S.B., 2011. Calcium isotope constraints onthe uptake and sources of Ca2+ in a base-poor forest: a new concept of combiningstable (δ44/42Ca) and radiogenic (εCa) signals. Geochimica et Cosmochimica Acta75, 7031–7046.
Feth, J.H.F., 1981. Chloride in natural continental water: a review. U.S. Geological SurveyWater-Supply Paper, 2176.
Forsyth, P.J., 2001. Geology of the Waitaki area: scale 1:250,000. Institute of Geological& Nuclear Sciences Lower Hutt, New Zealand.
France-Lanord, C., Derry, L.A., 1997. Organic carbon burial forcing of the carbon cyclefrom Himalayan erosion. Nature 390, 65–67.
Gabet, E.J., 2007. A theoretical model coupling chemical weathering and physical ero-sion in landslide-dominated landscapes. Earth and Planetary Science Letters 264,259–265.
Gabet, E.J., Mudd, S.M., 2009. A theoretical model coupling chemical weathering rateswith denudation rates. Geology 37, 151–154.
Gaillardet, J., Dupre, B., Louvat, P., Allegre, C.J., 1999. Global silicate weathering and CO2
consumption rates deduced from the chemistry of large rivers. Chemical Geology159, 3–30.
Galy, A., France-Lanord, C., 1999. Weathering processes in the Ganges–Brahmaputrabasin and the riverine alkalinity budget. Chemical Geology 159, 31–60.
Galy, V., France-Lanord, C., Beyssac, O., Faure, P., Kudrass, H., Palhol, F., 2007. Efficientorganic carbon burial in the Bengal fan sustained by the Himalayan erosional sys-tem. Nature 450, 407–410.
Garrels, R.M., 1967. Genesis of some ground waters from igneous rocks. In: Abelson,P.H. (Ed.), Researches in Geochemistry. Wiley, New York, pp. 405–420.
Genereux, D., 1998. Quantifying uncertainty in tracer-based hydrograph separations.Water Resources Research 34, 915–919.
Grapes, R., Watanabe, T., 1992. Metamorphism and uplift of Alpine schist in the FranzJosef–Fox Glacier area of the Southern Alps, New Zealand. Journal of MetamorphicGeology 10, 171–180.
Griffith, E.M., Paytan, A., Caldeira, K., Bullen, T.D., Thomas, E., 2008. A dynamic marinecalcium cycle during the past 28 million years. Science 322, 1671–1674.
Hem, J.D., 1985. Study and Interpretation of the Chemical Characteristics of NaturalWater. W2254 U. S. Geological Survey, Reston, VA.
Heuser, A., Eisenhauer, A., Bohm, F., Wallmann, K., Gussone, N., Pearson, P.N., Nagler,T.F., Dullo, W.C., 2005. Calcium isotope (δ44/40Ca) variations of Neogene planktonicforaminifera. Paleoceanography 20.
Hicks, D.M., Shankar, U., McKerchar, A.I., Basher, L., Lynn, I., Page, M., Jessen, M., 2011.Suspended sediment yields from New Zealand rivers. Journal of Hydrology NewZealand 50, 81–142.
Hilley, G.E., Chamberlain, C.P., Moon, S., Porder, S., Willett, S.D., 2010. Competition be-tween erosion and reaction kinetics in controlling silicate-weathering rates. Earthand Planetary Science Letters 293, 191–199.
Hindshaw, R.S., Reynolds, B.C., Wiederhold, J.G., Kretzschmar, R., Bourdon, B., 2011.Calcium isotopes in a proglacial weathering environment: Damma Glacier,Switzerland. Geochimica et Cosmochimica Acta 75, 106–118.
Hodson, A., Porter, P., Lowe, A., Mumford, P., 2002. Chemical denudation and silicateweathering in Himalayan glacier basins: Batura Glacier, Pakistan. Journal ofHydrology 262, 193–208.
Holmden, C., Belanger, N., 2010. Ca isotope cycling in a forested ecosystem. Geochimicaet Cosmochimica Acta 74, 995–1015.
Holmden, C., Papanastassiou, D.A., Blanchon, P., Evans, S., 2012. δ44/40Ca variability inshallow water carbonates and the impact of submarine groundwater dischargeon Ca-cycling in marine environments. Geochimica et Cosmochimica Acta 83,179–194.
Hovius, N., Stark, C.P., Allen, P.A., 1997. Sediment flux from a mountain belt derived bylandslide mapping. Geology 25, 231–234.
Hren, M.T., Chamberlain, C.P., Hilley, G.E., Blisniuk, P.M., Bookhagen, B., 2007. Major ionchemistry of the Yarlung Tsangpo–Brahmaputra river: chemical weathering, ero-sion, and CO2 consumption in the southern Tibetan plateau and eastern syntaxisof the Himalaya. Geochimica et Cosmochimica Acta 71, 2907–2935.
Jacobson, A.D., Blum, J.D., 2000. Ca/Sr and Sr-87/Sr-86 geochemistry of disseminatedcalcite in Himalayan silicate rocks from Nanga Parbat: influence on river-waterchemistry. Geology 28, 463–466.
Jacobson, A.D., Blum, J.D., 2003. Relationship between mechanical erosion and atmo-spheric CO2 consumption in the New Zealand Southern Alps. Geology 31, 865–868.
Jacobson, A.D., Holmden, C., 2008. δ44Ca evolution in a carbonate aquifer and its bear-ing on the equilibrium isotope fractionation factor for calcite. Earth and PlanetaryScience Letters 270, 349–353.
Jacobson, A.D., Blum, J.D., Chamberlain, C.P., Craw, D., Koons, P.O., 2003. Climatic andtectonic controls on chemical weathering in the New Zealand Southern Alps.Geochimica et Cosmochimica Acta 67, 29–46.
Kasemann, S.A., Hawkesworth, C.J., Prave, A.R., Fallick, A.E., Pearson, P.N., 2005. Boron andcalcium isotope composition in Neoproterozoic carbonate rocks from Namibia: evi-dence for extreme environmental change. Earth and Planetary Science Letters 231,73–86.
Lemarchand, D., Wasserburg, G.T., Papanastassiou, D.A., 2004. Rate-controlled calciumisotope fractionation in synthetic calcite. Geochimica et Cosmochimica Acta 68,4665–4678.
Lerman, A., Wu, L., 2006. Kinetics of global geochemical systems. In: Brantley, S.L.,Kubicki, J.D., White, A.F. (Eds.), Kinetics of Water–Rock Interaction. Springer-Kluwer.
Li, G., Ji, J., Chen, J., Kemp, D.B., 2009. Evolution of the Cenozoic carbon cycle: the rolesof tectonics and CO2 fertilization. Global Biogeochemical Cycles 23.
Liu, F.J., Williams, M.W., Caine, N., 2004. Source waters and flow paths in an alpinecatchment, Colorado Front Range, United States. Water Resources Research 40.
Lupker, M., France-Lanord, C., Galy, V., Lavé, J., Gaillardet, J., Gajurel, A.P., Guilmette, C.,Rahman, M., Singh, S.K., Sinha, R., 2012. Predominant floodplain over mountainweathering of Himalayan sediments (Ganga basin). Geochimica et CosmochimicaActa 84, 410–432.
Lyons, W.B., Carey, A.E., Hicks, D.M., Nezat, C.A., 2005. Chemical weathering in high-sediment-yielding watersheds, New Zealand. Journal of Geophysical Research110, F01008.
MacKinnon, T.C., 1983. Origin of the Torlesse terrane and coeval rocks, South Island,New Zealand. Geological Society of America Bulletin 94, 967–985.
Mast, M.A., Drever, J.I., Baron, J., 1990. Chemical weathering in the Loch Vale watershed,Rocky Mountain National Park, Colorado. Water Resources Research 26, 2971–2978.
Miller, E.K., Blum, J.D., Friedland, A.J., 1993. Determination of soil exchangeable-cationloss and weathering rates using Sr isotopes. Nature 362, 438–441.
Milliman, J.D., Syvitski, J.P.M., 1992. Geomorphic tectonic control of sediment dischargeto the ocean — the importance of small mountainous rivers. Journal of Geology100, 525–544.
Millot, R., Gaillardet, J., Dupré, B., Allègre, C.J., 2002. The global control of silicateweathering rates and the coupling with physical erosion: new insights from riversof the Canadian Shield. Earth and Planetary Science Letters 196, 83–98.
Misra, S., Froelich, P.N., 2012. Lithium isotope history of Cenozoic seawater: changes insilicate weathering and reverse weathering. Science 335, 818–823.
Mitchell, A.C., Brown, G.H., 2008. Modeling geochemical and biogeochemical reactionsin subglacial environments. Arctic, Antarctic, and Alpine Research 40, 531–547.
Nathan, S., Rattenbury, M.S., Suggate, R.P., 2002. Geology of the Greymouth area: scale1:250,000. Institute of Geological & Nuclear Sciences Lower Hutt, New Zealand.
Négrel, P., Allègre, C.J., Dupré, B., Lewin, E., 1993. Erosion sources determined by inver-sion of major and trace element ratios and strontium isotopic ratios in river: theCongo Basin case. Earth and Planetary Science Letters 120, 59–76.
Norris, R.J., Koons, P.O., Cooper, A.F., 1990. The obliquely convergent plate boundary inthe South Island of New Zealand: implications for ancient collision zones. Journalof Structural Geology 12, 715–725.
Norton, K.P., von Blanckenburg, F., 2010. Silicate weathering of soil-mantled slopes inan active Alpine landscape. Geochimica et Cosmochimica Acta 74, 5243–5258.
Oliva, P., Dupre, B., Martin, F., Viers, J., 2004. The role of trace minerals in chemicalweathering in a high-elevation granitic watershed (Estibere, France): chemicaland mineralogical evidence. Geochimica et Cosmochimica Acta 68, 2223–2243.
Page, B.D., Bullen, T.D., Mitchell, M.J., 2008. Influences of calcium availability and tree spe-cies on Ca isotope fractionation in soil and vegetation. Biogeochemistry 88, 1–13.
Parkhurst, D.L., Appelo, C.A.J., 1999. User's Guide to PHREEQC (Version 2). W4259 U.S.Geological Survey, Washington, DC.

127J. Moore et al. / Chemical Geology 341 (2013) 110–127
Perakis, S., Maguire, D., Bullen, T., Cromack, K., Waring, R., Boyle, J., 2006. Coupled ni-trogen and calcium cycles in forests of the Oregon Coast Range. Ecosystems 9,63–74.
Quade, J., English, N., DeCelles, P.G., 2003. Silicate versus carbonate weathering in theHimalaya: a comparison of the Arun and Seti River watersheds. Chemical Geology202, 275–296.
Rad, S., Louvat, P., Gorge, C., Gaillardet, J., Allégre, C.J., 2006. River dissolved and solidloads in the Lesser Antilles: new insight into basalt weathering processes. Journalof Geochemical Exploration 88, 308–312.
Raymo, M.E., Ruddiman, W.F., 1992. Tectonic forcing of late Cenozoic climate. Nature359, 117–122.
Raymo, M.E., Ruddiman, W.F., Froelich, P.N., 1988. Influence of late Cenozoic mountainbuilding on ocean geochemical cycles. Geology 16, 649–653.
Riebe, C.S., Kirchner, J.W., Granger, D.E., Finkel, R.C., 2001. Strong tectonic and weakclimatic control of long-term chemical weathering rates. Geology 29, 511–514.
Ryu, J.S., Lee, K.S., Chang, H.W., Shin, H.S., 2008. Chemical weathering of carbonates andsilicates in the Han River basin, South Korea. Chemical Geology 247, 66–80.
Ryu, J.S., Jacobson, A.D., Holmden, C., Lundstrom, C., Zhang, Z., 2011. The major ion,δ44/40Ca, δ44/42Ca, and δ26/24 Mg geochemistry of granite weathering at pH=1and T=25 °C: power-law processes and the relative reactivity of minerals.Geochimica et Cosmochimica Acta 75, 6004–6026.
Schmitt, A.D.S., Stille, P., 2005. The source of calcium in wet atmospheric deposits: Ca–Srisotope evidence. Geochimica et Cosmochimica Acta 69, 3463–3468.
Schmitt, A.D., Chabaux, F., Stille, P., 2003. The calcium riverine and hydrothermal isotopicfluxes and the oceanic calciummass balance. Earth and Planetary Science Letters 213,503–518.
Schopka, H.H., Derry, L.A., Arcilla, C.A., 2011. Chemical weathering, river geochemistryand atmospheric carbon fluxes from volcanic and ultramafic regions on LuzonIsland, the Philippines. Geochimica et Cosmochimica Acta 75, 978–1002.
Silva-Tamayo, J.C., Nägler, T.F., Sial, A.N., Nogueira, A., Kyser, K., Riccomini, C., James,N.P., Narbonne, G.M., Villa, I.M., 2010. Global perturbation of the marine Ca isotopiccomposition in the aftermath of the Marinoan global glaciation. Precambrian Re-search 182, 373–381.
Simpson, G.D.H., Cooper, A.F., Norris, R.J., 1994. Late Quaternary evolution of the Alpinefault zone at Paringa, South Westland, New Zealand. New Zealand Journal of Geol-ogy and Geophysics 37, 49–58.
Spence, J., Telmer, K., 2005. The role of sulfur in chemical weathering and atmosphericCO2 fluxes: evidence from major ions, δ13C-(DIC), and δ34S-(SO4) in rivers of theCanadian Cordillera. Geochimica et Cosmochimica Acta 69, 5441–5458.
Stallard, R.F., 1995. Relating chemical and physical erosion. In: White, A.F., Brantley, S.L.(Eds.), Chemical Weathering Rates of Silicate Minerals. Reviews in Mineralogy.Mineralogical Society of America, Washington, DC, pp. 543–564.
Stillings, L.L., Brantley, S.L., 1995. Feldspar dissolution at 25 °C and pH 3: reactionstoichiometry and the effect of cations. Geochimica et Cosmochimica Acta 59,1483–1496.
Tang, J.W., Dietzel, M., Bohm, F., Kohler, S.J., Eisenhauer, A., 2008. Sr2+/Ca2+ and 44Ca/40Cafractionation during inorganic calcite formation: II. Ca isotopes. Geochimica etCosmochimica Acta 72, 3733–3745.
Taylor, A.S., Blum, J.D., Lasaga, A.C., 2000. The dependence of labradorite dissolution andSr isotope release rates on solution saturation state. Geochimica et CosmochimicaActa 64, 2389–2400.
Taylor, L., Banwart, S., Leake, J., Beerling, D.J., 2011. Modeling the evolutionary rise ofectomycorrhiza on sub-surface weathering environments and the geochemicalcarbon cycle. American Journal of Science 311, 369–403.
Taylor, L.L., Banwart, S.A., Valdes, P.J., Leake, J.R., Beerling, D.J., 2012. Evaluating theeffects of terrestrial ecosystems, climate and carbon dioxide on weathering overgeological time: a global-scale process-based approach. Philosophical Transactionsof the Royal Society of London. Series B, Biological Sciences 367, 565–582.
Teagle, D.A.H., Hall, C.M., Cox, S.C., Craw, D., 1998. Ar/Ar dating and uplift rate of hydro-thermal minerals in the Southern Alps, New Zealand. In: Arehart, G.B., Hulston, J.R.(Eds.), Proceedings — International Symposium on Water–Rock Interaction, pp.801–804.
Templeton, A.S., Chamberlain, C.P., Koons, P.O., Craw, D., 1998. Stable isotopic evidencefor mixing between metamorphic fluids and surface-derived waters during recentuplift of the Southern Alps, New Zealand. Earth and Planetary Science Letters 154,73–92.
Tipper, E.T., Galy, A., Bickle, M.J., 2008. Calcium and magnesium isotope systematics inrivers draining the Himalaya–Tibetan-Plateau region: lithological or fractionationcontrol? Geochimica et Cosmochimica Acta 72, 1057–1075.
Tipper, E.T., Gaillardet, J., Galy, A., Louvat, P., Bickle, M.J., Capmas, F., 2010. Calciumisotope ratios in the world's largest rivers: a constraint on the maximum imbal-ance of oceanic calcium fluxes. Global Biogeochemical Cycles 24, GB3019.
Tomlinson, A.I., 1992. Precipitation and the atmosphere. In: Mosley, M.P. (Ed.), Watersof New Zealand. New Zealand Hydrological Society, Christchurch, pp. 63–74.
Tranter, M., 2004. Geochemical weathering in glacial and proglacial environments. In:Drever, J.I. (Ed.), Surface and Ground Water, Weathering, and Soils. Treatise onGeochemistry. Elsevier Pergamon, San Diego, CA, pp. 190–205.
Tranter, M., Sharp, M.J., Lamb, H.R., Brown, G.H., Hubbard, B.P., Willis, I.C., 2002.Geochemical weathering at the bed of Haut Glacier d'Arolla, Switzerland — anew model. Hydrological Processes 16, 959–993.
Turnbull, I.M., 2000. Geology of the Wakatipu area: scale 1:250,000. Institute ofGeological & Nuclear Sciences Lower Hutt, New Zealand.
Urey, H.C., 1952. The Planets, their Origin and Development. Yale University Press, NewHaven (245 pp.).
Wadleigh, M.A., Veizer, J., Brooks, C., 1985. Strontium and its isotopes in Canadian rivers:fluxes and global implications. Geochimica et Cosmochimica Acta 49, 1727–1736.
Walcott, R.I., 1998. Modes of oblique compression: Late Cenozoic tectonics of the SouthIsland of New Zealand. Reviews of Geophysics 36, 1–26.
Walker, J.C.G., Hays, P.B., Kasting, J.F., 1981. A negative feedback mechanism for thelong-term stabilization of Earth's surface temperature. Journal of GeophysicalResearch — Oceans and Atmospheres 86, 9776–9782.
Wan, S., Kürschner, W.M., Clift, P.D., Li, A., Li, T., 2009. Extreme weathering/erosion dur-ing the Miocene Climatic Optimum: evidence from sediment record in the SouthChina Sea. Geophysical Research Letters 36.
Wellman, H.W., 1979. An uplift map for the South Island of New Zealand, and amodel for uplift of the Southern Alps. Bulletin. Royal Society of New Zealand13–20.
West, A.J., Bickle, M.J., Collins, R., Brasington, J., 2002. Small-catchment perspective onHimalayan weathering fluxes. Geology 30, 355–358.
West, A.J., Galy, A., Bickle, M., 2005. Tectonic and climatic controls on silicateweathering. Earth and Planetary Science Letters 235, 211–228.
White, A.F., Schulz, M.S., Lowenstern, J.B., Vivit, D.V., Bullen, T.D., 2005. The ubiquitousnature of accessory calcite in granitoid rocks: implications for weathering, soluteevolution, and petrogenesis. Geochimica et Cosmochimica Acta 69, 1455–1471.
White, A.F., Schulz, M.S., Vivit, D.V., Blum, A.E., Stonestrom, D.A., Anderson, S.P., 2008.Chemical weathering of a marine terrace chronosequence, Santa Cruz, CaliforniaI: interpreting rates and controls based on soil concentration–depth profiles.Geochimica et Cosmochimica Acta 72, 36–68.
White, A.F., Schulz, M.S., Stonestrom, D.A., Vivit, D.V., Fitzpatrick, J., Bullen, T.D., Maher, K.,Blum, A.E., 2009. Chemical weathering of a marine terrace chronosequence, SantaCruz, California. Part II: solute profiles, gradients and the comparisons of contem-porary and long-term weathering rates. Geochimica et Cosmochimica Acta 73,2769–2803.
Whitehead, J.A., Clift, P.D., 2009. Continent elevation, mountains, and erosion: free-board implications. Journal of Geophysical Research — Solid Earth 114.
Wolff-Boenisch, D., Gabet, E.J., Burbank, D.W., Langner, H., Putkonen, J., 2009. Spatialvariations in chemical weathering and CO2 consumption in Nepalese High Hima-layan catchments during the monsoon season. Geochimica et Cosmochimica Acta 73,3148–3170.
Wu, L., Jacobson, A.D., Hausner, M., 2008. Characterization of elemental release duringmicrobe–granite interactions at T=28 °C. Geochimica et Cosmochimica Acta 72,1076–1095.
Yoo, K., Mudd, S.M., 2008. Discrepancy between mineral residence time and soil age: im-plications for the interpretation of chemical weathering rates. Geology 36, 35–38.
Zachos, J., Pagani, M., Sloan, L., Thomas, E., Billups, K., 2001. Trends, rhythms, and aber-rations in global climate 65 Ma to present. Science 292, 686–693.
Zemp, M., Roer, I., Kaeaeb, A., Hoelzle, M., Paul, F., Haeberli, W., 2008. Global GlacierChanges: Facts and Figures. World Glacier Monitoring Service, Zurich, Switzerland(88 pp.).