trading firms and trading costs in services: the case of ... · 1 trading firms and trading costs...
TRANSCRIPT

1
Trading firms and trading costs in services: The case of Sweden
Magnus Lodefalk, Örebro University and Ratio Institute1
Hildegunn Kyvik Nordås, OECD and Örebro University
Abstract
This paper first portraits Swedish services exporters and services MNEs; second it analyses the determinants of
services exports and affiliate sales; and third it studies the choice of mode of entering a foreign market. Emanating
from a heterogeneous firm internationalization model, the main contribution of the paper is to explore the
interaction between firm characteristics and foreign market characteristics, particularly policy-induced services trade
barriers, in shaping services trade and investment patterns. Exploiting a large and very detailed firm-level dataset for
the 2008-2013 period, the descriptive analysis finds that most exporting firms export one or two products to a few,
most often other Nordic countries. Still, firms that export to 25 or more markets account for more than 80% of total
export value. Furthermore, firms that export to 20 countries export more than 60% to their main destination
country. Similar patterns are found for affiliate sales. Using a gravity approach we then study the determinants of
the extensive and intensive margin of exports and affiliate sales in pooled as well as sector level regressions. We find
that trade costs, both natural and policy-induced have the largest impact on the extensive margin of trade,
suggesting that trade costs facing services exporters are mainly in the form of fixed entry costs. This is further
supported by the finding that incumbency is the most important determinant of future exports and affiliate sales,
and incumbents tend to be protected and thrive behind trade barriers.
JEL: D22, F13
Keywords: services trade, affiliate sales, trade costs, micro data, Sweden
1. Introduction
The benefits of international trade stem from exploiting comparative advantage; deepening division
of labour through international production networks; and widening consumer choice without
foregoing economies of scale. Adjusting to changing market and policy conditions does, however,
entail considerable structural changes at the micro level including the entry and exit of firms; job
creation as well as job destruction. In the popular debate the overall gains from open markets and
trade are mostly recognised, but more attention has been paid to a possible link between
globalisation and job losses and stagnating median income. To address these concerns and mitigate
undesirable social impacts, a better understanding of micro-economic dynamics behind the overall
gains is needed.
Recent theory developments starting with a seminal paper by Melitz (2003), supported by a growing
body of empirical analysis of firm behaviour, have shed light on the impact of globalisation on
structural changes and the adjustments taking place at the firm level. Empirical research using micro
1 Lodefalk: Örebro University, SE-70182, Örebro, and Ratio Institute, Box-3202, SE-10364, Stockholm, Sweden.
E-mail: [email protected]. Kyvik Nordås (corresponding author): Trade and Agriculture Directorate, OECD, Paris, France. E-mail: [email protected].

2
data has largely focussed on the manufacturing sector, but recently a small, but growing body of
empirical research also sheds light on the characteristics of services exporters. Similar to exporters
of goods, services exporting firms tend to be larger, more productive, more often foreign owned and
they pay higher wages than non-exporters (Wagner, 2012).
Micro data analyses are country-specific out of necessity because such data are compiled under
strict confidentiality and there is no common methodology for sample selection and classification.
Furthermore, the variables contained in the micro databases differ across countries. General insights
from this body of research are still tentative (Wagner, 2012) and more research is needed to
understand how the special features of services play out in the global market place. Given that
services account for up to 80% of employment in rich countries and many services are substantially
transformed by the digital revolution, the importance of understanding the dynamics of the services
sector cannot be overstated.
This paper presents a portrait of Swedish services exporters and relates their market entry and trade
performance to the policy regime they face abroad. Sweden is a relatively small and open economy
home to a number of multinational enterprises with well-known brand names both in manufacturing
and services. Examples are Ericsson, Volvo, IKEA, H&M, Atlas Copco and Scania to mention but a
few. Manufacturing firms in Sweden are increasingly servicifying—buying, producing and exporting
services (Lodefalk, 2013, 2014). Swedish entrepreneurs have also been at the technology frontier in
the digital economy with firms such as Spotify taking an early and prominent position in the market
for music streaming and Minecraft in computer games.
We find that Swedish firms by and large fit the portrait of exporting firms reported in other studies.
However, foreign-owned firms in Sweden are less likely to export, and having entered export
markets, they export less than Swedish-owned firms. Furthermore, Swedish firms appear to be much
more sensitive to trade costs other than those related to physical distance, at the extensive margin
than at the intensive margin, suggesting that services exporters largely face fixed cost of entering
new markets, be it for new products or entering new countries. This interpretation is further
strengthened by the fact that one of the most important determinants of both exports and affiliate
sales is previous experience with exports or affiliate sales to the same country. Furthermore,
incumbents tend to sell more in countries with high policy induced trade restrictions, suggesting that
such restrictions may actually protect incumbents from new entrants. Services exports in one year is
also a strong predictor for foreign affiliate sales in subsequent years, indicating that firms may enter
a market through exports before they establish affiliate sales there. We finally observe that services
exports and services imports go together. Thus, services importing firms are much more likely to
export services and they export more than firms that do not import services.
2. Relation to previous research
Descriptive analysis – portrait of exporters, importers and MNEs
There is a small but fast-growing empirical, mainly descriptive literature portraying exporting and
importing firms and comparing them to non-exporting firms over variables such as productivity, firm
size, ownership structure, profits and firm survival to mention the most important. Most studies
focus on manufacturing firms, but recently a few papers on services exporters have been added to
the literature. Interestingly, it is documented that manufacturing firms are important services
3
exporters, particularly of computer services and other business services. This also applies to Sweden
where Gozzo (2010) found that manufacturing firms accounted for about a third of services exports.
The stylised facts that emerge from the descriptive literature are that most firms do not export;
most of those that do, export to one or a few markets; and exporting firms tend to be larger, more
productive and more often have foreign ownership than non-exporting firms. It is also clear that
firms that export to multiple export markets are more productive than both non-exporters and firms
that export to one market only. Similar patterns are found for importing firms (Bernard et al. 2007;
Antràs et al. 2016) and firms that export and import goods and services are the most productive.
Finally, exporting firms also tend to pay higher wages, but this effect tends to disappear once worker
characteristics are taken into account (Wagner, 2012).
Lööf (2010) related export status to productivity using Swedish firm level data for the period 1997-
2006. He aimed at determining whether firms are more productive because they export (the
learning by exporting hypothesis) or whether they export because they are more productive (the
self-selection into export hypotheses) and found support for the self-selection hypothesis. He also
found that the productivity premium from exporting is larger for services firms than for
manufacturing firms, a feature that few other papers report. Furthermore, while other studies have
found that manufacturing firms account for a large share of services exports, Lööf (2010) found that
services firms account for more than a third of total Swedish manufactured exports in 2006, up from
25% in 1997.
The findings from Swedish micro data is otherwise similar to those for the UK (Breinlich and
Criscuolo, 2011), France (Gaulier et al 2010), Germany (Kelle and Kleinert, 2010; Vogel, 2011), Italy
(Conti et al, 2010; Federico and Tosti 2012) the Netherlands (Kox and Rojas-Romagosa, 2010),
Belgium (Ariu, 2016), Austria (Walter and Dell’mour, 2010) and two comparative studies, one for
Finland, France, Ireland and Slovenia (Haller et al., 2014) and one for France, Germany and the UK
(Temouri et al., 2013). The German results on the productivity premium are, however, not robust to
the exclusion of outliers (Vogel and Wagner, 2011). Finally, it appears that the productivity premium
for exporting firms is either smaller or about the same for services as for goods in other studies
(Breinlich and Criscuolo, 2011; Kox and Rojas-Romagosa, 2010; Ariu, 2016).
A few papers have also covered trade through commercial presence, i.e. sales from subsidiaries
abroad. Rouzet et al (2017) compare Finland, Germany, Italy, Japan, the UK and the US and find that
firms which establish foreign affiliates in services are even larger and fewer than those that engage
in cross-border trade, they establish in fewer foreign markets, but foreign affiliate sales nevertheless
dwarf cross-border exports. Kelle et al (2013) and Christen and Francois (2015) report similar
findings for Germany and the US respectively. Interestingly, Rouzet et al (2017) find that services
exports are highly concentrated even for the firms that are present in the largest number of export
markets. Thus, the top destination market accounts for about half of services exports and affiliate
sales. Using a similar methodology as Rouzet et al (2017) we assess to what extent Sweden conforms
to the stylized facts reported in the literature; in which aspects Sweden is different and possible
explanations for such differences. We find that policy-determined trade barriers are most important
at the extensive margin, and that they tend to protect incumbent firms in a given market. We find a
strong relationship between trade in goods and services and between exports and imports of
services. The most important determinant of current affiliate sales and exports to a given market is,
4
however, previous exports or affiliate sales to the same market, suggesting that relevant experience
is highly country-specific. Contrary to other studies, we find that foreign-owned firms are less likely
to export and they export less than Swedish-owned firms, indicating that foreign-owned firms in
Sweden focus on the local and possibly the Nordic market.
Explaining firm behaviour in international markets
Motivated by early empirical findings largely from manufacturing firms, the role of firm
heterogeneity in the structural changes following globalisation was first embedded in a model of
trade and product differentiation in a seminal paper by Melitz (2003). In his model the key firm
characteristic that determines export status, entry and survival is the productivity level. The model
predicts that a reduction in trade costs induces the most productive firms to expand in export
markets and lowers the productivity threshold for entering export markets and thus draws new
firms into international markets. Less productive firms service local markets only, while the least
productive firms exit. The total number of firms declines and the average size and productivity of
firms in an economy increases.
The Melitz (2003) model inspired a host of papers embedding firm heterogeneity into the gravity
model. Assuming that the distribution of firms along the productivity dimension follows a Pareto
distribution, the resulting gravity equation could be estimated on aggregate trade data.2 The major
new insight from this research is the distinction between the intensive and extensive margin of
trade. The model explains a previously ignored empirical feature of international trade, namely the
significant number of country pairs that do not trade with each other.
By and large bilateral services trade in the aggregate as well as specific services sectors, notably
business services, are well explained by the gravity model featuring heterogeneous firms.3 In the
same manner as for goods, bilateral trade in services increases with the market size of both parties
and declines with geographical, cultural and institutional distance. Services trade is also muted by
trade restricting regulation and differences in the regulatory regime (Nordås and Rouzet, 2016;
Nordås, 2016).
The gravity model has also been applied to firm-level data using the variation in partner country
features to explain the determinants of firms’ selection into export markets and which markets they
choose to enter.4 This allows a richer analysis of the margins of trade, looking not only at the number
of exporters and the average exports per firm, but also changes in the composition of exporting
firms following a policy change. Crozet et al (2016) find that French business services are much less
likely to export to countries with burdensome domestic regulation such as licensing and recognition
of qualifications or lack thereof.5 Firms also export less to the more restrictive markets that they
enter into. From a policy perspective the models featuring heterogeneous firms provide an analytical
framework for studying the possible need for and effect of incentives for entering export markets
and conversely the need for and effect of policies to compensate and assist individuals that lose
their jobs due to structural changes.
2 See Melitz and Redding (2014) for a review.
3 See Francois and Hoekman (2010) for a recent survey.
4 See Head and Mayer (2014) for a recent review of the gravity literature.
5 The measure of burdensome regulation in this paper is the OECD Product Market Regulation (PMR) indices
for professional services.
5
Rouzet et al (2017) relate trade and foreign affiliate sales to services trade restrictions measured by
the OECD Services Trade Restrictiveness Index (STRI). They find that both trade and foreign affiliate
sales are significantly hampered by services trade restrictions. Furthermore, small firms and firms
with less experience in servicing foreign markets are more affected by services trade barriers than
large firms with an established presence in the market in question. Finally, they find that foreign
affiliates are less affected by trade restrictions in the home country of their parent than other
exporters to that market. These findings suggest that services trade barriers may protect incumbents
and large multinational firms from start-ups and entrants into new markets, a finding with very
significant policy implications if confirmed in subsequent analysis.
A few papers have analysed empirically the decision to enter markets through exports or
commercial establishment for services. Kelle et al (2013) used German firm level data and found that
services firms tend to enter foreign markets mainly through exports and that the firms that engage
in outward FDI are also the large exporters. Conditioning on having entered foreign markets at all,
using a generalised ordered logit model, they find that firms are more likely to choose FDI in distant
markets and larger markets; when cross-border trade costs are high; and when wages in the host
country are not too high. Surprisingly, they find no effect of policy restrictions on FDI on choice of
mode. Christen and Francois (2015) in contrast found a strong negative effect of FDI restrictions on
the share of foreign affiliate sales out of the firm’s total sales in a given market. They studied the
choice of mode for US firms and found that the distance effect was particularly strong for business
services. Moreover, the relative importance of affiliate sales was larger in markets where the US had
more manufacturing FDI.6 Finally Bhattacharya et al. (2012) argued that FDI may be the easiest route
to a foreign market in services sectors characterised by heterogeneous firms, close to zero trade
costs and uncertainty related to the quality of the service. They tested their model setup on Indian
data comparing chemicals where transport costs are significant but quality easily verified, to
computer services where trade costs are low but quality uncertain. They found that, as expected,
Indian computer services exporters are more productive than computer services firms servicing
foreign markets mainly through FDI.
This paper follows the Rouzet et al. (2017) methodology closely to provide comparable further
evidence of the relationship between trade restrictive policies and trade in services. In addition we
analyse the determinants of the choice of mode of supply of Swedish services exporters using SUR
and three-stage GLS estimates of exports and affiliate sales and GLM estimates of the share of
exports in total services sales. We are particularly interested in shedding more light on the role of
policy in shaping trade and investment patterns, given the mixed results in the literature so far. It
turned out, however, that matching the export and affiliate sales data can be problematic and our
results should be seen as preliminary on this account. With that caveat in mind, there is some
evidence that exports precede affiliate sales and that exports are more sensitive to trade restrictions
on the intensive margin than are affiliate sales. Intuitively this makes sense since affiliate sales are
preceded by fixed and sometimes sunk cost of establishment, after which a foreign-owned firm in
most cases faces the same regulations as local firms in the host market.
6 Christen and Francois (2015) applied GLM estimations for the share of foreign affiliate sales in total sales and
SUR as a robustness check.
6
3. Analytical framework
As we will see in the next sections, most services exporting firms export to one or a few markets and
most MNEs establish in one or a few foreign countries. The first variable of interest is therefore the
decision to enter a foreign market and what determines which firms chose to export to which
markets, which firms choose to establish an affiliate in which country and to what extent the export
and MNE decisions are linked. For this we build on the insights from Melitz’s (2003) and subsequent
empirical applications as reviewed in Melitz and Redding (2014).
Heterogeneous firms draw productivity 𝜑 from a Pareto distribution 𝐺(𝜑) = 1 − (1 𝜑⁄ )𝜅 and start
to produce if the productivity level exceeds a threshold for entering the local market. Entering a
foreign market involves expenditure on market research, negotiating a contract with a client or
customer, complying with regulation in the destination market and other costs. These are partly or
fully independent of the subsequent trade volume and must be incurred in each market that the
firm enters. In addition there may be variable trade costs, 𝜏𝑗ℎ, that are proportional to trade values.
Therefore, it pays off for a firm to enter a foreign market only if it obtains a price and export volume
sufficient to recover the fixed cost of entering the market. The ability of a firm to recover its entry
cost depends on its own productivity, its ability to differentiate the product from competitors and
the fixed cost of entering the market in question.
Making the standard assumption of monopolistic competition, a firm’s mark-up over marginal costs
is a constant that depends on the elasticity of substitution between different varieties of the product
category, σh > 1, which may differ across sectors, but is assumed to be the same across markets
within a sector. Further, we assume a simple, constant returns to scale production technology
𝑥(𝜑) = 𝜑𝑙 where labour is the only factor of production. Finally, consumers are assumed to have
homothetic preferences and spend constant shares of their income on each product category. The
unit price, revenue and profit of firm i in sector h from selling in market j is then be given by:
𝑝𝑖𝑗ℎ(𝜑) =𝜎ℎ
1−𝜎ℎ
𝜏𝑗ℎ𝑤
𝜑 (1)
𝑟𝑖𝑗ℎ(𝜑) =𝜎ℎ
1−𝜎ℎ
𝜏𝑗ℎ𝑤
𝜑𝑥𝑖𝑗ℎ(𝜑) = 𝐴𝑗ℎ (
𝜎ℎ−1
𝜎ℎ)
𝜎ℎ−1(
𝜏𝑗ℎ𝑤
𝜑)
1−𝜎ℎ (2)
Where 𝐴𝑗ℎ = 𝑋𝑗ℎ𝑃𝑗𝜎ℎ−1 represents total demand in country j for product category h and 𝑃𝑗
𝜎ℎ−1 is a
CES price index aggregating the prices of all varieties of products in sector h available in country j.
𝜋𝑖𝑗ℎ(𝜑) =𝑟𝑖𝑗ℎ(𝜑)
𝜎ℎ− 𝐹𝑗ℎ = 𝐴𝑗ℎ
(𝜎ℎ−1)𝜎ℎ−1
𝜎ℎ𝜎ℎ
(𝜏𝑗ℎ𝑤
𝜑)
1−𝜎ℎ− 𝐹𝑗ℎ (3)
Firms will enter market j if the profit from doing so is positive. The cut-off productivity level for
entering the market is derived by setting profits to zero and solving for the productivity parameter:
�̅� = 𝐵 ∗ 𝐴𝑗ℎ1/(1−𝜎ℎ)𝜏𝑗ℎ𝑤𝐹𝑗ℎ
1/(𝜎ℎ−1) (4)
Where B is a constant depending on 𝜎ℎ. The cut-off productivity level for entering the market is
lower the larger the foreign market and the higher the higher is the marginal costs of production as
represented by the wage rate, and the higher are the fixed and variable costs of entering the foreign
market. Firms have to incur the fixed costs in each market they enter, and for various reasons such
7
as coordination costs of operating in a large number of markets, it is unlikely to enter all the markets
for which the productivity cut-off rate holds.7 Entering a foreign market is therefore thought of as a
probability depending on the parameters and variables included in the zero profit condition, which
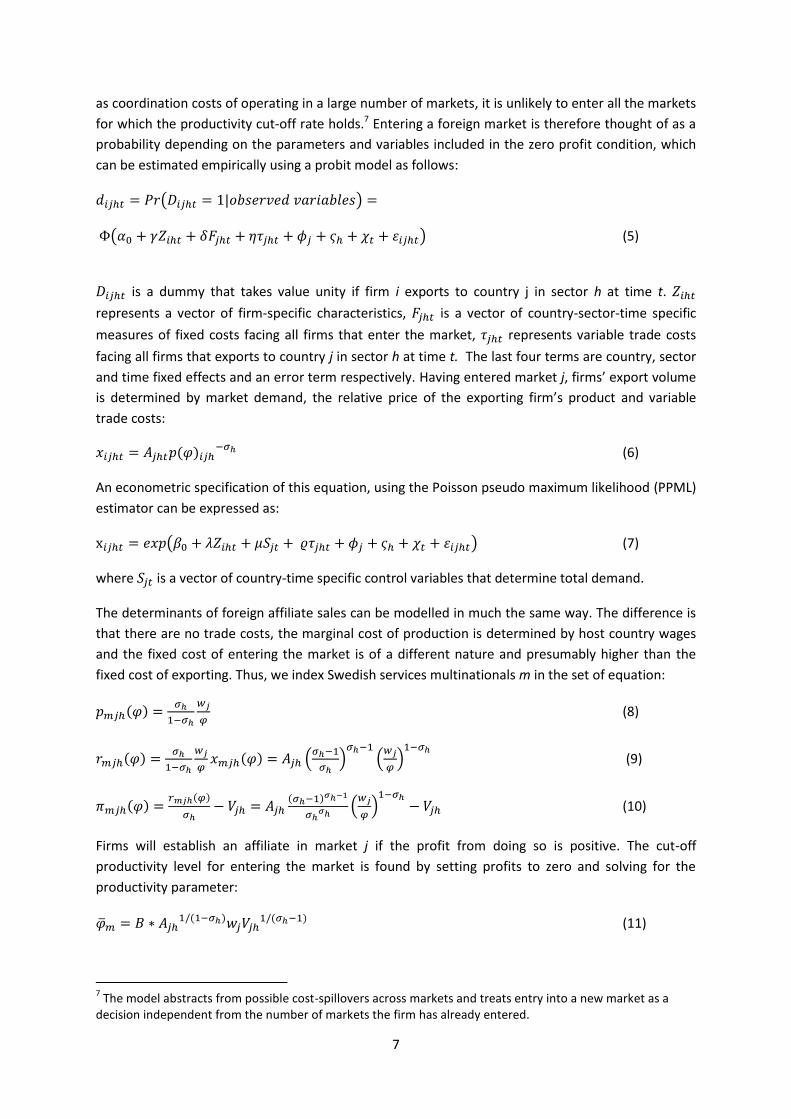
can be estimated empirically using a probit model as follows:
𝑑𝑖𝑗ℎ𝑡 = 𝑃𝑟(𝐷𝑖𝑗ℎ𝑡 = 1|𝑜𝑏𝑠𝑒𝑟𝑣𝑒𝑑 𝑣𝑎𝑟𝑖𝑎𝑏𝑙𝑒𝑠) =
Φ(𝛼0 + 𝛾𝑍𝑖ℎ𝑡 + 𝛿𝐹𝑗ℎ𝑡 + 𝜂𝜏𝑗ℎ𝑡 + 𝜙𝑗 + 𝜍ℎ + 𝜒𝑡 + 휀𝑖𝑗ℎ𝑡) (5)
𝐷𝑖𝑗ℎ𝑡 is a dummy that takes value unity if firm i exports to country j in sector h at time t. 𝑍𝑖ℎ𝑡
represents a vector of firm-specific characteristics, 𝐹𝑗ℎ𝑡 is a vector of country-sector-time specific
measures of fixed costs facing all firms that enter the market, 𝜏𝑗ℎ𝑡 represents variable trade costs
facing all firms that exports to country j in sector h at time t. The last four terms are country, sector
and time fixed effects and an error term respectively. Having entered market j, firms’ export volume
is determined by market demand, the relative price of the exporting firm’s product and variable
trade costs:
𝑥𝑖𝑗ℎ𝑡 = 𝐴𝑗ℎ𝑡𝑝(𝜑)𝑖𝑗ℎ−𝜎ℎ (6)
An econometric specification of this equation, using the Poisson pseudo maximum likelihood (PPML)
estimator can be expressed as:
x𝑖𝑗ℎ𝑡 = 𝑒𝑥𝑝(𝛽0 + 𝜆𝑍𝑖ℎ𝑡 + 𝜇𝑆𝑗𝑡 + 𝜚𝜏𝑗ℎ𝑡 + 𝜙𝑗 + 𝜍ℎ + 𝜒𝑡 + 휀𝑖𝑗ℎ𝑡) (7)
where 𝑆𝑗𝑡 is a vector of country-time specific control variables that determine total demand.
The determinants of foreign affiliate sales can be modelled in much the same way. The difference is
that there are no trade costs, the marginal cost of production is determined by host country wages
and the fixed cost of entering the market is of a different nature and presumably higher than the
fixed cost of exporting. Thus, we index Swedish services multinationals m in the set of equation:
𝑝𝑚𝑗ℎ(𝜑) =𝜎ℎ
1−𝜎ℎ
𝑤𝑗
𝜑 (8)
𝑟𝑚𝑗ℎ(𝜑) =𝜎ℎ
1−𝜎ℎ
𝑤𝑗
𝜑𝑥𝑚𝑗ℎ(𝜑) = 𝐴𝑗ℎ (
𝜎ℎ−1
𝜎ℎ)
𝜎ℎ−1(
𝑤𝑗
𝜑)
1−𝜎ℎ (9)
𝜋𝑚𝑗ℎ(𝜑) =𝑟𝑚𝑗ℎ(𝜑)
𝜎ℎ− 𝑉𝑗ℎ = 𝐴𝑗ℎ
(𝜎ℎ−1)𝜎ℎ−1
𝜎ℎ𝜎ℎ
(𝑤𝑗
𝜑)
1−𝜎ℎ− 𝑉𝑗ℎ (10)
Firms will establish an affiliate in market j if the profit from doing so is positive. The cut-off
productivity level for entering the market is found by setting profits to zero and solving for the
productivity parameter:
�̅�𝑚 = 𝐵 ∗ 𝐴𝑗ℎ1/(1−𝜎ℎ)𝑤𝑗𝑉𝑗ℎ
1/(𝜎ℎ−1) (11)
7 The model abstracts from possible cost-spillovers across markets and treats entry into a new market as a
decision independent from the number of markets the firm has already entered.
8
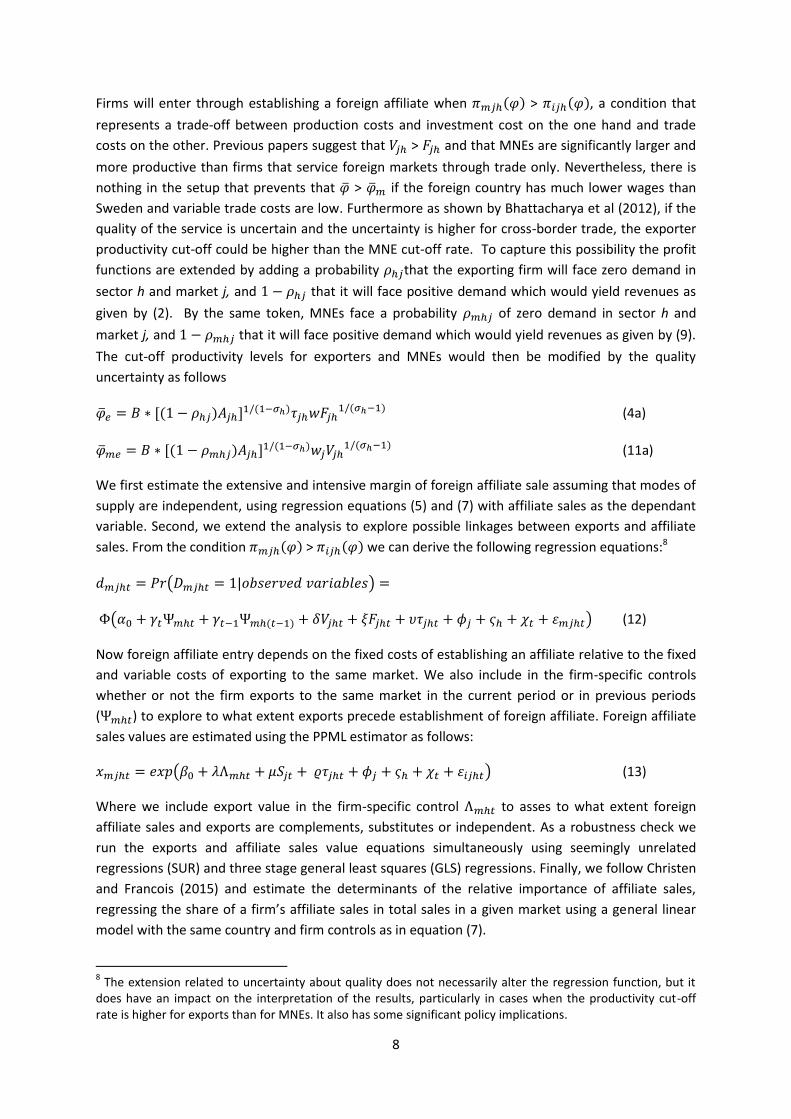
Firms will enter through establishing a foreign affiliate when 𝜋𝑚𝑗ℎ(𝜑) > 𝜋𝑖𝑗ℎ(𝜑), a condition that
represents a trade-off between production costs and investment cost on the one hand and trade
costs on the other. Previous papers suggest that 𝑉𝑗ℎ > 𝐹𝑗ℎ and that MNEs are significantly larger and
more productive than firms that service foreign markets through trade only. Nevertheless, there is
nothing in the setup that prevents that �̅� > �̅�𝑚 if the foreign country has much lower wages than
Sweden and variable trade costs are low. Furthermore as shown by Bhattacharya et al (2012), if the
quality of the service is uncertain and the uncertainty is higher for cross-border trade, the exporter
productivity cut-off could be higher than the MNE cut-off rate. To capture this possibility the profit
functions are extended by adding a probability 𝜌ℎ𝑗that the exporting firm will face zero demand in
sector h and market j, and 1 − 𝜌ℎ𝑗 that it will face positive demand which would yield revenues as
given by (2). By the same token, MNEs face a probability 𝜌𝑚ℎ𝑗 of zero demand in sector h and
market j, and 1 − 𝜌𝑚ℎ𝑗 that it will face positive demand which would yield revenues as given by (9).
The cut-off productivity levels for exporters and MNEs would then be modified by the quality
uncertainty as follows
�̅�𝑒 = 𝐵 ∗ [(1 − 𝜌ℎ𝑗)𝐴𝑗ℎ]1/(1−𝜎ℎ)𝜏𝑗ℎ𝑤𝐹𝑗ℎ1/(𝜎ℎ−1) (4a)
�̅�𝑚𝑒 = 𝐵 ∗ [(1 − 𝜌𝑚ℎ𝑗)𝐴𝑗ℎ]1/(1−𝜎ℎ)𝑤𝑗𝑉𝑗ℎ1/(𝜎ℎ−1) (11a)
We first estimate the extensive and intensive margin of foreign affiliate sale assuming that modes of
supply are independent, using regression equations (5) and (7) with affiliate sales as the dependant
variable. Second, we extend the analysis to explore possible linkages between exports and affiliate
sales. From the condition 𝜋𝑚𝑗ℎ(𝜑) > 𝜋𝑖𝑗ℎ(𝜑) we can derive the following regression equations:8
𝑑𝑚𝑗ℎ𝑡 = 𝑃𝑟(𝐷𝑚𝑗ℎ𝑡 = 1|𝑜𝑏𝑠𝑒𝑟𝑣𝑒𝑑 𝑣𝑎𝑟𝑖𝑎𝑏𝑙𝑒𝑠) =
Φ(𝛼0 + 𝛾𝑡Ψ𝑚ℎ𝑡 + 𝛾𝑡−1Ψ𝑚ℎ(𝑡−1) + 𝛿𝑉𝑗ℎ𝑡 + 𝜉𝐹𝑗ℎ𝑡 + 𝜐𝜏𝑗ℎ𝑡 + 𝜙𝑗 + 𝜍ℎ + 𝜒𝑡 + 휀𝑚𝑗ℎ𝑡) (12)
Now foreign affiliate entry depends on the fixed costs of establishing an affiliate relative to the fixed
and variable costs of exporting to the same market. We also include in the firm-specific controls
whether or not the firm exports to the same market in the current period or in previous periods
(Ψ𝑚ℎ𝑡) to explore to what extent exports precede establishment of foreign affiliate. Foreign affiliate
sales values are estimated using the PPML estimator as follows:
𝑥𝑚𝑗ℎ𝑡 = 𝑒𝑥𝑝(𝛽0 + 𝜆Λ𝑚ℎ𝑡 + 𝜇𝑆𝑗𝑡 + 𝜚𝜏𝑗ℎ𝑡 + 𝜙𝑗 + 𝜍ℎ + 𝜒𝑡 + 휀𝑖𝑗ℎ𝑡) (13)
Where we include export value in the firm-specific control Λ𝑚ℎ𝑡 to asses to what extent foreign
affiliate sales and exports are complements, substitutes or independent. As a robustness check we
run the exports and affiliate sales value equations simultaneously using seemingly unrelated
regressions (SUR) and three stage general least squares (GLS) regressions. Finally, we follow Christen
and Francois (2015) and estimate the determinants of the relative importance of affiliate sales,
regressing the share of a firm’s affiliate sales in total sales in a given market using a general linear
model with the same country and firm controls as in equation (7).
8 The extension related to uncertainty about quality does not necessarily alter the regression function, but it
does have an impact on the interpretation of the results, particularly in cases when the productivity cut-off rate is higher for exports than for MNEs. It also has some significant policy implications.

9
4. Data
Swedish firm-level data
We base the empirical analysis on our matched firm-level panel dataset for Sweden in the 2008-
2013 period. Using unique identification numbers for all Swedish firms, we have merged several
register datasets from Statistics Sweden. Key characteristics of all active private firms, excluding the
finance and insurance sector, comes from the Structural Business Statistics.9 From here we retrieve
data on turnover, assets, employment, foreign ownership, etcetera. Further data on foreign and
domestic firm affiliations and firm dynamics are from the Enterprise Group Register and the Firm
and Plant Dynamics Register. Data on foreign trade by firm-year-partner-product/service come from
the Foreign Trade Statistics. For goods trade with countries outside the EU, data is comprehensive
and register-based (Extrastat data from the Swedish Customs). For goods trade with other EU
countries, data is from the Intrastat population survey, with registration applying to firms whose
total trade with the rest of the EU excludes a certain threshold (4.5 million SEK). Trade in services is
recorded through a stratified monthly survey (GATS modes 1, 2 and 4), where the largest firms in
terms of turnover or trade always are included.10 Finally, we add data on firm activities abroad, using
the total population survey on Swedish controlled enterprise groups with subsidiaries abroad. The
survey is annual and collects information about firm activities in terms of foreign affiliates, their
sales and employment.11 In this way, we include information on commercial presence abroad (GATS
mode 3).
In line with the title of our paper, we focus our analysis on firms that export services, irrespective of
whether they are in the services or manufacturing sector. We therefore include firms that export to
at least one foreign market and have at least five employees at one point in time in the period
studied. Data for the smallest micro-enterprises are known to be noisy and being less carefully
screened by statistical offices. The restrictions are also motivated to capture firms that more
regularly are included in the services trade survey. The resulting sample consists of approximately 15
million observations and each year there are approximately 1,500 firms included.12
Gravity variables
The standard gravity variables related to geographical, cultural and institutional differences are from
CEPII (Head et al., 2010).
The STRI
9 Sector K (64-66) of the European Union NACE-classification is excluded.
10 Trade in services is defined according to the United Nations (2002) definition: a cross-border transaction
related to a contract on services sales. The stratified survey includes approximately 6,000 firms (10% of the relevant population) , whereof a quarter of those firms (approximately 1,500) always is included and is to provide additional details, specifically on the destination/source of their service payment. A third of the remaining firms in the survey are replaced each year. Stratification is done over industries and sizes (turnover). For more details, see, e.g., Growth Analysis (2010). 11
Basic information is extracted from annual reports of parent firms and then complemented by survey answers (approximately 80% response rate). All firms with affiliates abroad are included in the survey [# of parent firms]. Swedish ownership is defined as at least 50% of the votes of being held by Swedes. 12
In addition, a very limited number of observations with negative services export are excluded, representing less than 0.1‰ of the total.
10
Information on services trade policy draws on the OECD Services Trade Restrictiveness Indices (STRI) and database.13 The indices reflect de jure services trade restrictions which are catalogued, scored and weighted to produce composite indices taking values between zero and one. Zero represents a fully open sector and one a completely closed market. The indices are calculated for 22 services sectors for the 35 OECD member countries plus Brazil, China, Colombia, Costa Rica, India, Indonesia, Lithuania, Russia and South Africa.
The STRIs contain a set of core measures common for all sectors and in addition sector-specific measures. Examples of the latter are access and interconnection regulation in telecommunications and rail services, conditions related to obtaining a licence in regulated professions, and measures related to copyright management across borders in audio-visual services, to mention but a few. Exemptions from such restrictions negotiated through free trade agreements are not taken into account in the STRI database and indices. This is less of a problem than one may think. First, services trade barriers are largely behind the border in the form or domestic regulation. Second, free trade agreements rarely provide meaningful market access beyond making legally binding the liberalisation that has already taken place unilaterally. The only significant exception to this is the European Economic Area (EEA), to which Sweden is a member. To control for preferential access that Swedish firms enjoy in the EEA, we include a dummy which takes the value of unity if the export destination or host country of Swedish affiliates are a member of the EEA and zero otherwise.
5. A portrait of Swedish services exporters and MNEs
Descriptive statistics
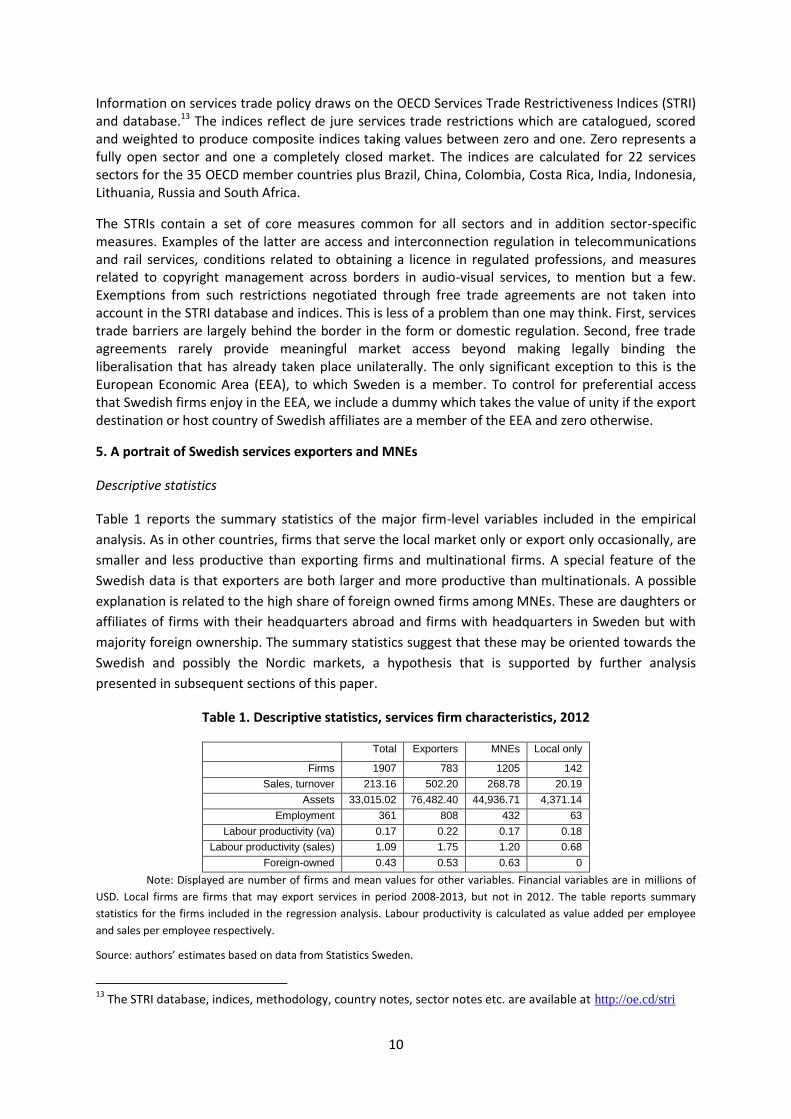
Table 1 reports the summary statistics of the major firm-level variables included in the empirical
analysis. As in other countries, firms that serve the local market only or export only occasionally, are
smaller and less productive than exporting firms and multinational firms. A special feature of the
Swedish data is that exporters are both larger and more productive than multinationals. A possible
explanation is related to the high share of foreign owned firms among MNEs. These are daughters or
affiliates of firms with their headquarters abroad and firms with headquarters in Sweden but with
majority foreign ownership. The summary statistics suggest that these may be oriented towards the
Swedish and possibly the Nordic markets, a hypothesis that is supported by further analysis
presented in subsequent sections of this paper.
Table 1. Descriptive statistics, services firm characteristics, 2012
Total Exporters MNEs Local only
Firms 1907 783 1205 142
Sales, turnover 213.16 502.20 268.78 20.19
Assets 33,015.02 76,482.40 44,936.71 4,371.14
Employment 361 808 432 63
Labour productivity (va) 0.17 0.22 0.17 0.18
Labour productivity (sales) 1.09 1.75 1.20 0.68
Foreign-owned 0.43 0.53 0.63 0
Note: Displayed are number of firms and mean values for other variables. Financial variables are in millions of
USD. Local firms are firms that may export services in period 2008-2013, but not in 2012. The table reports summary
statistics for the firms included in the regression analysis. Labour productivity is calculated as value added per employee
and sales per employee respectively.
Source: authors’ estimates based on data from Statistics Sweden.
13
The STRI database, indices, methodology, country notes, sector notes etc. are available at http://oe.cd/stri
11
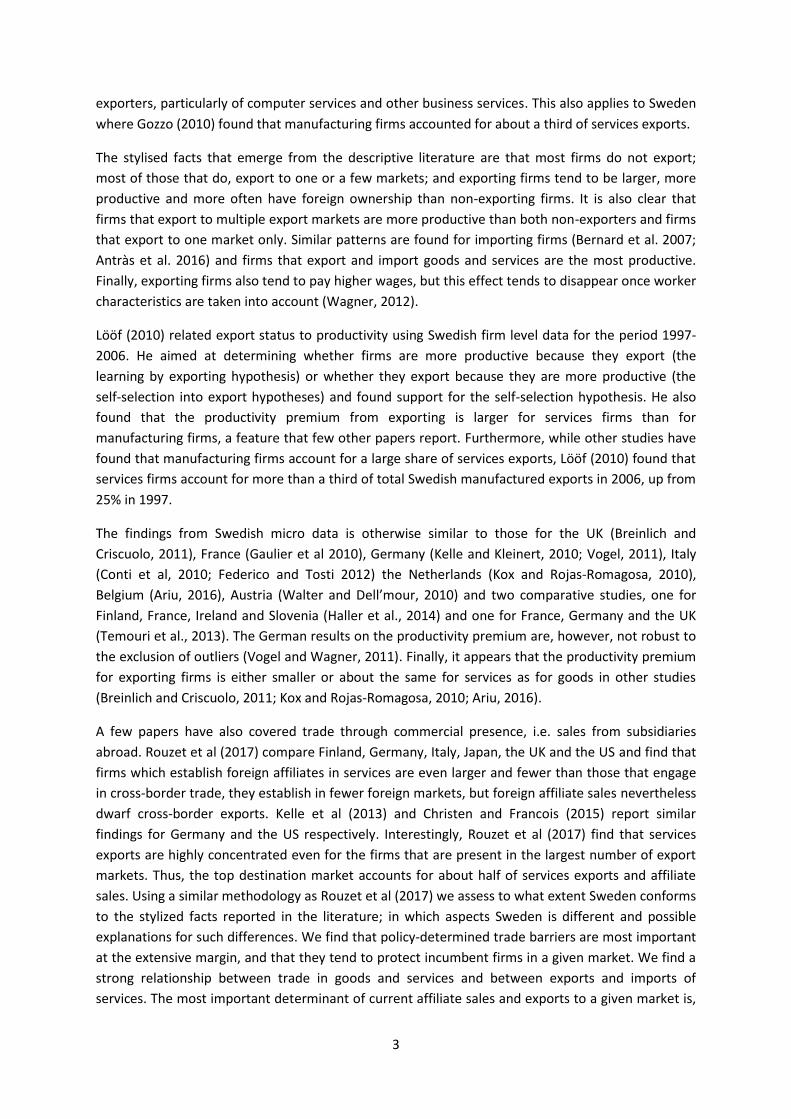
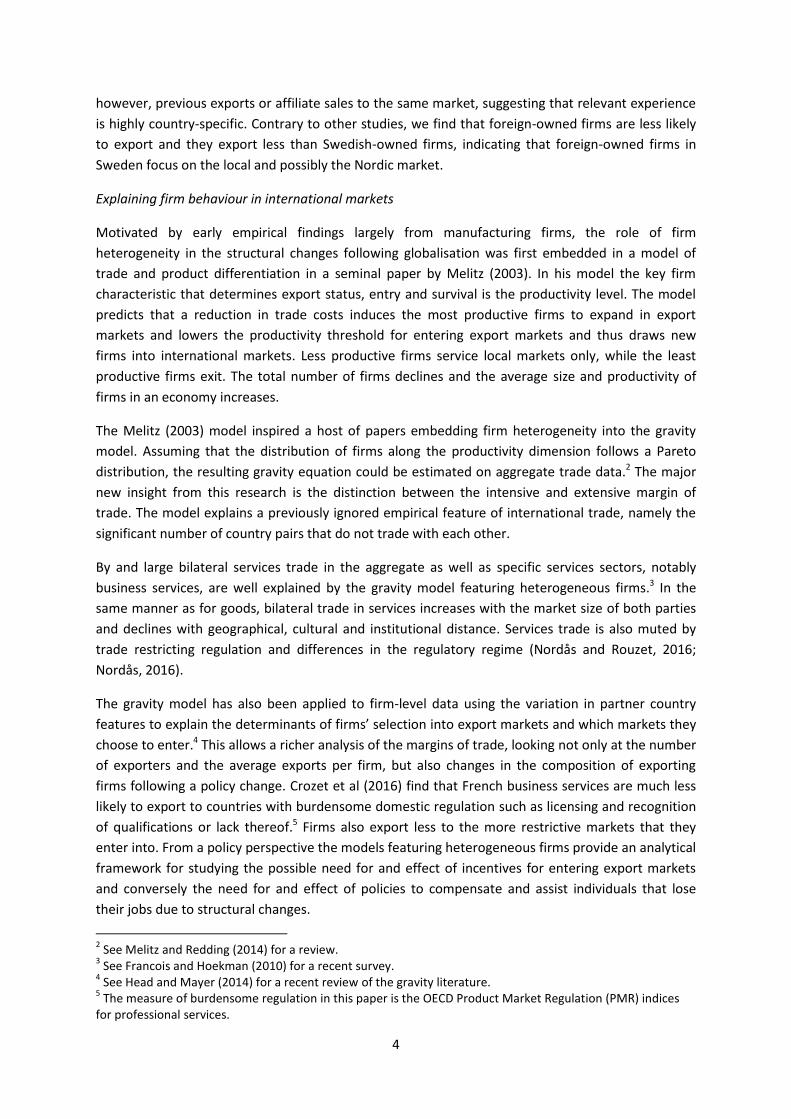
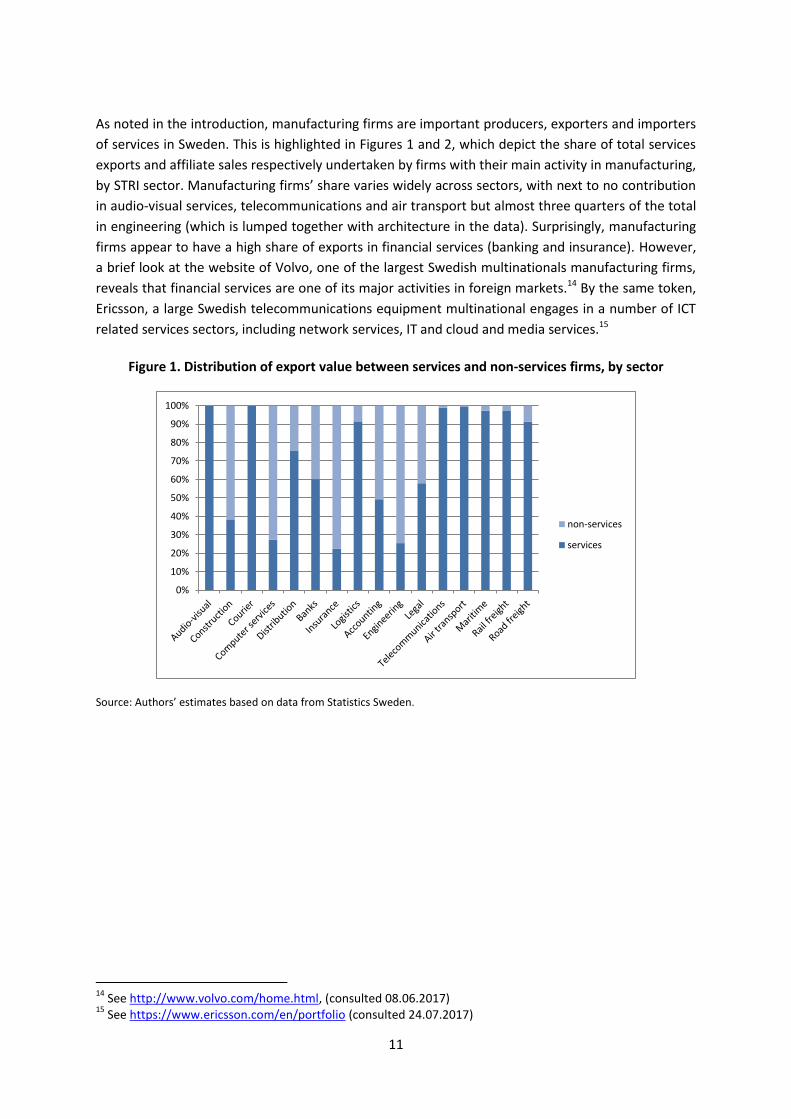
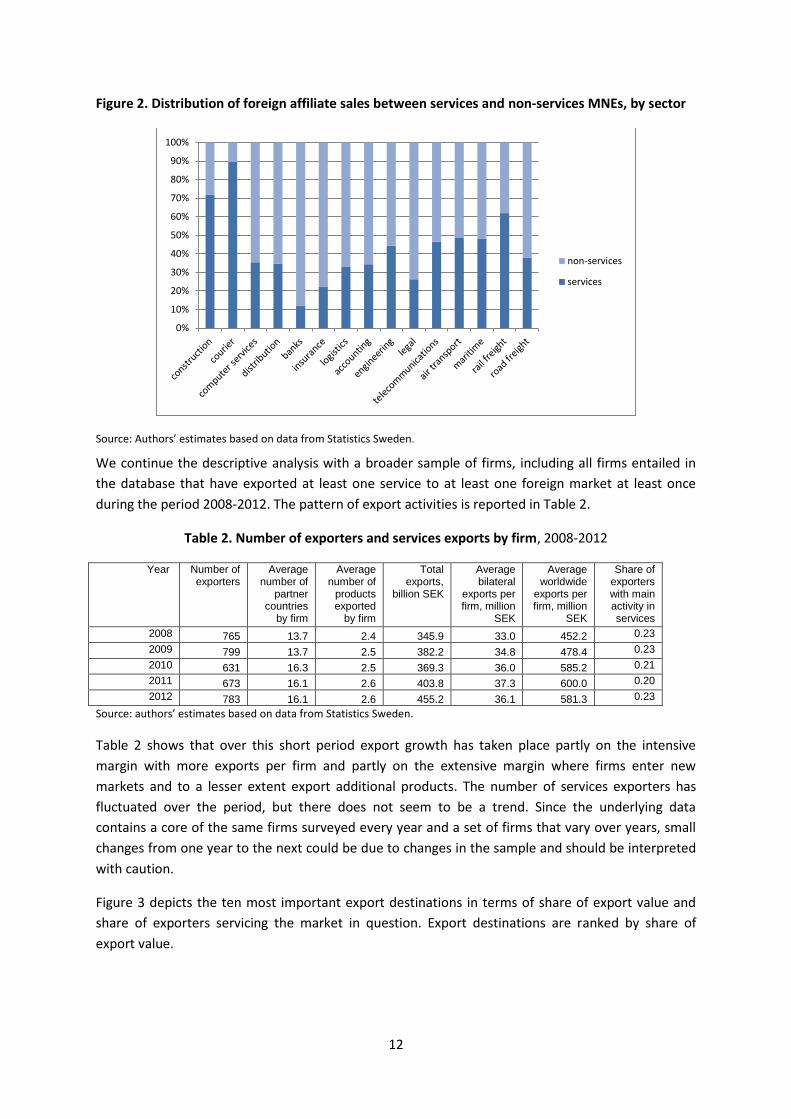
As noted in the introduction, manufacturing firms are important producers, exporters and importers
of services in Sweden. This is highlighted in Figures 1 and 2, which depict the share of total services
exports and affiliate sales respectively undertaken by firms with their main activity in manufacturing,
by STRI sector. Manufacturing firms’ share varies widely across sectors, with next to no contribution
in audio-visual services, telecommunications and air transport but almost three quarters of the total
in engineering (which is lumped together with architecture in the data). Surprisingly, manufacturing
firms appear to have a high share of exports in financial services (banking and insurance). However,
a brief look at the website of Volvo, one of the largest Swedish multinationals manufacturing firms,
reveals that financial services are one of its major activities in foreign markets.14 By the same token,
Ericsson, a large Swedish telecommunications equipment multinational engages in a number of ICT
related services sectors, including network services, IT and cloud and media services.15
Figure 1. Distribution of export value between services and non-services firms, by sector
Source: Authors’ estimates based on data from Statistics Sweden.
14
See http://www.volvo.com/home.html, (consulted 08.06.2017) 15
See https://www.ericsson.com/en/portfolio (consulted 24.07.2017)
0%
10%
20%
30%
40%
50%
60%
70%
80%
90%
100%
non-services
services
12
Figure 2. Distribution of foreign affiliate sales between services and non-services MNEs, by sector
Source: Authors’ estimates based on data from Statistics Sweden.
We continue the descriptive analysis with a broader sample of firms, including all firms entailed in
the database that have exported at least one service to at least one foreign market at least once
during the period 2008-2012. The pattern of export activities is reported in Table 2.
Table 2. Number of exporters and services exports by firm, 2008-2012
Year Number of exporters
Average number of
partner countries
by firm
Average number of
products exported
by firm
Total exports,
billion SEK
Average bilateral
exports per firm, million
SEK
Average worldwide
exports per firm, million
SEK
Share of exporters with main activity in services
2008 765 13.7 2.4 345.9 33.0 452.2 0.23
2009 799 13.7 2.5 382.2 34.8 478.4 0.23
2010 631 16.3 2.5 369.3 36.0 585.2 0.21
2011 673 16.1 2.6 403.8 37.3 600.0 0.20
2012 783 16.1 2.6 455.2 36.1 581.3 0.23
Source: authors’ estimates based on data from Statistics Sweden.
Table 2 shows that over this short period export growth has taken place partly on the intensive
margin with more exports per firm and partly on the extensive margin where firms enter new
markets and to a lesser extent export additional products. The number of services exporters has
fluctuated over the period, but there does not seem to be a trend. Since the underlying data
contains a core of the same firms surveyed every year and a set of firms that vary over years, small
changes from one year to the next could be due to changes in the sample and should be interpreted
with caution.
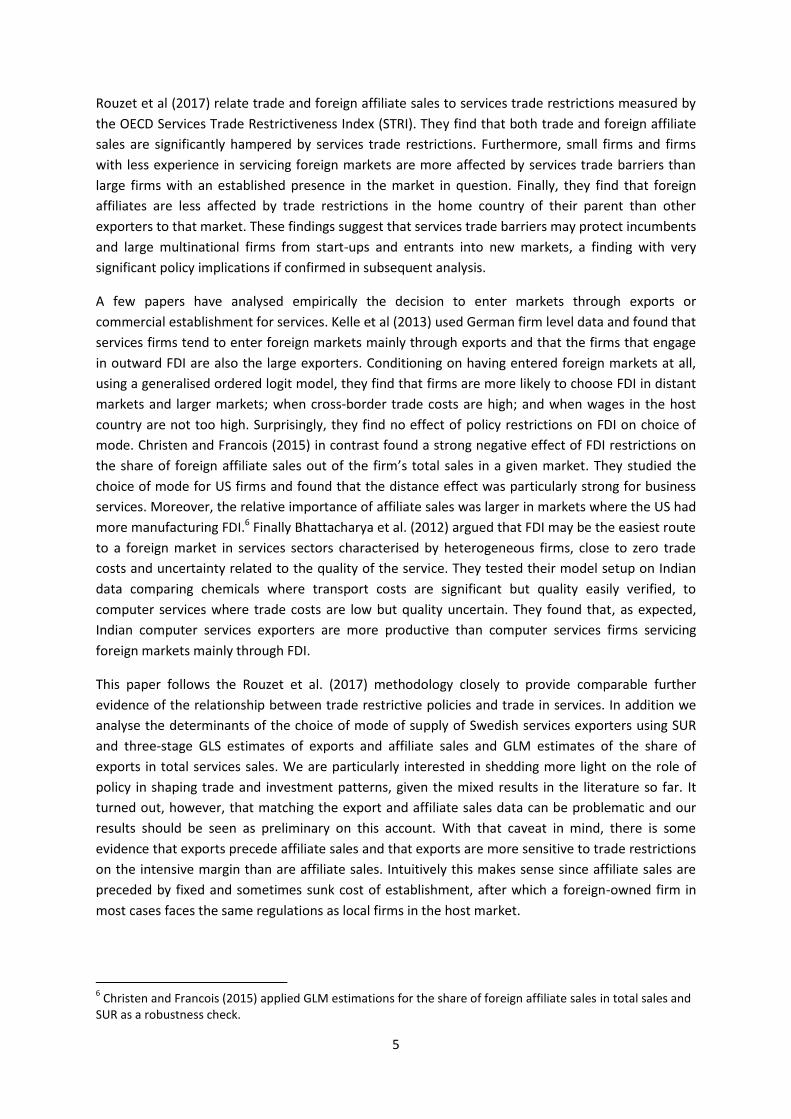
Figure 3 depicts the ten most important export destinations in terms of share of export value and
share of exporters servicing the market in question. Export destinations are ranked by share of
export value.
0%
10%
20%
30%
40%
50%
60%
70%
80%
90%
100%
non-services
services

13
Figure 3. Top ten export markets (export value and number of exporters) 2008-2012
Note: Only the top ten destinations are reported in the Figure. The destination markets are ranked by the share of export
value in total exports over the period considered.
Source: Authors’ estimates based on data from Statistics Sweden.
As one would expect, the large EU markets and the United States are the most important export
destinations measured by export value. Nevertheless, two thirds of all exporting firms are engaged
in exports to one or more of the neighbouring Nordic countries. The Nordics share a common legal
system, common borders and a common market predating the European Union and trade
significantly more services with each other than predicted by the standard gravity model (Nordås,
2017). The high share of exporters to the Nordic countries thus reflects low entry barriers for
Swedish services exporters.
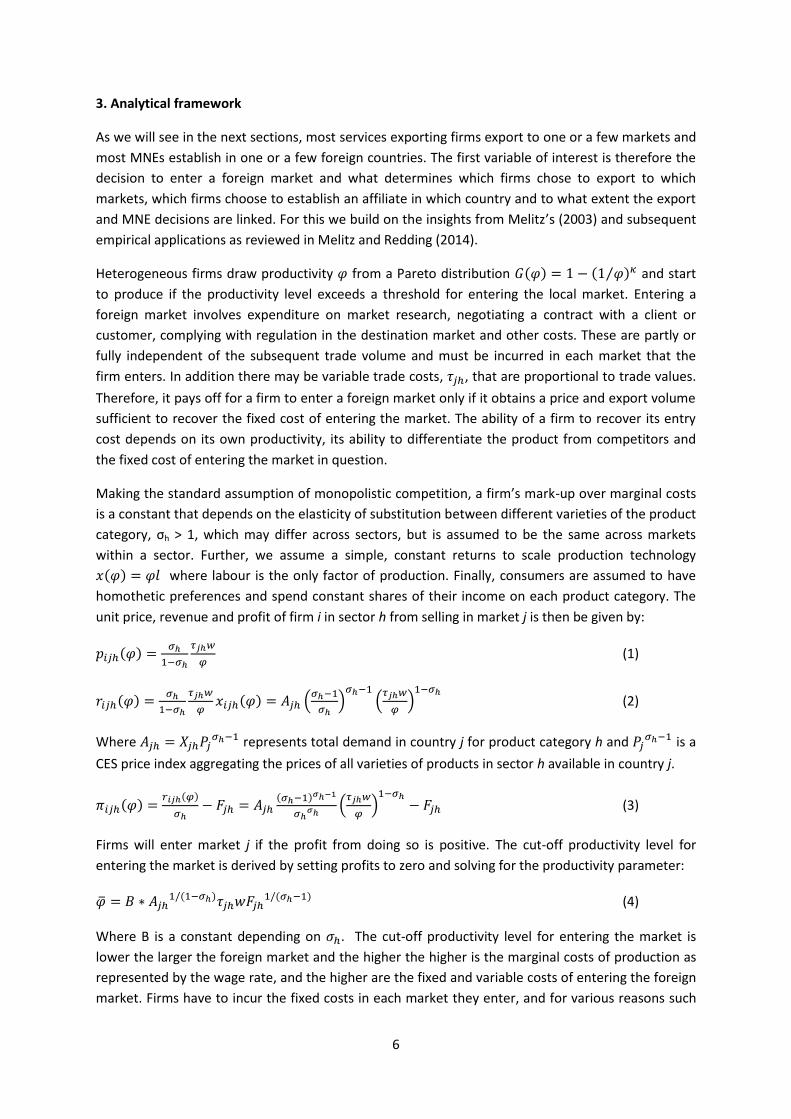
Figure 4. Top ten host countries for affiliate sales (total sale, number of affiliates), 2008-2012
Note: Only the top ten host markets are reported in the Figure. The markets are ranked by the share of turnover in total
turnover over the period considered. Source: Authors’ calculations based on data from Statistics Sweden.
0.00
0.10
0.20
0.30
0.40
0.50
0.60
0.70
0.80
Share of export value Share of exporters
0%
2%
4%
6%
8%
10%
12%
14%
16%
18%
Share of turnover Share of affiliates

14
Figure 4 reports the most important host countries for Swedish affiliates. The share in terms of
turnover exceeds the share in terms of number of affiliates for the largest markets, while the
opposite is true in the smaller markets, with the exception of the UK. The UK is an important host of
foreign affiliates servicing the European Union and beyond, particularly in financial services, which
could be a factor behind this.
Previous studies from other countries have found a high degree of firm heterogeneity as far as
participation in international trade and investment is concerned, which in turn is driven by
heterogeneity as far as firm characteristics such as size and productivity are concerned. In the next
charts and tables we describe different dimensions of firm heterogeneity related to activities in
foreign markets. Figure 5 reports the share of firms that export to a given number of destination
depicted on the horizontal axis, and the share of exports accounted for by firms servicing the given
number of destinations. Panel A shows exports and Panel B affiliate sales.
Figure 5. Concentration of international activity by number of destinations
Panel A. Exports
Panel B. Foreign affiliate activity
Source: Authors’ calculations based on data from Statistics Sweden.
0%
10%
20%
30%
40%
50%
60%
70%
80%
90%
share of firms share of exports
0%
10%
20%
30%
40%
50%
60%
70%
80%
1 2 3 4 5 6 7 8 9 10 11 -15
16 -25
> 25
Share of parent firms Share of affiliate sales
15
Figure 5 reveals both a high degree of concentration and polarisation among services exporters and
multinational enterprises. About 17% of all exporting firms export to only one destination, while 18%
export to more than 25 countries. These in turn account for as much as 85% of total exports, while
those exporting to only one country account for only 1.3% of total services exports. A similar picture
emerges for foreign affiliate sales where the polarisation is even more striking. More than 60% of
parent firms have affiliates in only one country, but these account for only 1% of total affiliate sales.
By contrast only about 1% of parent firms have affiliates in more than 25 countries, but these
account for almost 70% of total affiliate sales. This pattern is found in other countries as well (Rouzet
et al., 2017)
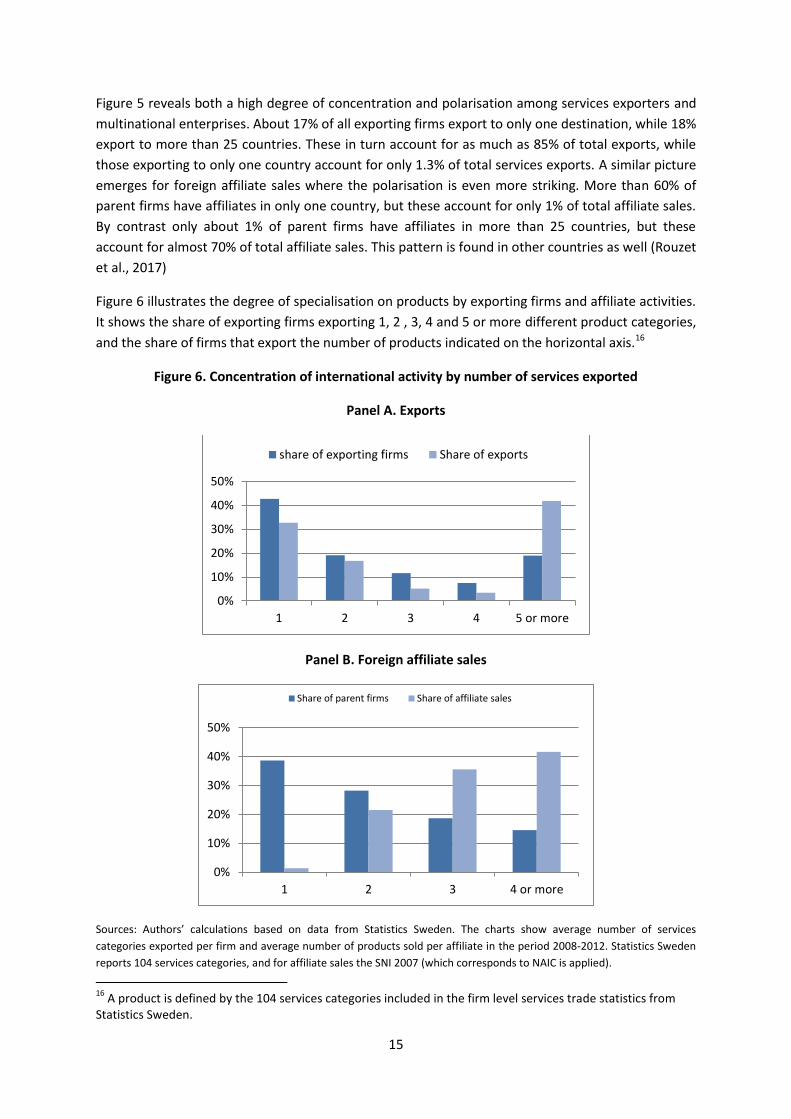
Figure 6 illustrates the degree of specialisation on products by exporting firms and affiliate activities.
It shows the share of exporting firms exporting 1, 2 , 3, 4 and 5 or more different product categories,
and the share of firms that export the number of products indicated on the horizontal axis.16
Figure 6. Concentration of international activity by number of services exported
Panel A. Exports
Panel B. Foreign affiliate sales
Sources: Authors’ calculations based on data from Statistics Sweden. The charts show average number of services
categories exported per firm and average number of products sold per affiliate in the period 2008-2012. Statistics Sweden
reports 104 services categories, and for affiliate sales the SNI 2007 (which corresponds to NAIC is applied).
16
A product is defined by the 104 services categories included in the firm level services trade statistics from Statistics Sweden.
0%
10%
20%
30%
40%
50%
1 2 3 4 5 or more
share of exporting firms Share of exports
0%
10%
20%
30%
40%
50%
1 2 3 4 or more
Share of parent firms Share of affiliate sales

16
It is observed that 42% of exporting firms export one services category only. These exporters
account for about a third of total exports, indicating that Swedish exporting firms are highly
specialised. Only 19% of exporters export more than five services categories, but these account for
more than 40% of total exports. By the same token 38% of all parent firms have affiliate activities in
only one product category, but these account for only 1.3% of total affiliate sales. By contrast about
15% of parent firms have affiliate activities in four or more product categories, but these account for
more than 40% of total affiliate sales.
Comparing Figures 5 and 6 reveals that the large exporters are more diversified both along the
destination market and the product variety dimensions, although single-product exporters also
accounts for a large share of total exports.
Concentration of exports does not only occur across firms, it is also an important feature within
firms as illustrated by Table 3. It shows the market share of the largest export market, the second
largest export market and so on for firms. The first column shows the average for all firms. The
second column shows the share of the largest market for firms that export to one country only,
which is obviously 100%. But firms that export to two countries export as much as 86.7% to one of
these countries. Even firms that export to 20 destinations export more than 60% to the most
important market.
Table 3. Concentration of services exports within firms
By main destination markets, 2008-2012
Export market ranking
Share of market
(all firms)
Share of market
(Num. of destinations
=1)
Share of market
(Num. of destinations
=2)
Share of market
(Num. of destinations
=5)
Share of market
(Num. of destinations
=10)
Share of market
(Num. of destinations
=20)
1 43% 100% 86.7% 62.9% 56.6% 61.5%
2 17% 13.3% 23.8% 18.8% 15.3%
3 10% 13.2% 9.2% 8.8%
4 7% 6.5% 6.8%
5 6% 2.9% 2.8%
Source: Authors’ calculations based on data from Statistics Sweden.
Table 4. Concentration of foreign affiliate activity within firms
By main destination markets, 2008-2012
Export market ranking
Share of market
(all affiliates)
Share of market
(Num. of destinations
=1)
Share of market
(Num. of destinations
=2)
Share of market
(Num. of destinations
=5)
Share of market
(Num. of destinations
≥ 10)
1 38% 100% 90% 64% 49%
2 18% 10% 22% 25%
3 12% 9% 13%
4 8% 3% 5%
5 6% 1% 3%
Source: Authors’ calculations based on data from Statistics Sweden.
Table 4 shows the distribution of affiliate activity among the five largest host markets by firm. Firms
that have affiliates in one country only will necessarily have all its activities in that market. But
similar to the observations for firms’ exports, also foreign affiliate activities within Swedish
multinationals are heavily concentrated in the largest host market. Even multinationals with

17
affiliates in more than ten countries have about half of their affiliate sales in the most important
host country.
6. Determinants of exports and affiliate sales, pooled regressions
Exports
We start by estimating the probability that firms will export to a particular market as expressed in
equation (5). The results are reported in Table 5. The first three columns run the regression on the
full sample of firms in all services sectors as classified by Statistics Sweden (104 sectors), while the
fourth column reports the regression results for the sectors and countries included in the STRI
database, adding the STRI score.
Table 5. Probit regressions, exports
LHS: services export dummy Swedish classification sectors STRI sectors
(1) (2) (3) (4)
Log GDP 0.206*** 0.216*** 0.164*** 0.178***
(0.007) (0.007) (0.006) (0.010)
Log distance -0.195*** -0.207*** -0.171*** -0.263***
(0.064) (0.068) (0.050) (0.07)
Contiguous 0.409*** 0.434*** 0.307*** 0.311***
(0.094) (0.100) (0.074) (0.081)
EEA dummy 0.343*** 0.358*** 0.258*** 0.107
(0.086) (0.091) (0.068) (0.102)
Common language 0.150*** 0.154*** 0.108*** 0.126***
(0.013) (0.014) (0.010) (0.017)
Labour productivity -0.017*** -0.007 -0.006 -0.053***
(0.005) (0.005) (0.004) (0.005)
Log turnover 0.060*** 0.023*** -0.003 0.084***
(0.005) (0.005) (0.004) (0.008)
Main activity in manufacturing -0.001 -0.002 -0.029*** -0.103***
(0.016) (0.017) (0.010) (0.022)
Foreign owned -0.109*** -0.107*** -0.081*** -0.086***
(0.008) (0.008) (0.006) (0.010)
Services importer 0.154*** 0.117*** 0.0766*** 0.144***
(0.018) (0.018) (0.013) (0.022)
Goods exporter 0.536*** 0.537*** 0.164*** 0.418***
(0.036) (0.037) (0.006) (0.038)
Previous exports 0.703*** 0.034
(0.007) (0.027)
Previous exports to same country 2.430***
(0.044)
STRI score -0.300**
(0.147)
Observations 3,196,200 3,196,200 3,196,200 353,798
Pseudo R2 0.267 0.307 0.508 0.105
Note: Pooled probit regressions of probability of exports at firm level from Sweden to all destination countries during the
period 2008-2013. Regressions include time and sector fixed effects. The sectors are the services sectors covered by the
STRI. Robust standard errors clustered on destination country are reported in parentheses. *, ** and *** represent
statistical significance at 10%, 5% and 1% respectively.

18
As expected from the theory expressed in equation (5), the probability to enter a market is higher
the larger is the market, the closer it is to Sweden, and firms are more likely to export to EEA
members than to non-members. These results are robust to specification of the regression and to
the sample size and inclusion of the STRI scores, except that the EEA dummy is no longer statistically
significant when the STRI scores are added.17 Turning to firm characteristics, large firms and firms
that also import services or export goods, are more likely to export services than smaller firms and
firms that do not engage in imports of services or exports of goods. Foreign subsidiaries are less
likely to export than are Swedish-owned firms, suggesting that Sweden may not be an important
export platform for foreign firms e.g. into the EEA. It appears that the single most important
characteristic predicting export in a given year is whether or not the firm exported to the same
country the year before. Interestingly, exports to the same country appears to be driving the general
previous export experience variable, suggesting that relevant export experience is quite country-
specific and consistent with the observation that most firms export to a few destinations, rather
than diversifying across the globe.
The fourth column adds the STRI scores, capturing policy determined trade costs in export markets.
This reduces the sample to about a tenth of the original sample, dropping countries and sectors for
which STRI indicators are not available. We see that more stringent policy-determined trade
restrictions significantly reduce the probability that a Swedish firm exports to the market in
question. The possibility that trade restricting policies may affect firms differently depending on firm
characteristics is explored by introducing interaction terms between the STRI and each of the firm
characteristics included in the regressions. The results are presented in Table 6 where in the interest
of space we report only the coefficient on the STRI, the firm characteristic indicated in the column
heading and the interaction term.
Table 6. Interaction between STRI scores and firm characteristics, probit
Labour productivity
Turnover Foreign owned
Previous exports
Previous exports to same country
Main activity
in manuf.
STRI score -0.272* 0.175 -0.295* -0.492*** -0.365** -0.170
(0.150) (0.281) (0.163) (0.177) (0.143) (0.165)
Firm characteristics -0.061*** 0.105*** -0.083*** 0.590*** 1.961*** -0.006
(0.006) (0.014) (0.032) (0.018) (0.091) (0.049)
STRI*firm character 0.030* -0.087** -0.011 0.303*** 0.790*** -0.397**
(0.016) (0.040) (0.119) (0.068) (0.282) (0.176)
Pseudo R2 0.105 0.105 0.105 0.141 0.345 0.105
Note: Pooled probit regressions of probability of exports at firm level from Sweden to all destination countries during the
period 2008-2013. Regressions include time and sector fixed effects. The sectors are the services sectors covered by the
STRI. Robust standard errors clustered on destination country are reported in parentheses. *, ** and *** represent
statistical significance at 10%, 5% and 1% respectively. Each column reports the coefficients on the STRI score, the firm
characteristic indicated in the column heading and the coefficient on the interaction term.
It is observed that new entrants to a specific market are strongly deterred by trade restrictions,
while incumbents with an established presence in export markets are much less sensitive to policy-
induced trade restrictions. Incumbents in the same country even exhibit a positive association
between the probability to remain in the market and the score on the STRI. A natural interpretation
17
Of the 44 countries included in the STRI database, 25 are EEA members.

19
of this result is that regulatory barriers to entry impose a fixed entry cost on firms. Having absorbed
such costs incumbents are protected from new entrants and may recuperate their entry costs
through continued sales above marginal cost.18 The first column suggests that more productive firms
are less deterred by policy-determined entry barriers than are less productive firms.
Table 7 presents the PPML estimates of equation (7) on pooled services exports at the firm level for
the period 2008-2013.19
Table 7. Pooled PPML regressions, services exports from Sweden
(1) (2) (3) (4) (5) (6)
Log of GDP 0.856*** 0.856*** 0.624*** 0.806*** 0.608*** 0.760***
(0.027) (0.027) (0.020) (0.027) (0.021) (0.037)
Log of distance -0.860*** -0.860*** -0.541*** -0.793*** -0.526*** -0.790***
(0.247) (0.247) (0.180) (0.231) (0.178) (0.149)
Contiguous 0.053 0.053 -0.096 -0.14 -0.185 -0.112
(0.212) (0.211) (0.170) (0.202) (0.177) (0.163)
EEA -0.106 -0.106 -0.302 -0.07 -0.266 -0.145
(0.485) (0.484) (0.378) (0.456) (0.372) (0.316)
Common language 0.647*** 0.646*** 0.386*** 0.739*** 0.431*** 0.671***
(0.053) (0.053) (0.039) (0.053) (0.046) (0.039)
Main activity in manufacturing -0.052 -0.019 -0.18 -0.245* -0.275** -0.791***
(0.15) (0.144) (0.117) (0.143) (0.126) (0.130)
Foreign owned -0.427*** -0.442*** -0.244** -0.462*** -0.252** -0.680***
(0.139) (0.135) (0.118) (0.136) (0.118) (0.145)
Services importer 0.566*** 0.607*** 0.611*** 0.645*** 0.651*** 0.890***
(0.130) (0.129) (0.122) (0.119) (0.112) (0.115)
Labour productivity 0.175*** 0.132** 0.168*** 0.156** 0.178*** 0.332***
(0.061) (0.061) (0.055) (0.062) (0.055) (0.047)
Log of turnover 0.710*** 0.669*** 0.600*** 0.638*** 0.578*** 0.806***
(0.027) (0.032) (0.035) (0.033) (0.035) (0.039)
Previous exports 1.803*** -1.520*** 1.825*** -1.486***
(0.079) (0.096) (0.08) (0.095)
Previous exports to same country 4.726*** 4.643***
(0.145) (0.143)
Goods exporter 1.153*** 0.547*** 1.171***
(0.165) (0.145) (0.197)
STRI score -1.123
(0.833)
Observations 3,196,200 3,196,200 3,196,200 3,196,200 3,196,200 353,798
R-squared 0.079 0.109 0.209 0.139 0.224 0.132
Log likelihood -1926 -1857 -1581 -1836 -1577 -1204
Dispersion 0.000627 0.000584 0.000411 0.00057 0.000408 0.00357
18
See Rouzet and Spinelli (2016) for estimates of mark-ups in the services sectors included in the STRI. 19
The database does not explicitly report zero exports. Since the database contains survey information with a core of firms included every year, it cannot be assumed that the absence of recorded exports to a particular country of a particular product in a given year implies that there is no export. Instead, it is assumed that if a firm is registered with positive exports of at least one product to at least one country in a given year, it does not export the product in question to the countries for which there is no information on positive exports that year. If a firm has not exported a specific product at all during the period covered, the firm is dropped from the regressions for that product.

20
Note: Pooled regressions of exports at firm level from Sweden to all destination countries. Regressions include time and sector fixed
effects. The sectors are the 104 services categories reported by Statistics Sweden. Robust standard errors clustered on destination
country are reported in parentheses. *, ** and *** represent statistical significance at 10%, 5% and 1% respectively.
It is first noted that the standard gravity control variables take the expected sign and magnitude,
although contiguity does not have a significant impact.20 However, recall from the probit results that
firms are more likely to export to neighbouring countries (i.e. Finland and Norway) in the first place.
The only country with which Sweden shares a common official language is Finland. Thus, the result
suggest that Swedish firms export about 90% more to Finland than otherwise predicted due to their
shared common official language.21
Turning to firm characteristics, foreign owned firms tend to export less services than locally owned
companies. It thus appears that foreign services firm affiliates and daughters in Sweden first and
foremost target the Swedish market. As expected from our theoretical framework, firm size
measured by turnover, and labour productivity are positively associated with export value.
Interestingly, services exports go together with services imports and services importers export about
70% more than services firms that do not import services even after controlling for firm size. But the
most important determinant of export value in a given year is whether or not the firm exported the
year before. Compared to first-time exporters, firms with experience from export markets tend to
export five times more on average than firms with no export experience. The experience factor
becomes huge when considering established exporters in a particular destination, and changes the
sign of the general export experience.22 Thus, it appears that experience from entering a foreign
market is quite country-specific and may not reduce the cost of entering another country much. The
final column reports the regression when adding the STRI scores by sector. The standard gravity
variables as well as the firm characteristic variables are robust to this sample as well. The coefficient
on the STRI score is negative, but not statistically significant. This suggests that on average policy
induced trade barriers are more important for the extensive margin of Swedish exports than for the
intensive margin.23 The average may, however, conceal interesting differences in the response to
policy changes by sector and by firm characteristics. As for the probit regressions above, we
introduce interaction terms for the STRI and the main firm characteristics. These are reported in
Table 8. Sectoral differences are analysed in Section 7 below.
20
Sweden shares a common land border only with Finland and Norway. One may argue that the Öresund bridge constitutes a land border to Denmark, but we have chosen to use the CEPII gravity database as is for consistency with other studies. 21
Having a common official language is probably associated with a number of other cultural and institutional commonalities that may matter for services trade. 22
The net effect of export experience in the same country is about 25 times predicted exports of firms with no experience (i.e. the exponential of 4.726-1.520, regression (3)). 23
Regression coefficients and their level of significance are reported at the sample means.
21
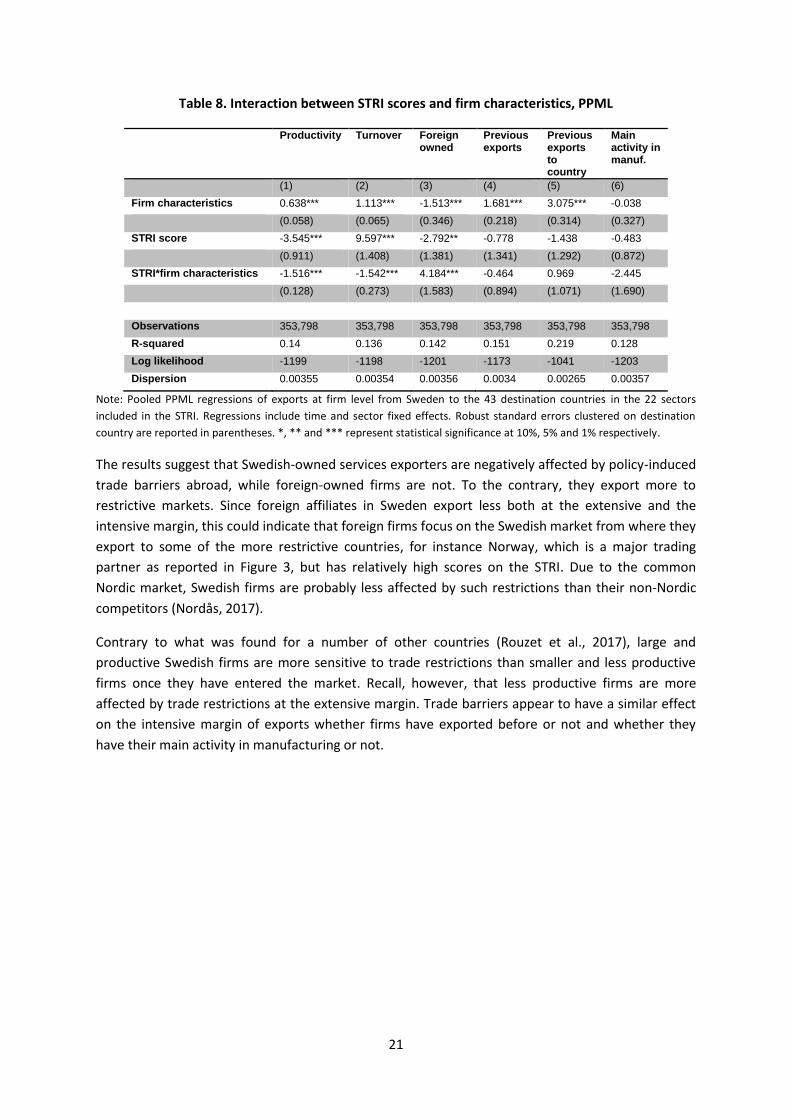
Table 8. Interaction between STRI scores and firm characteristics, PPML
Productivity Turnover Foreign owned
Previous exports
Previous exports to country
Main activity in manuf.
(1) (2) (3) (4) (5) (6)
Firm characteristics 0.638*** 1.113*** -1.513*** 1.681*** 3.075*** -0.038
(0.058) (0.065) (0.346) (0.218) (0.314) (0.327)
STRI score -3.545*** 9.597*** -2.792** -0.778 -1.438 -0.483
(0.911) (1.408) (1.381) (1.341) (1.292) (0.872)
STRI*firm characteristics -1.516*** -1.542*** 4.184*** -0.464 0.969 -2.445
(0.128) (0.273) (1.583) (0.894) (1.071) (1.690)
Observations 353,798 353,798 353,798 353,798 353,798 353,798
R-squared 0.14 0.136 0.142 0.151 0.219 0.128
Log likelihood -1199 -1198 -1201 -1173 -1041 -1203
Dispersion 0.00355 0.00354 0.00356 0.0034 0.00265 0.00357
Note: Pooled PPML regressions of exports at firm level from Sweden to the 43 destination countries in the 22 sectors
included in the STRI. Regressions include time and sector fixed effects. Robust standard errors clustered on destination
country are reported in parentheses. *, ** and *** represent statistical significance at 10%, 5% and 1% respectively.
The results suggest that Swedish-owned services exporters are negatively affected by policy-induced
trade barriers abroad, while foreign-owned firms are not. To the contrary, they export more to
restrictive markets. Since foreign affiliates in Sweden export less both at the extensive and the
intensive margin, this could indicate that foreign firms focus on the Swedish market from where they
export to some of the more restrictive countries, for instance Norway, which is a major trading
partner as reported in Figure 3, but has relatively high scores on the STRI. Due to the common
Nordic market, Swedish firms are probably less affected by such restrictions than their non-Nordic
competitors (Nordås, 2017).
Contrary to what was found for a number of other countries (Rouzet et al., 2017), large and
productive Swedish firms are more sensitive to trade restrictions than smaller and less productive
firms once they have entered the market. Recall, however, that less productive firms are more
affected by trade restrictions at the extensive margin. Trade barriers appear to have a similar effect
on the intensive margin of exports whether firms have exported before or not and whether they
have their main activity in manufacturing or not.

22
Affiliate sales
This section reports the regression results of estimating equations (5) and (7) on affiliate sales data.
Table 9 reports results of the probit regressions.
Table 9. Probit, affiliate sales
(1) (2) (3)
log GDP 0.0429 0.0428 0.0483
(0.030) (0.030) (0.030)
log distance 0.0376 0.037 0.0266
(0.076) (0.076) (0.073)
Contiguous 0.383***
0.377***
0.377***
(0.098) (0.097) (0.096)
EEA 0.176 0.173 0.159
(0.154) (0.155) (0.149)
Common language -0.140***
-0.136***
-0.112***
(0.029) (0.029) (0.031)
Main activity in manufacturing -0.0424 -0.0396 -0.0871
(0.077) (0.078) (0.077)
Foreign owned -1.324***
-1.321***
-0.602
(0.448) (0.449) (0.446)
Services importer 0.00769 0.0077 -0.0022
(0.150) (0.149) (0.150)
Goods exporter 0.263** 0.270
** 0.214
*
(0.125) (0.126) (0.126)
Labour productivity, head office -0.109***
-0.108***
-0.135***
(0.024) (0.024) (0.028)
Previous FATS 0.756 0.725
(0.544) (0.747)
Previous FATS to country 1.297***
(0.113)
Observations 6117 6117 6117
Pseudo R2 0.189 0.190 0.254
Note: Pooled probit regressions of probability of affiliate sales at firm level from Sweden in all host countries. Regressions
include time and sector fixed effects. Robust standard errors clustered on destination country are reported in parentheses.
*, ** and *** represent statistical significance at 10%, 5% and 1% respectively.
The standard gravity variables appear to have little effect on the probability of Swedish affiliate sales
in a host market in a particular sector. The exceptions are contiguity where countries with a common
border with Sweden (Norway and Finland) are more likely to host Swedish affiliates. Turning to firm
characteristics, as was the case for exports, foreign owned firms based in Sweden are less likely to
engage in activities abroad. Goods exporters are weakly more likely to sell services from affiliates
abroad, and labour productivity at the Swedish head office is negatively associated with the
probability of foreign affiliate sales. Interestingly, previous affiliate sales do not matter unless it is in
the same country.

23
The PPML regressions for affiliate sales are reported in Table 10. The last column shows the results
of adding the STRI score. This significantly reduces the sample size, and the estimates must be
interpreted with great caution for this regression.24
Table 10. Pooled PPML regressions, sales by Swedish foreign affiliates in host markets
(1) (2) (3) (4)
Log GDP 0.608*** 0.609*** 0.612*** 0.463***
(0.046) (0.046) (0.046) (0.176)
Log distance -0.124 -0.126 -0.114 0.162
(0.090) (0.091) (0.090) (0.166)
Contiguity 0.303** 0.299** 0.319** -0.307
(0.152) (0.150) (0.153) (0.218)
EEA 0.065 0.068 0.094 0.069
(0.188) (0.188) (0.187) (0.359)
Common language 0.218** 0.216** 0.200** 0.301***
(0.098) (0.099) (0.097) (0.107)
Labour productivity, head office -0.062** -0.063** -0.094***
(0.025) (0.025) (0.026)
Labour productivity, affiliate 0.271*** 0.272*** 0.285*** 0.127***
(0.053) (0.053) (0.057) (0.027)
Main activity in manufacturing 0.290*** 0.294*** 0.330*** -0.370***
(0.110) (0.111) (0.114) (0.161)
Foreign owned -2.361*** -2.360*** -1.854*** -4.051***
(0.335) (0.335) (0.327) (0.402)
Services importer 0.208 0.208 0.221 1.368***
(0.172) (0.174) (0.156) (0.179)
Goods exporter 0.335** 0.334** 0.265* 1.095***
(0.141) (0.141) (0.148) (0.269)
Previous FATS -0.389 -0.641
(0.539) (0.564)
Previous FATS to country 0.633***
(0.048)
STRI score 2.794**
(1.195)
Observations 6,589 6,589 6,589 1,914
R-squared 0.341 0.342 0.369 0.139
Log likelihood -961058 -960192 -932421 -395887
Dispersion 290.7 290.4 281.9 414.7
Note: Pooled regressions of affiliate sales at firm level of foreign affiliates of Swedish firms in all host countries.
Regressions include time and sector fixed effects. The sectors are four digit SNI categories, except for in Col (8) where STRI
sectors are used. Robust standard errors clustered on destination country are reported in parentheses. *, ** and ***
represent statistical significance at 10%, 5% and 1% respectively.
The patterns of foreign affiliate sales fit a standard gravity model reasonably well with the expected
sign on the standard controls. Comparing to the regressions for exports, there is a notable
difference. While contiguity is not relevant for exports, which fall off relatively sharply with distance,
the opposite is observed for affiliate sales. Thus, affiliate sales in neighbouring countries (Finland and
24
The small sample size and difficulties of establishing the zero flows also prevented us from running probit regressions for affiliate sales for the sectors and countries covered by the STRI.

24
Norway) is about 35% higher than predicted everything else equal, but beyond the neighbours
distance does not matter. Companies with their main activity in manufacturing have about 35%
more affiliate sales than services firms on average and foreign owned firms established in Sweden
sell much less through affiliates outside Sweden. As for exporters, they tend to focus on the Swedish
market.
Labour productivity in the affiliates is consistently associated with more affiliate sales, while foreign
affiliate sales are consistently negatively associated with labour productivity in the Swedish
headquarters of the firm. More analysis is needed to establish the reason for this, but the result is
consistent with Swedish headquarters specialised in servicing the affiliates that are in turn
specialised in production for the host market. In such cases the headquarters would have low
turnover per worker in Sweden, which may also explain the negative coefficient in the probit
estimates reported in Table 9.25 Finally, previous affiliate sales to same country, but not affiliate sales
experience in general, matters for current affiliate sales.
7. Determinants of exports at sector level
This section explores sectoral differences in the determinants of services exports. The analysis is
limited to the PPML regressions for exports in selected sectors for which the number of observations
is sufficient for meaningful analysis. We are left with five sectors covered by the STRI database:
computer services, distribution services, telecommunications, accounting, and engineering. The
results are reported in Table 11.
The patterns for the aggregate services sectors are by and large repeated for individual sectors,
although sectors differ in their sensitivity to distance, language and being part of the EEA. Perhaps
surprisingly, the sector most sensitive to distance is telecommunications, for which trade costs
probably do not vary much with distance. Nevertheless, communications over telecommunications
networks connect people and firms, and the frequency of communications between them probably
falls off quite sharply with distance. Turning to firm characteristics, large firms export more in all
sectors, with a particularly strong scale effect in computer services, distribution services and
telecommunications. Foreign owned firms export less, except in engineering where they export
more. Previous exports to the same country are one of the strongest predictors for current export
values in all sectors, with the strongest effect in telecommunications. Being a services importer
strongly boosts services exports particularly in telecommunications, accounting and engineering,
while exports of goods are positively associated with exports of service in all sectors except
accounting. It is particularly strong in engineering.
25
Labour productivity is measured as turnover per worker in the FATS regressions.

25
Table 11. PPML regressions, exports by sector
Computer services
Distribution services Telecommunications
Log GDP 0.811*** 0.806*** 0.718*** 0.759*** 0.733*** 0.663*** 0.718*** 0.717*** 0.669***
(0.075) (0.079) (0.075) (0.059) (0.057) (0.058) (0.099) (0.100) (0.091)
Log distance -0.329** -0.285 -0.22 -0.612*** -0.531*** -0.350*** -1.408*** -1.420*** -1.254***
(0.168) (0.178) (0.141) (0.143) (0.146) (0.129) (0.248) (0.273) (0.222)
Contiguity 0.281 0.459 0.137 -0.796*** -0.374 -0.737*** 0.699* 0.644 0.622*
(0.223) (0.332) (0.189) (0.216) (0.258) (0.219) (0.385) (0.681) (0.377)
EEA -0.36 0.297 -0.541** 0.410* 1.145** 0.413** -0.55 -0.654 -0.542
(0.290) (1.146) (0.231) (0.244) (0.506) (0.208) (0.436) (1.115) (0.411)
Common 0.662*** 0.669*** 0.485*** 0.076 -0.012 -0.179*** -0.105 -0.08 -0.116
language (0.070) (0.071) (0.070) (0.048) (0.064) (0.058) (0.194) (0.316) (0.188)
STRI score -0.543 -0.126 0.316 0.009 0.574 -0.429 -2.85 -2.949 -2.719
(1.175) (1.305) (2.408) (1.301) (1.211) (1.469) (2.112) (2.458) (1.736)
Log turnover 1.183*** 1.183*** 0.954*** 1.007*** 1.007*** 0.970*** 1.204*** 1.204*** 0.827***
(0.117) (0.117) (0.122) (0.076) (0.076) (0.107) (0.168) (0.168) (0.106)
Main activity in 0.481*** 0.480*** 0.073 -1.629*** -1.631*** -1.473*** -4.681*** -4.681*** -3.655***
manufacturing (0.170) (0.170) (0.126) (0.223) (0.223) (0.228) (0.540) (0.540) (0.534)
Foreign owned -1.313*** -1.313*** -1.121*** -1.033*** -1.034*** -0.889*** 0.086 0.086 -0.306**
(0.253) (0.253) (0.226) (0.175) (0.175) (0.199) (0.164) (0.164) (0.143)
Services 0.716** 0.718** 0.228 0.859*** 0.860*** 0.798*** 2.812*** 2.812*** 2.850***
importer (0.320) (0.321) (0.291) (0.192) (0.191) (0.232) (0.673) (0.673) (0.590)
Goods exporter 0.603*** 0.605*** -0.481*** 1.611*** 1.615*** 0.979*** 0.765*** 0.764*** 0.549***
(0.165) (0.165) (0.164) (0.212) (0.213) (0.204) (0.184) (0.179) (0.169)
STRI score* -2.764 -4.153* 0.46
EEA (4.625) (2.261) (4.695)
Previous exports 3.550*** 2.807*** 4.347***
to country (0.477) (0.366) (0.312)
STRI* previous -0.402 1.129 0.398
exp. to country (2.398) (1.219) (1.155)
Labour -0.448*** -0.448*** -0.312*** -0.140** -0.140** -0.222*** -0.005 -0.004 0.181
productivity -0.054 -0.054 -0.055 -0.064 -0.064 -0.085 -0.143 -0.142 -0.16
Observations 45,704 45,704 45,704 59,229 59,229 59,229 18,275 18,275 18,275
R-squared 0.55 0.541 0.558 0.141 0.146 0.258 0.358 0.359 0.544
Log likelihood -158.4 -158.4 -143 -697.4 -696.7 -586.2 -48.04 -48.04 -42.04
Dispersion 0.003 0.003 0.002 0.013 0.013 0.009 0.002 0.002 0.001
26
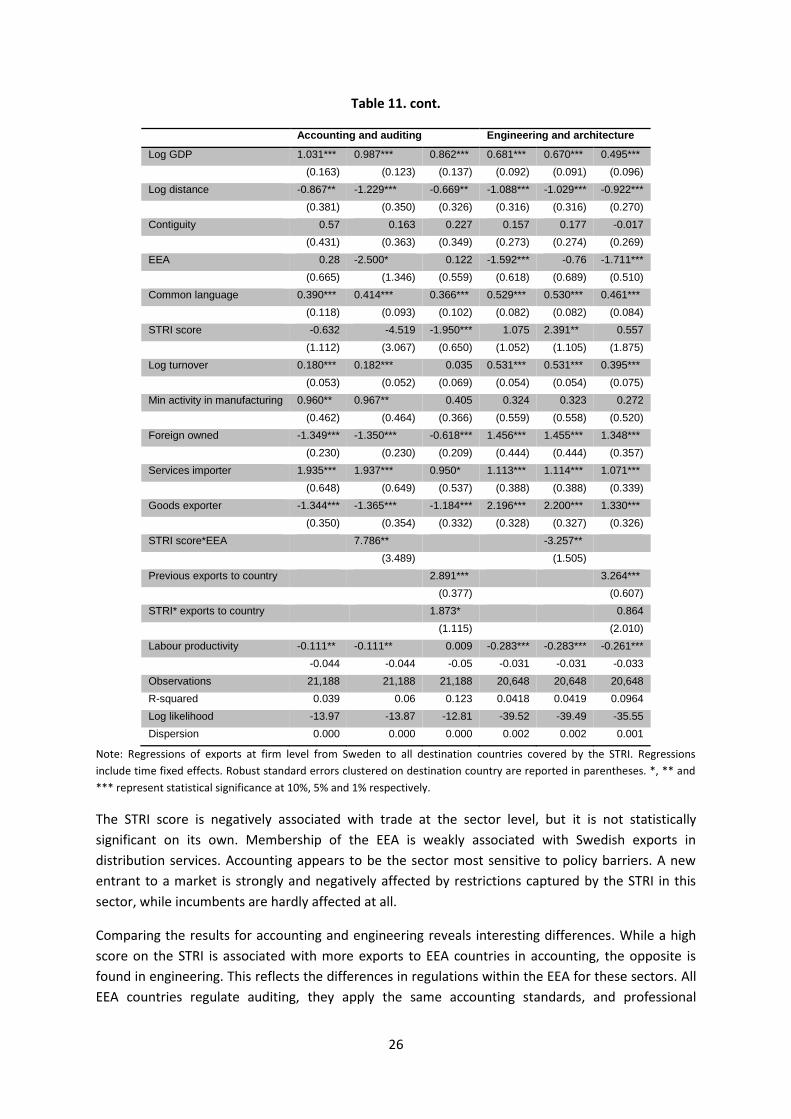
Table 11. cont.
Accounting and auditing Engineering and architecture
Log GDP 1.031*** 0.987*** 0.862*** 0.681*** 0.670*** 0.495***
(0.163) (0.123) (0.137) (0.092) (0.091) (0.096)
Log distance -0.867** -1.229*** -0.669** -1.088*** -1.029*** -0.922***
(0.381) (0.350) (0.326) (0.316) (0.316) (0.270)
Contiguity 0.57 0.163 0.227 0.157 0.177 -0.017
(0.431) (0.363) (0.349) (0.273) (0.274) (0.269)
EEA 0.28 -2.500* 0.122 -1.592*** -0.76 -1.711***
(0.665) (1.346) (0.559) (0.618) (0.689) (0.510)
Common language 0.390*** 0.414*** 0.366*** 0.529*** 0.530*** 0.461***
(0.118) (0.093) (0.102) (0.082) (0.082) (0.084)
STRI score -0.632 -4.519 -1.950*** 1.075 2.391** 0.557
(1.112) (3.067) (0.650) (1.052) (1.105) (1.875)
Log turnover 0.180*** 0.182*** 0.035 0.531*** 0.531*** 0.395***
(0.053) (0.052) (0.069) (0.054) (0.054) (0.075)
Min activity in manufacturing 0.960** 0.967** 0.405 0.324 0.323 0.272
(0.462) (0.464) (0.366) (0.559) (0.558) (0.520)
Foreign owned -1.349*** -1.350*** -0.618*** 1.456*** 1.455*** 1.348***
(0.230) (0.230) (0.209) (0.444) (0.444) (0.357)
Services importer 1.935*** 1.937*** 0.950* 1.113*** 1.114*** 1.071***
(0.648) (0.649) (0.537) (0.388) (0.388) (0.339)
Goods exporter -1.344*** -1.365*** -1.184*** 2.196*** 2.200*** 1.330***
(0.350) (0.354) (0.332) (0.328) (0.327) (0.326)
STRI score*EEA 7.786** -3.257**
(3.489) (1.505)
Previous exports to country 2.891*** 3.264***
(0.377) (0.607)
STRI* exports to country 1.873* 0.864
(1.115) (2.010)
Labour productivity -0.111** -0.111** 0.009 -0.283*** -0.283*** -0.261***
-0.044 -0.044 -0.05 -0.031 -0.031 -0.033
Observations 21,188 21,188 21,188 20,648 20,648 20,648
R-squared 0.039 0.06 0.123 0.0418 0.0419 0.0964
Log likelihood -13.97 -13.87 -12.81 -39.52 -39.49 -35.55
Dispersion 0.000 0.000 0.000 0.002 0.002 0.001
Note: Regressions of exports at firm level from Sweden to all destination countries covered by the STRI. Regressions
include time fixed effects. Robust standard errors clustered on destination country are reported in parentheses. *, ** and
*** represent statistical significance at 10%, 5% and 1% respectively.
The STRI score is negatively associated with trade at the sector level, but it is not statistically
significant on its own. Membership of the EEA is weakly associated with Swedish exports in
distribution services. Accounting appears to be the sector most sensitive to policy barriers. A new
entrant to a market is strongly and negatively affected by restrictions captured by the STRI in this
sector, while incumbents are hardly affected at all.
Comparing the results for accounting and engineering reveals interesting differences. While a high
score on the STRI is associated with more exports to EEA countries in accounting, the opposite is
found in engineering. This reflects the differences in regulations within the EEA for these sectors. All
EEA countries regulate auditing, they apply the same accounting standards, and professional

27
qualifications are recognised across the EEA, creating an integrated market. Engineering (and
architecture) in contrast is not regulated in Sweden, but falls under the regulated professions
category in many other EEA countries. The mutual recognition directive also applies to engineering
and architecture, but the lack of a common approach to regulation creates a more fragmented
market for such services within the EEA, which may raise the cost of doing business for engineers
from a country where engineers do not need a license wishing to provide services in countries where
they do. It is also noted that engineering is strongly related to manufacturing as can be seen in
Figures 1 and 2, which may explain the strong relationship between goods and services exports in
this sector. Using the coefficient in the third regression (1.330), exporters of goods export 275%
more engineering services than services only firms.
8. Determinants of choices of mode
In many cases services can be sold in foreign markets through exports or through commercial
establishment in the targeted market. For some services the modes of supply may be
complementary, particularly when face to face interaction is necessary for the final delivery of
services. For other services, for instance those that can be fully digitised, cross-border trade and
foreign affiliate sales may be substitutes. Following Kelle et al. (2013) we estimate equation (12),
which introduces export experience in the FATS probit regressions. The results are reported in Table
12.
Interestingly, export experience is more important than FATS experience for the decision to enter a
market. But when experience is narrowed down to the same country, FATS experience is what
counts. Since establishing an affiliate involves significant fixed and sometimes sunk costs and some
of these relate to compliance with country-specific regulation, this result is quite intuitive. The
results also suggest that firms tend to enter international services markets through exports before
they establish affiliates abroad, similar to the results that Kelle et al (2013) found for Germany.

28
Table 12. Probit affiliate sales, with export experience
(1) (2) (3) (4)
log GDP 0.0483 0.0483 0.0442 0.0419
(0.030) (0.030) (0.029) (0.030)
log distance 0.0289 0.0283 0.0298 0.038
(0.075) (0.075) (0.074) (0.072)
Contiguous 0.400***
0.397***
0.401***
0.351***
(0.100) (0.099) (0.099) (0.092)
EEA 0.16 0.158 0.146 0.177
(0.152) (0.152) (0.150) (0.148)
Common language -0.138***
-0.137***
-0.136***
-0.104***
(0.029) (0.029) (0.029) (0.032)
Main activity in manufacturing -0.0785 -0.0751 -0.07 -0.062
(0.076) (0.076) (0.077) (0.079)
Foreign subsidiary -0.911** -0.910
** -0.866
* -0.817
*
(0.452) (0.453) (0.448) (0.437)
Services importer -0.0043 -0.0043 -0.0146 0.0155
(0.147) (0.146) (0.149) (0.154)
Goods exporter 0.241* 0.248
** 0.201 0.198
(0.124) (0.124) (0.124) (0.130)
Labour productivity, head office -0.125***
-0.124***
-0.124***
-0.117***
(0.026) (0.027) (0.027) (0.028)
Previous exports 0.562***
0.559***
0.341***
-0.926***
(0.073) (0.073) (0.110) (0.167)
Previous FATS 0.673 1.365
(0.585) (0.957)
Previous exports to country 0.365***
-0.104
(0.139) (0.209)
Previous FATS to country 2.052***
(0.203)
Observations 6117 6117 6117 6117
Pseudo R2 0.204 0.205 0.207 0.269
To further explore the relationship between the modes of supply, we estimated equation (13)
entering previous export experience into the gravity regression for affiliate sales. The results are
reported in Table 13.
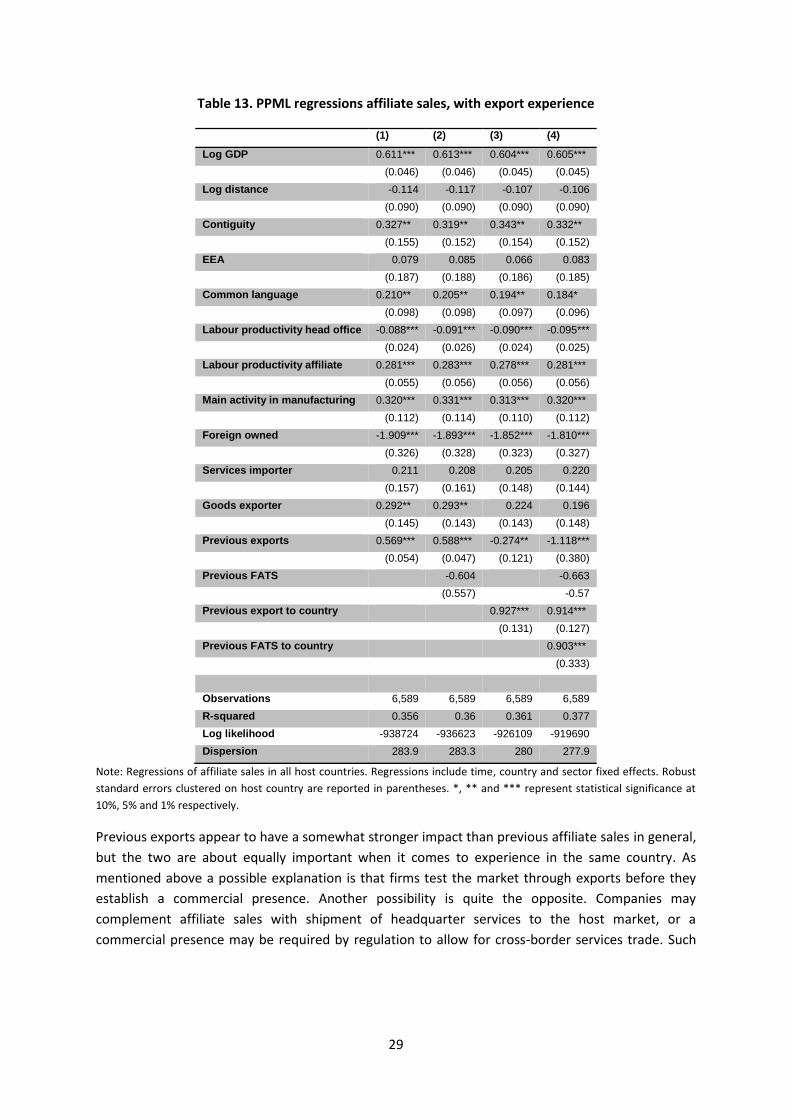
29
Table 13. PPML regressions affiliate sales, with export experience
(1) (2) (3) (4)
Log GDP 0.611*** 0.613*** 0.604*** 0.605***
(0.046) (0.046) (0.045) (0.045)
Log distance -0.114 -0.117 -0.107 -0.106
(0.090) (0.090) (0.090) (0.090)
Contiguity 0.327** 0.319** 0.343** 0.332**
(0.155) (0.152) (0.154) (0.152)
EEA 0.079 0.085 0.066 0.083
(0.187) (0.188) (0.186) (0.185)
Common language 0.210** 0.205** 0.194** 0.184*
(0.098) (0.098) (0.097) (0.096)
Labour productivity head office -0.088*** -0.091*** -0.090*** -0.095***
(0.024) (0.026) (0.024) (0.025)
Labour productivity affiliate 0.281*** 0.283*** 0.278*** 0.281***
(0.055) (0.056) (0.056) (0.056)
Main activity in manufacturing 0.320*** 0.331*** 0.313*** 0.320***
(0.112) (0.114) (0.110) (0.112)
Foreign owned -1.909*** -1.893*** -1.852*** -1.810***
(0.326) (0.328) (0.323) (0.327)
Services importer 0.211 0.208 0.205 0.220
(0.157) (0.161) (0.148) (0.144)
Goods exporter 0.292** 0.293** 0.224 0.196
(0.145) (0.143) (0.143) (0.148)
Previous exports 0.569*** 0.588*** -0.274** -1.118***
(0.054) (0.047) (0.121) (0.380)
Previous FATS -0.604 -0.663
(0.557) -0.57
Previous export to country 0.927*** 0.914***
(0.131) (0.127)
Previous FATS to country 0.903***
(0.333)
Observations 6,589 6,589 6,589 6,589
R-squared 0.356 0.36 0.361 0.377
Log likelihood -938724 -936623 -926109 -919690
Dispersion 283.9 283.3 280 277.9
Note: Regressions of affiliate sales in all host countries. Regressions include time, country and sector fixed effects. Robust
standard errors clustered on host country are reported in parentheses. *, ** and *** represent statistical significance at
10%, 5% and 1% respectively.
Previous exports appear to have a somewhat stronger impact than previous affiliate sales in general,
but the two are about equally important when it comes to experience in the same country. As
mentioned above a possible explanation is that firms test the market through exports before they
establish a commercial presence. Another possibility is quite the opposite. Companies may
complement affiliate sales with shipment of headquarter services to the host market, or a
commercial presence may be required by regulation to allow for cross-border services trade. Such

30
regulation is common in financial services, and implicitly also in regulated professional services for
which a license is required to enter the market.26
Finally, we ran simultaneous regressions for services exports and affiliate sales at the firm level,
using both seeming unrelated regressions (SUR) and three stage GLS regressions. The results are
reported in Table 14 which also depicts the results of a GLM regression where the dependent
variable is the share of exports in total foreign sales (i.e. exports plus affiliate sales).
Table 14. Simultaneous regressions, exports and affiliate sales
SUR 3 stage GLS GLM export share
Exports Full sample STRI sample Full sample STRI sample STRI sample
Log FATS 0.150*** 0.048*** -0.066*** -0.027
(0.011) (0.014) (0.022) (0.027)
log GDP 0.238*** 0.366*** 0.359*** 0.403*** 0.557
(0.018) (0.028) (0.022) (0.031) (0.649)
Log distance -0.065** -0.015 -0.009 0.019 6.701
(0.026) (0.040) (0.026) (0.040) (8.676)
Contiguity 0.192* 0.459*** 0.308** 0.516*** 20.114
(0.111) (0.149) (0.113) (0.150) (25.668)
Common language -0.080 -0.323 -0.122 -0.356** 0.939
(0.147) (0.193) (0.148) (0.193) (1.261)
Log labour productivity 0.129*** 0.327*** 0.005 0.249*** 0.255***
(0.017) (0.030) (0.014) (0.027) (0.050)
Log turnover 0.101*** 0.167*** 0.071*** 0.099*** 0.086***
(0.011) (0.017) (0.009) (0.015) (0.021)
Main activity in manufacturing -0.540*** -1.307*** -0.994*** -1.565*** -0.991***
(0.054) (0.073) (0.049) (0.070) (0.111)
Foreign owned -0.697 -0.658 1.607** 1.074 -2.274***
(0.957) (1.061) (0.724) (0.920) (0.648)
Services importer -0.122 -0.155 -0.538*** -0.288** 0.904***
(0.122) (0.154) (0.093) (0.133) (0.180)
Goods exporter -0.138*** -0.008 -0.316*** -0.214*** -0.561***
(0.056) (0.077) (0.045) (0.071) (0.092)
STRI score -3.376*** -3.355*** -1.508**
(0.321) (0.323) (0.731)
26
See the STRI database at http://oe.cd/stri

31
FATS SUR 3 stage GLS
Full sample STRI sample
Full sample
STRI sample
Log exports 0.085*** 0.007 -0.483*** -0.353***
(0.005) (0.008) (0.053) (0.032)
Log GDP 0.559*** 0.573*** 0.759*** 0.730***
(0.011) (0.020) (0.023) (0.026)
Log distance 0.084*** 0.075** -0.004 0.007
(0.017) (0.028) (0.023) (0.033)
Contiguity 0.728*** 0.717*** 0.915*** 0.916***
(0.075) (0.106) (0.097) (0.121)
Common language -0.126 -0.151 -0.146 -0.238
(0.099) (0.138) (0.127) (0.156)
Log labour productivity 0.604*** 0.638*** 0.588*** 0.637***
(0.009) (0.012) (0.011) (0.014)
STRI score 1.724*** 0.338
(0.232) (0.287)
Observations 15,696 8,048 15,696 8,048 39,662
R2
exports 0.049 0.116 0.021 0.104
R2 FATS 0.348 0.333 -0.073 0.148
Chi2 exports 931.81 1059.19 1192.88 1141.56
Chi2 FATS 8532.52 4022.67 5133.21 3267.04
Note: Standard errors are reported in parentheses. *, ** and *** represent statistical significance at 10%, 5% and 1%
respectively.
The results of these regressions are preliminary and should be interpreted with caution as it turned
out to be quite difficult to match exports and affiliate sales data. It is not possible to establish firmly
whether exports and affiliate sales are substitutes or complements as the SUR regressions suggest
they may be complements and the three stage GLS indicate that they may be substitutes. It appears,
however, that the STRI score negatively affect exports, but stimulates FATS at the intensive margin,
and shift total foreign sales towards affiliate sales.
9. Concluding remarks
Swedish services exporters and affiliates follow a similar pattern as reported in recent studies
portraying trading firms in other countries, but differ from the general findings in three important
ways. First, foreign ownership is negatively associated with exports and affiliate sales, suggesting
that Sweden is not an important export platform destination, with the possible exception of exports
to other Nordic countries. Second, services exports are more strongly related to manufacturing than
in most other countries, and affiliate sales even more so. This is probably related to the
servicification of manufacturing reported in several Swedish studies, combined with a number of
long-established global manufacturing firms headquartered in Sweden. This relationship is
particularly strong for engineering and computer services. Third, it appears that Swedish SMEs are
strongly engaged in international trade and not much more affected by policy barriers than larger
firms. However, a closer look reveals that SMEs tend to be active mainly in the Nordic countries,
which form a closely integrated market, even within the EEA.
Policy shapes exports and affiliate sales in interesting ways. First, services trade barriers have a
strong negative effect on the extensive margin of trade, deterring firms from entering new markets.

32
By the same token preferential access to markets, notably the European Economic Area strongly and
positively affects the entry of Swedish firms into these markets. Having entered the market,
incumbency is a great advantage for future exports and affiliate sales and incumbent firms are much
less affected by policy-related trade barriers, if at all. In some cases they are even more likely to stay
in the market after having jumped high trade barriers. The advantage of incumbency is country-
specific, indicating that policy-related trade costs are fixed and country-specific such that general
export or affiliate sales experience from one country does not necessarily spur entry into another
country.
References
Antràs, P., T.C. Fort and F. Tintelnot (2016), “The margins of global sourcing: theory and evidence
from U.S. Firms”, Harvard Working Paper,
http://scholar.harvard.edu/antras/publications/types/working-paper
Ariu, A. (2016), “Services versus goods trade: a firm-level comparison”, Review of World Economics,
152(1), pages 19-41.
Bhattacharya, R., I. Patnaik and A. Shah (2012), “Exports versus FDI in Services”, The World Economy,
doi: 10.1111/j.1467-9701.2011.01385.x
Bernard, A.B., J. Bradford Jensen, S.J. Redding and P.K. Schott (2007), “Firms in international trade”,
Journal of Economic Perspectives, 21, 105-130.
Breinlich, H. and C. Criscuolo (2011), “International trade in services: A portrait of importers and
exporters”, Journal of International Economics, Elsevier, vol. 84(2), pages 188-206, July.
Christen E. and Francois, J. (2015), “Modes of supply for US exports of services”, The World
Economy, DOI: 10.1111/twec.12330
Conti, G., A. Lo Turco, and D. Maggioni, (2010), “Exporters in services: New evidence from Italian
firms.” Applied Economics Quarterly, 56(1), 73–98. (Special Issue: The Internationalisation of
Services – Evidence from Micro Data)
Crozet, M., E. Milet and D. Mirza (2016), “The impact of domestic regulations on international trade
in services: Evidence from firm-level data”, Journal of Comparative Economics 44, 585–607
Francois, J. and B. Hoekman (2010), “Services trade and policy”, Journal of Economic Literature, 48(3)
642-692.
Gaulier, G. E. Milet and D. Mirza (2010), “Les firmes Francaises dans le commerce international de
services”, Économie et Statisticque vol. 435-436, p. 125-147.
Gozzo, M. (2010), “Tjänsteexporten – den snabbast växande sektorn i svensk ekonomi”, Slutrapport
från Exportrådet, maj 2010.
Greene, W. (2010), ”Testing Hypotheses about interaction terms in nonlinear models”, Economic
Letters, 107, 291-296.
33
Haller, Stefanie A., Damijan, Jože, Kaitila, Ville, Kostevc, Črt, Maliranta, Mika, Milet, Emmanuel,
Mirza, Daniel and Rojec, Matija (2014), “Trading firms in the services sectors: comparable
evidence from four EU countries”, Review of World Economics, vol. 150(3), pages 471–505.
Hausman, J. (2001), “Mismeasured variables in econometric analysis: problems from the right and
problems from the left”, Journal of Economic Perspectives, 15(4) 57-67.
Head, K., T. Mayer and J. Ries (2010), “The erosion of colonial trade linkages after independence”,
Journal of International Economics, vol. 81(1), pages 1-14.
Head and Mayer (2014), “Gravity equations: workhorse, toolkit and cookbook”, chapter 3 in
Gopinath, G., E. Helpman and K. Rogoff (eds) Handbook of International Economics Volume
4, Amsterdam: Elsevier.
Kelle, Markus and Kleinert, Jörn (2010), “German Firms in Service Trade“, Applied Economics
Quarterly, vol. 56(1), pages 51-71. (Special Issue: The Internationalisation of Services – Evidence
from Micro Data)
Kelle, Markus, Kleinert, Jörn, Raff, Horst and Toubal, Farid (2013), “Cross-border and Foreign Affiliate
Sales of Services: Evidence from German Microdata”, The World Economy, vol. 36(11), pages
1373-1392, November.
Kox, H. L. M. and H. Rojas-Romagosa (2010), “Exports and productivity selection effects for Dutch
firms,” De Economist, 158(3), 295–322
Lodefalk, M. (2013), “Servicification of Manufacturing—Evidence from Sweden”, International
Journal of Economics and Business Research, vol.6(1), pages 87-113.
Lodefalk, M. (2014), “The role of services for manufacturing firm exports”, Review of World
Economics, vol. 150(1), pages 59-82.
Lööf, H. (2010), “Are services different exporters?” Applied Economics Quarterly, 56(1), 99–117.
(Special Issue: The Internationalisation of Services – Evidence from Micro Data)
Melitz, M. J. (2003), “The impact of trade on intra-industry reallocations and aggregate industry
productivity”, Econometrica, 71(6), 1695–1725
Melitz, M.J and S.J. Redding (2014), “Heterogeneous firms and trade”, chapter 1 in Gopinath, G., E.
Helpman and K. Rogoff (eds) Handbook of International Economics Volume 4, Amsterdam:
Elsevier.
Nordås, H.K. and D. Rouzet (2016) “The impact of services trade restrictiveness on trade flows”,
World Economy, doi: 10.1111/twec.12424, available online 27 July 2016.
Nordås, H.K. (2016) “Services trade restrictiveness index: the trade effect of regulatory
heterogeneity”, OECD Trade Policy Paper no 189.
Nordås, H.K. (2017), “What drives trade in services? Lessons from the Nordics”, Örebro University Working Paper no 3/2017.
Rouzet, D. and F. Spinelli (2016), “Services trade restrictiveness, mark-ups and competition”, OECD

34
Trade Policy Paper No. 194.
Rouzet, D., S. Benz and F. Spinelli (2016), “Trading firms and trading costs in services: Firm-level analysis” TAD/TC/WP(2016)19, Paris: OECD.
Temouri, Y., A. Vogel and J. Wagner (2013), “Self-selection into export markets by business services
firms—Evidence from France, Germany and the United Kingdom”, Structural Change and
Economic Dynamics, 25, 146-158.
Vogel, A. (2011), “Exporter performance in the German business services sector”, The Services
Industries Journal, 31(7), 1015–1031
Vogel, A., and J. Wagner (2011), “Robust estimates of exporter productivity premia in German
business services enterprises”, Economic and Business Review, 13, 7-26
Wagner, J. (2012), “International trade and firm performance: a survey of empirical studies since
2006”, Review of World Economics, 148, 235-267.