trading winter spreads - tradementors · his book “winning winter spreads” is ... mr. fiske is...
TRANSCRIPT

Winter SpreadsTrading
By: Neal WeintraubBarrett FiskeLan Turner
Copyright 2007 (c) All rights reserved

Authors:
Neal WeintraubeMail: [email protected]
Mr. Weintraub is an educator, author, public speaker and professional trader. He has written numerousbooks on trading; his most recent “Tricks of the Active Trader.” His book “Winning Winter Spreads” isbased on the course he teaches at the Chicago Mercantile Exchange. Mr. Weintraub is a graduate ofMichigan State University and Ohio State University, and a former Navy Public Affairs Officer with adirect commission.
Barrett FiskeeMail: [email protected]
Mr. Fiske is President of Fiske Walter Capital Management Ltd., which he cofounded in January 2004.From 1991 through July 2001, Mr. Fiske was a trader for the proprietary arbitrage trading firmTransMarketGroup (TMG). During his tenure Mr. Fiske was routinely permitted to carry positions inexcess of $400 million.
When the stock market began its dramatic rise in the late 1990s, Mr. Fiske developed a basis arbitragetrade between the NASDAQ 100 cash market and the Chicago Mercantile Exchanges NASDAQ 100futures contract.
By mid-2001, the electronic execution futures markets had surpassed the trading pits in daily volume,and Mr. Fiske left TransMarketGroup to join Flow Trading, a state-of-the-art mathematical modeling andresearch firm, where he developed their proprietary trading systems still in use today.
Mr. Fiske is a consultant to individual traders and hedge fund traders, as well as to brokerage firms. Heis also a regular special subjects teacher for the member-traders at the Chicago Mercantile Exchange(CME). In November 2003, Mr. Fiske founded American Resource Trading Group in order to coordinatehis consulting work.
Mr. Fiske is a past member of the Mid-America Commodity Exchange and the Chicago Board of Trade.He is currently a corporate member of the Chicago Mercantile Exchange.
Lan TurnereMail: [email protected]
Mr. Turner is the President and CEO of Gecko Software, Inc., creator of Track ‘n Trade Pro Futures andTrack ‘n Trade High Finance, Forex and Stocks. He is also the owner of numerous financial websitesincluding Chartbook.com & StockAnnual.com, Mr. Turner is also the Editor and Chief of PitNews.comand the electronic PitNews Magazine. He’s an author, trainer, public speaker, columnist, and publisherof numerous educational videos, books and multimedia CD-ROM’s that teach traders how to navigatethe financial markets.
Gecko Software specializes in the development of software applications designed to assist traders inbecoming successful at trading commodities, stocks and forex. His flagship product, Track ‘n TradePro, has recently been featured in our industries top four national periodicals: Stocks and CommoditiesMagazine, Futures Magazine, Traders World Magazine and Active Trader Magazine. Track ‘n TradePro has now been the recipient of the Stocks & Commodities Magazine Readers Choice Award fourtimes.
Risk Disclosure
High Risk InvestmentTrading futures on margin carries a high level of risk, and may not be suitable for all investors. The high degree ofleverage can work against you as well as for you. Before deciding to trade futures you should carefully consideryour investment objectives, level of experience, and risk appetite. The possibility exists that you could sustain aloss of some or all of your initial investment and therefore you should not invest money that you cannot afford tolose. You should be aware of all the risks associated with futures trading, and seek advice from an independentfinancial advisor if you have any doubts.
Market OpinionsAny opinions, news, research, analyses, prices, or other information contained in this document is provided asgeneral market commentary, and does not constitute investment advice. The authors of this document will notaccept liability for any loss or damage, including without limitation to, any loss of profit, which may arise directly orindirectly from use of or reliance on such information.
Accuracy of InformationThe content in this document is subject to change at any time without notice, and is provided for the sole purposeof assisting traders to make independent investment decisions. The authors have taken reasonable measures toensure the accuracy of the information, however, does not guarantee its accuracy, and will not accept liability forany loss or damage which may arise directly or indirectly from its content.
DISCLOSURE OF RISK: THE RISK OF LOSS IN TRADING FUTURES AND OPTIONS CANBE SUBSTANTIAL; THEREFORE, ONLY GENUINE RISK FUNDS SHOULD BE USED. FU-TURES AND OPTIONS MAY NOT BE SUITABLE INVESTMENTS FOR ALL INDIVIDUALS,AND INDIVIDUALS SHOULD CAREFULLY CONSIDER THEIR FINANCIAL CONDITION INDECIDING WHETHER TO TRADE. OPTION TRADERS SHOULD BE AWARE THAT THEEXERCISE OF A LONG OPTION WOULD RESULT IN A FUTURES POSITION.
HYPOTHETICAL PERFORMANCE RESULTS HAVE MANY INHERENT LIMITATIONS, SOMEOF WHICH ARE DESCRIBED BELOW.
NO REPRESENTATION IS BEING MADE THAT ANY ACCOUNT WILL, OR IS LIKELY TO,ACHIEVE PROFITS OR LOSSES SIMILAR TO THOSE SHOWN. IN FACT, THERE AREFREQUENTLY SHARP DIFFERENCES BETWEEN HYPOTHETICAL PERFORMANCE RE-SULTS AND THE ACTUAL RESULTS SUBSEQUENTLY ACHIEVED BY ANY PARTICULARTRADING PROGRAM.
ONE OF THE LIMITATIONS OF HYPOTHETICAL PERFORMANCE RESULTS IS THAT THEYARE GENERALLY PREPARED WITH THE BENEFIT OF HINDSIGHT. IN ADDITION, HYPO-THETICAL TRADING DOES NOT INVOLVE FINANCIAL RISK, AND NO HYPOTHETICALTRADING RECORD CAN COMPLETELY ACCOUNT FOR THE IMPACT OF FINANCIALRISK IN ACTUAL TRADING. FOR EXAMPLE, THE ABILITY TO WITHSTAND LOSSES ORTO ADHERE TO A PARTICULAR TRADING PROGRAM, IN SPITE OF TRADING LOSSES,ARE MATERIAL POINTS WHICH CAN ALSO ADVERSELY AFFECT ACTUAL TRADINGRESULTS. THERE ARE NUMEROUS OTHER FACTORS RELATED TO THE MARKETS, INGENERAL, OR TO THE IMPLEMENTATION OF ANY SPECIFIC TRADING PROGRAMWHICH CANNOT BE FULLY ACCOUNTED FOR IN THE PREPARATION OF HYPOTHETI-CAL PERFORMANCE RESULTS AND ALL OF WHICH CAN ADVERSELY AFFECT ACTUALTRADING RESULTS.

CHAPTER 1:
What are spreads?
The futures markets provide a variety of trading opportunities. In addition to profiting from rising prices
by purchasing futures options or from falling prices by selling futures contracts, there is an opportunity
to profit from the relationship between different contracts – or SPREAD. A spread refers to the simulta-
neous purchase and sale of two or more different futures contracts. Here are some definitions:
Spread: The price difference between two different, but related contracts.
Spreading: The simultaneous buying and selling of two related markets in the expectation that a
profit will be made when the position is offset. Examples include: buying one futures contract
and selling another futures contract on the same commodity but different delivery month; buying
and selling the same delivery month on different exchanges; buying a given delivery month of
one futures contract and selling the same delivery month (or close to it) of a different, but related,
futures market.
When establishing - or “putting on” - a spread, a trader looks at the price differential of the spread rather
than the absolute price levels. The contract that is viewed as “cheap” is purchased – or a long position is
established. The contract that is viewed as “expensive” – or “dear” – is sold – or a short position is
established. If market prices move as expected, meaning the long position gains in value relative to the
short position, the trader profits from the change in the relationship between the prices.
The concern for a spread trader is the change in the relationship between contract he or she is long and
the one that he/she is short. For example, assume that a trader is buying July (long) CBOT Wheat and
Selling (short) December CBOT Wheat. The trader will profit from this position if any of the following
occurs:
The long contract increases in value MORE than the short contract.
For example, if over the course of a week, July CBOT increases in value 15 cents/bushel
($750.00 before commissions and fees) and December CBOT increases in value by only 10 cents/
bushel ($500.00 before commissions and fees), then the spread trader in this position has a profit
of 5 cents/bushel (or $250.00 before commissions and fees), because the long position gained +15
cents/bushel while the short position lost –10 cents/bushel.
The long contract decreases in value LESS than the short contract.
For example, if over the course of a week, July CBOT Wheat decreases in value by –10 cents/
bushel (-$500.00 before commissions and fees) and December CBOT Wheat decreases in value –
15 cents/bushel (-$750.00 before commissions and fees), then the spread trader in this position
has a profit of +5 cents/bushel, even though both contracts declined.
The long contract INCREASES in value and the short contract DECREASES in value.
For example, assume that July CBOT gains +2 cents per bushel (+$100.00 before commissions
and fees) and December CBOT Wheat decreases by –3 cents/bushel (+$150.00 before commis-
sions and fees because the trader is short), then the spread trader in this position has a profit of +5
cents/bushel, as he/she gained on both side of the spread trade.

Remember, the concern for a spread trader is the change in the relationship between contract he or she is
long and the one that he/she is short, not the absolute price level of the commodity in question. For
example, re-examine case #2 above, where the contract that the trader was long went down in value by -
$500.00. However, because the contract that the spread trader was short decreased in value by -$750.00,
resulting in a gain of +$750.00 before commissions and fees, the spread trader ended up making money
because the long contract gained in value RELATIVE to the short position.
Of course, just because you are spread, does not guarantee eliminate losses. If the long contract de-
creases in value RELATIVE to the short position, then the spread trader will incur losses. Let us assume
the same position as the above example, or that a spread trader is buying July (long) CBOT Wheat and
Selling (short) December CBOT Wheat. The trader will incur losses from this position if any of the
following occurs:
The long contract increases in value LESS than the short contract.
For example, if over the course of a week, July CBOT increases in value 10 cents/bushel
($500.00 before commissions and fees) and December CBOT increases in value by +15 cents/
bushel ($750.00 before commissions and fees), then the spread trader in this position has a loss of
-5 cents/bushel (or -$250.00 before commissions and fees), because the long position gained only
+10 cents/bushel while the short position lost –15 cents/bushel.
The long contract decreases in value MORE than the short contract.
For example, if over the course of a week, July CBOT Wheat decreases in value by –15 cents/
bushel (-$750.00 before commissions and fees) and December CBOT Wheat decreases in value
by only –10 cents/bushel (-$500.00 before commissions and fees), then the spread trader in this
position has a loss of -5 cents/bushel.
The key to spread trading is in the relative performance of one futures contract to another. Though some
spreads have a basic market bias, known as bull and bear spreads, the absolute price level of the underly-
ing commodity contracts is not important, only the relative performance of one contract versus the other.
In other words, a spread trade is a speculation that one contract will out perform another contract.
All spread charts in this booklett were created with the Spreads Expansion Pack from Gecko Software’s
Track ‘n Trade Pro Futures trading software. On the web at: www.TracknTrade.com.

Why Trade Spreads?
The main reasons most professional traders trade spreads are three fold:
1. Lower Risk
2. Attractive margin Rates
3. Increased Predictability
Lower Risk:
Because of their hedged nature, spreads generally are less risky than outright futures positions. Most of
the professional traders who trade spreads usually site this as the number 1 reason why they trade
spreads. Since the prices of two different futures contracts (on the same commodity or different but
related commodities) exhibit a strong tendency to move up or down together, spread trading offers
protection against losses that arise from unexpected or extreme price volatility.
Of course not all spreads have lower risk than outright futures positions. For example, “old crop” versus
“new crop” grain spreads may exhibit equal or even greater risk. However, careful examination of the
spreads you are considering should yield a stable of spreads which tend to have lower risk characteris-
tics, which can help lower the volatility of the market you are trading and fluctuations within your own
trading account.
Spreads offer “protection” because losses on one side of the spread are more or less offset by gains
from the other side of the spread. For example, if the short (sell side) of a spread results in a loss due to
an increase in price, the long (buy side) side of the spread should produce a profit offsetting much, if
not all of the loss.
Of course, spread trading has its own risks, but generally due to the partially hedged nature of spreads,
they tend to exhibit lower risk in general. The least risky spreads in most cases are Intra-Market (Deliv-
ery) spreads, followed by Inter-Market (Inter-Exchange) Spreads, and last and most risky are the Inter-
Commodity spreads.
Attractive Margin Rates:
This is not always the case, but because of the partially hedged nature of spread positions, spread
margins tend to be margined at a lower rate than outright futures positions. Like any other margin
requirement, spread margin minimum levels are set by the Exchanges, and can be higher depending
upon your brokerage house. Spread margins are subject to change, without notice, by either your bro-
kerage house or the exchange, just like any other margin level.
Due to the generally lower margin levels charged for spreads, traders are able to trade a larger variety of
positions, increasing their diversity. Also, because of the lower margin rates, which is a function of
volatility, spreads allow traders to risk a smaller percentage of their capital on any one trade.
Like traditional futures contracts, margin levels can be used as a rough guide for the level of risk in-
volved in that particular market. Generally, the higher the margin rate, the higher the risk, as well as the
higher the potential reward. As such, spread traders usually choose this avenue because of the lower
perceived risks, and are willing to sacrifice the tremendous upside potential of trading straight futures
positions, in return for the lower risk of trading Spreads.
Increased Predictability
Most spread traders feel that spreads are more predictable than outright futures positions. Some of this
predictability may be due to the lower risk involved in spreads. With lower volatility, it is easier for the
traders to take advantage of longer term price moves, as the lower volatility makes it easier for most
traders to ride out corrections with in major trends, instead of being shaken out of a position on these
corrections which often happens to straight futures traders.
Also, spreads are much less sensitive to sudden shocks to a market, such as news events or such. Be-
cause of this, many traders feel they are more predictable. Another commonly stated reason for increased
predictability is the greater liquidity in most spread markets. While many markets may be good for 50 or
100 contracts at any price bid or offered, it is not uncommon to see spread trading in that same market
good for 500 to 1,000 spreads. The spread markets are generally extremely liquid, and as such many feel
they offer a better opportunity than outright futures positions.
Lastly, some feel the spread markets are more predictable because they are off the beaten path. Thou-
sands of systems have been developed for trading futures. As such, some of the strong tendencies of the
markets have shifted because they have become so popular and well known. However, spread trading is
still considered much too complicated or esoteric for many, and as such many of these market anomalies
have yet to be worked out of the market.
Though no one knows for sure if Spreads are more predictable or not, traders will find that spreads tend
to trend well, and due to the high liquidity in the spread markets they also tend to chart and hold support
or resistance levels very well.
Cons of Spread Trading
Generally some of the benefits that were sighted as pros, can also be seen as a drawbacks to other
traders. Many people sight the slower movement and lower volatility nature of the spread
markets as a draw back. Spreads do not tend to offer the excitement of “in and out” straight
futures trading.
The general lack of risk also means that the potential rewards are smaller. Risk and reward are
almost always in a direct relationship with each other in the world of speculation. Therefore the
partially hedged nature of spreads which tends to limit risk (reduce volatility) also tends to cause
profits to smaller as well. In other words, when several traders described spread trading as about
as exciting as “watching grass grow.
Another draw back of trading spreads is the double commission structure. Remember, spreads
involve two different futures contracts, and as such you have double the cost of trading…. Com-
missions. Commissions in the futures market are generally charged on a per contract basis, and
therefore trading a spread involves twice the cost of trading outright futures positions.
Speculators need to consider commissions when running their own trading businesses. Commissions are
a cost, plain and simple. In trading spreads, this cost is higher. In fact, it is often joked that brokers
invented spreads, so they could charge double commissions. Though traders cannot ignore this cost, they
can work on reducing it. Often, many brokerage firms will charge a lower rate on a per contract basis for
spread trades. Though this “spread commission” is still typically higher than the cost of trading an
outright (single contract) position, it is often less than double the existing single contract position rate.
Conclusion
Spread trading is not for everyone. However if you are serious about trading, you should examine the art
of spread trading. Even if you have no intention of trading spreads per se, the spread markets can give
outright futures traders a lot of information about the underlying health of the market and clues to future
price direction.
Spreads are a very specialized vehicle for trading. They do not have as large of a profit potential as
outright futures positions, but they entail less risk in most cases. The attractive margin rates also help
newer or less capitalized traders risk less of their account on any one trade, allowing for more realistic
position sizing and possibly a lower risk of ruin (loss of bankrupting your trading account).
Spreads offer a viable way to speculate in the futures market. Their lower risk tendencies make them
especially suitable for newer traders. However, like anything else, they require study and lots of practice,
hence the Track ‘n Trade module for spreads, to allow traders to test ideas, and learn before risking their
hard earned dollars.

Spread 1
May Corn / March Corn
FUNDAMENTAL The primary corn crop harvest occurs in October. Once the grain is stored, carrying charges should widen in subsequent months, since supplies are abundant. Full carry on this particular spread is approximately 14 cents. As the March contract approaches delivery, winter transportation difficulties, combined with seasonal increases in demand, may produce a bullish environment. It is advisable, therefore, to exit the position before first notice day on the March contract. TIP Initiate: First week in January
Close: Last week in February
TECHNICAL Given its trading range characteristics, it is advisable to enter this spread on weakness and place a mental stop only beyond the lower boundary of the range. Conservative traders may take partial profits on breakouts above the upper channel line of the range. HISTORICAL
All c
hart
s a
re c
ou
rtesy o
f G
ecko
So
ftw
are
, an
d T
rack ‘
n T
rad
e P
ro.


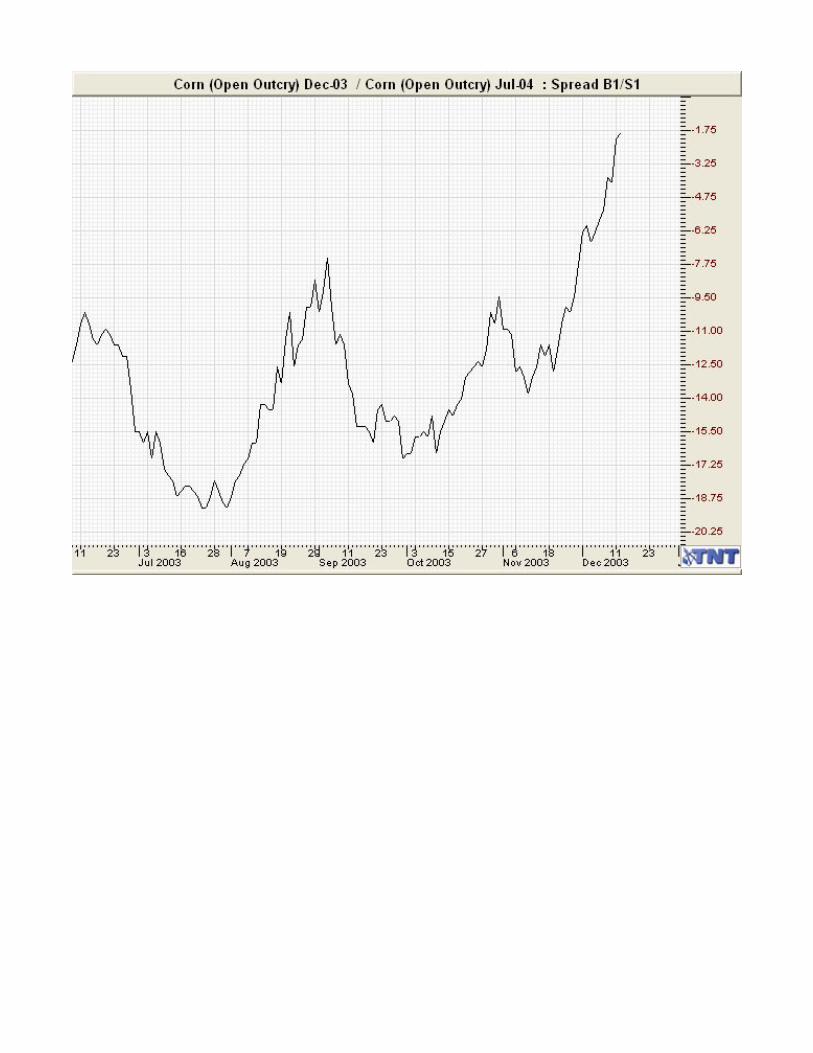
Spread 2
December Corn / July Corn
FUNDAMENTAL Referred to as an “old crop/new crop” spread because it includes the December contract, the first futures month of the new crop. When the trade is initiated, uncertainty over acreage yield and demand typically translates into either a substantial premium to the July side or a narrow premium to December. As this uncertainty resolves, there is less upside pressure on the nearby contract, and the spread begins to favor the deferred. Full carry is approximately 48 cents. Since anything near this level is unlikely until later in the year, a profit objective of 8 to 10 cents is reason able. TIP Initiate: Third week in January
Close: First week in March
TECHNICAL The old crop/new crop nature of this spread suggests that it should behave in a trading manner. Trend lines are useful directional trading indicators and appear to be more reliable with this spread than overbought/sold measures. Movement in this spread beginning in January often traces out an Elliot Wave pattern of either five waves up or three waves down. If the January high is exceeded by the middle of February, this is a strong signal that the position should continue favorably until at least some time in March. HISTORICAL


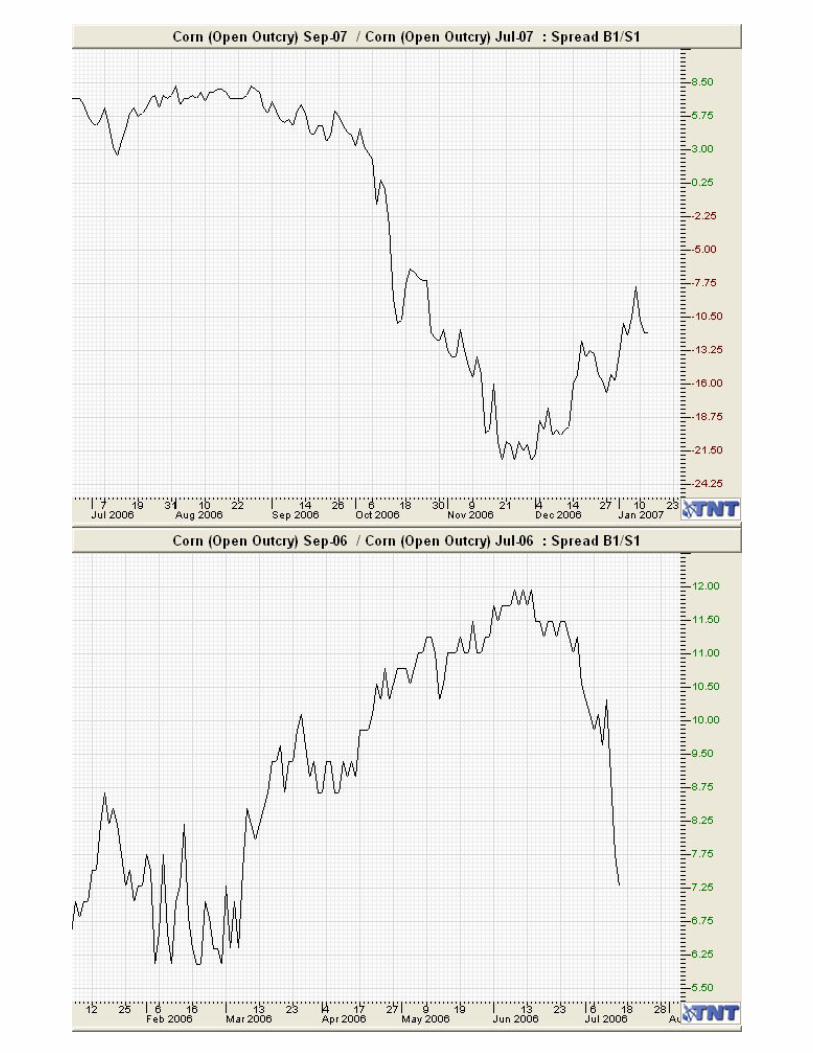
Spread 3
September Corn / July Corn
FUNDAMENTAL This spread involves two contract months within the same contract year. It is designed to capture the seasonal widening in carrying charges, which occurs following harvest and before the July contract month enters delivery. Full carry on the position is 13 cents. In a strongly bullish market, the nearby contract may gain on the deferred and the spread would then react unfavorably. For this reason it is important to monitor price action in the lead month for signs of strength in the market. TIP Initiate: Second week in February
Close: First week in March
TECHNICAL Volatility in this spread begins to increase as the July contract becomes the lead month. Until then the spread tends to trade within a range of approximately 28 days between successive highs and lows. This cyclical behavior can be used to more precisely time the entry and exit, as can overbought/sold indicators with time periods equal to one-half the cycle length. Trend measures should be avoided with this spread, because of the high probability of whipsaw. Mental stops should be placed outside the trading range formed since the beginning of the year. Rather than trying to identify a bottom in the spread, a position should be established during February after the deferred month begins to gain on the nearby month. Once the position is initiated it should be added to only on pull backs that do not break below the lower channel area. TRICK This spread has tended to stay within a 5 – 8 cent range in the February-March period during the last several years. While this presents limited potential gain, it also indicates less risk in carrying the position. Some traders may prefer to take advantage of reduced margin requirements for grain spreads and increase the total number of positions they are carrying. Even in years in which the overall spread has moved unfavorably, a bounce up in March sufficient to exit with little or no loss generally develops.


Spread 4
September Soybeans / May Soybeans
FUNDAMENTAL Due to the processed products of soybean meal and oil, soybeans are affected by supply/demand considerations for both feed-grain and oilseeds. Since the bean crop year begins September 1, this is considered an old crop/new crop spread. Uncertainty over the new crop helps support the price of the deferred contract, and during the first two months of even bull years, the May contract tends to lag the lead months. It is, therefore, only in strong bullish years that this position should behave unfavorably. Full carry is 92 cents. TIP Initiate: First week in January
Close: Last week in February
TECHNICAL This position tends to experience a sharp down move late in December, following which is the optimal time to enter the spread. Once opened, the position should be tracked using trend-following techniques. The dominant direction for the spread is indicated by a series of higher highs when it is trending higher or a series of lower lows if it is heading lower. Each major wave approximates the 21-day short-term cycle for soybeans. Overbought/sold measures and channel formations are not particularly reliable, because of the trending characteristics of this spread. Additional positions can be added on pull-backs, provided the overall trend continues favorably. Mental stops should be placed below the most recent low and adjusted only once a higher low is made. TRICK In years in which the spread has been profitable, it has managed to hold the low set near the end of December. When this low has been broken, the position tended to move lower. The move higher: A possible double-top formation occurring in December is also a signal of potential adverse movement. Highs made near the middle if February are often met with weakness immediately thereafter, so partial profits should be taken on strength during that time. If the immediately preceding low is penetrated, then the remaining positions should be liquidated even if before the targeted date of exit.


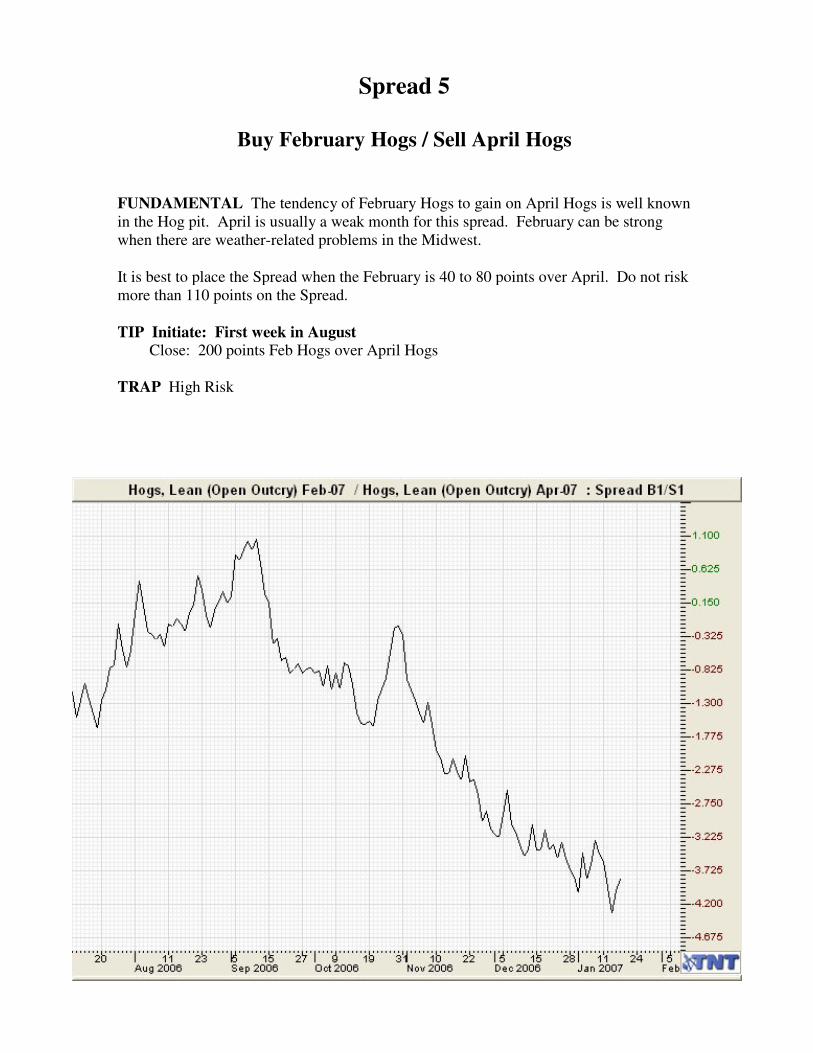
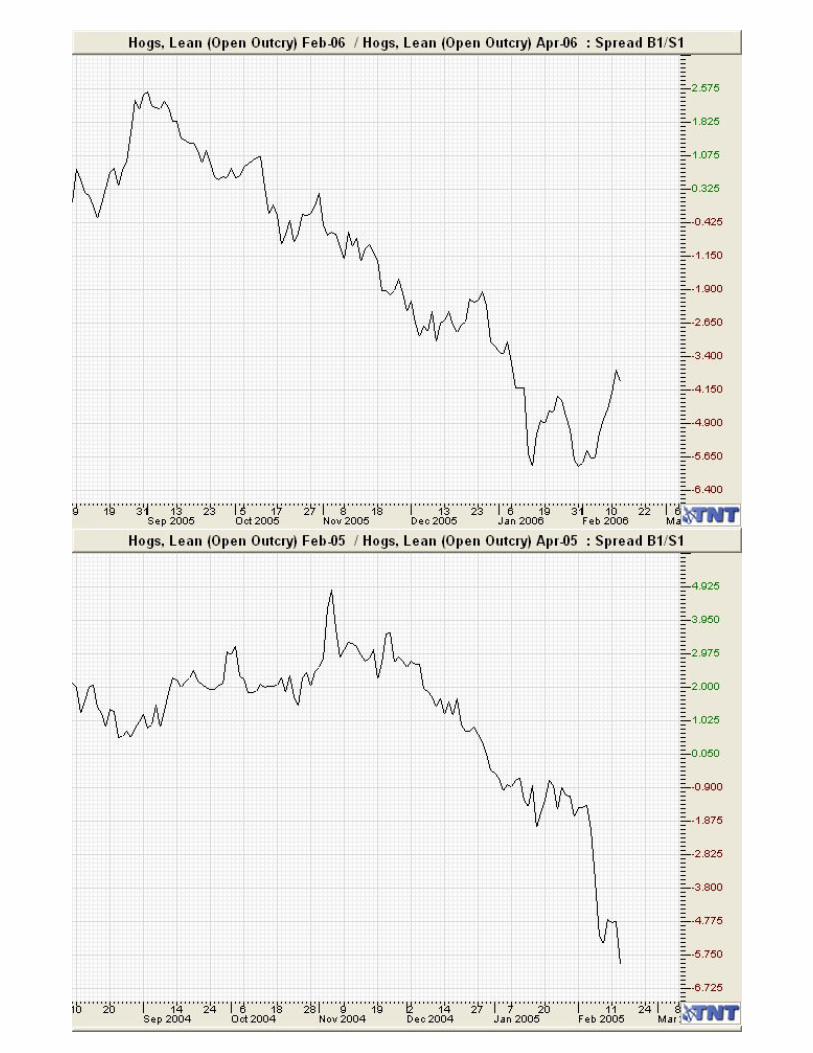
Spread 5
Buy February Hogs / Sell April Hogs
FUNDAMENTAL The tendency of February Hogs to gain on April Hogs is well known in the Hog pit. April is usually a weak month for this spread. February can be strong when there are weather-related problems in the Midwest. It is best to place the Spread when the February is 40 to 80 points over April. Do not risk more than 110 points on the Spread.
TIP Initiate: First week in August
Close: 200 points Feb Hogs over April Hogs TRAP High Risk


Spread 6
Buy Wheat / Sell Corn
FUNDAMENTAL This spread should be done using the December contract. The objective is to take advantage of a large corn crop. If you decide to keep this Spread on, exit the first day it goes against you.
TIP Initiate: Before September Crop Report
Close: Day after Crop Report
TRAP High Risk


Spread 7
March Soybean Meal / July Soybean Meal
FUNDAMENTAL Soybean meal is processed either as a light protein feed ingredient or is further refined for direct human consumption. Demand for meal tends to be relatively strong during the beginning of the year, and, since meal does not store well, currant demand is satisfied primarily with nearby supplies. At the same time, requirements for deferred delivery are less certain. Brazilian soybeans are not harvested until March, so they do not contribute to supply early in the year. Exports and projections of domestic consumption are important factors to watch for signs of demand that will impact the nearby contract. TIP Initiate: First week in January
Close: Middle of February
TRICK This spread works better in predominantly bull markets, in which demand for soybean products should produce an upward trending configuration. Weakness in the chart late in December should produce a near-term low early in January, and this is the signal. Frequently this break will bottom near the September-October low, and this is a good area to begin considering the position. Confirmation is given once the spread begins to move higher. After the position becomes profitable, it should not be carried below the point of initial entry. Because of its possible volatile nature, the spread should be added to only by traders willing to assume higher risk. Partial profits can be taken near the end of January, and no position should be carried past the recommended closing date.


Spread 8
October Soybean Meal / August Soybean Meal
FUNDAMENTAL This spread is designed to work even without a substantial change in the underlying cash price for soybean meal. The carrying charge between these two deferred months should widen progressively into the year as storage charges between the delivery months account for a greater percentage of total storage. In addition, the supply of soybeans, which becomes available as a result of the Brazilian harvest in March, should produce less demand for the nearby contract. These relationships will invert only during periods of extremely strong demand or of diminished exports from Latin America. TIP Initiate: Third week in February
Close: Middle of may
TRICK Ideally, this spread should move within a narrow range with an upside bias from February to May. The time of entry can be refined using overbought/sold indicators to measure the break, which typically begins early in February. One statistic to pay particular attention to is the Crush Margin Spread, which relates soybeans to their primary products, meal and oil. The crush ratio is constructed around meal production, so a rising crush indicates increased demand for meal. This could translate into an unfavorable movement in the October-August spread. The crush margin is calculated by multiplying the price per ton of meal by 0.024, the price per pound of oil by 0.11, and subtracting the sum of these, the price of soybeans per bushel. Since the crush spread is used here as an indication of changes in demand for meal, the relationship should be tracked over time when drawing conclusions.


Spread 9
July Soybean Oil / March Soybean Oil
FUNDAMENTAL Increased supply of soybean oil as a source of the fall harvest is the primary driving factor behind this spread. The crush level increases in the fall, which leads to expanded oil supplies and tends to widen carrying charges. It is important to exit the position before the results of the Brazilian soybean harvest in March, for a reduction in output there can produce a sharp increase in demand for domestic products. Weekly exports and monthly stocks should be monitored for possible changes in supply, which could impact the spread, also. TIP Initiate: Middle of December
Close: Last week in February
TRICK Entry in this spread follows a cyclical downturn, which typically occurs during the first two weeks of December. Overbought/sold indicators as well as support from the October-November lows can be used to refine the exact entry. Once a position is entered, the spread tends to oscillate with an upward bias, so additional contracts should be added only on pull backs. A breakout above the December high is a valid indicator of further strength; and, if such a penetration occurs, the position should be exited on weakness pulling the market back below that level. If the December high cannot be broken, this signals possible weakness and opportunities to break even or take small profits should be examined. Soybean oil follows a short-term cycle of 21 days, and this spread can be expected to track this interval. Indicators should be constructed using a period equal to one-half the cycle length. HISTORICAL It is important to open this position following a break in December, because a second entry opportunity is seldom presented. Often this break is followed quickly by a sharp rise, and this should be used to take at least partial profits.


Spread 10
May Soybeans / May CBOT Wheat
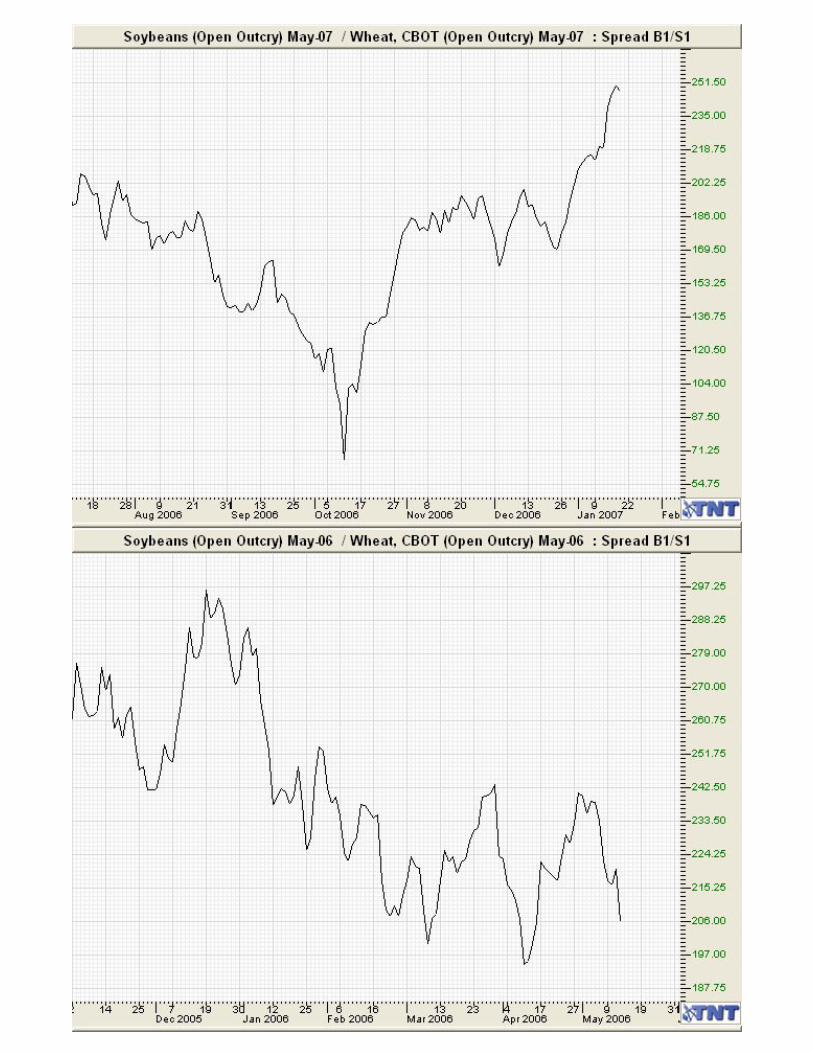
FUNDAMENTAL Soybean harvest occurs in September and October, while wheat is harvested in late May through July. At the beginning of the year, the bean supply, therefore, is known, while the size of the wheat harvest remains uncertain. As the year unfolds, estimations of the wheat crop become more accurate when the supply of harvest grain nears. In addition, the relatively higher price per harvest for soybeans tends to widen the carrying charge differential in the two commodities. All these factors combine to ordinarily increase the price of beans relative to wheat. TIP Initiate: Middle of February
Close: First week in April
TRICK This spread is best studied using trend-following techniques. After a period of relative stability during the previous three to four months, the spread often experiences a drop beginning late in February. Completion of this break is the signal to enter this position. From there trend lines can begin to be drawn, and even simple moving averages will assist in confirming a change in trend. Although additional positions can be added, they are best done on pull backs that do not break support lines. Wheat has a short-term cycle of approximately 32 days, and this spread will often oscillate within a period half that long. A penetration of the February highs is a strong signal that the position will at least meet the profit objective. Once it does, partial profits should be taken. If the position begins to back up from there, the remainder of the contracts should be exited even if less than one month after initiation. TRAP Traders wishing to carry their position into April should observe the sharp downturn that typically occurs later in the month. Although there are times when the spread later reverses and continues its climb, carrying the position after this break entails greater risk.


Spread 11
November Soybeans / December CBOT Wheat
FUNDAMENTAL This new crop spread is designed for differences in harvest periods between soybeans and wheat harvest when the supply of a grain is set. Further supply will not emerge. Before harvest the expectation of adjustments is likely to depress prices. On the other hand, soybeans tend to be strongest into the new year just as wheat begins to decline. This combination suggests that beans gain in price relative to wheat. TIP Initiate: Third week of February
Close: Within the first to third week of June
TRICK The spread operates with a slight upside bias from March to April or May. Corrections during this period tend to be brief and do not reach into new territory. Because of the narrow range, it is difficult to apply other technical indicators than long-term trend lines to measure support and resistance. Oscillators will prove inherently late in signaling changes in direction. The frequency of reversal makes this a spread to take small profits when they arise and not wait for a major move. On the other hand, once initial profits are taken, the position may be reentered on subsequent weakness with the same profit objective. It may be helpful to follow the May-March soybean spread for signs of strength in the lead months. HISTORICAL For traders wishing to hold the spread longer, volatility does not seem to increase until well into April or May. Even then the bias continues to favor the carrying charge position, although still within a narrowly defined range. HIGH RISK


Spread 12
July Soybeans / July CBOT Wheat
FUNDAMENTAL The propensities for this spread are similar to those for the May Beans/May Wheat position. Because the July delivery follows the May, this spread is opened slightly later in the year and is held approximately one month longer. By carrying the position into the beginning of wheat harvest, it is more sensitive to changes in that commodity. During the summer, wheat will often gain on beans, because the wheat harvest is complete and the soybean harvest is approaching. For that reason, the spread should not be carried into delivery. TIP Initiate: Last week in February
Close: Third week in May
TRICK This position is best analyzed with trend-following methods. Long-term support and resistance lines can be drawn from extremes as far back as data are available. Chart formations, such as double or triple tops and bottoms, also are indications of probably price reversal. Overbought/sold measures can be used to time entry and exit, but period length should be chosen carefully to avoid premature signals. Once the initial positions is established, additional contracts can be added on pull backs that do not violate previous lows. Partial profits should be taken whenever the spread reaches an overbought condition, since corrective breaks can be sometimes significant. Due to increased volatility into delivery, the entire position should in all cases be exited at least one month before contracts go into delivery. HISTORICAL Generally speaking, this spread has exhibited weakness from October to February. This is due primarily to an increased supply of soybeans following harvest. As this supply becomes integrated into the market, the spread typically reverses its long-term direction and begins to advance MODERATE RISK


Spread 13
Sell a Teenager
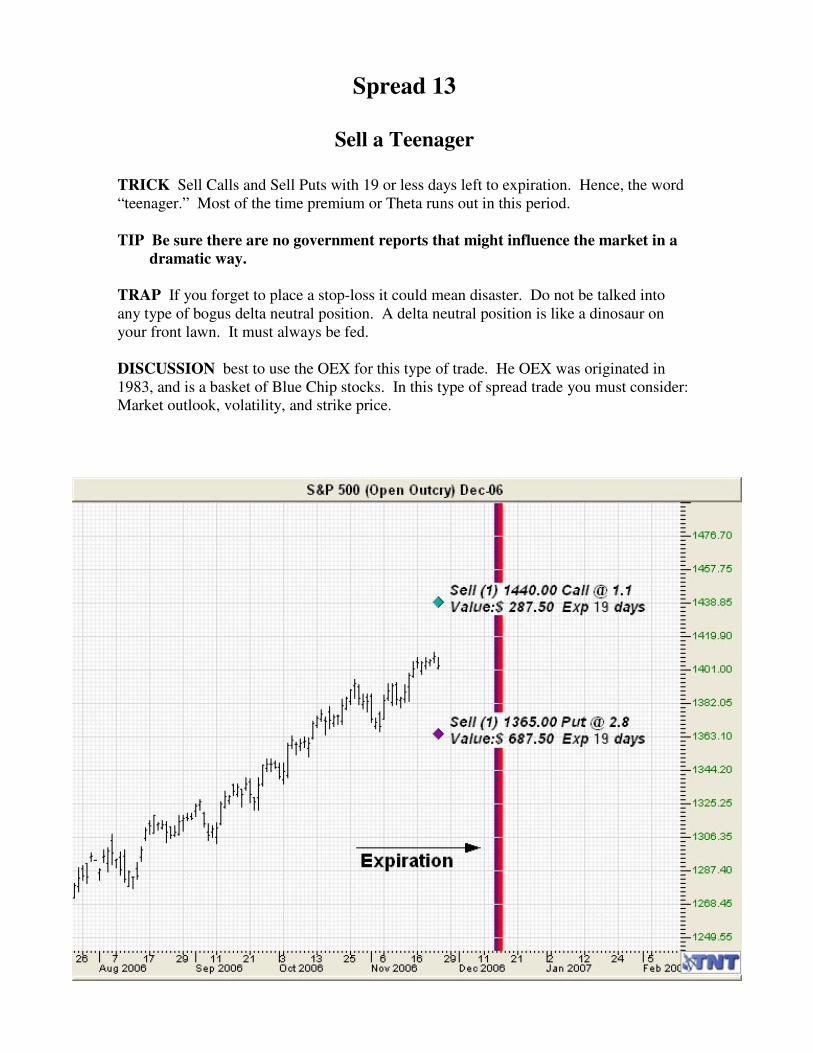
TRICK Sell Calls and Sell Puts with 19 or less days left to expiration. Hence, the word “teenager.” Most of the time premium or Theta runs out in this period. TIP Be sure there are no government reports that might influence the market in a
dramatic way.
TRAP If you forget to place a stop-loss it could mean disaster. Do not be talked into any type of bogus delta neutral position. A delta neutral position is like a dinosaur on your front lawn. It must always be fed. DISCUSSION best to use the OEX for this type of trade. He OEX was originated in 1983, and is a basket of Blue Chip stocks. In this type of spread trade you must consider: Market outlook, volatility, and strike price.

Spread 14
June Live Cattle / August Live Cattle
FUNDAMENTAL Cattle experiences their greatest marketings in late fall when they come off grass and are placed on more expensive feed. Lows occurring at that time are followed by rising prices into late spring or early summer. This pattern favors the bull spreads in most years. The greatest risk to the position is large placements of cattle on feed early in winter, which will translate into increased beef production by spring. This would tend to depress prices in the nearby contract. When considering this spread it is important to monitor the monthly USDA Cattle on Feed Report for changes in herd size. TIP Initiate: Third week in January
Close: Second week in April
TRAP Get out before cattle on feed report.


Spread 15
June Live Cattle / October Live Cattle
FUNDAMENTAL This spread follows the seasonality of the cattle market during late winter. Typically, tight supplies and a strengthening cash market tend to support the nearby contract. Increases in spring placements of cattle on feed, compared to the winter, raise the expected supply for October, which depresses the price of the deferred contract. Large placements in winter, feedlot liquidations, and competition from pork and poultry products are the primary market risks. TIP Initiate: First week in February
Close: 150 Points or the first week in March
TRICK This spread moves in a trending manner over a regular cycle lasting approximately 10-14 days. This cycle can be used to time entry as well as to select exit points. Trend lines may be drawn from either the December or January lows, and positions should be exited upon a subsequent penetration. Other trend-following techniques should be avoided, because of their lag in signaling a directional change. Sharp rallies tend to be followed by equally precipitous declines, so it’s preferable to exit a trade early, rather than wait until the spread begins to reverse. If January highs do not exceed those of the previous month, this suggests possible weakness and lower prices ahead. Mental stops must be placed far enough away to allow for intraday volatility, which in the cattle market can sometimes be substantial.
TRAP The decline that begins in January may extend beyond the first week in February, so timing the entry for this spread can be difficult..


Spread 16
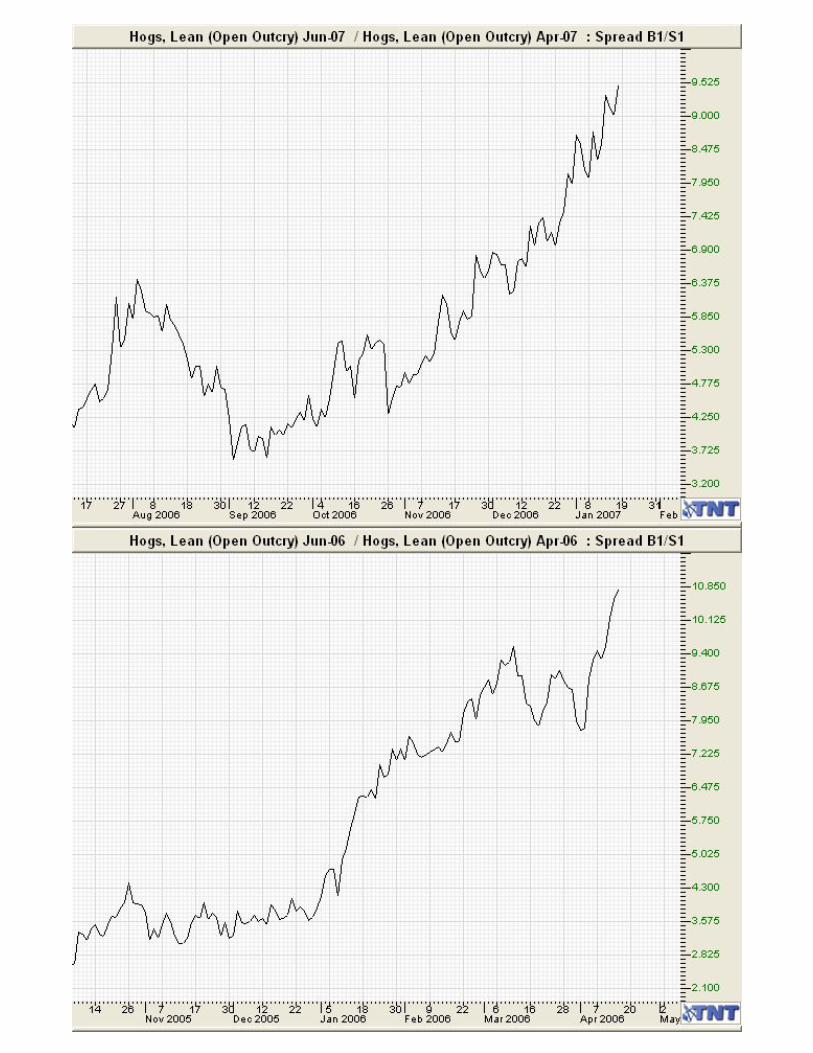
June Live Hogs / April Live Hogs
FUNDAMENTAL Seasonal patterns in the hog market are now less important than they once were, due to improved breeding and raising methods. Nevertheless, since corn is still the primary feed for hogs, as it rises in price the number of hogs sent to slaughter typically increases. This relationship ordinarily occurs from February through the beginning of April, and increased supplies tend to favor the bear spreads. Cash hog prices should be monitored, since an inverted market in which futures trade at a discount to the cash indicates strong demand, and it is the type of environment in which this spread should not perform well. TIP Initiate: Middle of February
Close: First week in April
TRICK When this position is opened, the deferred contract should be trading at a 200-300 point premium to the nearby month. Anything substantially greater than this suggests the market may already have adjusted for increased supply, and further upside potential is limited. Until the April contract goes into delivery, it is unlikely the spread will display large volatility, thus trend-following methods should be avoided. Hogs have a short-term cycle of approximately 21 days, so particular attention should be paid this long after the most recent high or low. Chart formations are notoriously unreliable in the hog and pork belly markets, so no particular significance is placed on pattern recognition. Mental stops should be placed outside the range of daily volatility and above the low of the past 30 days.
TRAP If the spread does not advance soon after it is opened, then additional positions should not be added on subsequent breaks, since the likelihood of a sideways pattern is increased. Only rarely does the high price in March exceed that from February, highlighting the importance of selecting properly the point of initial entry.


Spread 17
April Live Cattle / April Live Hogs
FUNDAMENTAL This spread is designed to profit from the different seasonal tendencies in these two livestock markets early in the year. Cattle prices generally gain as supplies diminish, and slaughter declines when grazing pastures become available in the spring. This assumes the usual light placements of cattle on feed in the early winter. Pork supplies during this time period are usually plentiful and exert downward pressure on hog prices. The primary risk in the position is the possibility of large early winter placements, which could keep cattle prices from rising in the spring. TIP Initiate: First week in February
Close: First week in March
TRICK When positions are initiated, the premium should be less than 25 cents per pound basis the cattle. Otherwise cattle prices would have to rise sharply before the spread becomes profitable. Sharp peaks make this position difficult to trade using trend-following techniques, although lines connecting previous tops or bottoms can be used to project overall direction. Additional contracts should not be added later in the month, and partial profits can be taken whenever the spread reaches an overbought condition.


Spread 18
April Live Cattle / April Feeder Cattle
FUNDAMENTAL During late winter, feeder cattle prices typically reach their seasonal highs for the year. This is a spillover from the tendency of live cattle prices to increase from December through February. Strength in live cattle prices translates into higher feed cattle prices during this time of year. The correlation is broken once supplies expand when winter feeders begin becoming available. This generally occurs around the time of delivery of the February futures contracts. Because cattle are placed on feedlots an average of 5 ½ months before being sent to slaughter, this spread is more speculative than one with contracts spaced that far apart. TIP Initiate: First week in March
Close: Last week in March
TRICK Since the April contract in both live and feeder cattle becomes the lead month at expiration of the February contract, this spread may exhibit extreme volatility surrounding that expiration. For that reason, no positions should be opened until the February contract expires. With a recommended holding period for the entire position of not more than one month, additional contracts should not be added on subsequent weakness. To measure intraday fluctuations, hourly charts on the spread should be kept if possible for several weeks before initiating a trade. If the position is legged on, the feeder cattle side should be opened first, because that is ordinarily the more difficult side off the spread to establish. Total open interest in feeder cattle futures is often less than 20 percent of that for live cattle. After a profit of 100-150 points has been achieved, at least a portion of the positions should be closed.


Spread 19
June Live Cattle / May Feeder Cattle
FUNDAMENTAL This spread should normally reach its greatest extreme sometime in late January or early February. At this time supplies of feed cattle are near their lower mark, while live cattle prices should not reach their seasonal peak until late March or early April, coinciding with the time recommended to close this position. Monthly USDA Cattle on Feed Reports as well as cash market prices should be studied for signs of supply shifts in these two related markets. TIP Initiate: Middle of March
Close: Between the first and tenth of April
TRICK It is common for this spread to exhibit an Elliott Wave progression from the lows in January and February to the highs in April. Impulse waves within this sequence can be used to take partial profits, while corrective waves provide the opportunity to add new positions. Trend lines drawn from recent lows are reliable confirmations of the overall trend, and overbought/sold measures are useful in determining when each impulse wave is probably nearing completion. Short-term trading cycles do not appear clearly with this spread, and so selection of optimal periods when constructing various indicators is difficult. As an initial approximation, one-half the normal cattle cycle of 15 trading days can be tried and then refined based on correlation with past price action. TRAP Entry in March should occur following a correction from the advance above the lows in February. A penetration through the downward sloping trend line from highs made the previous year confirms a change in long-term direction and increases the likelihood of higher prices in the spread. Aggressive traders may consider reversing their positions in April as the seasonal top in live cattle develops and the spread typically falls at least through the end of May.


Spread 20
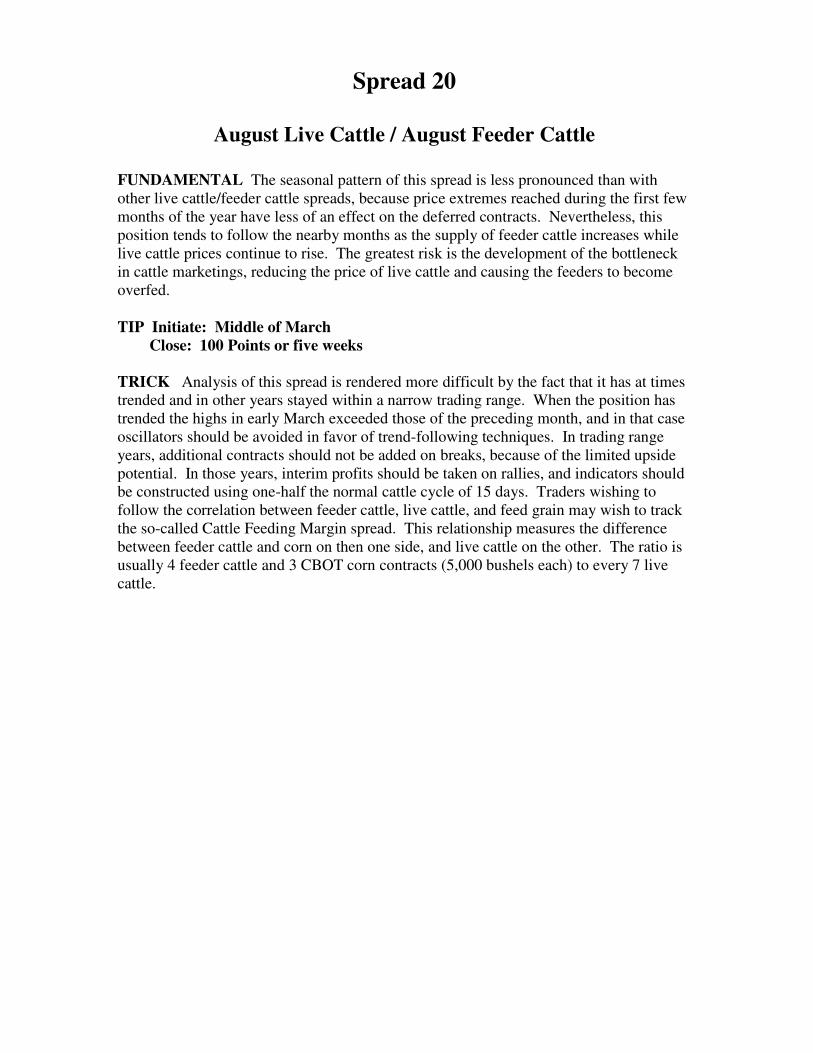
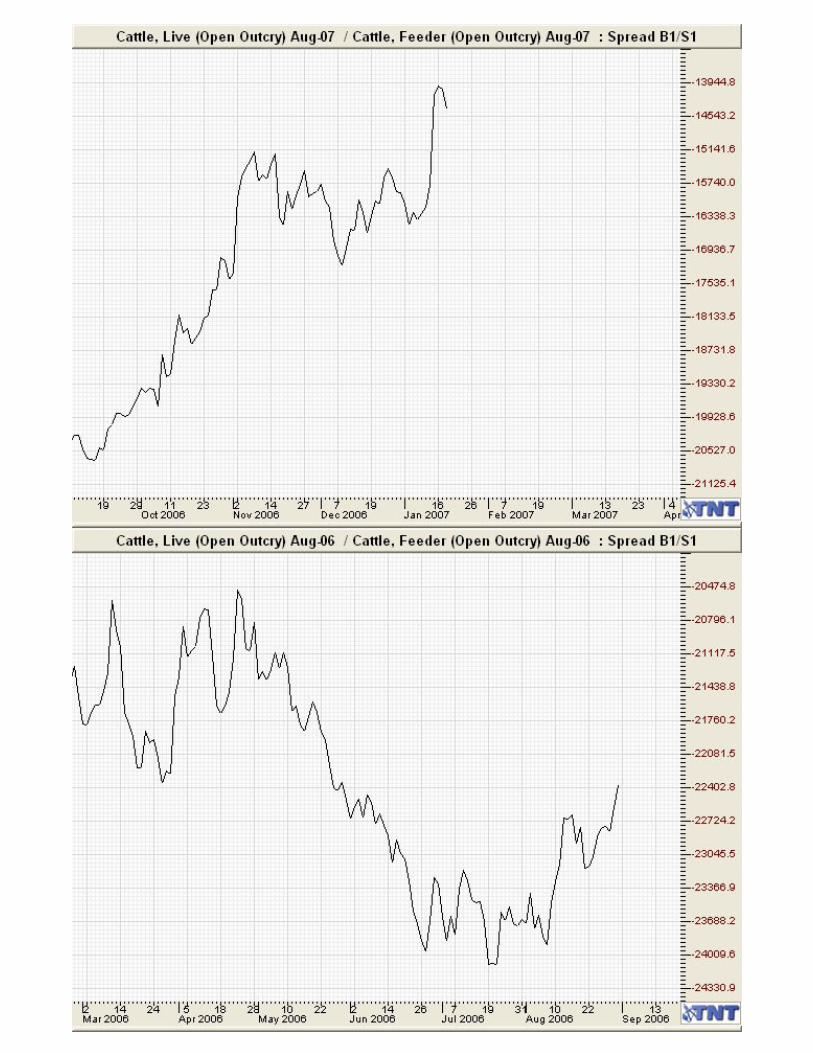
August Live Cattle / August Feeder Cattle
FUNDAMENTAL The seasonal pattern of this spread is less pronounced than with other live cattle/feeder cattle spreads, because price extremes reached during the first few months of the year have less of an effect on the deferred contracts. Nevertheless, this position tends to follow the nearby months as the supply of feeder cattle increases while live cattle prices continue to rise. The greatest risk is the development of the bottleneck in cattle marketings, reducing the price of live cattle and causing the feeders to become overfed. TIP Initiate: Middle of March
Close: 100 Points or five weeks
TRICK Analysis of this spread is rendered more difficult by the fact that it has at times trended and in other years stayed within a narrow trading range. When the position has trended the highs in early March exceeded those of the preceding month, and in that case oscillators should be avoided in favor of trend-following techniques. In trading range years, additional contracts should not be added on breaks, because of the limited upside potential. In those years, interim profits should be taken on rallies, and indicators should be constructed using one-half the normal cattle cycle of 15 days. Traders wishing to follow the correlation between feeder cattle, live cattle, and feed grain may wish to track the so-called Cattle Feeding Margin spread. This relationship measures the difference between feeder cattle and corn on then one side, and live cattle on the other. The ratio is usually 4 feeder cattle and 3 CBOT corn contracts (5,000 bushels each) to every 7 live cattle.


Spread 21
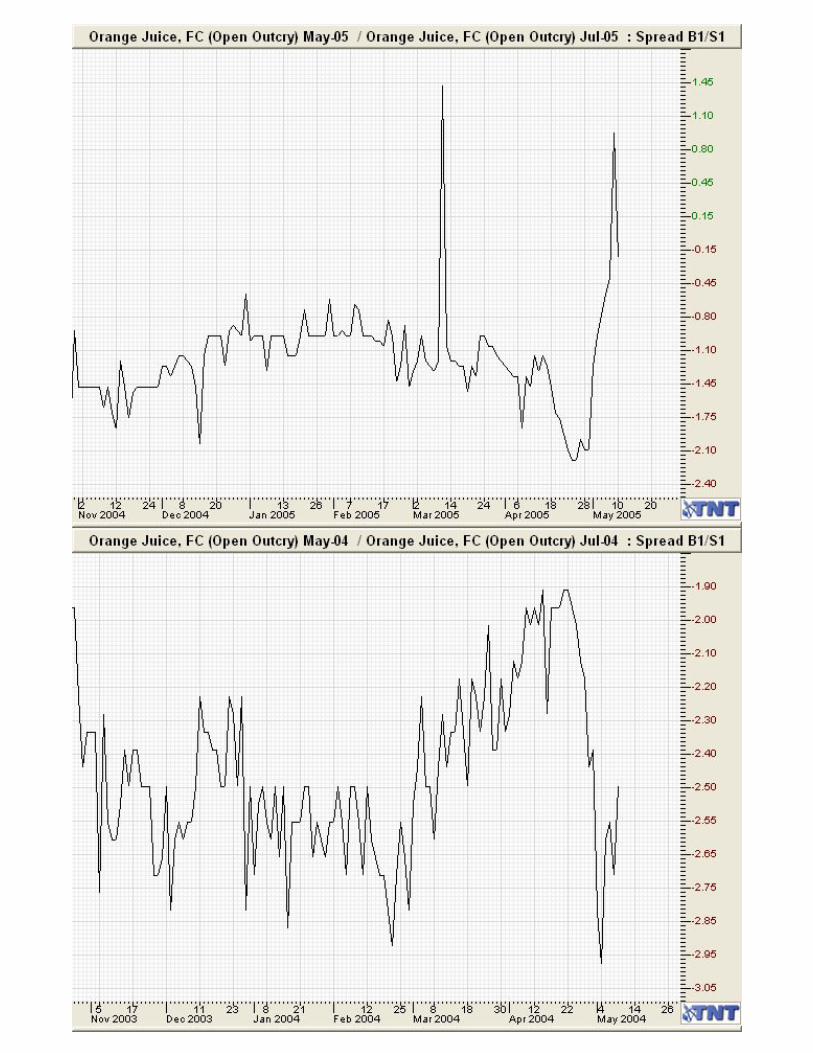
May Orange Juice / July Orange Juice
FUNDAMENTAL The crop year for oranges runs from December 1 through November 30. Harvest in Florida begins in December and is typically completed by the middle of June. The supply of frozen concentrated orange juice, on which futures are traded, depends primarily on yield, which in turn is a function of weather conditions. Since maximum production can be calculated assuming ideal temperature and moisture, speculation centers on how far below this level actual production will fall. Late winter freezes will ordinarily have a bullish impact on the market and cause this spread to widen. TIP Initiate: Middle of January
Close: Last week in March
TRICK After a prolonged period of sideways movement, this spread should begin to exhibit a slight upward bias near the first week in February. If it does, a support line connecting past lows can be drawn and positions should be maintained as long as this line is not broken on a closing basis. Although higher risk, additional contracts can be added on breaks that do not violate the long-term support line. December highs must be taken out before the position has a high probability of success. This should occur ideally some time in February, although occasionally it has happened as late as March. Orange juice futures exhibit little or no cyclic content, so construction and application of overbought/sold indicators can be difficult. TRAP Since the high price in March is frequently followed by a brief but sharp correction, it is better to take profits as the market enters an overbought condition, rather than waiting for it to reverse direction. There is little consistency after this reversal, so carrying positions later in the year is not advised.


Spread 22
July Cotton / December Cotton
FUNDAMENTAL The cotton crop year in the United States runs from August 1 through July 31. Planting begins in March and harvest is generally completed during December. The July contract is the last of the old crop year and December is the first of the new crop year. This “old crop/new crop” spread, therefore, is subject to fluctuations between crop years. Full carry is approximately 300 points, and the spread is expected to reach nearest this level when demand is low and expectations for the harvest are high. This typically occurs during December or January. The USDA Cotton Planting
Intentions Report, issued after the first of the year, should be monitored for the expected size of the new crop.
TIP Initiate: Last week in March
Close: Middle of June
TRAP The spread is subject to high volatility and should only be entered after indication of an upward turn in an oversold market. Indicators to measure this condition should use a period of approximately nine days, which is equal to one-half the length of the trading cycle for cotton. Due to the possibility of sharp reversals, additional positions should not be entered on breaks. If the chart has formed successively lower highs form November through January, a line connecting these represents resistance during the first few months of the new year. HISTORICAL It is not uncommon for the break, which often begins in March, to continue through the first week in April, and for that reason a position should be entered only once it appears the decline has ended. If the spread moves favorably, there will still be sufficient profit potential even if some of the upside has been missed.


Spread 23
May Lumber / July Lumber
FUNDAMENTAL Lumber production is largely unaffected by seasonal considerations, since most mills can operate on nearly a continuous basis as warranted by demand and reflected by price. Volatility is primarily a function of consumption, which is indicated by such factors as interest rate and new housing starts. The bull side of this spread has behaved well historically, because the demand for lumber increases with the usual expansion in new construction during warmer weather. In addition to domestic demand, signs of foreign consumption are also significant, since the United States continues to export plywood, lumber, and logs internationally. TIP Initiate: First week in January
Close: Middle of March
TRAP Substantial volatility is possible with this position as the demand for lumber varies. The spread tends to move in one direction for more than a few days once it begins, and this phenomenon is true during both primary and corrective phases. Although lumber has a short-term trading cycle of approximately 19 days, oscillators and other overbought/sold indicators generally prove unreliable due to the large fluctuations that can occur. As a result of this volatility, profits should be taken when the spread still appears strong, since reversals of even one day can be substantial. It is preferable to enter positions only after the chart begins to move higher following a decline. Greatest strength occurs when the nearby month trades at a premium to the deferred, and the position should be initiated only if the two contracts are trading near or above even. Never fade a limit up move in lumber.

