traffic archive data management system
TRANSCRIPT

Centre of Excellence in Urban Transport
IIT Madras
Traffic Archive Data Management System
A Study on the Feasibility of Implementation and Operation in Indian Urban Areas
D Sharan
Gitakrishnan Ramadurai
Transportation Engineering Division
Department of Civil Engineering
October 2011
This work was carried out as part of the activities in the Centre of Excellence in Urban Transport at IIT
Madras sponsored by the Ministry of Urban Development. The contents of this report reflect the views of
the authors who are responsible for the facts and the accuracy of the data presented herein. The contents
do not necessarily reflect the official views or policies of the Ministry that funded the project or IIT Madras.
This report is not a standard, specification, or regulation.
ii
Traffic Archive Data Management System
A Study on the Feasibility of Implementation and Operation in Indian Urban Areas
D Sharan
Project Officer
Department of Civil Engineering
Indian Institute of Technology Madras
Chennai 600 036, INDIA
E-mail: [email protected]
Dr. Gitakrishnan Ramadurai
Assistant Professor
Department of Civil Engineering
Indian Institute of Technology Madras
Chennai 600 036, INDIA
Ph : 91 44 2257 4298, Fax: 91 44 2257 4252
E-mail: [email protected]
October 2011

iii
Preface
Most successful manufacturing industries have designed their production process
around the concepts of lean manufacturing and just-in-time production. This has enabled higher
levels output, all the while using the least possible resources, resulting in greater efficiency and
larger profits. One of the major limitations in implementing this strategy to the field of
transportation engineering has been a lack of data about the traffic demand patterns and an
unpredictability of the consumer behavior, in this case, the road users. As a result, adding
capacity to the transportation system, in the form of additional lanes or other infrastructure
improvements have been the only solutions to alleviating congestion. But, the emergence of
Intelligent Transportation Systems (ITS) solutions to transportation problems has enabled traffic
engineers to improve the efficiency of the transportation system.
A Traffic Archive Data Management System (ADMS) is an ITS solution, which provides
traffic engineers the ability to store historical traffic data and later analyze and visualize this data
to produce meaningful conclusions. Thus, an ADMS is a decision support tool for traffic
engineers and policy-makers, helping in every decision making process ranging from the
operational level, to the tactical and the strategic level.
This study, examines the feasibility of implementing an ADMS for Indian traffic
conditions. The various technological aspects and the financial aspects involved in the
implementation of such a system are studied and explained in the various sections of this
report. Based on a literature review, a set of requirements for the system have been
recommended. A high-level design of the system has also been proposed, outlining the different
components of the ADMS and their interactions. Finally, potential applications for the ADMS
have been explored to illustrate the advantages of implementing and operating such a system.
iv
Acknowledgements
This study on the feasibility of a Traffic Archive Data Management System was
completed as part of the activities at the Centre of Excellence in Urban Transport (CoE-UT), IIT
Madras, sponsored by the Ministry of Urban Development, Government of India. We thank the
Ministry of Urban Development for sponsoring the CoE-UT at IIT Madras. We also thank the
Director, Dean (Industrial Consultancy & Sponsored Research), the Head of the Department,
Department of Civil Engineering for their support and guidance to the Centre. We thank the
Centre Coordinators for providing us the opportunity to work on this project.
We also thank the following individuals (and their organizations) who provided
information about the general characteristics of their ADMS,
Comune di Bologna (Municipality of Bologna, Italy), Italy: Mr. Cartolano Fabio
Istanbul Metropolitan Municipality, Turkey: Mr. Batuhan Altun
Rijkswaterstaat-Centre for Transport and Navigation, The Netherlands: Mr. Frans Griens
Roads and Transport Authority, Dubai: Mr. Sheikh Zakir Hussain
Traffic Centre Flanders, Belgium: Mr. Jean-Pierre Vijverman
Transportation Research Institute – Technion on behalf of the Tel Aviv municipality,
Israel: Dr. Ayelet Galtzur
University of Illinois at Chicago, United States: Dr. John F Dillenburg
v
Table of Contents
1. Introduction ........................................................................................................................ 2
2.Background ......................................................................................................................... 2
2.1. What is an Archive Data Management System? ......................................................... 2
2.2. Uses and Applications of an ADMS ............................................................................. 3
3.Literature Review………………………………………………………………………………. 5
3.1. Archive Data Management Systems in Operation ....................................................... 5
3.1.1. PeMS - California ........................................................................................... 5
3.1.2. ADMS – Virginia ........................................................................................... 10
3.1.3. Portal – Oregon ............................................................................................ 13
3.1.4. OASIS - South Korea ................................................................................... 14
3.1.5. Dalili - Dubai ................................................................................................. 16
3.1.6 Other systems . ............................................................................................ 18
3.2. ITS Standards ............................................................................................................. 21
3.2.1. National ITS Architecture - U.S. ................................................................... 21
3.2.2. UTMC - U.K. ................................................................................................. 24
4.Data Description………..………………………………………………………………………27
4.1. Map Data ..................................................................................................................... 27
4.2. Transit Data ................................................................................................................. 28
4.3. Traffic (Highways) Data .............................................................................................. 32
4.4. Traffic (Arterials) Data ................................................................................................. 33
4.5. Construction Data ....................................................................................................... 34
4.6. Incident Data ............................................................................................................... 34
4.7. Weather Data .............................................................................................................. 35
4.8. Socio-economic Data .................................................................................................. 35
5.Archive Data Management System – Design……………………………………………… 37
5.1. ADMS - Requirements ................................................................................................ 37
5.2. ADMS - Data Design .................................................................................................. 38
5.3. ADMS - System Design .............................................................................................. 39
5.3.1. Input Layer ................................................................................................... 42
5.3.2. Data, Programs Layer .................................................................................. 53
5.3.3. Output Layer ................................................................................................ 55
6.Estimated Costs………………………………………………………………………………..57

vi
6.1. Set-up Costs ............................................................................................................... 57
6.1.1. Hardware Set-up Costs ................................................................................ 58
6.1.2. Software Set-up Costs ................................................................................. 60
6.2. Operational Costs ....................................................................................................... 60
6.3. Upgrade Costs ............................................................................................................ 61
7.Applications of ADMS – Indian Traffic Scenario……………………………………………63
7.1. Recommending Infrastructure Improvement Projects to the Worst Recurrent
Bottlenecks .................................................................................................................. 63
7.2. Studying the Impact of Infrastructure Improvement Projects on Operational Efficiency
..................................................................................................................................... 64
7.3. Improving the Efficiency of Operations of the Transportation System ...................... 65
7.3.1. Traffic Signals .............................................................................................. 66
7.3.2. Transit .......................................................................................................... 66
7.4. Advance Traveler Information System – Highway users ........................................... 66
7.5. Advance Traveler Information System – Transit users .............................................. 68
7.6. Environmental Analyses ............................................................................................. 68
7.7. Recommend Improvement Projects to Accident-prone Road Sections .................... 69
7.8. Emergency Management ............................................................................................ 69
7.9. As a Resource for Traffic Research ........................................................................... 70
7.10. Commercial Applications ............................................................................................ 70
7.10.1. Applications for Third-Party Value Added Resellers ................................. 70
7.10.2. Applications for Logistics Service Providers .............................................. 71
7.11. A Vision for the Future ................................................................................................ 71
7.11.1. Mobile Phone Service Providers ............................................................... 71
7.11.2. Commercial Traffic Information Providers ................................................. 72
8.Vision for the Future……………………………………………………………………………75
8.1. Inter-vehicular Communication & Communication with the Infrastructure ................. 75
8.2. Congestion Pricing ...................................................................................................... 75
8.2.1. Network Level .............................................................................................. 75
8.2.2. Regional Level ............................................................................................. 76
8.3. VMT (Vehicle Miles (Kilometers) Travelled), Vehicle Type Based Taxation ............. 76
8.4. Increased carpooling due to widespread use of social networks .............................. 76
8.5. Multi-modal transportation system.............................................................................. 80
8.6. Autonomous driving .................................................................................................... 80

vii
8.7. Personal Rapid Transit ............................................................................................... 80
8.8. Auctioning of Road Infrastructure - Private Toll Roads Operators ............................ 81
9.Summary ........................................................................................................................... 83
10.References ...................................................................................................................... 85
viii
List of Figures
Figure 3-1 PeMS - System Design Schematic ............................................................................... 6
Figure 3-2 A contour plot of speed (above) and a chart (below) showing the occupancy of
detectors over time to identify potential bottlenecks ...................................................................... 9
Figure 3-3 ADMS Virginia Project Implementation Procedure .................................................... 11
Figure 3-4 ADUS System Design ................................................................................................. 13
Figure 3-5 Sub-systems of the FALCON platform ....................................................................... 17
Figure 3-6 The U.S. National ITS Architecture - Transportation Layer ....................................... 23
Figure 3-7 UTMC's Logical Reference Model .............................................................................. 25
Figure 3-8 UTMC's Functional Reference Model ......................................................................... 25
Figure 4-1 Example of a transportation network .......................................................................... 28
Figure 4-2 Example of a VMS displaying transit information ....................................................... 29
Figure 4-3 Example of a system employing video image processing to identify traffic parameters
....................................................................................................................................................... 32
Figure 5-1 An illustration of the proposed Data Design of the ADMS ......................................... 40
Figure 5-3 Illustrations explaining the mechanism of operation of Induction Loop detectors and
an example of Induction Loop detectors installed in the field, ..................................................... 43
Figure 5-4 Photographs showing the installaiton of video capture devices installed in the field, 44
Figure 5-5 Illustrations explaining the mechanism of operation of magnetic detectors ............. 45
Figure 5-6 Illustration explaining the mechanism of operation of Bluetooth detectors ............... 47
Figure 5-7 PeMS California - Communication Network ............................................................... 50
Figure 5-8 A sample user-interface of the Freeway Performance Measurement System (PeMS)
10.4 enabling users to submit queries and view the results ........................................................ 55
Figure 7-1 A report generated in the Freeway Performance Measurement System (PeMS) 10.4
listing the top bottlenecks for a given period & given stretch of highway .................................... 64
Figure 7-3 A Variable Message Sign (VMS) in operation ............................................................ 67
Figure 7-4 An illustration generated in the Freeway Performance Measurement System (PeMS)
10.4 showing the travel time estimates for a section of a highway for the different periods of a
day ................................................................................................................................................. 68
Figure 7-5 A screen-shot of Google Maps displaying the traffic conditions on the roads of
Sydney .......................................................................................................................................... 72

ix
List of Tables
Table 3-1 Table comparing the salient characteristics of other existing ADMSs ........................ 20
Table 4-1 Table listing the different types of data that could be stored in the ADMS ................. 31
Table 6-1 List of components of the ADMS, specifications, their approximate costs and power
consumption .................................................................................................................................. 59
Table 8-1 Table listing the different types of data that could be stored in the ADMS for a likely
future scenario .............................................................................................................................. 79

1
Introduction & Background
2
Archive traffic Data Management System (ADMS) Prototype
1. Introduction
When adding capacity is not an option either due to financial constraints or due to
various other reasons, operating the transportation system efficiently is most often the only
solution in combating congestion. More and more transportation agencies are concentrating on
improving the efficiency of the transportation system and Intelligent Transportation Systems
(ITS) is at the fore-front helping achieve this objective. ITS is the use of computer and
communications technology in the field of transportation to improve the performance of the
system. There are a wide variety of ITS technologies that may be employed to achieve this
objective and this study is a primer for one such technology. This study analyzes the feasibility
of the implementation and operation of a Traffic Archive Data Management System (ADMS) in
urban areas in India.
Transportation systems are dynamic and human interaction with the system occurs
almost constantly. Efficiently operating such a system whose properties change dynamically is a
challenge, but the availability of data, both past and current will help traffic engineers make the
right strategic and operational decisions. With the current state of the computation and storage
technology, it is inexpensive and easy to store vast amounts of data and rapidly access this
data to make meaningful real-time use of the information. Besides examining the feasibility of
implementing and operating such a decision support system called the Traffic Archive Data
Management System, the study also aims to identify the issues in the Indian context given the
mixed nature of traffic. Guidelines regarding the design and specifications of such a system are
also outlined in this study.
2. Background
This section provides the basic information about the Archive Data Management System
concept and a few applications of such a system.
2.1. What is an Archive Data Management System?
The Archive Data Management System (ADMS) is a collection of hardware and software
that work together to store traffic flow data and other data relevant to the operations of the
transportation system. The ADMS, then provides engineers and other decision makers with
secure access to modify, analyze and retrieve the stored data and to visualize the results either
as charts, tables or maps. With sufficient data stored in the system, the ADMS becomes a very
efficient and essential tool to traffic engineers both in their operational and their strategic
3
decision-making process. Transit data such as the location, speed of the vehicles and the
through-put of the system, archived in the ADMS enable significant improvement in transit
operations as well. In addition to transportation data, a host of related data such as weather,
incident, construction and lane closures data enables engineers and researchers to analyze the
transportation system holistically.
The ADMS may also provide members of the public, access to this data with appropriate
restrictions on their level of access. The public may create custom routes in the system and may
receive periodic updates on the travel time, delays for those particular routes.
2.2. Uses and Applications of an ADMS
ADMSs have mostly been implemented in developed countries, where the traffic flow
can be generally characterized as homogenous, composed mostly of automobiles with an
occasional motor bike and/or truck. Given such traffic conditions, an ADMS may have the
following applications.
As a decision support tool for organizations in implementing infrastructure improvement
projects. Recurrent bottlenecks that have been identified along highways and arterials by
the ADMS can be targeted with improvement projects to reduce the delay in the system
As an evaluation tool for organizations after an infrastructure improvement project has
been implemented. The effectiveness of the infrastructure project in alleviating
congestion can be evaluated by conducting “Before-and-After” studies
As a system optimization tool for organizations in improving the efficiency of the
operations of the transportation system. Based on the traffic flows at a signalized
intersection, the timing of the signal can be optimized
As a backbone for an Advance Traveler Information System (ATIS). Variable Message
Signs (VMS) at bus stops or along the highway can be used to display valuable
information to travelers regarding travel times and an ADMS can provide this information
As a tool for improving the safety of a transportation system. Data related to the location
and timing of the occurrence of crashes in the system can be used to develop
improvement plans to improve the safety of transportation infrastructure
As an operational tool in case of emergencies. Alternate routes for emergency response
vehicles and general traffic flow can be identified
As a source of macro-economic data such as Vehicle Kilometers Traveled (VKT),
Vehicle Hours Traveled (VHT) and other information that are useful for planning and
economic analyses

4
Literature Review
5
3. Literature Review
In order to identify the best practices in implementing an ADMS, some of the successful
functioning systems from around the world were studied and their brief details are mentioned
here. The salient characteristics of these systems were identified and these characteristics were
used as a guide for the high-level design of the system that is proposed in the following sections
of this report. The common characteristics that were identified are listed in a later section. Most
of these systems have been deployed in developed countries, with mature transportation
systems, and they happen to have homogenous traffic flow conditions. In order for the proposed
system to suit Indian (heterogeneous or mixed) traffic conditions, certain changes were
warranted. These changes are discussed throughout this report as they arise. The various
systems from around the world that were studied, have been implemented adhering to a certain
set of standards established by a governing authority of their respective jurisdiction. These
standards were developed in the context of the implementation of Intelligent Transportation
Systems and some of these standards have been reviewed too.
3.1. Archive Data Management Systems in Operation
3.1.1. PeMS - California
The (Freeway Performance Measurement System (PeMS) is a state-wide ADMS in the
state of California. "The PeMS is a project to investigate various performance measures on the
freeway system. It is a joint effort by Caltrans, the University of California, Berkeley, and PATH,
the Partnership for Advanced Technology on the Highways."1 Caltrans (California Department of
Transportation) administers transportation projects in California through twelve Caltrans
transportation districts and each of these twelve districts is represented in the system. Data
collected from the freeways in these districts are grouped separately in the system and the
performance is analyzed in a similar manner. The development version of the system is hosted
by the University of California, Berkeley and when the features are mature, they are migrated to
the production version that is hosted by Caltrans.
3.1.1.1. System Design
Figure 3-1 gives the schematic of the design of the PeMS.1 The interactions between the
different components in the system and the flow of data can be identified from the schematic.
Data for the system is collected from various sources, that includes
Freeway sensors that collect traffic data
Weather reporting stations that collect the weather data

C
T
commun
databas
by the
offered
3.1.1.2.
T
aggrega
stored f
inductio
Call boxes t
These sou
nication net
ses within th
users, rese
online tools
Data Gr
Traffic data
ates this da
for each free
on loop sen
that collect
rces of da
twork, etc.,
he system a
earchers, an
s to perform
Figu
ranularity an
a from the f
ata to 5-min
eway lane.
nsors in the
incident dat
ata, along
form the co
after quality
nd transpor
various ana
ure 3-1 PeMS
nd Aggregat
freeway se
ute values.
Count and
e field. From
ta
with the o
omplete sys
y control. Fin
rtation offici
alyses on th
S - System D
tion
nsors is co
Data such
occupancy
m this data
other comp
stem. The d
nally, the da
ials through
he data.
Design Sche
ollected eve
as count, o
are the bas
, the system
ponents su
data is store
ata from the
h a web int
ematic
ery 30 seco
occupancy f
sic data tha
m calculate
uch as the
ed in the ap
e system is
terface and
onds and th
from the se
at are provid
es various m
6
e servers,
ppropriate
accessed
d they are
he system
ensors are
ded by the
metrics to

7
define the performance of the freeway system (In this process, the data is aggregated both
temporally and spatially). Some of the metrics imputed by the system are,2
Speed, based on the individual g-factors for each loop detector
o g-factors vary for each detector and are calibrated in the field based on the
prevailing traffic conditions. The g-factors help in obtaining speed of travel based on
the occupancy values
Vehicle Miles Traveled (VMT) for a given section of the freeway and for a given time
period
Vehicle Hours Traveled (VHT) for a given section of the freeway and for a given time
period
Delay (due to congestion) for a given section of the freeway and for a given time period
o This is calculated by identifying the time taken to travel a section under free-flow
conditions, the travel time is again calculated based on prevailing speed and the
delay is the difference in travel time if any
o The delay is calculated for different base speeds from 35 mph to 60 mph at
increments of 5 mph
Annual Average Daily Traffic (AADT)
Travel Time Index (TTI) as the ratio of the average travel time for all users across a
region to the free-flow travel time
3.1.1.3. Applications of the System
The PeMS is a mature system with a production version being operated and maintained
by Caltrans. Caltrans uses the PeMS to make operational as well as planning decisions. In
addition, since the system is a state-wide resource, many local government agencies that have
the responsibility of reporting the performance of the transportation system to the public, have
conducted analyses based on the data obtained from the PeMS.
"Caltrans managers can instantaneously obtain a uniform, and comprehensive
assessment of the performance of their freeways. Traffic engineers can base their operational
decisions on knowledge of the current state of the freeway network. Planners can determine
whether congestion bottlenecks can be alleviated by improving operations or by minor capital
improvements. Traffic control equipment (ramp-metering and changeable message signs) can
be optimally placed and evaluated. Travellers can obtain the current shortest route and travel
time estimates. PeMS can serve to guide and assess deployment of intelligent transportation

8
systems (ITS)."3 In addition specific instances of the application of the PeMS by Caltrans have
been listed3, they are,
Freeway Operational Analysis
o PeMS was used by Caltrans staff to analyze existing operating conditions in the
Westbound direction of I-10 freeway during the AM peak period. The traditional
approach to obtain performance data involves conducting floating car studies to
obtain speed and delay data
o This requires a minimum of two days field data collection with four person
teams/segment driving instrumented vehicles in three 10-mile segments. This
translates into 120 person hours
o PeMS provides both the input (volumes) and performance data (speed, delay, VMT,
VHT) for the study area. More importantly, the data can be analyzed over several
typical days. The entire analysis can be performed in less than one person day
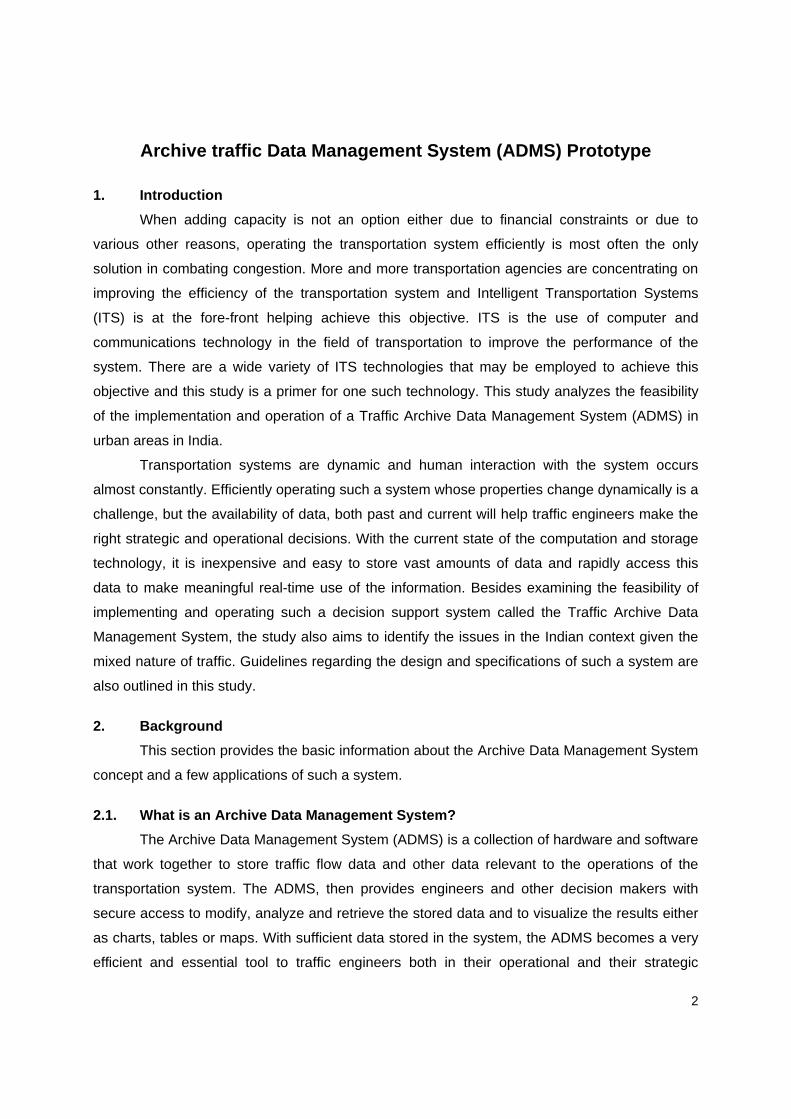
Bottleneck Identification and Analysis
o The Northbound direction of I-5 freeway in Los Angeles was analyzed. First, the
PeMS built-in speed and occupancy contour plots were used to pinpoint bottleneck
locations along the study section. Observations were performed for several
weekdays. This preliminary analyses indicated that a potential bottleneck exists at
postmile 29 (a weaving section)
o A key benefit of the PeMS is that the speed contour map is available for any time-
period, for any length of corridor 24 hours a day, 365 days a year. This allows
engineers to study mid-day congestion periods, weekend peaks, holiday
congestion, and alterations of traffic flow patterns due to extended construction road
closures
Level of Service (LOS) Characterization
o Caltrans and the California Air Resources Board (ARB) are conducting chase car
studies to derive speed correction factors to be incorporated into their emission
factors for air quality analysis
o The database included over 37 hours of chase car speed data collected in 250
segments in Los Angeles, the LOS was calculated from this data
Fig
gure 3-2 A coontour plot odetecto
of speed (abors over time
bove) and a e to identify
chart (belowpotential bo
w) showing tottlenecks
the occupan
9
ncy of
10
Incident Impacts
o By utilizing the PeMS plots of speeds and volumes across space it was possible to
determine the spatial and temporal impacts of the incident on the freeway, and the
time for recovery to normal operating conditions
Assessment of ATMIS Strategies
o Advanced Traffic Management and Information Systems (ATMIS) are used to
manage freeway congestion. Examples include ramp metering, changeable
message signs, and incident detection
o PeMS can be used to analyze delay for any section of freeway, and the
effectiveness of ramp metering
3.1.2. ADMS – Virginia
"The Federal Highway Administration (FHWA) and the Virginia Department of
Transportation (VDOT) sponsored the ADMS project. VDOT led the effort with the team
members being the University of Virginia (UVA) Center for Transportation Studies (CTS) and
George Mason University (GMU). UVA subcontracted the software development part of the
project to Open Roads Consulting, Inc. (ORCI). The equipment necessary for the project is
hosted at the Smart Travel Laboratory (STL), a joint facility of VDOT and UVA. Based on the
historic traffic, incident and weather data, the web-based system currently provides information
needed by the identified users of the system, in a variety of formats."4 Hence, similar to the
implementation of PeMS, the ADMS Virginia project was funded by a public agency and
developed by an educational/research institution.
The system was completed in a series of phases/builds to provide users with
incremental functionality. The procedure adopted in the implementation of the system is given
by the schematic in Figure 3-3.4
3.1.2.1. Data Granularity and Aggregation
"Speed, volume, and occupancy data is available. The user can query this database at
different temporal aggregations (e.g., 1, 5, 10, 15-minute intervals) and spatial aggregations
(e.g., station, corridor section or corridor). The STL at UVA currently hosts an archive of nearly 2
1/2 years of station traffic data. This data is continually sent from the Smart Traffic Center (STC)
to the STL so the ADMS Virginia system will have up-to-date traffic information. Data quality
assessments and data imputations are performed on the traffic records, and included as
additional fields in the database."5 Volumes, average speed, occupancy are some of the metrics
that can be queried from the system.

3.1.2.2.
W
of the s
Departm
P
o
o
E
Applicat
While illustr
system are
ment of Tran
Planning for
o In orde
Virginia
and we
o Stepha
empha
inciden
Emergency
Figure 3-3 A
tions of the
rating the im
discussed.
nsportation
r Operations
er to effectiv
a allows op
eather cond
any Hansh
sizes this im
nt response
Planning &
ADMS Virgin
System
mpacts of the7 Quotes fro
and other a
s
vely manag
perators to
itions, to im
aw, directo
mpact, “ADM
plans… It is
& Operations
nia Project Im
e ADMS Vir
om practici
agencies are
ge incidents
examine in
prove incide
or of the
MS Virginia
s a great ret
s
mplementati
rginia projec
ng transpor
e listed.7
, it is critica
ncident time
ent manage
Hampton
a provides a
turn on inve
ion Procedu
ct, five key f
rtation engi
al to learn f
e-lines, inclu
ement.
Roads Sm
a tool to be
estment.”
ure
functional c
neers at th
from the pa
uding traffic
mart Traffi
used to op
11
apabilities
he Virginia
ast. ADMS
c patterns
ic Center
timize our
12
o ADMS Virginia improves emergency planning by providing comprehensive data to a
wide user community, and by directly incorporating experience learned from
previous events.
o John Yorks, Traffic Engineer in the City of Hampton, relates this impact as follows: “
Our goals for the city’s signal control system include developing timing plans for
both planned and unplanned traffic events including concerts, holiday traffic,
hurricane evacuations, work zones, etc. Having a library of real data from VDOT
and other localities at our fingertips is invaluable in developing plans for special
events which impact both City and VDOT facilities.”
Regional Planning
o One of the problems that traditionally plagues effective regional transportation
planning is the lack of quality data. ADMS Virginia has made an immediate impact
on planning by relating ITS data directly to transportation planning models.
o Camelia Ravanbakht, Principal Transportation Engineer of the Hampton Roads
Planning District Commission expands on this impact, “As a regional planning
agency, we constantly are in need of many types of traffic data on a regional
level. The Hampton Roads MPO staffs use speed, volume and incident data from
ADMS Virginia to calibrate the long range transportation planning/air quality model
of the region."
Environmental Analyses
o Transportation agencies depend on air quality models to estimate the impacts of
proposed improvements on the environment.
o Amy Costello, lead on the VDOT Air Quality modeling program, describes the
impact of ADMS Virginia on her activities, “ For the first time in Virginia, the ADMS
system provides the customer with instant real-time and archived traffic data from
several systems. This quick, easy to use, reliable data source not only greatly
improves access to quality data, but also saves time and makes it easier to obtain
real data in a usable format.”
Performance Measurement
o Finally, as transportation agencies move to a focus on operations, it is essential that
mobility performance measures are available to measure congestion and the quality
of travel. ADMS Virginia directly computes a number of mobility performance
measures, allowing users to investigate these measures for locations and times of
their choosing.

o
3.1.3. P
S
maintain
federal
Architec
3.1.3.1.
F
characte
access
relationa
A daily a
o VDOT’
by the
interna
benefit
the too
Portal – Or
Similar to
ns the syst
level. 8 Mos
cture to ena
System
Figure 3-4
eristics are
data online
al database
and yearly b
s Stephany
ADMS has
l evaluation
of ITS and
ls I need to
regon
the previou
tem in conj
st of the d
able inter-op
Design
shows th
similar to th
e and the p
e managem
backup are
y Hanshaw d
s been inter
n at the low
d traffic and
do this.”
us cases, t
junction wit
design requ
perability wit
e design o
hose in othe
presence of
ent system
done on se
Figure 3-4
discussed th
rnal transpo
west level
d congestion
the Portlan
th other pu
uirements h
th other sys
of the AD
er systems.
f a backen
(RDBMS) a
erver at an o
4 ADUS Sys
his impact:
ortation sys
allows us t
n managem
nd State Un
ublic organiz
have been
tems in the
US and it
The simila
d database
and data fro
off-shore loc
stem Design
“The immed
stem perform
to begin to
ment strateg
niversity (P
zations at
derived fro
region and
can be o
arity in chara
e. The ADU
om ODOT i
cation and to
n
diate benefi
mance anal
determine
gies. ADMS
PSU) develo
the local, s
om the Nat
the country
observed th
acteristics is
US is a Pos
is in the XM
o DVD resp
13
t provided
lysis. This
the local
gives me
oped and
state, and
tional ITS
y.
hat some
s ability to
strgreSQL
ML format.
pectively.
14
3.1.3.2. Data Granularity and Aggregation
ADUS receives 20 second data from the sensors in the field which are aggregated to 5
minute data to allow faster processing. The 20 second data from the sensors are stored in the
databases of Oregon Department of Transportation (ODOT). This data is retrieved by the
ADUS, aggregated to 5 minute granularity, and stored in local databases. Aggregations are also
made to obtain data with 15 minute and 1 hour granularity. In addition, aggregation across lanes
is also performed.9 Different metrics are calculated for the different aggregation granularities
and the metrics are,
Volume
Speed
Occupancy
Count Readings
Vehicle Miles Travelled (VMT)
Vehicle Hours Travelled (VHT)
Travel Time
Delay
3.1.3.3. Next Steps
Some of the next steps and the proposed applications for the ADUS have been
mentioned as
Adding Data Sources in addition to existing sources such as loop detectors, global
positioning systems and manual human data collection
Addition of on-board GPS data from buses
GIS Integration
Vehicle Length Implementation
Travel Time Algorithm
Computer Aided Dispatch Database
3.1.4. OASIS - South Korea
Operations Analysis and Supportive Information System (OASIS) is a research
institution in South Korea and was developed by the Korean Expressway and the Transportation
Research Institute In November 2006. A brief introduction to the development of a traffic data
archive is given here.
3.1.4.1. Scope & Size

15
The OASIS data archive, "archives about 7GB of traffic data every day from various
sources, covering about 3,600 km of expressways in Korea. The data includes vehicle detection
system data (e.g., traffic volume, speed, and occupancy rate), toll collection system data (also
known as Hi-Pass system data) among others."10 The sources of these data includes Vehicle
Detection Systems (VDS), Toll Collection Systems (TCS), data from traffic incidents, traffic
operations, weather, and archived images from CCTV. "Korean Expressways is a 3,364 km
highway network with 3,118 Vehicle Detection Systems (VDS), 689 Variable Message Signs
(VMS), 262 tollgates (which collect information on 3.4 million vehicles), 2,237 CCTV cameras,
and 118 Automatic Vehicle Classification (AVC) tollbooths. The information collected from these
various systems is about 3GB daily. Also 10GB of images are archived daily from 100 CCTV
cameras."10 The following are the storage needs and characteristics of the system, "In January
2007, the Korean Expressway Corporation purchased 40TB of storage space to be used to
archive traffic data. The Database system was designed and developed in 2008 as a standard
for archiving the data. Currently we are developing a web-based user based application, which
is expected to be launched Dec 2009. Currently OASIS has 70 TB of storage space, where 30
TB are being used specifically as backup space."10
3.1.4.2. Data and Functions
The main sources of the traffic data archived by the system are10
VDS (Vehicle Detection System) data
TCS (Toll Collection System) data
Hi-Pass data (Automatic Toll Collection System)
Automatic Vehicle Classification Data
Accidents/Incidents Data
Variable Message Sign data
Weather data
Image data from 100 CCTVs
The main functions of the OASIS are10
Data processing and validation
Data query
Data analysis
Visualization

16
3.1.5. Dalili - Dubai
A questionnaire was prepared to request information regarding the characteristics of the
Dalili system.11 The information obtained from this questionnaire is summarized here. "Dalili" is
an Arabic word which translates to "My Guide" in English. The Dalili system is a Dynamic
Integrated Navigation System (DINS), which provides drivers with real time road traffic
conditions while they are driving. Dalili is an initiative of the Traffic and Roads Agency (TRA)
which is a part of the Roads and Transport Authority (RTA) of the Emirate of Dubai. The Dalili
system consists of in-car Dalili devices that can be purchased by road users. Through these in-
car, touch screen based devices, the system offers real time traffic events and alerts coupled
with navigation support, and turn by turn voice guidance in both English and Arabic.
3.1.5.1. System Design
The Dalili system is a part of the state-of-the-art Intelligent Traffic System Platform called
the "FALCON." The ITS platform FALCON includes several sub-systems such as the,
Urban Traffic Control (UTC) System, Split Cycle Offset Optimization Technique
(SCOOT) for traffic signal optimization
Closed-Circuit Television (CCTV) Surveillance and Monitoring System
Dynamic Message Sign (DMS) Control System
Lane and Speed Control System
Traveler Information System (Web, Kiosk, Dalili)
RADAR based Traffic Detection and Monitoring System
Video based Traffic Detection and Monitoring System
Figure 3-5 illustrates the interaction between the different sub-systems of the FALCON
platform
3.1.5.2. Data Granularity and Aggregation
The traffic data for the Dalili system is obtained from a variety of detectors that include
Induction Loops, Video Image Processing from Video detectors, Closed-circuit Television
(CCTV), RADAR detectors, and Global Positioning System (GPS) units installed on public
transit vehicles. The system has more than 100 detectors of each of these types of detectors
mentioned above. The granularity of the data collected by these detectors in the field varies
from one second for the Induction Loop detectors to more than one minute for other types of
detectors.

T
network
Network
Switche
(GB) wit
3.1.5.3.
A
updates
Accordi
1. T
2. I
3. A
4. A
The data c
ks to the Da
k (WAN), W
ed Telephon
th a capacit
Applicat
As mention
s to road u
ngly, the ap
Travel time
Incident Ma
Advance Tr
Advance Tr
collected in
alili databas
Wireless Wid
ne Network
ty to hold 2
tions of the
ned previou
users and t
pplications o
prediction
anagement
raveler Infor
raveler Infor
Figure
the field i
se. The com
de Area Ne
(PSTN). T
Terabytes (
System
usly, the Da
to alert du
of the system
rmation Sys
rmation Sys
e 3-5 Sub-sy
is transferre
mmunication
etwork (WA
The Dalili da
(TB) of data
alili system
ring inciden
m are,
stem - Varia
stem - Web
ystems of th
ed over dif
n networks
AN), Cellula
atabase has
a which can
's objective
nts and oth
ble Messag
based
he FALCON p
fferent type
employed a
r Network a
s a current
be upgrade
e is to prov
her occurre
ge Sign base
platform
es of comm
are Wired W
and a Leas
t size of 6 G
ed, when ne
vide real ti
ences of co
ed
17
munication
Wide Area
sed Public
Gigabytes
eeded.
me traffic
ongestion.

18
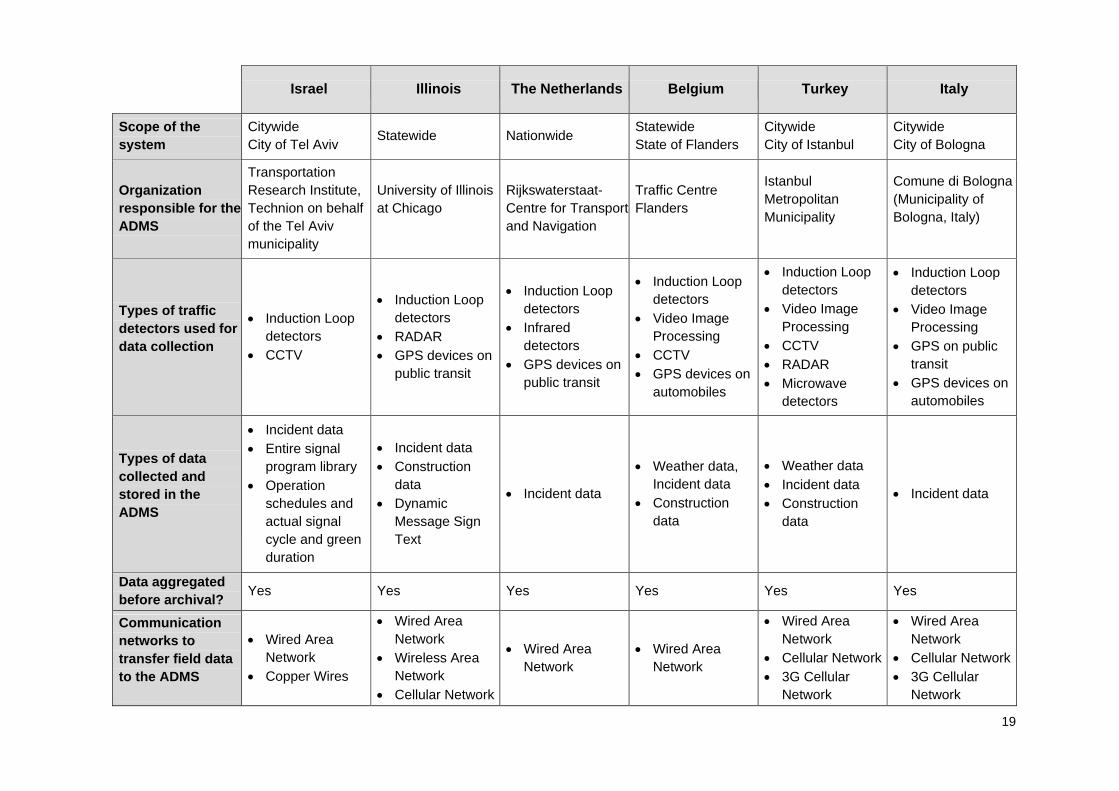
3.1.6. Other systems
The following Table 3-1 is a comparison of the characteristics of some of the other
existing ADMSs. The information was collected through an online questionnaire that was e-
mailed to the administrators of these systems.
19
Israel Illinois The Netherlands Belgium Turkey Italy
Scope of the system
Citywide City of Tel Aviv
Statewide Nationwide Statewide State of Flanders
Citywide City of Istanbul
Citywide City of Bologna
Organization responsible for the ADMS
Transportation Research Institute, Technion on behalf of the Tel Aviv municipality
University of Illinois at Chicago
Rijkswaterstaat-Centre for Transport and Navigation
Traffic Centre Flanders
Istanbul Metropolitan Municipality
Comune di Bologna (Municipality of Bologna, Italy)
Types of traffic detectors used for data collection
Induction Loop detectors
CCTV
Induction Loop detectors
RADAR GPS devices on
public transit
Induction Loop detectors
Infrared detectors
GPS devices on public transit
Induction Loop detectors
Video Image Processing
CCTV GPS devices on
automobiles
Induction Loop detectors
Video Image Processing
CCTV RADAR Microwave
detectors
Induction Loop detectors
Video Image Processing
GPS on public transit
GPS devices on automobiles
Types of data collected and stored in the ADMS
Incident data Entire signal
program library Operation
schedules and actual signal cycle and green duration
Incident data Construction
data Dynamic
Message Sign Text
Incident data
Weather data, Incident data
Construction data
Weather data Incident data Construction
data
Incident data
Data aggregated before archival?
Yes Yes Yes Yes Yes Yes
Communication networks to transfer field data to the ADMS
Wired Area Network
Copper Wires
Wired Area Network
Wireless Area Network
Cellular Network
Wired Area Network
Wired Area Network
Wired Area Network
Cellular Network 3G Cellular
Network
Wired Area Network
Cellular Network 3G Cellular
Network

20
Israel Illinois The Netherlands Belgium Turkey Italy
Data Transmission Protocols employed
Proprietary Protocols
Extensible Markup Language (XML)
Hypertext Transfer Protocol (HTTP)
Data Exchange (DATEX) II
File Transfer Protocol (FTP)
Real Time Streaming Protocol (RTSP)
Raw Binary Data
FTP Proprietary
Protocols
Database software SQL Server PostgreSQL ORACLE ORACLE SQL Server
SQL Server ORACLE MYSQL Microsoft Access
Traffic parameters calculated by the system
Flow Level of Service
per link Travel Time
Vehicle Miles Travelled
Vehicle Hours Travelled
Travel Time Speed Delay Flow Delay due to
congestion
Vehicle Hours Travelled
Speed Occupancy
Travel Time Speed Flow Occupancy
Travel Time Delay
Flow Queues at
signalized intersections
Modal Split
Applications of the ADMS
Bottleneck identification
Incident management
Planning analyses
Analyses of traffic management activities
Web based Advance Traveller Information System
Bottleneck identification
Incident Management
Planning analyses
Bottleneck analyses
Travel time prediction
Travel time prediction
Incident management
Advance Traveller Information System (ATIS) - Variable Message Sign
Bottleneck identification
Incident Management
ATIS - Variable Message Sign
Planning analyses
Traffic signal optimization
Table 3-1 Table comparing the salient characteristics of other existing ADMSs
21
3.2. ITS Standards
An ADMS is only one instance of the implementation of ITS and is usually just a
component, although a central and important component, of the entire ITS ecosystem.
Developed countries such as the U.S. which have a mature ITS implementation have defined an
ITS architecture as a guideline for the implementation of additional ITS components. Newer ITS
implementations are also expected to adhere to the standards specified in the ITS architecture.
Another example of an ITS architecture is the European FRAME Architecture. Although defining
such standards for the Indian conditions is beyond the scope of this study, the details of the
U.S. and European standards are reviewed here because, looking at the ADMS with the broad
perspective is more enlightening. It can also be noted from the review of these standards that
an ADMS is usually the central component of such ecosystems and the ADMS serves data and
information to all the other components.
3.2.1. National ITS Architecture - U.S.
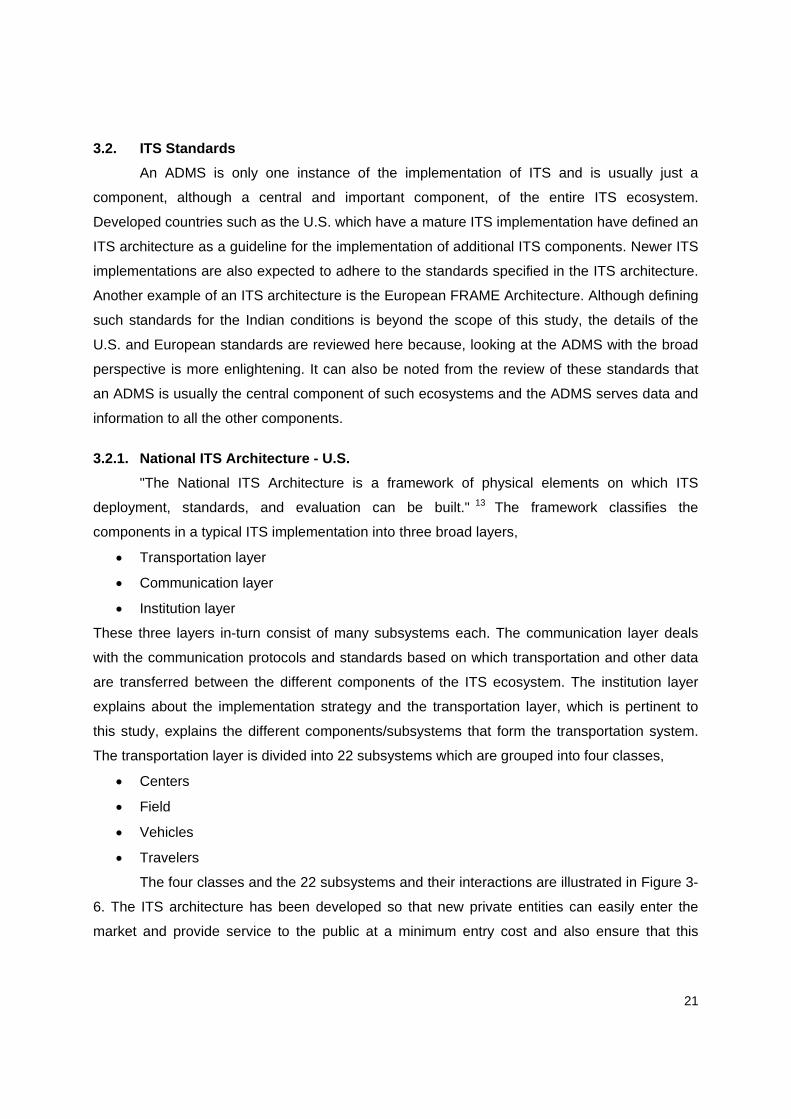
"The National ITS Architecture is a framework of physical elements on which ITS
deployment, standards, and evaluation can be built." 13 The framework classifies the
components in a typical ITS implementation into three broad layers,
Transportation layer
Communication layer
Institution layer
These three layers in-turn consist of many subsystems each. The communication layer deals
with the communication protocols and standards based on which transportation and other data
are transferred between the different components of the ITS ecosystem. The institution layer
explains about the implementation strategy and the transportation layer, which is pertinent to
this study, explains the different components/subsystems that form the transportation system.
The transportation layer is divided into 22 subsystems which are grouped into four classes,
Centers
Field
Vehicles
Travelers
The four classes and the 22 subsystems and their interactions are illustrated in Figure 3-
6. The ITS architecture has been developed so that new private entities can easily enter the
market and provide service to the public at a minimum entry cost and also ensure that this

22
service inter-operates with the other existing deployments. Thus, this also ensures competition
and choices for the implementation of a new technology.
Figure 3-6 also illustrates that "Archived Data Management" has been shown to be a
separate subsystem and is part of the "Centers" class of the architecture. This establishes the
importance of the functions of an ADMS in the ITS ecosystem. The interactions of the ADMS
with the other subsystems can also be identified from this schematic.

Figure 3-6 Thee U.S. National IITS Architecturee - Transportation Layer14
23
24
3.2.2. UTMC - U.K.
The Urban Traffic Management Control or UTMC programme was launched in 1997 by
the UK Department for Transport (DfT) with the main objective of facilitating development of a
more open approach to Intelligent Transport Systems (ITS) in urban areas.15 Similar to the
National ITS Architecture of the U.S. this standard also specifies standards that need to be
adhered to, so that the different implementations of ITS technology are able to communicate
and share information with each other.
The Technical Specification "specifies a framework of applicable standards for Urban
Traffic Management and Control (UTMC) systems, which will provide a cost effective and
flexible means to manage transport in urban areas to support a wide range of transport policy
objectives. The UTMC framework facilitates integration of transport systems, and enables
information to be provided to system for traffic management and as a means of influencing
traveller behaviour."16
In the context of the implementation of a new system, the Technical Specification also
directs that "A UTMC system shall have a documented Architecture which includes a schedule
of components and the communications links between them. In documenting this Architecture
the following reference models may be used:
The Logical Reference Model
The Functional Reference Model"16
Figure 3-7 and figure 3-8 provide the schematic of the organization of components in
both these models. Thus, UTMC proposes two models through which the vendor shall describe
the architecture of the ITS deployment. Each of these models have a unique characteristic of
representing the components in the architecture, but the broad underlying theme of these
models is that the logical reference model consists of a series of nodes while the functional
reference model consists of a series of layers in representing the system.

Figu
Figur
ure 3-7 UTM
re 3-8 UTMC
MC's Logical
C's Function
l Reference M
nal Referenc
Model
e Model
25

26
Data Description

27
4. Data Description
The presence of accurate and relevant data is very essential for the ADMS to be useful
for key decision-making processes. This section lists a set of requirements for the data that
would be stored in the system. The stored data may range from the core traffic data that are
observed from the field, to the socio-economic data that help in predicting the amount of travel
in the different regions. When compared to the other systems in the world, changes were
needed to suit the Indian scenario and these have been explained in the following discussion.
One of the core requirements of the system is the GIS capability and the ability to work
with and display the results through maps. Hence, each data point in the system needs to have
a temporal and spatial reference i.e., information regarding the time and the geographical
location for the data collected. Table 4.1 lists all the different types of data that could be stored
in the system and it also provides further details about this data, which includes the derived
information from the raw data, the time granularity of the data stored and the potential source for
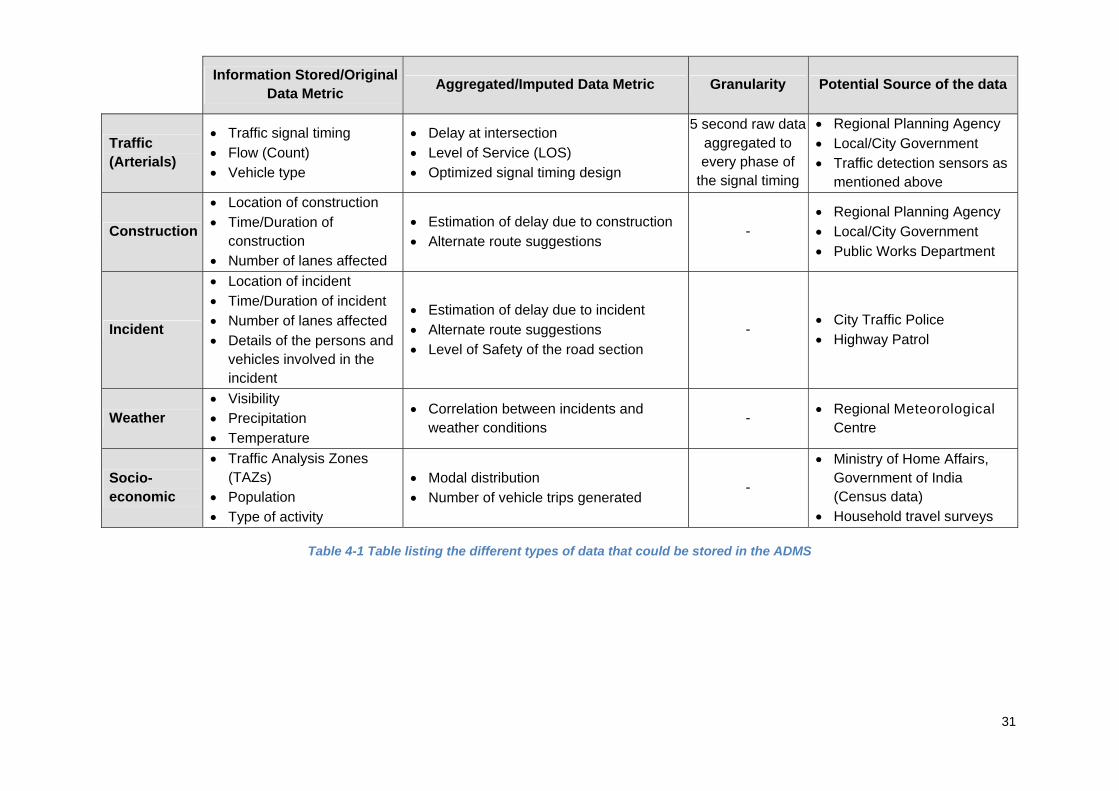
the data. The following is a detailed explanation of the same.
For each type of data stored in the system, further detailed information has been
provided. These are the raw data obtained from the field, mentioned in the table as
"Information Stored/Original Data Metric." The system aggregates this data to form other
meaningful quantities mentioned in the table as "Aggregated/Imputed Data Metric", the
granularity of the aggregation is mentioned in the table as "Granularity". Finally, the potential
sources for this data is mentioned in the table as "Potential Source of the data".
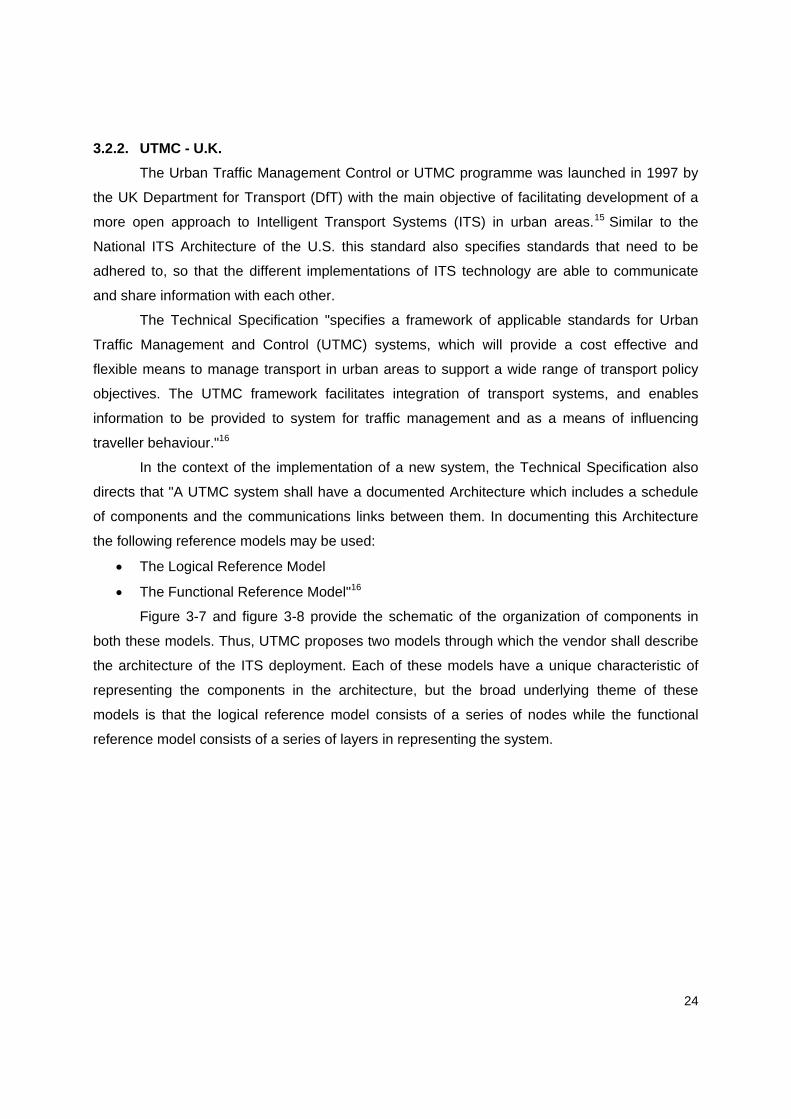
4.1. Map Data
As mentioned earlier, the ability to work with maps is a core requirement for the ADMS,
hence map data is one of the most important data in the system. Map data that could be stored
in the ADMS could include the physical locations of the different road segments and the urban
transit rail network that combined, forms the entire transportation network. Route information for
the buses of the transit service could also be added. Apart from this, the road configuration,
which includes the number of lanes of the road segment, design speed, lane width, and other
geometric information may be added. Similarly, Intersection configuration with the geometric
information regarding the intersections could be added. Road classification, indicating the
segment's functional classification/importance and the location of various detectors in the field
could also be added. The location of meteorological stations could be added so that weather
data can be easily represented in the system.
T
general
agencie
Police,
Meteor
The potent
ly administe
es are the, R
Regional
ological Ce
ial sources
er infrastruc
Regional/Lo
Planning A
entre.
Figure
for this m
cture projec
ocal Transit
Agency, Cit
e 4-1 Examp
map data co
cts and mai
Agency, R
ty Corporat
ple of a trans
ould be the
intain cartog
Regional Ra
tion/Local G
sportation n
e different
graphic rec
ilway Admin
Governmen
etwork18
public agen
cords. Some
nistration, C
nt and the
28
ncies that
e of these
City Traffic
Regional
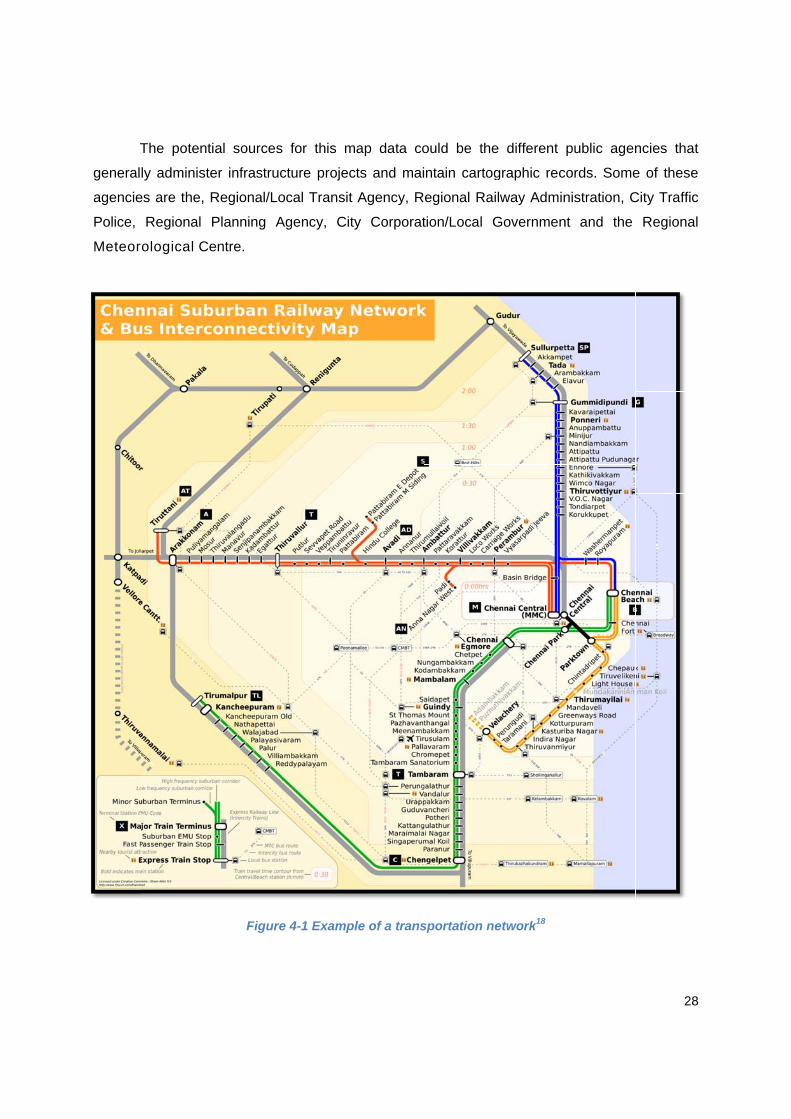
4.2. T
M
improve
major c
would b
also es
ADMS,
S
are upd
identifyi
informat
predicte
account
may als
Sign (VM
T
intervals
sources
installed
Transit Dat
Most of the
ement of op
component o
be very help
ssential that
also take in
F
Some mean
dated frequ
ng the num
tion. Based
ed travel tim
ting for pote
so be calcu
MS) at the s
The aggreg
s or anothe
s for transit
d in the tran
ta
e ADMSs a
erations alo
of the trans
ful in improv
t key inves
nto account
Figure 4-2 E
ningful data
uently, the
mber of pers
d on these
me and the
ential delay
ulated and t
stop.
gation gran
er similar f
t data cou
sit vehicles
around the
ong highway
sportation in
ving the per
stment or o
the transit p
Example of a
a from the tr
boardings
sons served
raw data,
buffer time
ys. Estimate
this informa
nularity cou
factor base
ld the Glo
or other sim
world that
ys, particula
nfrastructure
rformance o
operational
part of the tr
a VMS displa
ransit persp
and alight
d by the ve
imputed in
e for a veh
ed Time of
ation could
ld be 20 s
d on opera
bal Positio
milar Beaco
t have bee
arly the flow
e in India a
of the transp
decisions t
ransportatio
aying transit
pective are t
ings in the
ehicle/route
nformation t
hicle. The b
Arrival (ETA
be displaye
second raw
ational requ
ning Syste
on system in
en studied f
w of automo
and the pre
portation sy
that would
on infrastruc
t information
the transit v
e transit ve
, the transit
that could
buffer time g
A) at a dow
ed through
w data aggr
uirements.
m (GPS) t
nstalled.
focus main
biles. But, t
sence of tra
stem as a w
be made
cture.
n19
vehicle locat
ehicle whic
t route sche
be obtaine
gives the tr
wnstream tr
a Variable
regated to
Finally, the
transmitters
29
nly on the
transit is a
ansit data
whole. It is
using the
tion which
h help in
edule and
d are the
ravel time
ransit stop
Message
1 minute
e potential
s that are

30
Information Stored/Original
Data Metric Aggregated/Imputed Data Metric Granularity Potential Source of the data
Map
Transportation network (Road & Transit)
Road configuration Road classification Intersection configuration Detector locations Location of meteorological
stations
Distance between detectors -
Regional/Local Transit Agency
Regional Railway Administration
City Traffic Police Regional Planning Agency City Corporation/Local
Government Regional Meteorological
Centre
Transit
Vehicle location Boardings & Alightings Route schedule Route information
Travel time, Buffer time Total passengers served (throughput) Estimated Time of Arrival (ETA) at a
transit stop
20 second raw data aggregated
to 1 minute intervals
Global Positioning System (GPS)
Beacons
Traffic (Highways)
Flow (Count) Occupancy Vehicle type
Speed Density Delay Level of Service (LOS) Vehicle type distribution Vehicle Kilometres Travelled (VKT) Vehicle Hours Travelled (VHT) Travel time, Buffer time Average Daily Traffic (ADT) Monthly Average Daily Traffic (MADT) Annual Average Daily Traffic (AADT) Congestion parameters Alternate route suggestions
30 second raw data aggregated
to 5 minute intervals
Traffic detection sensors such as,
Induction loops Video detectors Radar detectors Infra-red detectors Magnetometers Bluetooth detectors Global Positioning System
(GPS) Cell phone triangulation
31
Information Stored/Original
Data Metric Aggregated/Imputed Data Metric Granularity Potential Source of the data
Traffic (Arterials)
Traffic signal timing Flow (Count) Vehicle type
Delay at intersection Level of Service (LOS) Optimized signal timing design
5 second raw data aggregated to every phase of
the signal timing
Regional Planning Agency Local/City Government Traffic detection sensors as
mentioned above
Construction
Location of construction Time/Duration of
construction Number of lanes affected
Estimation of delay due to construction Alternate route suggestions
- Regional Planning Agency Local/City Government Public Works Department
Incident
Location of incident Time/Duration of incident Number of lanes affected Details of the persons and
vehicles involved in the incident
Estimation of delay due to incident Alternate route suggestions Level of Safety of the road section
- City Traffic Police Highway Patrol
Weather Visibility Precipitation Temperature
Correlation between incidents and weather conditions
- Regional Meteorological
Centre
Socio-economic
Traffic Analysis Zones (TAZs)
Population Type of activity
Modal distribution Number of vehicle trips generated
-
Ministry of Home Affairs, Government of India (Census data)
Household travel surveys
Table 4-1 Table listing the different types of data that could be stored in the ADMS

4.3. T
T
highway
highway
transpo
vehicle
in the fie
Figure 4
T
heterog
from the
occupan
congest
calculat
Traffic (
can be
Traffic (Hig
The next ty
ys. This dat
y at reason
rtation syste
type metric
eld, but ther
4-3 Example
The vehicle
eneous flow
e raw data;
ncy values
tion parame
ted. Vehicle
(ADT), Mon
easily calc
ghways) Da
ype of data
ta is assume
nable dista
em. The ra
s. These ar
re might be
e of a system
e type metric
w conditions
; these inclu
. Delay, tra
eters can b
e Kilometres
thly Averag
ulated by s
ata
a useful to
ed available
nces from
aw data from
re the param
slight chang
m employing
c is being p
s. A host of
ude speed
avel time a
be calculate
s Travelled
ge Daily Tra
simple aggre
be stored
e from a ser
each othe
m the field
meters that
ges corresp
g video imag
proposed sp
f aggregated
and density
and buffer
ed based o
(VKT), Veh
affic (MADT
egation of t
in the ADM
ries of detec
er to provid
sensors co
most types
ponding to e
ge processin
pecifically fo
d and impu
y, both of w
time, Leve
on the spee
hicle Hours
) and Annu
the respect
MS is the
ctors/senso
de meaning
uld be the
of traffic de
each type of
ng to identif
or Indian con
ted informa
which can b
el of Servic
ed values
Travelled (
ual Average
tive quantitie
traffic data
ors installed
gful coverag
flow, occup
etectors can
f detector.
fy traffic par
nditions refl
ation can be
be obtained
ce (LOS) a
that were p
(VHT), Aver
Daily Traff
es. It is wo
32
from the
along the
ge of the
pancy and
n measure
rameters20
ecting the
e obtained
d from the
and other
previously
rage Daily
fic (AADT)
orth noting

that, ba
aggrega
T
intervals
the dat
Magneto
along hi
detector
vehicle/
4.4. T
S
ADMS.
sections
detector
dual pu
improvin
raw dat
different
traffic flo
delay a
Alternat
devices
develop
ased on th
ated informa
The aggreg
s or anothe
ta could be
ometer, all o
ighways to
rs, Global P
/user based
Traffic (Art
Similar to th
Arterial da
s of the arte
rs/sensors i
rpose of he
ng the effici
ta from the
t approache
ow through
at intersecti
tively, direct
that flow a
ped based o
e type of
ation mentio
gation gran
r similar fac
e Induction
of which are
produce the
Positioning
technologie
terials) Data
he traffic da
ta could inc
erials. The a
installed at
elping in the
ency of the
field could
es), Flow (C
h the interse
ions and t
t measures
as part of th
on the histor
detector us
oned here c
ularity coul
ctor based o
loops, Vid
e infrastruct
e data. In co
System (G
es.
a
ata from hig
clude the d
arterial data
the approac
signal timin
operation o
d be Traffic
Count) for t
ection. Base
he corresp
of delay ca
he traffic st
rical traffic in
sed in the
could be obt
ld be, 30 s
on operatio
deo detecto
ture side tec
ontrast, the
PS) and C
ghways, dat
data at the
a at intersec
ches of an i
ng design a
of the transp
c signal timi
the differen
ed on this
ponding Lev
an also be o
tream. An o
nformation f
field to co
ained direct
second raw
nal requirem
ors, Radar
chnologies
data could
ell phone tr
ta from the
intersection
ctions is ass
intersection
and supplyin
many of
studied,
collected
and one
collected
But, in In
the trave
not take p
along the
of arteria
portation sys
ing (green,
nt approach
raw data, im
vel of Serv
obtained thro
optimized s
for the differ
ollect traffic
tly from the
w data agg
ments. The
detectors,
and depend
also be obt
riangulation
arterials co
ns and the
sumed avail
. These det
ng the ADM
the existing
traffic data
from the
e of the
data is to
ndian traffic
el within the
place along
e arterials. H
al traffic data
stem in Indi
yellow and
hes and the
mputed info
vice (LOS)
ough GPS p
ignal timing
rent periods
c data, som
field as raw
regated to
potential so
Infra-red
d on devices
tained from
n technology
ould be sto
data from
lable from a
tectors wou
MS with traff
g systems
a had mos
e freeways/
applications
predict tra
c conditions
e urban ar
highways,
Hence, the
a is very im
ian urban ar
d red timing
e vehicle typ
ormation su
could be
probes and
g design ca
s of a day.
33
me of the
w data.
5 minute
ources for
detectors,
s installed
Bluetooth
y that are
red in the
mid-block
a series of
ld serve a
fic data. In
that were
stly been
/highways
s of the
vel times.
s, most of
reas does
but rather
collection
mportant in
reas. The
gs for the
pe for the
uch as the
obtained.
bluetooth
an also be

34
The aggregation granularity needs to be smaller than the case of the highways in order
to effectively capture the performance of the intersections because, the duration of the phases
is usually lesser than 5 minutes. Hence, the aggregation granularity could be 5 second raw data
aggregated to each phase of the traffic signal or another similar factor based on operational
requirements. The potential sources of information could be the Regional Planning Agency,
Local/City Government or any other agency responsible for the design of signal timing for
intersections in the region. The various traffic detection sensors discussed previously could
provide the flow data.
4.5. Construction Data
Repair & Rehabilitation of existing roads and construction of additional lanes are
inevitable and road closures mostly accompany them. The ADMS can play a very important role
in diverting the traffic by identifying alternate routes so that the incurred delay is kept to a
minimum. The traffic flow data during a road closure can also provide important data that could
help in analyzing the impact of the closure. The raw data from the field in the event of a closure
that could be stored in the ADMS are, physical location and extent of construction, time/duration
during which construction activity takes place, number of lanes affected due to the construction
taking place. Based on this, additional information that can be imputed are, an estimate of delay
due to the construction and alternate route suggestions.
Some of the potential sources for construction related data are the Regional Planning
Agency, Local/City Government and the Public Works Department.
4.6. Incident Data
Transportation safety is an area in which, the ADMS can play an active role by analyzing
the occurrence of incidents and collisions in the transportation system. The sections of the
system with high incidence of crashes can then be targeted with improvement plans. The
occurrence of an incident is similar to that of a construction where a road closure is caused and
similar analyses can be performed to that of the previous case. The raw data from the field and
the imputed information are similar to the previous case (construction data) where road closure
information is stored. In addition, the details of the involved parties are stored for historical
record and the Level of Safety of a section of a road is calculated based on the number of
incidents occurring in the given section relative to the other sections.
Some of the potential sources for the data are the City Traffic Police and the Highway
Patrol who can be requested to upload information to system as and when incidents occur in
their jurisdiction.

35
4.7. Weather Data
Weather could be a factor in the occurrence of incidents and in the reduced capacity of
the transportation system. Weather data, if stored in an ADMS, can be used in correlation
analyses to identify the impact of weather conditions on the safety and capacity of roads. Some
of the raw data from the field that could be stored are Visibility, Precipitation, and Temperature
for the different time periods of the day and from these, correlation between incidents and
weather conditions can be imputed.
The potential source for the weather data is the Regional Meteorological Centre.
4.8. Socio-economic Data
Rather than helping with the operational decision-making process, storing the socio-
economic data in the ADMS could aid in the long-term, strategic decision-making process. The
population and the prevailing land-use of a given region/location could be used to identify the
total number of trips originating and traveling to that location. The region/location with a
homogenous land use is called a Traffic Analysis Zone (TAZ), and the information regarding the
population, the type of activity or land-use whether commercial or residential could be stored in
the system. Based on this and the standard value for trip generation, the total number of
vehicles travelling to and from the TAZ can be calculated.
The potential sources for this data could be the Ministry of Home Affairs, Government of
India that collects and owns the Census data and Household travel surveys.

36
System Design

37
5. ADMS - Design
The previous chapter, "Data Description" clearly explains the different types of data that
are proposed to be stored in the system. The following is a discussion on the logical design of
the ADMS, outlining the different components and the relationship of these components with the
other components of the system.
5.1. ADMS - Requirements
After the extensive literature review that was conducted, a list of best practices and
characteristics of existing ADMSs were identified. In addition, few other requirements have been
formulated for the ADMS and the following is a list of the requirements that need to be met in
the implementation of an ADMS
1. The ADMS shall have a relational database for storing all the system data, with the
database management software having SQL compatibility
o The ADMS would store a wide variety of data such as traffic, weather, incident, and
map among others, from different sources and with different data formats. Hence,
the system needs to have a robust database for easy and fast storage, retrieval and
analysis of data
2. The ADMS shall have GIS capability for referencing the data to a location on the map
o Almost all of the systems reviewed, had the capability to associate data to a
geographical location. This helps in better visualization of data and easy referencing
within the system
3. The ADMS shall have temporal and spatial aggregation capabilities
o The traffic data from the field sensors usually have a very fine granularity in range of
20-30 seconds, which needs to be aggregated temporally to around five minute
intervals to be useful for meaningful analyses
o The traffic data from a series of a field sensors also needs to spatially aggregated to
whole/part sections of the road to identify the performance of segments of roads
4. The ADMS shall be a centralized archive with all the system data stored in the same
system location
o Even though the data for an ADMS is generated from different sources at different
locations, a centralized archive has been found to have some distinct advantages
over a decentralized archive
o Storing all the data in the same system helps in better management, security and
easier access of the data

38
5. The ADMS shall provide convenient online access to users through a web interface
o Almost all of the systems that were reviewed, provided online access of the data to
the users
o This option is easier and timely when compared to distribution of data through CDs
or other media
6. The ADMS shall have the ability to protect sensitive and classified data by offering
users with tiered level access by means of secure log-in sessions with user accounts
and passwords
7. The ADMS shall have a backup server at an off-site location to ensure that the data in
the system are not lost/damaged due to any disaster, failure at the primary location
8. The ADMS shall be scalable i.e., have the ability to handle changes as the system
grows. As the system matures, more detectors would invariably be installed to expand
the coverage, hence the ADMS should have the ability to incorporate new detectors
feeding data to the system
In this list of requirements, few of the requirements are specifically addressed in the
following discussion on the design of the system. Few requirements are not explicitly
addressed, because this study concerns the feasibility of implementation rather than being the
final design document of the ADMS. When a requirement is addressed, it is specifically called
out and when a requirement is not called out in the following discussion, it is implied that this will
be addressed during the actual final design of the system.
An ADMS is the interplay of hardware, software, and data to provide effective
capabilities to make meaningful analyses and decisions. The various programs that constitute
the software component of the system interact with the data stored in the system in the
operation of the system to analyze, store and retrieve the data. The interactions of the different
data components and the programs are given below in the following design sections.
5.2. ADMS - Data Design
The different types of data that are to be stored in the ADMS were discussed in the
previous chapter. With respect to Requirement No. 3, the design incorporates GIS functionality
to the system. The map data stored in the system would be central because, all the other types
of data that are to be stored in the system would interact with the map data for the storage,
analysis and retrieval operations. This has been represented in Figure 5-1. Instead of storing all
the map data in the system, commercial online and digital mapping services can be leveraged
for displaying the background map information. A few examples of these services include the
39
OpenStreetMap, Google Maps, Bing Maps, etc. These services typically provide the option of
embedding the maps, with location information overlaid on these maps, in third-party Web sites.
Storage of all the data in the system would be handled by a relational database which is
SQL-compliant; this caters to fulfill Requirement No. 1. Further detailed explanations are
provided in the following sections. The data stored would be modular with each type of data
stored in a specific individual "table" in the database referenced by the unique date/time
identifier key combined with the location of the collection of that data point. The modular design
of the system is to fulfill Requirement No. 8. The system is being proposed to collect data from
various sources and save this in a central database with all the data in the system backed up to
a secure location different from that of the primary system, these fulfill Requirement No. 2 and
Requirement No. 7.
5.3. ADMS - System Design
This section provides a bird's eye view of the design of the entire ADMS, with all the
high-level components represented. Very broadly, the system consists of three layers,
Input layer
Data, Programs layer
Output layer
As the name suggests, the Input layer is the collection of components that are
responsible for the collection and loading of data into the system. The Data, Programs layer is
the collection of programs and data stored in the system. The programs interact with the data to
produce the desired results. The Output layer is responsible for displaying the results in terms of
graphs, reports, maps, charts to the user after the completion of the analyses. Figure 5-2 is an
illustration of these different layers in the context of the entire system.
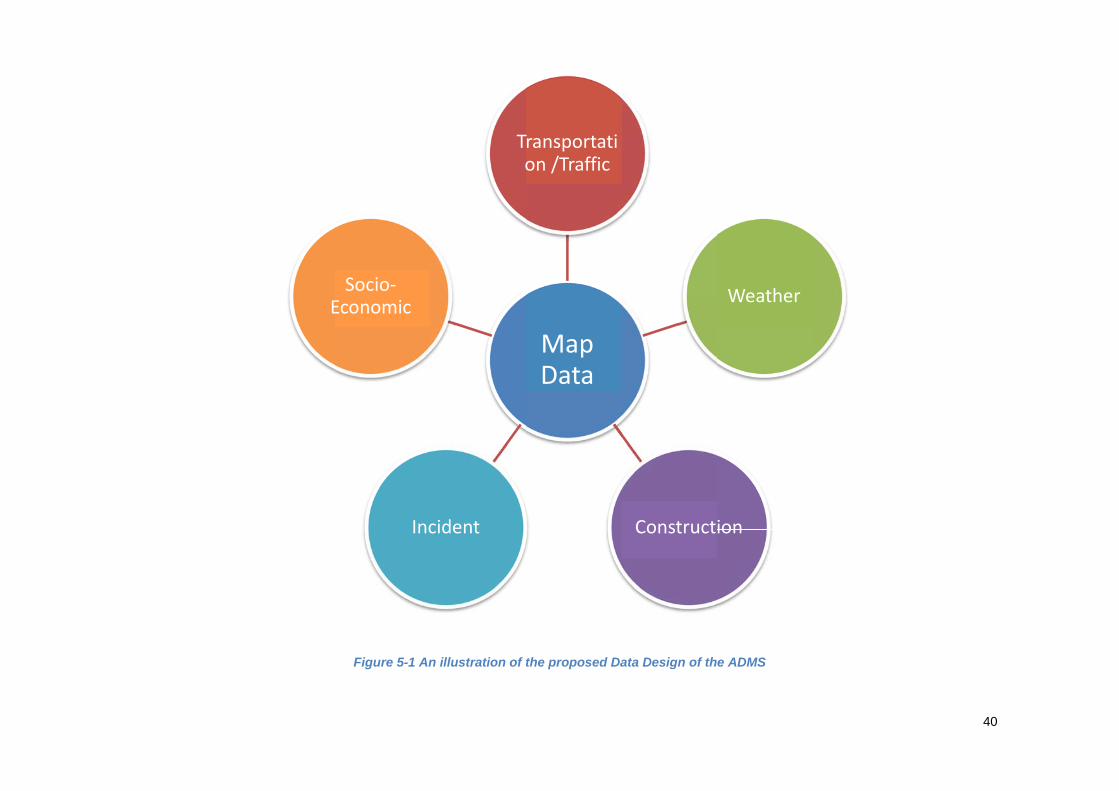
E
Figure 5-1 An
Inc
Socio‐Economic
n illustration of
To
cident
the proposed Da
Map Data
Transportation /Traffic
ata Design of th
Construct
e ADMS
Weather
ion
40

Inpput Laye
Figure 5-2 An
r
Dat
Da
illustration of th
Pr
Analys
ta Aggre
atabase
he proposed Sys
Data, rograms Layer
sis Modu
egation S
Adminis
stem Design of t
ules
Software
stration
the ADMS
Out
e
put Laye
41
er
42
5.3.1. Input Layer
The input layer is the collection of equipments in the field that collect the data, the
communication links that transmit the data to the system from the field and the quality control
programs that ensure that erroneous data is not stored in the system.
5.3.1.1. Data Collection Equipment
The data collection equipment in the field range from the vehicle detection sensors to the
controllers that process the information from the sensors and finally to the communication link
that transmits the data from the field to the ADMS. This entire set-up in the field is analogous to
the architecture of the human eye-sight. The vehicle detection sensors are analogous to the
eyes, the ADMS to the brain and the communication links to the neurons that connect the eyes
to the brain.
"Maximizing the efficiency and capacity of existing transportation networks is vital
because of the continued increase in traffic volume and the limited construction of new highway
facilities in urban, intercity, and rural areas." 21 Various vehicle detection technologies are
available in the market and each one of these technologies has its own advantages and
disadvantages. But the underlying objective of each of these technologies is to identify the
presence or absence of a vehicle and to identify other characteristics of the vehicle. The
following is a brief explanation on the different technologies and their suitability to Indian traffic
conditions.
5.3.1.1.1. Induction Loop Detectors
Induction loop detectors are one of the most common types of detectors used around
the world. An induction loop detector identifies the presence/absence of a vehicle by a
phenomenon known as induction. When a metallic object interferes with the magnetic field of an
object, an electric current is produced. In the case of an induction loop detector, a loop of wire is
embedded in the pavement surface and when any vehicle passes over the detector, a current is
produced in the loop. Each instance of the generation of current is counted as the passage of a
vehicle. Based on the amount of current produced, the type of vehicle that passed over the loop
can also be identified. The basic traffic parameters that are obtained from an induction loop
detector are count and occupancy. Occupancy is the percentage of time, the loop is occupied
by a vehicle, and all other traffic parameters are calculated from these two metrics.

Figure 5
T
widely i
incleme
detector
suscept
disconn
heterog
challeng
installed
that thes
5.3.1.1.2
U
they can
5-3 Illustratioe
These dete
nstalled. Th
ent weather.
rs thus redu
tible to high
nect the loo
eneous and
ge to the op
d on the roa
se detectors
2. Vide
Unlike the c
n be installe
ons explainiexample of I
ctors have
hey also pro
. The disadv
ucing pavem
her rates o
op. The co
d this comb
peration of t
ad surface a
s might und
eo Detectors
case of ind
ed without a
ing the mecInduction Lo
the advanta
ovide the ba
vantages a
ment life an
of failure be
mposition o
bined with
this type of
approximate
dercount veh
s
uction loop
any disrupti
chanism of ooop detecto
age of being
asic parame
re, the need
d disruption
ecause of t
of traffic flo
a lack of s
detectors. T
ely at the ce
hicles under
detectors,
ion to the fl
operation ofors installed
g cheap, te
eters neede
d to cut the
n of traffic d
the constan
ow on India
strict lane-fo
This is beca
enter of eac
r Indian traf
video dete
ow of traffic
f Induction Lin the field2
echnological
ed and are
e pavement
during insta
nt applicatio
an roads is
ollowing beh
ause, induct
ch lane, and
ffic condition
ctors are n
c or the pav
Loop detecto22,23
lly mature, a
relatively re
for installat
llation. They
on of load
s known to
havior, cou
tion loops a
d there is a
ns.
on-intrusive
vement. The
43
ors and an
and being
esistant to
tion of the
y are also
that may
o be very
ld pose a
are usually
possibility
e because
ey rely on
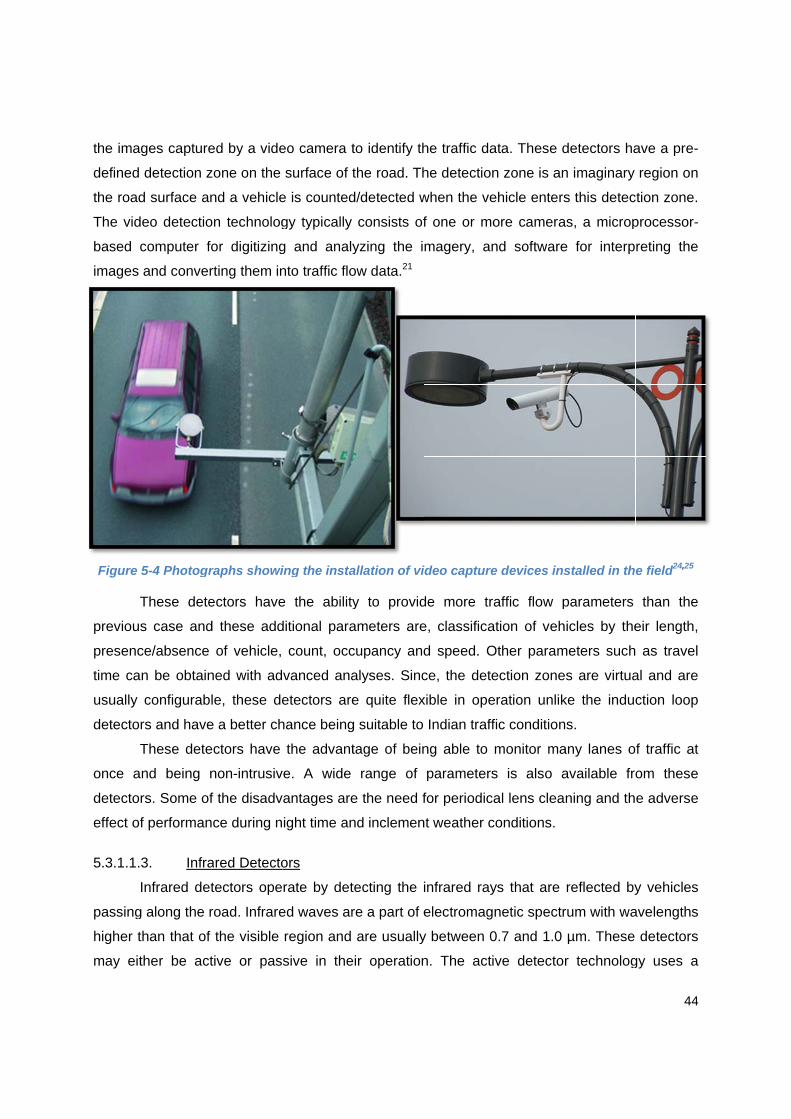
the imag
defined
the road
The vid
based c
images
Figure
T
previous
presenc
time ca
usually
detector
T
once a
detector
effect of
5.3.1.1.3
I
passing
higher t
may eit
ges capture
detection z
d surface an
eo detectio
computer fo
and conver
5-4 Photogr
These dete
s case and
ce/absence
n be obtain
configurabl
rs and have
These dete
nd being n
rs. Some of
f performan
3. Infra
Infrared det
g along the r
than that of
ther be act
ed by a vide
zone on the
nd a vehicle
on technolog
or digitizing
rting them in
raphs showi
ectors have
d these add
of vehicle,
ned with ad
le, these de
e a better ch
ectors have
non-intrusiv
f the disadv
ce during n
ared Detecto
tectors ope
road. Infrare
the visible
tive or pas
eo camera t
surface of t
e is counted
gy typically
g and analy
nto traffic flo
ing the insta
e the ability
ditional para
count, occ
vanced ana
etectors are
hance being
the advant
ve. A wide
antages are
ight time an
ors
rate by det
ed waves ar
region and
sive in the
to identify th
the road. Th
d/detected w
consists of
yzing the i
ow data.21
allation of vi
y to provid
ameters are
cupancy and
alyses. Sinc
e quite flex
g suitable to
tage of bein
range of
e the need f
nd inclemen
tecting the
re a part of e
are usually
eir operation
he traffic da
he detection
when the ve
f one or mo
magery, an
ideo capture
de more tra
e, classifica
d speed. O
ce, the dete
xible in ope
Indian traff
ng able to
parameters
for periodica
nt weather c
infrared ray
electromag
y between 0
n. The acti
ata. These d
n zone is an
ehicle enters
ore camera
nd software
e devices ins
affic flow p
ation of veh
Other param
ection zone
eration unlik
fic condition
monitor ma
s is also a
al lens clea
conditions.
ys that are
netic spectr
0.7 and 1.0
ve detector
detectors ha
n imaginary
s this detec
as, a microp
e for interp
stalled in th
parameters
icles by the
meters such
s are virtua
ke the induc
ns.
any lanes o
available fro
ning and th
reflected by
rum with wa
µm. These
r technolog
44
ave a pre-
region on
ction zone.
processor-
reting the
e field24,25
than the
eir length,
as travel
al and are
ction loop
f traffic at
om these
e adverse
y vehicles
avelengths
detectors
gy uses a
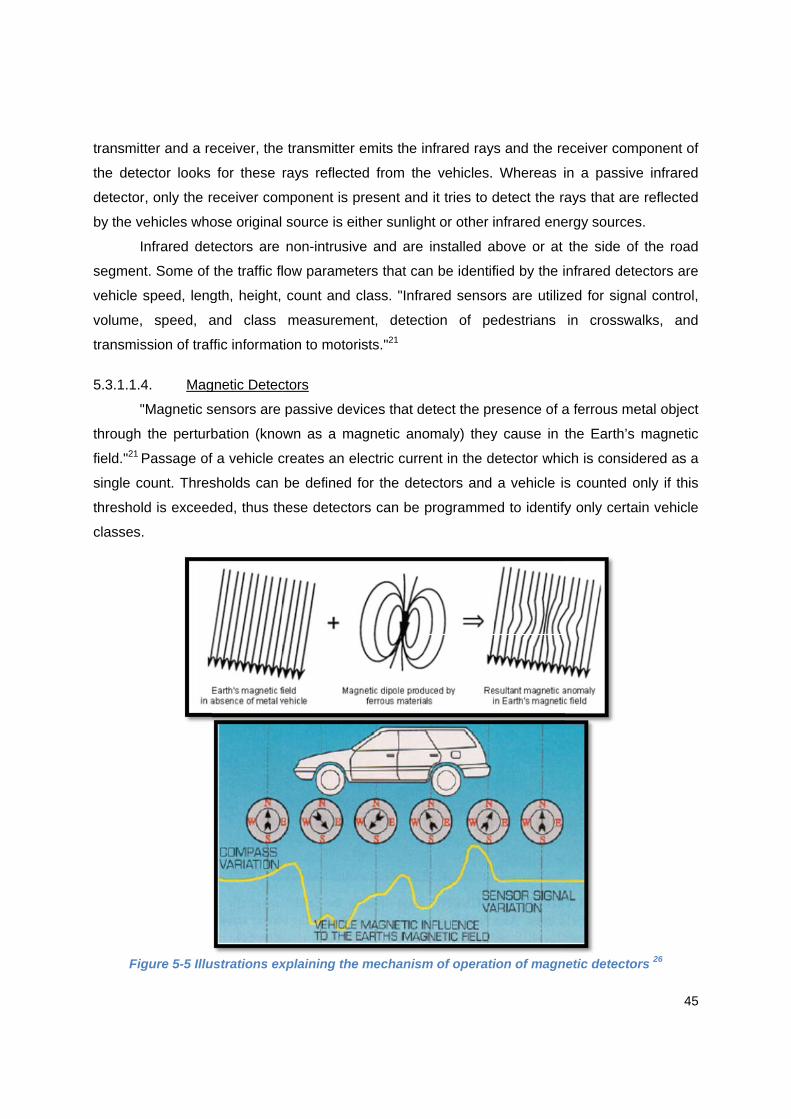
transmit
the dete
detector
by the v
I
segmen
vehicle
volume,
transmis
5.3.1.1.4
"
through
field."21
single c
thresho
classes
Fig
tter and a re
ector looks
r, only the r
vehicles who
Infrared det
nt. Some of
speed, leng
, speed, a
ssion of traf
4. Mag
"Magnetic s
the perturb
Passage of
count. Thres
ld is exceed
.
igure 5-5 Illu
eceiver, the
for these
receiver com
ose original
tectors are
the traffic fl
gth, height,
and class
ffic informat
gnetic Detec
sensors are
bation (kno
f a vehicle c
sholds can
ded, thus th
ustrations ex
e transmitter
rays reflect
mponent is
source is e
non-intrusiv
low parame
count and
measurem
tion to moto
ctors
passive dev
wn as a m
creates an e
be defined
hese detecto
xplaining the
r emits the i
ted from the
present and
either sunlig
ve and are
eters that ca
class. "Infra
ment, detec
rists."21
vices that d
magnetic ano
electric curre
for the det
ors can be
e mechanism
nfrared rays
e vehicles.
d it tries to d
ht or other i
installed a
an be identif
ared senso
ction of pe
etect the pr
omaly) they
ent in the d
tectors and
programme
m of operati
s and the re
Whereas i
detect the ra
infrared ene
above or at
fied by the i
ors are utiliz
edestrians
resence of a
y cause in t
etector whic
a vehicle is
ed to identify
ion of magn
eceiver com
in a passiv
ays that are
ergy sources
the side of
nfrared dete
zed for sign
in crosswa
a ferrous me
the Earth’s
ch is consid
s counted o
y only certa
netic detecto
45
mponent of
e infrared
e reflected
s.
f the road
ectors are
al control,
alks, and
etal object
magnetic
dered as a
only if this
ain vehicle
ors 26
46
Some of the disadvantages of this type of detectors are, these detectors are not able to
provide occupancy information, only the count of vehicles is available. These detectors are
intrusive and they involve cutting the pavement surface for the installation of the detector.
Furthermore, "application-specific software from its manufacturer is also needed to enable
stopped vehicle detection."21 Thus, these detectors are employed only for cases with special
needs.
5.3.1.1.5. Microwave Detectors
Microwave detectors are similar to the infrared detectors in their operating principle. The
only difference between these and the infrared detectors is that, the microwave detectors use
microwaves instead of infrared waves for their operations. These detectors try to identify the
microwave rays that are reflected by the passing vehicles. Microwaves used in these detectors
have their wavelength in the range of 0.4 inch and 11.8 inches. The frequency of the
microwaves for road-side applications may be limited by the government and this has to be
noted if the implementation of this type of detectors is considered.
Volume, speed, and vehicle length are some of the traffic flow parameters identified by
these detectors. There are different types of microwave detectors, with the ability to provide
different information, "Microwave sensors that transmit a continuous wave (CW) Doppler
waveform detect vehicle passage and provide measurements of vehicle count and speed. They
cannot detect stopped vehicles. Microwave sensors that transmit a frequency modulated
continuous wave (FMCW) detect vehicle presence as well as vehicle passage. They can detect
stopped vehicles and provide measurements of lane occupancy, vehicle count, speed, and
vehicle length grouped into several length bins."21
5.3.1.1.6. Bluetooth Detectors
The wide-spread use of mobile phones and the availability of Bluetooth technology in
almost all of these mobile devices have made the Bluetooth traffic monitoring technology
popular. "Bluetooth enabled devices can communicate with other Bluetooth enabled devices
anywhere from 1 meter to about 100 meters, depending on the power rating of the Bluetooth
sub-systems in the devices. The Bluetooth protocol uses an electronic identifier, or tag, in each
device called a Media Access Control address, or MAC address for short. The MAC address
serves as an electronic nickname so that electronic devices can keep track of who’s who during
data communications. It is these MAC addresses that are used as the basis for obtaining traffic
information."27 Thus, each Bluetooth enabled device can be specifically identified and with the

help of a
can be i
Fi
B
flow. Th
and hen
conditio
technolo
principle
other ve
used in
vehicle,
devices
used to
5.3.1.1.7
S
detector
a series of B
identified as
igure 5-6 Illu
Bluetooth d
he bluetooth
nce vehicle
ons. This tec
ogies men
e of conve
ehicle into a
n floating ca
the pers
equipped
collect vario
7. Mob
Similar to t
rs, this
Bluetooth d
s well.
ustration exp
etectors are
h devices th
class infor
chnology, an
ntioned bel
rting a reg
a probe ve
ar studies.
sonal autom
with Blueto
ous traffic p
bile Phone T
he previous
technolog
etectors alo
plaining the
e able to pr
hat are used
mation are
nd a couple
ow, work
gular autom
hicle that is
Similar to
mobiles tha
ooth techno
parameters.
Triangulation
s case of B
gy involve
ong the road
e mechanism
rovide coun
d to identify
not availab
e of other
on the
mobile or
s usually
a probe
at carry
ology are
n
Bluetooth
es the
ds, the chan
m of operatio
nt, travel tim
the traffic f
ble. This ma
nge in the lo
on of Blueto
me and spee
flow parame
ay be a dis
ocation of th
ooth detecto
ed data for
eters are an
advantage
47
he devices
rs 28
the traffic
nonymous
for Indian
48
identification and re-identification of mobile phones over time to measure the change in location
of these devices. The very high popularity of mobile phones in India makes this technology a
very viable candidate for use as traffic detectors. Location information of mobile phones is
identified by a process known as triangulation, where the signal from three mobile phone
service towers is used in combination to pin-point the location of the device. Based on the
change in the location of the mobile devices and hence the vehicles/users over time, the speed
and eventually a host of other metrics may be calculated. Privacy concerns may be biggest
hurdle in the implementation of this technology, but effective means of working around this
limitation can be devised.
The advantages of this technology are, installation of a large number of expensive
detectors is avoided because mobile phones are widely used. The mobile phone service towers
that have been installed to provide mobile phone service are utilized in this method, thus
eliminating need for the installation of detectors. There is also the possibility of cooperation with
mobile phone service providers in which case, extensive traffic detection can be achieved at a
very little marginal cost.
5.3.1.1.8. In-car Global Positioning System (GPS) Devices
This is another detection technology that is based on acquiring traffic data from regular
road-going automobiles, in essence treating them as probe vehicles. Global Positioning System
(GPS) devices are commonly used for navigation in automobiles. These devices also keep track
of the location information of the vehicles. Based on the change in location of the vehicles over
time, various traffic parameters can be obtained.
5.3.1.1.9. Global Positioning System (GPS) Devices in Transit Vehicles
Unlike in the U.S. and other developed countries, where the majority of the traffic on the
roads is automobiles, transit is a very important and vital mode of transportation in India. Hence,
the collection of data related to the operations of transit service and the archival of this data
becomes important. Accordingly, the proposed ADMS has been planned to accommodate
transit data. The Global Positioning System (GPS) devices on-board the transit vehicles that
collect transit data are an important type of data collection equipment. These devices reside on-
board the transit vehicle and they continuously and at small regular intervals, transmit the
location information of the transit vehicle. The location information could be the latitude-
longitude combination at every instant. The speed of the vehicle and hence the speed profile of
the transit vehicles may be either calculated by the device or in the ADMS, based on the change
in the latitude-longitude over time. Thus, the locations along the transit route, where most of the
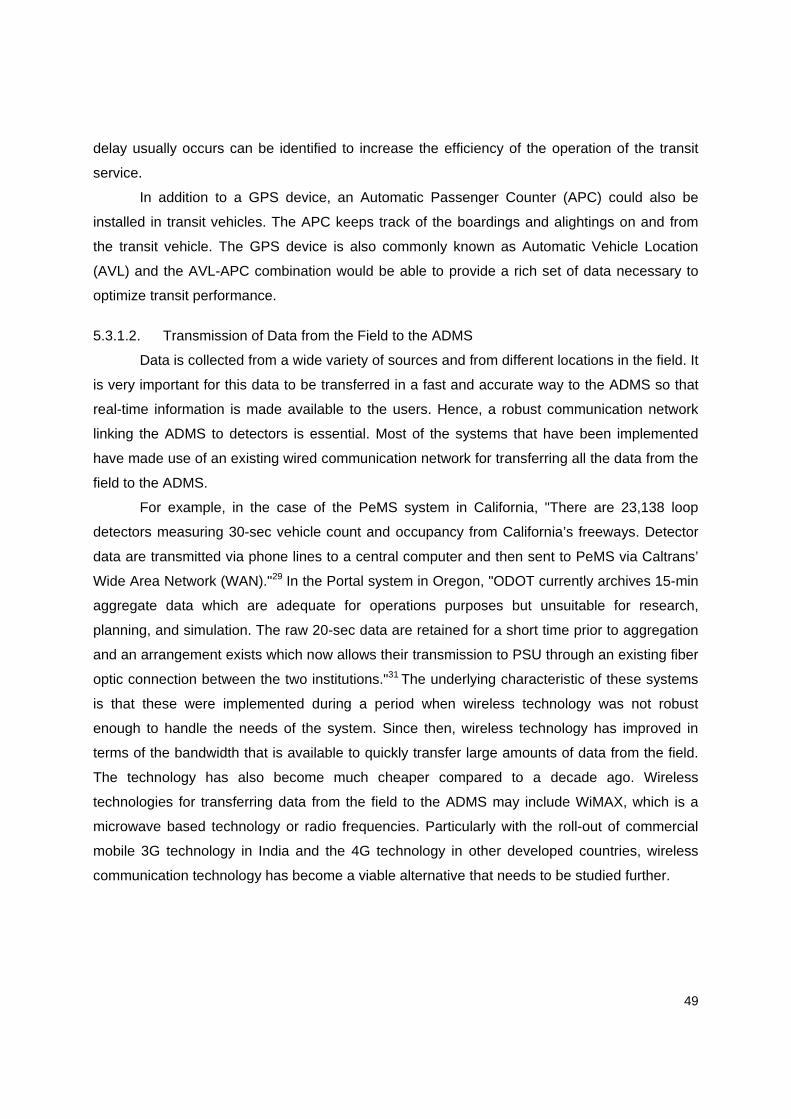
49
delay usually occurs can be identified to increase the efficiency of the operation of the transit
service.
In addition to a GPS device, an Automatic Passenger Counter (APC) could also be
installed in transit vehicles. The APC keeps track of the boardings and alightings on and from
the transit vehicle. The GPS device is also commonly known as Automatic Vehicle Location
(AVL) and the AVL-APC combination would be able to provide a rich set of data necessary to
optimize transit performance.
5.3.1.2. Transmission of Data from the Field to the ADMS
Data is collected from a wide variety of sources and from different locations in the field. It
is very important for this data to be transferred in a fast and accurate way to the ADMS so that
real-time information is made available to the users. Hence, a robust communication network
linking the ADMS to detectors is essential. Most of the systems that have been implemented
have made use of an existing wired communication network for transferring all the data from the
field to the ADMS.
For example, in the case of the PeMS system in California, "There are 23,138 loop
detectors measuring 30-sec vehicle count and occupancy from California’s freeways. Detector
data are transmitted via phone lines to a central computer and then sent to PeMS via Caltrans’
Wide Area Network (WAN)."29 In the Portal system in Oregon, "ODOT currently archives 15-min
aggregate data which are adequate for operations purposes but unsuitable for research,
planning, and simulation. The raw 20-sec data are retained for a short time prior to aggregation
and an arrangement exists which now allows their transmission to PSU through an existing fiber
optic connection between the two institutions."31 The underlying characteristic of these systems
is that these were implemented during a period when wireless technology was not robust
enough to handle the needs of the system. Since then, wireless technology has improved in
terms of the bandwidth that is available to quickly transfer large amounts of data from the field.
The technology has also become much cheaper compared to a decade ago. Wireless
technologies for transferring data from the field to the ADMS may include WiMAX, which is a
microwave based technology or radio frequencies. Particularly with the roll-out of commercial
mobile 3G technology in India and the 4G technology in other developed countries, wireless
communication technology has become a viable alternative that needs to be studied further.
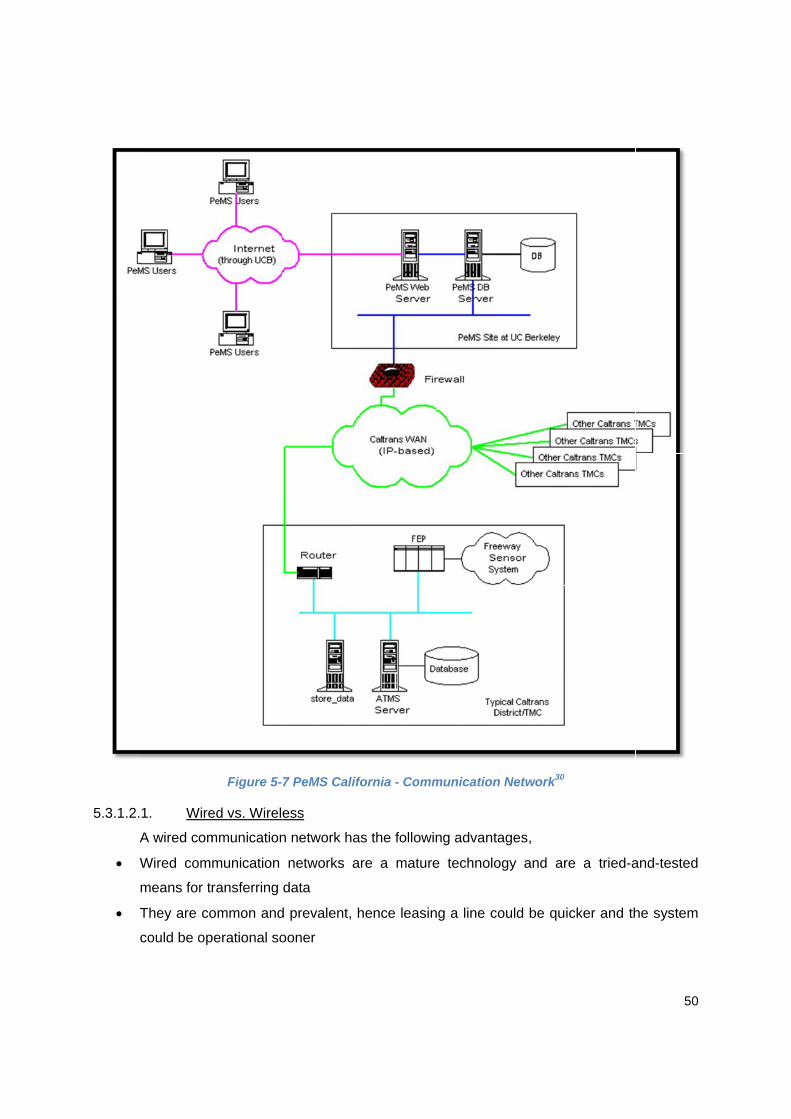
5.3.1.2.
A
W
m
T
c
1. Wire
A wired com
Wired com
means for tr
They are co
could be op
Figure 5-
ed vs. Wirele
mmunication
munication
ransferring
ommon and
perational so
7 PeMS Cali
ess
n network ha
networks a
data
d prevalent,
ooner
ifornia - Com
as the follow
are a matu
hence leas
mmunication
wing advant
ure technolo
sing a line c
n Network30
tages,
ogy and ar
could be qu
re a tried-a
icker and th
50
and-tested
he system
o
T
s
A
following
A
e
l
w
c
o
a
t
s
E
n
5.3.1.2.2
I
identifie
H
X
R
S
F
S
T
purpose
transfer
I
of ITS i
America
Commu
o 3G wire
base st
The bandw
system, hen
A wireless
g advantage
Addition of
easy, since
line connec
wired netw
coverage is
over the
available. W
to accomm
system
External dis
network bec
2. Data
In the revie
ed.1 They are
HTTP - Hyp
XML - EXte
RPC - Rem
SQL/NET -
FTP - File T
SOAP - Sim
The schem
e. Similarly,
r standard fo
In addition,
implementa
an Society
unications fo
eless netwo
tations may
idth for data
nce they cou
communic
es,
new detecto
e there is no
cting the d
work. In any
s usually p
years as
Wireless tec
modate such
sruptions to
cause, the b
a Transfer S
ew of the P
e,
pertext Tran
nsible Mark
ote Procedu
Structured
Transfer Pro
mple Object
matic in Fig
in the revie
or transferrin
certain stan
ations, spec
y for Tes
or ITS Proto
ork coverage
y have to be
a transfer is
uld be usefu
cation netw
ors to the sy
o need to i
detector to
y new ADM
lanned to b
new fun
chnology co
h future ad
o the service
base station
Specification
PeMS, a ho
nsfer Protoco
kup Languag
ure Call
Query Lang
otocol
Access Pro
ure 3-1 illu
ew of the P
ng the data
ndards have
cifically pert
sting and
ocol (NTCIP
e may not b
e installed in
s not limited
ul for transfe
work has th
ystem is ve
nstall a fixe
the existin
MS, detecto
be increase
nds becom
uld be easie
dditions to
e could be
ns are relativ
ns
ost of data
ol
ge
guage/
otocol
ustrates the
Portal system
between O
e been deve
taining to th
Materials
P) are some
be compreh
n some locat
d by techno
erring large
he
ry
ed
ng
or
ed
me
er
a
lower than
vely inacces
transfer pro
e use of a
m of Orego
ODOT and th
eloped and
he data col
(ASTM)
of the agen
ensive in re
tions
logy but on
amounts of
that for a w
ssible to ext
otocols and
specific pr
on, it was id
he Portal sy
widely adop
lection and
and Natio
ncies that h
emote areas
nly by the co
f data
wired comm
ternal eleme
d specificat
rotocol for
entified tha
ystem was X
pted for the
d archival o
onal Tran
have develo
51
s and new
ost for the
munication
ents
ions were
a specific
at the data
XML.
purposes
perations.
sportation
ped these

52
standards and are usually available for purchase. Some of these standards and their specific
purpose are,
ASTM E2665 - 08: Standard Specification for Archiving ITS-Generated Traffic
Monitoring Data32
ASTM E2259 - 03a: Standard Guide for Archiving and Retrieving ITS-Generated Data33
ASTM E2468 - 05: Standard Practice for Metadata to Support Archived Data
Management Systems34
NTCIP 1209: Object Definitions for Transportation Sensor Systems (TSS)35
5.3.1.3. Data Quality Checks
The quality and the accuracy of the raw data from the field is very important, because
this data is the basic information with which other aggregated data are calculated and stored in
the ADMS. But, the data from the detectors in the field is not always accurate. This could be
because of either faulty detectors or corruption during transmission from the field to the ADMS.
Hence, quality control measures at the input layer of the ADMS are essential before the data
enters the system. These would be a set of programs working real-time, with the objective of
identifying anomalous data as they are transmitted from the field. In addition to identifying and
excluding the erroneous data, it is also important to fill the void of missing data by imputing the
missing information to get an accurate estimate.
Some research is already available regarding the subject of quality control for ADMSs
and these are mostly based on the systems that were identified in the literature review of this
study. A comparison of the criteria for data validity and quality control procedures employed in
some of the existing ADMSs is provided in the report by the Texas Transportation Institute.36
Some of the commonly used validity criteria identified by the study are,
"Univariate and multivariate range checks – These criteria typically correspond to the
minimum, maximum, or range of expected values for a single variable or combination of
variables.
Spatial and temporal consistency – These criteria evaluate the consistency of traffic data
as compared to nearby locations (either across lanes, or upstream and downstream
monitoring locations) or previous time periods.
Detailed diagnostics – These criteria require detailed diagnostic data from traffic
detectors and typically cannot be performed with the original source data that is
collected and archived by traffic operations centers."36

53
Similarly, the diagnostic algorithm used in the PeMS to identify faulty detectors is
explained in the report titled "Detecting Errors And Imputing Missing Data For Single Loop
Surveillance Systems."37 These are good references and a useful starting point for the design of
quality control measures for the proposed ADMS. But it must be noted that the methodology
explained in the above-mentioned studies are based on the loop detector technology being the
prime source of detection data to the system. For other types of detectors and communication
network, the errors associated with the data might be different and appropriate changes would
have to be made to the validity criteria to accommodate this.
5.3.2. Data, Programs Layer
The Data, Programs layer consists of all the raw and aggregated data that is stored in
the ADMS and the programs/software that are developed to perform various analyses. The
various functions performed by the Data, Programs layer can be used to further classify this
layer into three sub-layers,
Database Administration - Bottom layer
Data Aggregation Software - Middle layer
Analysis Modules - Top layer
Figure 5-2 shows the arrangement of these different layers within the Data, Programs
layer.
5.3.2.1. Database Administration - Bottom layer
This layer consists of all the programs that are part of the relational database
management software. These programs would be part of the database management software
that is used as the base to store all the data. These programs would provide functionality such
as crash protection, disk management, internal data storage and retrieval. These programs
would be opaque and would not be developed while implementing the system. These are the
basic programs upon which all other data are stored and analyses performed, hence these
constitute the Bottom layer of the Data, Programs layer.
5.3.2.2. Data Aggregation Software - Middle layer
The raw data from the field would have a granularity in the level of seconds, probably 5 -
30 seconds. In order to perform any analyses, it is necessary to aggregate this data to larger
granularity. In addition, the data would be collected at the detector level in the field, and this has
to be aggregated to sections of the road/highway and the entire length of the road. Thus,
temporal and spatial aggregation programs are needed to aggregate the data to meaningful
54
granularities. These programs would have to be developed while implementing the ADMS and
these serve to fulfill Requirement No. 4. These programs would run continuously in order to
aggregate and store the data as they become available from the field.
The set of programs form the Data Aggregation Software interact with the data stored in
the system by the programs in the Database Administration layer. These sit on top of the
Bottom layer and hence form the Middle layer of the Data, Programs layer.
5.3.2.3. Analysis Modules - Top layer
Once the data is aggregated and stored at the required granularity, the users might wish
to perform a variety of analyses on this data. The entries listed in the "Aggregated/Imputed Data
Metric" column in Table 4-1 are some of the metrics that would be calculated by the programs in
the Analysis Modules. These programs use the data that is created by the Data Aggregation
Software of the Middle layer, hence these sit on top of the Middle layer to form the Top layer of
the Data, Programs layer. Some of the analyses modules that may be provided in the ADMS
are,
A bottleneck identification algorithm/program, designed to identify potential bottlenecks
in the system
A delay calculation program to estimate the delay along a given section of the road
during a specified time period
o Options may be included to estimate the delay due to construction/incident road
closures, recurrent bottlenecks, delay at intersection and so on
A module to estimate the Level of Service (LOS) along a given section of the road during
a specified time period
A module to estimate the travel time and buffer time between two locations for the
different modes of travel
o Buffer time may be calculated as the 95th percentile of the travel time, this
information would be useful to identify the travel times such that the traveler is able
to reach the destination 19 out of 20 times
o This metric is useful to identify the reliability of the transportation system
A module to estimate the Vehicle Kilometers Travelled (VKT) and Vehicle Hours
Travelled (VHT) along a given section of the road during a specified time period
A module to estimate the likelihood of occurrence of collisions at different locations along
the transportation network, so that the safety of the system can be iimproved

A
(
(
A
A
5.3.3. O
A
interface
queries
results
access
5 and R
Figure 5
A module to
(ADT), Mon
(AADT)
A module to
A module to
Output Lay
As explaine
e of the AD
would also
in the form
the system
Requirement
5-8 A sample
o estimate th
nthly Avera
o estimate th
o estimate th
yer
ed earlier, s
MS. The sa
display the
of maps, c
through an
t No. 6.
e user-interfenabling
he various t
age Daily T
he throughp
he travel tim
some eleme
ame interfac
e results for
charts, repo
interface a
face of the Fg users to su
traffic plann
Traffic (MAD
put of transi
me, buffer tim
ents of the
ce of the out
the queries
orts and tab
available thro
Freeway Perubmit querie
ning estimate
DT) and the
t services d
me and dela
output lay
tput layer th
s. The interf
bles. The u
ough the in
rformance Mes and view
es such as
e Annual A
during a spe
ay along the
er of the s
hrough whic
face would s
users would
ternet, fulfil
Measurementhe results
Average Da
Average Da
ecified time p
e transit rou
ystem form
ch the user e
support the
d be able to
ling Require
nt System (P
55
aily Traffic
aily Traffic
period
ute
m the user
enters the
display of
o securely
ement No.
PeMS) 10.4

56
Estimated Costs
57
6. Estimated Costs
For the proposed design of the ADMS, an estimate of the costs involved with the
implementation has been prepared and this section explains the cost estimate. It is expected
that the ADMS would be implemented in a series of phases/builds. This is the proposed method
of implementation because of financial and time constraints. Implementation in a series of
phases ensures that the detector coverage can be established over time while archiving the
data from the installed detectors in the mean time. The components that would eventually make
up the ADMS have been identified and their costs reported. Based on the usage and
requirements, additional components may be procured accordingly. This estimate covers almost
all of the components of the ADMS and the subsequent phases would be upgrades to these
components if needed. Identifying the relevant costs later, for these subsequent phases should
hence be very easy. The list of components and the respective prices mentioned here are by no
means set-in-stone; operational requirements may lead to a change in the estimate at any point
in time.
Prevailing market prices, as of March 15, 2011, for the different components have been
identified through interviews with vendors and through research at vendor's website. In cases,
where the prevailing prices could not be determined accurately, a conservative (higher) value
has been used. Cost estimates presented here have been prepared by taking into account only
the core components of the ADMS. These are all the components presented in the "Input
Layer", "Data, Programs Layer" and the "Output Layer" of the ADMS. Cost of the detectors and
their installation has not been included here.
The costs involved with the implementation of the ADMS have been grouped into the
following classes,
Set-up costs
o Hardware set-up costs
o Software set-up costs
Operational costs
Upgrade costs
6.1. Set-up Costs
These are by far the largest component of costs involved with the implementation of the
ADMS. These are mostly one-time fixed costs, investment required to purchase the necessary
hardware and software licenses to set-up the system.
58
6.1.1. Hardware Set-up Costs
Based on the proposed design of the ADMS, a list of the required hardware components
was identified. This list of components and typical unit price and the quantity needed for each
component is listed in Table 6-1. The market price of these components were identified either
through personal inquiries with vendors or from the vendors' Web sites.
The storage server is envisioned to be the component that receives all the raw data from
the field. Programs designed to perform Data Quality Checks would analyze the incoming data
for inconsistencies and anomalies before storing the raw data. The Data Aggregation Software
run continuously and aggregate this raw data based on the required granularity to derive the
aggregated and imputed data. Both the raw and aggregated data is stored in the storage server.
The Database Management System (DBMS) resides on the storage server and performs all the
database functions.
The web server hosts the Analysis modules and the user interface programs. Since, our
ADMS has been proposed to provide an online user interface for users to access the data, the
required programs for this functionality would reside on the web server as well. The
workstations are envisioned to be the development platform for all the programs of the System
Layer. Once these programs have been developed and tested, they would eventually be moved
to the servers to perform the routine operations. The raw and aggregated data stored in the
ADMS is very valuable and backing-up all the data is essential to ensure continuous operation
even in the case of system failures and crashes. The network backup storage should preferably
be located at a different physical location as of the ADMS. Connected over a network to the
ADMS, all the data would be backed-up at periodic intervals, preferably at the end of each day.
The backing-up of the data at the network backup storage and the presence of a RAID
configuration in the storage server provide two levels of redundancy to the data to ensure that
the data in the system is safe from accidental deletion and corruption.
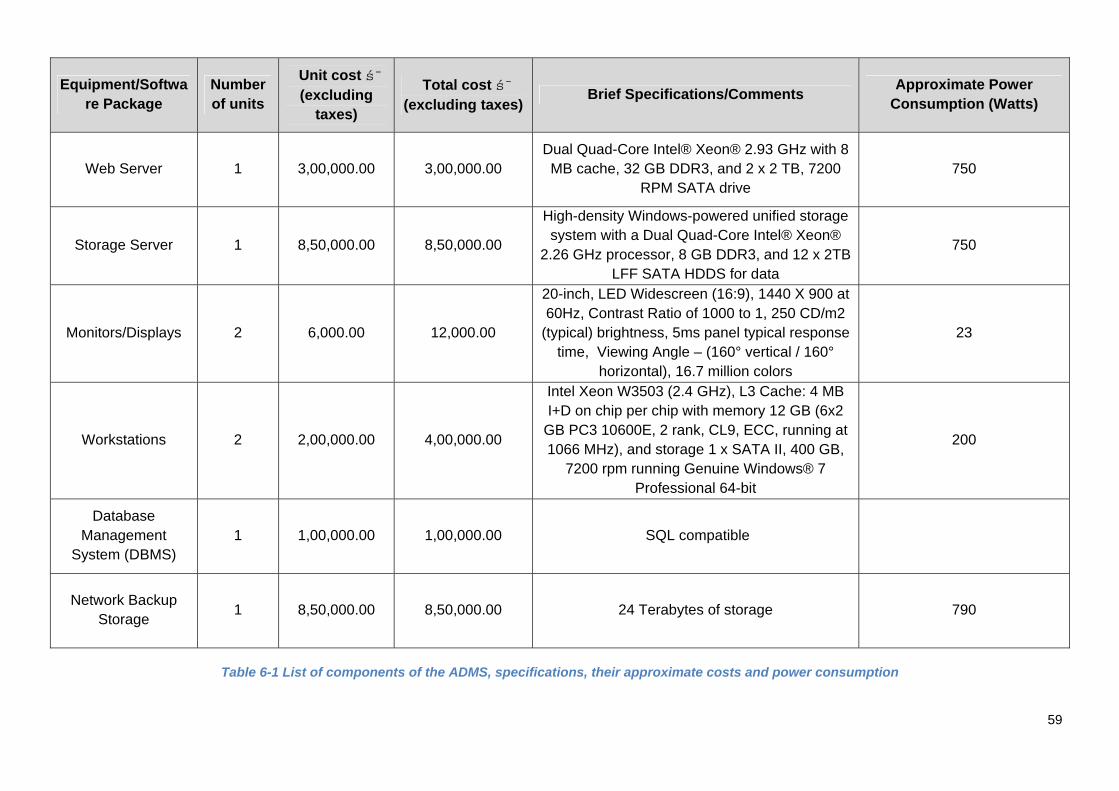
59
Equipment/Software Package
Number of units
Unit cost ₹ (excluding
taxes)
Total cost ₹ (excluding taxes)
Brief Specifications/Comments Approximate Power
Consumption (Watts)
Web Server 1 3,00,000.00 3,00,000.00 Dual Quad-Core Intel® Xeon® 2.93 GHz with 8 MB cache, 32 GB DDR3, and 2 x 2 TB, 7200
RPM SATA drive 750
Storage Server 1 8,50,000.00 8,50,000.00
High-density Windows-powered unified storage system with a Dual Quad-Core Intel® Xeon®
2.26 GHz processor, 8 GB DDR3, and 12 x 2TB LFF SATA HDDS for data
750
Monitors/Displays 2 6,000.00 12,000.00
20-inch, LED Widescreen (16:9), 1440 X 900 at 60Hz, Contrast Ratio of 1000 to 1, 250 CD/m2
(typical) brightness, 5ms panel typical response time, Viewing Angle – (160° vertical / 160°
horizontal), 16.7 million colors
23
Workstations 2 2,00,000.00 4,00,000.00
Intel Xeon W3503 (2.4 GHz), L3 Cache: 4 MB I+D on chip per chip with memory 12 GB (6x2
GB PC3 10600E, 2 rank, CL9, ECC, running at 1066 MHz), and storage 1 x SATA II, 400 GB,
7200 rpm running Genuine Windows® 7 Professional 64-bit
200
Database Management
System (DBMS) 1 1,00,000.00 1,00,000.00 SQL compatible
Network Backup Storage
1 8,50,000.00 8,50,000.00 24 Terabytes of storage 790
Table 6-1 List of components of the ADMS, specifications, their approximate costs and power consumption
60
Based on the estimates provided in Table 6-1, the total cost of the hardware
components is,
Total Hardware Set-up Costs = ₹ 24,12,000.00
6.1.2. Software Set-up Costs
The functions of database administration have already been explained. All the basic
functions such as data storage, retrieval, table creation, crash protection would be handled by
the selected database administration software.
In addition to this, the various programs that constitute the System Layer also need to be
developed. Commercial software does not exist to serve this function; hence these would have
to be developed during the implementation of the ADMS. In addition, there are many
advantages in developing these programs because they can be designed to serve specific
objectives and requirements. Since, these other programs of the System Layer are proposed to
be developed "in-house", the program staff are expected to be involved in this process and
hence a cost estimate involved with this process is not provided.
Total Software Set-up Costs = ₹ 1,00,000.00
Total Set-up Costs = ₹ 25,12,000.00
6.2. Operational Costs
In addition to the fixed set-up costs, recurrent annual costs are expected to be incurred
by the system. Electricity and communications are two components of the operational costs
expected to be incurred. Based on the power rating of each of the hardware component as
mentioned in Table 6-1, the total electricity consumption in a year has been calculated. The total
electricity consumed in a year is 22013.88 kWh. Based on a rate of ₹ 4 per kWh of electricity
(obtained from the Tamil Nadu Electricity Board's Web site), the total cost of electricity is ₹
88,055.52.
The costs incurred for the transmission of data from the field to the ADMS would depend
on the total amount of data transferred to the system and the cost of bandwidth. Both the total
number of detectors in the field and the communication network to be used for the ADMS are
yet to be determined, hence an accurate estimate could not be prepared. In addition, the mode
of data transfer, whether wired or wireless mode of communication, for the system is yet to be
finalized. This makes any estimate of the communication costs unlikely to be accurate. Hence,
this highly variable costs component has not been added to the general cost estimate.
Total Annual Operational Costs = ₹ 89,000.00

61
6.3. Upgrade Costs
In addition to the initial set-up of hardware, periodic upgrades to the system hardware
would also be necessary. This is needed to ensure that the system has enough storage space
to accommodate all the additional data that is generated as the system grows. Upgrades would
also be needed to ensure that enough processing power is available to meet the increased
demand of the programs of the System Layer. Though these upgrades are not expected to cost
as much as the initial set-up costs, these could be considerable as well. The upgrade costs are
also flexible in nature, since the purchase of upgrade components would not be restricted by
any time schedule.
A certain amount is proposed to be set aside every year to accommodate the periodic
upgrades. A complex upgrade cycle might be involved realistically, where the different
components are upgraded at different years, but setting aside a set amount ensures that this
amount can be tapped when needed to make the purchases. Based on the costs of the
components and a four year life-time for each component, an annual amount of ₹ 2,00,000.00
should be sufficient to complete the periodic upgrades.
Total Annual Upgrade Costs = ₹ 2,00,000.00
Grand Total of the Costs = ₹ 25,12,000.001 INITIAL + ₹ 2,89,000.002 ANNUAL
It has to be emphasized that this cost estimate has certain limitations. The uncertainty
about the mode of data transfer and certain internal costs (salary of the employees of the ITS
program implementing the ADMS) lead to an incomplete cost estimate for the ADMS
1 Excluding taxes 2 Excluding communication costs

62
Applications of ADMS -
Indian Traffic Scenario

63
7. Applications of ADMS – Indian Traffic Scenario
An earlier section already covered the applications of an ADMS but from the context of
existing systems in developed countries with different operational traffic conditions. This section
examines the usefulness of an ADMS in the Indian context. Illustrations of reports, charts, and
maps from existing ADMSs are also included here to better explain the potential applications of
such a system. Most of the applications that were discussed for the existing ADMSs in other
countries are also applicable to the proposed system, but a few other applications specific to
Indian conditions are also explained here.
The amount of traffic data and the accuracy of the data are very important in the
usefulness of an ADMS. This is because, for any meaningful decision to be made with an
ADMS, the data that resides within the system needs to be adequate and accurate. With the
status quo in India, the coverage of traffic detectors is almost non-existent with only pilot steps
being in place to test and install traffic detectors. The following discussion on the usefulness of
an ADMS is being made assuming that a sufficient coverage of traffic detectors is in place,
feeding reliable data to the system continuously. Also, in order to arrive at any kind of
meaningful conclusions, the presence of historical data is necessary, hence, the true potential of
an ADMS is expected to be achieved only after the system has been operational for a while.
7.1. Recommending Infrastructure Improvement Projects to the Worst Recurrent
Bottlenecks
As has been mentioned earlier, one of the biggest advantages of an ADMS is its
effectiveness in functioning as a decision-support tool in directing transportation infrastructure
improvement projects to deficient segments of the system. The availability of historical data in
an ADMS helps to identify recurrent bottlenecks in the transportation system. Removing
bottlenecks from the system can go a long way in alleviating congestion in the system. Most
often, transportation organizations have limited amount of funding at their disposal and they are
forced to make a choice on which transportation project to implement. In these cases, an ADMS
can act as a valuable tool in the allocation of funds to projects that can provide the maximum
benefit to the system and its users.
There are different metrics to identify and measure the impact of bottlenecks. The impact
of the bottleneck on the system over a predefined period can be measured as one of the
following metrics,
Total Delay caused by the bottleneck to the system
Delay per user caused by the bottleneck

N
T
A
Figur
With co
infrastru
projects
be trac
projects
7.2. S
Efficien
A
infrastru
impleme
Number of d
Total duratio
Average ex
re 7-1 A repolisting
ontinuous m
ucture impro
s that addre
ked over ti
s can be imp
Studying t
ncy
An ADMS
ucture proje
entation of
days the bo
on the bottle
tent (in kilom
ort generateg the top bot
monitoring of
ovement pro
ess the wors
ime. As an
plemented s
the Impac
can not on
cts, but it c
those proje
ottleneck is a
eneck is act
meters) the
ed in the Frettlenecks for
f the traffic
ojects can b
st bottlenec
nd when ad
successively
ct of Infra
nly be very
an also be
ects. “Befor
active
tive
bottleneck
eeway Perforr a given pe
conditions,
be establish
cks and prov
dditional fu
y.
structure
effective a
effective in
re-and-After
is active
rmance Meariod & given
, a methodo
ed with in th
vide the ma
nding beco
Improveme
as a decisio
identifying
r” studies ca
asurement Sn stretch of h
ology for th
he ADMS. I
aximum ben
omes availa
ent Projec
on-support
the resultan
an be easil
System (PeMhighway
e prioritizat
In such a sy
nefit to the
able, the q
cts on Op
tool in imp
nt benefits d
ly carried o
64
MS) 10.4
tion of the
ystem, the
users can
ueued up
perational
plementing
due to the
out for the
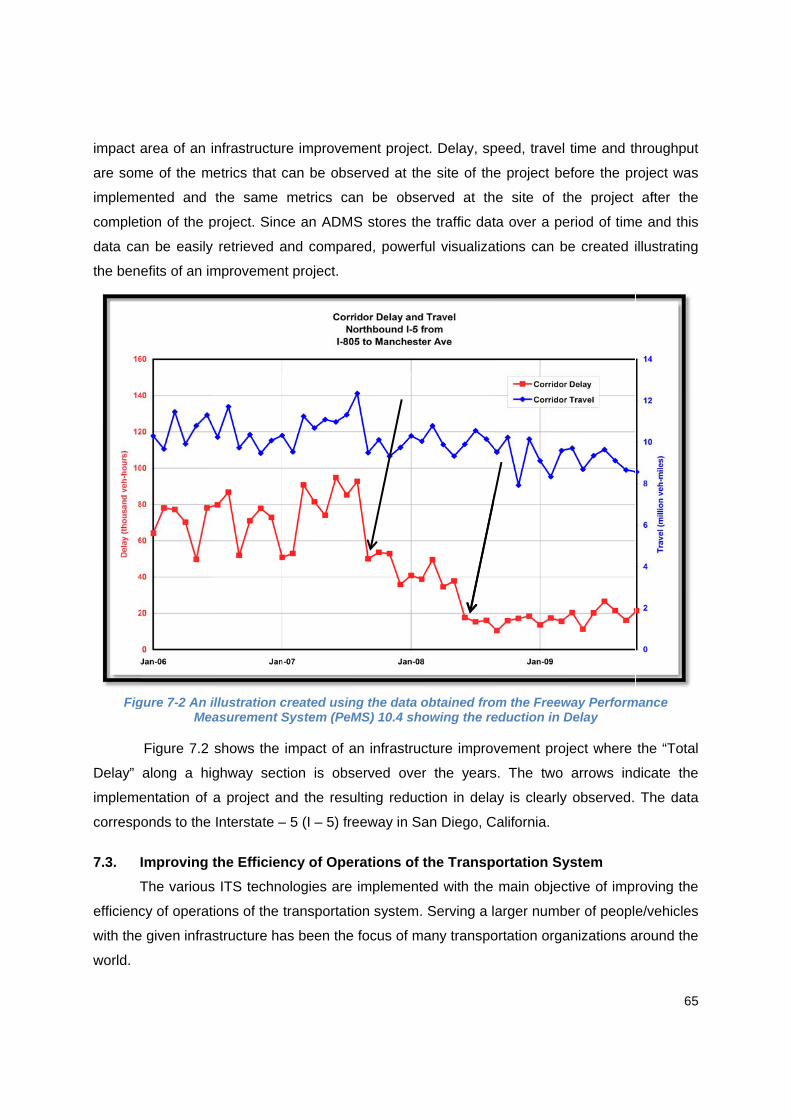
impact a
are som
impleme
complet
data ca
the bene
Fig
Delay”
impleme
correspo
7.3. I
T
efficienc
with the
world.
area of an i
me of the m
ented and
tion of the p
n be easily
efits of an im
gure 7-2 An iMe
Figure 7.2
along a hi
entation of
onds to the
Improving
The various
cy of operat
e given infra
infrastructur
metrics that c
the same
project. Sinc
y retrieved a
mprovemen
illustration ceasurement S
shows the
ghway sec
a project a
Interstate –
the Efficien
s ITS techno
tions of the
structure ha
re improvem
can be obs
metrics ca
ce an ADM
and compar
nt project.
created usinSystem (PeM
impact of a
ction is obs
nd the resu
– 5 (I – 5) fre
ncy of Ope
ologies are
transportati
as been the
ment projec
served at th
an be obse
S stores the
red, powerf
ng the data oMS) 10.4 sho
an infrastruc
served over
ulting reduc
eeway in Sa
erations of t
implemente
ion system.
e focus of m
ct. Delay, sp
e site of the
erved at th
e traffic dat
ful visualiza
obtained froowing the re
cture improv
r the years
ction in dela
an Diego, C
the Transp
ed with the
Serving a l
any transpo
peed, travel
e project be
e site of t
ta over a pe
ations can b
om the Freeweduction in D
vement pro
s. The two
ay is clearly
California.
portation Sy
main objec
arger numb
ortation orga
time and th
efore the pr
the project
eriod of time
be created i
way PerformDelay
oject where
arrows ind
y observed.
ystem
ctive of imp
ber of people
anizations a
65
hroughput
roject was
after the
e and this
illustrating
mance
the “Total
dicate the
The data
roving the
e/vehicles
around the
66
7.3.1. Traffic Signals
Optimization of the timing and coordination of a series of traffic signals is another area in
which an ADMS can be effectively leveraged to alleviate congestion in an urban environment.
Most often, signalized intersections are prime locations for the installation of traffic detectors as
they can serve dual purpose. Detectors at the approach of intersections can help in monitoring
the flow count at the intersection and in the functioning of the actuated traffic signals.
With detectors installed at all the major approaches of an intersection, an ADMS can
store the flow count data at all the approaches for all periods of the day over many months.
Information regarding the signal timing plans and the timing for the various signal phases can
also be stored. This information can be used manually or in various signal timing and
coordination programs to develop and implement the most efficient signal timing plan for the
given conditions. This application of the ADMS to cater to the operations of signalized
intersections and arterials is important in the Indian context because, most of the inter-city travel
in India is made along the arterials.
7.3.2. Transit
Public transit is one of the important modes of transportation in India and a mode that
needs to be fostered to bring about sustainability in urban growth and the transportation system
in the future. Based on the observations of the existing ADMSs, transit has not been provided
much significance in these systems. Transit operations data are not collected and archived as
much as freeway data and analyses modules have not been developed catering to improving
the efficiency of the transit system.
Applications of the ADMS geared towards improving the efficiency of the transit system
should be a major objective of an ADMS implemented in India. Based on the AVL & APC data,
the location of the transit vehicles over time and the number of passengers served can be
obtained. In conjunction with the information about the demand for transit at different stations
and hubs, these metrics could be used to optimize the performance of the transit system.
7.4. Advance Traveler Information System – Highway users
Timely information provided to road users in a convenient manner can help the users in
making good travel choices, thus helping the transportation system as a whole. One of the
applications of Intelligent Transportation Systems (ITS) is the use of Dynamic Message Signs
(DMS) or Variable Message Signs (VMS) to provide useful information to the drivers safely,
without distracting them. A VMS is an electronic information board installed along the roads, in
the field-of-vision of a driver to present relevant information while driving. Figure 7.3 shows a

relativel
phrases
E
to prese
location
conjunc
duration
road us
times to
effective
informat
users to
F
highway
predictio
peak pe
in San D
y older VM
s. Newer VM
Employing a
ent useful in
of the hig
ction to infor
n of delay d
ers make. A
o various de
e prediction
tion can be
o make alter
Figure 7.4 s
y during the
ons possible
eriods as on
Diego, Califo
S in operat
MS are able
Figure 7-
an ADMS in
nformation t
ghway can
rmation reg
due to the e
Another exa
estinations. W
ns can be m
displayed o
rnative route
shows the a
e different p
e and it can
ne would ex
ornia.
tion displayi
to display t
3 A Variable
n conjunctio
to travelers
be display
garding alte
emergency c
ample of use
With a cons
made regard
on a VMS o
e choices.
actual and a
periods of a
n be noted t
xpect. The d
ing informat
text that can
e Message S
on with VMS
. Informatio
yed at upst
rnate routes
can prove v
eful informa
siderable am
ding the trav
or provided
an estimate
a day. Histo
that the trav
data corresp
tion to drive
n be program
Sign (VMS) in
S, innovativ
on regarding
ream locat
s to various
valuable in d
ation involve
mount of his
vel times at
to users on
of the trave
rical data s
vel times inc
ponds to th
ers from a p
mmed from
n operation
ve technique
g emergenc
ion to the
s destinatio
determining
es displaying
storical data
t different p
n the ADMS
el time along
stored in the
creases dur
e Interstate
pre-determin
the control
es can be d
cies at a do
road users
ns and the
g the choice
g the predic
a stored in th
periods in a
Ss webpage
g a given se
e ADMS ma
ring the A.M
e – 15 (I -15
67
ned set of
terminal.
developed
ownstream
s. This, in
expected
es that the
cted travel
he ADMS,
day. This
e, enabling
ection of a
akes such
M and P.M
5) freeway

Figure10.4 sho
7.5. A
A
Automa
board th
the ADM
informat
mobile t
transit u
willingne
location
at differe
7.6. E
T
emissio
sector r
efforts i
e 7-4 An illuowing the tr
Advance T
A similar ap
atic Vehicle
he transit ve
MS. The AD
tion to the e
technology,
users. Once
ess to rece
of vehicles
ent transit s
Environme
The transpo
ns. The U.S
represents a
in reducing
ustration genravel time es
raveler Info
pplication is
Location (A
ehicles can
DMS can th
electronic m
it is also po
e a transit u
eive alerts, t
s of the user
stops can al
ental Analys
ortation ind
S. Environm
about 10% o
the GHG
nerated in thstimates for
ormation S
s the Advan
AVL) units
continuous
hen process
message sig
ossible to s
user registe
the ADMS
r’s routes of
so be sent t
ses
dustry is on
mental Prote
of all energy
emissions
he Freeway Pr a section o
System – Tr
nce Travele
or the Glo
sly send inf
s this data
gns installe
end custom
ers with the
system cou
f interest. U
to the trans
e of the m
ction Agenc
y-related gr
should also
Performancef a highway
ransit users
r Informatio
obal Position
formation re
and relay a
d at transit
mized alerts
system, co
uld send up
pdates on t
it users.
major source
cy (EPA) sta
reenhouse-g
o consider
e Measuremy for the diffe
s
on System f
ning System
egarding the
arrival time
stops. With
to various m
onfirming his
p-to-the-mom
the arrival ti
es of Green
ates that "th
gas emissio
the transpo
ment Systemerent period
for transit u
m (GPS) d
eir current l
estimates
h the curren
mobile devi
s/her prefer
ment updat
me of trans
n-House Ga
he U.S. tran
ons worldwid
ortation sec
68
m (PeMS) ds of a day
users. The
evices on
ocation to
and other
nt state of
ces of the
rence and
tes on the
it vehicles
as (GHG)
sportation
de."38 Any
ctor to be
69
successful. The system level metrics such as the Vehicle Kilometers Traveled (VKT) and the
average speed of the vehicles that are stored in the ADMS, can be used to identify the GHG
emissions due to the transportation system. Research is available on the amount of the GHG
emitted at different speeds of travel of automobiles. Generally, any delay in the transportation
system leads to idling of vehicles and the additional time being spent on the roads increases the
amount of GHG emitted. The VKT value helps identify the additional amount of travel that has
taken place in the system year-over-year. This additional travel might be due to the general
increase in transportation activity over the years, increase in the population or other reasons.
The increase in travel is associated with an increase in the emission of GHG as well. Thus, an
ADMS would be useful for future efforts to monitor and reduce emissions reduction from the
transportation system.
7.7. Recommend Improvement Projects to Accident-prone Road Sections
Safety is one of the essential aspects of a good transportation system, towards which
transportation agencies around the world are devoting a lot of attention. “Worldwide, an
estimated 1.2 million people are killed in road crashes each year and as many as 50 million are
injured.”39 These numbers are only expected to go higher in the coming years, due to increased
number of vehicles reaching the road and the resulting increase in travel. An ADMS can again
be an effective tool in improving the safety of a transportation system.
An ADMS usually has geospatial features i.e., it has the ability to let the users view
transportation data on a map. When all the crash data are stored in the ADMS along with the
location and time-of-day information, useful analyses can be carried out. The safety of the
different segments or locations along a highway can be calculated as the incidence of
crashes/kilometer. This metric can then be used to sort the segments to reveal the most
dangerous segments along the entire highway. Accordingly, transportation improvement
projects can be carried out to address the segments with the highest safety risks. This
prioritization is similar to the one that was explained in the section for the alleviation of
bottlenecks and projects can be implemented based on the priority established and additional
projects implemented when more funds become available.
7.8. Emergency Management
As an extension of the safety applications, the ADMS also helps in emergency
management. Re-routing in the case of an incident on the highway and signal prioritization for
emergency vehicles are some examples of emergency management with an ADMS.
70
Thus, an ADMS forms the backbone or the core element of most of the ITS services in a
transportation system, all the other systems could interact with the ADMS to get the necessary
information for its operations and in-turn supply information regarding its state of operation to
the ADMS.
7.9. As a Resource for Traffic Research
In addition to all the practical applications of an ADMS, it can also serve as a very
effective resource for traffic researchers and academicians. The vast amount of data stored in
an ADMS is ideal for studying and analyzing various phenomena and a better understanding of
the traffic characteristics can help the transportation system in general. Most of the existing
ADMSs that were studied had a common characteristic: an educational institution was involved
in the development of the system. New features and capabilities are routinely developed by the
researchers and once mature, are migrated to the production version. Thus a healthy
relationship in developing new features for the ADMS and using the ADMS to further the
existing understanding can be a great success for the system.
7.10. Commercial Applications
Apart from the ADMSs applications in the public domain, (government organizations,
and research institutions) certain applications of the system in the private sector are interesting
to investigate as well. These applications might also generate revenue for the system, which
can be spent for the maintenance and upgrades of the system.
7.10.1. Applications for Third-Party Value Added Resellers
As the reliability of the transportation system improves and as it becomes possible to
better predict the travel times between locations, an interesting business proposition arises.
Private organizations might be interested to develop business ventures around the idea of
predicting travel times for road users. This would involve developing programs to predict travel
times during different times of the day and along different routes to find the best possible route
between two locations at a given time of the day. The organization could sell subscriptions to
the public, who pay a certain amount each month to receive travel time predictions and to
receive periodic real-time updates regarding traffic conditions along their preferred routes. This
whole proposition depends on the availability of historical data and a constant flow of real-time
traffic data. The ADMS could serve this data to the private organizations for a pre-defined fixed
amount of money, this amount being the revenue to the system.
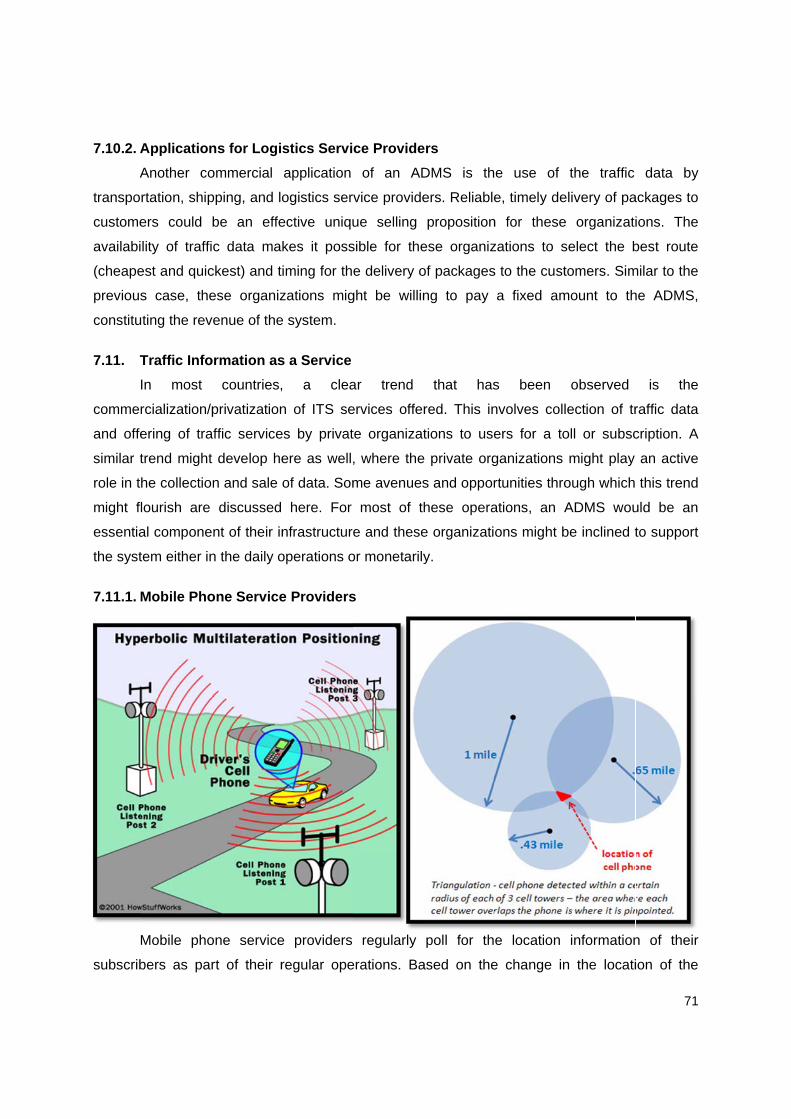
7.10.2. A
A
transpo
custome
availabi
(cheape
previous
constitu
7.11. T
I
commer
and offe
similar t
role in th
might fl
essentia
the syst
7.11.1. M
M
subscrib
Application
Another co
rtation, ship
ers could
lity of traffi
est and quic
s case, the
ting the rev
Traffic Info
In most
rcialization/p
ering of tra
trend might
he collectio
lourish are
al compone
tem either in
Mobile Pho
Mobile pho
bers as par
ns for Logis
ommercial
pping, and lo
be an effe
c data mak
ckest) and ti
ese organiz
venue of the
ormation as
countries,
privatization
affic service
t develop he
n and sale o
discussed
nt of their in
n the daily o
one Service
one service
rt of their r
stics Servi
application
ogistics ser
ective uniqu
kes it poss
iming for th
zations mig
e system.
s a Service
a clea
n of ITS se
es by privat
ere as well,
of data. Som
here. For
nfrastructure
operations o
e Providers
e providers
regular ope
ce Provide
of an AD
rvice provide
ue selling
sible for the
e delivery o
ght be willin
ar trend
ervices offer
te organizat
, where the
me avenues
most of th
e and these
or monetarily
s
regularly
erations. Ba
ers
DMS is th
ers. Reliable
proposition
ese organiz
of packages
ng to pay
that has
red. This in
tions to use
e private org
s and oppor
hese opera
e organizati
y.
poll for th
ased on the
e use of
e, timely de
n for these
zations to s
s to the cust
a fixed am
s been
nvolves coll
ers for a to
ganizations
rtunities thro
ations, an A
ons might b
e location
e change in
the traffic
elivery of pa
e organizati
select the b
tomers. Sim
mount to th
observed
lection of tr
oll or subsc
might play
ough which
ADMS wou
be inclined t
information
n the locati
71
data by
ackages to
ions. The
best route
milar to the
he ADMS,
is the
raffic data
cription. A
an active
this trend
uld be an
to support
n of their
ion of the

subscrib
calculat
to build
to preve
the maj
collect a
need fo
provider
traffic d
services
7.11.2. C
I
usually
traffic in
NAVTEQ
users to
Figure
bers along t
ted. Thus, w
effective tr
ent privacy c
jor advanta
a major por
r expensive
rs do not w
ata to third
s.
Commercia
Irrespective
a stressful
nformation f
Q and Siga
o help them
7-5 A screen
the roads ov
with a consi
raffic profiles
concerns, b
ages for the
rtion of the
e installation
ish to divers
d-party valu
al Traffic In
e of where w
and tiring
for some m
alert offer liv
avoid cong
n-shot of Go
ver time, the
derable sub
s in their co
but this is us
e mobile ph
data neede
n of new de
sify and pu
e added re
nformation
we live in, dr
experience
major cities
ve traffic upd
estion.
oogle Maps
e speed an
bscriber bas
overage are
seful inform
hone servic
ed for an AD
etectors is e
rsue this ne
esellers for
Providers
riving to wor
e. Google M
around the
dates and c
displaying t
d eventually
se and wide
ea. The loca
mation from t
ce providers
DMS at a v
liminated. E
ew business
a fee who
rk or getting
Maps, a co
e world and
customized
the traffic co
y a host of o
e coverage,
ation inform
the context
s is that the
very limited
Even if the m
s opportunit
in-turn mig
g back home
ommercial s
other com
route sugge
onditions on
other metric
, they are b
mation is ano
of an ADM
ey would b
marginal co
mobile phon
ty, they cou
ght provide
e in the pea
service, pro
mmercial ser
estions to s
n the roads o
72
cs may be
best suited
onymized,
MS. One of
be able to
ost as the
ne service
uld sell the
the traffic
ak hours is
ovides live
rvices like
subscribed
of Sydney

73
There is huge potential for similar services to be offered in India and with the maturity of
ITS applications, these might soon become a reality. As an extension of the previous scenario,
these commercial traffic information providers could be the mobile phone service providers.
Alternatively they could be the third-party value added resellers who obtain the traffic
information from the mobile phone service providers. They could in-turn, process, analyze and
present the necessary information to the public in a suitable format. A third option is for the
commercial traffic information providers to own the detection network as well and provide the
traffic information services.

74
Vision for the Future

75
8. Vision for the Future
The applications for the ADMS that were discussed in the previous chapter are those
that have already been implemented in similar systems or the applications that are feasible
under the current conditions. But, it is interesting to explore the potential uses of an ADMS,
given certain changes in the transportation system. There is no way to predict the future nor the
changes that might happen in the transportation system, nonetheless this section tries to
visualize the ways in which an ADMS might be leveraged in certain future scenarios. Table 8.1
lists some of these scenarios that might come up, the transportation data that might be stored in
the ADMS accordingly and the applications of the ADMS in each case. Some of these scenarios
are closer to reality while others have been mere ideas for many decades. Irrespective of the
way transportation changes in the future, it is certain that the amount of data generated from the
system would increase enormously and the importance of an ADMS could only increase. The
following sub-sections briefly explain a scenario and further information corresponding to that
scenario has been provided in Table 8.1.
8.1. Inter-vehicular Communication & Communication with the Infrastructure
Communication capabilities between vehicles and between the vehicles and the
infrastructure are a prime vision for a safe and reliable future transportation system. Efforts are
already under way, initiated by the USDOT to establish a standard platform to develop ITS
technologies that enable better integration and communication. Full scale implementation of
such communication capabilities might be a few years away, but Table 8-1 lists the data that
might be useful to be stored in the ADMS and some applications of the stored data.
8.2. Congestion Pricing
8.2.1. Network Level
This envisioned change to the transportation system is a scenario where a toll is
collected from the users of a highway for the usage of the facility. The amount of toll to be levied
is determined dynamically based on the amount of traffic already in the highway. The toll is
increased appropriately so that the traffic operates under free-flow conditions within the facility.
Access is restricted and electronic tolling is employed to prevent the need to stop to pay a toll.
Electronic tolling may be implemented using License plate recognition or with the use of a radio
transponder. This concept has already been implemented in some cities.
76
8.2.2. Regional Level
Similar to the concept of tolling users who access a highway, a toll is levied on all users
of a certain vehicle type who access a certain region of a city during the rush hours. All ingress
points of the specified region are monitored and a toll is levied electronically.
8.3. VMT (Vehicle Miles (Kilometers) Travelled), Vehicle Type Based Taxation
The current system of fuel taxes that are collected in most countries does not take into
account the damage caused by the type of vehicle to the pavement. Heavy vehicles inevitably
cause more damage and lead to early deterioration of the pavement. In addition, the fuel tax
does not accurately capture the total amount of travel and the usage of the transportation
infrastructure by a user. Implementation of a taxation system which considers the amount, time
of travel and the type of vehicle would be impartial to all users.
8.4. Increased carpooling due to widespread use of social networks
Social networks are an important part of our communication medium in our lives today.
As people grow accustomed to the idea of sharing more and more information about their lives
online, it is possible to envision that they would be more willing to share a ride with their friends.
Matching riders for carpooling has also become very convenient because of the social networks.
The impediment to prevalent carpooling is the lack of convincing incentives, which is a change
needed on the policy level and most of technology needed is already available for this change.
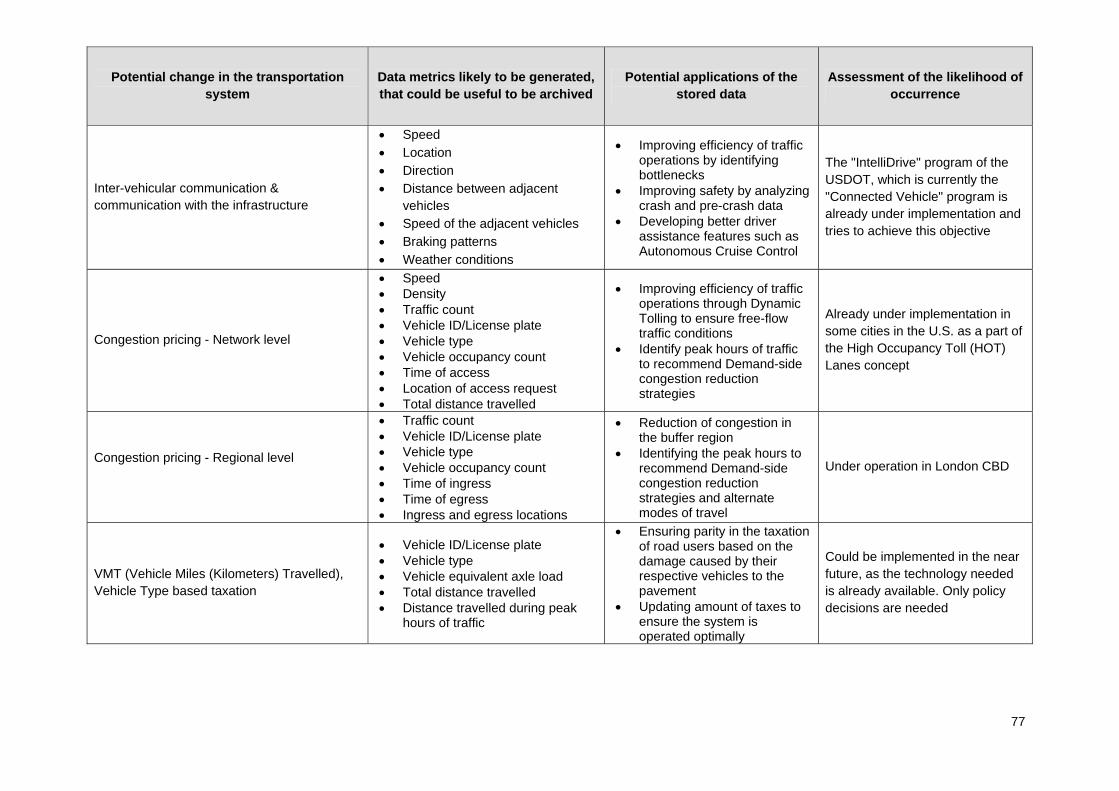
77
Potential change in the transportation system
Data metrics likely to be generated, that could be useful to be archived
Potential applications of the stored data
Assessment of the likelihood of occurrence
Inter-vehicular communication & communication with the infrastructure
Speed Location Direction Distance between adjacent
vehicles Speed of the adjacent vehicles Braking patterns Weather conditions
Improving efficiency of traffic operations by identifying bottlenecks
Improving safety by analyzing crash and pre-crash data
Developing better driver assistance features such as Autonomous Cruise Control
The "IntelliDrive" program of the USDOT, which is currently the "Connected Vehicle" program is already under implementation and tries to achieve this objective
Congestion pricing - Network level
Speed Density Traffic count Vehicle ID/License plate Vehicle type Vehicle occupancy count Time of access Location of access request Total distance travelled
Improving efficiency of traffic operations through Dynamic Tolling to ensure free-flow traffic conditions
Identify peak hours of traffic to recommend Demand-side congestion reduction strategies
Already under implementation in some cities in the U.S. as a part of the High Occupancy Toll (HOT) Lanes concept
Congestion pricing - Regional level
Traffic count Vehicle ID/License plate Vehicle type Vehicle occupancy count Time of ingress Time of egress Ingress and egress locations
Reduction of congestion in the buffer region
Identifying the peak hours to recommend Demand-side congestion reduction strategies and alternate modes of travel
Under operation in London CBD
VMT (Vehicle Miles (Kilometers) Travelled), Vehicle Type based taxation
Vehicle ID/License plate Vehicle type Vehicle equivalent axle load Total distance travelled Distance travelled during peak
hours of traffic
Ensuring parity in the taxation of road users based on the damage caused by their respective vehicles to the pavement
Updating amount of taxes to ensure the system is operated optimally
Could be implemented in the near future, as the technology needed is already available. Only policy decisions are needed
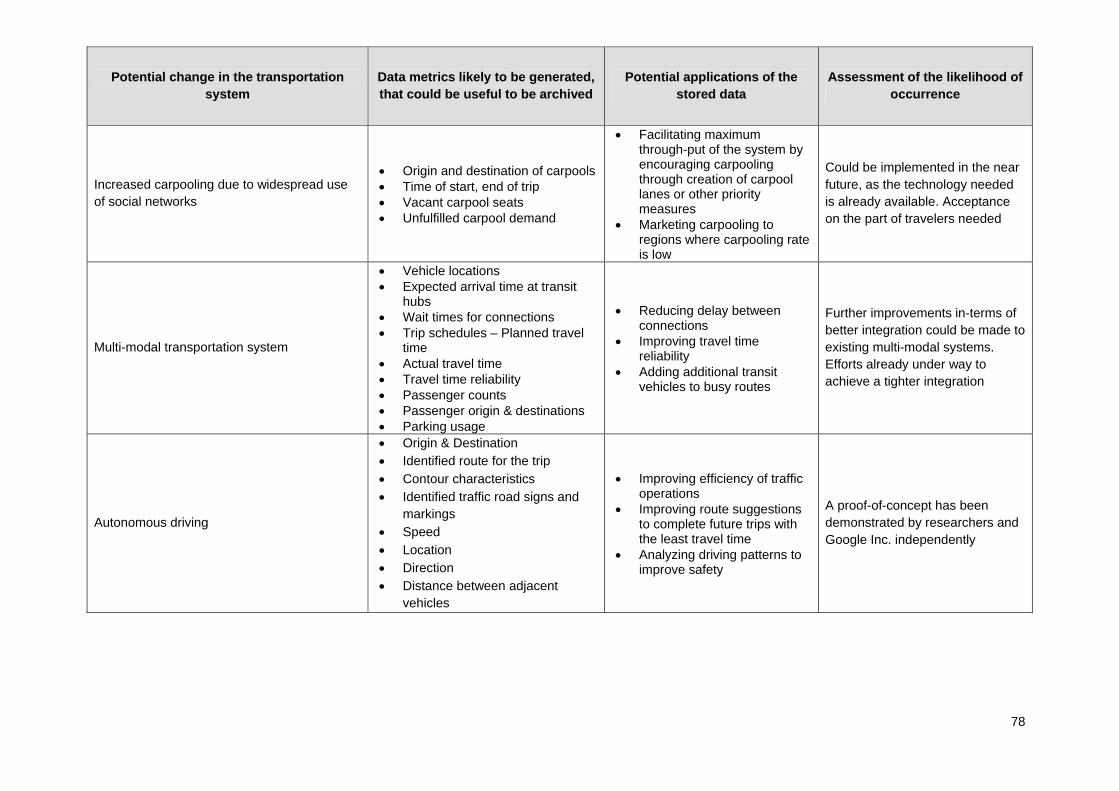
78
Potential change in the transportation system
Data metrics likely to be generated, that could be useful to be archived
Potential applications of the stored data
Assessment of the likelihood of occurrence
Increased carpooling due to widespread use of social networks
Origin and destination of carpools Time of start, end of trip Vacant carpool seats Unfulfilled carpool demand
Facilitating maximum through-put of the system by encouraging carpooling through creation of carpool lanes or other priority measures
Marketing carpooling to regions where carpooling rate is low
Could be implemented in the near future, as the technology needed is already available. Acceptance on the part of travelers needed
Multi-modal transportation system
Vehicle locations Expected arrival time at transit
hubs Wait times for connections Trip schedules – Planned travel
time Actual travel time Travel time reliability Passenger counts Passenger origin & destinations Parking usage
Reducing delay between connections
Improving travel time reliability
Adding additional transit vehicles to busy routes
Further improvements in-terms of better integration could be made to existing multi-modal systems. Efforts already under way to achieve a tighter integration
Autonomous driving
Origin & Destination Identified route for the trip Contour characteristics Identified traffic road signs and
markings Speed Location Direction Distance between adjacent
vehicles
Improving efficiency of traffic operations
Improving route suggestions to complete future trips with the least travel time
Analyzing driving patterns to improve safety
A proof-of-concept has been demonstrated by researchers and Google Inc. independently
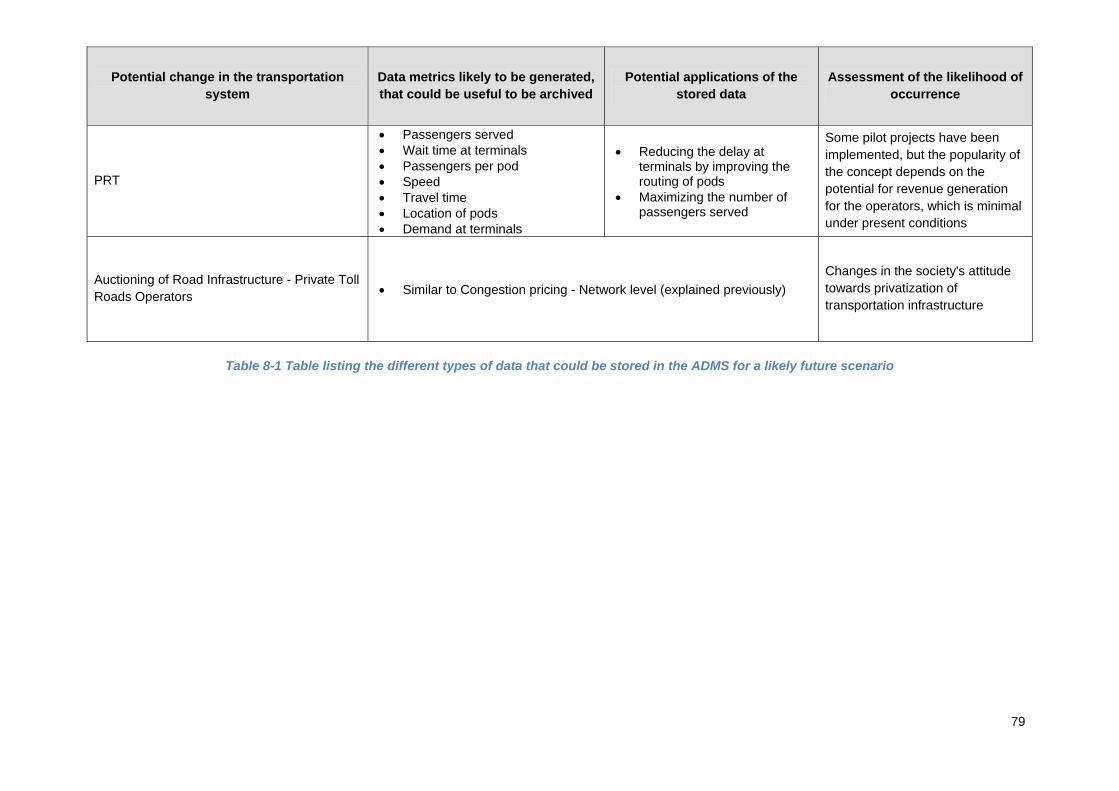
79
Potential change in the transportation system
Data metrics likely to be generated, that could be useful to be archived
Potential applications of the stored data
Assessment of the likelihood of occurrence
PRT
Passengers served Wait time at terminals Passengers per pod Speed Travel time Location of pods Demand at terminals
Reducing the delay at terminals by improving the routing of pods
Maximizing the number of passengers served
Some pilot projects have been implemented, but the popularity of the concept depends on the potential for revenue generation for the operators, which is minimal under present conditions
Auctioning of Road Infrastructure - Private Toll Roads Operators Similar to Congestion pricing - Network level (explained previously)
Changes in the society's attitude towards privatization of transportation infrastructure
Table 8-1 Table listing the different types of data that could be stored in the ADMS for a likely future scenario

80
8.5. Multi-modal transportation system
A transportation system centered on a transit system has the advantage of a high
throughput, whereas a system predominantly consisting of automobiles offers the passengers
with the convenience of door-to-door travel but at the cost of reduced system throughput.
Hence, in all practical solutions, a compromise has to be made to ensure acceptable levels of
accessibility and system throughput. In an efficient transportation system, a transit network
usually acts as a backbone carrying large traffic, which is in-turn served by feeder systems that
carry the passengers to and from their ultimate destinations. Many major cities around the world
are built around this concept, but a tight and true integration of all the modes is rarely achieved.
A system can be envisioned where technology enables efficient connections between the
different modes of travel such as walking, biking, use of automobiles, feeder buses and heavy
rail or light rail modes. A scenario can also be envisioned where transit users anonymously
share the location data voluntarily with the ADMS. This crowd sourced data could again be used
for providing better traveler information.
8.6. Autonomous driving
Recent improvements in video image processing, sensor technology and the availability
of cheap computing power have made autonomous vehicles realistic. Researchers in
academia40 and engineers at Google Inc.41 have independently demonstrated vehicles that are
capable of navigating the roads in real-world traffic conditions. Though, the reliability of this
concept and acceptance among the public for this technology is yet to be seen.
8.7. Personal Rapid Transit
Driverless pods carrying passengers to their destinations have long been a staple of
science fiction, but only recently have there been recent cases of implementation of this
technology for real-world solutions. The Urban Light Transport (ULTra) is a Personal Rapid
Transport (PRT) system developed by ULTra PRT. An implementation of this system is under
the pilot stage at the Heathrow airport in London, UK. Another example of a PRT system under
operation is the Morgantown Personal Rapid Transit (WVU PRT) in Morgantown, West Virginia,
USA. Many other projects have also been proposed, but the acceptance of the system is yet to
be fully seen because of the need for the construction of an entirely new infrastructure for the
operation of the system. Table 8-1 lists the data might be useful to be stored in the ADMS for
such a system and the applications of the ADMS for the operation of the system.

81
8.8. Auctioning of Road Infrastructure - Private Toll Roads Operators
One of the recent developments in the field of transportation infrastructure maintenance
and operation is the move by government agencies to lease the transportation infrastructure to
private entities. The lack of sufficient funds with government agencies has encouraged them to
outsource the maintenance and operation of a facility in return for an up-front fee. The Chicago
Skyway is an example for this type of arrangement, with the lease period being 99 years.42
Another common practice is the BOT arrangement where a private entity is granted the rights to
build a facility, collect toll from users for a specific period and finally transfer the facility to the
government. An analogy can be visualized between the wireless mobile phone service providers
and the private entities operating the leased transportation infrastructure. The right-of-way or the
existing transportation facility would be analogous to the communication spectrum leased in the
wireless service business model.
The private entities would bid the right to operate a transportation facility and would
compete with other entities in attracting travelers to their facility, from whom they would levy a
toll. Unlike the case of national highways in the country, where a viable alternate route does not
exist, the roads within urban areas usually have parallel alternate routes, which would foster
competition. This competition would encourage the efficient operation of the available
infrastructure and there incentive would be an incentive to provide a smooth, faster travel
experience to the users.

82
Summary
83
9. Summary
This study looked at the various aspects of the implementation and operation of a traffic
Archive Data Management System (ADMS) under Indian conditions. As part of this study,
similar systems around the world have been identified and reviewed. Their characteristics were
studied and a list of best practices commonly followed in the industry was compiled. In
proposing the development of an ADMS for Indian conditions, a list of requirements has been
proposed. The different types of data, the collection of which would be useful for a host of
applications, have been identified. Additionally, detailed information about each of these types
of data in terms of the derived data that can be obtained and the granularity of aggregation and
potential sources of the data have all been explained. A logical design of the system has been
proposed which includes the different components that make up the system. The relationship of
each component of the system with the other components and the function of that component in
the overall context of the system has also been explained. In addition, an approximate cost
estimate for the implementation of the ADMS has been calculated based on the prevailing
market prices.
Based on the review of other similar systems around the world, a gradual shift in the
source of funding for ITS implementation and operations from the government/public sector to
the commercial/private sector has been observed. With the ITS technologies reaching a state of
maturity, commercial applications have been developed and the private sector has been seen to
participate eventually by either providing funding or helping in implementation. A similar
environment can be imagined to take shape in India as well, with government funding being the
predominant source of funding during the initial stages of research and development followed by
interest from the private sector. An ADMS has been identified to be one of the most important
components of the ITS ecosystem. Few applications of the ADMS have also been visualized
both from a government perspective and from that of private organizations. Irrespective of the
source of funding, very useful applications have been identified for the ADMS, the potential
benefits being both social and commercial.

84
References
85
10. References
1 Freeway Performance Measurement System (PeMS). (n.d.). System Overview.
Retrieved February 15, 2011, from
http://pems.dot.ca.gov/?user=8399&dnode=Help&content=help_overview 2 Freeway Performance Measurement System (PeMS). (n.d.). System Calculations.
Retrieved February 15, 2011, from http://pems.dot.ca.gov/?dnode=Help&content=help_calc 3 Choe, T., Skabardonis, A., & Varaiya, P. (2002). Freeway Performance Measurement
System (PeMS): An Operational Analysis Tool. 81st Annual Meeting Transportation Research
Board. Washington, D.C. 4 Venkatanarayana, R. (2005). TMC Applications of Archived Data - Operational Test.
Virginia: Smart Travel Laboratory. 5 Virginia Smart Travel Lab, Open Roads. (2006, October 20). Database Descriptions.
Retrieved February 23, 2011, from ADMS Virginia Northern Virginia:
http://adms.vdot.virginia.gov/ADMSVirginiaNOVA/html/HelpFrontPage_NOVA.html 7 Center for Transportation Studies, University of Virginia. (n.d.). ADMS Virginia
Transportation Management Center Applications of Archived Data . Retrieved February 23,
2011, from Center for Transportation Studies: http://www.cts.virginia.edu/news_its_proposal.htm 8 Bertini, R. L., Matthews, S., & Hansen, S. (2005). ITS Archived Data User Service in
Portland, Oregon: Now and Into the Future. IEEE ITSC Vienna. 9 Tufte, K. A. (2009). PORTAL Aggregation Analysis and Documentation. Portland:
Portland State University. 10 Namkoong, S. J., Im, W., & Jeon, S. (2009). Development of Korean Expressway
Archived Traffic Data Management System: OASIS. Asia Congress. 11 Hussain, S. Z. (2011, March 27). Dalili System - Survey of the Characteristics. (D.
Sharan, Interviewer) 13 Architecture Development Team. (2007). National ITS Architecture Physical
Architecture. Washington D.C. 20590: Research and Innovative Technology Administration
(RITA), US Department of Transportation. 14 State of Oregon. (2007, February 04). Intelligent Transportation Systems (ITS).
Retrieved February 24, 2011, from State of Oregon:
http://www.oregon.gov/ODOT/HWY/ITS/PDFs/ITSDocuments/StatewideITSPlan/Figure1_Natio
nal_ITS_Physical_Architecture.jpg

86
15 UTMC Ltd. (2010, July 28). Background Introduction to UTMC. Retrieved February 24,
2011, from Urban Traffic Management Control: http://www.utmc.uk.com/background/index.php 16 Urban Traffic Management and Control Ltd. (2009). UTMC-TS003.003:2009 UTMC
Framework Technical Specification. Urban Traffic Management and Control Ltd.
18 http://a2.mzstatic.com/us/r1000/034/Purple/18/f9/6d/mzl.nkxjvnjj.480x480-75.jpg 19http://www.netsgate.info/wp-content/uploads/2009/03/hi-tech-bus-chennai-313.jpg
20 http://www.isscctv.com/images/products/interface2.jpg 21 Klein, L. A., Mills, M. K., & Gibson, D. R. (2006). Traffic Detector Handbook: Third
Edition—Volume I. McLean: Federal Highway Administration, US Department of Transportation.
22 http://static.howstuffworks.com/gif/red-light-camera-loop.gif
23 http://ops.fhwa.dot.gov/freewaymgmt/publications/frwy_mgmt_handbook/images/fig15
-1.jpg
24 http://www.siemens.com/press/pool/de/pp_cc/2007/02_feb/sc_upload_file_sosep2007
02_03_72dpi_1433893.jpg
25 http://farm3.static.flickr.com/2541/4153047461_76e2e1a9d3.jpg
26 Klein, L. A., Mills, M. K., & Gibson, D. R. (2006). Traffic Detector Handbook: Third
Edition—Volume I. McLean: Federal Highway Administration, US Department of Transportation. 27 University Of Maryland - Center For Advanced Transportation Technology. (2008).
Bluetooth Traffic Monitoring Technology - Concept Of Operation & Deployment Guidelines.
College Park: University Of Maryland - Center For Advanced Transportation Technology. 28 University Of Maryland - Center For Advanced Transportation Technology. (2008).
Bluetooth Traffic Monitoring Technology - Concept Of Operation & Deployment Guidelines.
College Park: University Of Maryland - Center For Advanced Transportation Technology. 29 Bertini, R. L., Byrd, A. M., & Yin, T. (2004). Implementing the ITS Archived Data User
Service in Portland, Oregon. IEEE 7th annual Conference on Intelligent Transportation
Systems. Washington, DC. 30 http://pems.dot.ca.gov/?dnode=Help&content=help_overview 32 American Society for Testing and Materials. (n.d.). ASTM E2665 - 08 Standard
Specification for Archiving ITS-Generated Traffic Monitoring Data. Retrieved March 07, 2011,
from American Society for Testing and Materials: http://www.astm.org/Standards/E2665.htm 33 American Society for Testing and Materials. (n.d.). ASTM E2259 - 03a Standard
Guide for Archiving and Retrieving ITS-Generated Data. Retrieved March 07, 2011, from
American Society for Testing and Materials: http://www.astm.org/Standards/E2259.htm
87
34 American Society for Testing and Materials. (n.d.). ASTM E2468 - 05 Standard
Practice for Metadata to Support Archived Data Management Systems. Retrieved March 07,
2011, from American Society for Testing and Materials:
http://www.astm.org/Standards/E2468.htm 35 National Transportation Communications for ITS Protocol. (2011, January 25). Library:
1209 - NTCIP Object Definitions for Transportation Sensor Systems (TSS). Retrieved March 07,
2011, from National Transportation Communications for ITS Protocol:
http://www.ntcip.org/library/standards/default.asp?documents=yes&standard=1209 36 Texas Transportation Institute. (2007). Quality Control Procedures For Archived
Operations Traffic Data: Synthesis Of Practice And Recommendations. Washington, DC 20590:
Office of Highway Policy Information, Federal Highway Administration, U.S. Department of
Transportation. 37 Chen, C., Kwon, J., Rice, J., Skabardonis, A., & Varaiya, P. (2003). Detecting Errors
And Imputing Missing Data For Single Loop Surveillance Systems. 82nd Annual Meeting
Transportation Research Board . 38 U.S. Environmental Protection Agency (EPA). (n.d.). A Wedge Analysis of the U.S.
Transportation Sector. Retrieved August 04, 2011, from
http://www.epa.gov/oms/climate/420f07049.htm 39 World Health Organization (WHO). (n.d.). Violence and Injury Prevention and Disability (VIP).
Retrieved February 9, 2011, from World Health Organization (WHO):
http://www.who.int/violence_injury_prevention/publications/road_traffic/world_report/en/ 40 Sofge, E. (2009, October 1). DARPA's Robot Car Race Hits the City: 2007 Preview.
Retrieved August 5, 2011, from Popular Mechanics:
http://www.popularmechanics.com/technology/engineering/robots/4228634 41 Thrun, S. (2010, October 9). What we’re driving at. Retrieved August 5, 2011, from
The Official Google Blog: http://googleblog.blogspot.com/2010/10/what-were-driving-at.html
42 Skyway Concession Company, LLC . (n.d.). About the Skyway. Retrieved August 05,
2011, from Chicago Skyway: http://www.chicagoskyway.org/about/