traffic data visualization shashi shekhar spatial database lab department of computer science...
TRANSCRIPT

Traffic Data Visualization
Shashi Shekhar
Spatial Database LabDepartment of Computer Science
University of Minnesota
Http://www.cs.umn.edu/research/shashi-group/
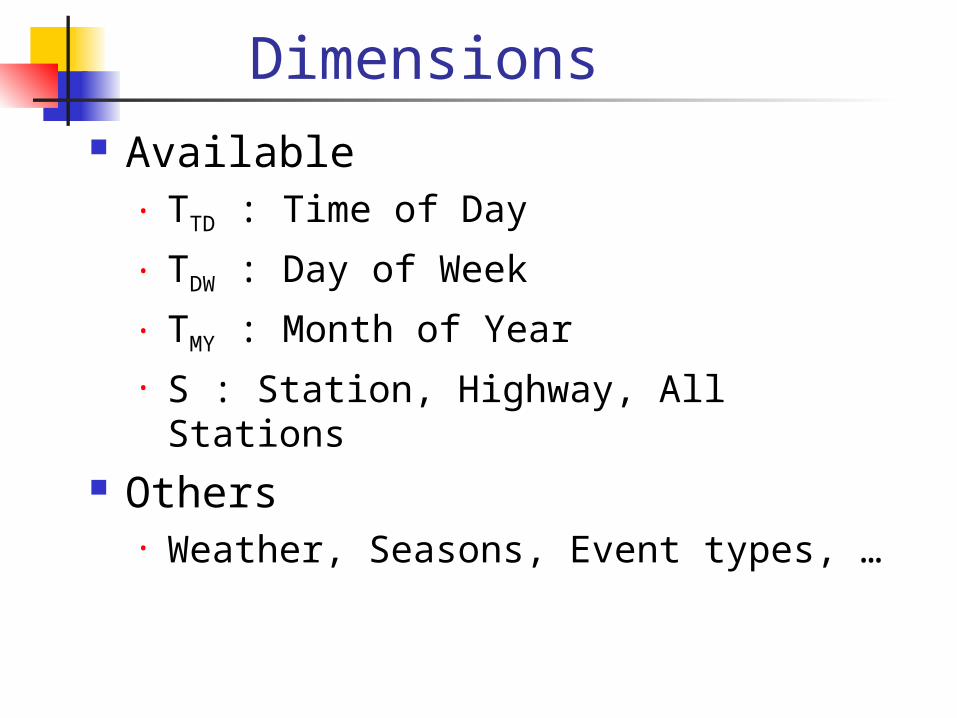
Dimensions Available
• TTD : Time of Day
• TDW : Day of Week
• TMY : Month of Year• S : Station, Highway, All Stations
Others• Weather, Seasons, Event types, …
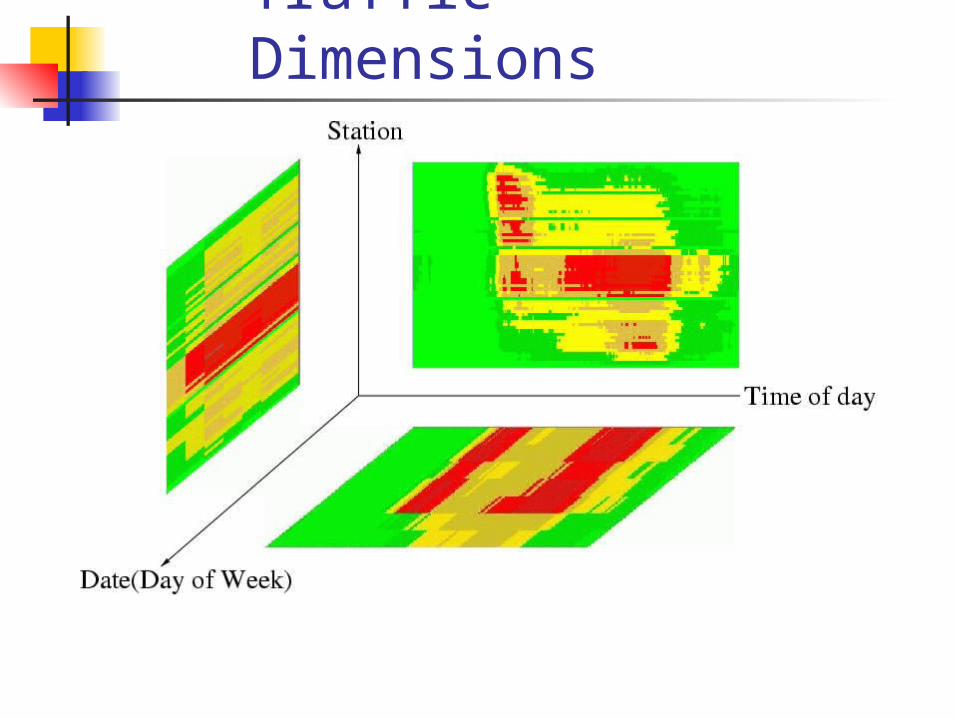
Traffic Dimensions
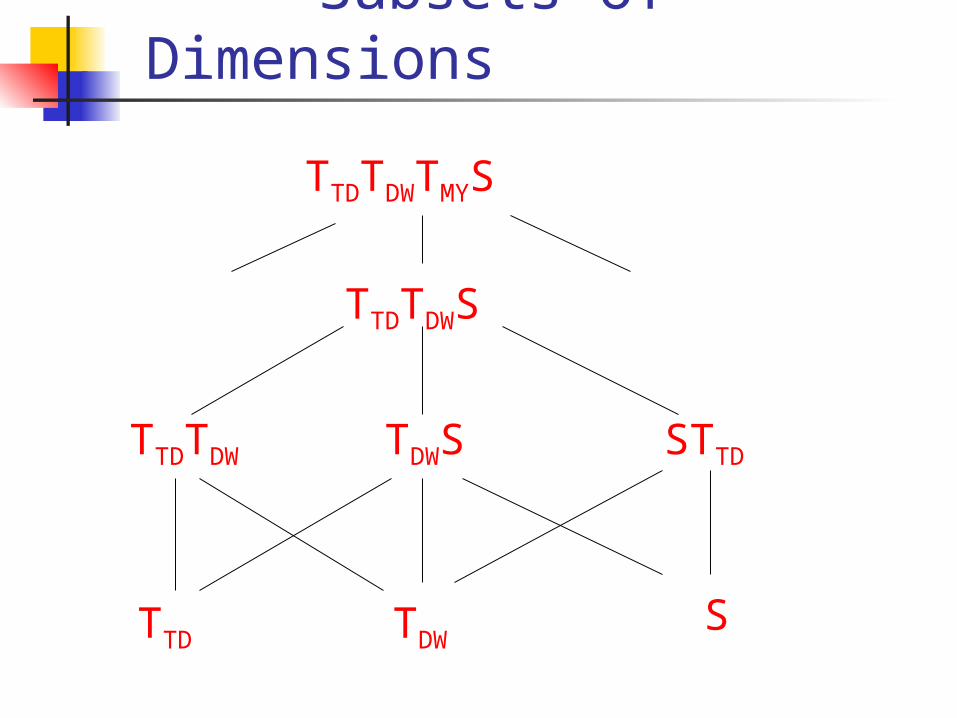
Subsets of Dimensions
TTDTDWS
TTDTDW TDWS STTD
TTD TDWS
TTDTDWTMYS
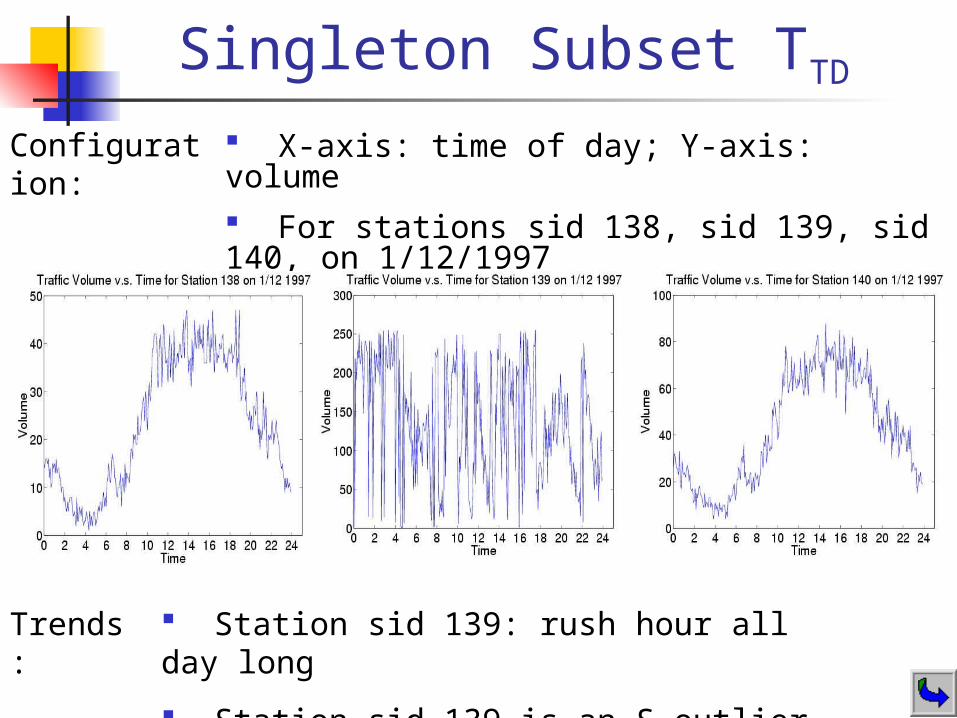
Singleton Subset TTD
X-axis: time of day; Y-axis: volume
For stations sid 138, sid 139, sid 140, on 1/12/1997
Configuration:
Trends:
Station sid 139: rush hour all day long
Station sid 139 is an S-outlier

Singleton Subset: TDW
Configuration:
X axis: Day of week; Y axis: Avg. volume. For stations 4, 8, 577 Avg. volume for Jan 1997
Trends: Friday is the busiest day of weekTuesday is the second busiest day of week

Singleton Subset: SConfiguration:
X-axis: I-35W South; Y-axis: Avg. traffic volume
Avg. 5–min traffic volume for January 12,1997
Trends: High avg. traffic volume from Franklin Ave to Nicollet AveTwo outliers: 35W/26S(sid 576) and 35W/TH55S(sid 585)

Dimension Pair: TTD-TDW
Evening rush hour broader than morning rush hour Rush hour starts early on Friday. Wednesday - narrower rush hour
Configuration:
Trends:
X-axis: Time of day; Y-axis: Day of week f(x,y): Avg. volume over all stations for Jan 1997
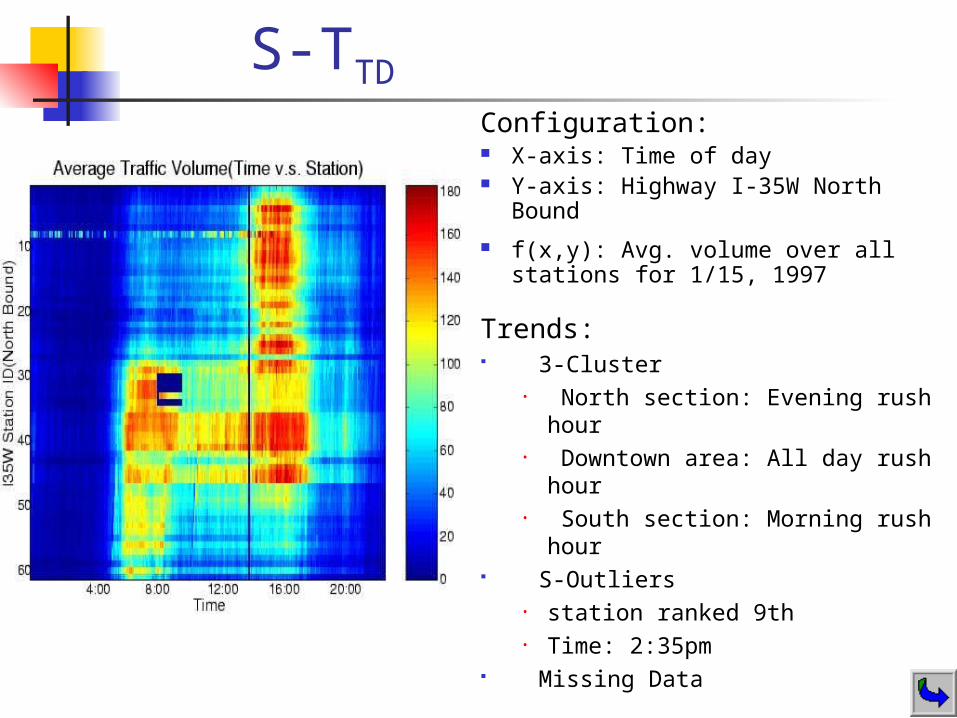
Dimension Pair: S-TTD
Configuration: X-axis: Time of day Y-axis: Highway I-35W North Bound
f(x,y): Avg. volume over all stations for 1/15, 1997
Trends: 3-Cluster
• North section: Evening rush hour• Downtown area: All day rush hour• South section: Morning rush hour
S-Outliers • station ranked 9th• Time: 2:35pm
Missing Data
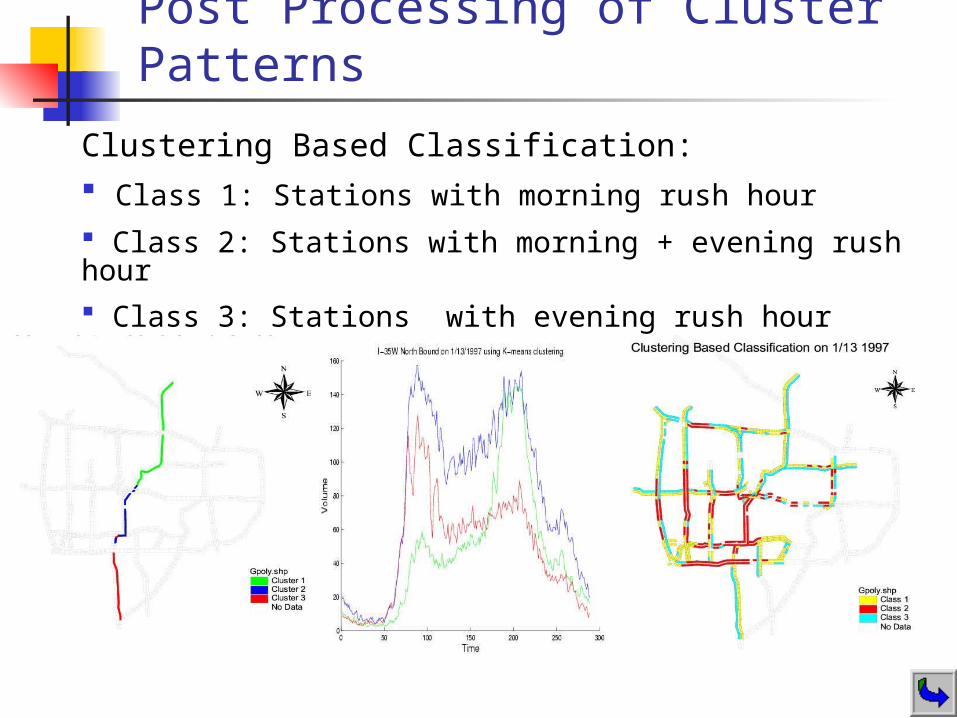
Post Processing of Cluster Patterns
Clustering Based Classification: Class 1: Stations with morning rush hour
Class 2: Stations with morning + evening rush hour
Class 3: Stations with evening rush hour
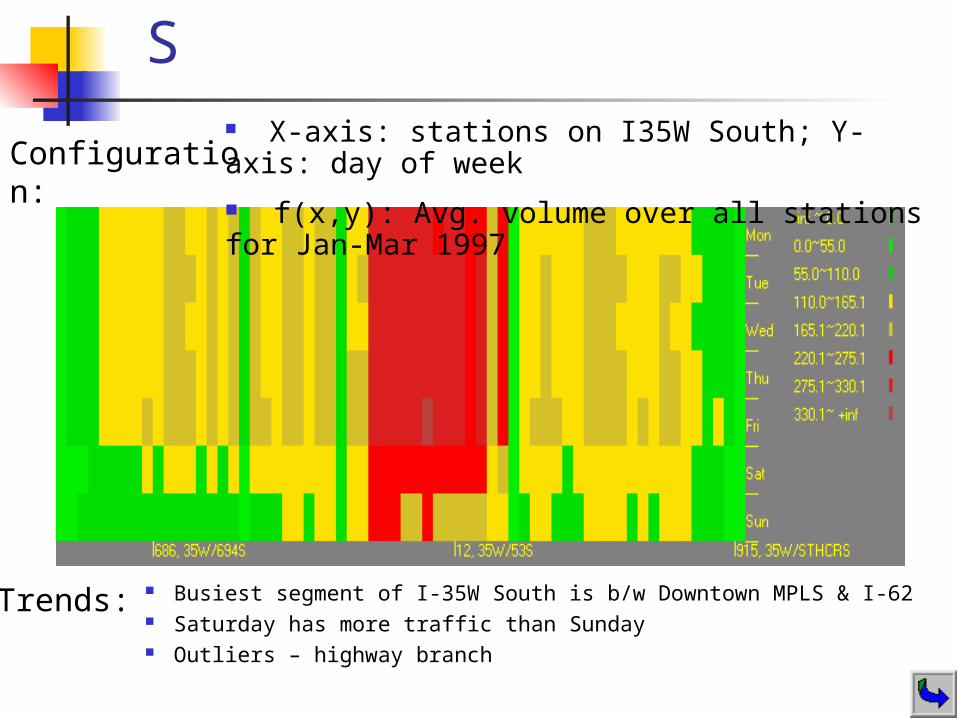
Dimension Pair: TDW-S
Busiest segment of I-35W South is b/w Downtown MPLS & I-62 Saturday has more traffic than Sunday Outliers – highway branch
Configuration: X-axis: stations on I35W South; Y-axis: day of week
f(x,y): Avg. volume over all stations for Jan-Mar 1997
Trends:

TTDTDWS: Comparison of Traffic Video
Configuration: Traffic volume on Jan 9 (Th) and 10 (F), 1997
Trends: Evening rush hour starts earlier on Friday Congested segments: I-35W (downtown MPLS – I-62);
I-94 (MPLS – St. Paul); I-494 (intersection I-35W)
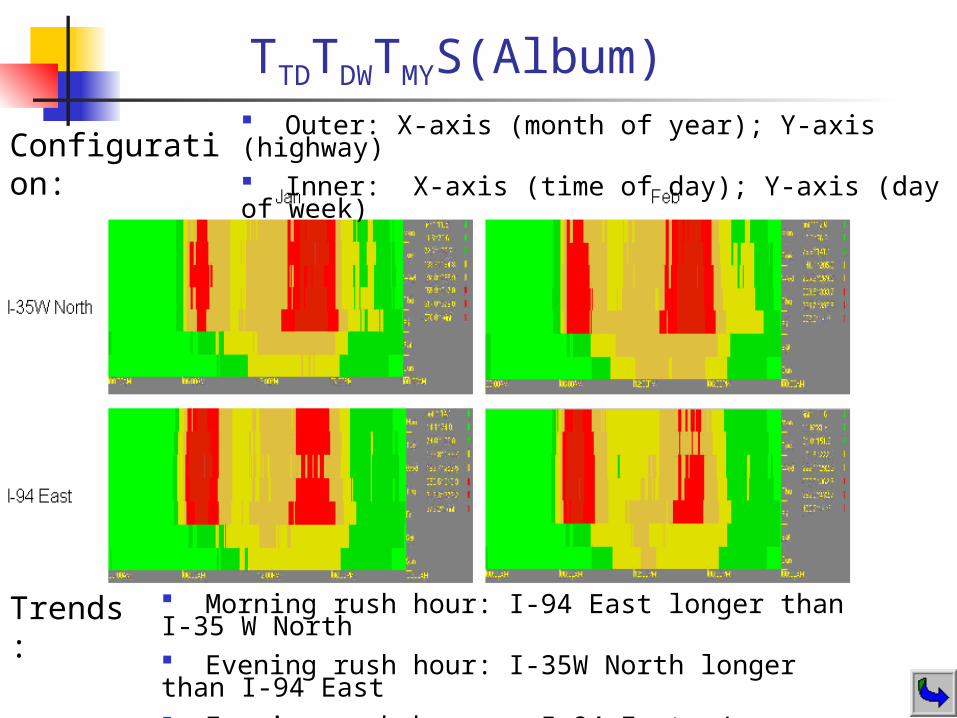
TTDTDWTMYS(Album)
Configuration: Outer: X-axis (month of year); Y-axis (highway) Inner: X-axis (time of day); Y-axis (day of week)
Trends:
Morning rush hour: I-94 East longer than I-35 W North Evening rush hour: I-35W North longer than I-94 East Evening rush hour on I-94 East: Jan longer than Feb