traffic impact assessment - online.planning.wa.gov.au
TRANSCRIPT
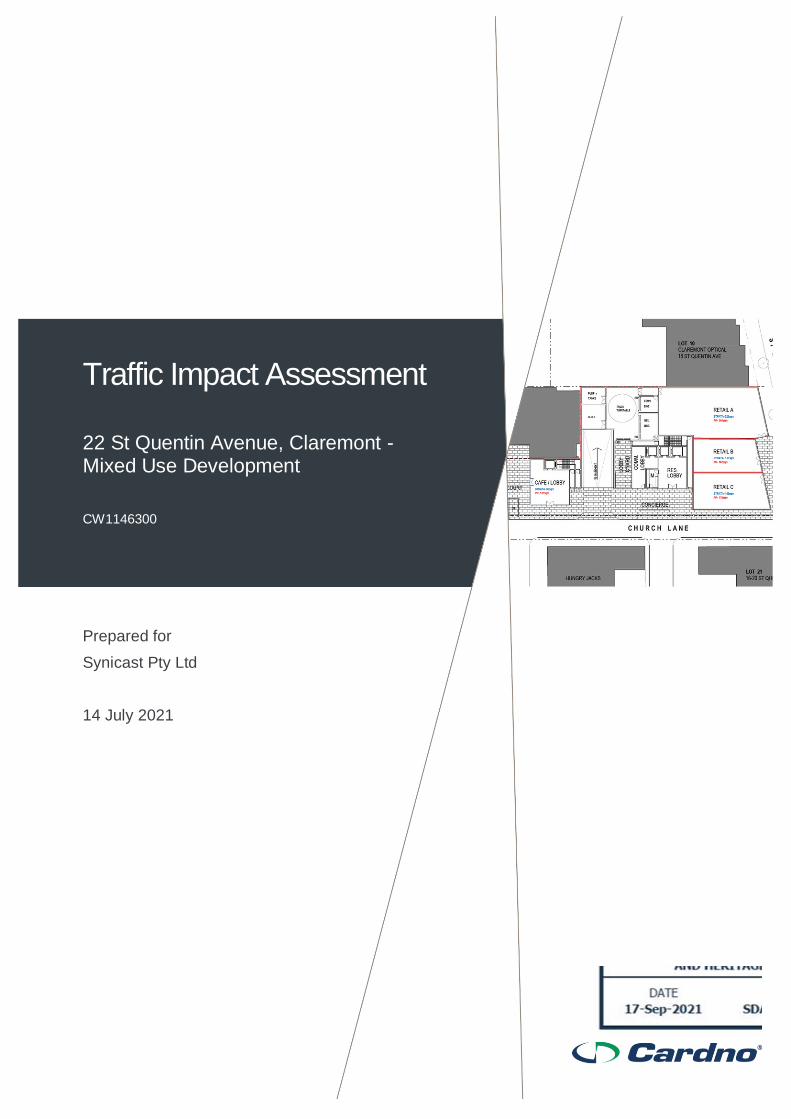
Traffic Impact Assessment
22 St Quentin Avenue, Claremont - Mixed Use Development
14 July 2021 Cardno i
Traffic Impact Assessment
22 St Quentin Avenue, Claremont - Mixed Use Development
CW1146300
Prepared for
Synicast Pty Ltd
14 July 2021
© Cardno. Copyright in the whole and every part of this document belongs to Cardno and may not be used, sold, transferred, copied or reproduced in whole or in part in any manner or form or in or on any media to any person other than by agreement with Cardno.
This document is produced by Cardno solely for the benefit and use by the client in accordance with the terms of the engagement. Cardno does not and shall not assume any responsibility or liability whatsoever to any third party arising out of any use or reliance by any third party on the content of this
document.
Our report is based on information made available by the client. The validity and comprehensiveness of supplied information has not been independently verified and, for the purposes of this report, it is assumed that the information provided to Cardno is both complete and accurate. Whilst, to the best of our knowledge, the information contained in this report is accurate at the date of issue, changes may occur to the site conditions, the site context or the applicable planning framework. This report should not be used after any such changes without consulting the provider of the report or a suitably qualified person.
CW1146300 | 14 July 2021 | Commercial in Confidence ii
Contact Information Document Information
Cardno (WA) Pty Ltd
ABN 77 009 119 000
11 Harvest Terrace
West Perth WA 6005
Australia
www.cardno.com
Phone +61 8 9273 3888
Fax +61 8 9486 8664
Prepared for Synicast Pty Ltd
Project Name 22 St Quentin Avenue,
Claremont - Mixed Use
Development
File Reference CW1143600_TR_RP_001_A
22 Quentin
St_Claremont_TIA
Job Reference CW1146300
Date 14 July 2021
Version Number B
Author(s):
Sedrik Aralar
Traffic Engineer
Effective Date 14/07/2021
Approved By:
Ray Cook
Business Leader, Traffic & Transport Planning
WA
Date Approved 14/07/2021
Document History
Version Effective Date Description of Revision Prepared by Reviewed by
A 08/04/2021 For Issue DH/SA RJC
B 14/07/2021 Updated site plan DH/SA RJC
CW1146300 | 14 July 2021 | Commercial in Confidence iii
Table of Contents
1 Introduction 1
1.1 Background 1
2 Existing Site Situation 2
2.1 Site Location 2
2.2 Surrounding Land Use 3
2.3 Existing Development 3
2.4 Existing Road Network 4
2.5 Existing Intersections 5
2.6 Existing Pedestrian / Cycle Networks 12
2.7 Existing Public Transport Facilities 13
2.8 Existing Traffic Volumes 14
2.9 Crash Assessment 15
3 Changes to Surrounding Area 18
3.1 Road Network 18
3.2 Public Transport 20
4 Development Proposal 21
4.1 Proposed Land Use 21
4.2 Site Access 22
4.3 Car Parking Provision 23
4.4 Bicycle Parking Provision 26
4.5 8.4m Waste Truck Swept Path 27
4.6 B99 Swept Path 28
5 Integration with Surrounding Area 32
5.1 Surrounding Major Attractors/Generators 32
6 Analysis of Transport Network 33
6.1 Analysis Overview 33
6.2 Assessment Years and Time Period 33
6.3 Key Assumptions 33
6.4 Development Trip Generation 34
6.5 Development Trip Distribution 36
6.6 Traffic Volumes 37
6.7 Intersection Performance 58
6.8 SIDRA Results Summary 69
7 Conclusions 70
Appendices
Appendix A WAPC CHECKLIST
Appendix B SIDRA RESULTS

CW1146300 | 14 July 2021 | Commercial in Confidence iv
Tables
Table 2-1 Road Network Description 4
Table 2-2 Bus Route Frequency 14
Table 2-3 Train Service Frequency 14
Table 2-4 Existing Weekday Mid-Block Traffic Volumes 14
Table 2-5 Total Crashes 16
Table 2-6 Total Intersection Crashes 16
Table 2-7 Total Midblock Crashes 16
Table 4-1 Car Parking Requirements 23
Table 4-2 Compliance with geometry requirements 25
Table 4-3 Bicycle Parking Provision 26
Table 5-1 Major Attractors/Generators 32
Table 6-1 Trip Generation Rates of Existing Developments 34
Table 6-2 Land uses 34
Table 6-3 Internal trip capture 35
Table 6-4 Trip Generation Rates 35
Table 6-5 Directional Trip Distribution Rates 35
Table 6-6 Development Trip Generation 35
Table 6-7 Level of Service (LoS) Performance Criteria 58
Table 6-8 SIDRA Analysis Results – Stirling Hwy/Bay View Terrace 60
Table 6-9 SIDRA Analysis Results – Queenslea Dr / Stirling Hwy / Stirling Rd 62
Table 6-10 SIDRA Results – Church Ln / Stirling Hwy 64
Table 6-11 SIDRA Analysis Results – St Quentin Ave / Church Ln 65
Table 6-12 SIDRA Analysis Results – Stirling Road / St Quentin Ave 66
Table 6-13 SIDRA Analysis Results – Avion Way / St Quentin Ave 67
Table 6-14 SIDRA Analysis Results – Bay View Terrace / St Quentin Ave 68
Figures
Figure 1-1 Aerial view of the Site 1
Figure 2-1 Site Location 2
Figure 2-2 Zoning Map of an area of the Town of Claremont 3
Figure 2-3 Road Hierarchy Map 4
Figure 2-4 Church Lane/Stirling Highway intersection 5
Figure 2-5 St Quentin Avenue/Church Lane Intersection 6
Figure 2-6 St Quentin Avenue/Avion Way intersection 7
Figure 2-7 Bay View Terrace/St Quentin Avenue intersection 8
Figure 2-8 Stirling Highway/Queenslea Drive/ Stirling Road intersection 9

CW1146300 | 14 July 2021 | Commercial in Confidence v
Figure 2-9 Stirling Highway/Bay View Terrace intersection 10
Figure 2-10 Stirling Road/St Quentin Avenue intersection 11
Figure 2-11 Perth Bike Map (Perth, Fremantle and Stirling) 12
Figure 2-12 Public Transport Network Map 13
Figure 2-13 Crash Map 15
Figure 3-1 Proposed changes to road network 19
Figure 4-1 Site Plan 21
Figure 4-2 Site Access Locations 22
Figure 4-3 Basement 1 Boom Gate 22
Figure 4-4 Waste Truck Swept Path 27
Figure 4-5 B99 Swept Path 28
Figure 4-6 Basement 1 Swept Path 30
Figure 4-7 Basement 2 Swept Path 31
Figure 6-1 Distribution Diagram 36
Figure 6-2 Trip Distribution for Bay View Terrace southbound 36
Figure 6-3 Scenario 1 – 2020 Existing Traffic without Development AM 37
Figure 6-4 Scenario 1 – 2020 Existing Traffic without Development PM 38
Figure 6-5 Scenario 1 – 2020 Existing Traffic without Development Saturday 39
Figure 6-6 Scenario 2 – 2022 Future Traffic without Development AM (future intersection layouts) 40
Figure 6-7 Scenario 2 – 2022 Future Traffic without Development PM (future intersection layouts) 41
Figure 6-8 Scenario 2 – 2022 Future Traffic without Development Saturday (future intersection layouts) 42
Figure 6-9 Scenario 2.1 – 2022 Future Traffic without Development AM (existing intersection layouts) 43
Figure 6-10 Scenario 2.1 – 2022 Future Traffic without Development PM (existing intersection layouts) 44
Figure 6-11 Scenario 2.1 – 2022 Future Traffic without Development Saturday (existing intersection layouts) 45
Figure 6-12 Scenario 3 – 2022 Future Traffic with Development AM (future intersection layouts) 46
Figure 6-13 Scenario 3 – 2022 Future Traffic with Development PM (future intersection layouts) 47
Figure 6-14 Scenario 3 – 2022 Future Traffic with Development Saturday (future intersection layouts) 48
Figure 6-15 Scenario 3.1 – 2022 Future Traffic with Development AM (existing intersection layouts) 49
Figure 6-16 Scenario 3.1 – 2022 Future Traffic with Development PM (existing intersection layouts) 50
Figure 6-17 Scenario 3.1 – 2022 Future Traffic with Development Saturday (existing intersection layouts) 51
Figure 6-18 Scenario 4– 2032 Future Traffic without Development AM (future intersection layouts) 52
Figure 6-19 Scenario 4– 2032 Future Traffic without Development PM (future intersection layouts) 53
Figure 6-20 Scenario 4– 2032 Future Traffic without Development Saturday (future intersection layouts) 54
Figure 6-21 Scenario 5– 2032 Future Traffic with Development AM (future intersection layouts) 55
Figure 6-22 Scenario 5– 2032 Future Traffic with Development PM (future intersection layouts) 56
Figure 6-23 Scenario 5– 2032 Future Traffic with Development Saturday (future intersection layouts) 57
Figure 6-24 SIDRA Layouts – Stirling Hwy/ Bay View Terrace 59
Figure 6-25 SIDRA Layouts – Queenslea Dr / Stirling Hwy / Stirling Rd 61
Figure 6-26 SIDRA Layouts – Church Ln / Stirling Hwy 63
CW1146300 | 14 July 2021 | Commercial in Confidence vi
Figure 6-27 SIDRA Layout – St Quentin Ave / Church Ln - Scenario 1 – 2020 Existing Traffic without Development 65
Figure 6-28 SIDRA Layout – Stirling Road / St Quentin Ave 66
Figure 6-29 SIDRA Layout – Avion Way / St Quentin Ave 67
Figure 6-30 SIDRA Layouts – Bay View Terrace / St Quentin Ave 68
CW1146300 | 14 July 2021 | Commercial in Confidence 1
1 Introduction
1.1 Background
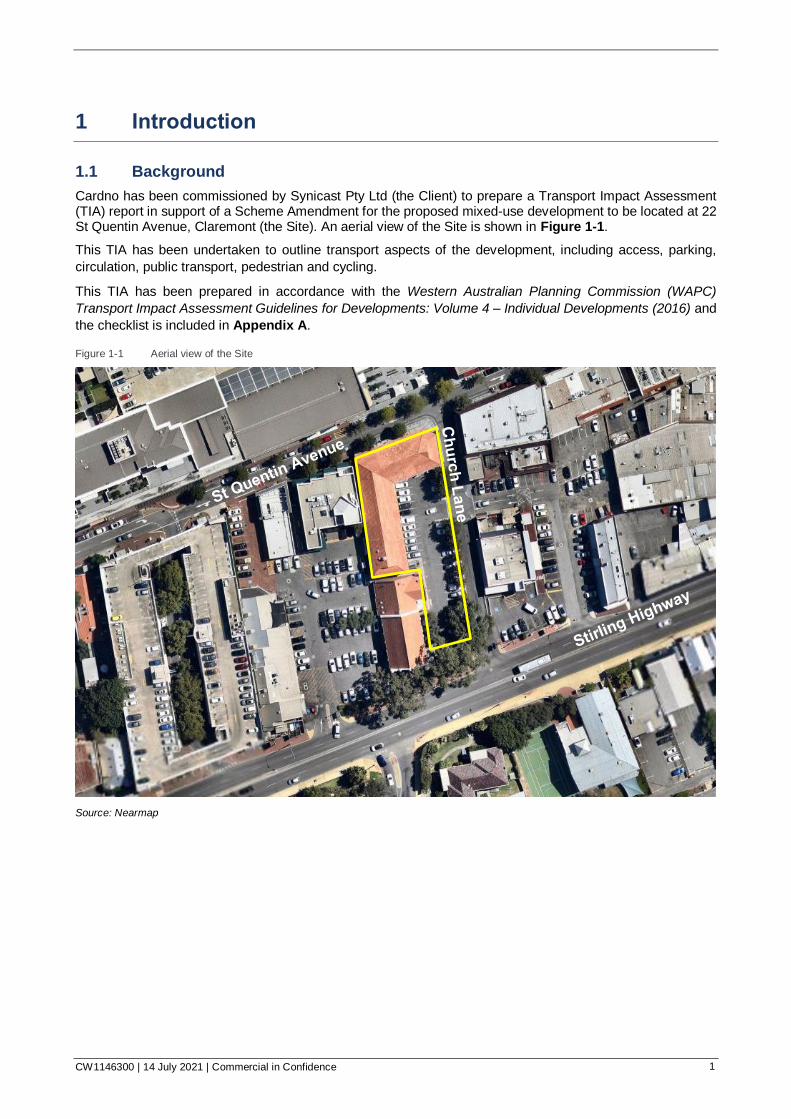
Cardno has been commissioned by Synicast Pty Ltd (the Client) to prepare a Transport Impact Assessment (TIA) report in support of a Scheme Amendment for the proposed mixed-use development to be located at 22 St Quentin Avenue, Claremont (the Site). An aerial view of the Site is shown in Figure 1-1.
This TIA has been undertaken to outline transport aspects of the development, including access, parking,
circulation, public transport, pedestrian and cycling.
This TIA has been prepared in accordance with the Western Australian Planning Commission (WAPC)
Transport Impact Assessment Guidelines for Developments: Volume 4 – Individual Developments (2016) and
the checklist is included in Appendix A.
Figure 1-1 Aerial view of the Site
Source: Nearmap
CW1146300 | 14 July 2021 | Commercial in Confidence 2
2 Existing Site Situation
2.1 Site Location
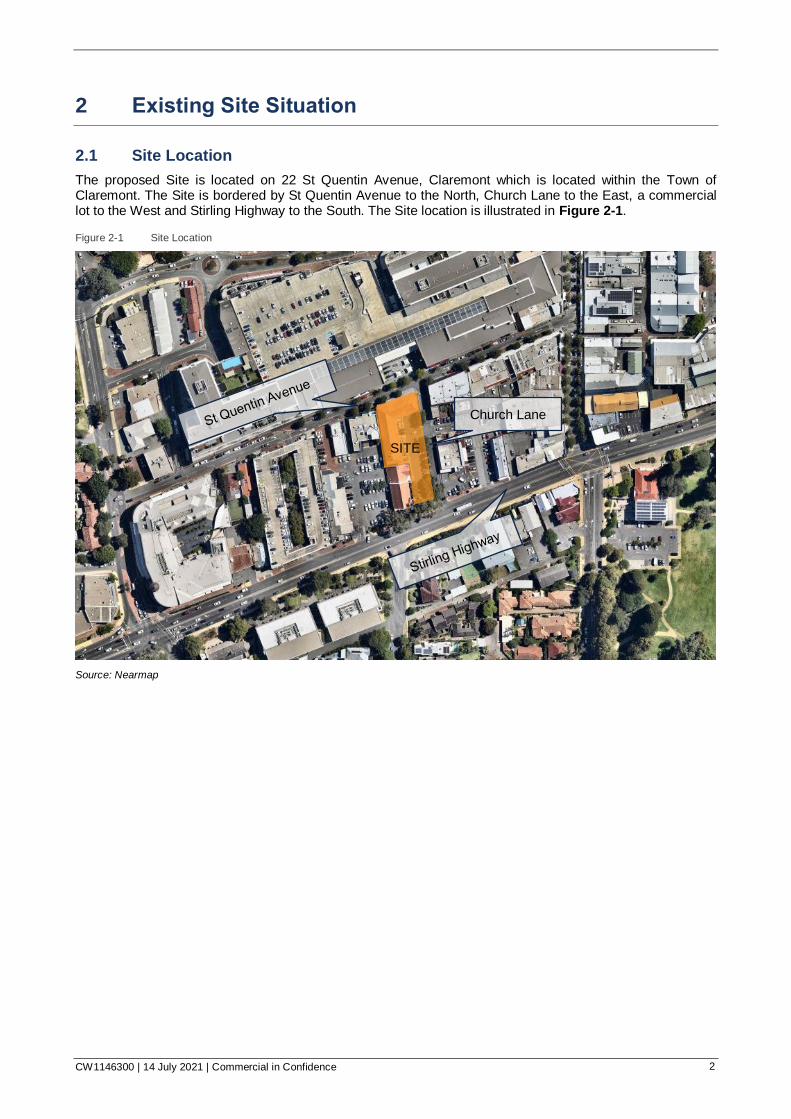
The proposed Site is located on 22 St Quentin Avenue, Claremont which is located within the Town of Claremont. The Site is bordered by St Quentin Avenue to the North, Church Lane to the East, a commercial lot to the West and Stirling Highway to the South. The Site location is illustrated in Figure 2-1.
Figure 2-1 Site Location
Source: Nearmap
SITE
Church Lane
CW1146300 | 14 July 2021 | Commercial in Confidence 3
2.2 Surrounding Land Use
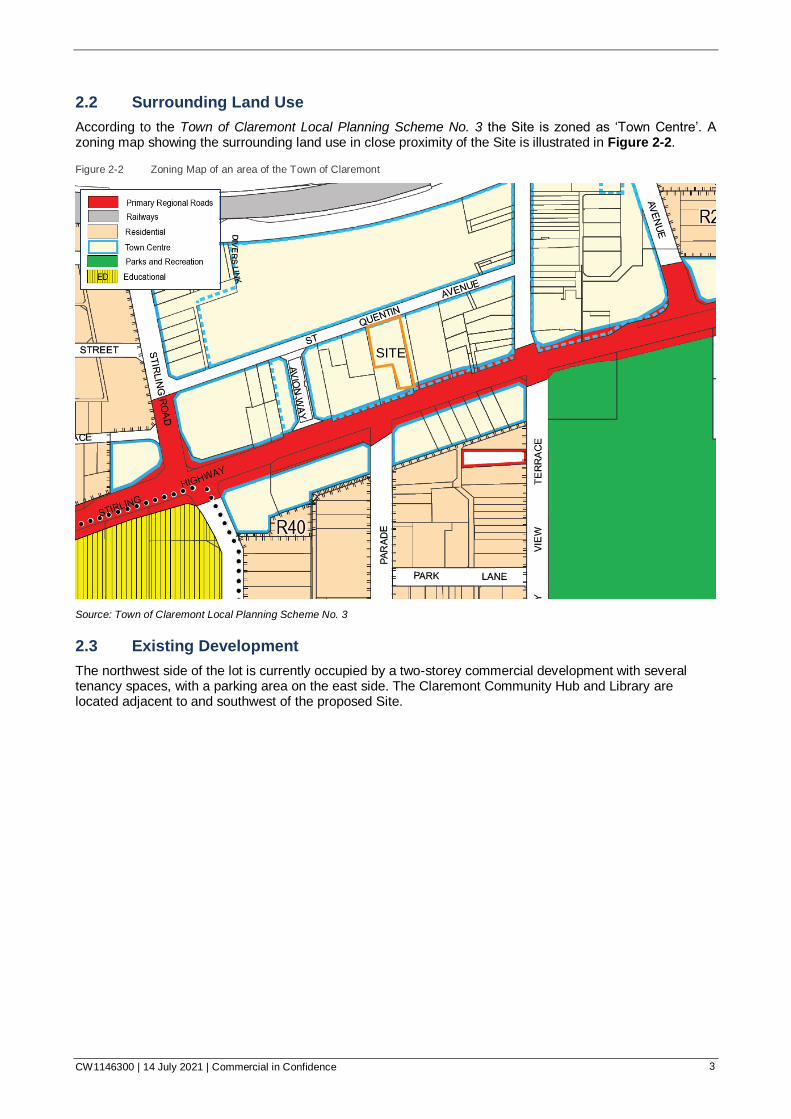
According to the Town of Claremont Local Planning Scheme No. 3 the Site is zoned as ‘Town Centre’. A zoning map showing the surrounding land use in close proximity of the Site is illustrated in Figure 2-2.
Figure 2-2 Zoning Map of an area of the Town of Claremont
Source: Town of Claremont Local Planning Scheme No. 3
2.3 Existing Development
The northwest side of the lot is currently occupied by a two-storey commercial development with several tenancy spaces, with a parking area on the east side. The Claremont Community Hub and Library are located adjacent to and southwest of the proposed Site.
SITE
CW1146300 | 14 July 2021 | Commercial in Confidence 4
2.4 Existing Road Network
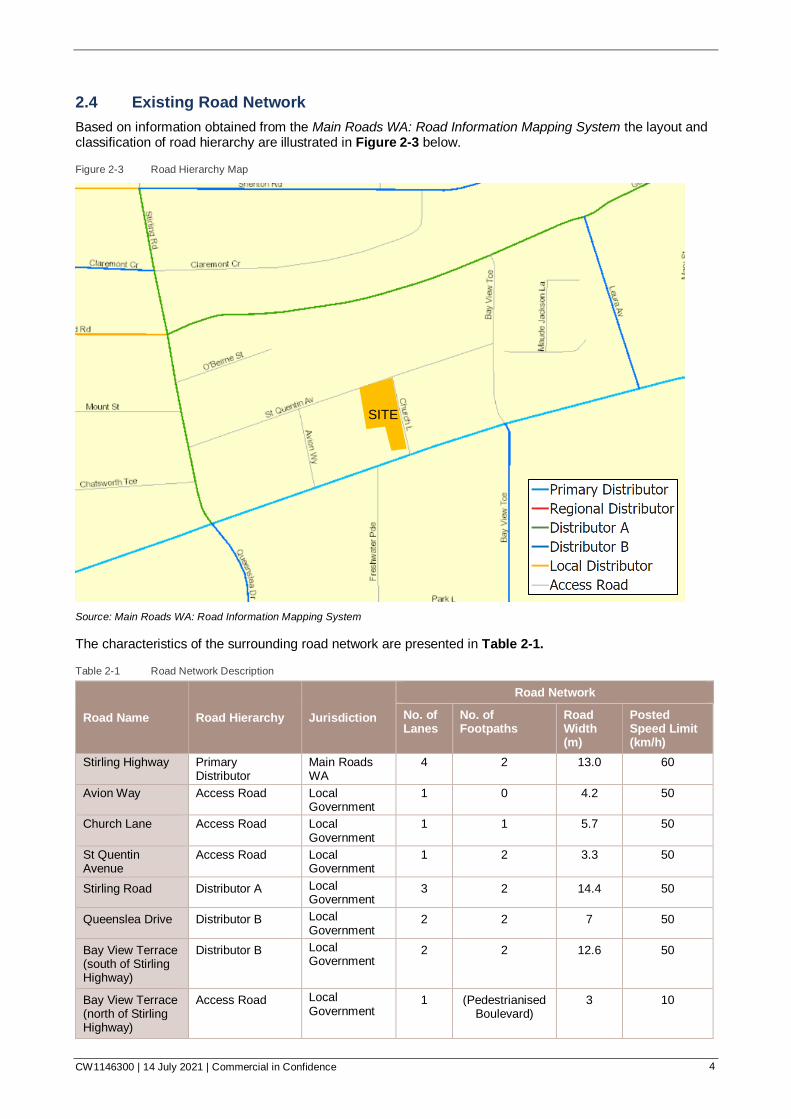
Based on information obtained from the Main Roads WA: Road Information Mapping System the layout and classification of road hierarchy are illustrated in Figure 2-3 below.
Figure 2-3 Road Hierarchy Map
Source: Main Roads WA: Road Information Mapping System
The characteristics of the surrounding road network are presented in Table 2-1.
Table 2-1 Road Network Description
Road Name Road Hierarchy Jurisdiction
Road Network
No. of Lanes
No. of Footpaths
Road Width (m)
Posted Speed Limit (km/h)
Stirling Highway Primary Distributor
Main Roads WA
4 2 13.0 60
Avion Way Access Road Local Government
1 0 4.2 50
Church Lane Access Road Local Government
1 1 5.7 50
St Quentin Avenue
Access Road Local Government
1 2 3.3 50
Stirling Road Distributor A Local Government
3 2 14.4 50
Queenslea Drive Distributor B Local Government
2 2 7 50
Bay View Terrace (south of Stirling Highway)
Distributor B Local Government
2 2 12.6 50
Bay View Terrace (north of Stirling Highway)
Access Road Local Government
1 (Pedestrianised Boulevard)
3 10
SITE
CW1146300 | 14 July 2021 | Commercial in Confidence 5
2.5 Existing Intersections
The following discusses the intersections in the proximity of the development:
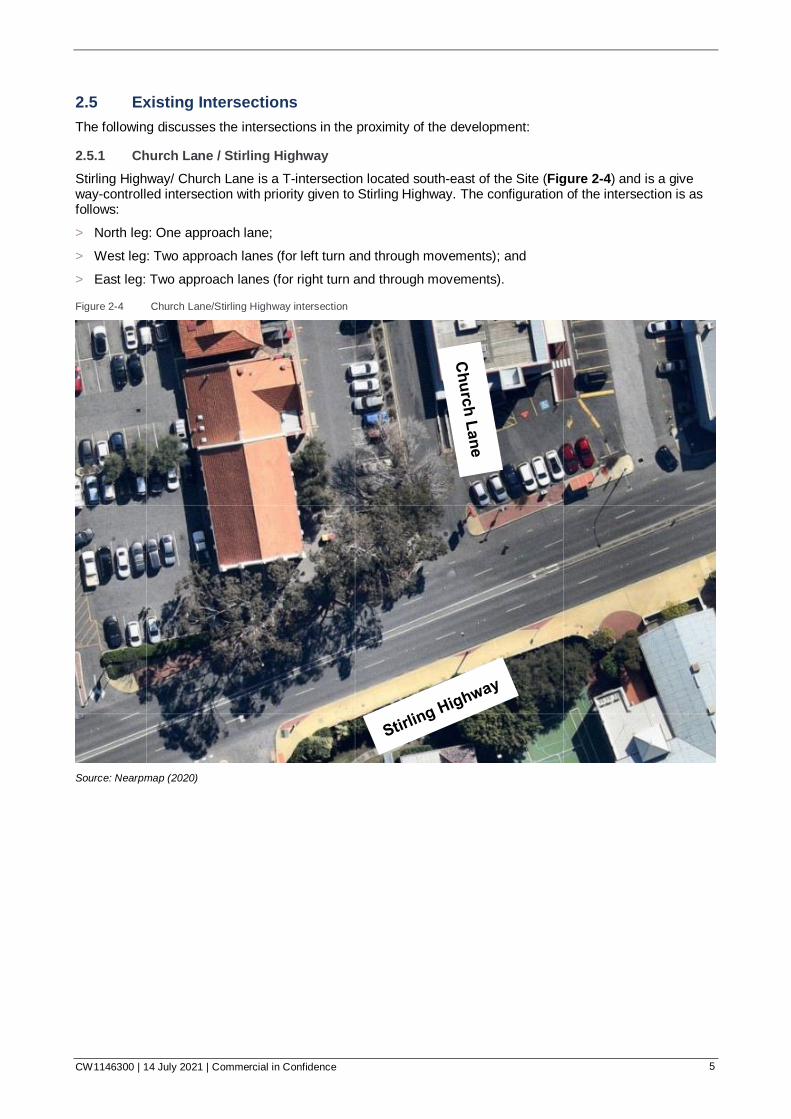
2.5.1 Church Lane / Stirling Highway
Stirling Highway/ Church Lane is a T-intersection located south-east of the Site (Figure 2-4) and is a give way-controlled intersection with priority given to Stirling Highway. The configuration of the intersection is as follows:
> North leg: One approach lane;
> West leg: Two approach lanes (for left turn and through movements); and
> East leg: Two approach lanes (for right turn and through movements).
Figure 2-4 Church Lane/Stirling Highway intersection
Source: Nearpmap (2020)

CW1146300 | 14 July 2021 | Commercial in Confidence 6
2.5.2 St Quentin Avenue/Church Lane
St Quentin Avenue/Church Lane is a T-intersection located north east of the Site (Figure 2-5) and is a give way-controlled intersection with priority given to St Quentin Avenue.
> South leg: One approach lane (for left turn movements);
> East leg: One approach lane (for both left and through movements); and
> West leg: One way westbound.
Figure 2-5 St Quentin Avenue/Church Lane Intersection
Source: Nearmap (2020)
CW1146300 | 14 July 2021 | Commercial in Confidence 7
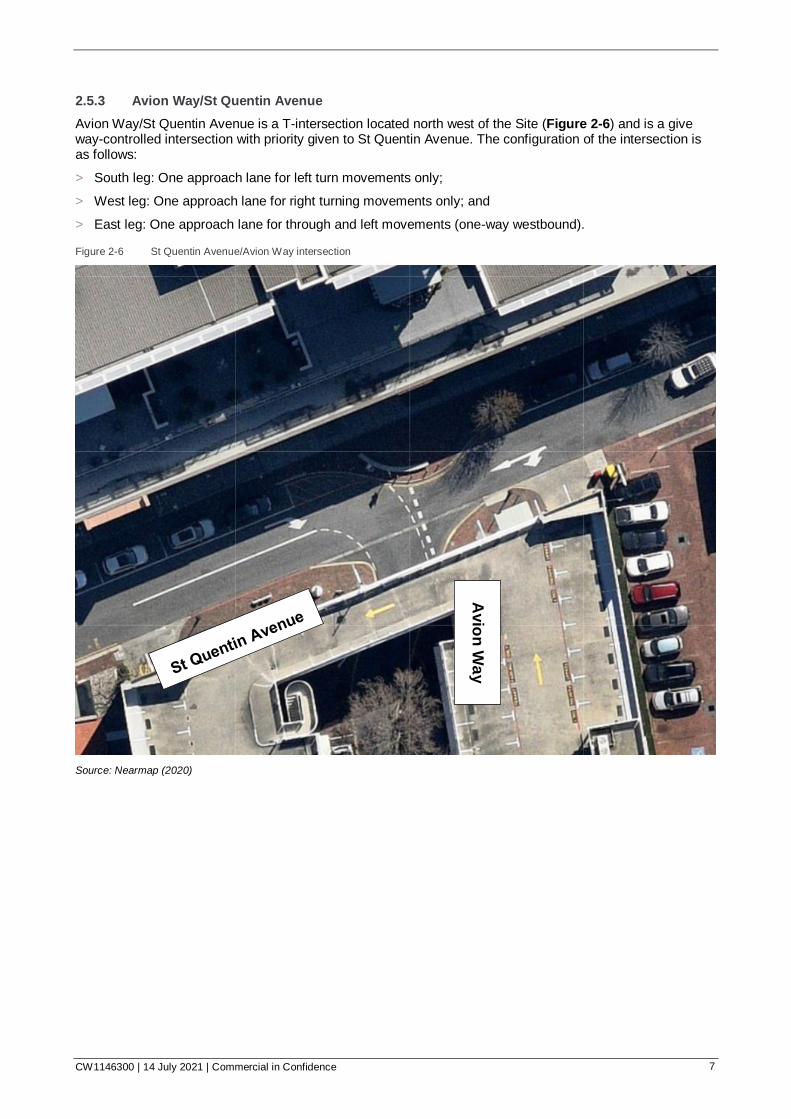
2.5.3 Avion Way/St Quentin Avenue
Avion Way/St Quentin Avenue is a T-intersection located north west of the Site (Figure 2-6) and is a give way-controlled intersection with priority given to St Quentin Avenue. The configuration of the intersection is as follows:
> South leg: One approach lane for left turn movements only;
> West leg: One approach lane for right turning movements only; and
> East leg: One approach lane for through and left movements (one-way westbound).
Figure 2-6 St Quentin Avenue/Avion Way intersection
Source: Nearmap (2020)
Avio
n W
ay
CW1146300 | 14 July 2021 | Commercial in Confidence 8
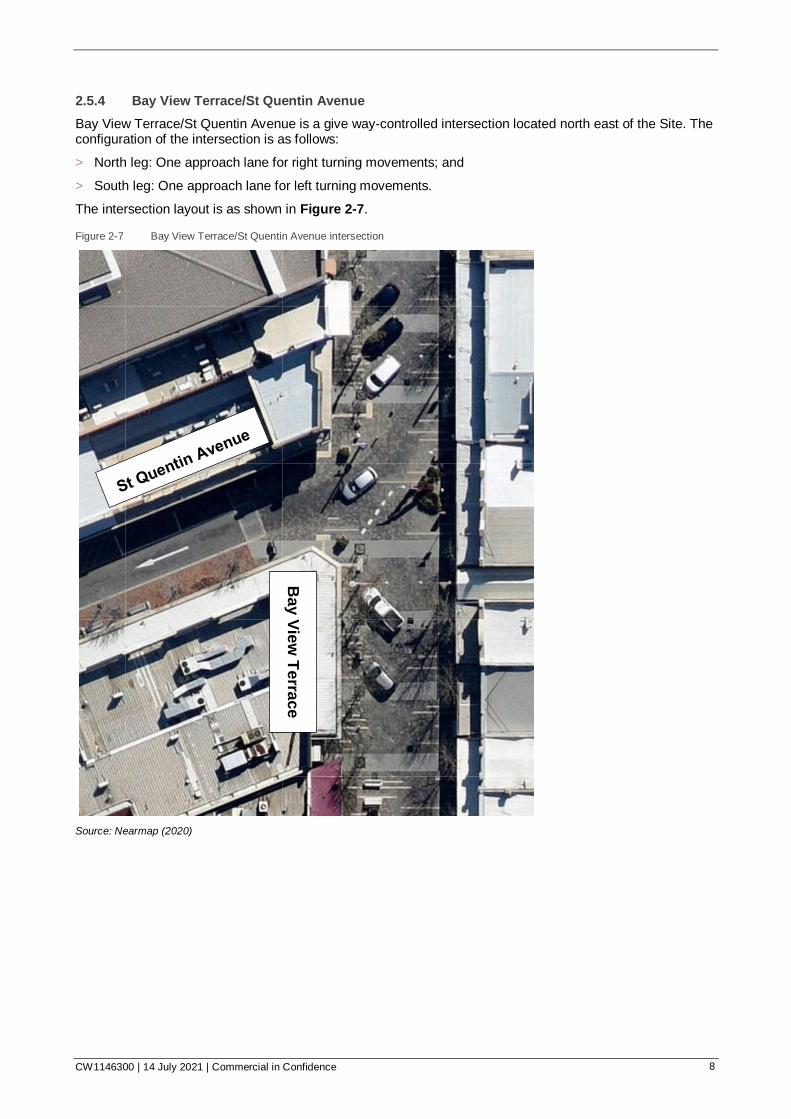
2.5.4 Bay View Terrace/St Quentin Avenue
Bay View Terrace/St Quentin Avenue is a give way-controlled intersection located north east of the Site. The configuration of the intersection is as follows:
> North leg: One approach lane for right turning movements; and
> South leg: One approach lane for left turning movements.
The intersection layout is as shown in Figure 2-7.
Figure 2-7 Bay View Terrace/St Quentin Avenue intersection
Source: Nearmap (2020)
Bay V
iew
Te
rrac
e

CW1146300 | 14 July 2021 | Commercial in Confidence 9
2.5.5 Stirling Highway/Queenslea Drive/Stirling Road
Stirling Highway/Queenslea Drive/Stirling Road is a four-way signalised intersection located south west of the Site. The configuration of the intersection is as follows:
> North leg: Two approach lanes for right and through movements with a left turn slip lane;
> South leg: One approach lane for right and through movements with a dedicated left lane;
> West leg: Two approach lanes for through movements with dedicated left and right turn lanes; and
> East leg: Two approach lanes for left and through movements with a dedicated right turn lane.
The intersection layout is as shown in Figure 2-8.
Figure 2-8 Stirling Highway/Queenslea Drive/ Stirling Road intersection
Source: Nearmap (2020)
CW1146300 | 14 July 2021 | Commercial in Confidence 10
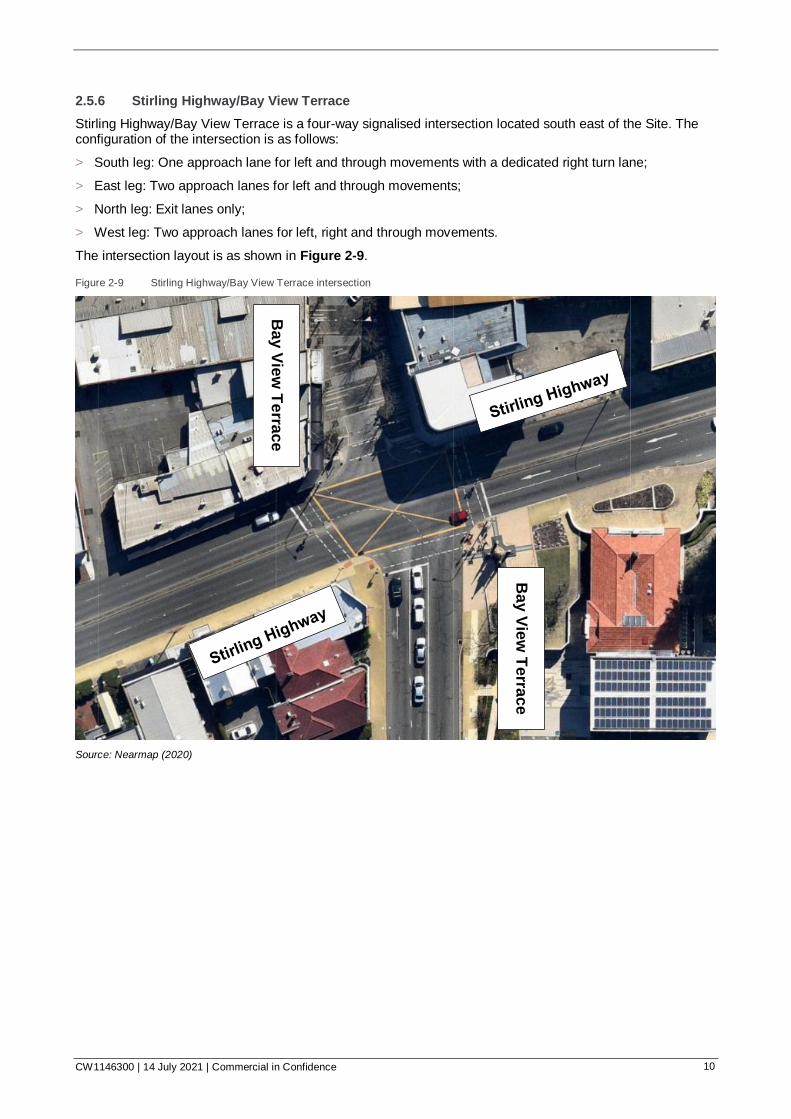
2.5.6 Stirling Highway/Bay View Terrace
Stirling Highway/Bay View Terrace is a four-way signalised intersection located south east of the Site. The configuration of the intersection is as follows:
> South leg: One approach lane for left and through movements with a dedicated right turn lane;
> East leg: Two approach lanes for left and through movements;
> North leg: Exit lanes only;
> West leg: Two approach lanes for left, right and through movements.
The intersection layout is as shown in Figure 2-9.
Figure 2-9 Stirling Highway/Bay View Terrace intersection
Source: Nearmap (2020)
Bay V
iew
Te
rrac
e
Bay V
iew
Te
rrac
e
CW1146300 | 14 July 2021 | Commercial in Confidence 11
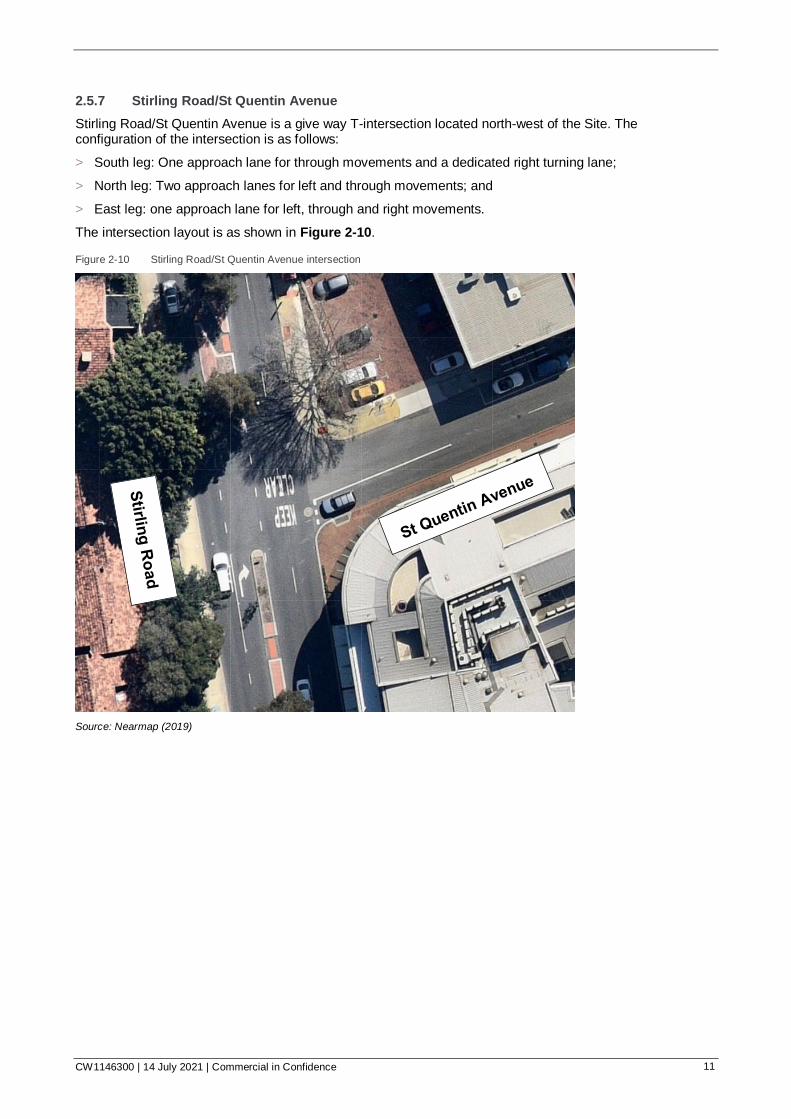
2.5.7 Stirling Road/St Quentin Avenue
Stirling Road/St Quentin Avenue is a give way T-intersection located north-west of the Site. The configuration of the intersection is as follows:
> South leg: One approach lane for through movements and a dedicated right turning lane;
> North leg: Two approach lanes for left and through movements; and
> East leg: one approach lane for left, through and right movements.
The intersection layout is as shown in Figure 2-10.
Figure 2-10 Stirling Road/St Quentin Avenue intersection
Source: Nearmap (2019)
CW1146300 | 14 July 2021 | Commercial in Confidence 12
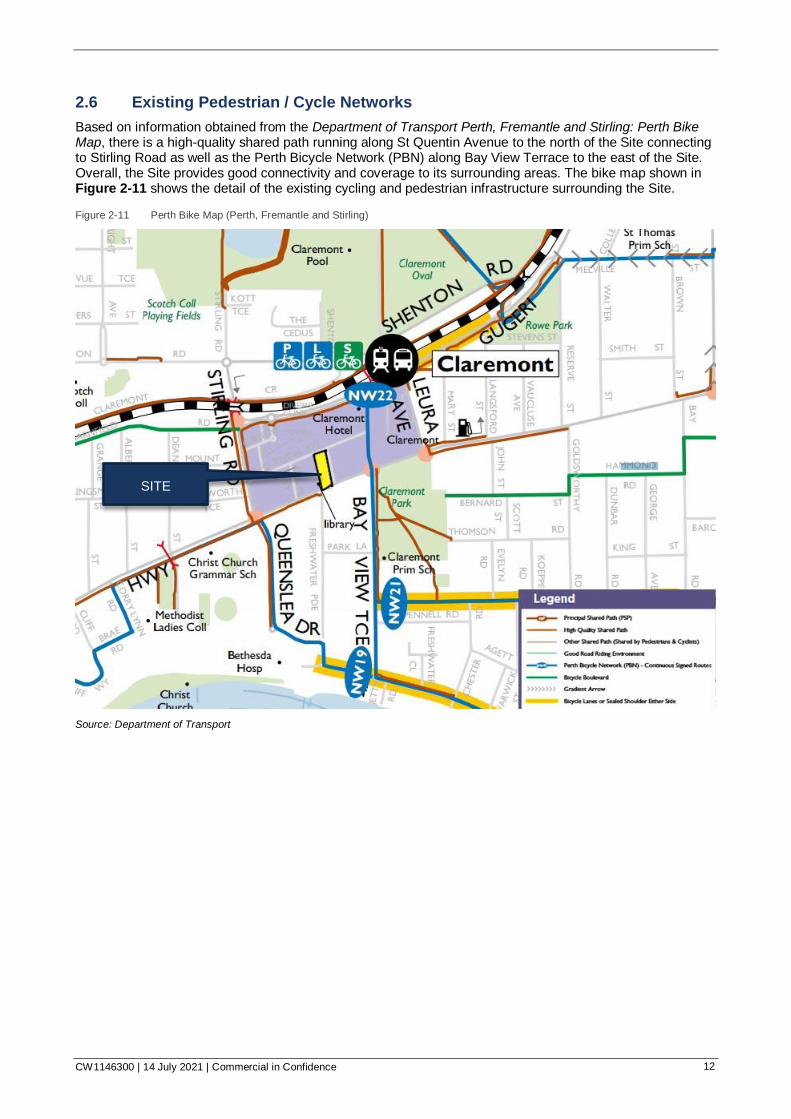
2.6 Existing Pedestrian / Cycle Networks
Based on information obtained from the Department of Transport Perth, Fremantle and Stirling: Perth Bike Map, there is a high-quality shared path running along St Quentin Avenue to the north of the Site connecting to Stirling Road as well as the Perth Bicycle Network (PBN) along Bay View Terrace to the east of the Site. Overall, the Site provides good connectivity and coverage to its surrounding areas. The bike map shown in Figure 2-11 shows the detail of the existing cycling and pedestrian infrastructure surrounding the Site.
Figure 2-11 Perth Bike Map (Perth, Fremantle and Stirling)
Source: Department of Transport
SITE

CW1146300 | 14 July 2021 | Commercial in Confidence 13
2.7 Existing Public Transport Facilities
Train and bus services are located within close proximity of the Site as shown in the public transport map in Figure 2-12. The Site is serviced by numerous bus services running along major road corridors near the Site. The nearest bus stop is located along Stirling Highway to the east of the Site. The Site is served by bus service 23, 24, 25, 102, 103, 107, 998 and 999. Bus service 103, 998 and 999 travel along Stirling Highway, bus routes 102 and 107 traverses along Stirling Highway then deviates onto Leura Avenue to Gugeri Street and bus service 23, 24, 25 travel along Leura Avenue only.
The frequencies of buses and trains are summarised in Table 2-2 and Table 2-3 respectively.
Overall, the public transport amenity within the vicinity of the Site is excellent with a high frequency of bus and train services within walking distance.
Figure 2-12 Public Transport Network Map
Source: Transperth
SITE

CW1146300 | 14 July 2021 | Commercial in Confidence 14
Table 2-2 Bus Route Frequency
Bus Route
Route Description Frequency
Direction Weekdays Saturday Sunday & Public Holidays
23 Perth – Claremont Station From Perth 3 trips:
7:24 AM, 4:55 PM, 5:25 PM
- -
To Perth 3 trips:
7:05 AM, 7:33 AM, 3:45 PM
- -
24 East Perth – Claremont Station 10-60 minutes 30-60 minutes 30-60 minutes
25 Perth – Claremont Station 30-60 minutes 60 minutes -
102 Perth – Cottesloe Station 15-60 minutes 30-60 minutes 30-60 minutes
103 East Perth – Fremantle Station 30 minutes 60 minutes 60 minutes
107 Perth – Fremantle Station 15-60 minutes 60 minutes 120 minutes
998 Fremantle Station – South Street
15 minutes 30 minutes 30 minutes
999 South Street – Fremantle 15 minutes 30 minutes 30 minutes
Source: Transperth
Table 2-3 Train Service Frequency
Train Route Weekday (Peak) Weekday
(Off-Peak) Saturday
Sunday & Public Holiday
Fremantle Line 10 min 15-30 mins 15-30 mins 15-30 mins
Source: Transperth
2.8 Existing Traffic Volumes
Existing traffic volumes were obtained from the Main Roads Western Australia’s Traffic Map and Town of Claremont for key road sections in the vicinity of the site as shown in Table 2-4.
Table 2-4 Existing Weekday Mid-Block Traffic Volumes
Location Year Average Weekday Traffic Volumes (two-way)
Daily AM Peak PM Peak
Stirling Road (north of Stirling Highway) 2019/20 15,456 1,116 1,291
Stirling Highway (West of Bay view Terrace) 2020/2021 32,313 2,414 2,585
Bay View Terrace (south of St Quentin Avenue) 2018 1,111 102 99
St Quentin Avenue (west of Bay View Terrace) 2018 3,329 267 275
Avion Way (south of St Quentin Avenue) 2018 1,804 146 161
CW1146300 | 14 July 2021 | Commercial in Confidence 15
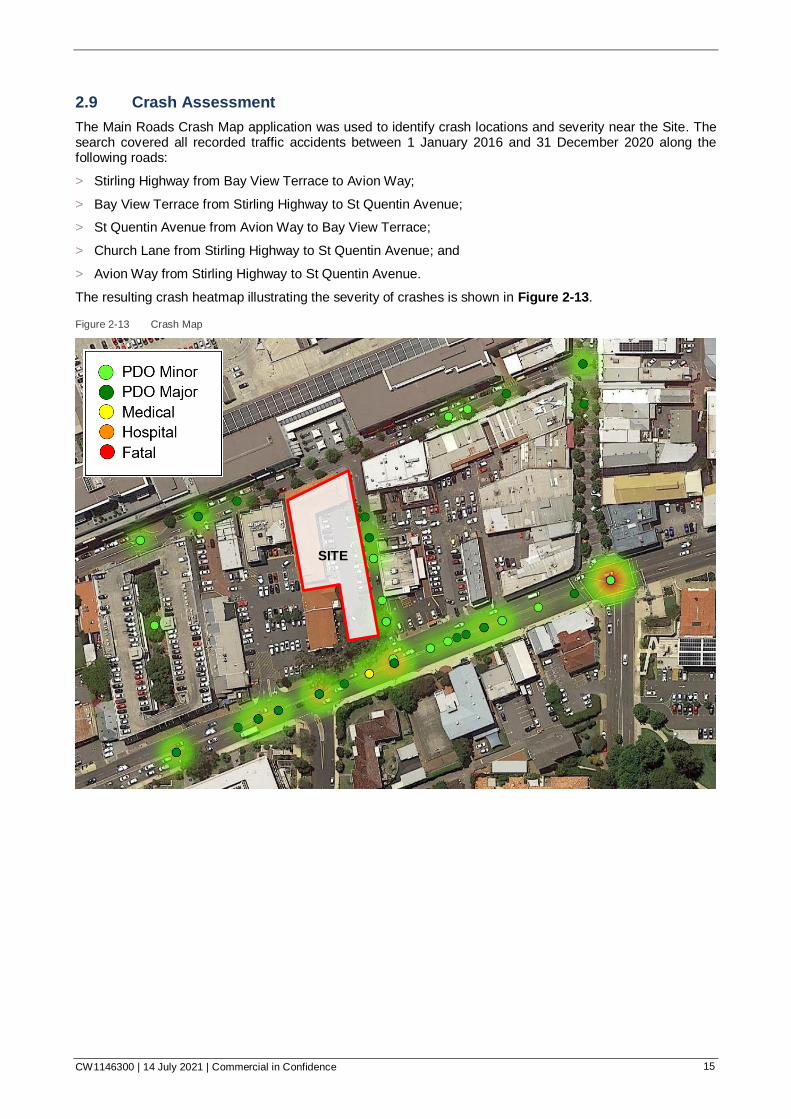
2.9 Crash Assessment
The Main Roads Crash Map application was used to identify crash locations and severity near the Site. The search covered all recorded traffic accidents between 1 January 2016 and 31 December 2020 along the following roads:
> Stirling Highway from Bay View Terrace to Avion Way;
> Bay View Terrace from Stirling Highway to St Quentin Avenue;
> St Quentin Avenue from Avion Way to Bay View Terrace;
> Church Lane from Stirling Highway to St Quentin Avenue; and
> Avion Way from Stirling Highway to St Quentin Avenue.
The resulting crash heatmap illustrating the severity of crashes is shown in Figure 2-13.
Figure 2-13 Crash Map
SITE
CW1146300 | 14 July 2021 | Commercial in Confidence 16
Details of the crashes are presented in Table 2-5, Table 2-6 and Table 2-7.
Table 2-5 Total Crashes
Type of Crash (RUM Code)
Fatal Hospital Medical Major Property Damage
Minor Property Damage
Total Crashes
Right Turn Thru 1 1 2 8 2 14
Rear End - 1 4 22 12 39
Right Angle - - - 10 10 20
Sideswipe Same Direction - - 1 10 4 15
Hit Pedestrian - 1 - - 2 3
Hit Object - - - - 1 1
Unspecified - - - 6 4 10
Total 1 3 7 56 35 102
Table 2-6 Total Intersection Crashes
Intersection Name Fatal Hospital Medical Major Property Damage
Minor Property Damage
Total Crashes
Bay View Tce - Stirling Hwy 1 1 5 9 6 22
Bay View Tce - St Quentin Ave - - - 2 - 2
St Quentin Av - Avion Wy - - - 1 1 2
Church Lane - Stirling Hwy - - - 9 2 11
Avion Way - Stirling Hwy - - - 4 1 5
Stirling Hwy - Freshwater Pde - - - 6 3 9
Total 1 1 5 31 13 51
Table 2-7 Total Midblock Crashes
Road Name Fatal Hospital Medical Major Property Damage
Minor Property Damage
Total Crashes
Bay View Tce - - - 1 1 2
St Quentin Ave - - - 3 4 7
Church Lane - - - 5 5 10
Avion Way - - - - 1 1
Stirling Hwy - 2 2 16 11 31
Total - 2 2 25 22 51
A summary of the crash data is as follows:
> One fatal crash and one crash resulting in hospitalisation was recorded at the intersection of Stirling Highway and Bay View Terrace;
> 7 crashes requiring medical attention were recorded- the majority of which occurred on Stirling Highway;
> More than 50% of the crashes resulted in major property damage, which are mostly caused by a rear-end crash type;
> Approximately 34% of the crashes (mostly of rear-end crash type) resulted in minor property damage;
CW1146300 | 14 July 2021 | Commercial in Confidence 17
> Most of the intersection crashes occurred at Stirling Highway / Bay View Terrace intersection; and
> Most of the midblock crashes occurred along Stirling Highway.
It is unlikely that the development will have any material impact on crash rates in the area, however, as the number of recorded crashes surrounding the Site is relatively high as well as the occurrence of a fatal crash, it is suggested that a road safety review is conducted by the Town of Claremont to evaluate road safety in the area.
CW1146300 | 14 July 2021 | Commercial in Confidence 18
3 Changes to Surrounding Area
3.1 Road Network
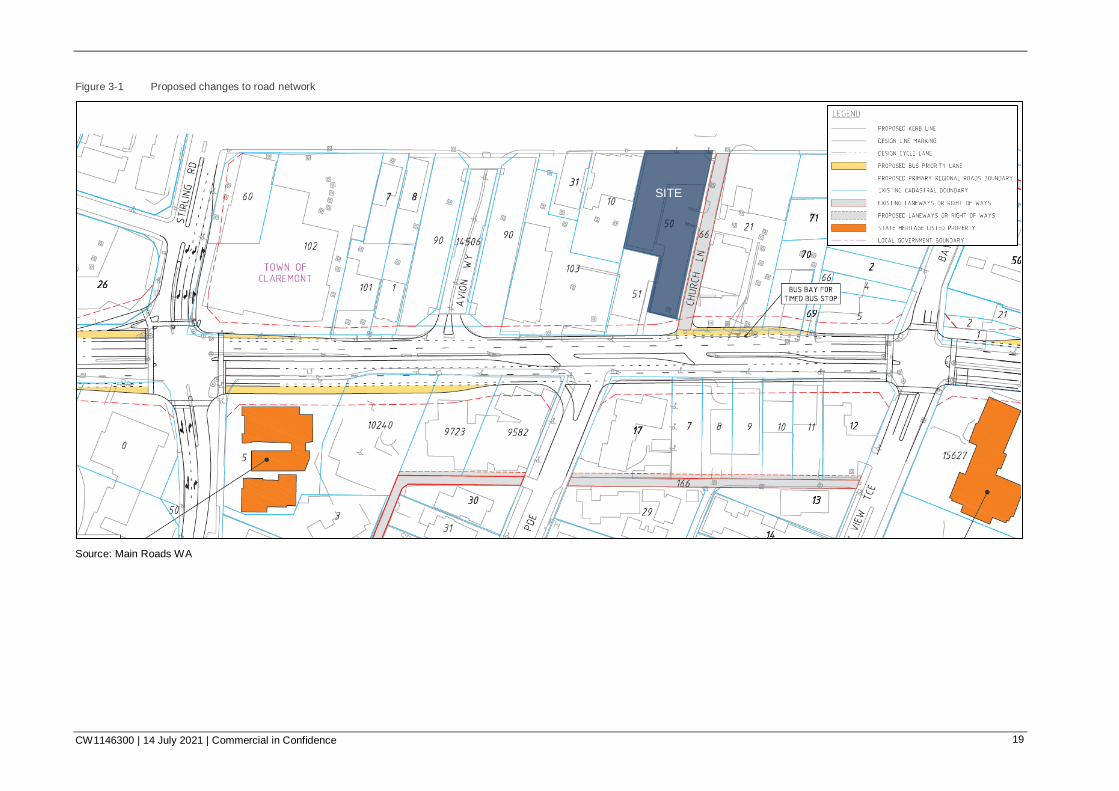
Figure 3-1 shows the proposed Stirling Highway upgrade which comprises a bus priority lane to be located southwest of the Site in the eastbound direction of Stirling Highway and proposed laneways south of Stirling Highway. It is Cardno’s understanding that the implementation of the proposed upgrades on the Stirling Highway Activity Corridor is not anticipated within the next 10-year horizon.
The road network changes proposed for the Stirling Highway will affect the distribution of traffic on the surrounding network and is enumerated below:
> Conversion of Bay View Terrace north approach to two-way;
> Additional right-turn pocket lane at the west approach of Stirling Highway-Bay View Terrace intersection;
> Removal of channelization on north approach of Stirling Road-Stirling Highway intersection;
> Redesignation of approach lanes on the northern approach of the Stirling Road-Stirling Highway intersection;
> Additional bus priority short lane on the east approach of Stirling Road-Stirling Highway intersection;
> Conversion of turn pocket lane on the west approach of Stirling Road-Stirling Highway intersection to a bus priority lane;
> Conversion of the south approach of Freshwater Parade to left-turn out only;
> Conversion of Church Lane to left-turn out only at its intersection with Stirling Highway; and
> Provision of right-turn pocket lanes from Stirling Highway into Church Lane.
CW1146300 | 14 July 2021 | Commercial in Confidence 19
Figure 3-1 Proposed changes to road network
Source: Main Roads WA
SITE
CW1146300 | 14 July 2021 | Commercial in Confidence 20
3.2 Public Transport
Cardno has contacted the Public Transport Authority and was advised that no imminent changes in public transport are to occur in the area. However, there are changes in the long term, which includes the following:
> Construction work on the Claremont Station upgrade will disrupt train services on the Fremantle Line for an extended period from February 2021 which will result in a reduction in train frequency south of the Showgrounds for a temporary period;
> Construction of a new on-street bus interchange will commence shortly; and
> Airport Line services (Claremont to High Wycombe) will commence in late 2021 and this will likely trigger some minor changes to the bus network around Claremont Station. It is anticipated that train frequencies will substantially increase between Claremont and Perth.
CW1146300 | 14 July 2021 | Commercial in Confidence 21
4 Development Proposal
4.1 Proposed Land Use
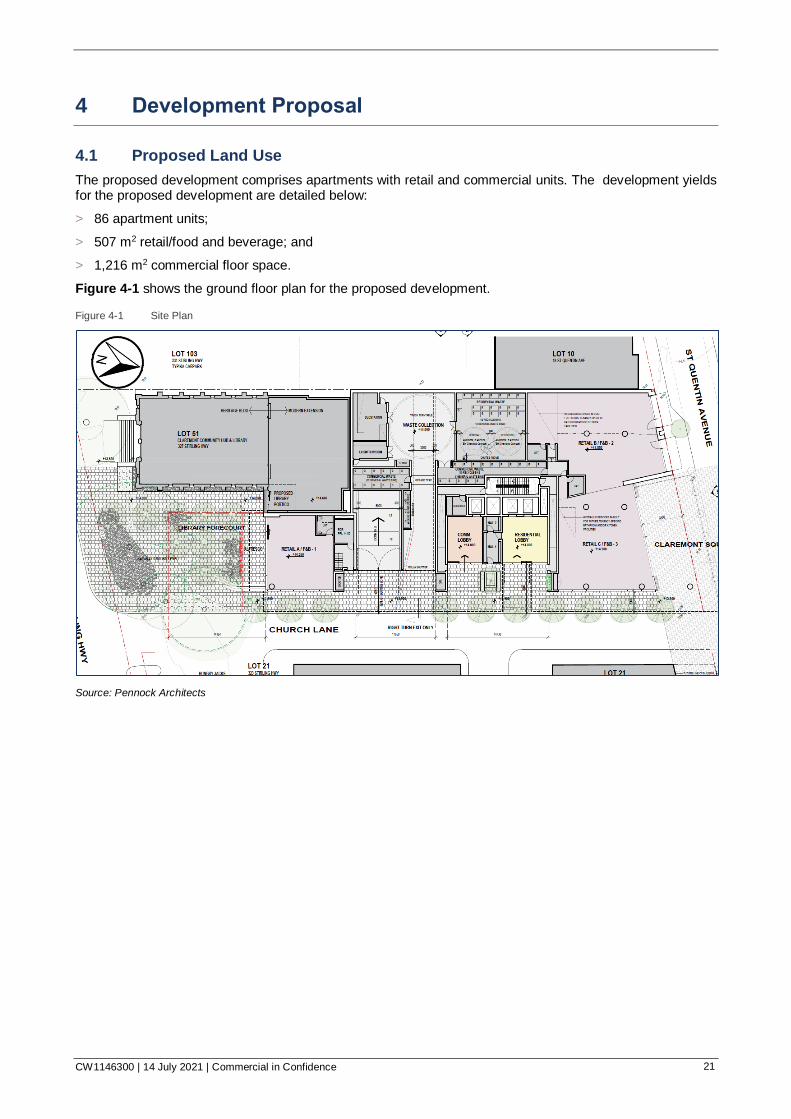
The proposed development comprises apartments with retail and commercial units. The development yields for the proposed development are detailed below:
> 86 apartment units;
> 507 m2 retail/food and beverage; and
> 1,216 m2 commercial floor space.
Figure 4-1 shows the ground floor plan for the proposed development.
Figure 4-1 Site Plan
Source: Pennock Architects

CW1146300 | 14 July 2021 | Commercial in Confidence 22
4.2 Site Access
The Site provides several access points located on the southern and eastern boundaries. Figure 4-2 shows the location of the vehicle and pedestrian accesses to different areas of the development.
Figure 4-2 Site Access Locations
Source: Pennock Architects
A boom gate is proposed to be installed at the ramp leading from the Basement 1 level to the Basement 2 level as shown in Figure 4-3. This gate will restrict access between these two basement floor levels.
Figure 4-3 Basement 1 Boom Gate
Source: Pennock Architects
Carpark
access
Retail A
access
Retail C access
Residential lobby access
Service vehicle
access
Commercial lobby
access
Vehicle Access
Pedestrian Access Retail B
accesses
Boom Gate
CW1146300 | 14 July 2021 | Commercial in Confidence 23
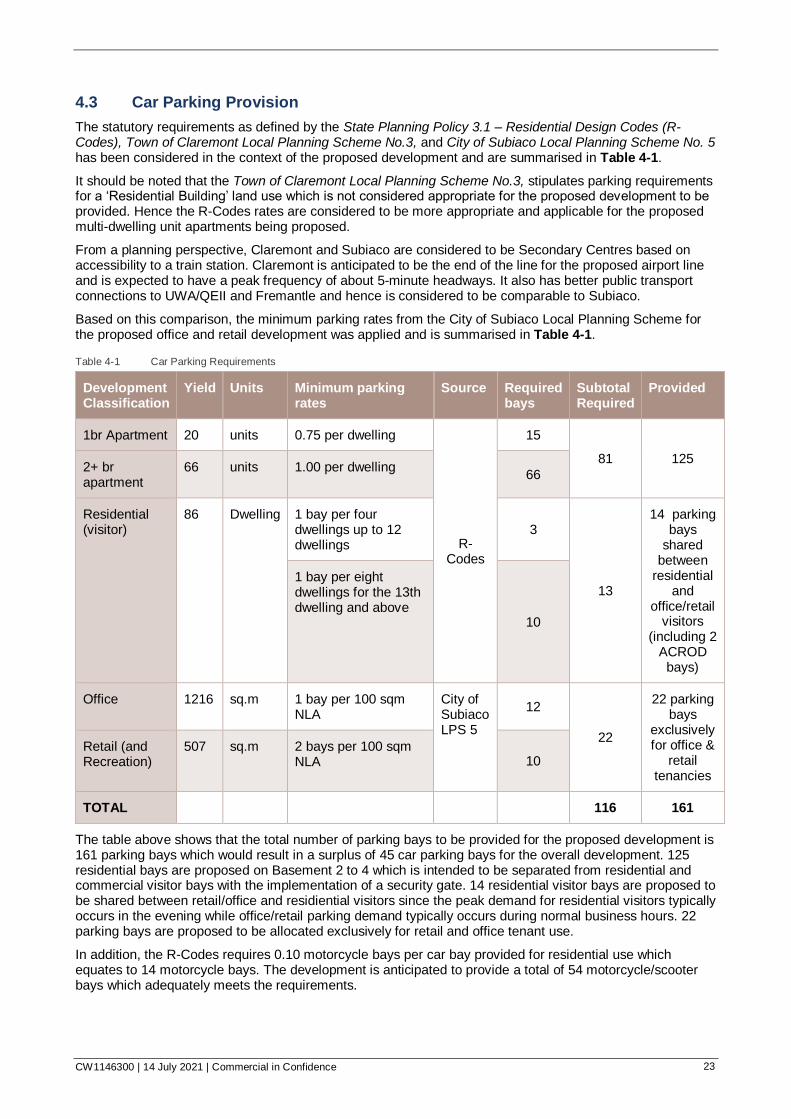
4.3 Car Parking Provision
The statutory requirements as defined by the State Planning Policy 3.1 – Residential Design Codes (R-Codes), Town of Claremont Local Planning Scheme No.3, and City of Subiaco Local Planning Scheme No. 5 has been considered in the context of the proposed development and are summarised in Table 4-1.
It should be noted that the Town of Claremont Local Planning Scheme No.3, stipulates parking requirements for a ‘Residential Building’ land use which is not considered appropriate for the proposed development to be provided. Hence the R-Codes rates are considered to be more appropriate and applicable for the proposed multi-dwelling unit apartments being proposed.
From a planning perspective, Claremont and Subiaco are considered to be Secondary Centres based on accessibility to a train station. Claremont is anticipated to be the end of the line for the proposed airport line and is expected to have a peak frequency of about 5-minute headways. It also has better public transport connections to UWA/QEII and Fremantle and hence is considered to be comparable to Subiaco.
Based on this comparison, the minimum parking rates from the City of Subiaco Local Planning Scheme for the proposed office and retail development was applied and is summarised in Table 4-1.
Table 4-1 Car Parking Requirements
Development Classification
Yield Units Minimum parking rates
Source Required bays
Subtotal Required
Provided
1br Apartment 20 units 0.75 per dwelling
R-Codes
15
81 125 2+ br apartment
66 units 1.00 per dwelling 66
Residential (visitor)
86 Dwelling 1 bay per four dwellings up to 12 dwellings
3
13
14 parking bays
shared between
residential and
office/retail visitors
(including 2 ACROD
bays)
1 bay per eight dwellings for the 13th dwelling and above
10
Office 1216 sq.m 1 bay per 100 sqm NLA
City of Subiaco LPS 5
12
22
22 parking bays
exclusively for office &
retail tenancies
Retail (and Recreation)
507 sq.m 2 bays per 100 sqm NLA 10
TOTAL 116 161
The table above shows that the total number of parking bays to be provided for the proposed development is 161 parking bays which would result in a surplus of 45 car parking bays for the overall development. 125 residential bays are proposed on Basement 2 to 4 which is intended to be separated from residential and commercial visitor bays with the implementation of a security gate. 14 residential visitor bays are proposed to be shared between retail/office and residiential visitors since the peak demand for residential visitors typically occurs in the evening while office/retail parking demand typically occurs during normal business hours. 22 parking bays are proposed to be allocated exclusively for retail and office tenant use.
In addition, the R-Codes requires 0.10 motorcycle bays per car bay provided for residential use which equates to 14 motorcycle bays. The development is anticipated to provide a total of 54 motorcycle/scooter bays which adequately meets the requirements.
CW1146300 | 14 July 2021 | Commercial in Confidence 24
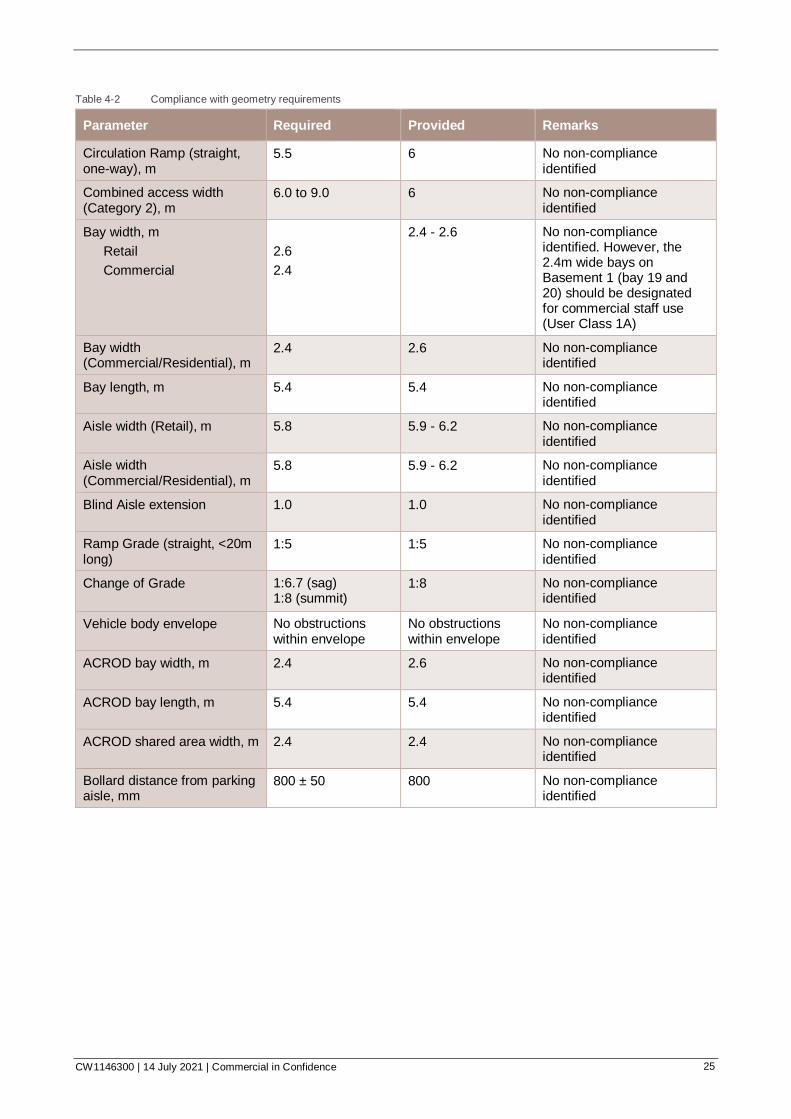
4.3.2 Compliance with Australian Standards
The parking bay geometry requirements set forth by AS2890.1 and AS2890.6 for a User Class 1A and User Class 3 facility and the parking compliance assessment is detailed in Table 4-2.
The proposed development access falls under the Category 2 access facility (development fronting a local road and has between 101 to 300 parking spaces (Class 1A).
CW1146300 | 14 July 2021 | Commercial in Confidence 25
Table 4-2 Compliance with geometry requirements
Parameter Required Provided Remarks
Circulation Ramp (straight, one-way), m
5.5 6 No non-compliance identified
Combined access width (Category 2), m
6.0 to 9.0 6 No non-compliance identified
Bay width, m
Retail
Commercial
2.6
2.4
2.4 - 2.6 No non-compliance identified. However, the 2.4m wide bays on Basement 1 (bay 19 and 20) should be designated for commercial staff use (User Class 1A)
Bay width (Commercial/Residential), m
2.4 2.6 No non-compliance identified
Bay length, m 5.4 5.4 No non-compliance identified
Aisle width (Retail), m 5.8 5.9 - 6.2 No non-compliance identified
Aisle width (Commercial/Residential), m
5.8 5.9 - 6.2 No non-compliance identified
Blind Aisle extension 1.0 1.0 No non-compliance identified
Ramp Grade (straight, <20m long)
1:5 1:5 No non-compliance identified
Change of Grade 1:6.7 (sag) 1:8 (summit)
1:8 No non-compliance identified
Vehicle body envelope No obstructions within envelope
No obstructions within envelope
No non-compliance identified
ACROD bay width, m 2.4 2.6 No non-compliance identified
ACROD bay length, m 5.4 5.4 No non-compliance identified
ACROD shared area width, m 2.4 2.4 No non-compliance identified
Bollard distance from parking aisle, mm
800 ± 50 800 No non-compliance identified
CW1146300 | 14 July 2021 | Commercial in Confidence 26
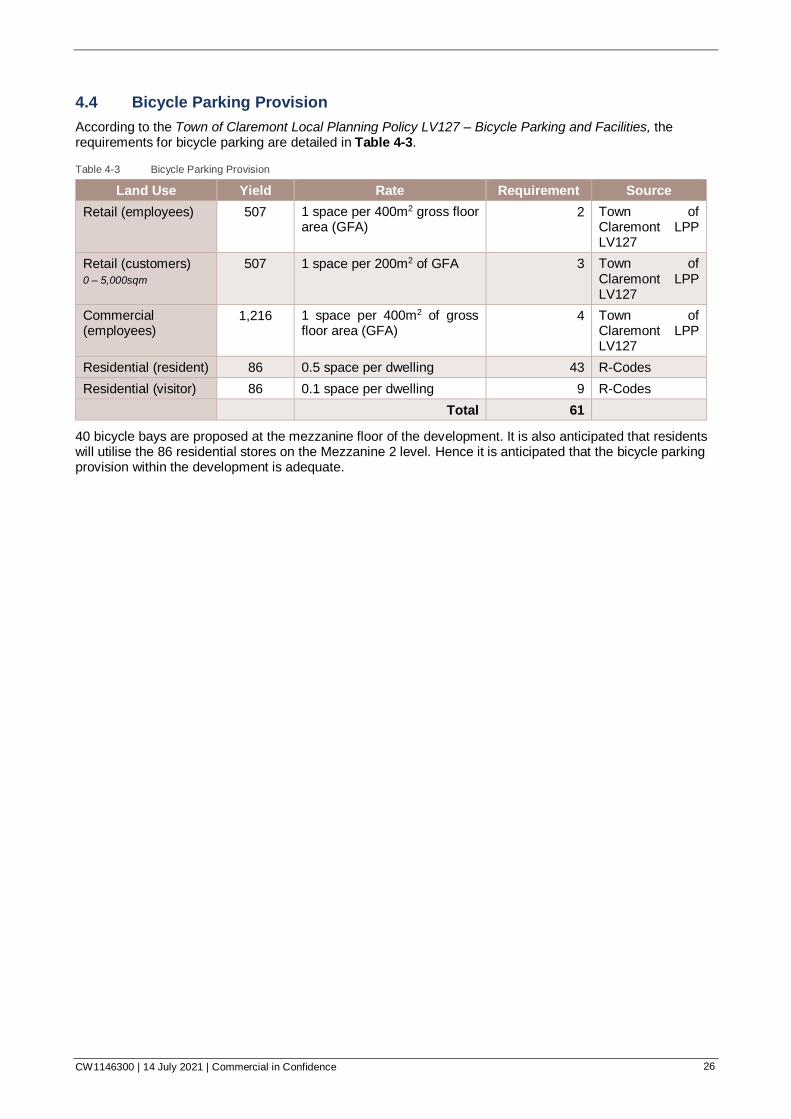
4.4 Bicycle Parking Provision
According to the Town of Claremont Local Planning Policy LV127 – Bicycle Parking and Facilities, the requirements for bicycle parking are detailed in Table 4-3.
Table 4-3 Bicycle Parking Provision
Land Use Yield Rate Requirement Source
Retail (employees) 507 1 space per 400m2 gross floor area (GFA)
2 Town of Claremont LPP LV127
Retail (customers) 0 – 5,000sqm
507 1 space per 200m2 of GFA 3 Town of Claremont LPP LV127
Commercial (employees)
1,216 1 space per 400m2 of gross floor area (GFA)
4 Town of Claremont LPP LV127
Residential (resident) 86 0.5 space per dwelling 43 R-Codes
Residential (visitor) 86 0.1 space per dwelling 9 R-Codes Total 61
40 bicycle bays are proposed at the mezzanine floor of the development. It is also anticipated that residents will utilise the 86 residential stores on the Mezzanine 2 level. Hence it is anticipated that the bicycle parking provision within the development is adequate.
CW1146300 | 14 July 2021 | Commercial in Confidence 27
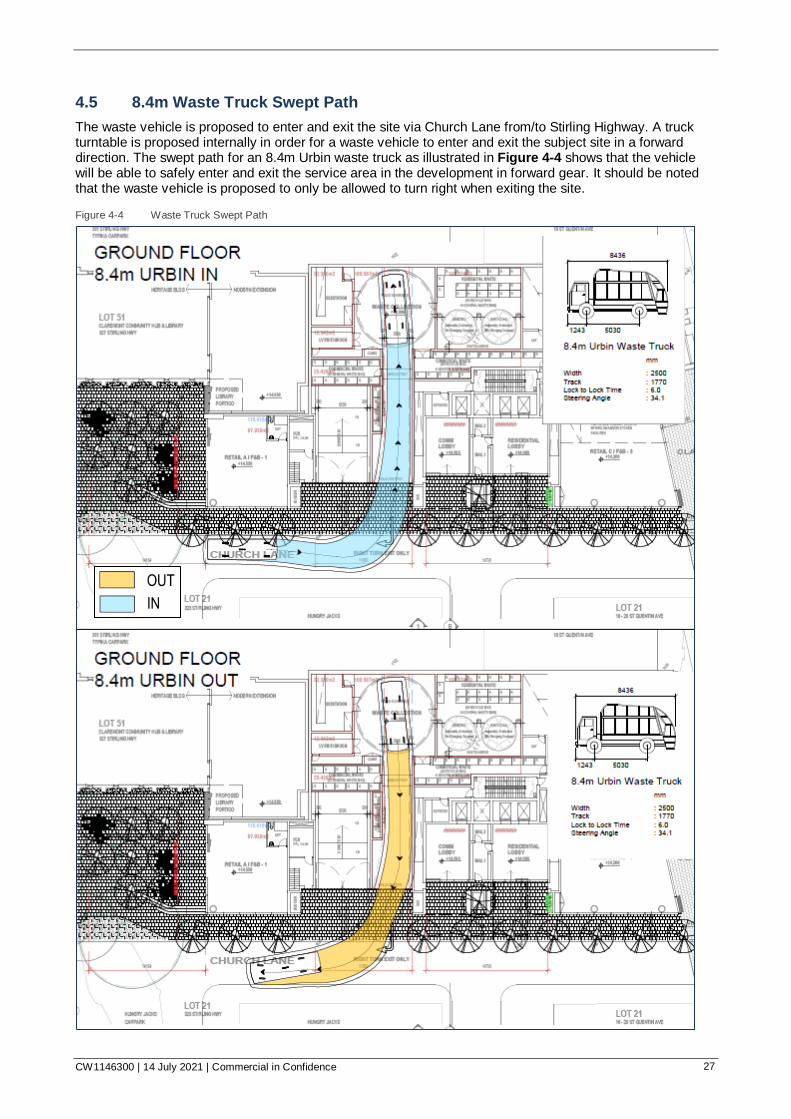
4.5 8.4m Waste Truck Swept Path
The waste vehicle is proposed to enter and exit the site via Church Lane from/to Stirling Highway. A truck turntable is proposed internally in order for a waste vehicle to enter and exit the subject site in a forward direction. The swept path for an 8.4m Urbin waste truck as illustrated in Figure 4-4 shows that the vehicle will be able to safely enter and exit the service area in the development in forward gear. It should be noted that the waste vehicle is proposed to only be allowed to turn right when exiting the site.
Figure 4-4 Waste Truck Swept Path

CW1146300 | 14 July 2021 | Commercial in Confidence 28
4.6 B99 Swept Path
Figure 4-5 shows that a B99 vehicle will be able to safely enter and exit the car park entrance from both directions on Church Lane.
Figure 4-5 B99 Swept Path
CW1146300 | 14 July 2021 | Commercial in Confidence 29
CW1146300 | 14 July 2021 | Commercial in Confidence 30
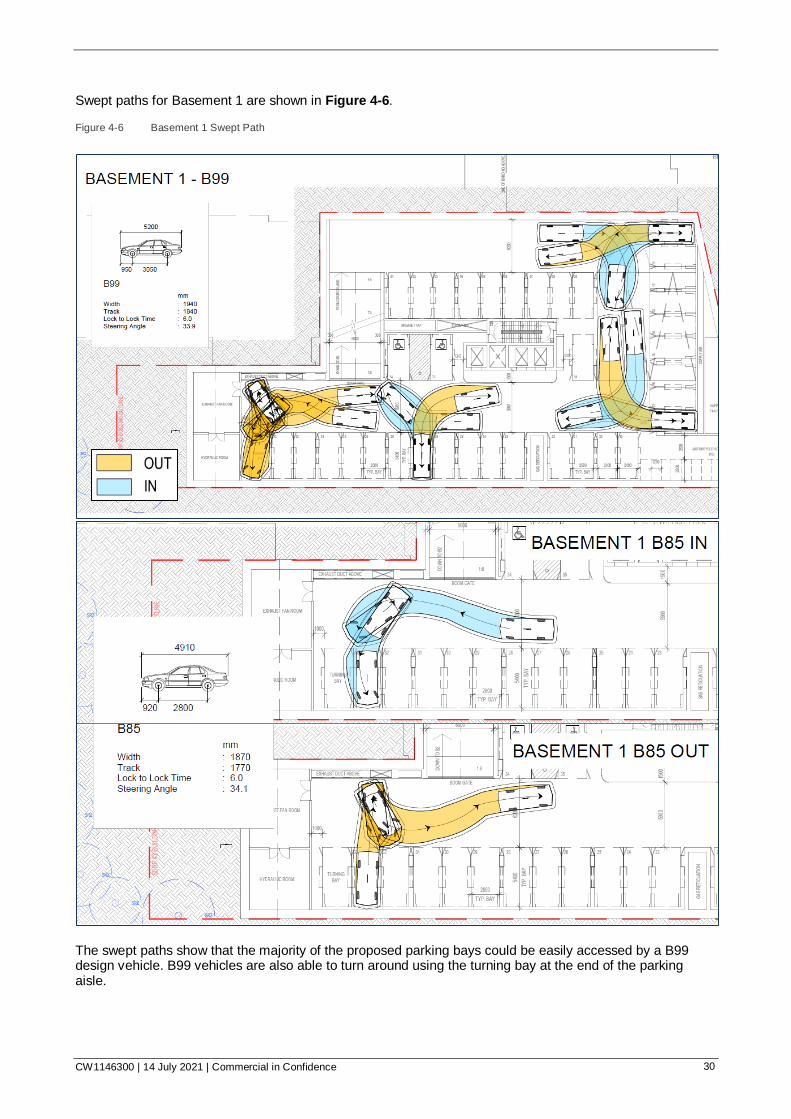
Swept paths for Basement 1 are shown in Figure 4-6.
Figure 4-6 Basement 1 Swept Path
The swept paths show that the majority of the proposed parking bays could be easily accessed by a B99 design vehicle. B99 vehicles are also able to turn around using the turning bay at the end of the parking aisle.
CW1146300 | 14 July 2021 | Commercial in Confidence 31
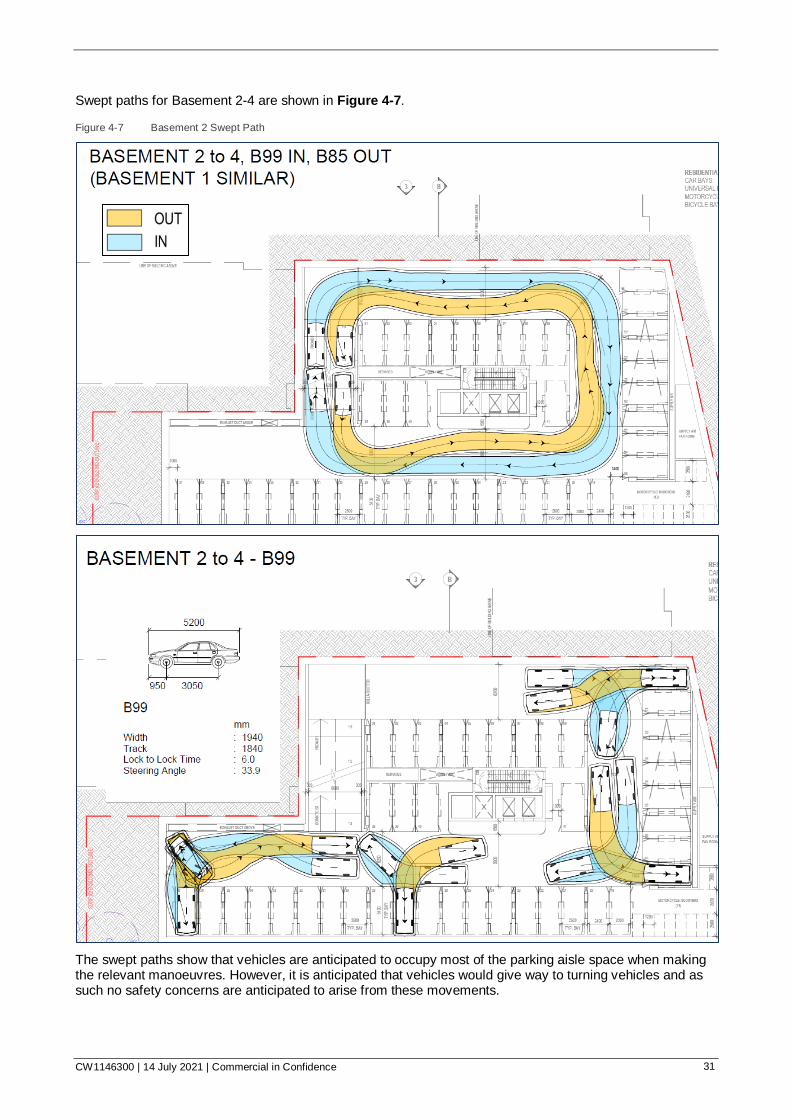
Swept paths for Basement 2-4 are shown in Figure 4-7.
Figure 4-7 Basement 2 Swept Path
The swept paths show that vehicles are anticipated to occupy most of the parking aisle space when making the relevant manoeuvres. However, it is anticipated that vehicles would give way to turning vehicles and as such no safety concerns are anticipated to arise from these movements.

CW1146300 | 14 July 2021 | Commercial in Confidence 32
5 Integration with Surrounding Area
5.1 Surrounding Major Attractors/Generators
Being within the town centre, the Site is immediately surrounded by several commercial establishments and residential developments. In addition, major attractors/generators surrounding the development are shown in Table 5-1. Key attractors/generators include:
> Claremont Station;
> Showgrounds Station;
> Claremont Pool;
> Claremont Oval;
> Claremont Showgrounds; and
> Town of Claremont Golf Course
Table 5-1 Major Attractors/Generators
SITE
CW1146300 | 14 July 2021 | Commercial in Confidence 33
6 Analysis of Transport Network
6.1 Analysis Overview
6.1.1 Key Intersections
A SIDRA network analysis has been undertaken for the following intersections to assess the potential impact of Site-generated traffic on the surrounding road network.
> Stirling Hwy / Bay View Terrace;
> Queenslea Dr / Stirling Hwy / Stirling Rd;
> Church Ln / Stirling Hwy;
> St Quentin Ave / Church Ln;
> Stirling Road / St Quentin Ave;
> Avion Way / St Quentin Ave; and
> Bay View Terrace / St Quentin Ave.
6.2 Assessment Years and Time Period
A survey was conducted on Thursday 13th of February 2020 (7h00-9h00 & 15h00-17h00) and Saturday 15th February 2020 (11h00-13h00) at the key intersections. Assessed peak periods were based on the peak hours of the gathered data which is detailed below:
> 7:45am to 8:45am on weekdays;
> 3:30pm to 4:30pm on weekdays; and
> 11:45am to 12:45pm on weekends.
The following scenarios have been analysed as part of this assessment for these peak activity periods:
> Scenario 1 – 2020 Existing Traffic without Development;
> Scenario 2 – 2022 Future Traffic (assumed opening year) without Development for future intersection layouts;
> Scenario 2.1 – 2022 Future Traffic (assumed opening year) without Development for existing intersection layouts;
> Scenario 3 – 2022 Future Traffic (assumed opening year) with Development for future intersection layouts;
> Scenario 3.1 – 2022 Future Traffic (assumed opening year) with Development for existing intersection layouts;
> Scenario 4 – 2032 Future Traffic (10-year horizon) without Development for future intersection layouts; and
> Scenario 5 – 2032 Future Traffic (10-year horizon) with Development for future intersection layouts.
6.3 Key Assumptions
The following assumptions were made for the traffic analysis of the key intersections:
> The existing background traffic data was surveyed by an external service provider for the critical peak periods on Thursday 13th of February 2020 (7h00-9h00 & 15h00-17h00) and Saturday 15th February 2020 (11h00-13h00) for all the key intersections. This information was used as a basis for the traffic analysis of these intersections;
> All relevant intersections have been analysed for the three assessment years by applying a conservative growth rate of 2% per annum to the traffic observations based on historical data obtained between 2017 and 2018 at the Stirling Hwy (west of Bay View Terrace) traffic counting station;

CW1146300 | 14 July 2021 | Commercial in Confidence 34
> Changes to the intersection layouts discussed in Section 3 will be completed by 2022. Hence, all future scenarios are modelled based on the proposed layouts; and
> Practical cycle time was used for signal timing of future scenarios.
6.4 Development Trip Generation
6.4.1 Trip generation of existing developments
A trip generation survey of existing developments with similar purpose and transport environment to the proposed development has been conducted in order to estimate the potential trip generation for the said development. The survey involved undertaking an inventory of residential units and traffic counts at the development’s access driveway during a typical weekday peak period. The following was assumed:
> Residential units are fully occupied;
> 100% of outgoing traffic during the AM peak and 100% of incoming traffic during the PM peak are residential traffic. Similarly, 100% of AM in and PM out traffic is associated with the commercial development;
> The retail/food and beverage land use was assumed to be 100% food and beverage due to its higher trip generation rate compared to retail to obtain more conservative results;
> Outgoing traffic during the AM peak represents 80% of total; and
> Incoming traffic during the PM peak represents 80% of total.
Results of the survey are presented in Table 6-1.
Table 6-1 Trip Generation Rates of Existing Developments
Development No. of Units
Traffic Volume Residential trip rate
(vehicles per dwelling unit)
AM out PM in AM in AM out AM total PM in PM out PM total
Site 1 58 9 11 0.039 0.155 0.194 0.190 0.047 0.237
Site 2 63 7 6 0.028 0.111 0.139 0.095 0.024 0.119
Average
0.166
0.178
The results show that the average weekday AM and PM trip generation rates are 0.166 and 0.178 per dwelling unit respectively. In comparison, rates from The Institute of Transportation Engineers (ITE): Trip Generation 10th Edition are 0.31 for the AM peak and 0.20 for the PM peak. The lower values of the calculated trip rates may be attributed to their location since trip attractors are within walkable distance. It is expected that trip rates for the proposed development would be similar to these calculated values because of its proximity to public transport and trip attractors.
6.4.2 Internal trip capture model
It is expected that a portion of visitors to the retail land uses will be coming from the residential land uses of the development. To consider this, Cardno’s reciprocal parking model has been used to calculate the reduction factor for trip generation rates to be used in the analysis.
Land uses used in the model are as shown in Table 6-2.
Table 6-2 Land uses
Land Use Yield Unit
Residential (high-rise apartment) 86 dwelling
Retail 507 sqm
Commercial (commercial office) 1,216 sqm
Results of the analysis are presented in Table 6-3.
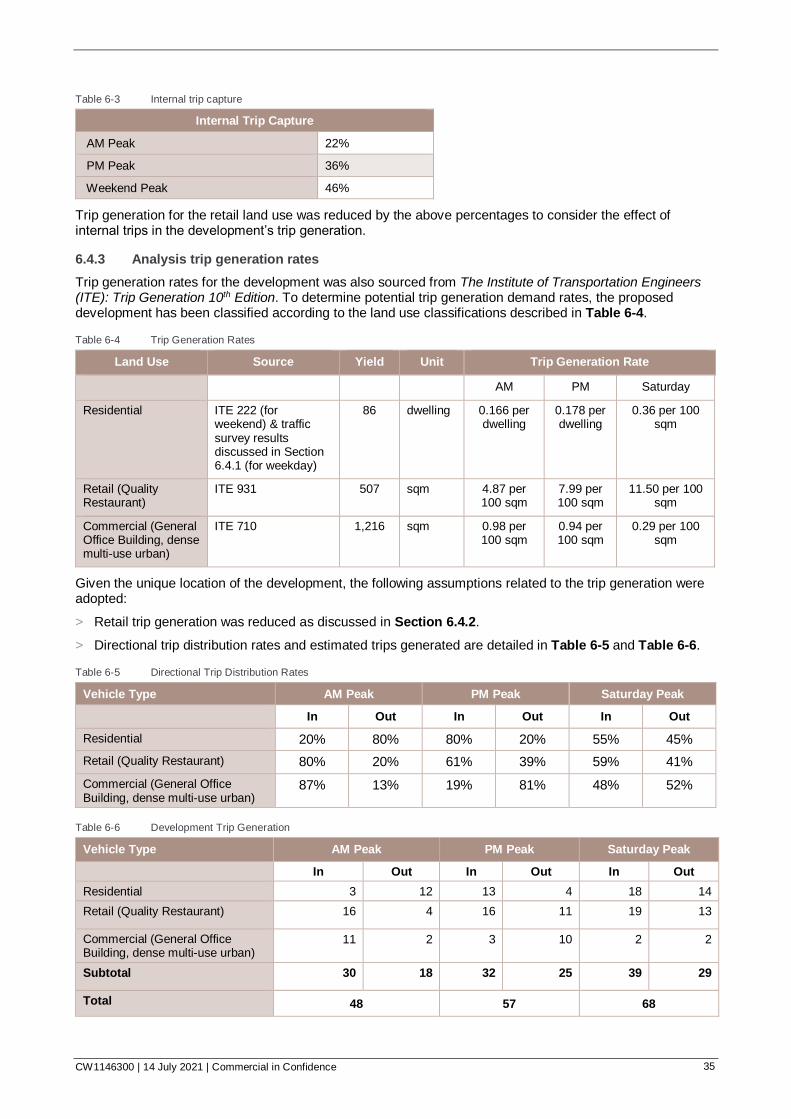
CW1146300 | 14 July 2021 | Commercial in Confidence 35
Table 6-3 Internal trip capture
Internal Trip Capture
AM Peak 22%
PM Peak 36%
Weekend Peak 46%
Trip generation for the retail land use was reduced by the above percentages to consider the effect of internal trips in the development’s trip generation.
6.4.3 Analysis trip generation rates
Trip generation rates for the development was also sourced from The Institute of Transportation Engineers (ITE): Trip Generation 10th Edition. To determine potential trip generation demand rates, the proposed development has been classified according to the land use classifications described in Table 6-4.
Table 6-4 Trip Generation Rates
Land Use Source Yield Unit Trip Generation Rate
AM PM Saturday
Residential ITE 222 (for weekend) & traffic survey results discussed in Section 6.4.1 (for weekday)
86 dwelling 0.166 per dwelling
0.178 per dwelling
0.36 per 100 sqm
Retail (Quality Restaurant)
ITE 931 507 sqm 4.87 per 100 sqm
7.99 per 100 sqm
11.50 per 100 sqm
Commercial (General Office Building, dense multi-use urban)
ITE 710 1,216 sqm 0.98 per 100 sqm
0.94 per 100 sqm
0.29 per 100 sqm
Given the unique location of the development, the following assumptions related to the trip generation were adopted:
> Retail trip generation was reduced as discussed in Section 6.4.2.
> Directional trip distribution rates and estimated trips generated are detailed in Table 6-5 and Table 6-6.
Table 6-5 Directional Trip Distribution Rates
Vehicle Type AM Peak PM Peak Saturday Peak
In Out In Out In Out
Residential 20% 80% 80% 20% 55% 45%
Retail (Quality Restaurant) 80% 20% 61% 39% 59% 41%
Commercial (General Office Building, dense multi-use urban)
87% 13% 19% 81% 48% 52%
Table 6-6 Development Trip Generation
Vehicle Type AM Peak PM Peak Saturday Peak
In Out In Out In Out
Residential 3 12 13 4 18 14
Retail (Quality Restaurant) 16 4 16 11 19 13
Commercial (General Office Building, dense multi-use urban)
11 2 3 10 2 2
Subtotal 30 18 32 25 39 29
Total 48 57 68
CW1146300 | 14 July 2021 | Commercial in Confidence 36
As summarized above, the proposed development is expected to generate two-way trips of 48, 57 and 68 for the weekday AM, weekday PM and weekend peak hour periods respectively.
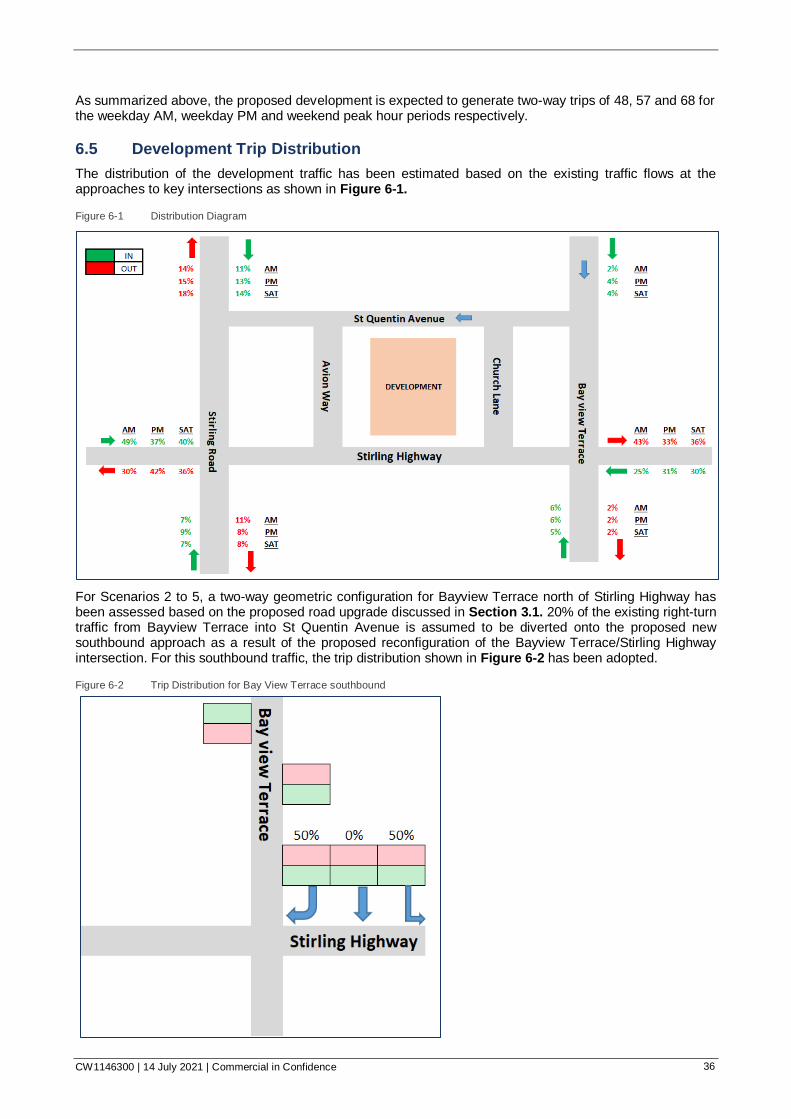
6.5 Development Trip Distribution
The distribution of the development traffic has been estimated based on the existing traffic flows at the approaches to key intersections as shown in Figure 6-1.
Figure 6-1 Distribution Diagram
For Scenarios 2 to 5, a two-way geometric configuration for Bayview Terrace north of Stirling Highway has been assessed based on the proposed road upgrade discussed in Section 3.1. 20% of the existing right-turn traffic from Bayview Terrace into St Quentin Avenue is assumed to be diverted onto the proposed new southbound approach as a result of the proposed reconfiguration of the Bayview Terrace/Stirling Highway intersection. For this southbound traffic, the trip distribution shown in Figure 6-2 has been adopted.
Figure 6-2 Trip Distribution for Bay View Terrace southbound
CW1146300 | 14 July 2021 | Commercial in Confidence 37
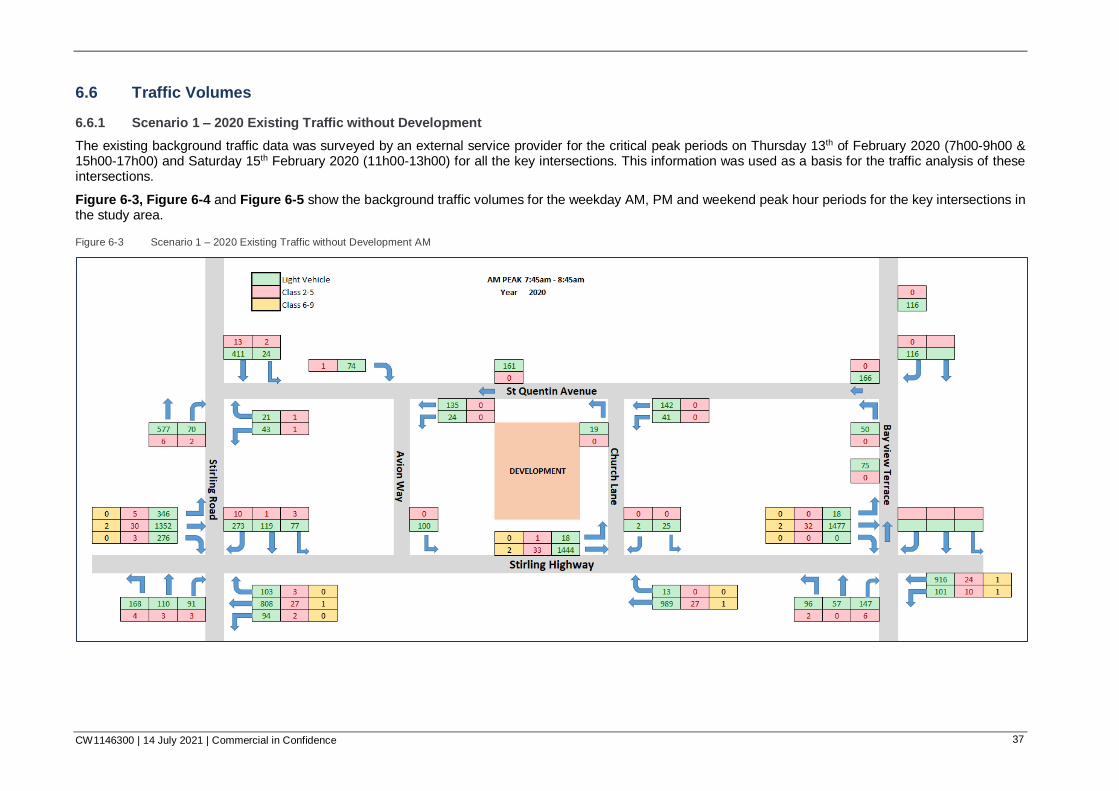
6.6 Traffic Volumes
6.6.1 Scenario 1 – 2020 Existing Traffic without Development
The existing background traffic data was surveyed by an external service provider for the critical peak periods on Thursday 13th of February 2020 (7h00-9h00 & 15h00-17h00) and Saturday 15th February 2020 (11h00-13h00) for all the key intersections. This information was used as a basis for the traffic analysis of these intersections.
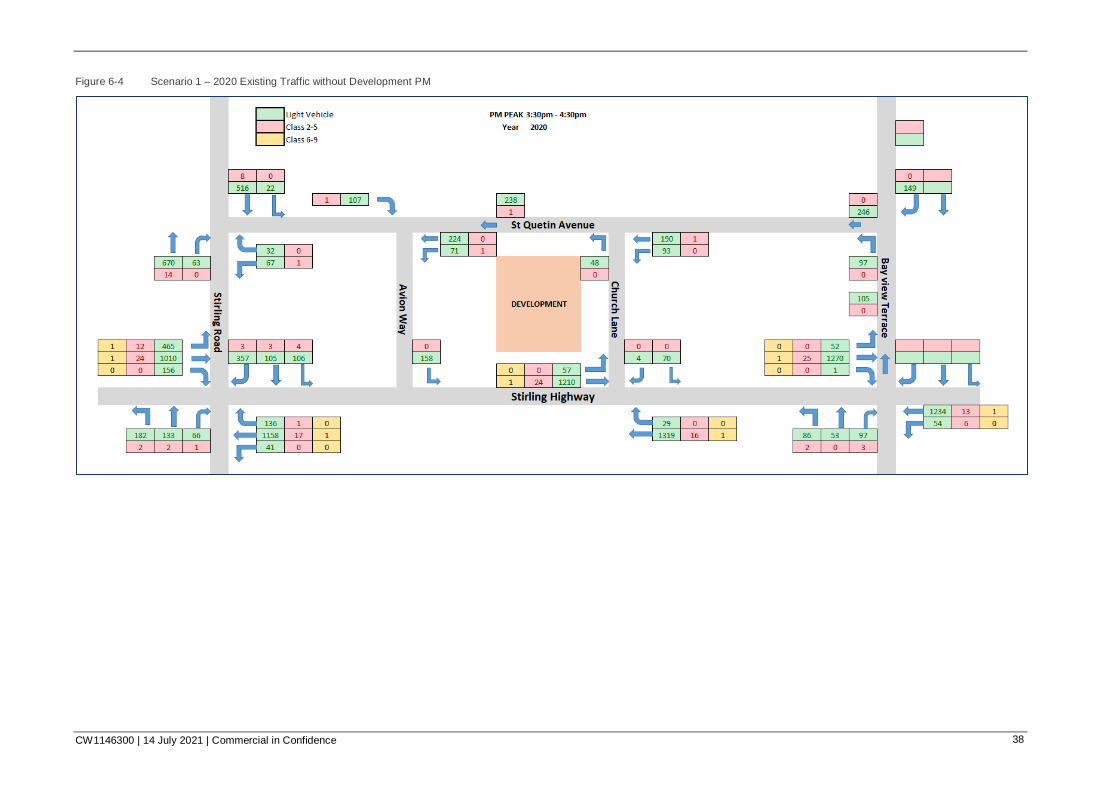
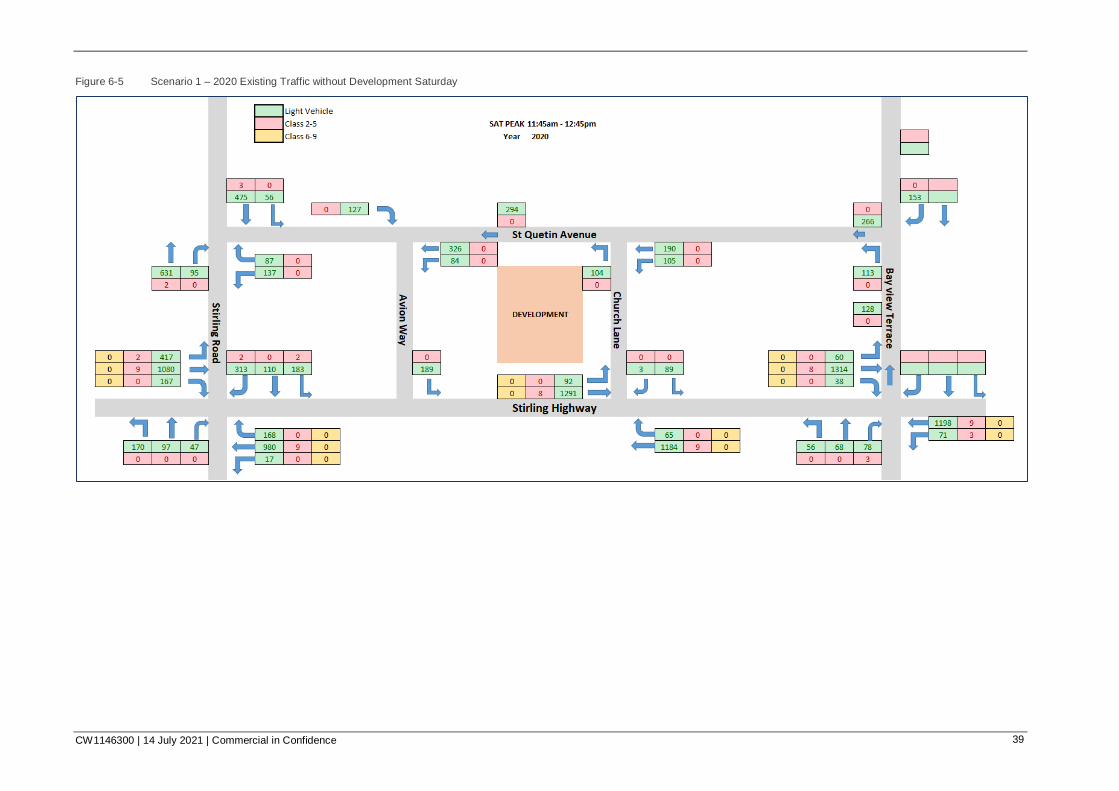
Figure 6-3, Figure 6-4 and Figure 6-5 show the background traffic volumes for the weekday AM, PM and weekend peak hour periods for the key intersections in the study area.
Figure 6-3 Scenario 1 – 2020 Existing Traffic without Development AM
CW1146300 | 14 July 2021 | Commercial in Confidence 38
Figure 6-4 Scenario 1 – 2020 Existing Traffic without Development PM
CW1146300 | 14 July 2021 | Commercial in Confidence 39
Figure 6-5 Scenario 1 – 2020 Existing Traffic without Development Saturday

CW1146300 | 14 July 2021 | Commercial in Confidence 40
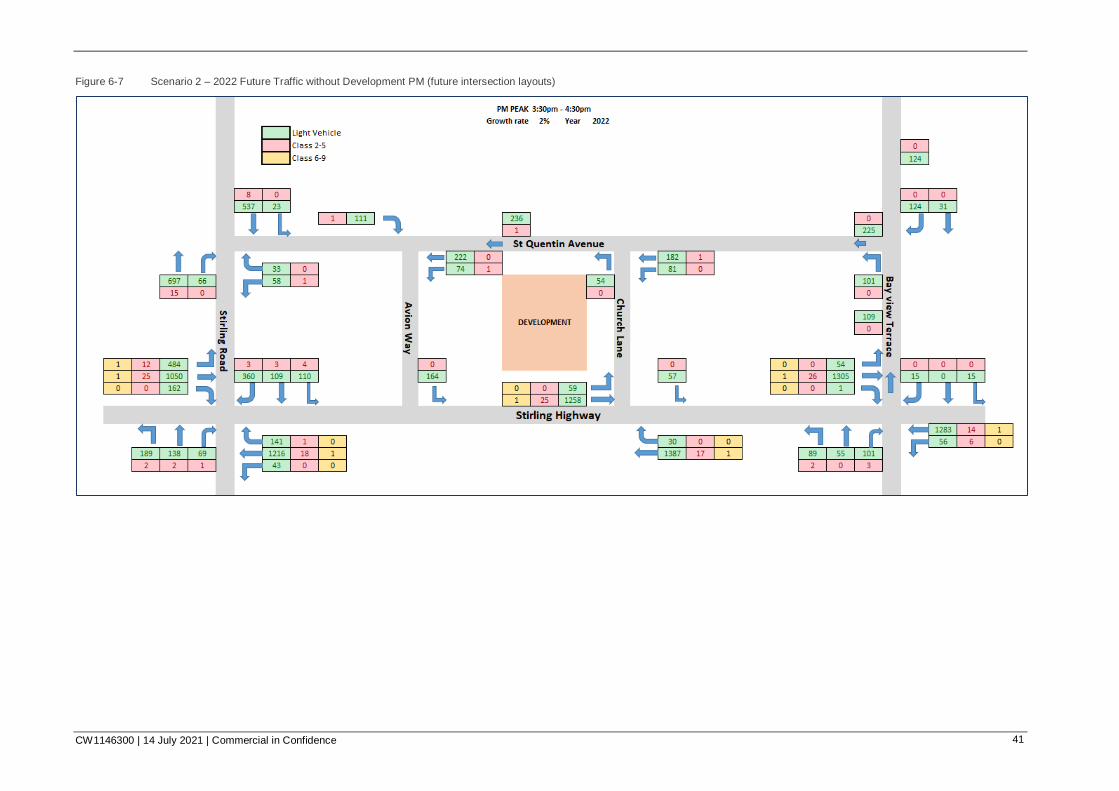
6.6.2 Scenario 2 – 2022 Future Traffic without Development (future intersection layouts)
Existing traffic was projected to future year 2022 with growth rate of 2%. Figure 6-6, Figure 6-7 and Figure 6-8 show the calculated future traffic without the development and considering proposed changes to the intersection layouts.
Figure 6-6 Scenario 2 – 2022 Future Traffic without Development AM (future intersection layouts)
CW1146300 | 14 July 2021 | Commercial in Confidence 41
Figure 6-7 Scenario 2 – 2022 Future Traffic without Development PM (future intersection layouts)
CW1146300 | 14 July 2021 | Commercial in Confidence 42
Figure 6-8 Scenario 2 – 2022 Future Traffic without Development Saturday (future intersection layouts)

CW1146300 | 14 July 2021 | Commercial in Confidence 43
6.6.3 Scenario 2.1 - 2022 Future Traffic without Development (existing intersection layouts)
Existing traffic was projected to future year 2022 with growth rate of 2%. Figure 6-9, Figure 6-10 and Figure 6-11 show the calculated future traffic without the development without incorporating proposed intersection layout changes.
Figure 6-9 Scenario 2.1 – 2022 Future Traffic without Development AM (existing intersection layouts)
CW1146300 | 14 July 2021 | Commercial in Confidence 44
Figure 6-10 Scenario 2.1 – 2022 Future Traffic without Development PM (existing intersection layouts)
CW1146300 | 14 July 2021 | Commercial in Confidence 45
Figure 6-11 Scenario 2.1 – 2022 Future Traffic without Development Saturday (existing intersection layouts)
CW1146300 | 14 July 2021 | Commercial in Confidence 46
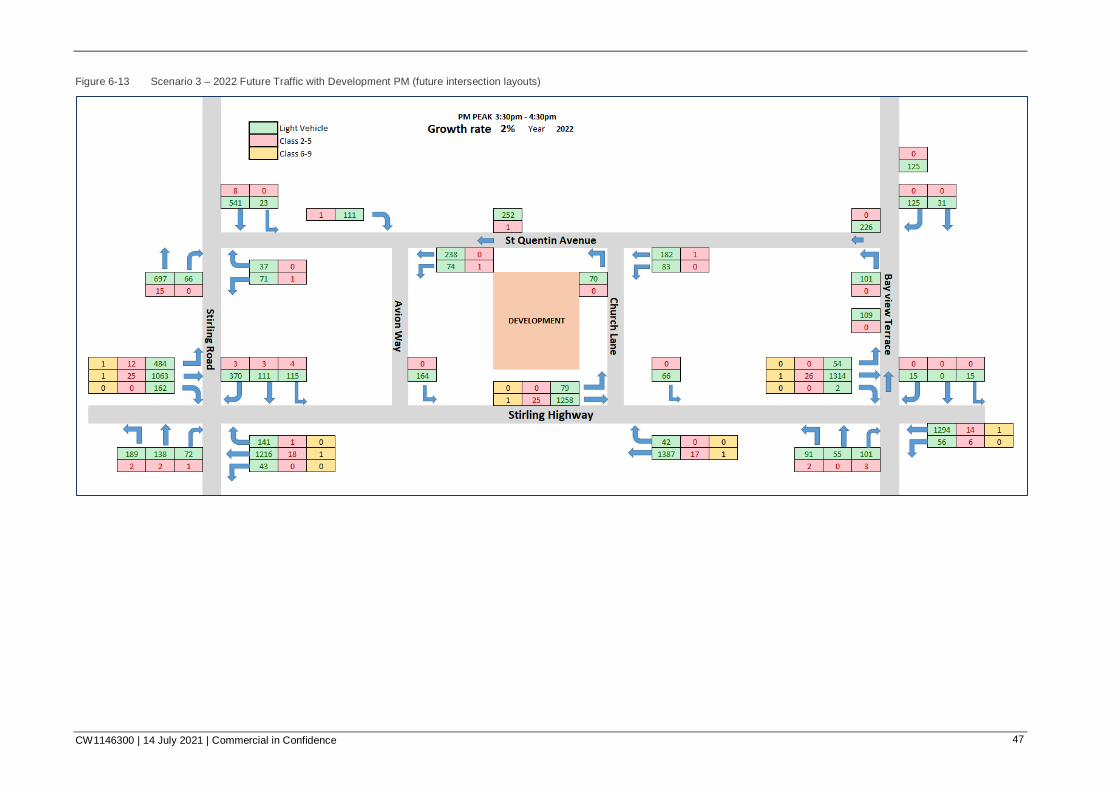
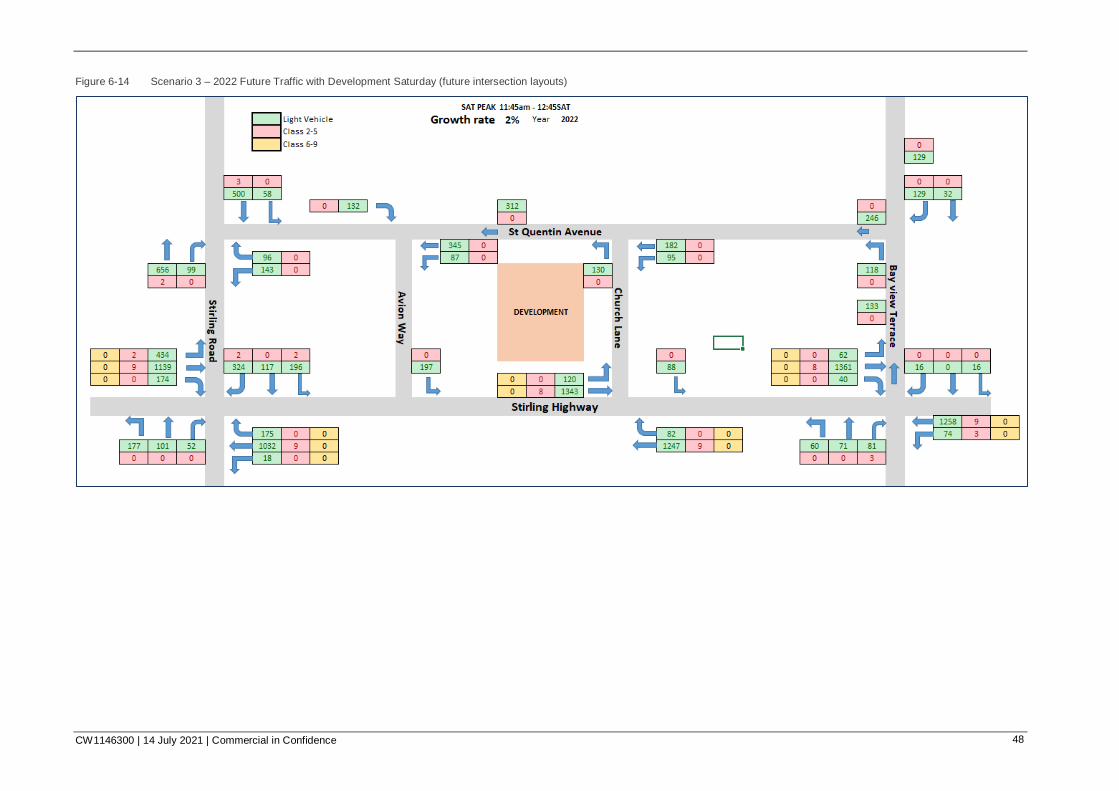
6.6.4 Scenario 3 – 2022 Future Traffic with Development (future intersection layouts)
Traffic generated by the development was added to the 2022 traffic and are presented in Figure 6-12, Figure 6-13 and Figure 6-14. These volumes also takes into consideration proposed changes to the intersection layouts
Figure 6-12 Scenario 3 – 2022 Future Traffic with Development AM (future intersection layouts)
CW1146300 | 14 July 2021 | Commercial in Confidence 47
Figure 6-13 Scenario 3 – 2022 Future Traffic with Development PM (future intersection layouts)
CW1146300 | 14 July 2021 | Commercial in Confidence 48
Figure 6-14 Scenario 3 – 2022 Future Traffic with Development Saturday (future intersection layouts)
CW1146300 | 14 July 2021 | Commercial in Confidence 49
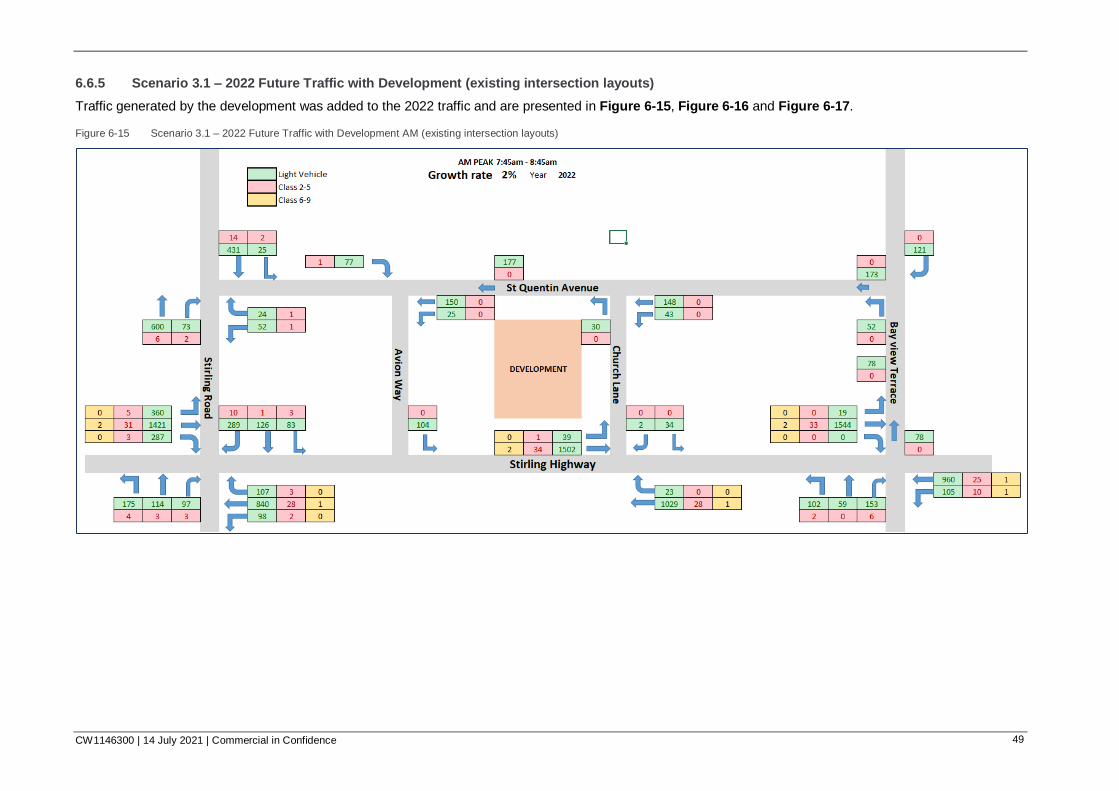
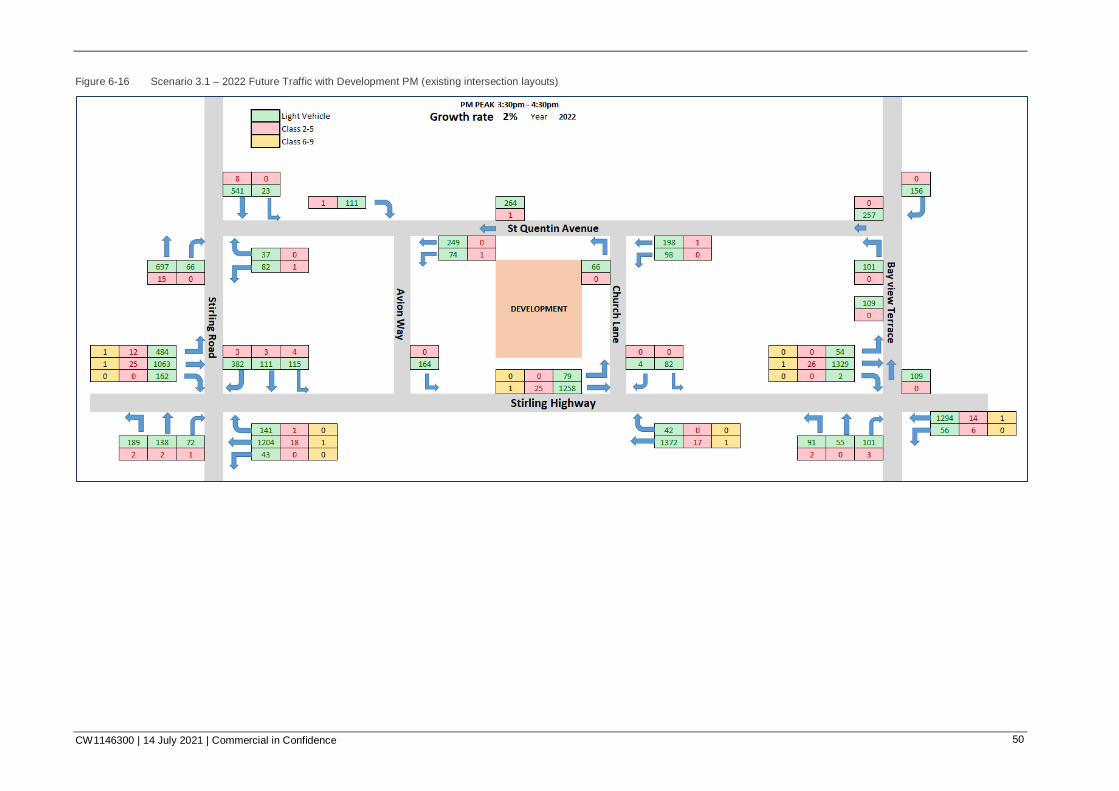
6.6.5 Scenario 3.1 – 2022 Future Traffic with Development (existing intersection layouts)
Traffic generated by the development was added to the 2022 traffic and are presented in Figure 6-15, Figure 6-16 and Figure 6-17.
Figure 6-15 Scenario 3.1 – 2022 Future Traffic with Development AM (existing intersection layouts)
CW1146300 | 14 July 2021 | Commercial in Confidence 50
Figure 6-16 Scenario 3.1 – 2022 Future Traffic with Development PM (existing intersection layouts)
CW1146300 | 14 July 2021 | Commercial in Confidence 51
Figure 6-17 Scenario 3.1 – 2022 Future Traffic with Development Saturday (existing intersection layouts)

CW1146300 | 14 July 2021 | Commercial in Confidence 52
6.6.6 Scenario 4 – 2032 Traffic without Development (future intersection layouts)
A 10-year future scenario was considered for the completeness of this assessment. Figure 6-18, Figure 6-19 and Figure 6-20 shows the estimated traffic volumes with 10 years’ traffic growth for the weekday and weekend peak hour periods, based on a yearly traffic growth rate of 2% from 2022 to 2032.
Figure 6-18 Scenario 4– 2032 Future Traffic without Development AM (future intersection layouts)
CW1146300 | 14 July 2021 | Commercial in Confidence 53
Figure 6-19 Scenario 4– 2032 Future Traffic without Development PM (future intersection layouts)
CW1146300 | 14 July 2021 | Commercial in Confidence 54
Figure 6-20 Scenario 4– 2032 Future Traffic without Development Saturday (future intersection layouts)

CW1146300 | 14 July 2021 | Commercial in Confidence 55
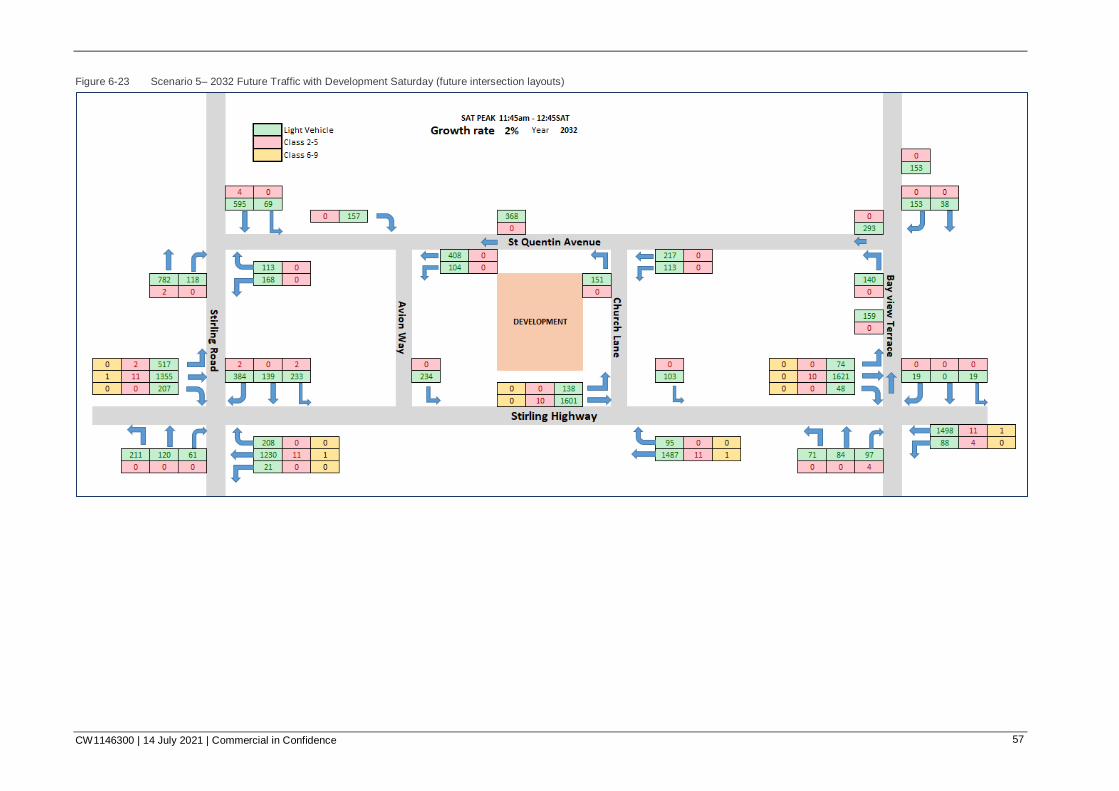
6.6.7 Scenario 5 – 2032 Traffic with Development (future intersection layouts)
Traffic generated by the development was added to the 2032 traffic and are presented in Figure 6-21, Figure 6-22 and Figure 6-23.
Figure 6-21 Scenario 5– 2032 Future Traffic with Development AM (future intersection layouts)
CW1146300 | 14 July 2021 | Commercial in Confidence 56
Figure 6-22 Scenario 5– 2032 Future Traffic with Development PM (future intersection layouts)
CW1146300 | 14 July 2021 | Commercial in Confidence 57
Figure 6-23 Scenario 5– 2032 Future Traffic with Development Saturday (future intersection layouts)
CW1146300 | 14 July 2021 | Commercial in Confidence 58
6.7 Intersection Performance
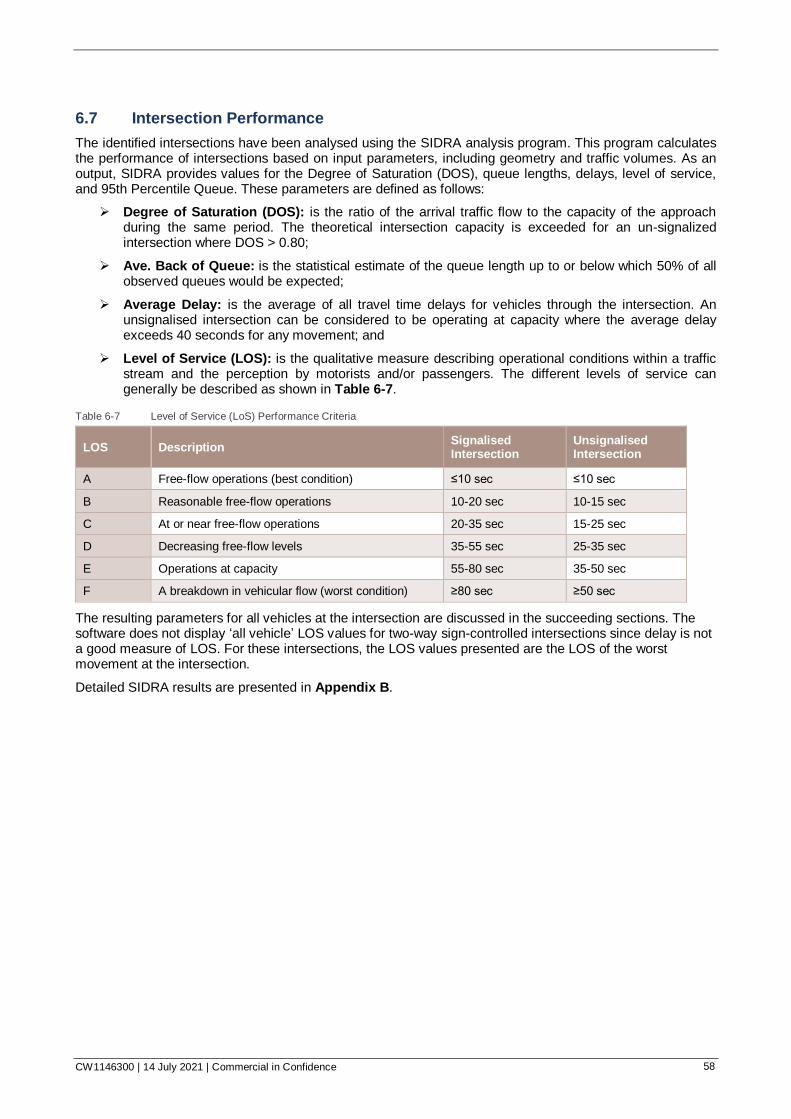
The identified intersections have been analysed using the SIDRA analysis program. This program calculates the performance of intersections based on input parameters, including geometry and traffic volumes. As an output, SIDRA provides values for the Degree of Saturation (DOS), queue lengths, delays, level of service, and 95th Percentile Queue. These parameters are defined as follows:
➢ Degree of Saturation (DOS): is the ratio of the arrival traffic flow to the capacity of the approach during the same period. The theoretical intersection capacity is exceeded for an un-signalized intersection where DOS > 0.80;
➢ Ave. Back of Queue: is the statistical estimate of the queue length up to or below which 50% of all observed queues would be expected;
➢ Average Delay: is the average of all travel time delays for vehicles through the intersection. An unsignalised intersection can be considered to be operating at capacity where the average delay exceeds 40 seconds for any movement; and
➢ Level of Service (LOS): is the qualitative measure describing operational conditions within a traffic stream and the perception by motorists and/or passengers. The different levels of service can generally be described as shown in Table 6-7.
Table 6-7 Level of Service (LoS) Performance Criteria
LOS Description Signalised Intersection
Unsignalised Intersection
A Free-flow operations (best condition) ≤10 sec ≤10 sec
B Reasonable free-flow operations 10-20 sec 10-15 sec
C At or near free-flow operations 20-35 sec 15-25 sec
D Decreasing free-flow levels 35-55 sec 25-35 sec
E Operations at capacity 55-80 sec 35-50 sec
F A breakdown in vehicular flow (worst condition) ≥80 sec ≥50 sec
The resulting parameters for all vehicles at the intersection are discussed in the succeeding sections. The software does not display ‘all vehicle’ LOS values for two-way sign-controlled intersections since delay is not a good measure of LOS. For these intersections, the LOS values presented are the LOS of the worst movement at the intersection.
Detailed SIDRA results are presented in Appendix B.
CW1146300 | 14 July 2021 | Commercial in Confidence 59
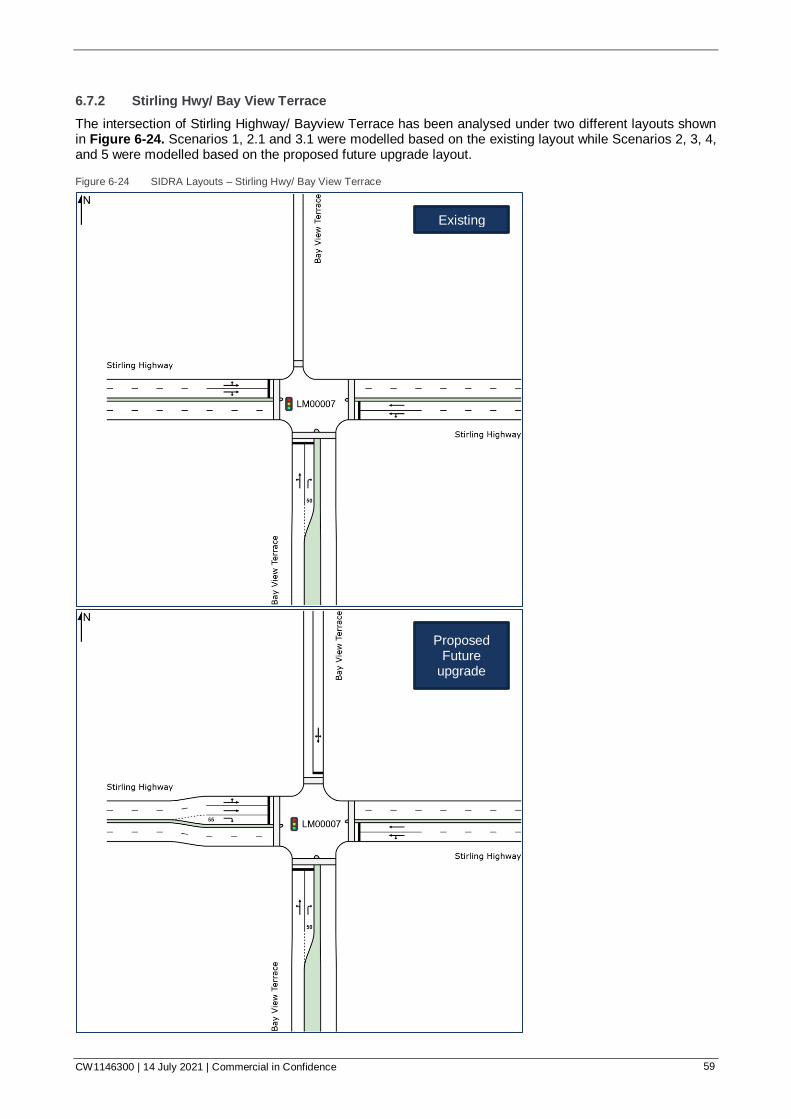
6.7.2 Stirling Hwy/ Bay View Terrace
The intersection of Stirling Highway/ Bayview Terrace has been analysed under two different layouts shown in Figure 6-24. Scenarios 1, 2.1 and 3.1 were modelled based on the existing layout while Scenarios 2, 3, 4, and 5 were modelled based on the proposed future upgrade layout.
Figure 6-24 SIDRA Layouts – Stirling Hwy/ Bay View Terrace
Existing
Proposed Future
upgrade
CW1146300 | 14 July 2021 | Commercial in Confidence 60
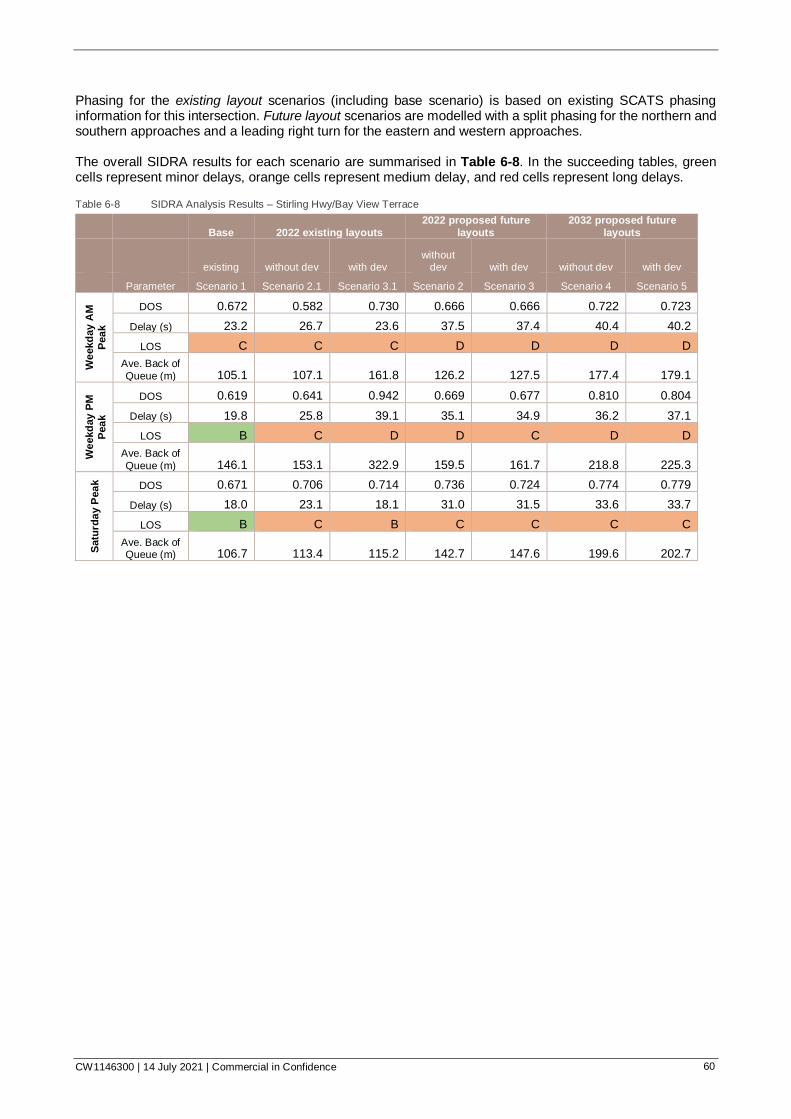
Phasing for the existing layout scenarios (including base scenario) is based on existing SCATS phasing information for this intersection. Future layout scenarios are modelled with a split phasing for the northern and southern approaches and a leading right turn for the eastern and western approaches. The overall SIDRA results for each scenario are summarised in Table 6-8. In the succeeding tables, green cells represent minor delays, orange cells represent medium delay, and red cells represent long delays.
Table 6-8 SIDRA Analysis Results – Stirling Hwy/Bay View Terrace
Base 2022 existing layouts
2022 proposed future
layouts
2032 proposed future
layouts
existing without dev with dev without
dev with dev without dev with dev
Parameter Scenario 1 Scenario 2.1 Scenario 3.1 Scenario 2 Scenario 3 Scenario 4 Scenario 5
We
ekd
ay
AM
Pea
k
DOS 0.672 0.582 0.730 0.666 0.666 0.722 0.723
Delay (s) 23.2 26.7 23.6 37.5 37.4 40.4 40.2
LOS C C C D D D D
Ave. Back of
Queue (m) 105.1 107.1 161.8 126.2 127.5 177.4 179.1
We
ekd
ay
PM
Pea
k
DOS 0.619 0.641 0.942 0.669 0.677 0.810 0.804
Delay (s) 19.8 25.8 39.1 35.1 34.9 36.2 37.1
LOS B C D D C D D
Ave. Back of
Queue (m) 146.1 153.1 322.9 159.5 161.7 218.8 225.3
Satu
rda
y P
ea
k
DOS 0.671 0.706 0.714 0.736 0.724 0.774 0.779
Delay (s) 18.0 23.1 18.1 31.0 31.5 33.6 33.7
LOS B C B C C C C
Ave. Back of Queue (m) 106.7 113.4 115.2 142.7 147.6 199.6 202.7

CW1146300 | 14 July 2021 | Commercial in Confidence 61
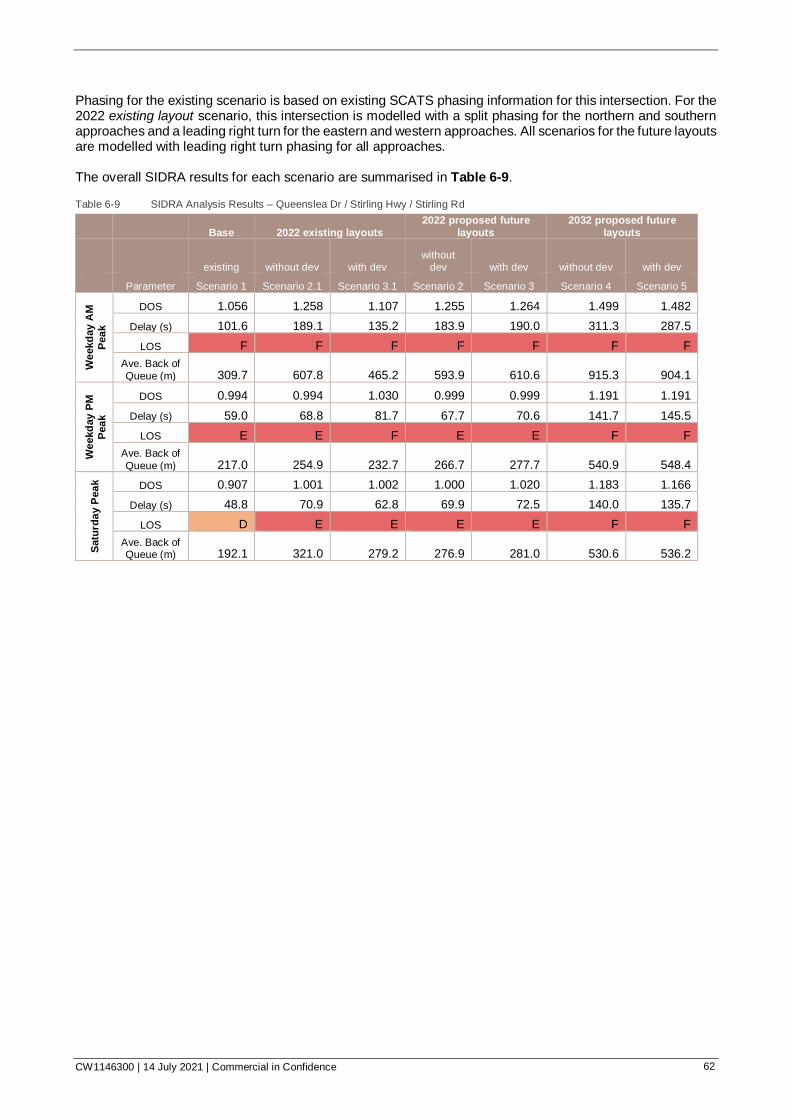
6.7.3 Queenslea Dr / Stirling Hwy / Stirling Rd
The intersection of Queenslea Dr / Stirling Hwy / Stirling Rd has been analysed under two different layouts shown in Figure 6-25. Scenarios 1, 2.1, and 3.1 were modelled based on the existing layout while Scenarios 2, 3, 4, and 5 were modelled based on the proposed future upgrade layout.
Figure 6-25 SIDRA Layouts – Queenslea Dr / Stirling Hwy / Stirling Rd
Existing
Proposed Future
Upgrade
CW1146300 | 14 July 2021 | Commercial in Confidence 62
Phasing for the existing scenario is based on existing SCATS phasing information for this intersection. For the 2022 existing layout scenario, this intersection is modelled with a split phasing for the northern and southern approaches and a leading right turn for the eastern and western approaches. All scenarios for the future layouts are modelled with leading right turn phasing for all approaches. The overall SIDRA results for each scenario are summarised in Table 6-9.
Table 6-9 SIDRA Analysis Results – Queenslea Dr / Stirling Hwy / Stirling Rd
Base 2022 existing layouts
2022 proposed future
layouts
2032 proposed future
layouts
existing without dev with dev without
dev with dev without dev with dev
Parameter Scenario 1 Scenario 2.1 Scenario 3.1 Scenario 2 Scenario 3 Scenario 4 Scenario 5
We
ekd
ay
AM
Pea
k
DOS 1.056 1.258 1.107 1.255 1.264 1.499 1.482
Delay (s) 101.6 189.1 135.2 183.9 190.0 311.3 287.5
LOS F F F F F F F
Ave. Back of
Queue (m) 309.7 607.8 465.2 593.9 610.6 915.3 904.1
We
ekd
ay
PM
Pea
k
DOS 0.994 0.994 1.030 0.999 0.999 1.191 1.191
Delay (s) 59.0 68.8 81.7 67.7 70.6 141.7 145.5
LOS E E F E E F F
Ave. Back of
Queue (m) 217.0 254.9 232.7 266.7 277.7 540.9 548.4
Satu
rda
y P
ea
k
DOS 0.907 1.001 1.002 1.000 1.020 1.183 1.166
Delay (s) 48.8 70.9 62.8 69.9 72.5 140.0 135.7
LOS D E E E E F F
Ave. Back of Queue (m) 192.1 321.0 279.2 276.9 281.0 530.6 536.2
CW1146300 | 14 July 2021 | Commercial in Confidence 63
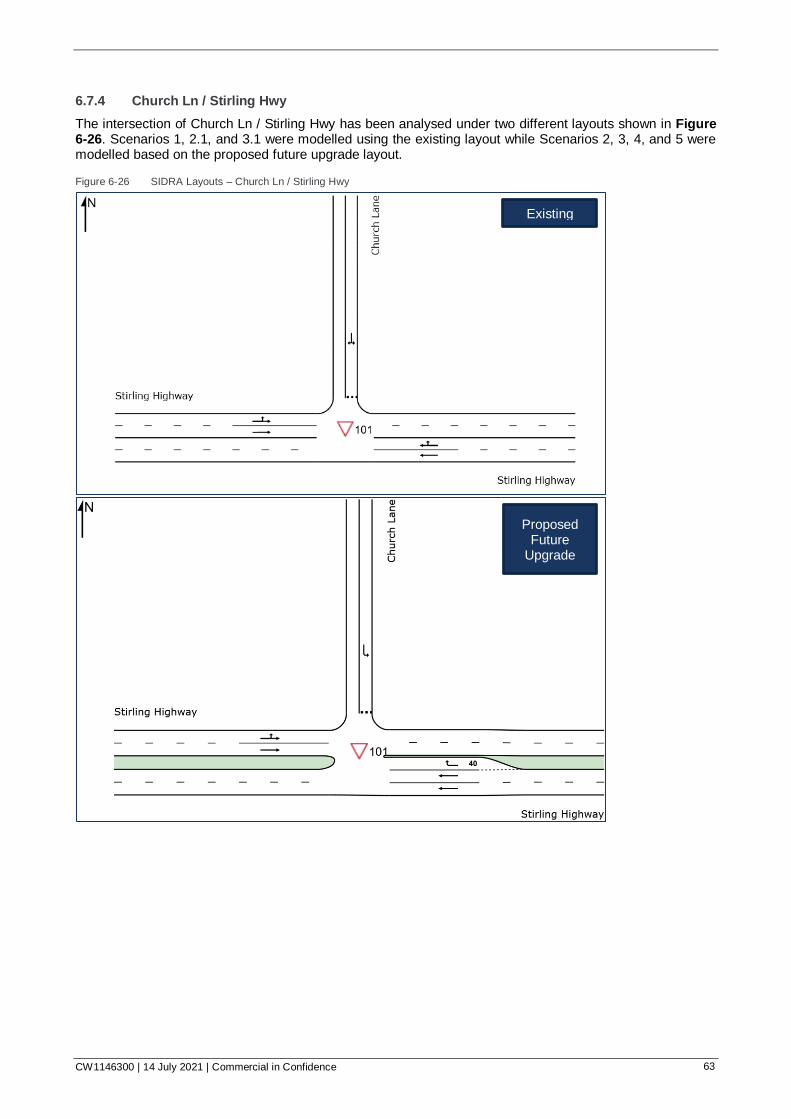
6.7.4 Church Ln / Stirling Hwy
The intersection of Church Ln / Stirling Hwy has been analysed under two different layouts shown in Figure 6-26. Scenarios 1, 2.1, and 3.1 were modelled using the existing layout while Scenarios 2, 3, 4, and 5 were modelled based on the proposed future upgrade layout.
Figure 6-26 SIDRA Layouts – Church Ln / Stirling Hwy
Existing
Proposed Future
Upgrade
CW1146300 | 14 July 2021 | Commercial in Confidence 64
The overall SIDRA results for each scenario are summarised in Table 6-10.
Table 6-10 SIDRA Results – Church Ln / Stirling Hwy
Base 2022 existing layouts 2022 proposed future
layouts 2032 proposed future
layouts
existing without dev with dev without
dev with dev without dev with dev
Parameter Scenario 1 Scenario 2.1 Scenario 3.1 Scenario 2 Scenario 3 Scenario 4 Scenario 5
We
ekd
ay
AM
Pea
k
DOS 0.420 0.352 0.419 0.362 0.365 0.512 0.493
Delay (s) 0.9 0.6 1.3 0.2 0.3 0.2 0.3
LOS F F F B B B B
Ave. Back of Queue (m) 71.0 73.6 93.0 115.6 115.2 116.2 115.7
We
ekd
ay
PM
Pea
k
DOS 0.831 0.949 0.864 0.664 0.652 0.501 0.485
Delay (s) 3.4 4.8 4.3 0.5 0.7 0.5 0.6
LOS F F F C C C C
Ave. Back of Queue (m) 17.9 105.2 92.7 129.3 129.1 134.3 133.0
Satu
rda
y P
ea
k
DOS 0.620 0.651 0.783 0.399 0.407 0.658 0.646
Delay (s) 3.2 3.7 4.8 0.9 1.1 1.0 1.2
LOS F F F C C C C
Ave. Back of Queue (m) 35.1 112.1 40.9 108.7 109.0 129.0 99.5
*LOS shown is for the critical movement at this intersection
CW1146300 | 14 July 2021 | Commercial in Confidence 65
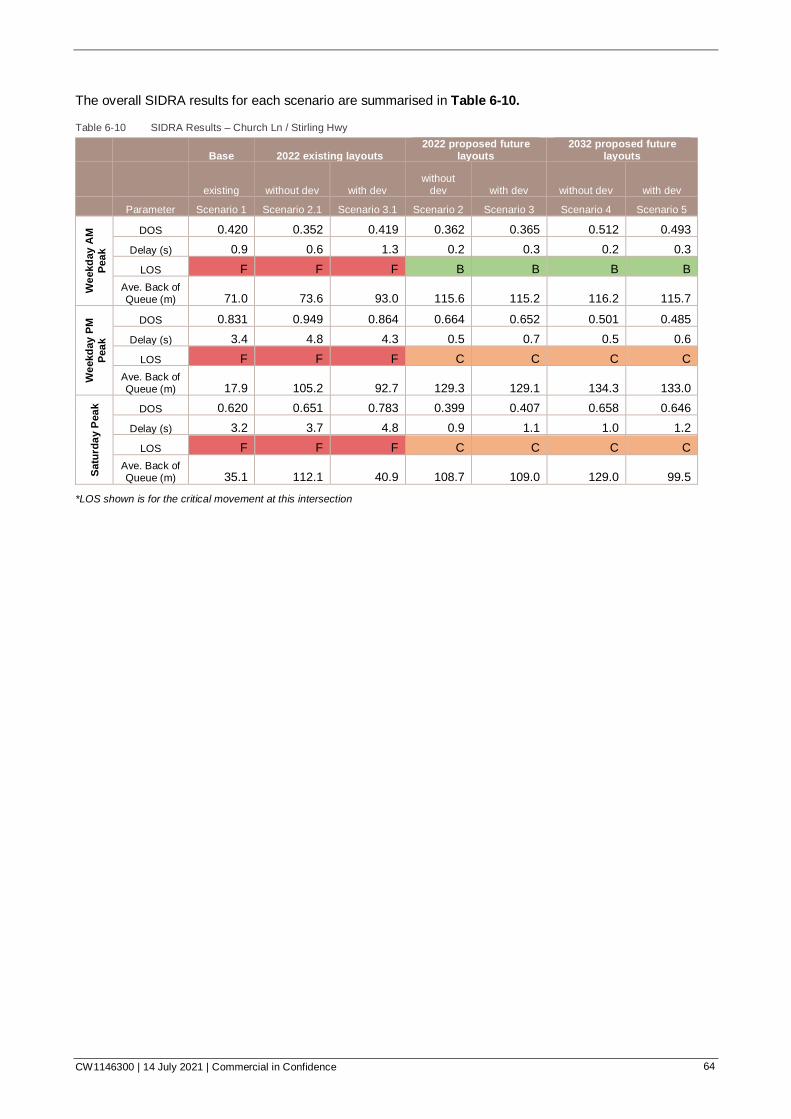
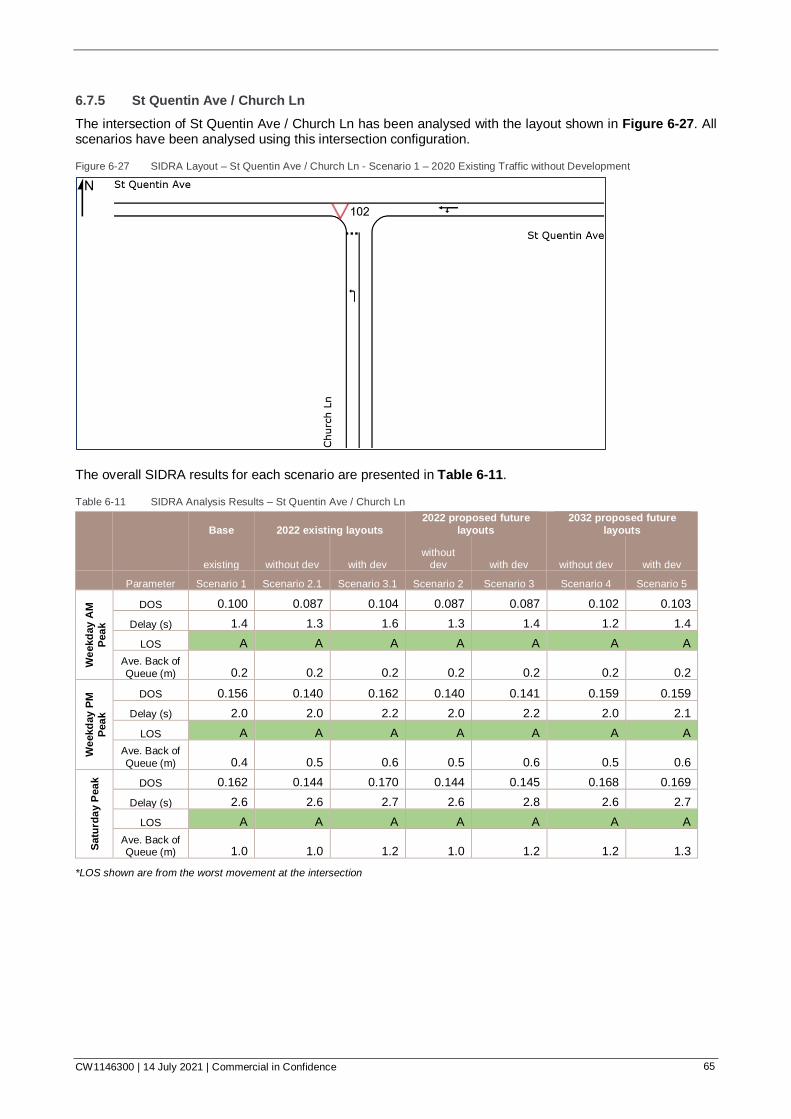
6.7.5 St Quentin Ave / Church Ln
The intersection of St Quentin Ave / Church Ln has been analysed with the layout shown in Figure 6-27. All scenarios have been analysed using this intersection configuration.
Figure 6-27 SIDRA Layout – St Quentin Ave / Church Ln - Scenario 1 – 2020 Existing Traffic without Development
The overall SIDRA results for each scenario are presented in Table 6-11.
Table 6-11 SIDRA Analysis Results – St Quentin Ave / Church Ln
Base 2022 existing layouts
2022 proposed future
layouts
2032 proposed future
layouts
existing without dev with dev without
dev with dev without dev with dev
Parameter Scenario 1 Scenario 2.1 Scenario 3.1 Scenario 2 Scenario 3 Scenario 4 Scenario 5
We
ekd
ay
AM
Pea
k
DOS 0.100 0.087 0.104 0.087 0.087 0.102 0.103
Delay (s) 1.4 1.3 1.6 1.3 1.4 1.2 1.4
LOS A A A A A A A
Ave. Back of
Queue (m) 0.2 0.2 0.2 0.2 0.2 0.2 0.2
We
ekd
ay
PM
Pea
k
DOS 0.156 0.140 0.162 0.140 0.141 0.159 0.159
Delay (s) 2.0 2.0 2.2 2.0 2.2 2.0 2.1
LOS A A A A A A A
Ave. Back of
Queue (m) 0.4 0.5 0.6 0.5 0.6 0.5 0.6
Satu
rda
y P
ea
k
DOS 0.162 0.144 0.170 0.144 0.145 0.168 0.169
Delay (s) 2.6 2.6 2.7 2.6 2.8 2.6 2.7
LOS A A A A A A A
Ave. Back of Queue (m) 1.0 1.0 1.2 1.0 1.2 1.2 1.3
*LOS shown are from the worst movement at the intersection
CW1146300 | 14 July 2021 | Commercial in Confidence 66
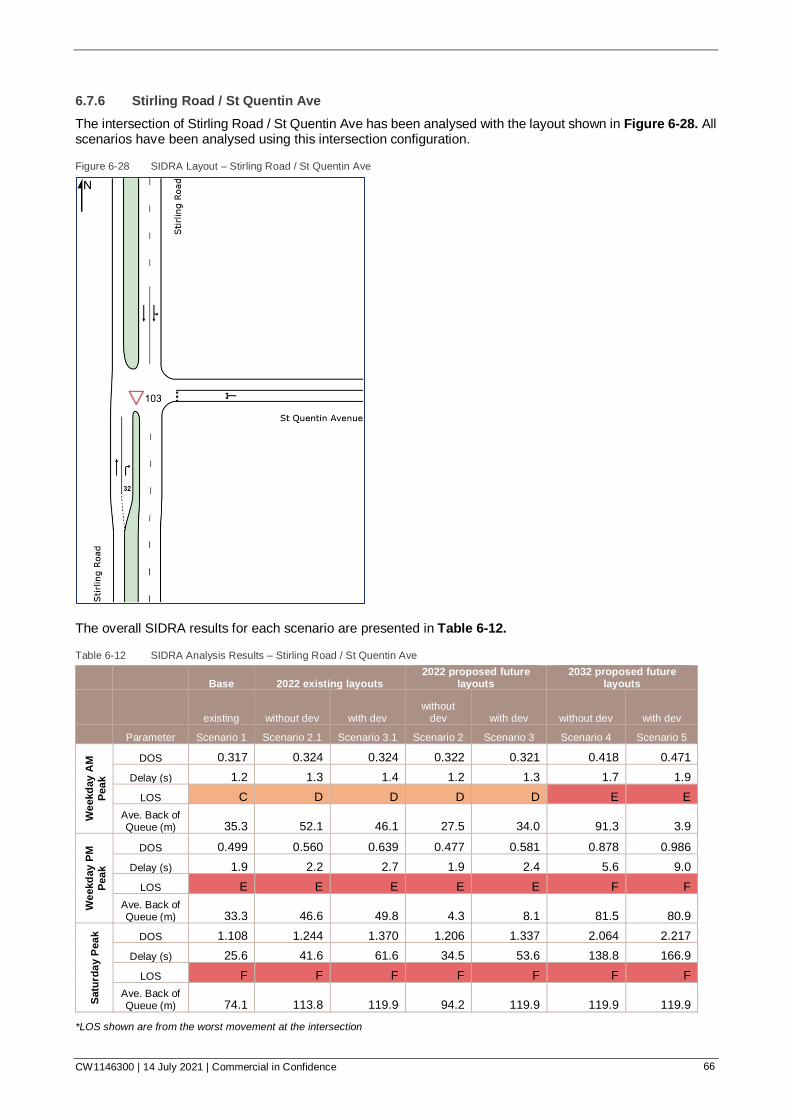
6.7.6 Stirling Road / St Quentin Ave
The intersection of Stirling Road / St Quentin Ave has been analysed with the layout shown in Figure 6-28. All scenarios have been analysed using this intersection configuration.
Figure 6-28 SIDRA Layout – Stirling Road / St Quentin Ave
The overall SIDRA results for each scenario are presented in Table 6-12.
Table 6-12 SIDRA Analysis Results – Stirling Road / St Quentin Ave
Base 2022 existing layouts 2022 proposed future
layouts 2032 proposed future
layouts
existing without dev with dev without
dev with dev without dev with dev
Parameter Scenario 1 Scenario 2.1 Scenario 3.1 Scenario 2 Scenario 3 Scenario 4 Scenario 5
We
ekd
ay
AM
Pea
k
DOS 0.317 0.324 0.324 0.322 0.321 0.418 0.471
Delay (s) 1.2 1.3 1.4 1.2 1.3 1.7 1.9
LOS C D D D D E E
Ave. Back of Queue (m) 35.3 52.1 46.1 27.5 34.0 91.3 3.9
We
ekd
ay
PM
Pea
k
DOS 0.499 0.560 0.639 0.477 0.581 0.878 0.986
Delay (s) 1.9 2.2 2.7 1.9 2.4 5.6 9.0
LOS E E E E E F F
Ave. Back of Queue (m) 33.3 46.6 49.8 4.3 8.1 81.5 80.9
Satu
rda
y P
ea
k
DOS 1.108 1.244 1.370 1.206 1.337 2.064 2.217
Delay (s) 25.6 41.6 61.6 34.5 53.6 138.8 166.9
LOS F F F F F F F
Ave. Back of Queue (m) 74.1 113.8 119.9 94.2 119.9 119.9 119.9
*LOS shown are from the worst movement at the intersection
CW1146300 | 14 July 2021 | Commercial in Confidence 67
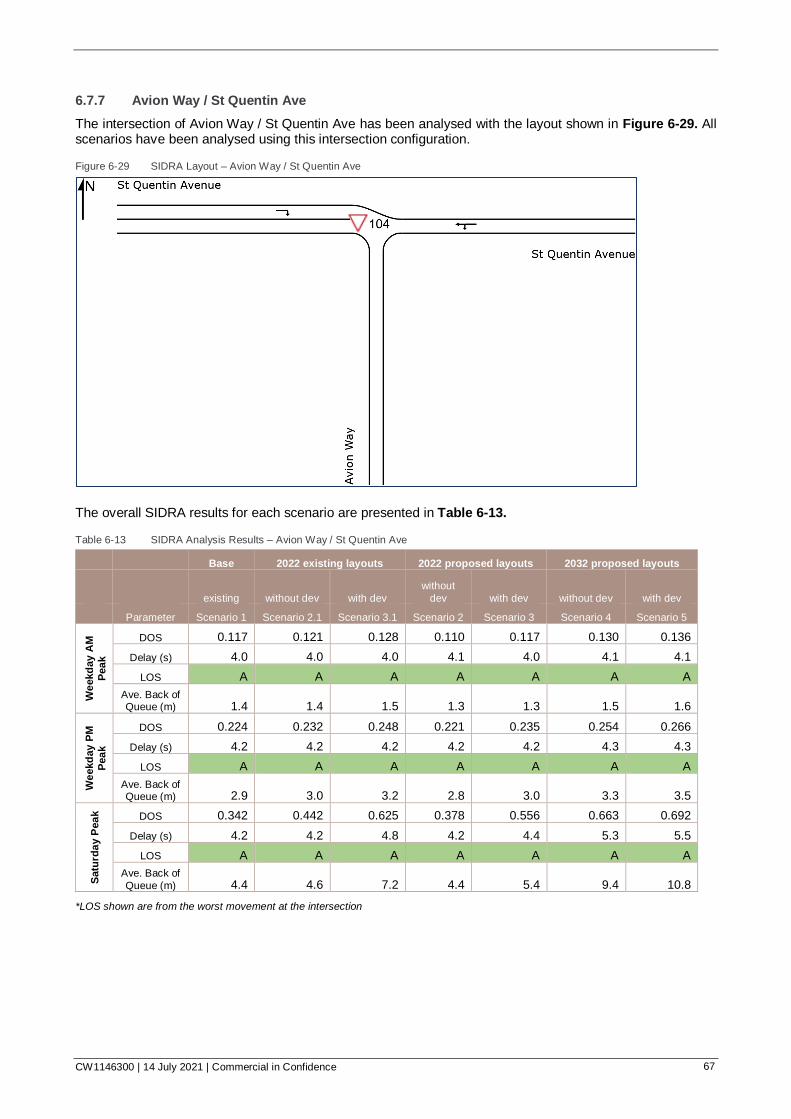
6.7.7 Avion Way / St Quentin Ave
The intersection of Avion Way / St Quentin Ave has been analysed with the layout shown in Figure 6-29. All scenarios have been analysed using this intersection configuration.
Figure 6-29 SIDRA Layout – Avion Way / St Quentin Ave
The overall SIDRA results for each scenario are presented in Table 6-13.
Table 6-13 SIDRA Analysis Results – Avion Way / St Quentin Ave
Base 2022 existing layouts 2022 proposed layouts 2032 proposed layouts
existing without dev with dev
without
dev with dev without dev with dev
Parameter Scenario 1 Scenario 2.1 Scenario 3.1 Scenario 2 Scenario 3 Scenario 4 Scenario 5
We
ekd
ay
AM
Pea
k
DOS 0.117 0.121 0.128 0.110 0.117 0.130 0.136
Delay (s) 4.0 4.0 4.0 4.1 4.0 4.1 4.1
LOS A A A A A A A
Ave. Back of Queue (m) 1.4 1.4 1.5 1.3 1.3 1.5 1.6
We
ekd
ay
PM
Pea
k
DOS 0.224 0.232 0.248 0.221 0.235 0.254 0.266
Delay (s) 4.2 4.2 4.2 4.2 4.2 4.3 4.3
LOS A A A A A A A
Ave. Back of Queue (m) 2.9 3.0 3.2 2.8 3.0 3.3 3.5
Satu
rda
y P
ea
k
DOS 0.342 0.442 0.625 0.378 0.556 0.663 0.692
Delay (s) 4.2 4.2 4.8 4.2 4.4 5.3 5.5
LOS A A A A A A A
Ave. Back of
Queue (m) 4.4 4.6 7.2 4.4 5.4 9.4 10.8
*LOS shown are from the worst movement at the intersection
CW1146300 | 14 July 2021 | Commercial in Confidence 68
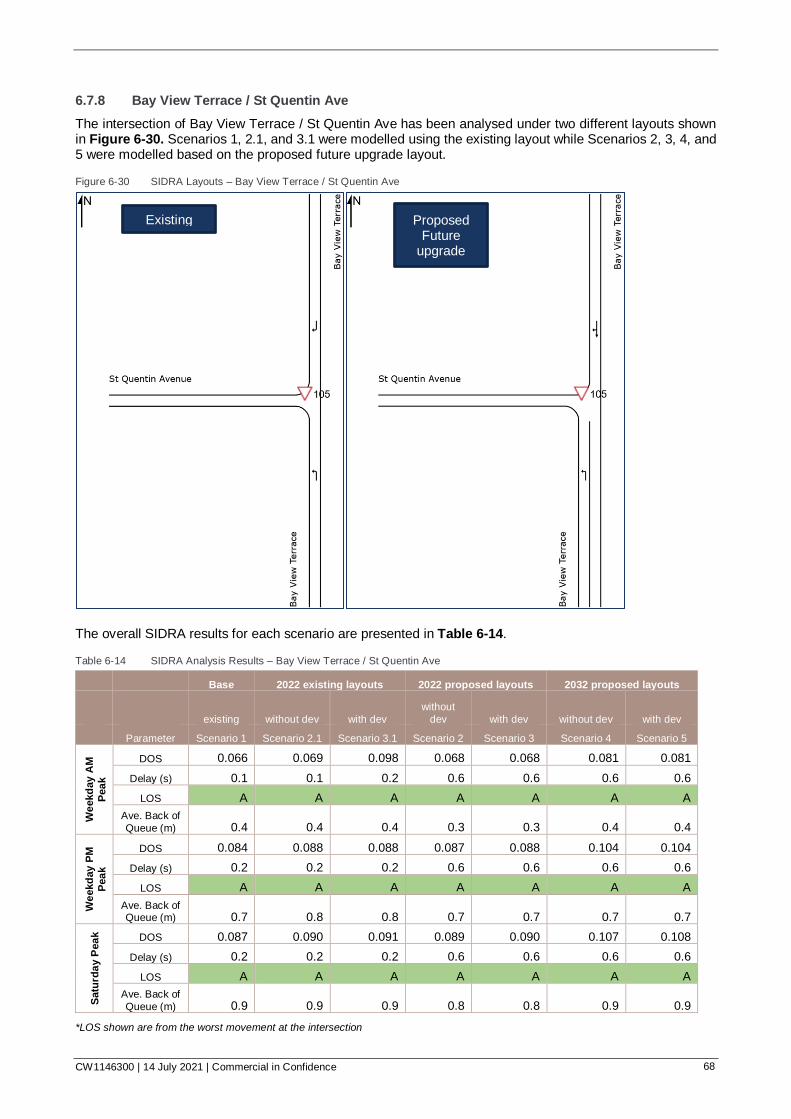
6.7.8 Bay View Terrace / St Quentin Ave
The intersection of Bay View Terrace / St Quentin Ave has been analysed under two different layouts shown in Figure 6-30. Scenarios 1, 2.1, and 3.1 were modelled using the existing layout while Scenarios 2, 3, 4, and 5 were modelled based on the proposed future upgrade layout.
Figure 6-30 SIDRA Layouts – Bay View Terrace / St Quentin Ave
The overall SIDRA results for each scenario are presented in Table 6-14.
Table 6-14 SIDRA Analysis Results – Bay View Terrace / St Quentin Ave
Base 2022 existing layouts 2022 proposed layouts 2032 proposed layouts
existing without dev with dev
without
dev with dev without dev with dev
Parameter Scenario 1 Scenario 2.1 Scenario 3.1 Scenario 2 Scenario 3 Scenario 4 Scenario 5
We
ekd
ay
AM
Pea
k
DOS 0.066 0.069 0.098 0.068 0.068 0.081 0.081
Delay (s) 0.1 0.1 0.2 0.6 0.6 0.6 0.6
LOS A A A A A A A
Ave. Back of
Queue (m) 0.4 0.4 0.4 0.3 0.3 0.4 0.4
We
ekd
ay
PM
Pea
k
DOS 0.084 0.088 0.088 0.087 0.088 0.104 0.104
Delay (s) 0.2 0.2 0.2 0.6 0.6 0.6 0.6
LOS A A A A A A A
Ave. Back of Queue (m) 0.7 0.8 0.8 0.7 0.7 0.7 0.7
Satu
rda
y P
ea
k
DOS 0.087 0.090 0.091 0.089 0.090 0.107 0.108
Delay (s) 0.2 0.2 0.2 0.6 0.6 0.6 0.6
LOS A A A A A A A
Ave. Back of
Queue (m) 0.9 0.9 0.9 0.8 0.8 0.9 0.9
*LOS shown are from the worst movement at the intersection
Existing Proposed Future
upgrade
CW1146300 | 14 July 2021 | Commercial in Confidence 69
6.8 SIDRA Results Summary
Results of the SIDRA analysis are summarised as follows:
> Overall, the traffic impacts of the proposed development are expected to be minimal when compared to the impacts of future traffic growth on the surrounding network.
> For the existing scenario, the Stirling Highway/Bay View Terrace intersection operates at an acceptable LOS;
> The north approach of Stirling Highway/Bay View Terrace intersection (including upgrading this approach to two-way operations as per the proposed Stirling Highway upgrade) is expected to operate at LOS F for Scenario 2 (2022 without development) during the weekday AM, PM and weekend peak hour periods;
> For the existing scenario, Queenslea Dr/Stirling Highway/Stirling Road intersection currently operates at LOS F, LOS E and LOS D during the weekday AM, PM and weekend peak hour periods respectively. The traffic operations of this intersection are expected to worsen during the weekday AM, PM and weekend peak hour periods for the 2022 and 2032 horizon;
> The right-turn movement exiting from Church Lane to Stirling Highway is currently operating at LOS F for all peak hours during the weekday and weekend periods;
> The eastern approach of the Stirling Road/St Quentin Avenue intersection currently operates at LOS F during the weekend peak and is anticipated to experience higher delays for future scenarios;
> The eastern approach of the Stirling Road/St Quentin Avenue intersection is anticipated to operate at LOS F during the weekday PM and weekend peak hour periods for Scenarios 4 and 5;
> The intersections of St Quentin Ave / Church Ln, Avion Way / St Quentin Ave and Bay View Terrace / St Quentin Ave are expected to operate at satisfactory LOS (all movements at LOS A) for the weekday AM, PM and weekend peak hour periods for the 2032 horizon;
> Comparison of the 2022 opening year “with” and “without” development scenario for the current intersection configurations would indicate similar operational results and hence indicate the proposed development traffic has minimal impact on the adjacent intersections and road network;
> Scenario 4 assessment results showed that further traffic growth within the network will have a significant impact on the surrounding road network; and
> Scenario 5 assessment results indicate that the performance at the intersections within the surrounding area would deteriorate further with the additional development traffic. However, comparing the Scenario 4 and Scenario 5 modelling results, the performance of the intersections within the area are comparable and hence it is concluded that the impact of the proposed development traffic is minimal and insignificant in comparison with the impact due to the overall background traffic growth.
CW1146300 | 14 July 2021 | Commercial in Confidence 70
7 Conclusions
The following conclusions have been made in regards to the proposed development:
> The proposed development consists of retail, commercial and residential land uses;
> The Site is located within the Town of Claremont providing excellent access to pedestrian/cycle facilities, as well as public transport facilities. In addition, non-car trips such as walking and cycling is expected to be higher due to the proximity of trip attractors such as shopping centres;
> Internal trips within the Site is expected to reduce overall trips generated by the proposed development by about 22%, 36%, and 46% for AM, PM and weekend peaks respectively;
> Comparison of the 2022 opening year “with” and “without” development scenario for the current intersection configurations would indicate similar operational results and hence indicate the proposed development traffic has minimal impact on the adjacent intersections and road network; and
> Overall, the traffic impacts of the proposed development are expected to be minimal when compared to the impacts of future background traffic growth on the surrounding network.
CW1146300 | 14 July 2021 | Commercial in Confidence 71
22 St Quentin Avenue, Claremont - Mixed Use Development
APPENDIX
WAPC CHECKLIST
CW1146300 | 14 July 2021 | Commercial in Confidence 72
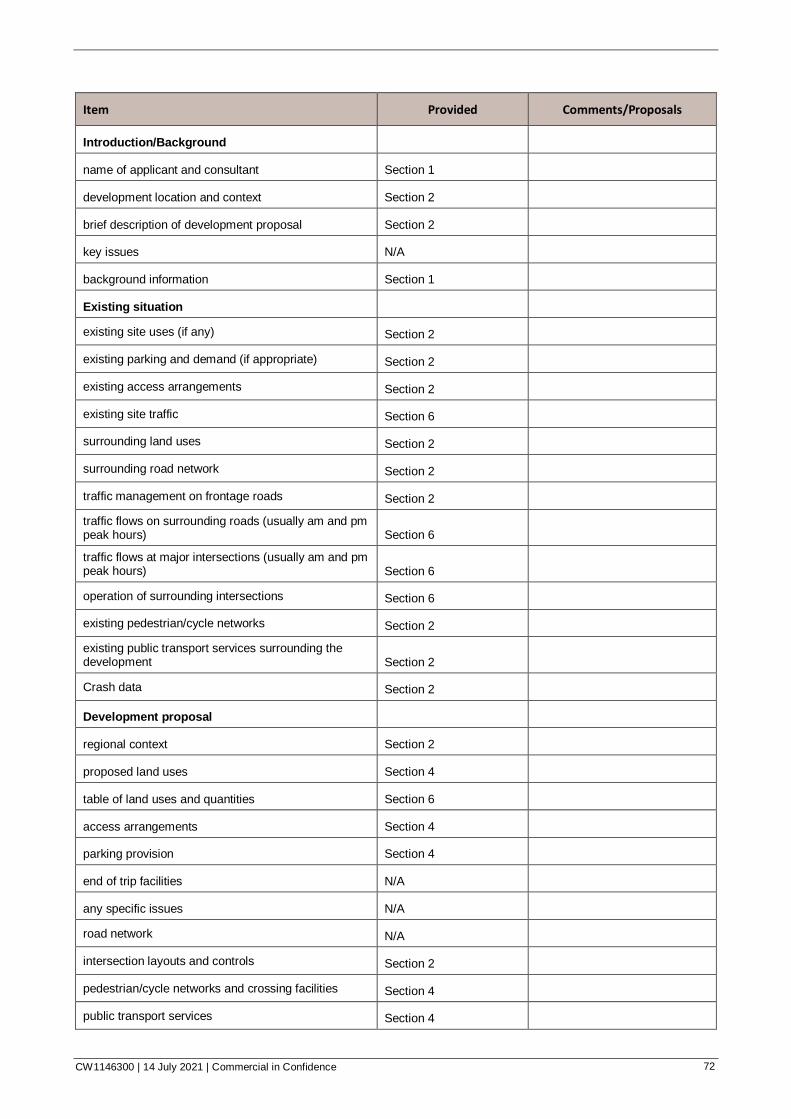
Item Provided Comments/Proposals
Introduction/Background
name of applicant and consultant Section 1
development location and context Section 2
brief description of development proposal Section 2
key issues N/A
background information Section 1
Existing situation
existing site uses (if any) Section 2
existing parking and demand (if appropriate) Section 2
existing access arrangements Section 2
existing site traffic Section 6
surrounding land uses Section 2
surrounding road network Section 2
traffic management on frontage roads Section 2
traffic flows on surrounding roads (usually am and pm peak hours) Section 6
traffic flows at major intersections (usually am and pm peak hours) Section 6
operation of surrounding intersections Section 6
existing pedestrian/cycle networks Section 2
existing public transport services surrounding the development Section 2
Crash data Section 2
Development proposal
regional context Section 2
proposed land uses Section 4
table of land uses and quantities Section 6
access arrangements Section 4
parking provision Section 4
end of trip facilities N/A
any specific issues N/A
road network N/A
intersection layouts and controls Section 2
pedestrian/cycle networks and crossing facilities Section 4
public transport services Section 4
CW1146300 | 14 July 2021 | Commercial in Confidence 73
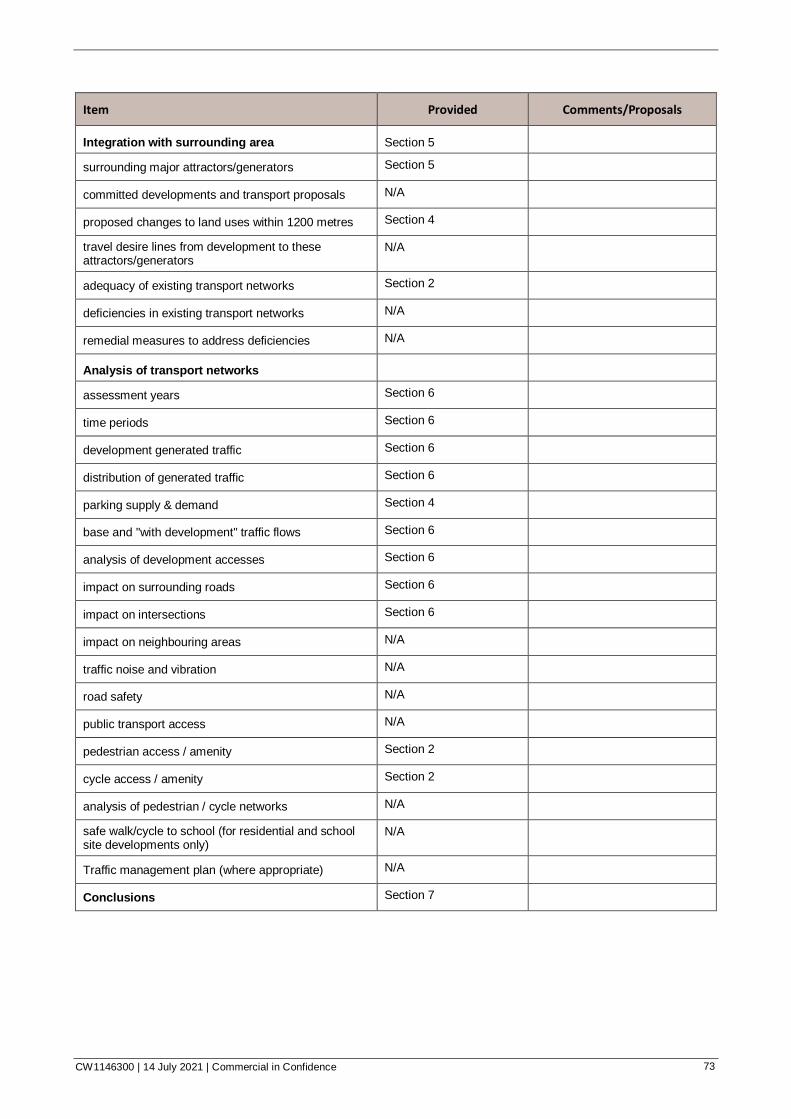
Item Provided Comments/Proposals
Integration with surrounding area Section 5
surrounding major attractors/generators Section 5
committed developments and transport proposals N/A
proposed changes to land uses within 1200 metres Section 4
travel desire lines from development to these attractors/generators
N/A
adequacy of existing transport networks Section 2
deficiencies in existing transport networks N/A
remedial measures to address deficiencies N/A
Analysis of transport networks
assessment years Section 6
time periods Section 6
development generated traffic Section 6
distribution of generated traffic Section 6
parking supply & demand Section 4
base and "with development" traffic flows Section 6
analysis of development accesses Section 6
impact on surrounding roads Section 6
impact on intersections Section 6
impact on neighbouring areas N/A
traffic noise and vibration N/A
road safety N/A
public transport access N/A
pedestrian access / amenity Section 2
cycle access / amenity Section 2
analysis of pedestrian / cycle networks N/A
safe walk/cycle to school (for residential and school site developments only)
N/A
Traffic management plan (where appropriate) N/A
Conclusions Section 7

CW1146300 | 14 July 2021 | Commercial in Confidence 74
22 St Quentin Avenue, Claremont - Mixed Use Development
APPENDIX
SIDRA RESULTS
CW1146300 | 14 July 2021 | Commercial in Confidence 75
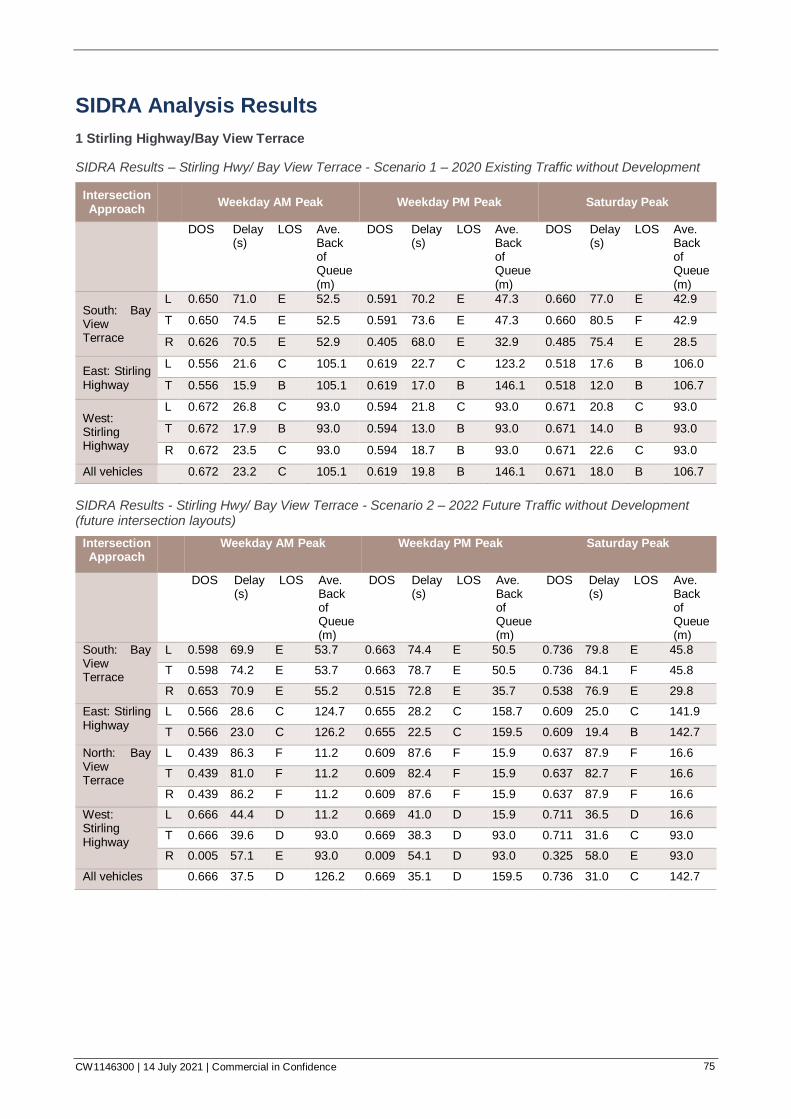
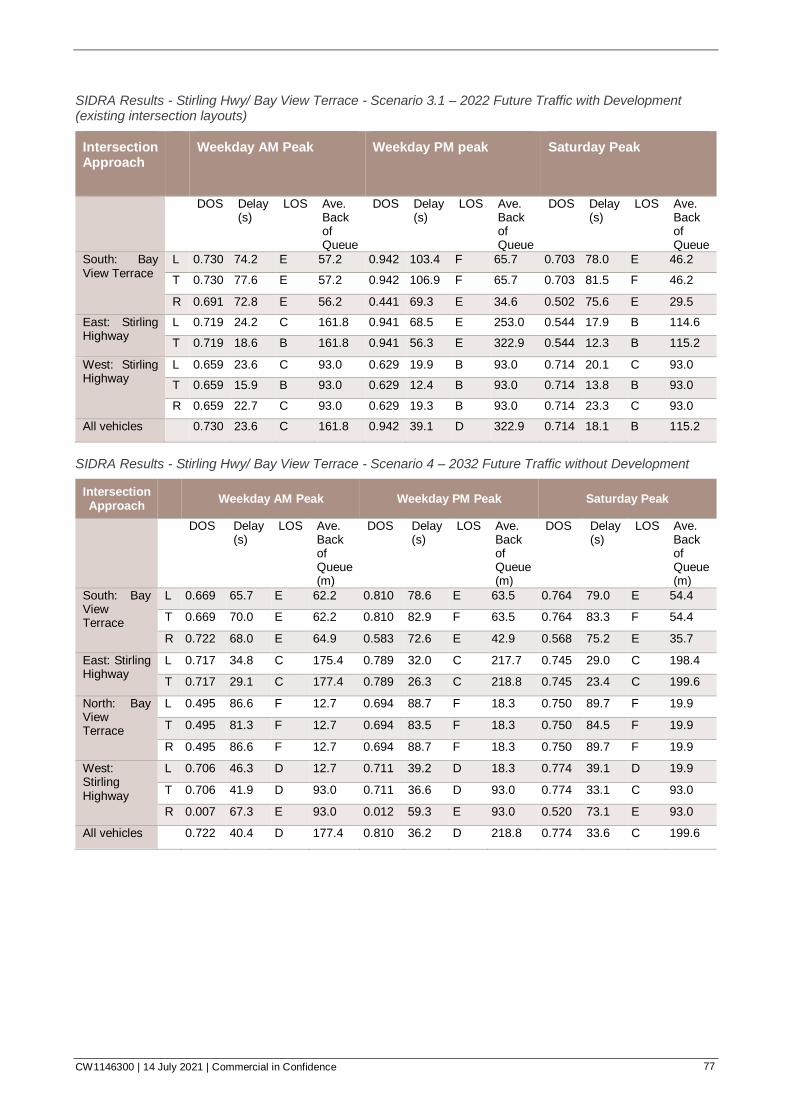
SIDRA Analysis Results
1 Stirling Highway/Bay View Terrace
SIDRA Results – Stirling Hwy/ Bay View Terrace - Scenario 1 – 2020 Existing Traffic without Development
Intersection Approach
Weekday AM Peak Weekday PM Peak Saturday Peak
DOS Delay
(s) LOS Ave.
Back of Queue (m)
DOS Delay (s)
LOS Ave. Back of Queue (m)
DOS Delay (s)
LOS Ave. Back of Queue (m)
South: Bay View Terrace
L 0.650 71.0 E 52.5 0.591 70.2 E 47.3 0.660 77.0 E 42.9
T 0.650 74.5 E 52.5 0.591 73.6 E 47.3 0.660 80.5 F 42.9
R 0.626 70.5 E 52.9 0.405 68.0 E 32.9 0.485 75.4 E 28.5
East: Stirling Highway
L 0.556 21.6 C 105.1 0.619 22.7 C 123.2 0.518 17.6 B 106.0
T 0.556 15.9 B 105.1 0.619 17.0 B 146.1 0.518 12.0 B 106.7
West: Stirling Highway
L 0.672 26.8 C 93.0 0.594 21.8 C 93.0 0.671 20.8 C 93.0
T 0.672 17.9 B 93.0 0.594 13.0 B 93.0 0.671 14.0 B 93.0
R 0.672 23.5 C 93.0 0.594 18.7 B 93.0 0.671 22.6 C 93.0
All vehicles
0.672 23.2 C 105.1 0.619 19.8 B 146.1 0.671 18.0 B 106.7
SIDRA Results - Stirling Hwy/ Bay View Terrace - Scenario 2 – 2022 Future Traffic without Development (future intersection layouts)
Intersection Approach
Weekday AM Peak Weekday PM Peak Saturday Peak
DOS Delay
(s) LOS Ave.
Back of Queue (m)
DOS Delay (s)
LOS Ave. Back of Queue (m)
DOS Delay (s)
LOS Ave. Back of Queue (m)
South: Bay View Terrace
L 0.598 69.9 E 53.7 0.663 74.4 E 50.5 0.736 79.8 E 45.8
T 0.598 74.2 E 53.7 0.663 78.7 E 50.5 0.736 84.1 F 45.8
R 0.653 70.9 E 55.2 0.515 72.8 E 35.7 0.538 76.9 E 29.8
East: Stirling Highway
L 0.566 28.6 C 124.7 0.655 28.2 C 158.7 0.609 25.0 C 141.9
T 0.566 23.0 C 126.2 0.655 22.5 C 159.5 0.609 19.4 B 142.7
North: Bay View Terrace
L 0.439 86.3 F 11.2 0.609 87.6 F 15.9 0.637 87.9 F 16.6
T 0.439 81.0 F 11.2 0.609 82.4 F 15.9 0.637 82.7 F 16.6
R 0.439 86.2 F 11.2 0.609 87.6 F 15.9 0.637 87.9 F 16.6
West: Stirling Highway
L 0.666 44.4 D 11.2 0.669 41.0 D 15.9 0.711 36.5 D 16.6
T 0.666 39.6 D 93.0 0.669 38.3 D 93.0 0.711 31.6 C 93.0
R 0.005 57.1 E 93.0 0.009 54.1 D 93.0 0.325 58.0 E 93.0
All vehicles 0.666 37.5 D 126.2 0.669 35.1 D 159.5 0.736 31.0 C 142.7
CW1146300 | 14 July 2021 | Commercial in Confidence 76
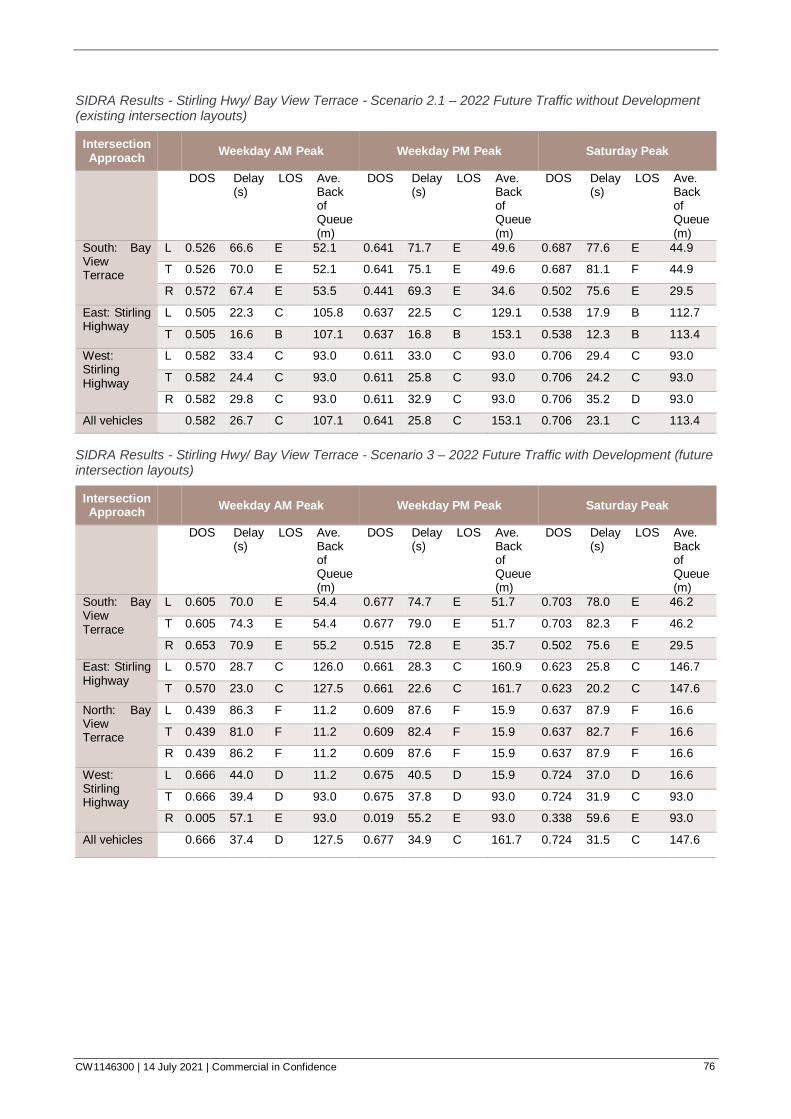
SIDRA Results - Stirling Hwy/ Bay View Terrace - Scenario 2.1 – 2022 Future Traffic without Development (existing intersection layouts)
Intersection Approach
Weekday AM Peak Weekday PM Peak Saturday Peak
DOS Delay
(s) LOS Ave.
Back of Queue (m)
DOS Delay (s)
LOS Ave. Back of Queue (m)
DOS Delay (s)
LOS Ave. Back of Queue (m)
South: Bay View Terrace
L 0.526 66.6 E 52.1 0.641 71.7 E 49.6 0.687 77.6 E 44.9
T 0.526 70.0 E 52.1 0.641 75.1 E 49.6 0.687 81.1 F 44.9
R 0.572 67.4 E 53.5 0.441 69.3 E 34.6 0.502 75.6 E 29.5
East: Stirling Highway
L 0.505 22.3 C 105.8 0.637 22.5 C 129.1 0.538 17.9 B 112.7
T 0.505 16.6 B 107.1 0.637 16.8 B 153.1 0.538 12.3 B 113.4
West: Stirling Highway
L 0.582 33.4 C 93.0 0.611 33.0 C 93.0 0.706 29.4 C 93.0
T 0.582 24.4 C 93.0 0.611 25.8 C 93.0 0.706 24.2 C 93.0
R 0.582 29.8 C 93.0 0.611 32.9 C 93.0 0.706 35.2 D 93.0
All vehicles
0.582 26.7 C 107.1 0.641 25.8 C 153.1 0.706 23.1 C 113.4
SIDRA Results - Stirling Hwy/ Bay View Terrace - Scenario 3 – 2022 Future Traffic with Development (future intersection layouts)
Intersection Approach
Weekday AM Peak Weekday PM Peak Saturday Peak
DOS Delay
(s) LOS Ave.
Back of Queue (m)
DOS Delay (s)
LOS Ave. Back of Queue (m)
DOS Delay (s)
LOS Ave. Back of Queue (m)
South: Bay View Terrace
L 0.605 70.0 E 54.4 0.677 74.7 E 51.7 0.703 78.0 E 46.2
T 0.605 74.3 E 54.4 0.677 79.0 E 51.7 0.703 82.3 F 46.2
R 0.653 70.9 E 55.2 0.515 72.8 E 35.7 0.502 75.6 E 29.5
East: Stirling Highway
L 0.570 28.7 C 126.0 0.661 28.3 C 160.9 0.623 25.8 C 146.7
T 0.570 23.0 C 127.5 0.661 22.6 C 161.7 0.623 20.2 C 147.6
North: Bay View Terrace
L 0.439 86.3 F 11.2 0.609 87.6 F 15.9 0.637 87.9 F 16.6
T 0.439 81.0 F 11.2 0.609 82.4 F 15.9 0.637 82.7 F 16.6
R 0.439 86.2 F 11.2 0.609 87.6 F 15.9 0.637 87.9 F 16.6
West: Stirling Highway
L 0.666 44.0 D 11.2 0.675 40.5 D 15.9 0.724 37.0 D 16.6
T 0.666 39.4 D 93.0 0.675 37.8 D 93.0 0.724 31.9 C 93.0
R 0.005 57.1 E 93.0 0.019 55.2 E 93.0 0.338 59.6 E 93.0
All vehicles
0.666 37.4 D 127.5 0.677 34.9 C 161.7 0.724 31.5 C 147.6
CW1146300 | 14 July 2021 | Commercial in Confidence 77
SIDRA Results - Stirling Hwy/ Bay View Terrace - Scenario 3.1 – 2022 Future Traffic with Development (existing intersection layouts)
Intersection Approach
Weekday AM Peak Weekday PM peak Saturday Peak
DOS Delay
(s) LOS Ave.
Back of Queue
DOS Delay (s)
LOS Ave. Back of Queue
DOS Delay (s)
LOS Ave. Back of Queue
South: Bay View Terrace
L 0.730 74.2 E 57.2 0.942 103.4 F 65.7 0.703 78.0 E 46.2
T 0.730 77.6 E 57.2 0.942 106.9 F 65.7 0.703 81.5 F 46.2
R 0.691 72.8 E 56.2 0.441 69.3 E 34.6 0.502 75.6 E 29.5
East: Stirling Highway
L 0.719 24.2 C 161.8 0.941 68.5 E 253.0 0.544 17.9 B 114.6
T 0.719 18.6 B 161.8 0.941 56.3 E 322.9 0.544 12.3 B 115.2
West: Stirling Highway
L 0.659 23.6 C 93.0 0.629 19.9 B 93.0 0.714 20.1 C 93.0
T 0.659 15.9 B 93.0 0.629 12.4 B 93.0 0.714 13.8 B 93.0
R 0.659 22.7 C 93.0 0.629 19.3 B 93.0 0.714 23.3 C 93.0
All vehicles 0.730 23.6 C 161.8 0.942 39.1 D 322.9 0.714 18.1 B 115.2
SIDRA Results - Stirling Hwy/ Bay View Terrace - Scenario 4 – 2032 Future Traffic without Development
Intersection Approach
Weekday AM Peak Weekday PM Peak Saturday Peak
DOS Delay
(s) LOS Ave.
Back of Queue (m)
DOS Delay (s)
LOS Ave. Back of Queue (m)
DOS Delay (s)
LOS Ave. Back of Queue (m)
South: Bay View Terrace
L 0.669 65.7 E 62.2 0.810 78.6 E 63.5 0.764 79.0 E 54.4
T 0.669 70.0 E 62.2 0.810 82.9 F 63.5 0.764 83.3 F 54.4
R 0.722 68.0 E 64.9 0.583 72.6 E 42.9 0.568 75.2 E 35.7
East: Stirling Highway
L 0.717 34.8 C 175.4 0.789 32.0 C 217.7 0.745 29.0 C 198.4
T 0.717 29.1 C 177.4 0.789 26.3 C 218.8 0.745 23.4 C 199.6
North: Bay View Terrace
L 0.495 86.6 F 12.7 0.694 88.7 F 18.3 0.750 89.7 F 19.9
T 0.495 81.3 F 12.7 0.694 83.5 F 18.3 0.750 84.5 F 19.9
R 0.495 86.6 F 12.7 0.694 88.7 F 18.3 0.750 89.7 F 19.9
West: Stirling Highway
L 0.706 46.3 D 12.7 0.711 39.2 D 18.3 0.774 39.1 D 19.9
T 0.706 41.9 D 93.0 0.711 36.6 D 93.0 0.774 33.1 C 93.0
R 0.007 67.3 E 93.0 0.012 59.3 E 93.0 0.520 73.1 E 93.0
All vehicles
0.722 40.4 D 177.4 0.810 36.2 D 218.8 0.774 33.6 C 199.6
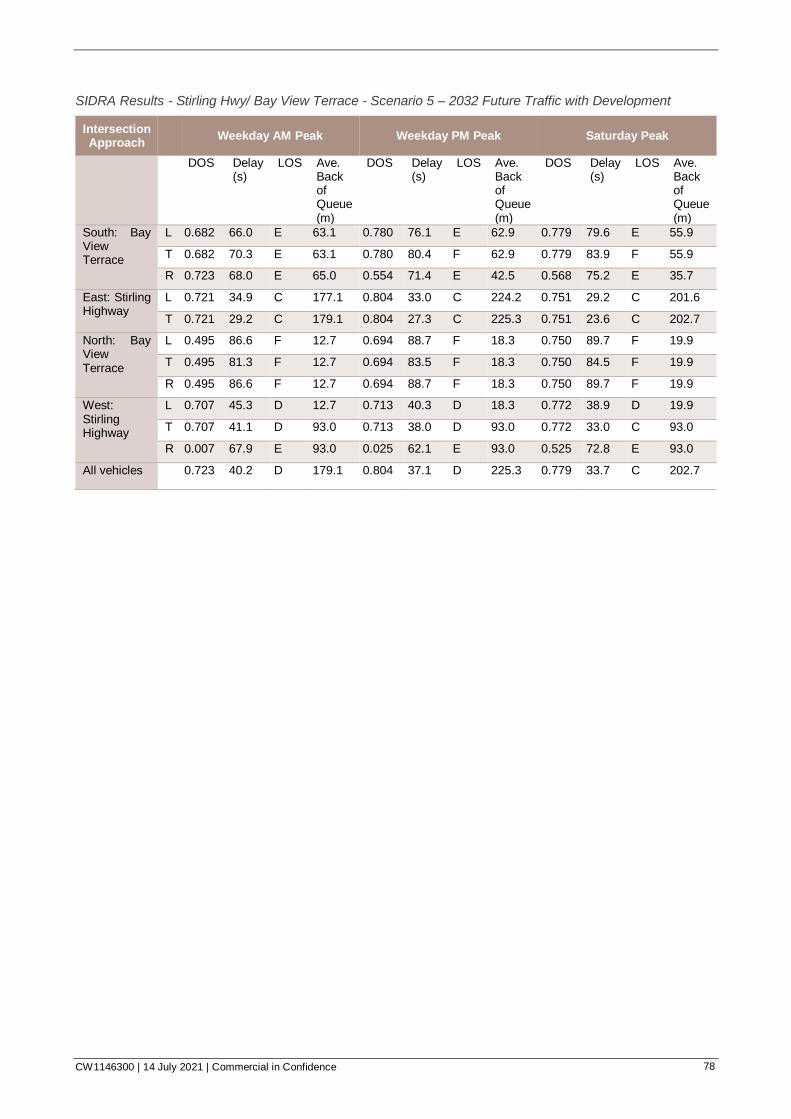
CW1146300 | 14 July 2021 | Commercial in Confidence 78
SIDRA Results - Stirling Hwy/ Bay View Terrace - Scenario 5 – 2032 Future Traffic with Development
Intersection Approach
Weekday AM Peak Weekday PM Peak Saturday Peak
DOS Delay
(s) LOS Ave.
Back of Queue (m)
DOS Delay (s)
LOS Ave. Back of Queue (m)
DOS Delay (s)
LOS Ave. Back of Queue (m)
South: Bay View Terrace
L 0.682 66.0 E 63.1 0.780 76.1 E 62.9 0.779 79.6 E 55.9
T 0.682 70.3 E 63.1 0.780 80.4 F 62.9 0.779 83.9 F 55.9
R 0.723 68.0 E 65.0 0.554 71.4 E 42.5 0.568 75.2 E 35.7
East: Stirling Highway
L 0.721 34.9 C 177.1 0.804 33.0 C 224.2 0.751 29.2 C 201.6
T 0.721 29.2 C 179.1 0.804 27.3 C 225.3 0.751 23.6 C 202.7
North: Bay View Terrace
L 0.495 86.6 F 12.7 0.694 88.7 F 18.3 0.750 89.7 F 19.9
T 0.495 81.3 F 12.7 0.694 83.5 F 18.3 0.750 84.5 F 19.9
R 0.495 86.6 F 12.7 0.694 88.7 F 18.3 0.750 89.7 F 19.9
West: Stirling Highway
L 0.707 45.3 D 12.7 0.713 40.3 D 18.3 0.772 38.9 D 19.9
T 0.707 41.1 D 93.0 0.713 38.0 D 93.0 0.772 33.0 C 93.0
R 0.007 67.9 E 93.0 0.025 62.1 E 93.0 0.525 72.8 E 93.0
All vehicles
0.723 40.2 D 179.1 0.804 37.1 D 225.3 0.779 33.7 C 202.7
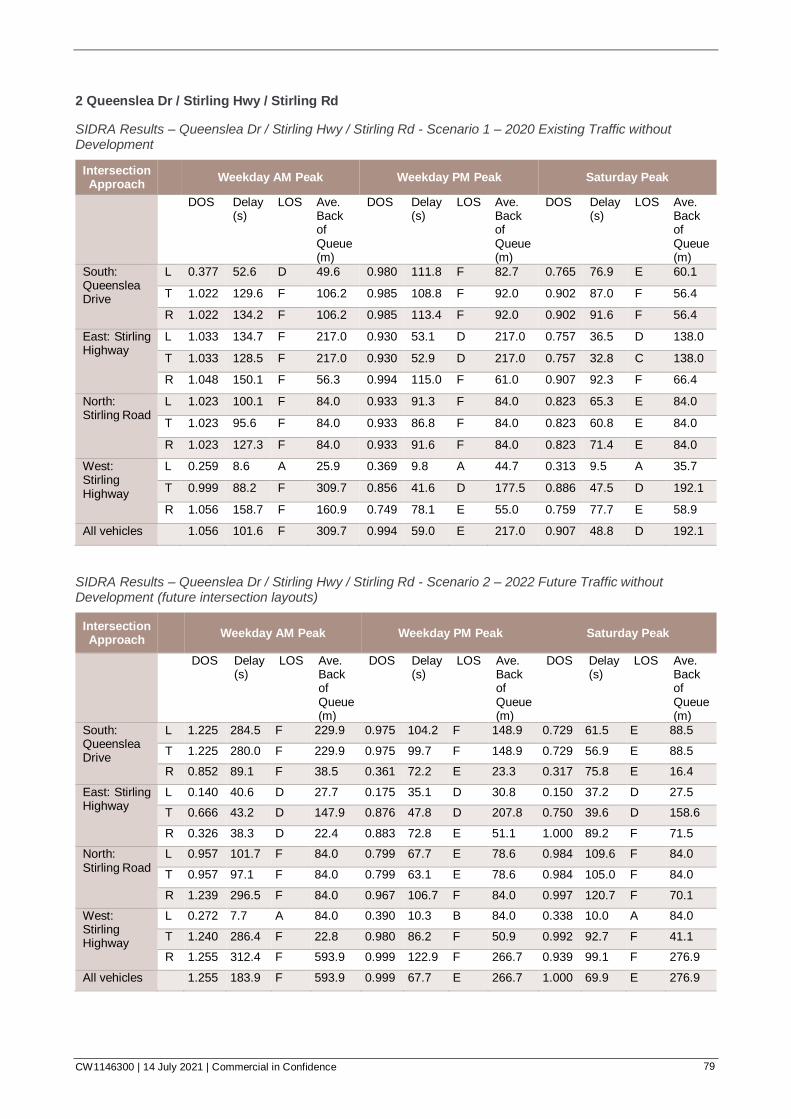
CW1146300 | 14 July 2021 | Commercial in Confidence 79
2 Queenslea Dr / Stirling Hwy / Stirling Rd
SIDRA Results – Queenslea Dr / Stirling Hwy / Stirling Rd - Scenario 1 – 2020 Existing Traffic without Development
Intersection Approach
Weekday AM Peak Weekday PM Peak Saturday Peak
DOS Delay (s)
LOS Ave. Back of Queue (m)
DOS Delay (s)
LOS Ave. Back of Queue (m)
DOS Delay (s)
LOS Ave. Back of Queue (m)
South: Queenslea Drive
L 0.377 52.6 D 49.6 0.980 111.8 F 82.7 0.765 76.9 E 60.1
T 1.022 129.6 F 106.2 0.985 108.8 F 92.0 0.902 87.0 F 56.4
R 1.022 134.2 F 106.2 0.985 113.4 F 92.0 0.902 91.6 F 56.4
East: Stirling Highway
L 1.033 134.7 F 217.0 0.930 53.1 D 217.0 0.757 36.5 D 138.0
T 1.033 128.5 F 217.0 0.930 52.9 D 217.0 0.757 32.8 C 138.0
R 1.048 150.1 F 56.3 0.994 115.0 F 61.0 0.907 92.3 F 66.4
North: Stirling Road
L 1.023 100.1 F 84.0 0.933 91.3 F 84.0 0.823 65.3 E 84.0
T 1.023 95.6 F 84.0 0.933 86.8 F 84.0 0.823 60.8 E 84.0
R 1.023 127.3 F 84.0 0.933 91.6 F 84.0 0.823 71.4 E 84.0
West: Stirling Highway
L 0.259 8.6 A 25.9 0.369 9.8 A 44.7 0.313 9.5 A 35.7
T 0.999 88.2 F 309.7 0.856 41.6 D 177.5 0.886 47.5 D 192.1
R 1.056 158.7 F 160.9 0.749 78.1 E 55.0 0.759 77.7 E 58.9
All vehicles
1.056 101.6 F 309.7 0.994 59.0 E 217.0 0.907 48.8 D 192.1
SIDRA Results – Queenslea Dr / Stirling Hwy / Stirling Rd - Scenario 2 – 2022 Future Traffic without Development (future intersection layouts)
Intersection Approach
Weekday AM Peak Weekday PM Peak Saturday Peak
DOS Delay (s)
LOS Ave. Back of Queue (m)
DOS Delay (s)
LOS Ave. Back of Queue (m)
DOS Delay (s)
LOS Ave. Back of Queue (m)
South: Queenslea Drive
L 1.225 284.5 F 229.9 0.975 104.2 F 148.9 0.729 61.5 E 88.5
T 1.225 280.0 F 229.9 0.975 99.7 F 148.9 0.729 56.9 E 88.5
R 0.852 89.1 F 38.5 0.361 72.2 E 23.3 0.317 75.8 E 16.4
East: Stirling Highway
L 0.140 40.6 D 27.7 0.175 35.1 D 30.8 0.150 37.2 D 27.5
T 0.666 43.2 D 147.9 0.876 47.8 D 207.8 0.750 39.6 D 158.6
R 0.326 38.3 D 22.4 0.883 72.8 E 51.1 1.000 89.2 F 71.5
North: Stirling Road
L 0.957 101.7 F 84.0 0.799 67.7 E 78.6 0.984 109.6 F 84.0
T 0.957 97.1 F 84.0 0.799 63.1 E 78.6 0.984 105.0 F 84.0
R 1.239 296.5 F 84.0 0.967 106.7 F 84.0 0.997 120.7 F 70.1
West: Stirling Highway
L 0.272 7.7 A 84.0 0.390 10.3 B 84.0 0.338 10.0 A 84.0
T 1.240 286.4 F 22.8 0.980 86.2 F 50.9 0.992 92.7 F 41.1
R 1.255 312.4 F 593.9 0.999 122.9 F 266.7 0.939 99.1 F 276.9
All vehicles 1.255 183.9 F 593.9 0.999 67.7 E 266.7 1.000 69.9 E 276.9
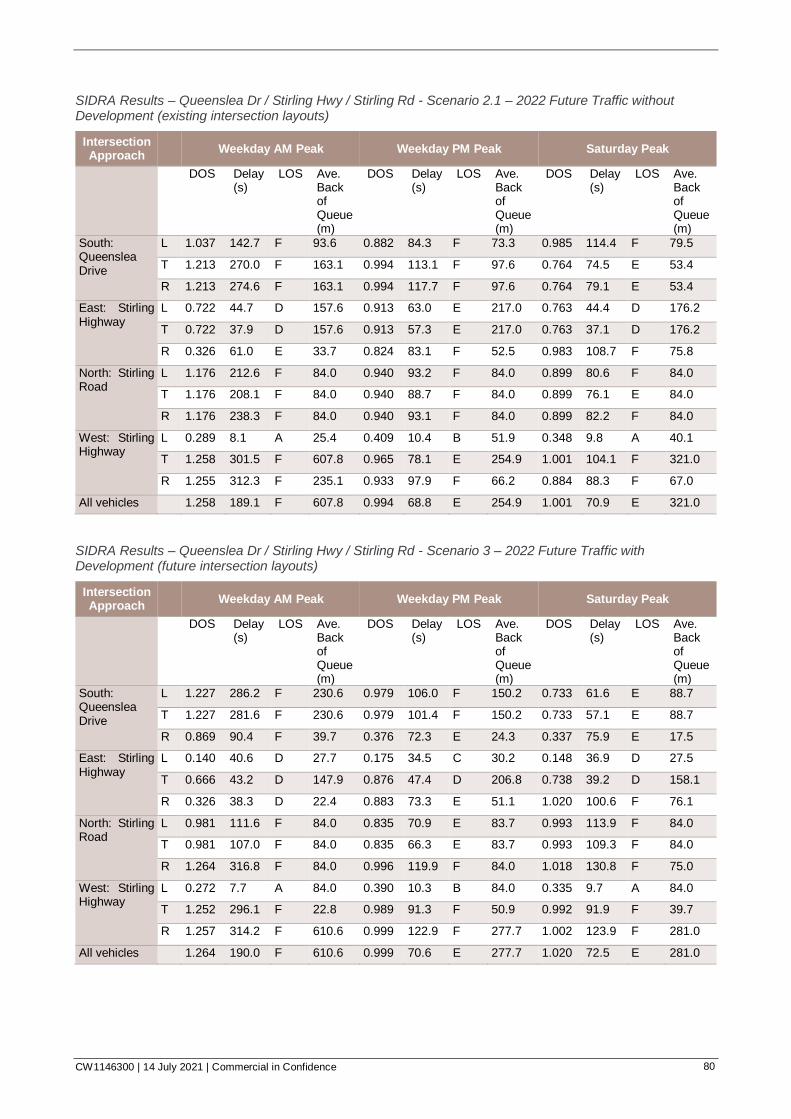
CW1146300 | 14 July 2021 | Commercial in Confidence 80
SIDRA Results – Queenslea Dr / Stirling Hwy / Stirling Rd - Scenario 2.1 – 2022 Future Traffic without Development (existing intersection layouts)
Intersection Approach
Weekday AM Peak Weekday PM Peak Saturday Peak
DOS Delay (s)
LOS Ave. Back of Queue (m)
DOS Delay (s)
LOS Ave. Back of Queue (m)
DOS Delay (s)
LOS Ave. Back of Queue (m)
South: Queenslea Drive
L 1.037 142.7 F 93.6 0.882 84.3 F 73.3 0.985 114.4 F 79.5
T 1.213 270.0 F 163.1 0.994 113.1 F 97.6 0.764 74.5 E 53.4
R 1.213 274.6 F 163.1 0.994 117.7 F 97.6 0.764 79.1 E 53.4
East: Stirling Highway
L 0.722 44.7 D 157.6 0.913 63.0 E 217.0 0.763 44.4 D 176.2
T 0.722 37.9 D 157.6 0.913 57.3 E 217.0 0.763 37.1 D 176.2
R 0.326 61.0 E 33.7 0.824 83.1 F 52.5 0.983 108.7 F 75.8
North: Stirling Road
L 1.176 212.6 F 84.0 0.940 93.2 F 84.0 0.899 80.6 F 84.0
T 1.176 208.1 F 84.0 0.940 88.7 F 84.0 0.899 76.1 E 84.0
R 1.176 238.3 F 84.0 0.940 93.1 F 84.0 0.899 82.2 F 84.0
West: Stirling Highway
L 0.289 8.1 A 25.4 0.409 10.4 B 51.9 0.348 9.8 A 40.1
T 1.258 301.5 F 607.8 0.965 78.1 E 254.9 1.001 104.1 F 321.0
R 1.255 312.3 F 235.1 0.933 97.9 F 66.2 0.884 88.3 F 67.0
All vehicles
1.258 189.1 F 607.8 0.994 68.8 E 254.9 1.001 70.9 E 321.0
SIDRA Results – Queenslea Dr / Stirling Hwy / Stirling Rd - Scenario 3 – 2022 Future Traffic with Development (future intersection layouts)
Intersection Approach
Weekday AM Peak Weekday PM Peak Saturday Peak
DOS Delay (s)
LOS Ave. Back of Queue (m)
DOS Delay (s)
LOS Ave. Back of Queue (m)
DOS Delay (s)
LOS Ave. Back of Queue (m)
South: Queenslea Drive
L 1.227 286.2 F 230.6 0.979 106.0 F 150.2 0.733 61.6 E 88.7
T 1.227 281.6 F 230.6 0.979 101.4 F 150.2 0.733 57.1 E 88.7
R 0.869 90.4 F 39.7 0.376 72.3 E 24.3 0.337 75.9 E 17.5
East: Stirling Highway
L 0.140 40.6 D 27.7 0.175 34.5 C 30.2 0.148 36.9 D 27.5
T 0.666 43.2 D 147.9 0.876 47.4 D 206.8 0.738 39.2 D 158.1
R 0.326 38.3 D 22.4 0.883 73.3 E 51.1 1.020 100.6 F 76.1
North: Stirling Road
L 0.981 111.6 F 84.0 0.835 70.9 E 83.7 0.993 113.9 F 84.0
T 0.981 107.0 F 84.0 0.835 66.3 E 83.7 0.993 109.3 F 84.0
R 1.264 316.8 F 84.0 0.996 119.9 F 84.0 1.018 130.8 F 75.0
West: Stirling Highway
L 0.272 7.7 A 84.0 0.390 10.3 B 84.0 0.335 9.7 A 84.0
T 1.252 296.1 F 22.8 0.989 91.3 F 50.9 0.992 91.9 F 39.7
R 1.257 314.2 F 610.6 0.999 122.9 F 277.7 1.002 123.9 F 281.0
All vehicles
1.264 190.0 F 610.6 0.999 70.6 E 277.7 1.020 72.5 E 281.0
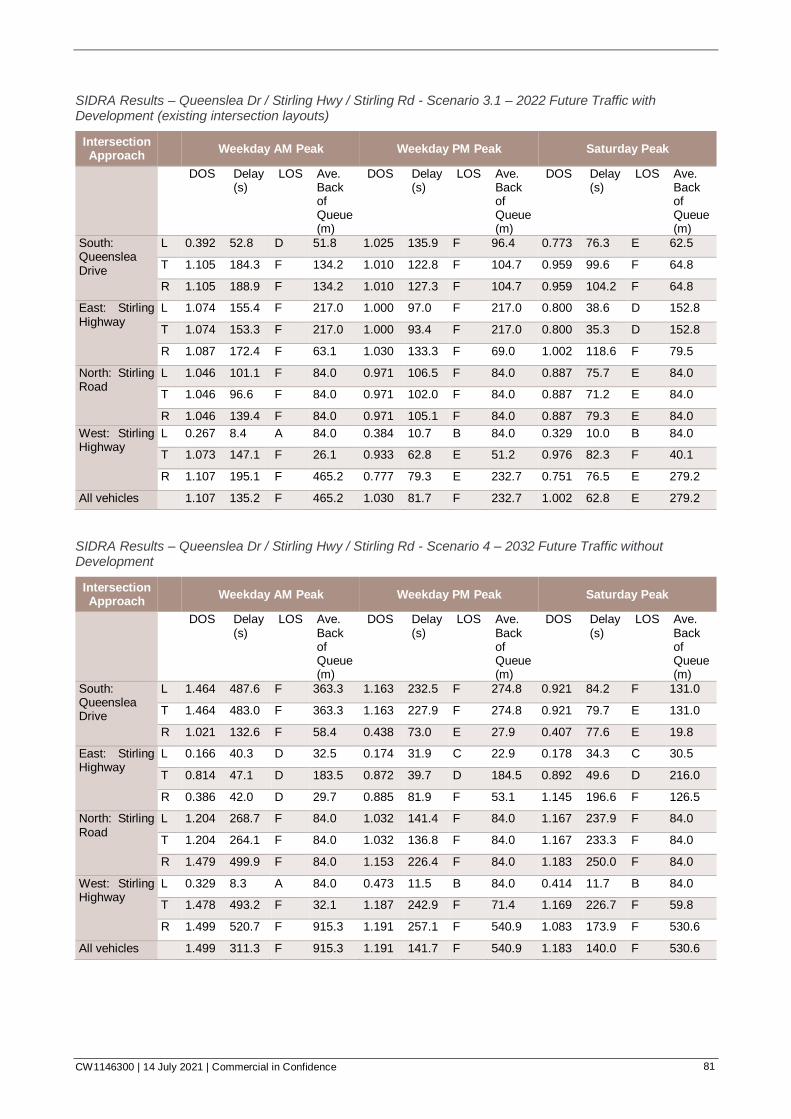
CW1146300 | 14 July 2021 | Commercial in Confidence 81
SIDRA Results – Queenslea Dr / Stirling Hwy / Stirling Rd - Scenario 3.1 – 2022 Future Traffic with Development (existing intersection layouts)
Intersection Approach
Weekday AM Peak Weekday PM Peak Saturday Peak
DOS Delay (s)
LOS Ave. Back of Queue (m)
DOS Delay (s)
LOS Ave. Back of Queue (m)
DOS Delay (s)
LOS Ave. Back of Queue (m)
South: Queenslea Drive
L 0.392 52.8 D 51.8 1.025 135.9 F 96.4 0.773 76.3 E 62.5
T 1.105 184.3 F 134.2 1.010 122.8 F 104.7 0.959 99.6 F 64.8
R 1.105 188.9 F 134.2 1.010 127.3 F 104.7 0.959 104.2 F 64.8
East: Stirling Highway
L 1.074 155.4 F 217.0 1.000 97.0 F 217.0 0.800 38.6 D 152.8
T 1.074 153.3 F 217.0 1.000 93.4 F 217.0 0.800 35.3 D 152.8
R 1.087 172.4 F 63.1 1.030 133.3 F 69.0 1.002 118.6 F 79.5
North: Stirling Road
L 1.046 101.1 F 84.0 0.971 106.5 F 84.0 0.887 75.7 E 84.0
T 1.046 96.6 F 84.0 0.971 102.0 F 84.0 0.887 71.2 E 84.0
R 1.046 139.4 F 84.0 0.971 105.1 F 84.0 0.887 79.3 E 84.0
West: Stirling Highway
L 0.267 8.4 A 84.0 0.384 10.7 B 84.0 0.329 10.0 B 84.0
T 1.073 147.1 F 26.1 0.933 62.8 E 51.2 0.976 82.3 F 40.1
R 1.107 195.1 F 465.2 0.777 79.3 E 232.7 0.751 76.5 E 279.2
All vehicles
1.107 135.2 F 465.2 1.030 81.7 F 232.7 1.002 62.8 E 279.2
SIDRA Results – Queenslea Dr / Stirling Hwy / Stirling Rd - Scenario 4 – 2032 Future Traffic without Development
Intersection Approach
Weekday AM Peak Weekday PM Peak Saturday Peak
DOS Delay (s)
LOS Ave. Back of Queue (m)
DOS Delay (s)
LOS Ave. Back of Queue (m)
DOS Delay (s)
LOS Ave. Back of Queue (m)
South: Queenslea Drive
L 1.464 487.6 F 363.3 1.163 232.5 F 274.8 0.921 84.2 F 131.0
T 1.464 483.0 F 363.3 1.163 227.9 F 274.8 0.921 79.7 E 131.0
R 1.021 132.6 F 58.4 0.438 73.0 E 27.9 0.407 77.6 E 19.8
East: Stirling Highway
L 0.166 40.3 D 32.5 0.174 31.9 C 22.9 0.178 34.3 C 30.5
T 0.814 47.1 D 183.5 0.872 39.7 D 184.5 0.892 49.6 D 216.0
R 0.386 42.0 D 29.7 0.885 81.9 F 53.1 1.145 196.6 F 126.5
North: Stirling Road
L 1.204 268.7 F 84.0 1.032 141.4 F 84.0 1.167 237.9 F 84.0
T 1.204 264.1 F 84.0 1.032 136.8 F 84.0 1.167 233.3 F 84.0
R 1.479 499.9 F 84.0 1.153 226.4 F 84.0 1.183 250.0 F 84.0
West: Stirling Highway
L 0.329 8.3 A 84.0 0.473 11.5 B 84.0 0.414 11.7 B 84.0
T 1.478 493.2 F 32.1 1.187 242.9 F 71.4 1.169 226.7 F 59.8
R 1.499 520.7 F 915.3 1.191 257.1 F 540.9 1.083 173.9 F 530.6
All vehicles
1.499 311.3 F 915.3 1.191 141.7 F 540.9 1.183 140.0 F 530.6

CW1146300 | 14 July 2021 | Commercial in Confidence 82
SIDRA Results – Queenslea Dr / Stirling Hwy / Stirling Rd - Scenario 5 – 2032 Future Traffic with Development
Intersection Approach
Weekday AM Peak Weekday PM Peak Saturday Peak
DOS Delay (s)
LOS Ave. Back of Queue (m)
DOS Delay (s)
LOS Ave. Back of Queue (m)
DOS Delay (s)
LOS Ave. Back of Queue (m)
South: Queenslea Drive
L 1.466 489.3 F 364.0 1.166 234.6 F 276.1 1.012 124.9 F 163.0
T 1.466 484.7 F 364.0 1.166 230.1 F 276.1 1.012 120.3 F 163.0
R 1.482 502.6 F 125.2 0.448 73.0 E 28.9 0.401 76.5 E 21.0
East: Stirling Highway
L 0.161 38.7 D 31.7 0.173 31.9 C 22.7 0.176 33.6 C 28.5
T 0.788 44.3 D 177.8 0.865 38.9 D 180.8 0.878 46.1 D 205.3
R 0.374 41.0 D 29.1 0.879 81.4 F 52.5 1.124 178.5 F 119.7
North: Stirling Road
L 1.146 221.3 F 84.0 1.054 154.7 F 84.0 1.156 227.8 F 84.0
T 1.146 216.7 F 84.0 1.054 150.1 F 84.0 1.156 223.2 F 84.0
R 0.931 100.7 F 31.3 1.181 248.8 F 84.0 1.112 193.9 F 84.0
West: Stirling Highway
L 0.329 8.3 A 84.0 0.473 11.4 B 84.0 0.419 12.4 B 84.0
T 1.449 467.5 F 32.0 1.189 244.0 F 71.3 1.166 224.1 F 63.5
R 1.480 504.3 F 904.1 1.191 257.1 F 548.4 1.069 164.3 F 536.2
All vehicles
1.482 287.5 F 904.1 1.191 145.5 F 548.4 1.166 135.7 F 536.2

CW1146300 | 14 July 2021 | Commercial in Confidence 83
3 Church Ln / Stirling Hwy
SIDRA Results – Church Ln / Stirling Hwy - Scenario 1 – 2020 Existing Traffic without Development
Intersection Approach
Weekday AM Peak Weekday PM Peak Saturday Peak
DOS Delay (s)
LOS Ave. Back of Queue (m)
DOS Delay (s)
LOS Ave. Back of Queue (m)
DOS Delay (s)
LOS Ave. Back of Queue (m)
East: Stirling Highway
T 0.313 1.2 A 49.2 0.529 1.2 A 17.9 0.457 3.2 A 13.1
R 0.313 26.1 D 49.2 0.529 20.2 C 5.4 0.457 23.9 C 13.1
North: Church Lane
L 0.290 12.8 B 1.4 0.831 75 F 9.3 0.62 23 C 5.2
R 0.290 175.2 F 1.4 0.831 347.8 F 9.3 0.62 241 F 5.2
West: Stirling Highway
L 0.420 5.6 A 69.4 0.362 5.6 A 7.3 0.385 5.6 A 35.1
T 0.420 0 A 71.0 0.362 0 A 10.8 0.385 0 A 35.1
All vehicles
0.420 0.9 NA 71.0 0.831 3.4 NA 17.9 0.62 3.2 NA 35.1
NA: Intersection LOS and Major Road Approach LOS values are Not Applicable for two-way sign control since the average delay is not a good LOS measure due to zero delays associated with major road movements.
SIDRA Results – Church Ln / Stirling Hwy - Scenario 2 – 2022 Future Traffic without Development (future intersection layouts)
Intersection Approach
Weekday AM Peak Weekday PM Peak Saturday Peak
DOS Delay (s)
LOS Ave. Back of Queue (m)
DOS Delay (s)
LOS Ave. Back of Queue (m)
DOS Delay (s)
LOS Ave. Back of Queue (m)
East: Stirling Highway
T 0.331 0.0 A 0.0 0.664 0.1 A 0.0 0.391 0.0 A 0.0
R 0.038 14.3 B 0.3 0.096 16.3 C 0.8 0.247 19.4 C 2.3
North: Church Lane
L 0.033 8.1 A 1.7 0.156 8.2 A 8.3 0.214 8.4 A 12.3
West: Stirling Highway
L 0.362 5.6 A 103.2 0.376 5.6 A 99.9 0.399 5.6 A 108.7
T 0.362 0.1 A 115.6 0.376 0.1 A 129.3 0.399 0.1 A 108.7
All vehicles
0.362 0.2 NA 115.6 0.664 0.5 NA 129.3 0.399 0.9 NA 108.7
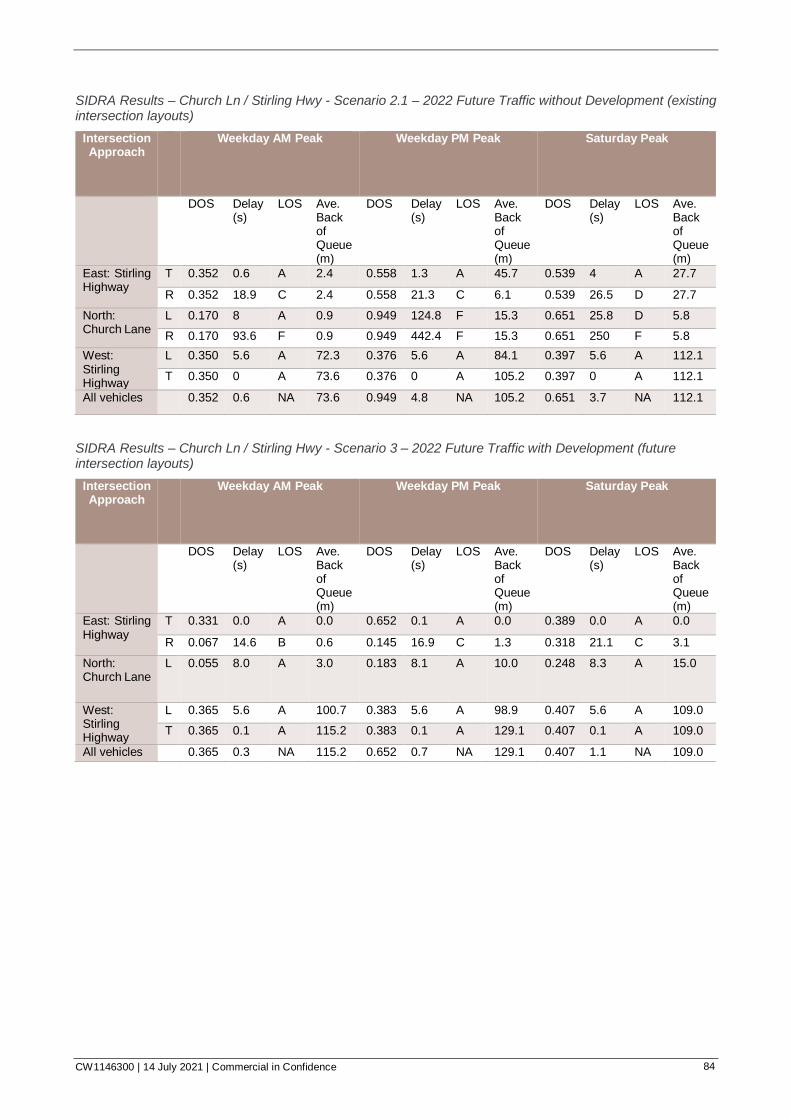
CW1146300 | 14 July 2021 | Commercial in Confidence 84
SIDRA Results – Church Ln / Stirling Hwy - Scenario 2.1 – 2022 Future Traffic without Development (existing intersection layouts)
Intersection Approach
Weekday AM Peak Weekday PM Peak Saturday Peak
DOS Delay (s)
LOS Ave. Back of Queue (m)
DOS Delay (s)
LOS Ave. Back of Queue (m)
DOS Delay (s)
LOS Ave. Back of Queue (m)
East: Stirling Highway
T 0.352 0.6 A 2.4 0.558 1.3 A 45.7 0.539 4 A 27.7
R 0.352 18.9 C 2.4 0.558 21.3 C 6.1 0.539 26.5 D 27.7
North: Church Lane
L 0.170 8 A 0.9 0.949 124.8 F 15.3 0.651 25.8 D 5.8
R 0.170 93.6 F 0.9 0.949 442.4 F 15.3 0.651 250 F 5.8
West: Stirling Highway
L 0.350 5.6 A 72.3 0.376 5.6 A 84.1 0.397 5.6 A 112.1
T 0.350 0 A 73.6 0.376 0 A 105.2 0.397 0 A 112.1
All vehicles
0.352 0.6 NA 73.6 0.949 4.8 NA 105.2 0.651 3.7 NA 112.1
SIDRA Results – Church Ln / Stirling Hwy - Scenario 3 – 2022 Future Traffic with Development (future intersection layouts)
Intersection Approach
Weekday AM Peak Weekday PM Peak Saturday Peak
DOS Delay (s)
LOS Ave. Back of Queue (m)
DOS Delay (s)
LOS Ave. Back of Queue (m)
DOS Delay (s)
LOS Ave. Back of Queue (m)
East: Stirling Highway
T 0.331 0.0 A 0.0 0.652 0.1 A 0.0 0.389 0.0 A 0.0
R 0.067 14.6 B 0.6 0.145 16.9 C 1.3 0.318 21.1 C 3.1
North: Church Lane
L 0.055 8.0 A 3.0 0.183 8.1 A 10.0 0.248 8.3 A 15.0
West: Stirling Highway
L 0.365 5.6 A 100.7 0.383 5.6 A 98.9 0.407 5.6 A 109.0
T 0.365 0.1 A 115.2 0.383 0.1 A 129.1 0.407 0.1 A 109.0
All vehicles 0.365 0.3 NA 115.2 0.652 0.7 NA 129.1 0.407 1.1 NA 109.0
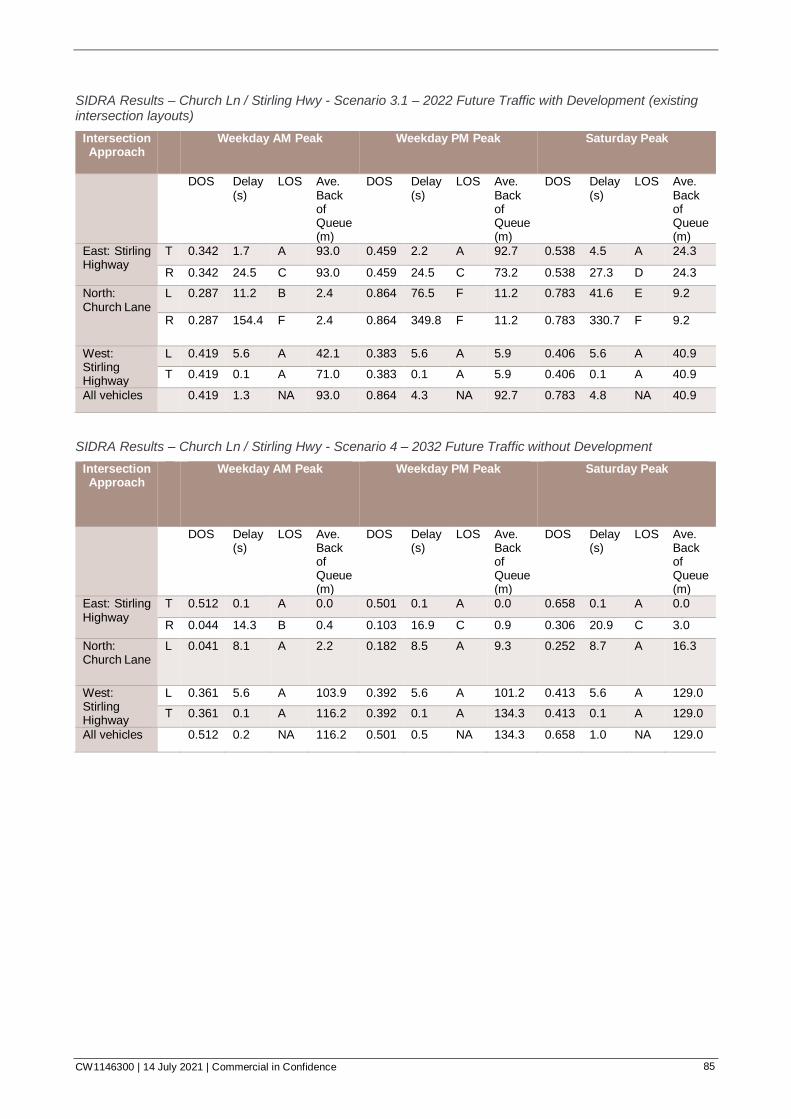
CW1146300 | 14 July 2021 | Commercial in Confidence 85
SIDRA Results – Church Ln / Stirling Hwy - Scenario 3.1 – 2022 Future Traffic with Development (existing intersection layouts)
Intersection Approach
Weekday AM Peak Weekday PM Peak Saturday Peak
DOS Delay (s)
LOS Ave. Back of Queue (m)
DOS Delay (s)
LOS Ave. Back of Queue (m)
DOS Delay (s)
LOS Ave. Back of Queue (m)
East: Stirling Highway
T 0.342 1.7 A 93.0 0.459 2.2 A 92.7 0.538 4.5 A 24.3
R 0.342 24.5 C 93.0 0.459 24.5 C 73.2 0.538 27.3 D 24.3
North: Church Lane
L 0.287 11.2 B 2.4 0.864 76.5 F 11.2 0.783 41.6 E 9.2
R 0.287 154.4 F 2.4 0.864 349.8 F 11.2 0.783 330.7 F 9.2
West: Stirling Highway
L 0.419 5.6 A 42.1 0.383 5.6 A 5.9 0.406 5.6 A 40.9
T 0.419 0.1 A 71.0 0.383 0.1 A 5.9 0.406 0.1 A 40.9
All vehicles
0.419 1.3 NA 93.0 0.864 4.3 NA 92.7 0.783 4.8 NA 40.9
SIDRA Results – Church Ln / Stirling Hwy - Scenario 4 – 2032 Future Traffic without Development
Intersection Approach
Weekday AM Peak Weekday PM Peak Saturday Peak
DOS Delay (s)
LOS Ave. Back of Queue (m)
DOS Delay (s)
LOS Ave. Back of Queue (m)
DOS Delay (s)
LOS Ave. Back of Queue (m)
East: Stirling Highway
T 0.512 0.1 A 0.0 0.501 0.1 A 0.0 0.658 0.1 A 0.0
R 0.044 14.3 B 0.4 0.103 16.9 C 0.9 0.306 20.9 C 3.0
North: Church Lane
L 0.041 8.1 A 2.2 0.182 8.5 A 9.3 0.252 8.7 A 16.3
West: Stirling Highway
L 0.361 5.6 A 103.9 0.392 5.6 A 101.2 0.413 5.6 A 129.0
T 0.361 0.1 A 116.2 0.392 0.1 A 134.3 0.413 0.1 A 129.0
All vehicles 0.512 0.2 NA 116.2 0.501 0.5 NA 134.3 0.658 1.0 NA 129.0

CW1146300 | 14 July 2021 | Commercial in Confidence 86
SIDRA Results – Church Ln / Stirling Hwy - Scenario 5 – 2032 Future Traffic with Development
Intersection Approach
Weekday AM Peak Weekday PM Peak Saturday Peak
DOS Delay (s)
LOS Ave. Back of Queue (m)
DOS Delay (s)
LOS Ave. Back of Queue (m)
DOS Delay (s)
LOS Ave. Back of Queue (m)
East: Stirling Highway
T 0.493 0.1 A 0.0 0.485 0.1 A 0.0 0.646 0.1 A 0.0
R 0.075 14.6 B 0.7 0.136 17.0 C 1.2 0.372 22.1 C 3.8
North: Church Lane
L 0.063 8.0 A 3.4 0.205 8.3 A 10.7 0.286 8.8 A 1.9
West: Stirling Highway
L 0.364 5.6 A 100.8 0.391 5.6 A 97.7 0.416 5.6 A 0.0
T 0.364 0.1 A 115.7 0.391 0.1 A 133.0 0.416 0.1 A 99.5
All vehicles 0.493 0.3 NA 115.7 0.485 0.6 NA 133.0 0.646 1.2 NA 99.5
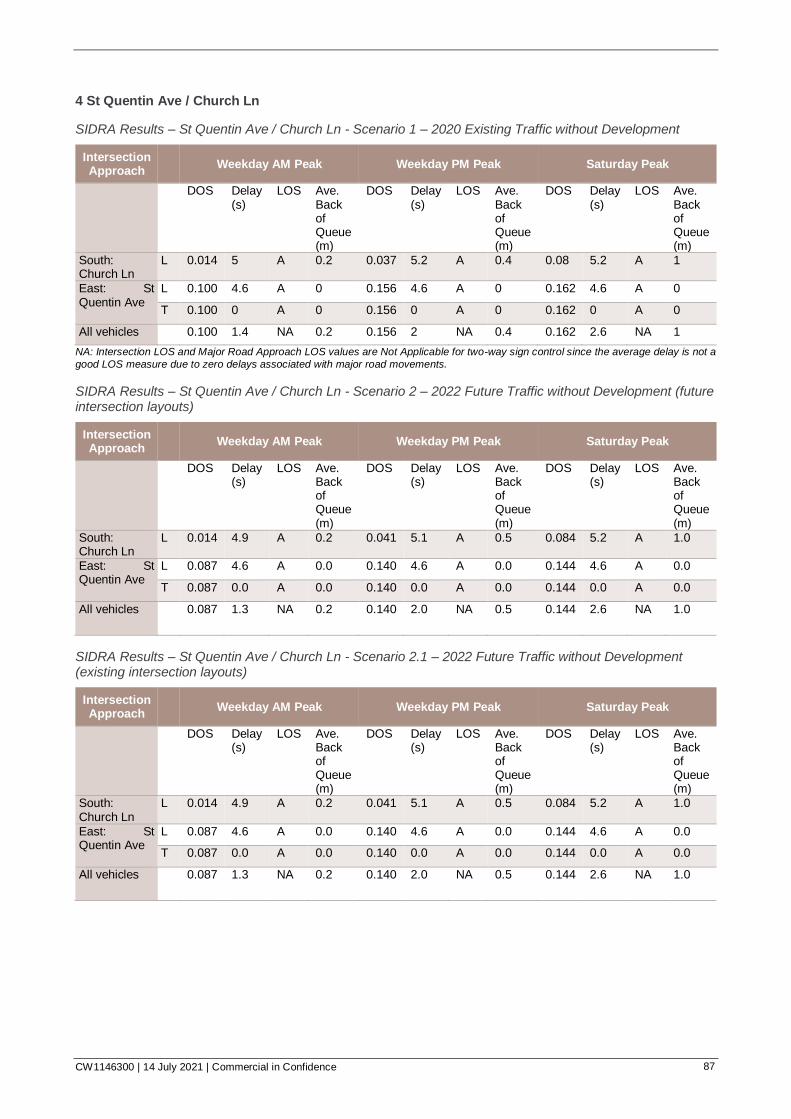
CW1146300 | 14 July 2021 | Commercial in Confidence 87
4 St Quentin Ave / Church Ln
SIDRA Results – St Quentin Ave / Church Ln - Scenario 1 – 2020 Existing Traffic without Development
Intersection Approach
Weekday AM Peak Weekday PM Peak Saturday Peak
DOS Delay
(s) LOS Ave.
Back of Queue (m)
DOS Delay (s)
LOS Ave. Back of Queue (m)
DOS Delay (s)
LOS Ave. Back of Queue (m)
South: Church Ln
L 0.014 5 A 0.2 0.037 5.2 A 0.4 0.08 5.2 A 1
East: St Quentin Ave
L 0.100 4.6 A 0 0.156 4.6 A 0 0.162 4.6 A 0
T 0.100 0 A 0 0.156 0 A 0 0.162 0 A 0
All vehicles
0.100 1.4 NA 0.2 0.156 2 NA 0.4 0.162 2.6 NA 1
NA: Intersection LOS and Major Road Approach LOS values are Not Applicable for two-way sign control since the average delay is not a
good LOS measure due to zero delays associated with major road movements.
SIDRA Results – St Quentin Ave / Church Ln - Scenario 2 – 2022 Future Traffic without Development (future intersection layouts)
Intersection Approach
Weekday AM Peak Weekday PM Peak Saturday Peak
DOS Delay
(s) LOS Ave.
Back of Queue (m)
DOS Delay (s)
LOS Ave. Back of Queue (m)
DOS Delay (s)
LOS Ave. Back of Queue (m)
South: Church Ln
L 0.014 4.9 A 0.2 0.041 5.1 A 0.5 0.084 5.2 A 1.0
East: St Quentin Ave
L 0.087 4.6 A 0.0 0.140 4.6 A 0.0 0.144 4.6 A 0.0
T 0.087 0.0 A 0.0 0.140 0.0 A 0.0 0.144 0.0 A 0.0
All vehicles
0.087 1.3 NA 0.2 0.140 2.0 NA 0.5 0.144 2.6 NA 1.0
SIDRA Results – St Quentin Ave / Church Ln - Scenario 2.1 – 2022 Future Traffic without Development (existing intersection layouts)
Intersection Approach
Weekday AM Peak Weekday PM Peak Saturday Peak
DOS Delay
(s) LOS Ave.
Back of Queue (m)
DOS Delay (s)
LOS Ave. Back of Queue (m)
DOS Delay (s)
LOS Ave. Back of Queue (m)
South: Church Ln
L 0.014 4.9 A 0.2 0.041 5.1 A 0.5 0.084 5.2 A 1.0
East: St Quentin Ave
L 0.087 4.6 A 0.0 0.140 4.6 A 0.0 0.144 4.6 A 0.0
T 0.087 0.0 A 0.0 0.140 0.0 A 0.0 0.144 0.0 A 0.0
All vehicles
0.087 1.3 NA 0.2 0.140 2.0 NA 0.5 0.144 2.6 NA 1.0
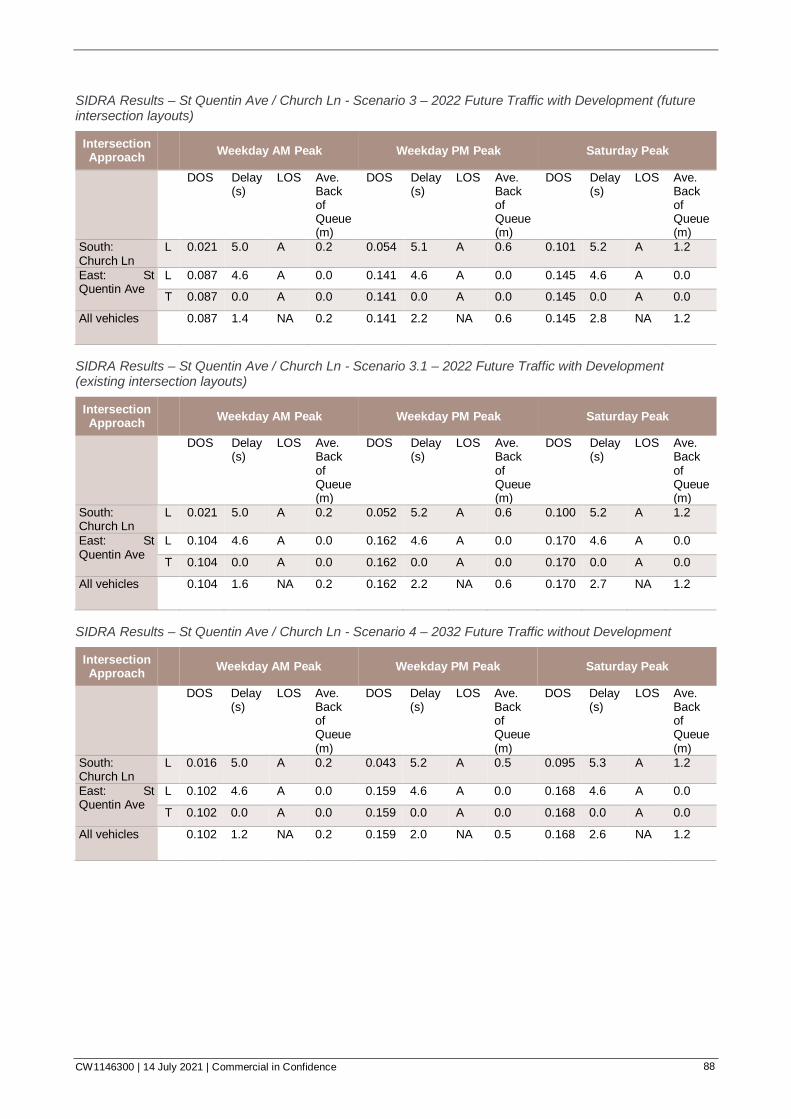
CW1146300 | 14 July 2021 | Commercial in Confidence 88
SIDRA Results – St Quentin Ave / Church Ln - Scenario 3 – 2022 Future Traffic with Development (future intersection layouts)
Intersection Approach
Weekday AM Peak Weekday PM Peak Saturday Peak
DOS Delay
(s) LOS Ave.
Back of Queue (m)
DOS Delay (s)
LOS Ave. Back of Queue (m)
DOS Delay (s)
LOS Ave. Back of Queue (m)
South: Church Ln
L 0.021 5.0 A 0.2 0.054 5.1 A 0.6 0.101 5.2 A 1.2
East: St Quentin Ave
L 0.087 4.6 A 0.0 0.141 4.6 A 0.0 0.145 4.6 A 0.0
T 0.087 0.0 A 0.0 0.141 0.0 A 0.0 0.145 0.0 A 0.0
All vehicles
0.087 1.4 NA 0.2 0.141 2.2 NA 0.6 0.145 2.8 NA 1.2
SIDRA Results – St Quentin Ave / Church Ln - Scenario 3.1 – 2022 Future Traffic with Development (existing intersection layouts)
Intersection Approach
Weekday AM Peak Weekday PM Peak Saturday Peak
DOS Delay
(s) LOS Ave.
Back of Queue (m)
DOS Delay (s)
LOS Ave. Back of Queue (m)
DOS Delay (s)
LOS Ave. Back of Queue (m)
South: Church Ln
L 0.021 5.0 A 0.2 0.052 5.2 A 0.6 0.100 5.2 A 1.2
East: St Quentin Ave
L 0.104 4.6 A 0.0 0.162 4.6 A 0.0 0.170 4.6 A 0.0
T 0.104 0.0 A 0.0 0.162 0.0 A 0.0 0.170 0.0 A 0.0
All vehicles
0.104 1.6 NA 0.2 0.162 2.2 NA 0.6 0.170 2.7 NA 1.2
SIDRA Results – St Quentin Ave / Church Ln - Scenario 4 – 2032 Future Traffic without Development
Intersection Approach
Weekday AM Peak Weekday PM Peak Saturday Peak
DOS Delay
(s) LOS Ave.
Back of Queue (m)
DOS Delay (s)
LOS Ave. Back of Queue (m)
DOS Delay (s)
LOS Ave. Back of Queue (m)
South: Church Ln
L 0.016 5.0 A 0.2 0.043 5.2 A 0.5 0.095 5.3 A 1.2
East: St Quentin Ave
L 0.102 4.6 A 0.0 0.159 4.6 A 0.0 0.168 4.6 A 0.0
T 0.102 0.0 A 0.0 0.159 0.0 A 0.0 0.168 0.0 A 0.0
All vehicles
0.102 1.2 NA 0.2 0.159 2.0 NA 0.5 0.168 2.6 NA 1.2

CW1146300 | 14 July 2021 | Commercial in Confidence 89
SIDRA Results – St Quentin Ave / Church Ln - Scenario 5 – 2032 Future Traffic with Development
Intersection Approach
Weekday AM Peak Weekday PM Peak Saturday Peak
DOS Delay
(s) LOS Ave.
Back of Queue (m)
DOS Delay (s)
LOS Ave. Back of Queue (m)
DOS Delay (s)
LOS Ave. Back of Queue (m)
South: Church Ln
L 0.021 5.0 A 0.2 0.054 5.2 A 0.6 0.110 5.3 A 1.3
East: St Quentin Ave
L 0.103 4.6 A 0.0 0.159 4.6 A 0.0 0.169 4.6 A 0.0
T 0.103 0.0 A 0.0 0.159 0.0 A 0.0 0.169 0.0 A 0.0
All vehicles
0.103 1.4 NA 0.2 0.159 2.1 NA 0.6 0.169 2.7 NA 1.3
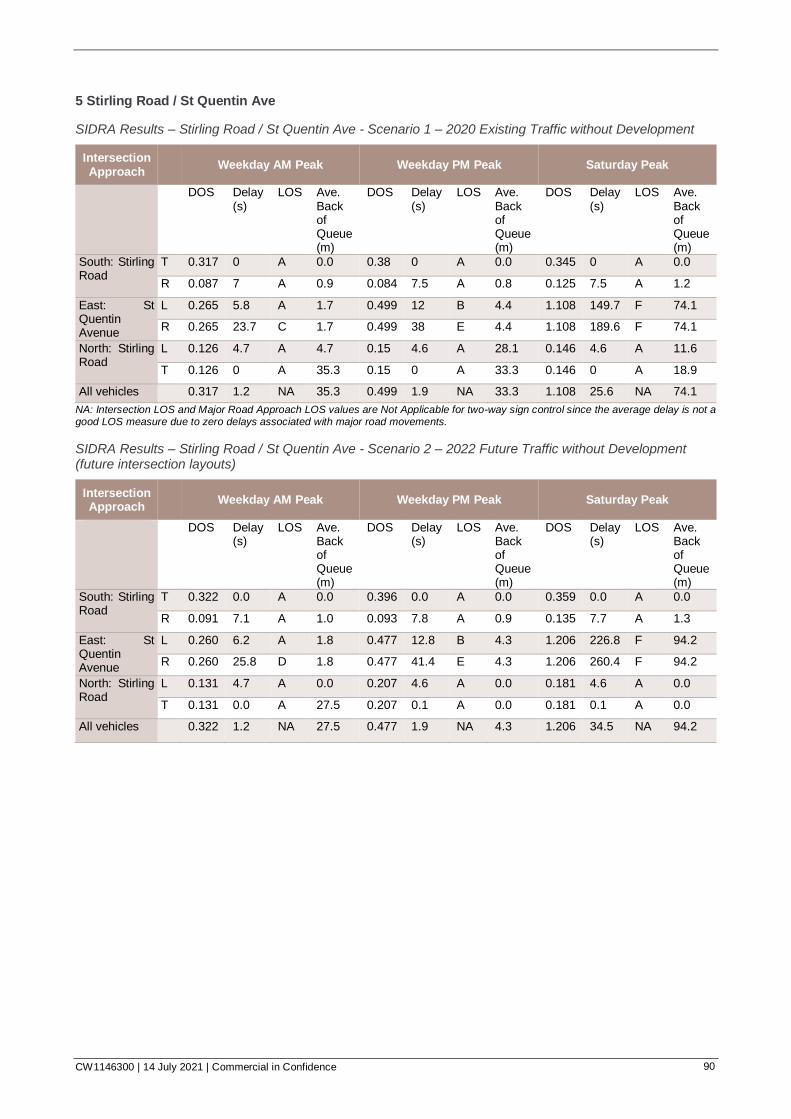
CW1146300 | 14 July 2021 | Commercial in Confidence 90
5 Stirling Road / St Quentin Ave
SIDRA Results – Stirling Road / St Quentin Ave - Scenario 1 – 2020 Existing Traffic without Development
Intersection Approach
Weekday AM Peak Weekday PM Peak Saturday Peak
DOS Delay (s)
LOS Ave. Back of Queue (m)
DOS Delay (s)
LOS Ave. Back of Queue (m)
DOS Delay (s)
LOS Ave. Back of Queue (m)
South: Stirling Road
T 0.317 0 A 0.0 0.38 0 A 0.0 0.345 0 A 0.0
R 0.087 7 A 0.9 0.084 7.5 A 0.8 0.125 7.5 A 1.2
East: St Quentin Avenue
L 0.265 5.8 A 1.7 0.499 12 B 4.4 1.108 149.7 F 74.1
R 0.265 23.7 C 1.7 0.499 38 E 4.4 1.108 189.6 F 74.1
North: Stirling Road
L 0.126 4.7 A 4.7 0.15 4.6 A 28.1 0.146 4.6 A 11.6
T 0.126 0 A 35.3 0.15 0 A 33.3 0.146 0 A 18.9
All vehicles
0.317 1.2 NA 35.3 0.499 1.9 NA 33.3 1.108 25.6 NA 74.1
NA: Intersection LOS and Major Road Approach LOS values are Not Applicable for two-way sign control since the average delay is not a good LOS measure due to zero delays associated with major road movements.
SIDRA Results – Stirling Road / St Quentin Ave - Scenario 2 – 2022 Future Traffic without Development (future intersection layouts)
Intersection Approach
Weekday AM Peak Weekday PM Peak Saturday Peak
DOS Delay (s)
LOS Ave. Back of Queue (m)
DOS Delay (s)
LOS Ave. Back of Queue (m)
DOS Delay (s)
LOS Ave. Back of Queue (m)
South: Stirling Road
T 0.322 0.0 A 0.0 0.396 0.0 A 0.0 0.359 0.0 A 0.0
R 0.091 7.1 A 1.0 0.093 7.8 A 0.9 0.135 7.7 A 1.3
East: St Quentin Avenue
L 0.260 6.2 A 1.8 0.477 12.8 B 4.3 1.206 226.8 F 94.2
R 0.260 25.8 D 1.8 0.477 41.4 E 4.3 1.206 260.4 F 94.2
North: Stirling Road
L 0.131 4.7 A 0.0 0.207 4.6 A 0.0 0.181 4.6 A 0.0
T 0.131 0.0 A 27.5 0.207 0.1 A 0.0 0.181 0.1 A 0.0
All vehicles
0.322 1.2 NA 27.5 0.477 1.9 NA 4.3 1.206 34.5 NA 94.2
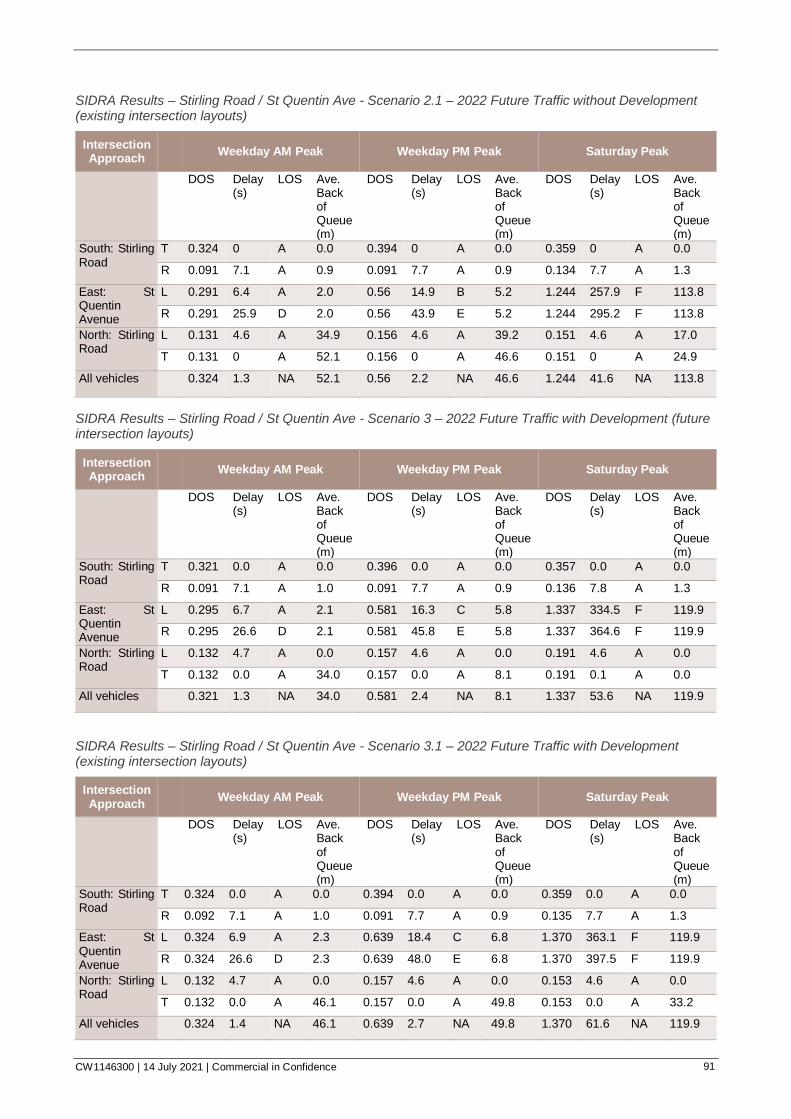
CW1146300 | 14 July 2021 | Commercial in Confidence 91
SIDRA Results – Stirling Road / St Quentin Ave - Scenario 2.1 – 2022 Future Traffic without Development (existing intersection layouts)
Intersection Approach
Weekday AM Peak Weekday PM Peak Saturday Peak
DOS Delay (s)
LOS Ave. Back of Queue (m)
DOS Delay (s)
LOS Ave. Back of Queue (m)
DOS Delay (s)
LOS Ave. Back of Queue (m)
South: Stirling Road
T 0.324 0 A 0.0 0.394 0 A 0.0 0.359 0 A 0.0
R 0.091 7.1 A 0.9 0.091 7.7 A 0.9 0.134 7.7 A 1.3
East: St Quentin Avenue
L 0.291 6.4 A 2.0 0.56 14.9 B 5.2 1.244 257.9 F 113.8
R 0.291 25.9 D 2.0 0.56 43.9 E 5.2 1.244 295.2 F 113.8
North: Stirling Road
L 0.131 4.6 A 34.9 0.156 4.6 A 39.2 0.151 4.6 A 17.0
T 0.131 0 A 52.1 0.156 0 A 46.6 0.151 0 A 24.9
All vehicles
0.324 1.3 NA 52.1 0.56 2.2 NA 46.6 1.244 41.6 NA 113.8
SIDRA Results – Stirling Road / St Quentin Ave - Scenario 3 – 2022 Future Traffic with Development (future intersection layouts)
Intersection Approach
Weekday AM Peak Weekday PM Peak Saturday Peak
DOS Delay (s)
LOS Ave. Back of Queue (m)
DOS Delay (s)
LOS Ave. Back of Queue (m)
DOS Delay (s)
LOS Ave. Back of Queue (m)
South: Stirling Road
T 0.321 0.0 A 0.0 0.396 0.0 A 0.0 0.357 0.0 A 0.0
R 0.091 7.1 A 1.0 0.091 7.7 A 0.9 0.136 7.8 A 1.3
East: St Quentin Avenue
L 0.295 6.7 A 2.1 0.581 16.3 C 5.8 1.337 334.5 F 119.9
R 0.295 26.6 D 2.1 0.581 45.8 E 5.8 1.337 364.6 F 119.9
North: Stirling Road
L 0.132 4.7 A 0.0 0.157 4.6 A 0.0 0.191 4.6 A 0.0
T 0.132 0.0 A 34.0 0.157 0.0 A 8.1 0.191 0.1 A 0.0
All vehicles
0.321 1.3 NA 34.0 0.581 2.4 NA 8.1 1.337 53.6 NA 119.9
SIDRA Results – Stirling Road / St Quentin Ave - Scenario 3.1 – 2022 Future Traffic with Development (existing intersection layouts)
Intersection Approach
Weekday AM Peak Weekday PM Peak Saturday Peak
DOS Delay (s)
LOS Ave. Back of Queue (m)
DOS Delay (s)
LOS Ave. Back of Queue (m)
DOS Delay (s)
LOS Ave. Back of Queue (m)
South: Stirling Road
T 0.324 0.0 A 0.0 0.394 0.0 A 0.0 0.359 0.0 A 0.0
R 0.092 7.1 A 1.0 0.091 7.7 A 0.9 0.135 7.7 A 1.3
East: St Quentin Avenue
L 0.324 6.9 A 2.3 0.639 18.4 C 6.8 1.370 363.1 F 119.9
R 0.324 26.6 D 2.3 0.639 48.0 E 6.8 1.370 397.5 F 119.9
North: Stirling Road
L 0.132 4.7 A 0.0 0.157 4.6 A 0.0 0.153 4.6 A 0.0
T 0.132 0.0 A 46.1 0.157 0.0 A 49.8 0.153 0.0 A 33.2
All vehicles
0.324 1.4 NA 46.1 0.639 2.7 NA 49.8 1.370 61.6 NA 119.9
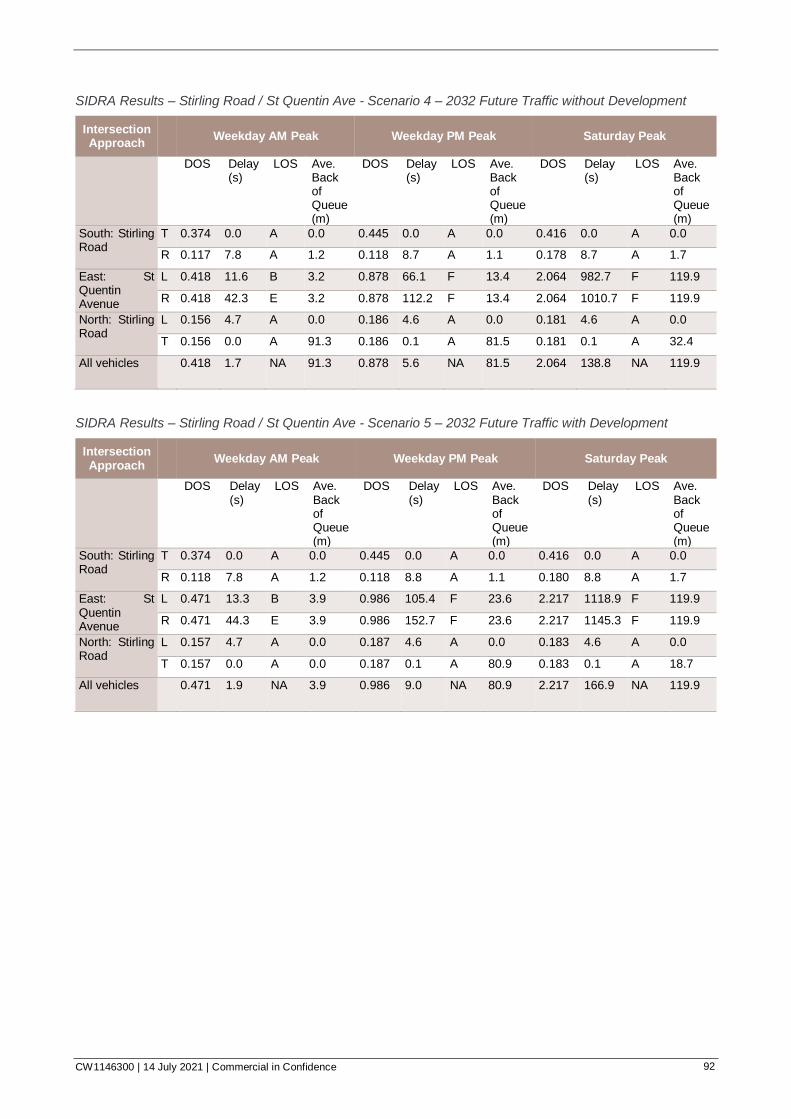
CW1146300 | 14 July 2021 | Commercial in Confidence 92
SIDRA Results – Stirling Road / St Quentin Ave - Scenario 4 – 2032 Future Traffic without Development
Intersection Approach
Weekday AM Peak Weekday PM Peak Saturday Peak
DOS Delay (s)
LOS Ave. Back of Queue (m)
DOS Delay (s)
LOS Ave. Back of Queue (m)
DOS Delay (s)
LOS Ave. Back of Queue (m)
South: Stirling Road
T 0.374 0.0 A 0.0 0.445 0.0 A 0.0 0.416 0.0 A 0.0
R 0.117 7.8 A 1.2 0.118 8.7 A 1.1 0.178 8.7 A 1.7
East: St Quentin Avenue
L 0.418 11.6 B 3.2 0.878 66.1 F 13.4 2.064 982.7 F 119.9
R 0.418 42.3 E 3.2 0.878 112.2 F 13.4 2.064 1010.7 F 119.9
North: Stirling Road
L 0.156 4.7 A 0.0 0.186 4.6 A 0.0 0.181 4.6 A 0.0
T 0.156 0.0 A 91.3 0.186 0.1 A 81.5 0.181 0.1 A 32.4
All vehicles
0.418 1.7 NA 91.3 0.878 5.6 NA 81.5 2.064 138.8 NA 119.9
SIDRA Results – Stirling Road / St Quentin Ave - Scenario 5 – 2032 Future Traffic with Development
Intersection Approach
Weekday AM Peak Weekday PM Peak Saturday Peak
DOS Delay (s)
LOS Ave. Back of Queue (m)
DOS Delay (s)
LOS Ave. Back of Queue (m)
DOS Delay (s)
LOS Ave. Back of Queue (m)
South: Stirling Road
T 0.374 0.0 A 0.0 0.445 0.0 A 0.0 0.416 0.0 A 0.0
R 0.118 7.8 A 1.2 0.118 8.8 A 1.1 0.180 8.8 A 1.7
East: St Quentin Avenue
L 0.471 13.3 B 3.9 0.986 105.4 F 23.6 2.217 1118.9 F 119.9
R 0.471 44.3 E 3.9 0.986 152.7 F 23.6 2.217 1145.3 F 119.9
North: Stirling Road
L 0.157 4.7 A 0.0 0.187 4.6 A 0.0 0.183 4.6 A 0.0
T 0.157 0.0 A 0.0 0.187 0.1 A 80.9 0.183 0.1 A 18.7
All vehicles
0.471 1.9 NA 3.9 0.986 9.0 NA 80.9 2.217 166.9 NA 119.9
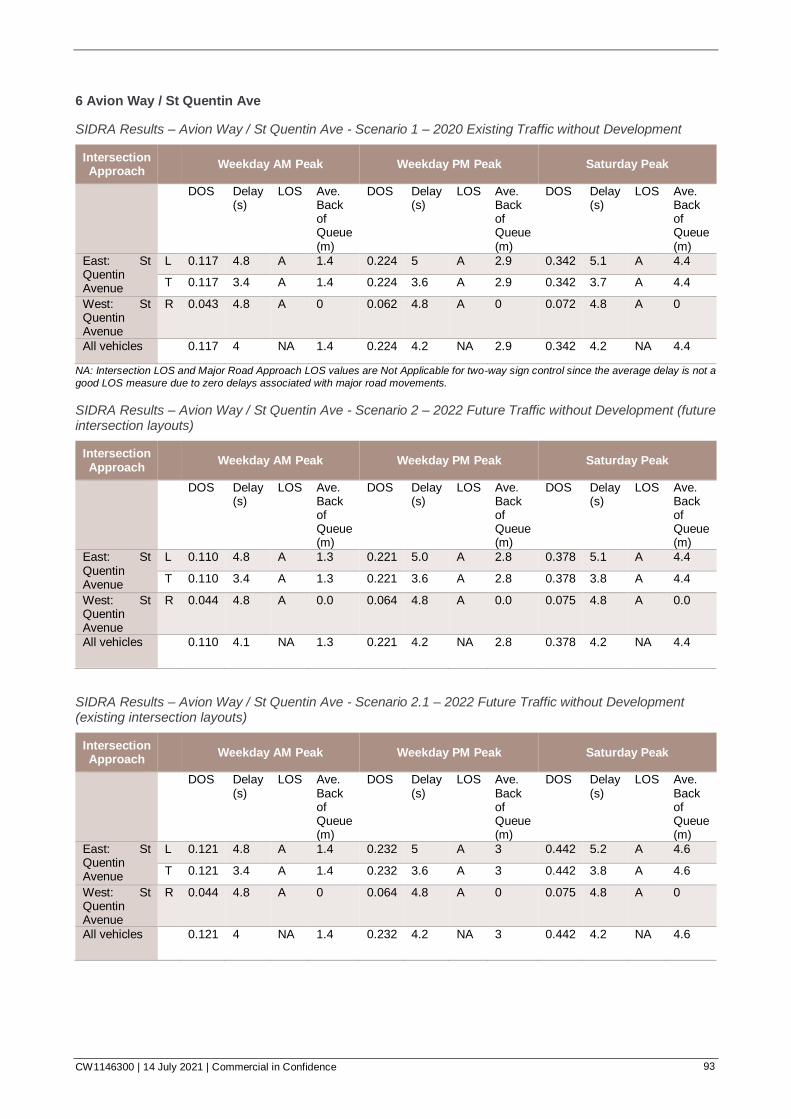
CW1146300 | 14 July 2021 | Commercial in Confidence 93
6 Avion Way / St Quentin Ave
SIDRA Results – Avion Way / St Quentin Ave - Scenario 1 – 2020 Existing Traffic without Development
Intersection Approach
Weekday AM Peak Weekday PM Peak Saturday Peak
DOS Delay (s)
LOS Ave. Back of Queue (m)
DOS Delay (s)
LOS Ave. Back of Queue (m)
DOS Delay (s)
LOS Ave. Back of Queue (m)
East: St Quentin Avenue
L 0.117 4.8 A 1.4 0.224 5 A 2.9 0.342 5.1 A 4.4
T 0.117 3.4 A 1.4 0.224 3.6 A 2.9 0.342 3.7 A 4.4
West: St Quentin Avenue
R 0.043 4.8 A 0 0.062 4.8 A 0 0.072 4.8 A 0
All vehicles 0.117 4 NA 1.4 0.224 4.2 NA 2.9 0.342 4.2 NA 4.4
NA: Intersection LOS and Major Road Approach LOS values are Not Applicable for two-way sign control since the average delay is not a
good LOS measure due to zero delays associated with major road movements.
SIDRA Results – Avion Way / St Quentin Ave - Scenario 2 – 2022 Future Traffic without Development (future intersection layouts)
Intersection Approach
Weekday AM Peak Weekday PM Peak Saturday Peak
DOS Delay (s)
LOS Ave. Back of Queue (m)
DOS Delay (s)
LOS Ave. Back of Queue (m)
DOS Delay (s)
LOS Ave. Back of Queue (m)
East: St Quentin Avenue
L 0.110 4.8 A 1.3 0.221 5.0 A 2.8 0.378 5.1 A 4.4
T 0.110 3.4 A 1.3 0.221 3.6 A 2.8 0.378 3.8 A 4.4
West: St Quentin Avenue
R 0.044 4.8 A 0.0 0.064 4.8 A 0.0 0.075 4.8 A 0.0
All vehicles 0.110 4.1 NA 1.3 0.221 4.2 NA 2.8 0.378 4.2 NA 4.4
SIDRA Results – Avion Way / St Quentin Ave - Scenario 2.1 – 2022 Future Traffic without Development (existing intersection layouts)
Intersection Approach
Weekday AM Peak Weekday PM Peak Saturday Peak
DOS Delay (s)
LOS Ave. Back of Queue (m)
DOS Delay (s)
LOS Ave. Back of Queue (m)
DOS Delay (s)
LOS Ave. Back of Queue (m)
East: St Quentin Avenue
L 0.121 4.8 A 1.4 0.232 5 A 3 0.442 5.2 A 4.6
T 0.121 3.4 A 1.4 0.232 3.6 A 3 0.442 3.8 A 4.6
West: St Quentin Avenue
R 0.044 4.8 A 0 0.064 4.8 A 0 0.075 4.8 A 0
All vehicles 0.121 4 NA 1.4 0.232 4.2 NA 3 0.442 4.2 NA 4.6
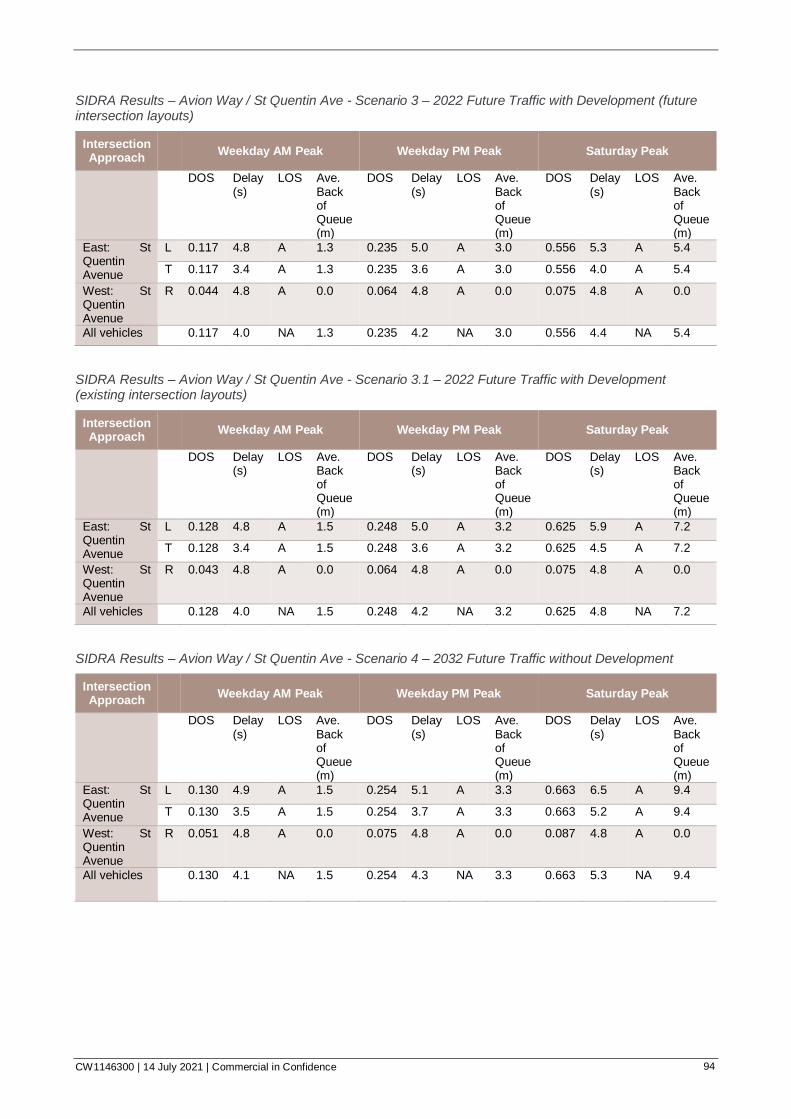
CW1146300 | 14 July 2021 | Commercial in Confidence 94
SIDRA Results – Avion Way / St Quentin Ave - Scenario 3 – 2022 Future Traffic with Development (future intersection layouts)
Intersection Approach
Weekday AM Peak Weekday PM Peak Saturday Peak
DOS Delay (s)
LOS Ave. Back of Queue (m)
DOS Delay (s)
LOS Ave. Back of Queue (m)
DOS Delay (s)
LOS Ave. Back of Queue (m)
East: St Quentin Avenue
L 0.117 4.8 A 1.3 0.235 5.0 A 3.0 0.556 5.3 A 5.4
T 0.117 3.4 A 1.3 0.235 3.6 A 3.0 0.556 4.0 A 5.4
West: St Quentin Avenue
R 0.044 4.8 A 0.0 0.064 4.8 A 0.0 0.075 4.8 A 0.0
All vehicles 0.117 4.0 NA 1.3 0.235 4.2 NA 3.0 0.556 4.4 NA 5.4
SIDRA Results – Avion Way / St Quentin Ave - Scenario 3.1 – 2022 Future Traffic with Development (existing intersection layouts)
Intersection Approach
Weekday AM Peak Weekday PM Peak Saturday Peak
DOS Delay (s)
LOS Ave. Back of Queue (m)
DOS Delay (s)
LOS Ave. Back of Queue (m)
DOS Delay (s)
LOS Ave. Back of Queue (m)
East: St Quentin Avenue
L 0.128 4.8 A 1.5 0.248 5.0 A 3.2 0.625 5.9 A 7.2
T 0.128 3.4 A 1.5 0.248 3.6 A 3.2 0.625 4.5 A 7.2
West: St Quentin Avenue
R 0.043 4.8 A 0.0 0.064 4.8 A 0.0 0.075 4.8 A 0.0
All vehicles 0.128 4.0 NA 1.5 0.248 4.2 NA 3.2 0.625 4.8 NA 7.2
SIDRA Results – Avion Way / St Quentin Ave - Scenario 4 – 2032 Future Traffic without Development
Intersection Approach
Weekday AM Peak Weekday PM Peak Saturday Peak
DOS Delay (s)
LOS Ave. Back of Queue (m)
DOS Delay (s)
LOS Ave. Back of Queue (m)
DOS Delay (s)
LOS Ave. Back of Queue (m)
East: St Quentin Avenue
L 0.130 4.9 A 1.5 0.254 5.1 A 3.3 0.663 6.5 A 9.4
T 0.130 3.5 A 1.5 0.254 3.7 A 3.3 0.663 5.2 A 9.4
West: St Quentin Avenue
R 0.051 4.8 A 0.0 0.075 4.8 A 0.0 0.087 4.8 A 0.0
All vehicles 0.130 4.1 NA 1.5 0.254 4.3 NA 3.3 0.663 5.3 NA 9.4
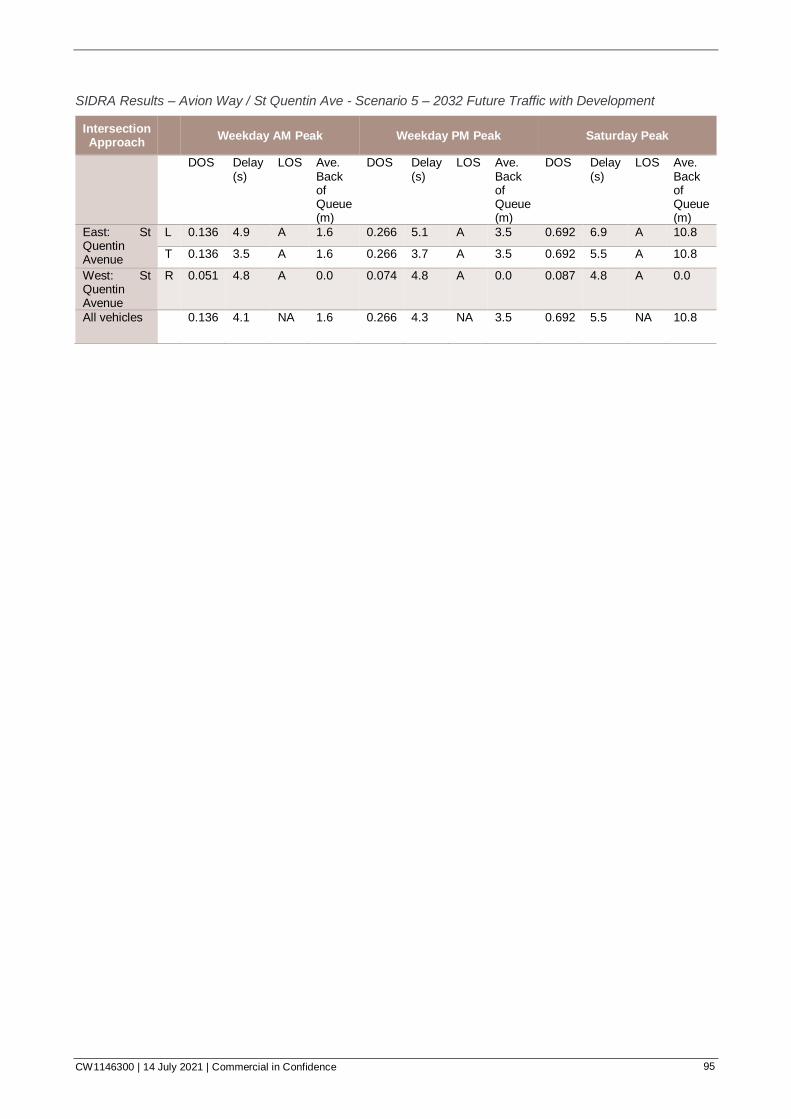
CW1146300 | 14 July 2021 | Commercial in Confidence 95
SIDRA Results – Avion Way / St Quentin Ave - Scenario 5 – 2032 Future Traffic with Development
Intersection Approach
Weekday AM Peak Weekday PM Peak Saturday Peak
DOS Delay (s)
LOS Ave. Back of Queue (m)
DOS Delay (s)
LOS Ave. Back of Queue (m)
DOS Delay (s)
LOS Ave. Back of Queue (m)
East: St Quentin Avenue
L 0.136 4.9 A 1.6 0.266 5.1 A 3.5 0.692 6.9 A 10.8
T 0.136 3.5 A 1.6 0.266 3.7 A 3.5 0.692 5.5 A 10.8
West: St Quentin Avenue
R 0.051 4.8 A 0.0 0.074 4.8 A 0.0 0.087 4.8 A 0.0
All vehicles 0.136 4.1 NA 1.6 0.266 4.3 NA 3.5 0.692 5.5 NA 10.8
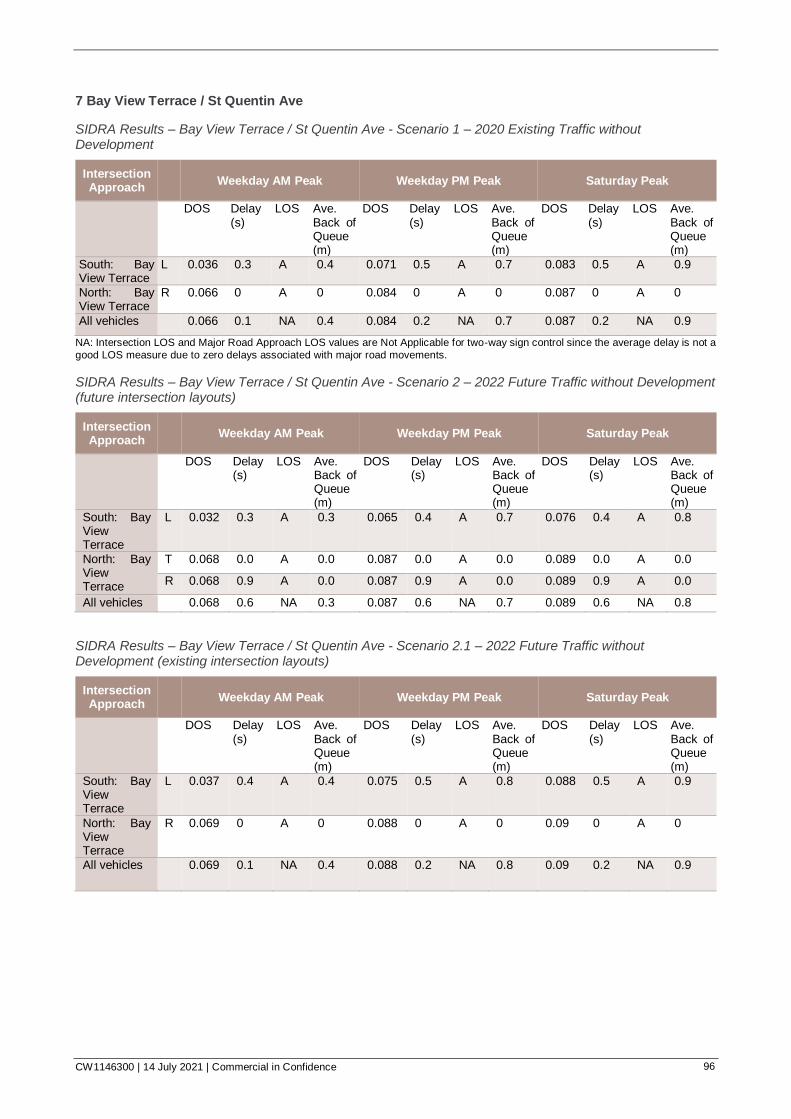
CW1146300 | 14 July 2021 | Commercial in Confidence 96
7 Bay View Terrace / St Quentin Ave
SIDRA Results – Bay View Terrace / St Quentin Ave - Scenario 1 – 2020 Existing Traffic without Development
Intersection Approach
Weekday AM Peak Weekday PM Peak Saturday Peak
DOS Delay (s)
LOS Ave. Back of Queue (m)
DOS Delay (s)
LOS Ave. Back of Queue (m)
DOS Delay (s)
LOS Ave. Back of Queue (m)
South: Bay View Terrace
L 0.036 0.3 A 0.4 0.071 0.5 A 0.7 0.083 0.5 A 0.9
North: Bay View Terrace
R 0.066 0 A 0 0.084 0 A 0 0.087 0 A 0
All vehicles 0.066 0.1 NA 0.4 0.084 0.2 NA 0.7 0.087 0.2 NA 0.9
NA: Intersection LOS and Major Road Approach LOS values are Not Applicable for two-way sign control since the average delay is not a
good LOS measure due to zero delays associated with major road movements.
SIDRA Results – Bay View Terrace / St Quentin Ave - Scenario 2 – 2022 Future Traffic without Development (future intersection layouts)
Intersection Approach
Weekday AM Peak Weekday PM Peak Saturday Peak
DOS Delay (s)
LOS Ave. Back of Queue (m)
DOS Delay (s)
LOS Ave. Back of Queue (m)
DOS Delay (s)
LOS Ave. Back of Queue (m)
South: Bay View Terrace
L 0.032 0.3 A 0.3 0.065 0.4 A 0.7 0.076 0.4 A 0.8
North: Bay View Terrace
T 0.068 0.0 A 0.0 0.087 0.0 A 0.0 0.089 0.0 A 0.0
R 0.068 0.9 A 0.0 0.087 0.9 A 0.0 0.089 0.9 A 0.0
All vehicles
0.068 0.6 NA 0.3 0.087 0.6 NA 0.7 0.089 0.6 NA 0.8
SIDRA Results – Bay View Terrace / St Quentin Ave - Scenario 2.1 – 2022 Future Traffic without Development (existing intersection layouts)
Intersection Approach
Weekday AM Peak Weekday PM Peak Saturday Peak
DOS Delay (s)
LOS Ave. Back of Queue (m)
DOS Delay (s)
LOS Ave. Back of Queue (m)
DOS Delay (s)
LOS Ave. Back of Queue (m)
South: Bay View Terrace
L 0.037 0.4 A 0.4 0.075 0.5 A 0.8 0.088 0.5 A 0.9
North: Bay View Terrace
R 0.069 0 A 0 0.088 0 A 0 0.09 0 A 0
All vehicles
0.069 0.1 NA 0.4 0.088 0.2 NA 0.8 0.09 0.2 NA 0.9

CW1146300 | 14 July 2021 | Commercial in Confidence 97
SIDRA Results – Bay View Terrace / St Quentin Ave - Scenario 3 – 2022 Future Traffic with Development (future intersection layouts)
Intersection Approach
Weekday AM Peak Weekday PM Peak Saturday Peak
DOS Delay (s)
LOS Ave. Back of Queue (m)
DOS Delay (s)
LOS Ave. Back of Queue (m)
DOS Delay (s)
LOS Ave. Back of Queue (m)
South: Bay View Terrace
L 0.032 0.3 A 0.3 0.065 0.4 A 0.7 0.076 0.4 A 0.8
North: Bay View Terrace
T 0.068 0.0 A 0.0 0.088 0.0 A 0.0 0.090 0.0 A 0.0
R 0.068 0.9 A 0.0 0.088 0.9 A 0.0 0.090 0.9 A 0.0
All vehicles
0.068 0.6 NA 0.3 0.088 0.6 NA 0.7 0.090 0.6 NA 0.8
SIDRA Results – Bay View Terrace / St Quentin Ave - Scenario 3.1 – 2022 Future Traffic with Development (existing intersection layouts)
Intersection Approach
Weekday AM Peak Weekday PM Peak Saturday Peak
DOS Delay (s)
LOS Ave. Back of Queue (m)
DOS Delay (s)
LOS Ave. Back of Queue (m)
DOS Delay (s)
LOS Ave. Back of Queue (m)
South: Bay View Terrace
L 0.039 0.5 A 0.4 0.075 0.5 A 0.8 0.088 0.5 A 0.9
North: Bay View Terrace
R 0.098 0.0 A 0.0 0.088 0.0 A 0.0 0.091 0.0 A 0.0
All vehicles
0.098 0.2 NA 0.4 0.088 0.2 NA 0.8 0.091 0.2 NA 0.9
SIDRA Results – Bay View Terrace / St Quentin Ave - Scenario 4 – 2032 Future Traffic without Development
Intersection Approach
Weekday AM Peak Weekday PM Peak Saturday Peak
DOS Delay (s)
LOS Ave. Back of Queue (m)
DOS Delay (s)
LOS Ave. Back of Queue (m)
DOS Delay (s)
LOS Ave. Back of Queue (m)
South: Bay View Terrace
L 0.037 0.3 A 0.4 0.069 0.5 A 0.7 0.088 0.5 A 0.9
North: Bay View Terrace
T 0.081 0.0 A 0.0 0.104 0.0 A 0.0 0.107 0.0 A 0.0
R 0.081 0.9 A 0.0 0.104 0.9 A 0.0 0.107 0.9 A 0.0
All vehicles
0.081 0.6 NA 0.4 0.104 0.6 NA 0.7 0.107 0.6 NA 0.9
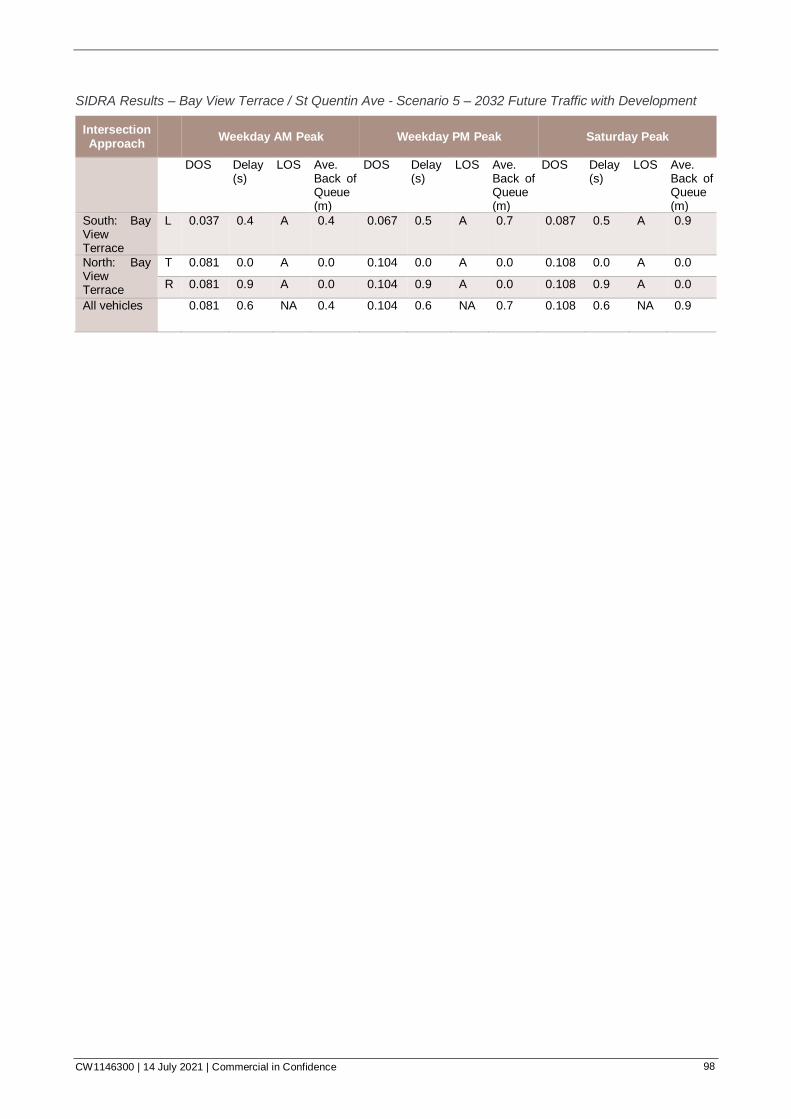
CW1146300 | 14 July 2021 | Commercial in Confidence 98
SIDRA Results – Bay View Terrace / St Quentin Ave - Scenario 5 – 2032 Future Traffic with Development
Intersection Approach
Weekday AM Peak Weekday PM Peak Saturday Peak
DOS Delay (s)
LOS Ave. Back of Queue (m)
DOS Delay (s)
LOS Ave. Back of Queue (m)
DOS Delay (s)
LOS Ave. Back of Queue (m)
South: Bay View Terrace
L 0.037 0.4 A 0.4 0.067 0.5 A 0.7 0.087 0.5 A 0.9
North: Bay View Terrace
T 0.081 0.0 A 0.0 0.104 0.0 A 0.0 0.108 0.0 A 0.0
R 0.081 0.9 A 0.0 0.104 0.9 A 0.0 0.108 0.9 A 0.0
All vehicles
0.081 0.6 NA 0.4 0.104 0.6 NA 0.7 0.108 0.6 NA 0.9