training and education needs assessment survey - … and education needs assessment survey ... d....
TRANSCRIPT

Training and Education Needs Assessment Survey
Final Report Prepared for: University of California, Davis Center for Nutrition in Schools California Department of Education Nutrition Services Division October 26, 2012 Anna Jones, PhD Candidate Center for Nutrition in Schools University of California, Davis Mandeep Punia, MS, RD Nutrition Services Division California Department of Education Shannan Young, RD, SNS Nutrition Services Division California Department of Education Carol Chase, MS, RD Nutrition Services Division California Department of Education Sheri Zidenberg-Cherr, PhD Center for Nutrition in Schools University of California, Davis

Table of Contents Executive Summary ............................................................................................ 1
Introduction ................................................................................................................. 1 Selected Results ......................................................................................................... 1 Conclusion ................................................................................................................... 4
Chapter 1 – Introduction ..................................................................................... 5 Background ................................................................................................................. 5 Methodology ................................................................................................................ 6 Questionnaire Development ...................................................................................... 7
Chapter 2 – Participant Characteristics ............................................................ 9 Respondent Characteristics ...................................................................................... 9 School, District, or Program Characteristics ......................................................... 10
Chapter 3 – Training Needs .............................................................................. 12 Overall Needs ............................................................................................................ 12 Director and Manager Perceptions of Staff Needs ................................................ 15
Chapter 4 – Training Preferences .................................................................... 19 Chapter 5 – Resources and Barriers ............................................................... 22
Resources .................................................................................................................. 22 Barriers ...................................................................................................................... 25
Chapter 6 – Professional Development ........................................................... 27 Chapter 7 – Discussion and Conclusions ....................................................... 29 Appendices ........................................................................................................ 31
A. Questionnaire ....................................................................................................... 31 B. Communications .................................................................................................. 50 C. Responses to each question ............................................................................... 56 D. Training and Education Needs Assessment (TENA) Committee Members .... 75 E. References ............................................................................................................ 77

TENA Survey Final Report: Executive Summary
1
Executive Summary Introduction California’s child nutrition programs serve millions of meals every day to children, and do so cost-effectively, while following a host of state and federal regulations. With the passage of the Healthy, Hunger-Free Kids Act of 2010 (HHFKA) and the release of the Final Rule on Nutrition Standards in the National School Lunch Program (NSLP) and School Breakfast Programs (SBP) in January 2012, there are significant changes to implement. In order to ensure successful implementation of the new requirements as well as ongoing initiatives, such as the Let’s Move! Campaign, the HealthierUS School Challenge, and the Team California for Healthy Kids campaign, the California Department of Education (CDE), Nutrition Services Division (NSD) plans to provide timely and quality training, technical assistance, and resources to the child nutrition program personnel in California. The CDE therefore convened the Training and Education Needs Assessment (TENA) Committee, a diverse stakeholder group, to assist the NSD in developing a five-year plan to address the priority needs of personnel in child nutrition programs that sponsor the NSLP. A survey was conducted to insure that CDE directs the limited funds available towards training, technical assistance, and resources that school food authorities (SFAs) say they need. The TENA Survey was conducted by the University of California, Davis, Center for Nutrition in Schools in partnership with the California Department of Education, Nutrition Services Division. This research evaluated the training, resource, and professional development needs of child nutrition program staff in school districts, charter schools, after school programs1 and residential child care institutions (RCCI) that participate in the NSLP. This web-based survey of directors, managers, nutrition specialists, supervisors, and child nutrition staff was conducted in November and early December, 2011. Those unable to complete the questionnaire on the Internet were able to request a paper copy of the questionnaire.
Selected Results
Survey Respondents
The survey was sent to 1,490 programs and a total of 994 respondents initiated the survey. Of these, 739 (74.3 percent) completed the web-based survey and 34 completed a paper copy of the questionnaire. The survey reached multiple levels of personnel, including chief business officials, child nutrition directors, and kitchen and cafeteria employees.
• The majority of respondents were female, between the ages of 50 and 59 years, and identified as white or Caucasian.
1 After school programs in this study refers only to those that participate in the NSLP. Those that participate in the Child and Adult Care Food Program will be surveyed in a future study.

TENA Survey Final Report: Executive Summary
2
• Most respondents had attended at least some college or held an associate’s or a bachelor’s degree.
• Forty-four percent were directors, 27 percent were managers or supervisors, and eight percent were staff.
• Most respondents were employed in schools, districts, or programs with students in elementary school and/or middle school.
• Almost half of directors worked in districts with fewer than 2,500 students.
Training Needs
The ten most needed training topics are reported in Table 1. Respondents perceived training needs in the following areas:
• Training in program management topics, such as managing employees, grant writing, and procurement.
• Almost all training topics linked to the HHFKA were highly needed, especially menu planning to meet the new requirements.
• Respondents were interested in receiving training related to nutrition, health, and wellness. This included training on more general areas, such as child nutrition, as well as preparing food for children with special dietary needs and training in school wellness policies.
• For those that are employed in RCCIs, training specific to RCCIs was highly needed.
Directors, managers, and supervisors were asked to provide information about perceived training needs of their staff. The ten most needed training topics for staff are reported in Table 2. Many of the training topics that staff need overlap with that of the overall training needs. However, there were a few needs unique to staff:
• Planning, preparing, and serving meals is needed, including planning for just-in-time food preparation, culinary skills, and controlling portion sizes.
• Development of skills related to communication and marketing, particularly communication with teachers, administrators, and parent organizations.
Table 1: Ten most needed training topics and percent of respondents that chose “Really needed” or “Somewhat needed”
Training Topics Really +
Somewhat Needed
(%) Disaster plan development and implementation 69.8 Type 2 diabetes 64.9 Grant writing 62.9 HHFKA Menu planning to meet the new meal requirements 62.0
Food allergies or intolerances in children 61.6 Special dietary needs 60.9 Staff productivity analysis 60.5 Writing specifications for fruits and vegetables 58.9 HHFKA Cost-effective menus that meet new requirements 58.5
Team building 58.0

TENA Survey Final Report: Executive Summary
3
Training Preferences
The results of the survey revealed the following about training preferences among respondents:
• In-person classes or workshops are most popular, and the majority of respondents would also be willing to participate in internet-based training.
• Most respondents would be willing to travel between 30 and 60 miles to attend training.
• Respondents prefer weekday training, as opposed to weekend.
• In-person trainings are preferred to be 1 to 3 hours long or all day, while internet-based training would ideally be between 30 minutes and an hour in length.
• There was no clear preference for school year vs. summer training.
Barriers to Training
In order to determine how to improve access to training, respondents were asked about perceived barriers to training:
• Expense was the most commonly cited barrier to obtaining training, followed by travel distance and lack of relief staff.
• Most respondents did not indicate that training location type discourages them from attending training.
Resources
The ten most helpful resources are reported in Table 3. All suggested resources were very popular with respondents. Some highlights are:
• Informational and reference resources were among the most helpful to respondents, particularly an online directory of available training opportunities and a child nutrition director quick guide to frequently asked questions.
• Standardized recipes aligned to the new meal pattern, cafeteria promotional materials, and printed training materials were among the program management resources respondents would find helpful.
• The interest in training in school wellness and nutrition is mirrored by interest in nutrition education resources. Funding to purchase food for experiential learning was the most helpful to respondents.
Table 2: Director and manager perceptions of the ten most needed training topics for staff and percent of respondents that chose “Really needed” or “Somewhat needed”
Training Topics Really +
Somewhat Needed
(%) Current nutrition issues 76.8 Special dietary needs 76.0 Type 2 diabetes 75.6 Food allergies or intolerances in children 74.8 Child nutrition 72.6 Childhood obesity 72.2 Vegetarianism 71.6 Basic nutrition principles 71.1 Culinary skills 68.6 Preparing food for students with special dietary needs 68.1

TENA Survey Final Report: Executive Summary
4
Program Barriers
The questionnaire also included items about barriers to successful implementation of child nutrition programs:
• Lack of funding was a barrier for more than half; the most common consequence of which was reduction in staff.
• Lack of equipment was a barrier to scratch cooking for many respondents.
• The most common barriers to meal participation were student preferences and a poor image of school meals by students.
Professional Development
The majority of respondents were somewhat or very interested in moving up the career ladder. Tuition paid or partially paid, and online and weekend classes would most likely encourage respondents to pursue professional development on their own time.
Conclusion The TENA survey determined the perceived training, resource, technical assistance, and professional development needs of personnel working in programs that participate in the NSLP. The results provide valuable information for developing a five-year training, technical assistance, and resource plan that is reflective of the needs of these programs.
Table 3: Ten most helpful resources and percent of respondents that chose “Really helpful”
Resource Really Helpful
(%) Standardized recipes aligned with new meal pattern 68.0
Online directory of available trainings 66.0 Child nutrition director quick guide to frequently asked questions 65.8
Child Nutrition Program Guide for new directors 62.2 Searchable database of Management Bulletins 60.6 Funding to purchase food for experiential learning 60.3
Printed training materials 60.1 Funding for substitute pay to release teacher from classroom for nutrition education training or curriculum alignment assignments
60.1
Cafeteria promotional materials 58.3 Web-based way to share best practices 57.7
TENA Survey Final Report: Chapter 1 – Introduction 5
Chapter 1 – Introduction Background
In the 2010-2011 school-year, California schools served over 580 million lunches and over 229 million breakfasts to children as part of the National School Lunch Program (NSLP) and School Breakfast Program (SBP), which reimburse School Food Authorities (SFAs) a predetermined amount for each meal served, provided they meet the federal regulations (1). To implement these complex regulations and operate a successful meal program, child nutrition personnel need training in a variety of areas, from menu planning and food preparation, to budgeting, to marketing. Furthermore, the childhood obesity epidemic has resulted in identification of schools as the ideal venue for nationwide initiatives to improve the health of children. The Institute of Medicine report, School Meals: Building Blocks for Healthy Children (2), emphasizes the importance of schools and the school meal programs in child health, as does a joint statement by the Academy of Nutrition and Dietetics (formerly the American Dietetic Association), the School Nutrition Association (SNA), and the Society for Nutrition Education on the role of schools in preventing obesity and promoting child health (3). As awareness of these important issues has grown, so has focus on initiatives and federal and state programs to address them, such as the Let’s Move! Campaign, the HealthierUS School Challenge, and Superintendent Tom Torlakson’s Team California for Healthy Kids campaign.
In December 2010, President Obama signed the Healthy, Hunger-Free Kids Act of 2010 (HHFKA) (4), which mandated numerous changes to the NSLP and SBP. These changes include several provisions to improve fiscal operations, program access, wellness through healthy school environment, as well as a provision (in Section 201) to update the meal patterns and nutrition standards for the NSLP and the SBP, based on the recommendations of the Institute of Medicine. The Final Rule: Nutrition Standards in the National School Lunch and School Breakfast Programs, released by U. S. Department of Agriculture (USDA) on January 26, 2012, requires SFAs to increase the availability of fruits, vegetables, whole grains, and fat-free and low-fat fluid milk in school meals; reduce the levels of sodium, saturated fat and trans fat in meals; and meet the nutrition needs of school children within their calorie requirements (5). While these changes will improve the management of school meal programs and the healthfulness of meals served, they bring with them significant changes that will impact the training, resource, and technical assistance needs of school nutrition personnel who administer the NSLP and SBP.
To address these issues, the California Department of Education (CDE), Nutrition Services Division (NSD) launched the School Nutrition Program Training and Education Needs Assessment (TENA) project. The primary reason for the needs assessment was to ensure that CDE directs the limited State Administrative Expense (SAE) funds available, towards trainings, resources, and technical assistance that SFAs state they need. The TENA project included convening a diverse stakeholder committee and conducting a needs assessment survey. The TENA Committee has representatives from small, medium, and large school districts, a residential child care institution (RCCI),

TENA Survey Final Report: Chapter 1 – Introduction 6
charter school associations, CDE After School program, and many other organizations who are stakeholders in child nutrition programs (Appendix D). The committee was charged with the task to help the NSD develop a five-year plan to address the priority training, resource, and technical assistance needs of the child nutrition personnel that work in the NSLP or SBP.
As part of the needs assessment process, the University of California, Davis (UCD), Center for Nutrition in Schools collaborated with CDE to develop and implement a needs assessment survey to gather data directly from child nutrition directors and personnel. The objective of the survey was to determine training, resource, and professional development needs of child nutrition personnel in schools, after school programs1, and RCCIs. In addition, respondents were surveyed about preferences with regards to training format and delivery modes. The results of the survey were utilized by the TENA committee as they prioritized the training and resource needs for the next five years.
Methodology The TENA Survey team (UCD and CDE staff) conducted a web-based survey of
directors, managers, nutrition specialists, supervisors, and child nutrition staff employed by school nutrition programs, after school programs, and RCCIs in California. Programs that participated in the NSLP received an email inviting personnel to participate in the survey. Included in the email was a link to the web survey and a printable flyer that could be posted or distributed to staff. One week later, a second email was sent to thank those that had completed the questionnaire, and to serve as a reminder for non-respondents. A few days after the second email was sent, all programs received a packet by mail containing a cover letter inviting directors and their staff to participate, and an information flyer about the study. This packet had originally been intended to be received by directors before the initial email was sent, but was not mailed in time for this to occur. The mailed packet was sent in addition to emails in order to reach the largest number of NSLP-participating programs possible. Furthermore, a combination of email and postal mail ensured we could reach both those with a tendency to respond better to mailed letters, and those that respond better to email. A final reminder/thank you email was sent two weeks later. In addition, the survey was publicized at the California School Nutrition Association (CSNA) conference, where a link was available to the web survey on the conference cyber café computers. Those unable to complete the questionnaire on the Internet were able to request a paper copy of the questionnaire to complete. Appendix B contains all communications sent.
The web survey utilized Survey Monkey software. All UCD requirements for human subjects research were followed and the Institutional Review Board (IRB) approved the project before the survey began. Before beginning the survey, participants were presented with a list of “frequently asked questions” (FAQ) about the study, their rights as a participant in human subject research, and who to contact with questions. Per IRB regulations, all respondents had the option of choosing not to answer any
1 After school programs in this study refers only to those that participate in the NSLP. Those that participate in the Child and Adult Care Food Program will be surveyed in a future study.

TENA Survey Final Report: Chapter 1 – Introduction 7
question. To ensure that respondents intentionally chose not to provide a response, questions on the web-based survey required a response in order to proceed in the survey, however respondents could choose “Prefer not to answer”. “Not sure” and “Prefer not to answer” responses were not included in analysis, unless otherwise noted.
Data was imported into SPSS Statistics Version 20 (IBM Corp., Armonk, NY, 2011) for analysis. Analyses consisted of descriptive statistics and Chi-square analysis.
Questionnaire Development Questionnaire development began with a review of similar surveys that had been
conducted in the past, and a bank of questions from these questionnaires was developed. Questions were revised and new questions were added as needed. The surveys used included the National Food Service Management Institute Training Needs Reported by School Food Service Site Managers and Recommendations for Meeting Managers’ Needs (2000), the 2004 Education and Training Needs Assessment conducted by the NSD and California State Polytechnic University at Pomona, the 2011 Regional Leadership Conference: Stepping Up to the Challenge – Creating a Healthy School Environment Training and Technical Assistance Application, the UC Berkeley Center for Weight and Health Nutrition Learning Environments, Actions & Policies Stakeholder Questionnaire, the Georgia Department of Education Needs Assessment for 2012-2014 Recertification Course for Managers, and the California School Nutrition Association Professional Development Survey. Following the development of the draft version of the questionnaire, it was reviewed by NSD staff for completeness and clarity, and content validity, before being reviewed by the TENA committee. Suggestions by NSD staff and TENA committee members were incorporated into the questionnaire before it was reviewed again by NSD staff. Necessary revisions were made and the questionnaire was finalized.
The questionnaire (Appendix A) was designed to be used at different levels within the child nutrition career ladder, including kitchen and line staff, managers and supervisors, and directors. In order to reduce respondent burden and increase response rate, skip logic was used to direct respondents to questions that would be relevant to them. Questions 3 and 4 were used to determine skip patterns for the online survey. Job title (question 3) determined what questions were asked of the respondent (e.g. line workers did not see questions intended for directors), and site type (question 4) determined if questions refer to site or district (e.g. many questions have “site/district” in the question. Respondents saw “site” or “district” depending on whichever was most appropriate for them). There were seven sections in the questionnaire:
1. Work site or district 2. Training needs 3. Staff training needs (directors and managers) 4. Training opinions and preferences 5. Resources, equipment and technical assistance 6. Professional development 7. Demographic information

TENA Survey Final Report: Chapter 1 – Introduction 8
Directors and managers answered questions from all of the sections, while staff, nutrition specialists and those who chose “Other” answered questions from sections 1, 2, and 4-6. The additional section for directors and managers on staff training needs was included for two reasons. The first was that the survey team anticipated there would be a “gatekeeper” effect, as the contact person for the NSLP at the site or district was responsible for distributing the questionnaire to others in the child nutrition program. For this reason, the response rate for kitchen and line staff was expected to be lower; surveying directors and managers on their staff need would provide some data about what kitchen and line staff might need. Furthermore, it allows the survey team to compare what directors and managers think their staff might need to what the staff respondents themselves indicated was needed. Appendix A contains the questionnaire used in this survey.

TENA Survey Final Report: Chapter 2 – Participant Characteristics 9
Chapter 2 – Participant Characteristics The survey was sent to 1,490 programs participating in the NSLP, and a total of
994 respondents initiated the online survey. Of these, 739 (74.3 percent) completed the web-based survey. Since the Survey Monkey software records data as it is collected, responses from those who did not finish the full questionnaire were included in the analysis. In addition to the web-based survey, respondents were offered the option of completing a paper copy of the questionnaire, resulting in an additional 34 completed questionnaires. All counties in California were represented in the survey.
Counties were divided into regions (Bay Area, Central, Los Angeles, Northern, Southern and Coastal) based on data from the CDE Child Nutrition Information and Payment System, and survey data was compared to expected frequencies for each of the six regions. Programs in the Central and Southern regions were over-represented, while programs in the Coastal region were under-represented in the sample (χ2=45.13, df=5, p<0.001).
Respondent Characteristics
Demographic Characteristics
Table 1 contains the demographic distribution of respondents. The majority of respondents were female (85.4 percent), between the ages of 50 and 59 years (44.2 percent), held the title of director (43.6 percent), had at least some college education (31.2 percent), and identified as white or Caucasian (68.2 percent). Of the remaining participants, 4.0 percent were between 18 and 29 years, 12.2 percent between 30 and 39 years, 24.4 percent between 40 and 49 years, 10.6 percent were between 60 and 69 years. Less than 1 percent were 70 years or older. Aside from directors, the sample consisted of 27.2 percent managers or supervisors, 16.9
Table 1: Participant Demographics
Characteristic n % Gender
Female 663 85.4 Male 99 12.8 Prefer not to answer 14 1.8
Age (years) 18-29 31 4.0 30-39 95 12.2 40-49 189 24.4 50-59 343 44.2 60-69 82 10.6 70+ 6 0.8 Prefer not to answer 30 3.9
Title Director 435 43.6 Manager or Supervisor 271 27.2 Staff 81 8.1 Administrators, business staff, etc.
168 16.9
Nutrition specialist 11 1.1 Miscellaneous 31 3.1
Education Less than high school 6 0.8 High school diploma or equivalent
128 16.5
Some college 242 31.2 Associate’s degree or equivalent
121 15.6
Bachelor’s degree 167 21.5 Advanced degree 81 10.4 Other 7 0.9 Not sure 1 0.1 Prefer not to answer 23 3.0
Race and Ethnicity (participants could choose more than one response)
African American 43 5.6 Asian or Pacific Islander 36 4.7 Latino or Hispanic 124 16.2 Native American or Alaska Native
12 1.6
White or Caucasian 523 68.2 Other 10 1.3 Not sure 2 0.3 Prefer not to answer 60 7.8

TENA Survey Final Report: Chapter 2 – Participant Characteristics 10
percent administrators, and business or office staff, 8.1 percent child nutrition staff, 1.1 percent nutrition specialists, and 3.1 percent miscellaneous. Of those that responded to the question, 16.2 percent identified as Latino or Hispanic, 5.6 percent as African American, 4.7 percent as Asian or Pacific Islander, 1.6 percent as Native American or Alaska Native, and 7.8 percent preferred not to respond.
Employment and Professional Characteristics
Most participants have been in their current position for at least a year (Figure 1), with 33.4 percent employed for 1-5 years, 23.7 percent for 6-10 years, 13.4 percent for 11-15 years, and 20.9 percent for more than 15 years. A much smaller proportion (8.1 percent) have been in their current position for less than a year, and 0.5 percent chose not to provide a response. Most participants have no plans to retire in the near future. Almost half (42.1 percent) don’t plan to retire for at least 10 years, while 21.3 percent plan to retire between 6 and 10 years from now, 19.5 percent between 1 and 5 years from now, and 3.1 percent within the next year. Of the remaining respondents, 11.2 percent were not sure, and 2.8 percent chose not to respond.
Just over a third of respondents (36 percent) are members of the CSNA. School Nutrition Association (SNA) Certification was fairly rare among respondents, with 1.5 percent, 0.5 percent, 2.2 percent holding Level 1, 2, or 3 certifications respectively. SNA School Nutrition Specialist (SNS) credentials were also uncommon; 2.7 percent of respondents indicated they had an SNS credential. However, most respondents were certified in food safety (68.5 percent) and 4.0 percent indicated they were registered dietitians.
School, District, or Program Characteristics Almost half of respondents (46.2 percent) indicated they were employed at a
school site, while 31.7 percent were employed at the district level. Of the remaining respondents, 8.3 percent worked at RCCIs, 6.5 percent worked at a central production site, 7.0 percent chose “Other”, and 0.2 percent were not sure what type of site they were employed at. The vast majority of respondents were employed in schools, districts, or programs with students in elementary or middle schools (Figure 2). All counties in California were represented in the sample (county breakdown can be found in Appendix C).
Directors, managers, and nutrition specialists were asked about participation in Shaping Health As Partners in Education (SHAPE). Of those that were asked this question, 21.2 percent indicated their district or program participates in SHAPE. The
Figure 1: Number of years in current position by percent of respondents
Less than 1 year 8%
1-5 years 33%
6-10 years 24%
11-15 years 13%
More than 15 years 21%
How many years have you been in your current position?

TENA Survey Final Report: Chapter 2 – Participant Characteristics 11
majority (59.1 percent) indicated their district or program does not participate, and 19.7 percent were unsure.
In addition to the above questions, directors were asked to provide additional information about their districts. When asked number of students enrolled in their district, 47.3 percent indicated that fewer than 2,500 students attended, while 25.8 percent indicated they work in medium-sized districts (2,500-9,999 students), 21.7 percent in large districts (10,000-39,999 students) and 3.1 percent in very large school districts (>40,000 students).
The total number of staff employed by the child nutrition programs was less than 5 in 23 percent of cases, between 6 and 10 in 13.8 percent, between 11 and 25 in 18.5 percent, between 26 and 50 in 15.7 percent, between 51-100 in 14.3 percent, between 101 and 250 in 9.7 percent and more than 250 employees in 3.8 percent of cases. A small percentage (1.2 percent) were not sure how many staff were employed.
Most (67.1 percent) of directors responded that their district provides snacks or meals to an after school program, while 31 percent do not and 1.9 percent are unsure.
Figure 2: Grade Levels at Respondent Site or District
1.1
41
69.6 70.5 70.6 70.7 70.6 70.5 72 69.9 72.3
46.4 46.5 46.1 47.6
0 10 20 30 40 50 60 70 80
Perc
ent o
f Res
pond
ents
Grade Level
What grade levels are students at your site/district?

TENA Survey Final Report: Chapter 3 – Training Needs 12
Chapter 3 – Training Needs For each training topic, participants were asked to rate how much they needed
training in that area. In addition to “Not sure” and “Prefer not to answer”, available response options were:
• Not needed for my job • Already well trained • Somewhat needed • Really needed
This report will discuss training topics with a 50 percent or greater proportion of respondents who chose “Really needed” or “Somewhat needed” for the sake of brevity. A complete breakdown of responses to each question can be found in Appendix C.
Overall Needs Training topics were grouped into general themes, with responses summarized
below. Response percentages can be found in Table 2.
Program Management
Directors and managers were asked several questions focused on child nutrition program management, of which many had 50 percent or more respond with “Really needed” or “Somewhat needed.” The training topic with the highest percentage of “Really needed” and “Somewhat needed” responses was “Disaster plan development and implementation” (69.8 percent). Also falling under this category was “Grant writing” (62.9 percent), which was the only training topic in which a larger percentage of respondents chose “Really needed” than “Somewhat needed.” This is particularly interesting in light of the responses to the question “Do you obtain funding for your program from outside sources?” in which the majority (62.4 percent) indicated they do not. Those that do not currently obtain funding were more likely to express need for grant writing training than those that do (χ2=28.33, df=8, p<0.001, “Not sure” responses included in analysis). These results suggest that a lack of training in grant writing may be a barrier to obtaining outside funding.
Subthemes that emerged among program management topics were managing employees and procurement. Managing employees was an area in which there is clearly a need for training. Several employee management topics fell above the 50 percent mark, including “Staff productivity analysis” (60.5 percent), “Team building” (58.0 percent), “Leadership” (54.5 percent), “Communicating effectively with workers” (54.2 percent), “Training employees” (51.9 percent), and “Evaluating on the job performance of workers” (51.0 percent).
Interest was high in procurement training, including “Writing specifications for fruits and vegetables” (58.9 percent), “Writing bids for procurement” (51.5 percent), and “Procurement of regional produce” (51.3 percent).

TENA Survey Final Report: Chapter 3 – Training Needs 13
Other needed management training topics were “Managing stressful situations at work” (56.6 percent), “Work simplification” (56.0 percent), “Policy development” (55.7 percent), “Indirect costs” (52.4 percent), and “Waste management” (50.4 percent).
The Healthy, Hunger-Free Kids Act of 2010/Final Rule on Meal Patterns and Nutrition Standards
Almost all training topics linked to the final rule on meal patterns and nutrition standards, resulting from the HHFKA of 2010, were highly ranked. The highest-needed training topic was “Menu planning to meet the new requirements,” with 62.0 percent of respondents choosing “Really need” or “Somewhat need” which is very similar to the next most-needed topic, “Cost-effective menus that meet new requirements” (58.5 percent).
To implement the final rule, changes will need to be made in what is served and what is required as part of a reimbursable meal. The new rule reduces sodium in meals gradually, with the first sodium reduction target going into effect on July 1, 2014. The USDA will evaluate the research linking sodium and health outcomes before implementing a second target, followed by a final target. The need for training in this area is reflected in the fact that more than half of respondents feel they need training in “Reducing sodium in meals while maintaining flavor” (55.7 percent). In addition to reducing sodium, respondents indicated they also need training in “Offer v. Serve crediting to meet the new meal pattern requirements” (52.8 percent), “Meeting calorie limits, reducing saturated fat, and eliminating trans fats in menus” (52.1 percent), “Increasing dark green and orange vegetables in menus” (51.6 percent), and “Increasing dry beans and peas in menus” (50.7 percent). Table 2: Training topics in which at least 50 percent of respondents chose "Really needed" or "Somewhat needed"
Training Topics Really +
Somewhat Needed (%)
Really Needed
(%)
Somewhat Needed
(%)
Already well-
trained (%)
Not needed for my job (%)
Disaster plan development and implementation 69.8 20.2 49.6 22 8.1
Type 2 diabetes 64.9 17.4 47.5 20.4 14.8
Grant writing 62.9 34.5 28.4 26.2 11.0 HHFKA Menu planning to meet the new meal requirements 62.0 23.7 38.3 17.3 20.6
Food allergies or intolerances in children 61.6 13.6 48.0 26.7 11.7
Special dietary needs 60.9 12.7 48.2 24.4 14.7
Staff productivity analysis 60.5 16.6 43.9 25.5 13.9
Writing specifications for fruits and vegetables 58.9 16.0 42.9 20.3 20.9 HHFKA Cost-effective menus that meet new requirements 58.5 20.7 37.8 18.4 23.1
Team building 58.0 13.0 45.0 37.7 4.4
Childhood obesity 57.0 12.2 44.8 28.8 14.1

TENA Survey Final Report: Chapter 3 – Training Needs 14
Training Topics Really +
Somewhat Needed (%)
Really Needed
(%)
Somewhat Needed
(%)
Already well-
trained (%)
Not needed for my job (%)
Current nutrition issues 56.6 14.3 42.3 31.5 11.8
Managing stressful situations at work 56.6 9.3 47.3 39.9 3.5
Vegetarianism 56.5 10.4 46.1 26.2 17.3
Work simplification 56.0 12.0 44.0 38.8 5.2
Teaching nutrition to students 55.7 12.3 43.4 18.7 25.6
Policy development 55.7 21.0 34.7 32.6 11.7 HHFKA Reducing sodium in meals while maintaining flavor 55.7 21.4 34.3 22.9 21.3
Coordinating meal programs with classroom study 55.6 17.1 38.5 13.7 30.6
Role of meal program in coordinated school health 55.5 16.4 39.1 26.5 17.9
Identifying relationship between wellness policy & meals 55.5 15.0 40.5 29.6 15.0
Developing a strong wellness policy 55.2 13.9 41.3 30.9 13.8
Farm-to-School programs 54.9 10.4 44.1 14.6 30.5
Promoting a healthy school environment 54.5 15.0 39.5 29.0 16.5
Leadership 54.5 12.2 42.0 41.8 3.7
Communicating effectively with workers 54.2 17.0 37.0 42.8 2.9
Employee wellness 53.6 13.3 40.3 31.5 14.9
HHFKA Offer vs. Serve in new meal pattern 52.8 18.7 34.1 28.3 18.9
Indirect costs 52.4 15.8 36.6 26.3 21.2
HHFKA Meeting calorie, fat limits 52.1 18.2 33.9 24.4 23.6
Training employees 51.9 9.7 42.2 43.9 4.2 HHFKA Increasing dark green & orange vegetables 51.6 16.9 34.7 28.3 20.2
Writing bids for procurement 51.5 18.3 33.2 32.8 15.6
Procurement of regional produce 51.3 9.1 42.2 28.4 20.3
Child nutrition 51.2 8.3 42.9 36.9 11.9
Evaluating on-the-job performance of workers 51.0 11.8 39.2 42.7 6.3 HHFKA Increasing dry beans and peas in school menus 50.7 15.4 35.3 27.9 21.4
Marketing healthy meal choices 50.6 16.3 34.3 24.7 24.7
Waste management 50.4 8.4 42.0 39.7 9.9 Preparing food for students with special dietary needs 50.2 14.5 35.7 29.7 20.1

TENA Survey Final Report: Chapter 3 – Training Needs 15
Nutrition, Health, and Wellness
Aligned with the HHFKA focus of improving child health, is the interest respondents have in health and school wellness overall. Of the 40 topics with 50 percent or more respondents choosing “Really needed” or “Somewhat needed,” 16 fall under health and wellness. Training on specific aspects of child health is needed, particularly “Type 2 diabetes” (64.9 percent), “Food allergies or intolerances in children” (61.6 percent), “Special dietary needs” (60.9 percent), “Childhood obesity” (57.0 percent), “Child nutrition” (51.2 percent), and “Preparing food for children with special dietary needs” (50.2 percent). In addition, respondents expressed a need for training in “Current nutrition issues” (56.5 percent), and “Vegetarianism” (56.5 percent).
It also becomes apparent that many respondents either already do, or would like to take on a leadership role in school wellness. “Teaching nutrition to students” (55.7 percent) is one part of this, and complements the topics “Coordinating the school meal programs with classroom study themes” (55.6 percent), “Identifying the role of the school meal program in coordinated school health” (55.5 percent), “Identifying the relationship between wellness policy and the school meals program” (55.5 percent), “Developing a strong wellness policy” (55.2 percent), and ”Promoting a healthy school environment” (54.5 percent). As part of promoting a healthy school environment, it is also important to promote healthy choices, which is reflected in the training need of “Marketing healthy meal choices” (50.6 percent) to encourage kids to choose and eat healthier menu options.
Training Specific to Residential Child Care Institutions
While overall, the proportion of respondents indicating they need training specific to RCCIs was low (20.5 percent), the number of respondents from RCCIs represent a small proportion of the sample (n=83, 8.3 percent). When the data is analyzed for just those who were from RCCIs, the percentage of respondents who indicated they needed RCCI-specific training jumps to 72.2 percent.
Director and Manager Perceptions of Staff Needs It was anticipated that the response from child nutrition program staff would be
lower than that of directors, as it was necessary for directors to distribute the survey among their staff. For this reason, directors, managers, and supervisors were asked an additional set of questions about staff needs. The sample of staff is unlikely to be representative of the state, as the number of staff responding to the survey was less then 10 percent of the respondents, and over 50 percent of staff respondents were from 13 different school districts or programs. For these reasons, this report will focus mostly on director and manager perceptions of staff needs. Training topics were grouped into general themes, with responses summarized below. Response percentages can be found in Table 3.
Nutrition, Health, and Wellness
Managers and directors clearly felt it was important for their staff to be trained in child health and wellness. Of the 40 training topics with greater than 50 percent of
TENA Survey Final Report: Chapter 3 – Training Needs 16
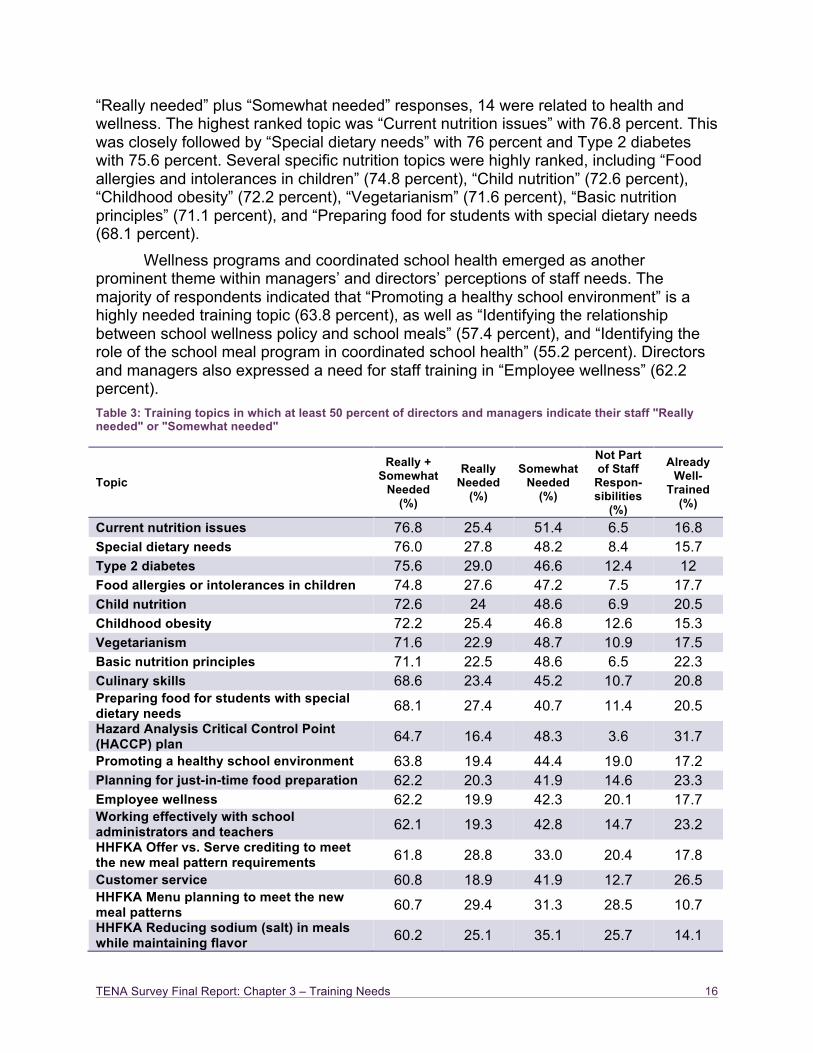
“Really needed” plus “Somewhat needed” responses, 14 were related to health and wellness. The highest ranked topic was “Current nutrition issues” with 76.8 percent. This was closely followed by “Special dietary needs” with 76 percent and Type 2 diabetes with 75.6 percent. Several specific nutrition topics were highly ranked, including “Food allergies and intolerances in children” (74.8 percent), “Child nutrition” (72.6 percent), “Childhood obesity” (72.2 percent), “Vegetarianism” (71.6 percent), “Basic nutrition principles” (71.1 percent), and “Preparing food for students with special dietary needs (68.1 percent).
Wellness programs and coordinated school health emerged as another prominent theme within managers’ and directors’ perceptions of staff needs. The majority of respondents indicated that “Promoting a healthy school environment” is a highly needed training topic (63.8 percent), as well as “Identifying the relationship between school wellness policy and school meals” (57.4 percent), and “Identifying the role of the school meal program in coordinated school health” (55.2 percent). Directors and managers also expressed a need for staff training in “Employee wellness” (62.2 percent). Table 3: Training topics in which at least 50 percent of directors and managers indicate their staff "Really needed" or "Somewhat needed"
Topic Really +
Somewhat Needed
(%)
Really Needed
(%)
Somewhat Needed
(%)
Not Part of Staff
Respon-sibilities
(%)
Already Well-
Trained (%)
Current nutrition issues 76.8 25.4 51.4 6.5 16.8 Special dietary needs 76.0 27.8 48.2 8.4 15.7 Type 2 diabetes 75.6 29.0 46.6 12.4 12 Food allergies or intolerances in children 74.8 27.6 47.2 7.5 17.7 Child nutrition 72.6 24 48.6 6.9 20.5 Childhood obesity 72.2 25.4 46.8 12.6 15.3 Vegetarianism 71.6 22.9 48.7 10.9 17.5 Basic nutrition principles 71.1 22.5 48.6 6.5 22.3 Culinary skills 68.6 23.4 45.2 10.7 20.8 Preparing food for students with special dietary needs 68.1 27.4 40.7 11.4 20.5 Hazard Analysis Critical Control Point (HACCP) plan 64.7 16.4 48.3 3.6 31.7 Promoting a healthy school environment 63.8 19.4 44.4 19.0 17.2 Planning for just-in-time food preparation 62.2 20.3 41.9 14.6 23.3 Employee wellness 62.2 19.9 42.3 20.1 17.7 Working effectively with school administrators and teachers 62.1 19.3 42.8 14.7 23.2 HHFKA Offer vs. Serve crediting to meet the new meal pattern requirements 61.8 28.8 33.0 20.4 17.8 Customer service 60.8 18.9 41.9 12.7 26.5 HHFKA Menu planning to meet the new meal patterns 60.7 29.4 31.3 28.5 10.7 HHFKA Reducing sodium (salt) in meals while maintaining flavor 60.2 25.1 35.1 25.7 14.1

TENA Survey Final Report: Chapter 3 – Training Needs 17
Topic Really +
Somewhat Needed
(%)
Really Needed
(%)
Somewhat Needed
(%)
Not Part of Staff
Respon-sibilities
(%)
Already Well-
Trained (%)
Cooking/food preparation 59.5 16.5 43.0 7.4 33.1 Scratch cooking (including speed scratch or quick scratch) 58.8 21.4 37.4 19.1 22.1 HHFKA Increasing dark green and orange vegetables in school menus 58.6 26.3 32.3 23.8 17.6 HHFKA Increasing dry beans and peas in school menus 58.2 24.1 34.1 25.4 16.4 Forecasting food production needs 57.8 19.4 38.4 15.4 26.9 Controlling portion sizes 57.7 15.5 42.2 6.5 35.7 Identifying the relationship between school wellness policy and school meals 57.4 18.2 39.2 28.8 13.7 Standardizing recipes 56.7 18.9 37.8 21.9 21.5 Adjusting standardized recipes for quantities needed 56.3 16.2 40.1 19 24.7 Preparing plant-based meals 56.3 15.3 41.0 25.5 18.1 Incorporating cultural foods into school meals 56.3 15.1 41.2 26.5 17.2 Evaluating new food products 56.2 11.8 44.4 22.6 21.2 Offering food or meal choices 55.6 12.1 43.5 13.9 30.4 HHFKA Implementing food-based approach in menu planning 55.5 24.4 31.1 27 17.5 Identifying the role of the school meal program in coordinated school health 55.2 17.1 38.1 32.1 12.7 Menu planning options 55.1 15.7 39.4 24.9 20.1 Food safety 54.7 11.8 42.9 2.6 42.7 HHFKA Meeting calorie limits, reducing saturated fat, and eliminating trans fat in school menus
53.1 23.3 29.8 33.4 13.5
HHFKA Increasing whole grains in school menus 52.6 23.3 29.3 25.0 22.4 Marketing healthy meal choices 52.6 19.6 33.0 32.1 15.4 Communicating with parent organizations 50.3 16.1 34.2 29.2 20.5
Planning, Preparing, and Serving Meals
The primary goal of the meal programs is to prepare and serve meals to children, and this is reflected in director and manager perceptions of staff training needs related to planning, preparing, and serving meals. “Culinary skills” (68.6 percent) was the highest ranked topic under this theme. As millions of children are served every day, preventing food-borne illness is crucial; the importance of this is highlighted in the training topics “Hazard Analysis Critical Control Point (HACCP) plan” (64.7 percent), and “Food safety” (54.7 percent).
Planning meals can include not just menu planning, but also other aspects of planning that are needed on a regular basis to prepare and serve meals. Of these, “Planning for just-in-time food preparation” was the highest ranked, with 62.2 percent indicating it was needed. Also needed are “Forecasting food production needs” (57.8

TENA Survey Final Report: Chapter 3 – Training Needs 18
percent), “Standardizing recipes” (56.7 percent), “Adjusting standardized recipes for quantities needed” (56.3 percent), “Incorporating cultural foods into school meals” (56.3 percent), “Evaluating new food products” (56.2 percent), “Offering food or meal choices” (55.6 percent), and “Menu planning options” (55.1 percent). When it came to preparing and serving meals, “Cooking/food preparation” (59.5 percent) is the most highly needed, followed by “Scratch cooking (including speed scratch or quick scratch)” (58.8 percent), “Controlling portion sizes” (57.7 percent), and “Preparing plant-based meals” (56.3 percent).
The Healthy, Hunger-Free Kids Act of 2010
With so many training topics related to the HHFKA being highly ranked for personal training needs, it comes as no surprise that managers and directors indicated their staff needed training in various aspects of the HHFKA. Of these, “Offer vs. Serve crediting to meet the new meal pattern requirements” was the highest ranked, with 61.8 percent. “Menu planning to meet the new meal pattern requirements” (60.7 percent), “Reducing sodium in meals while maintaining flavor” (60.2 percent), “Increasing dark green and orange vegetables in school menus (58.6 percent), “Implementing food-based approach in menu planning” (55.5 percent), “Meeting calorie limits, reducing saturated fat, and eliminating trans fat in school menus” (53.1 percent), and “Increasing whole grains in school menus” (52.6 percent) are training topics related to the HHFKA that fell above the 50 percent cutoff.
Communication and Marketing
The communication skill directors and managers indicated their staff needed the most was “Working effectively with school administrators and teachers” (62.1 percent). This was followed by “Customer service” (60.8 percent). One of the most commonly cited barriers to meal program participation (discussed in Chapter 5) was poor perception of the meal program by students, and one component of the poor perception may be customer service. Other communication and marketing training topics were “Marketing healthy meal choices” (52.6 percent), which also falls under school wellness, and “Communicating with parent organizations” (50.3 percent).

TENA Survey Final Report: Chapter 4 – Training Preferences 19
Chapter 4 – Training Preferences While the bulk of the questionnaire was focused on training topics, preferences
about training format, location, length, and other relevant aspects of training were also included. This information can be used to guide the development of training in order to encourage maximum interest and participation, while minimizing aspects of training that may discourage some from participating.
Based on responses, the ideal training would be in-person, last between 1 and 3 hours, be within 60
miles of all attendees, and take place during the school year. When asked “Which of the following do you consider the best training method?” respondents more frequently chose in-person workshops or training classes (57.3 percent), followed by internet-based training (26 percent). The other options were considerably less popular (Table 4). While respondents expressed a clear preference for in-person and internet-based trainings, willingness to participate in other types of training was relatively high. The overwhelming majority (86 percent) stated they would participate in in-person trainings, while 76.3 percent were willing to participate in internet-based training. Over half (55.1 percent) would be willing to participate in conference-based training, 43.9 percent would utilize video/DVD instruction, 38.2 percent would utilize self-study workbooks, and 35.9 percent would use computer-based training that does not require internet.
Staff were significantly less likely to be willing to participate in internet-based training compared to directors and managers (χ2=35.73, df=2, p<0.001). While 79 percent of directors and 70 percent of managers would be willing to participate, less than half of staff were willing (46.8 percent). However, as noted earlier, the sample of staff in this survey was small and not representative of staff within the state as a whole, therefore, these results should be interpreted with caution.
In-Person Workshops or Training Classes
Respondents expressed a clear preference for training that takes place in-person rather than distance training or self-study. Related to the willingness to participate in in-person training, is the willingness to travel to attend trainings. While 10 percent of respondents would prefer not to travel more than 10 miles for training, most respondents are willing to travel a moderate distance for training (Figure 3). Staff were
Table 4: Best training method and training method respondents were willing to participate by percent of respondents
Training Method Best Training Method (%)
Willing to Participate (%)
In-person 57.3 86.0 Internet-based 26.0 76.3 Conference-based 5.2 55.1 Self-study workbooks 2.5 38.2 Video/DVD instruction 2.2 43.9 Computer-based not requiring internet 0.8 35.9
Other 1.7 0.6 Not sure 4.5 2.3

TENA Survey Final Report: Chapter 4 – Training Preferences 20
significantly less likely to be willing to travel more than 30 miles (χ2=59.04, df=10, p<0.001).
Just over half (52.3 percent) of respondents would prefer in-person training to take place during the school year, while 33.5 percent prefer the summer, and 12.4 percent weren’t sure. Respondents prefer training to take place on week days, preferably in the middle of the week, while relatively few prefer training that takes place on Saturday or Sunday (Figure 4).
A slight majority of respondents prefer in-person trainings to be 1 to 3 hours long (51.8 percent). Just under a third (32.9 percent) prefer day-long trainings, and 7.9 percent prefer multiple day trainings.
Internet-Based Training
Internet-based training was the second most popular training format. Interestingly, computer-based training not requiring internet was much less acceptable to respondents. This may indicate that the ability to interact with instructors, such as in a webinar, may be the key feature that would cause respondents to choose one over the other. When it comes to training length, 10.1 percent prefer training to be less than 30 minutes in length, while 48.1 percent prefer trainings between 30 minutes and an hour in length, and 34.8 percent indicate that between one and two hours is the ideal length. Very few (1.9 percent) state that more than two hours is the ideal length for internet-based training. One respondent indicated “Other” (0.1 percent), while 5 percent selected “Not sure”.
Barriers to Training
Respondents were also asked to provide information about what might prevent them from receiving the training they may want or need (Figure 5). Of those that answered the question “Do any of the following prevent you from getting the training you want or need?” the most common barrier was expense, including the cost of courses or cost of travel (63.1 percent). This was followed by “Travel distance” (51.5 percent), “Lack of relief staff” (49.5 percent), and “Courses held at inconvenient times” (47.4
Figure 3: Maximum distance respondents were willing to travel (percentage of respondents)
Figure 4: Preferred days of the week for in-person training classes (percentage of respondents)
Less than 10 miles
10%
10-30 miles 26%
31-60 miles 29%
61-100 miles 18%
Over 100 miles 9%
Not sure 8%
What is the maximum distance you would be willing to travel for training?
29.6
55.6 61.4
55.2
34
11.4 2.8
0 10 20 30 40 50 60 70
Perc
ent
What are the best days of the week for training?

TENA Survey Final Report: Chapter 4 – Training Preferences 21
percent). Respondents were able to choose “other” and provide reasons not included. Of those that chose to provide a response in the “other” field, several said they did not have time in their schedules to accommodate training (n=8), while some stated that they had no barriers to training (n=11). Interestingly, managers were less likely than directors and staff to state that expense was a barrier (χ2=7.31, df=2, p=0.026), while managers and staff were significantly less likely than directors to say that travel distance was a barrier (χ2=24.5, df=2, p<0.001), and less likely to cite “courses are held at inconvenient times” (χ2=16.69, df=2, p<0.001). Staff were less likely than managers and directors to consider lack of relief staff as a barrier (χ2=7.24, df=2, p=0.027). Directors from small districts (<2,500 students) were less likely to cite “Courses are held at inconvenient times” as a barrier compared to larger districts (χ2=7.91, df=3, p=0.048).
For most respondents (79.4 percent), the type of location does not discourage them from attending trainings; however 20.6 percent indicate the training location type sometimes or frequently causes them to not want to attend. These respondents were
asked a follow-up question to ascertain which types of locations were not preferred (Table 5). Of those (n= 193), equal numbers of respondents preferred not to attend trainings at hotel meeting rooms and college or university campuses (25.3 percent). County Office of Education meeting rooms (7.3 percent), school district meeting rooms (6.7 percent), and school classrooms (12.4 percent) were less likely to
discourage respondents from attending. However, these percentages reflect a subset of respondents. When compared to the total number of respondents, including those who indicated they were not discouraged by location type, the numbers of those who expressed unwillingness to attend trainings at any particular location type is quite small, as reflected in far right column of Table 5.
Table 5: Undesirable location types by percent of question respondents and percent of total survey respondents
Location type Percent of question
respondents
Percent of total
respondents College or university campus 25.3 6.1
Hotel meeting rooms 25.3 6.1
School classrooms 12.4 3.0 County Office of Education meeting rooms 7.3 1.8
School district meeting rooms 6.7 1.6
Figure 5: Barriers to training (percentage of respondents)
63.10%
51.50% 49.50% 47.40%
0% 10% 20% 30% 40% 50% 60% 70%
Expense Travel distance Lack of relief staff
Courses are held at
inconvenient times
Perc
ent
Do any of the following prevent you from getting the training you want or need?

TENA Survey Final Report: Chapter 5 – Resources and Barriers 22
Chapter 5 – Resources and Barriers Resources
While there are a variety of resources available to child nutrition personnel, not all are aware of what is available, and there may be resource needs not currently being addressed. To gather data on what resources should be promoted or developed, respondents were asked to choose a response based on how useful a resource would be to them. In addition to “Not sure” and “Prefer not to answer”, available response options were:
• Not helpful • Somewhat helpful • Really helpful A complete list of resources and participant response percentages can be found
in Table 6. Overall, each resource was rated as “Really helpful” by a significant proportion of respondents, indicating that resource needs are high.
Information and Reference Resources
Several of the resources related to reference materials or accessing information. Taken together, these suggest a need not just for guidance in these areas, but also a user-friendly way of accessing necessary information. An “Online directory of available trainings” was the second most helpful with 66.0 percent of respondents choosing “Really helpful.” This resource was suggested by the TENA committee, as there are a variety of programs and agencies that offer training for child nutrition programs but there is currently no central listing of available training classes. Also ranked highly was a “Child nutrition director quick guide to frequently asked questions” (65.8 percent), a “Child Nutrition program guide for new directors” (62.2 percent), a searchable database of Management Bulletins (60.6 percent), a “Web-based way to share best practices” (57.7 percent), and a “Regionally-based technical support system” (54.5 percent). In keeping with the need for training in grant writing, a “guide to outside funding sources” was considered to be very useful by more than half of respondents (56.6 percent). Respondents were also interested in specific guides for serving plant-based meals (47.8 percent), and after school program meals (45.4 percent).
Program Management Resources
When it comes to how helpful respondents would find certain resources, there were certain themes that were seen throughout. The resource with the highest percentage of respondents rating it as “Really helpful” was “Standardized recipes aligned with new meal pattern” (68.0 percent), which is consistent with the need respondents expressed for training associated with the HHFKA. Also consistent with the TENA committee’s recommendation for marketing, were “Cafeteria promotional materials,” with 58.3 percent of respondents choosing “Really helpful.”
TENA Survey Final Report: Chapter 5 – Resources and Barriers 23
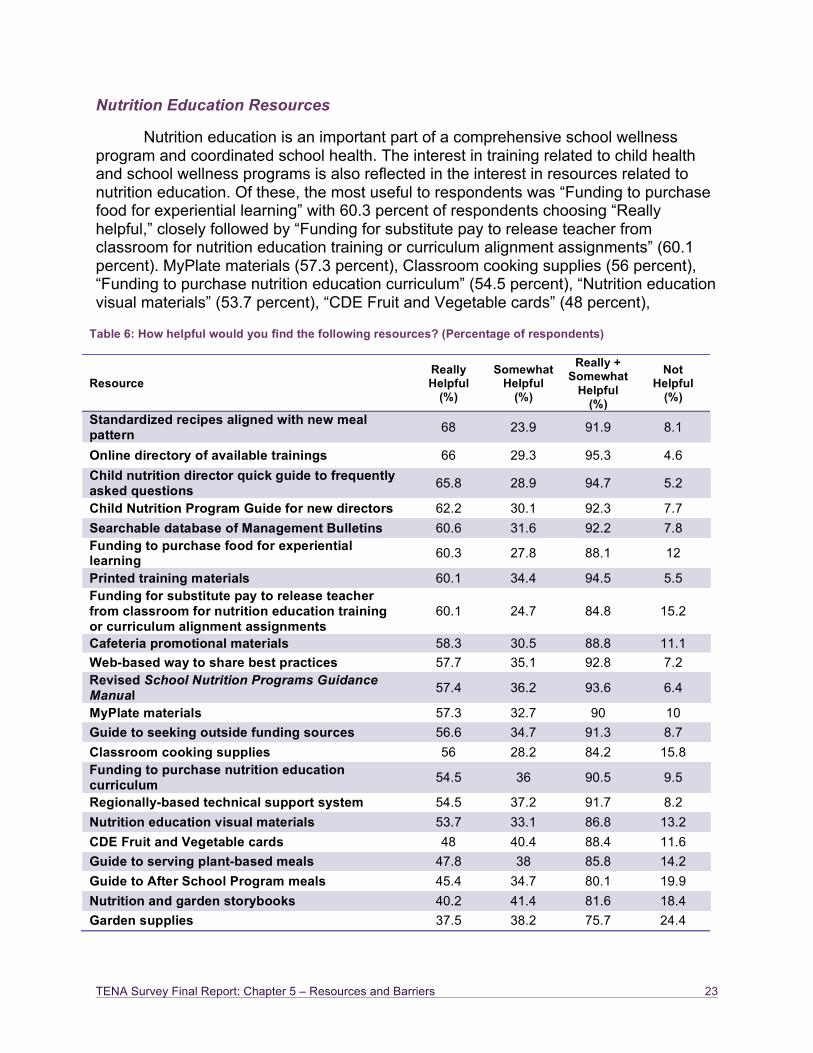
Nutrition Education Resources
Nutrition education is an important part of a comprehensive school wellness program and coordinated school health. The interest in training related to child health and school wellness programs is also reflected in the interest in resources related to nutrition education. Of these, the most useful to respondents was “Funding to purchase food for experiential learning” with 60.3 percent of respondents choosing “Really helpful,” closely followed by “Funding for substitute pay to release teacher from classroom for nutrition education training or curriculum alignment assignments” (60.1 percent). MyPlate materials (57.3 percent), Classroom cooking supplies (56 percent), “Funding to purchase nutrition education curriculum” (54.5 percent), “Nutrition education visual materials” (53.7 percent), “CDE Fruit and Vegetable cards” (48 percent),
Table 6: How helpful would you find the following resources? (Percentage of respondents)
Resource Really Helpful
(%)
Somewhat Helpful
(%)
Really + Somewhat
Helpful (%)
Not Helpful
(%)
Standardized recipes aligned with new meal pattern 68 23.9 91.9 8.1
Online directory of available trainings 66 29.3 95.3 4.6 Child nutrition director quick guide to frequently asked questions 65.8 28.9 94.7 5.2
Child Nutrition Program Guide for new directors 62.2 30.1 92.3 7.7 Searchable database of Management Bulletins 60.6 31.6 92.2 7.8 Funding to purchase food for experiential learning 60.3 27.8 88.1 12
Printed training materials 60.1 34.4 94.5 5.5 Funding for substitute pay to release teacher from classroom for nutrition education training or curriculum alignment assignments
60.1 24.7 84.8 15.2
Cafeteria promotional materials 58.3 30.5 88.8 11.1 Web-based way to share best practices 57.7 35.1 92.8 7.2 Revised School Nutrition Programs Guidance Manual 57.4 36.2 93.6 6.4
MyPlate materials 57.3 32.7 90 10 Guide to seeking outside funding sources 56.6 34.7 91.3 8.7 Classroom cooking supplies 56 28.2 84.2 15.8 Funding to purchase nutrition education curriculum 54.5 36 90.5 9.5
Regionally-based technical support system 54.5 37.2 91.7 8.2 Nutrition education visual materials 53.7 33.1 86.8 13.2 CDE Fruit and Vegetable cards 48 40.4 88.4 11.6 Guide to serving plant-based meals 47.8 38 85.8 14.2 Guide to After School Program meals 45.4 34.7 80.1 19.9 Nutrition and garden storybooks 40.2 41.4 81.6 18.4 Garden supplies 37.5 38.2 75.7 24.4
TENA Survey Final Report: Chapter 5 – Resources and Barriers 24
“Nutrition and garden storybooks” (40.2 percent) and “Garden supplies” (37.5 percent) were other nutrition education resources included on the questionnaire. A few of the nutrition education resources on the list are already available (e.g. CDE Fruit and Vegetable cards and MyPlate materials) although it is unclear if respondents are unaware of these and would find them helpful, or are aware but unable to acquire them.
Other Resources
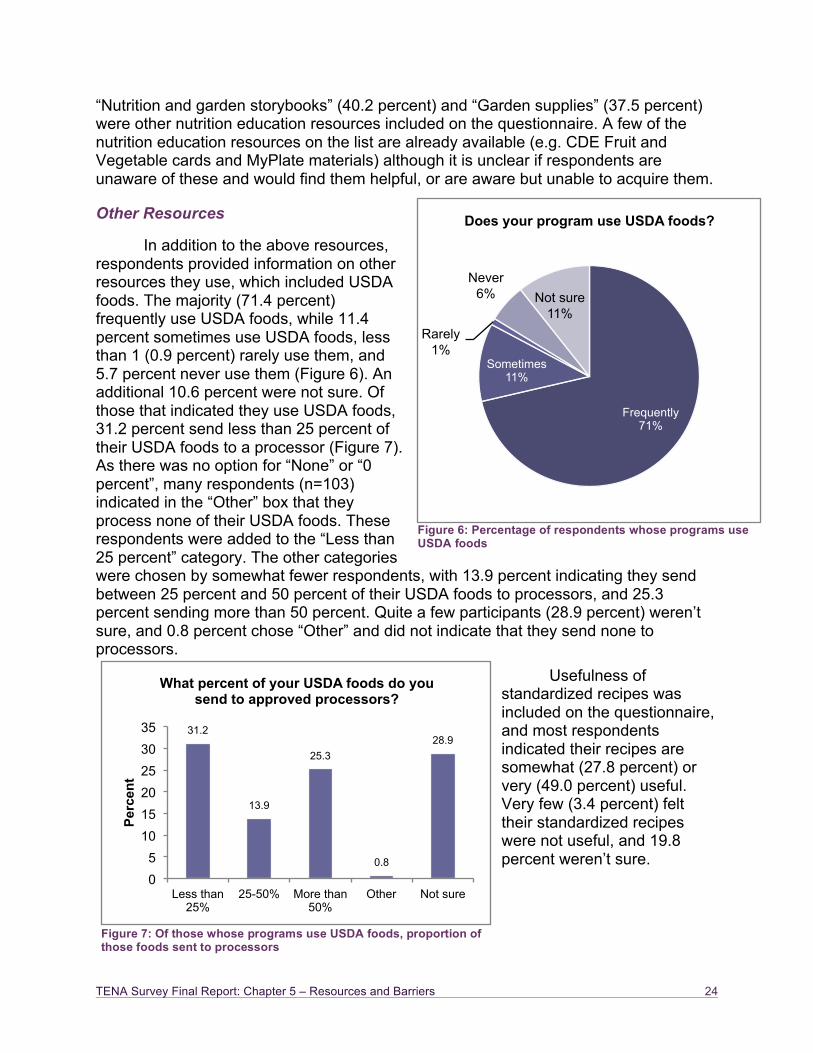
In addition to the above resources, respondents provided information on other resources they use, which included USDA foods. The majority (71.4 percent) frequently use USDA foods, while 11.4 percent sometimes use USDA foods, less than 1 (0.9 percent) rarely use them, and 5.7 percent never use them (Figure 6). An additional 10.6 percent were not sure. Of those that indicated they use USDA foods, 31.2 percent send less than 25 percent of their USDA foods to a processor (Figure 7). As there was no option for “None” or “0 percent”, many respondents (n=103) indicated in the “Other” box that they process none of their USDA foods. These respondents were added to the “Less than 25 percent” category. The other categories were chosen by somewhat fewer respondents, with 13.9 percent indicating they send between 25 percent and 50 percent of their USDA foods to processors, and 25.3 percent sending more than 50 percent. Quite a few participants (28.9 percent) weren’t sure, and 0.8 percent chose “Other” and did not indicate that they send none to processors.
Usefulness of standardized recipes was included on the questionnaire, and most respondents indicated their recipes are somewhat (27.8 percent) or very (49.0 percent) useful. Very few (3.4 percent) felt their standardized recipes were not useful, and 19.8 percent weren’t sure.
Figure 6: Percentage of respondents whose programs use USDA foods
Figure 7: Of those whose programs use USDA foods, proportion of those foods sent to processors
Frequently 71%
Sometimes 11%
Rarely 1%
Never 6% Not sure
11%
Does your program use USDA foods?
31.2
13.9
25.3
0.8
28.9
0 5
10 15 20 25 30 35
Less than 25%
25-50% More than 50%
Other Not sure
Perc
ent
What percent of your USDA foods do you send to approved processors?

TENA Survey Final Report: Chapter 5 – Resources and Barriers 25
Barriers
Lack of funding
When examining what child nutrition programs may need, it is important to address what kinds of barriers they may have. The majority (62.1 percent) indicated that lack of funding has impacted their program, while 23.4 percent stated there was no impact, and 14.6 percent weren’t sure. A follow-up question was asked of those who responded “Yes” to determine how a lack of funding has impacted programs (Figure 8). “Reduction in staff” was the most frequently cited impact, with 69.4 percent, followed by “Less or no scratch cooking is done” (45.4 percent), “Fewer choices offered at meals” (32.9 percent), “Eliminating or not offering snacks” (8.2 percent), and “Eliminating or not offering breakfast” (7.9 percent).
Equipment
For many, lack of equipment is either a minor barrier (24.7 percent) or a major barrier (19.5 percent) to scratch cooking in their kitchens, although 38.5 percent do not consider it to be a barrier, and 11.1 percent were not sure. In addition to lack of equipment, lack of training on available equipment may also limit what is prepared. While many respondents did not indicate this (45.6 percent), it often limits (3.5 percent), sometimes limits (16.0 percent), and rarely limits (22.7 percent) what is prepared.
Barriers to Meal Participation
Low participation in the meal programs can limit revenue. Respondents were asked about perceived barriers to meal participation in their programs (Table 7). The most commonly cited barrier was student preferences, with 66.9 percent respondents choosing either “Major barrier” or “Minor barrier” although most respondents indicated this was minor barrier. This was followed by “Students have poor image of school meals” with 60.5 percent and ”Lack of parent/family support” (49.3 percent). While less than half (45.2 percent) of respondents indicated “Lunch period is too short” is a barrier in their program, this category had the highest percentage of respondents choosing “Major barrier” (18 percent). Other barriers to participation can be found in Table 7.
Figure 8: Impacts of lack of funding by percent of respondents who indicated funding had impacted their program
7.9 8.2
69.4
32.9
45.4
0 10 20 30 40 50 60 70 80
Eliminating or not
offering breakfast
Eliminating or not
offering snacks
Reduction in staff
Fewer choices
offered at meals
Less or no scratch
cooking is done
Perc
ent
How has lack of funding impacted your program?

TENA Survey Final Report: Chapter 5 – Resources and Barriers 26
Overall, compared to directors from medium (2,500-9,999 students), and large (10,000-39,999 student) districts, directors from very large school districts (> 40,000 students) were more likely to choose “Major barrier” or “Minor barrier”, while directors from small school districts (<2,500 students) were less likely (χ2=15.74-85.48, df=6, p=0.001-0.015).
Table 7: Perceived barriers to meal participation by percent of respondents
Barrier
Major + Minor barrier
(%)
Major barrier
(%)
Minor barrier
(%)
Not a barrier
(%)
Student preferences 66.9 12.2 54.7 33.2
Students have poor image of school meals 60.5 12 48.5 39.5
Lack of parent/family support 49.3 12.8 36.5 50.7
Lunch period is too short 45.2 18 27.2 54.8
Food quality, taste, and/or visual appeal 40.5 6.6 33.9 59.5
Inadequate facilities for serving meals 33 9.8 23.2 67
Inadequate dining facilities for students 32.6 11.1 21.5 67.4
Inadequate facilities for meal preparation 30.9 11.7 19.2 69.1
Stigma associated with free- and reduced-price meals 30.6 6 24.6 69.4
Lack of administrative support 30.5 7.3 23.2 69.5
Competition from nearby meal vendors 26.6 8.5 18.1 73.5
TENA Survey Final Report: Chapter 6 – Professional Development 27
Chapter 6 – Professional Development The HHFKA, Section 306, requires USDA to develop professional development
standards for school food service personnel. USDA expects to release the final rule during the 2013-2014 school year. At the time of the survey, little information was available on the potential federal standards.
Interest in Promotion and Professional Development
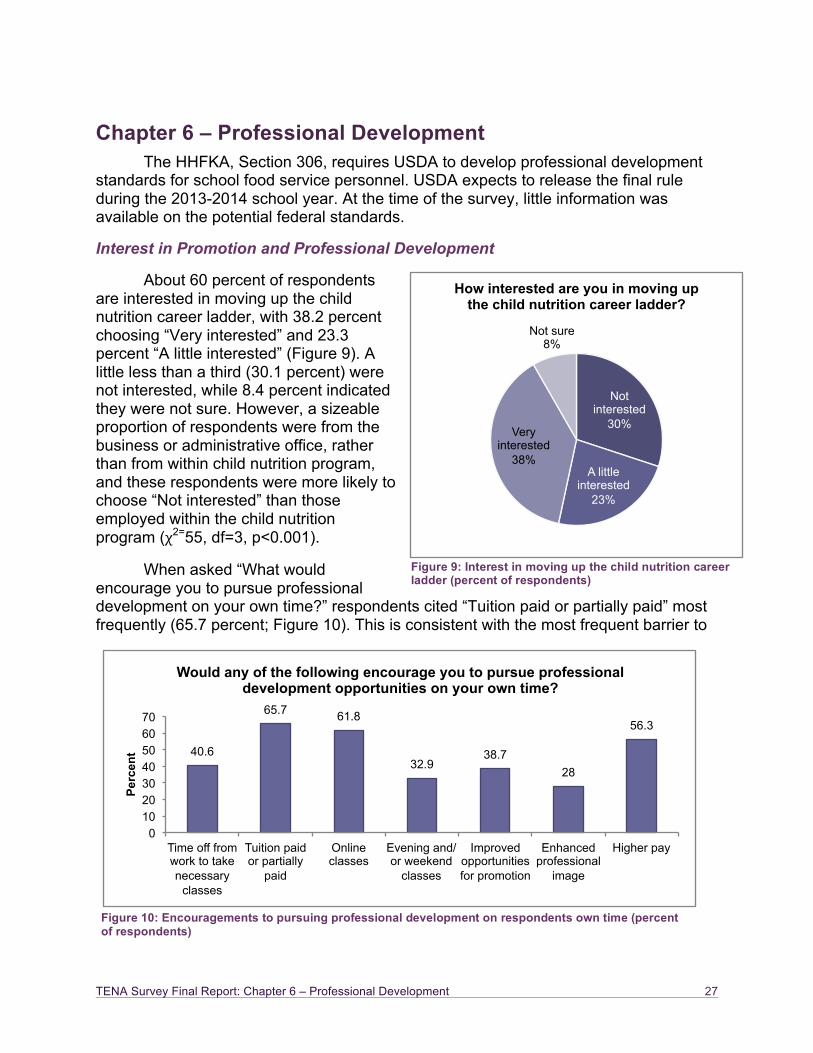
About 60 percent of respondents are interested in moving up the child nutrition career ladder, with 38.2 percent choosing “Very interested” and 23.3 percent “A little interested” (Figure 9). A little less than a third (30.1 percent) were not interested, while 8.4 percent indicated they were not sure. However, a sizeable proportion of respondents were from the business or administrative office, rather than from within child nutrition program, and these respondents were more likely to choose “Not interested” than those employed within the child nutrition program (χ2=55, df=3, p<0.001).
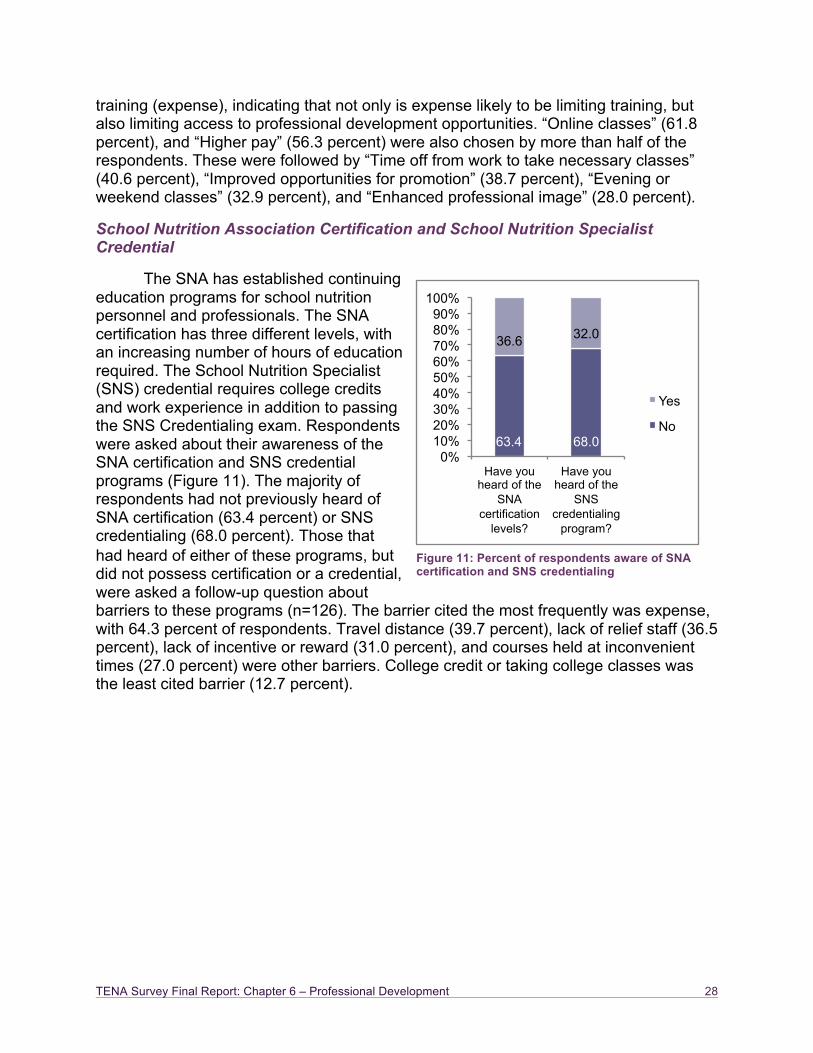
When asked “What would encourage you to pursue professional development on your own time?” respondents cited “Tuition paid or partially paid” most frequently (65.7 percent; Figure 10). This is consistent with the most frequent barrier to
Figure 9: Interest in moving up the child nutrition career ladder (percent of respondents)
Figure 10: Encouragements to pursuing professional development on respondents own time (percent of respondents)
Not interested
30%
A little interested
23%
Very interested
38%
Not sure 8%
How interested are you in moving up the child nutrition career ladder?
40.6
65.7 61.8
32.9 38.7
28
56.3
0 10 20 30 40 50 60 70
Time off from work to take necessary
classes
Tuition paid or partially
paid
Online classes
Evening and/or weekend
classes
Improved opportunities for promotion
Enhanced professional
image
Higher pay
Perc
ent
Would any of the following encourage you to pursue professional development opportunities on your own time?
TENA Survey Final Report: Chapter 6 – Professional Development 28
training (expense), indicating that not only is expense likely to be limiting training, but also limiting access to professional development opportunities. “Online classes” (61.8 percent), and “Higher pay” (56.3 percent) were also chosen by more than half of the respondents. These were followed by “Time off from work to take necessary classes” (40.6 percent), “Improved opportunities for promotion” (38.7 percent), “Evening or weekend classes” (32.9 percent), and “Enhanced professional image” (28.0 percent).
School Nutrition Association Certification and School Nutrition Specialist Credential
The SNA has established continuing education programs for school nutrition personnel and professionals. The SNA certification has three different levels, with an increasing number of hours of education required. The School Nutrition Specialist (SNS) credential requires college credits and work experience in addition to passing the SNS Credentialing exam. Respondents were asked about their awareness of the SNA certification and SNS credential programs (Figure 11). The majority of respondents had not previously heard of SNA certification (63.4 percent) or SNS credentialing (68.0 percent). Those that had heard of either of these programs, but did not possess certification or a credential, were asked a follow-up question about barriers to these programs (n=126). The barrier cited the most frequently was expense, with 64.3 percent of respondents. Travel distance (39.7 percent), lack of relief staff (36.5 percent), lack of incentive or reward (31.0 percent), and courses held at inconvenient times (27.0 percent) were other barriers. College credit or taking college classes was the least cited barrier (12.7 percent).
Figure 11: Percent of respondents aware of SNA certification and SNS credentialing
63.4 68.0
36.6 32.0
0% 10% 20% 30% 40% 50% 60% 70% 80% 90%
100%
Have you heard of the
SNA certification
levels?
Have you heard of the
SNS credentialing
program?
Yes
No

TENA Survey Final Report: Chapter 7 – Discussion and Conclusions 29
Chapter 7 – Discussion and Conclusions California’s child nutrition programs serve millions of meals every day to children
and youth, while following numerous state and federal regulations. In order to support the personnel who work in these programs, the CDE plans to target its limited resources to the trainings and resources the SFAs say they need the most. This survey served as a tool to determine their needs and the findings of the survey helped the TENA Committee prioritize the needs into a five-year plan for the CDE to address.
When reviewing the results of this survey, it becomes very clear that personnel in California’s child nutrition programs feel they need training, resources, and technical assistance in a variety of areas. The training areas most needed are:
• The Final Rule on Meal Patterns and Nutrition Standards (all respondents) • Nutrition, health, and wellness (all respondents) • Program management (directors and managers) • Planning, preparing, and serving meals (staff) • Communication and marketing (staff)
Over the last several years, there has been an increasing focus on the school environment as a vehicle for attenuating the rise in childhood obesity. The HHFKA was passed as a reflection of this, and it is understandable that the changes to meal patterns and nutrition standards was one of the top training areas, as was nutrition, health, and wellness. School wellness extends beyond the meal programs into all aspects of the school environment. Larger initiatives, such as the Let’s Move! campaign, HealthierUS School Challenge, and Team California for Healthy Kids campaign encourage schools to meet the challenge of improving the health of children.
Among the popular resources were user-friendly access to information about training and a method for sharing best practices. There is a wealth of resources and information available to schools; what may be needed is a convenient conduit for child nutrition programs to access this information. This could also reasonably be extrapolated to include easy access to information about nutrition and wellness in child nutrition programs, which was another area in which respondents indicated high interest. However, focus groups should be considered in order to fully illuminate detailed training needs in this area. For example, a large number of respondents indicated they needed training in “special dietary needs”. Depending on the respondent, this could mean they want general information about special dietary needs, or it could mean they would like more specific training – what are the special dietary needs that they are required to accommodate, what foods they can procure cost-effectively, and how do they need to be prepared. As the majority of respondents were directors and managers, many of the training topics that were ranked as highly needed were related to program management, including managing employees and procurement. Respondents felt the need for training on a variety of topics, including training employees. There are several barriers to training child nutrition program staff. Staff are much less willing to travel to obtain training, and are less willing to participate in internet-based training compared to

TENA Survey Final Report: Chapter 7 – Discussion and Conclusions 30
directors and managers. In addition, there is also the barrier of lack of access to the internet at work. While administering this survey, several directors requested paper copies of the survey for their staff due to lack of staff internet access. It stands to reason that lack of internet access would also be an issue for access to internet-based training. These are barriers that will need to be overcome or circumvented in order to provide staff with the training they need.
In addition to the barriers to training staff, there are the barriers to training in general. Expense and travel distance are not only barriers to obtaining training, they are also barriers to providing it. In-person training classes and workshops are the preferred training format, however, it is impractical to offer all training this way. Prioritizing which training areas should be taught as face-to-face courses will necessitate taking into account several factors, the most important of which should be the content. Skill building requires hands-on practice, while other content may be more easily taught via distance education. Despite this, the survey gathered valuable information on how to tailor training to encourage participants to attend. For example, weekdays, especially Tuesday through Thursday, are preferred for training. The preferred length of in-person trainings could present some difficulties, as a slight majority preferred training to be one to three hours in length. This would necessitate a greater number of training sessions to cover the same material compared to day-long or multiple-day classes, which would likely increase travel expenses. However, it would allow time for study and review between sessions, which may be beneficial for retention.
The survey illuminates the perceived needs and preferences of child nutrition program directors, managers, and staff, and provides valuable information in guiding the development of training courses and the overall plan for providing trainings and resources. However, there are some limitations to this study. While the survey team attempted to be as clear as possible, not all questions may have been interpreted as intended. Furthermore, as the survey was sent to the contact person on record for the NSLP sponsor, it was then up to this person to disseminate the survey to all personnel in the child nutrition program. As a result, the sample of staff that responded to the survey was quite small and unlikely to be representative, and the survey team instead used director and manager perceptions to determine staff needs, rather than data from staff directly. In addition, respondents to the survey may have been more likely to be highly motivated and interested in training, compared to those that did not respond. Despite this, the survey has several strengths. The sample size was quite large and included respondents from every county in California. The survey methodology utilized several techniques designed to increase response rate, and by using email and standard mail to recruit participants, the survey appealed to both those that respond better to email, and to those that respond better to standard mail. Overall, the survey team is confident that the findings of this survey will be of use in developing training programs that meet the needs of child nutrition programs in California.

TENA Survey Final Report – Appendix A 31
Appendices A. Questionnaire As#this#was#an#online#survey,#the#following#is#the#list#of#questions#asked#of#respondents,#rather#than#an#exact#replica#of#the#online#questionnaire.#Please#note#that#Questions#3#and#4#were#used#to#determine#skip#patterns#for#the#online#survey.#Job#title#(question#3)#determined#what#questions#were#asked#of#the#respondent#(e.g.#line#workers#did#not#see#questions#intended#for#directors),#and#site#type#(question#4)#determined#if#questions#refer#to#site#or#district#(e.g#many#questions#have#“site/district”#in#the#question.#Respondents#saw#“site”#or#“district”#depending#whichever#was#most#appropriate#for#them).#Boxes#that#state#for#whom#the#question#was#intended#(e.g.#“All#respondents”)#are#for#review#purposes#only#and#were#not#included#on#the#survey#itself.##
First,#we’d#like#to#ask#some#questions#about#your#work#site#or#district.##!1.#What#is#the#name#of#the#school#district#or#agency#in#which#you#work?#____________________________!!2.#In#what#county#is#[school#district#or#agency]?#____________________________!!3.#What#type#of#site#do#you#work#at?##
School!site! Central!production! District!office! Residential!child!care!institution!(RCCI)! Other!–!Please!describe!
!4.#What#grade#levels#are#the#students#at#your#site/district?#(Please'choose'all'that'apply'to'your'site'or'district.)'
There!are!no!students!at!my!site!! Pre@kindergarten! Kindergarten! Grade!1! Grade!2! Grade!3! Grade!4! Grade!5! Grade!6! Grade!7! Grade!8! Grade!9! Grade!10! Grade!11! Grade!12! Other!@@@!Please!describe! Not!sure! Prefer!not!to!answer!
!!!!# #
All#respondents#–#Required##
All#respondents#–#Required##
All#respondents#–#Required##
All#respondents#

TENA Survey Final Report – Appendix A 32
5.#What#type#of#food#production#does#your#site/district#use?#(Please'choose'all'that'apply'to'your'site'or'district.)'
Scratch!cooking!(including!speed!scratch!or!quick!scratch)! On@site!food!preparation! Central!production! Satellite/receiving!school! Cook@chill! Other!@@@!Please!describe! Not!sure! Prefer!not!to!answer!
#6.#What#is#your#job#title?!!
Central!kitchen!line!worker!or!substitute!! School!site!line!worker!or!substitute! Food!service!director!or!assistant!director! Nutrition!specialist! Regional!manager! Regional!supervisor! Central!kitchen!manager! Central!kitchen!area!lead!or!supervisor! Site!lead!or!supervisor! Equipment!maintenance!supervisor! Delivery!driver! Other!–!Please!describe!
#7.#What#is#the#total#number#of#staff#employed#in#your#district’s#child#nutrition#operation?##(Please'choose'only'one.)#
Less!than!5! 6@10! 11@25! 26@50! 51@100! 101@250! More!than!250! Not!sure! Prefer!not!to!answer!
!8.#How#many#students#are#enrolled#in#your#district?##(Please'choose'only'one.)#
Under!2,500! 2,500@9,999! 10,000@39,999! 40,000!or!more! Not!sure!! Prefer!not!to!answer!
!9.###Does#your#school#district#provide#snacks#or#meals#to#an#After#School#Program?##
Yes! ! ! ! ! ! ! ! ! ! ! No! Not!sure! Prefer!not!to!answer!
!# #
All#respondents#–#Required##
Directors#only#
Directors#only#
All#respondents#
Directors#only#
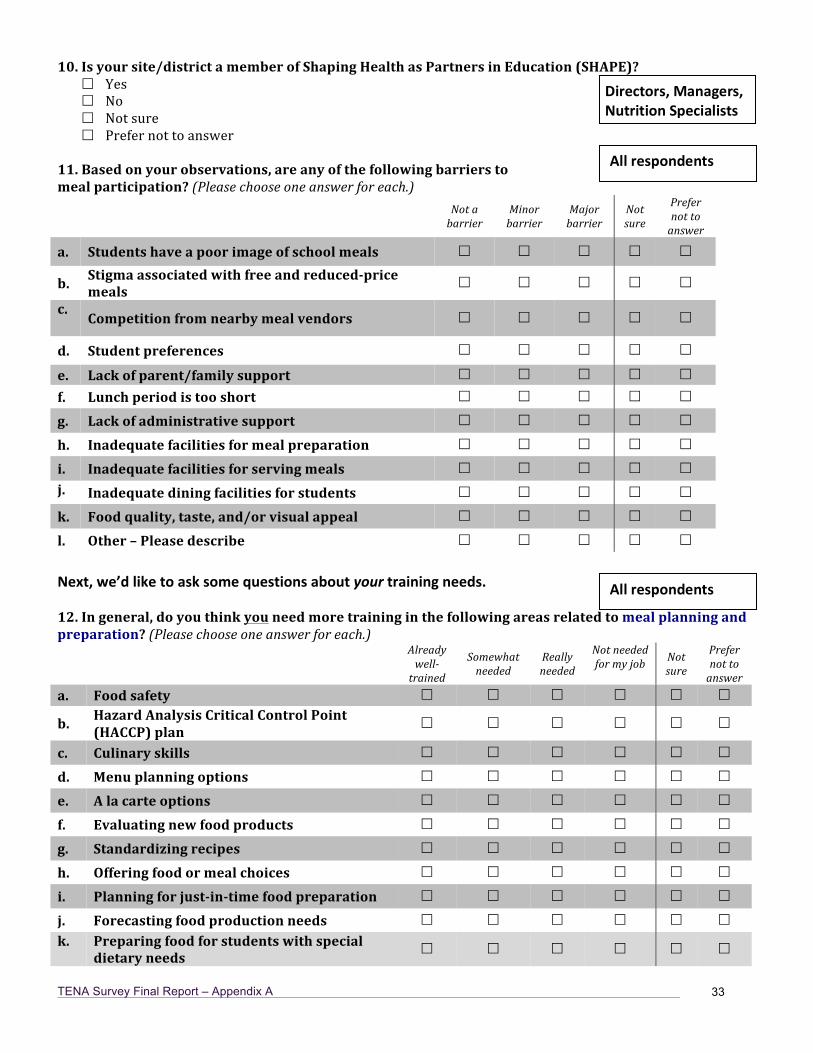
TENA Survey Final Report – Appendix A 33
10.#Is#your#site/district#a#member#of#Shaping#Health#as#Partners#in#Education#(SHAPE)?# Yes! No! Not!sure! Prefer!not!to!answer!
!11.#Based#on#your#observations,#are#any#of#the#following#barriers#to##meal#participation?#(Please'choose'one'answer'for'each.)## # Not'a'
barrier'Minor'barrier'
Major'barrier'
Not'sure'
Prefer'not'to'answer'
a.# Students#have#a#poor#image#of#school#meals# ! ! ! ! !
b.# Stigma#associated#with#free#and#reducedUprice#meals# ! ! ! ! !
c.## Competition#from#nearby#meal#vendors# ! ! ! ! !
d.# Student#preferences# ! ! ! ! !e.# Lack#of#parent/family#support# ! ! ! ! !f.# Lunch#period#is#too#short# ! ! ! ! !g.# Lack#of#administrative#support# ! ! ! ! !h.## Inadequate#facilities#for#meal#preparation# ! ! ! ! !i.# Inadequate#facilities#for#serving#meals# ! ! ! ! !j.# Inadequate#dining#facilities#for#students# ! ! ! ! !k.# Food#quality,#taste,#and/or#visual#appeal# ! ! ! ! !l.# Other#–#Please#describe# ! ! ! ! !#Next,#we’d#like#to#ask#some#questions#about#your#training#needs.!#12.#In#general,#do#you#think#you#need#more#training#in#the#following#areas#related#to#meal#planning#and#preparation?#(Please'choose'one'answer'for'each.)#
# #Already'well<'trained'
Somewhat'needed'
Really'needed'
Not'needed'for'my'job' Not'
sure'
Prefer'not'to'answer'
a.# Food#safety# ! ! ! ! ! !
b.# Hazard#Analysis#Critical#Control#Point#(HACCP)#plan# ! ! ! ! ! !
c.# Culinary#skills# ! ! ! ! ! !d.# Menu#planning#options# ! ! ! ! ! !e.# A#la#carte#options# ! ! ! ! ! !f.# Evaluating#new#food#products# ! ! ! ! ! !g.# Standardizing#recipes# ! ! ! ! ! !h.# Offering#food#or#meal#choices# ! ! ! ! ! !i.# Planning#for#justUinUtime#food#preparation# ! ! ! ! ! !j.# Forecasting#food#production#needs# ! ! ! ! ! !k.# Preparing#food#for#students#with#special#
dietary#needs# ! ! ! ! ! !# #
All#respondents#
All#respondents#
Directors,#Managers,#Nutrition#Specialists#

TENA Survey Final Report – Appendix A 34
12#continued.#In#general,#do#you#think#you#need#more#training#in#the#following##areas#related#to#meal#planning#and#preparation?#(Please'choose'one'answer'for'each.)#l.# Cooking/food#preparation# ! ! ! ! ! !m.# Controlling#portion#sizes# ! ! ! ! ! !
n.# Planning#reimbursable#meals#that#appeal#to#children# ! ! ! ! ! !
o.# Adjusting#standardized#recipes#for#quantities#needed# ! ! ! ! ! !
p.# Incorporating#cultural#foods#into#school#meals# ! ! ! ! ! !
q.# Scratch#cooking#(including#speed#scratch#or#quick#scratch)# ! ! ! ! ! !
r.# Implementation#of#salad#bars# ! ! ! ! ! !
s.# Use#of#USDA#foods#(commodities)# ! ! ! ! ! !
t.# Preparing#plantUbased#meals# ! ! ! ! ! !
u.# Planning#for#use#of#regional#produce# ! ! ! ! ! !
v.# Planning#for#use#of#seasonal#produce# ! ! ! ! ! !
w.# Meal#crediting## ! ! ! ! ! ! 13.#Do#you#think#you#need#additional#training#in#the#following#areas##related#to#child#health?#(Please'choose'one'answer'for'each.)#
# #Already'well<'trained'
Somewhat'needed'
Really'needed'
Not'needed'for'my'job' Not'
sure'
Prefer'not'to'answer'
a.# Food#allergies#or#intolerances#in#children# ! ! ! ! ! !
b.# Childhood#obesity# ! ! ! ! ! !
c.# Type#2#diabetes# ! ! ! ! ! !
d.# Basic#nutrition#principles# ! ! ! ! ! !
e.# Current#nutrition#issues# ! ! ! ! ! !f.# Child#nutrition# ! ! ! ! ! !
g.# Special#dietary#needs# ! ! ! ! ! !
h.# Vegetarianism# ! ! ! ! ! !
i.# Other#–#Please#describe# ! ! ! ! ! !########## #
All#respondents#
All#respondents#

TENA Survey Final Report – Appendix A 35
14.#Do#you#think#you#need#additional#training#in#areas#related#to##program#management?#(Please'choose'one'answer'for'each.)## # Already'
well<'trained'
Somewhat'needed'
Really'needed'
Not'needed'for'my'job' Not'
sure'
Prefer'not'to'answer'
a.# Using#USDA#Foods#(commodities)#to#costUeffectively#enhance#school#menus# ! ! ! ! ! !
b.# Budgeting# ! ! ! ! ! !c.# Cost#control# ! ! ! ! ! !d.# Grant#writing# ! ! ! ! ! !e.# Staff#productivity#analysis# ! ! ! ! ! !f.# Fiscal#management# ! ! ! ! ! !g.# Equity#in#school#lunch#pricing# ! ! ! ! ! !h.# Revenue#from#nonUprogram#food# ! ! ! ! ! !i.# Indirect#costs# ! ! ! ! ! !
j.# Eligibility/Meal#applications/Direct#certification# ! ! ! ! ! !
k.# Verification#of#meal#applications# ! ! ! ! ! !
l.# Disaster#plan#development#and#implementation## ! ! ! ! ! !
m.# Site#monitoring# ! ! ! ! ! !n.# Waste#management# ! ! ! ! ! !o.# Policy#development# ! ! ! ! ! !p.# Menu#production#records# ! ! ! ! ! !q.# Transport#records# ! ! ! ! ! !
r.# Writing#bids#for#procurement# ! ! ! ! ! !
s.# Equipment#procurement# ! ! ! ! ! !t.# Procurement#of#food#and#supplies# ! ! ! ! ! !
u.# Procurement#of#regional#produce# ! ! ! ! ! !
v.# Procurement#of#seasonal#produce# ! ! ! ! ! !w.# Writing#specifications#for#fresh#fruits#and#
vegetables# ! ! ! ! ! !
x.# Food#specifications/CN#labels# ! ! ! ! ! !y.# Competitive#foods#and#beverage#sales# ! ! ! ! ! !
z.# Access#to#free#drinkable#water# ! ! ! ! ! !aa.# Breakfast#implementation#or#expansion# ! ! ! ! ! !bb.# Seamless#Summer#Feeding#option# ! ! ! ! ! !cc.# After#School#Program#snacks#and#meals# ! ! ! ! ! !dd.# Training#specific#to#Residential#Child#Care#
Institutions#(RCCIs)# ! ! ! ! ! !##
Directors,#Managers#

TENA Survey Final Report – Appendix A 36
##15.#Thinking#about#the#new#proposed#meal#pattern#requirements#in#the#USDA#Proposed#Rule#on#Nutrition#Standards#in#the#National#School#Lunch#and#School#Breakfast#Programs,#do#you#think#you#need#training#in#any#of#the#following#areas?#(Please'choose'one'answer'for'each.)#
# #Already'well<'trained'
Somewhat'needed'
Really'needed'
Not'needed'for'my'job' Not'
sure'
Prefer'not'to'answer'
a.# Menu#planning#to#meet#the#new#meal#patterns# ! ! ! ! ! !
b.##
Increasing#dark#green#and#orange#vegetables#in#school#menus# ! ! ! ! ! !
c.# Increasing#whole#grains#in#school#menus# ! ! ! ! ! !
d.# Increasing#dry#beans#and#peas#in#school#menus# ! ! ! ! ! !
e.##
Implementing#foodUbased#approach#in#menu#planning# ! ! ! ! ! !
f.# Planning#costUeffective#menus#that#meet#the#new#requirements# ! ! ! ! ! !
g.##
Meeting#calorie#limits,#reducing#saturated#fat,#and#eliminating#trans#fat#in#school#menus# ! ! ! ! ! !
h.##
Offer#vs.#Serve#crediting#to#meet#the#new#meal#pattern#requirements# ! ! ! ! ! !
i.# Reducing#sodium#(salt)#in#meals#while#maintaining#flavor# ! ! ! ! ! !
j.##
Providing#meals#in#After#School#Programs#! ! ! ! ! !
###16.#Do#you#think#you#need#additional#training#in#the#following#areas##related#to#managing#staff?#(Please'choose'one'answer'for'each.)## # Already'
well<'trained'
Somewhat'needed'
Really'needed'
Not'needed'for'my'job' Not'
sure'
Prefer'not'to'answer'
a.# Leadership# ! ! ! ! ! !b.# Team#building# ! ! ! ! ! !
c.# Communicating#effectively#with#workers# ! ! ! ! ! !
d.# Evaluating#onUtheUjob#performance#of#workers# ! ! ! ! ! !
e.# Training#employees# ! ! ! ! ! !f.# Managing#stressful#situations#at#work# ! ! ! ! ! !g.# Developing#employee#work#schedules# ! ! ! ! ! !h.# Teaching#strategies#for#adult#learners# ! ! ! ! ! !i.# Work#simplification# ! ! ! ! ! !!# #
Directors,#Managers#
All#respondents#

TENA Survey Final Report – Appendix A 37
17.#Do#you#think#you#need#additional#training#in#the#following#areas##related#to#communication#and#marketing?#(Please'choose'one'answer'for'each.)#
# #Already'well<'trained'
Somewhat'needed'
Really'needed'
Not'needed'for'my'job'
Not'sure'
Prefer'not'to'answer'
a.# Working#effectively#with#school#administrators#and#teachers# ! ! ! ! ! !
b.# Working#effectively#with#vendors# ! ! ! ! ! !c.##
Working#effectively#with#approved#USDA#processors# ! ! ! ! ! !
d.# Working#effectively#with#after#school#program#staff# ! ! ! ! ! !
e.# Customer#service# ! ! ! ! ! !f.# Communicating#with#parent#organizations# ! ! ! ! ! !
g.# Working#with#the#press# ! ! ! ! ! !
h.# Making#presentations#to#the#school#board# ! ! ! ! ! !i.##
Marketing#school#meal#programs#to#parents#and#students# ! ! ! ! ! !
j.# Public#relations#strategies# ! ! ! ! ! !
k.# Marketing#healthy#meal#choices# ! ! ! ! ! !##18.#Do#you#think#you#need#additional#training#in#the#following#areas##related#to#school#wellness#and#nutrition#education?#(Please'choose'one'answer'for'each.)#
# #Already'well<'trained'
Somewhat'needed'
Really'needed'
Not'needed'for'my'job'
Not'sure'
Prefer'not'to'answer'
a.# Coordinating#the#school#meal#programs#with#classroom#study#themes# ! ! ! ! ! !
b.# Teaching#nutrition#to#students# ! ! ! ! ! !
c.# Promoting#a#healthy#school#environment# ! ! ! ! ! !
d.# Identifying#the#relationship#between#school#wellness#policy#and#school#meals# ! ! ! ! ! !
e.# Identifying#the#role#of#the#school#meal#program#in#coordinated#school#health# ! ! ! ! ! !
f.# Employee#wellness# ! ! ! ! ! !
g.# Developing#a#strong#wellness#policy# ! ! ! ! ! !
h.# FarmUtoUSchool#programs# ! ! ! ! ! !
i.# Extending#wellness#efforts#to#after#school#programs# ! ! ! ! ! !
## #
All#respondents#
All#respondents#

TENA Survey Final Report – Appendix A 38
Next,#we’d#like#to#ask#some#questions#about#the#training#needs#of#your#staff.#
19.#In#general,#do#you#think#most#of#your#staff#need#additional#training##in#the#following#areas#related#to#meal#planning#and#preparation?##(Please'choose'one'answer'for'each.)#
# #Already'well<'trained'
Somewhat'needed'
Really'needed'
Not'part'of'staff'responsibilities'
Not'sure'
Prefer'not'to'answer'
a.# Food#safety# ! ! ! ! ! !
b.# Hazard#Analysis#Critical#Control#Point#(HACCP)#plan# ! ! ! ! ! !
c.# Culinary#skills# ! ! ! ! ! !d.# Menu#planning#options# ! ! ! ! ! !e.# A#la#carte#options# ! ! ! ! ! !f.# Evaluating#new#food#products# ! ! ! ! ! !g.# Standardizing#recipes# ! ! ! ! ! !h.# Offering#food#or#meal#choices# ! ! ! ! ! !i.# Planning#for#justUinUtime#food#preparation# ! ! ! ! ! !j.# Forecasting#food#production#needs# ! ! ! ! ! !k.# Preparing#food#for#students#with#special#
dietary#needs# ! ! ! ! ! !
l.# Cooking/food#preparation# ! ! ! ! ! !m.# Controlling#portion#sizes# ! ! ! ! ! !
n.# Planning#reimbursable#meals#that#appeal#to#children# ! ! ! ! ! !
o.# Adjusting#standardized#recipes#for#quantities#needed# ! ! ! ! ! !
p.# Incorporating#cultural#foods#into#school#meals# ! ! ! ! ! !
q.# Scratch#cooking#(including#speed#scratch#or#quick#scratch)# ! ! ! ! ! !
r.# Implementation#of#salad#bars# ! ! ! ! ! !
s.# Use#of#USDA#foods#(commodities)# ! ! ! ! ! !
t.# Preparing#plantUbased#meals# ! ! ! ! ! !
u.# Planning#for#use#of#regional#produce# ! ! ! ! ! !
v.# Planning#for#use#of#seasonal#produce# ! ! ! ! ! !
w.# Meal#crediting# ! ! ! ! ! !
Directors,#Managers#
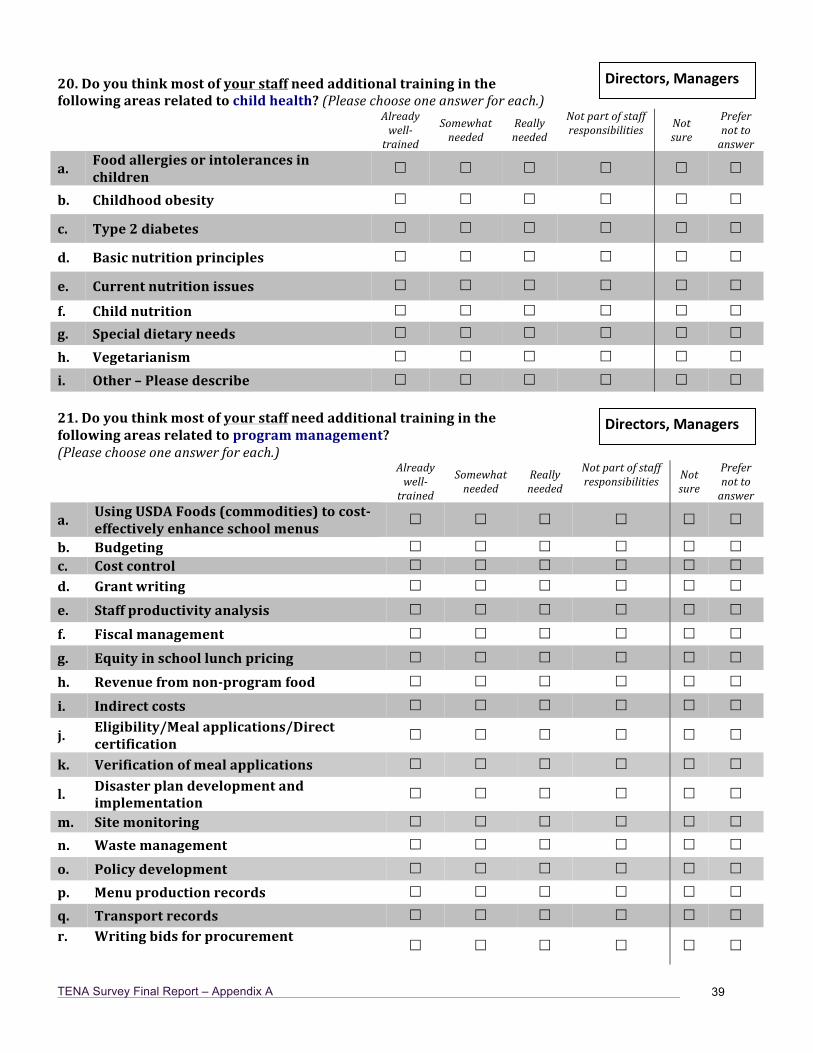
TENA Survey Final Report – Appendix A 39
20.#Do#you#think#most#of#your#staff&need#additional#training#in#the##following#areas#related#to#child#health?#(Please'choose'one'answer'for'each.)
# #Already'well<'trained'
Somewhat'needed'
Really'needed'
Not'part'of'staff'responsibilities' Not'
sure'
Prefer'not'to'answer'
a.# Food#allergies#or#intolerances#in#children# ! ! ! ! ! !
b.# Childhood#obesity# ! ! ! ! ! !
c.# Type#2#diabetes# ! ! ! ! ! !
d.# Basic#nutrition#principles# ! ! ! ! ! !
e.# Current#nutrition#issues# ! ! ! ! ! !f.# Child#nutrition# ! ! ! ! ! !g.# Special#dietary#needs# ! ! ! ! ! !h.# Vegetarianism# ! ! ! ! ! !i.# Other#–#Please#describe# ! ! ! ! ! !#21.#Do#you#think#most#of#your#staff&need#additional#training#in#the##following#areas#related#to#program#management?##(Please'choose'one'answer'for'each.)## # Already'
well<'trained'
Somewhat'needed'
Really'needed'
Not'part'of'staff'responsibilities' Not'
sure'
Prefer'not'to'answer'
a.# Using#USDA#Foods#(commodities)#to#costUeffectively#enhance#school#menus# ! ! ! ! ! !
b.# Budgeting# ! ! ! ! ! !c.# Cost#control# ! ! ! ! ! !d.# Grant#writing# ! ! ! ! ! !e.# Staff#productivity#analysis# ! ! ! ! ! !f.# Fiscal#management# ! ! ! ! ! !g.# Equity#in#school#lunch#pricing# ! ! ! ! ! !h.# Revenue#from#nonUprogram#food# ! ! ! ! ! !i.# Indirect#costs# ! ! ! ! ! !
j.# Eligibility/Meal#applications/Direct#certification# ! ! ! ! ! !
k.# Verification#of#meal#applications# ! ! ! ! ! !
l.# Disaster#plan#development#and#implementation## ! ! ! ! ! !
m.# Site#monitoring# ! ! ! ! ! !n.# Waste#management# ! ! ! ! ! !o.# Policy#development# ! ! ! ! ! !p.# Menu#production#records# ! ! ! ! ! !q.# Transport#records# ! ! ! ! ! !r.# Writing#bids#for#procurement#
! ! ! ! ! !
# #
Directors,#Managers#
Directors,#Managers#

TENA Survey Final Report – Appendix A 40
21#continued.#Do#you#think#most#of#your#staff&need#additional#training#in#the##following#areas#related#to#program#management?##s.# Equipment#procurement# ! ! ! ! ! !t.# Procurement#of#food#and#supplies# ! ! ! ! ! !
u.# Procurement#of#regional#produce# ! ! ! ! ! !v.# Procurement#of#seasonal#produce# ! ! ! ! ! !w.# Writing#specifications#for#fresh#fruits#and#
vegetables# ! ! ! ! ! !
x.# Food#specifications/CN#labels# ! ! ! ! ! !
y.# Competitive#foods#and#beverage#sales# ! ! ! ! ! !
z.# Access#to#free#drinkable#water# ! ! ! ! ! !
aa.# Breakfast#implementation#or#expansion# ! ! ! ! ! !
bb.# Seamless#Summer#Feeding#option# ! ! ! ! ! !
cc.# After#School#Program#snacks#and#meals# ! ! ! ! ! !
dd.# Training#specific#to#Residential#Child#Care#Institutions#(RCCIs)# ! ! ! ! ! !
#22.#Thinking#about#the#new#proposed#meal#pattern#requirements#in##the#USDA#Proposed#Rule#on#Nutrition#Standards#in#the#National##School#Lunch#and#School#Breakfast#Programs,#do#you#think#most#of##your#staff#need#training#in#any#of#the#following#areas?##(Please'choose'one'answer'for'each.)#
# #Already'well<'trained'
Somewhat'needed'
Really'needed'
Not'part'of'staff'responsibilities' Not'
sure'
Prefer'not'to'answer'
a.# Menu#planning#to#meet#the#new#meal#patterns# ! ! ! ! ! !
b.##
Increasing#dark#green#and#orange#vegetables#in#school#menus# ! ! ! ! ! !
c.# Increasing#whole#grains#in#school#menus# ! ! ! ! ! !
d.# Increasing#dry#beans#and#peas#in#school#menus# ! ! ! ! ! !
e.##
Implementing#foodUbased#approach#in#menu#planning# ! ! ! ! ! !
f.# Planning#costUeffective#menus#that#meet#the#new#requirements# ! ! ! ! ! !
g.##
Meeting#calorie#limits,#reducing#saturated#fat,#and#eliminating#trans#fat#in#school#menus#
! ! ! ! ! !
h.##
Offer#vs.#Serve#crediting#to#meet#the#new#meal#pattern#requirements# ! ! ! ! ! !
i.# Reducing#sodium#(salt)#in#meals#while#maintaining#flavor# ! ! ! ! ! !
j.##
Providing#meals#in#After#School#Programs#! ! ! ! ! !
### #
Directors,#Managers#
Directors,#Managers#

TENA Survey Final Report – Appendix A 41
23.#Do#you#think#most#of#your#staff&need#additional#training#in#the#following##areas#related#to#communication#and#marketing?#(Please'choose'one'answer'for'each.)#
# #Already'well<'trained'
Somewhat'needed'
Really'needed'
Not'part'of'staff'responsibilities' Not'
sure'
Prefer'not'to'answer'
a.# Working#effectively#with#school#administrators#and#teachers# ! ! ! ! ! !
b.# Working#effectively#with#vendors# ! ! ! ! ! !c.##
Working#effectively#with#approved#USDA#processors# ! ! ! ! ! !
d.# Working#effectively#with#after#school#program#staff# ! ! ! ! ! !
e.# Customer#service# ! ! ! ! ! !
f.# Communicating#with#parent#organizations# ! ! ! ! ! !
g.# Working#with#the#press# ! ! ! ! ! !
h.# Making#presentations#to#the#school#board# ! ! ! ! ! !
i.##
Marketing#school#meal#programs#to#parents#and#students# ! ! ! ! ! !
j.# Public#relations#strategies# ! ! ! ! ! !
k.# Marketing#healthy#meal#choices# ! ! ! ! ! !##24.#Do#you#think#most#of#your#staff#need#additional#training#in#the#following##areas#related#to#school#wellness#and#nutrition#education?##(Please'choose'one'answer'for'each.)#
# #Already'well<'trained'
Somewhat'needed'
Really'needed'
Not'part'of'staff'responsibilities' Not'
sure'
Prefer'not'to'answer'
a.# Coordinating#the#school#meal#programs#with#classroom#study#themes# ! ! ! ! ! !
b.# Teaching#nutrition#to#students# ! ! ! ! ! !
c.# Promoting#a#healthy#school#environment# ! ! ! ! ! !
d.# Identifying#the#relationship#between#school#wellness#policy#and#school#meals# ! ! ! ! ! !
e.# Identifying#the#role#of#the#school#meal#program#in#coordinated#school#health# ! ! ! ! ! !
f.# Employee#wellness# ! ! ! ! ! !
g.# Developing#a#strong#Wellness#Policy# ! ! ! ! ! !
h.# FarmUtoUSchool#programs# ! ! ! ! ! !
i.# Extending#wellness#efforts#to#after#school#programs# ! ! ! ! ! !
## #
Directors,#Managers#
Directors,#Managers#

TENA Survey Final Report – Appendix A 42
All#respondents#
These#next#few#questions#are#about#your#training#opinions#and#preferences.##25.#What#is#the#maximum#distance#you#are#willing#to#travel#to#attend#inUperson#trainings?'#(Please'choose'only'one.)#
Less!than!10!miles! 10!to!30!miles! 31@60!miles! 61@100!miles! Over!100!miles! Other!@@@!Please!describe! Not!sure! Prefer!not!to!answer!
#26.#How#often#would#you#be#willing#to#travel#this#distance#to#attend#inUperson#trainings?#
Weekly! Twice!a!month! Monthly! Three!to!four!times!a!year! Twice!a!year! Yearly! Other!@@@!Please!describe! Not!sure! Prefer!not!to!answer!
#27.#Which#one#of#the#following#do#you#think#is#the#best#training#method?#(Please'choose'only'one.)'
Internet@based!(e.g.!online!courses!or!live!or!pre@recorded!webinars)! In@person!workshops!or!training!classes! Conference@based!training! Self@study!workbooks! Video/DVD!instruction! Computer@based!training!that!doesn’t!require!internet!access!(e.g.!DVD@ROM)! Other!@@@!Please!describe! Not!sure! Prefer!not!to!answer!
#28.#Of#the#choices#below,#what#are#all#the#types#of#training#you#would#be#willing#to#participate#in?#(Please'choose'all'that'apply.)'
Internet@based!(e.g.!online!courses!or!live!or!pre@recorded!webinars)!
In@person!workshops!or!training!classes! Conference@based!training! Self@study!workbooks! Video/DVD!instruction! Computer@based!training!that!doesn’t!
require!internet!access!(e.g.!DVD@ROM)! Other!@@@!Please!describe! Not!sure! Prefer!not!to!answer
All#respondents#
All#respondents#
All#respondents#

TENA Survey Final Report – Appendix A 43
!29.#What#do#you#think#is#the#ideal#length#for#inUperson#trainings?'(Please'choose'only'one.)#
Brief!trainings!of!1@3!hours! One@day!trainings! Multiple@day!training! Other!@@@!Please!describe! Not!sure! Prefer!not!to!answer!
!30.#What#do#you#think#is#the#ideal#length#for#InternetUbased#trainings?'(Please'choose'only'one.)#
Less!than!30!minutes! 30!minutes!to!an!hour! Over!an!hour,!but!less!than!two!hours! More!than!two!hours! Other!@@@!Please!describe! Not!sure! Prefer!not!to!answer!
#31.#What#do#you#think#is#the#best#time#of#year#for#inUperson#trainings?#(Please'choose'only'one.)#
During!the!school!year! During!the!summer! Other!@@@!Please!describe! Not!sure! Prefer!not!to!answer!
#32.#What#days#of#the#week#are#best#for#inUperson#trainings?#(Please'choose'all'that'apply.)#
! Mondays! Tuesdays! Wednesdays! Thursdays! Fridays! Saturdays! Sundays! Not!sure! Prefer!not!to!answer!
#33.#Do#any#of#the#following#prevent#you#from#getting#the#training#you#want#or#need?'(Please'choose'all'that'apply.)'
Expense!(i.e.,!cost!of!courses,!and/or!cost!of!travel)! Travel!distance! Lack!of!relief!staff! Courses!are!held!at!inconvenient!times! Other!@@@!Please!describe! Not!sure! Prefer!not!to!answer!
!# #
All#respondents#
All#respondents#
All#respondents#
All#respondents#
All#respondents#

TENA Survey Final Report – Appendix A 44
34.#Trainings#are#often#held#at#a#variety#of#location#types,#for#example,#school#districts,#hotel#meeting#rooms,#or#college#campuses.#Does#the#type#of#location#ever#cause#you#to#not#want#to#attend?##
Never! Sometimes! Often! Prefer!not!to!answer!
!If#sometimes#or#often:#35.#What#types#of#locations#cause#you#to#not#want#to#attend?#(Please'select'all'that'apply.)#
College!or!university!campuses! School!district!meeting!rooms! County!office!of!education!meeting!rooms! School!classrooms! Hotel!meeting!rooms! Other!–!please!describe! Prefer!not!to!answer!
Next#we’d#like#to#ask#some#questions#about#resources,#equipment,#and#technical#assistance.#
36.#Do#you#obtain#funding#for#your#program#from#outside#sources#(such#as#grants,#etc.)?# Yes! No!! Not!sure! Prefer!not!to!answer!
#37.#Does#your#program#use#USDA#Foods#(commodities)#in#your#menus?##
Never! Rarely! Sometimes! Frequently! Not!sure! Prefer!not!to!answer!
#If#Rarely,#Sometimes,#or#Frequently:#38.#What#percent#of#your#USDA#foods#do#you#send#to#approved#processors?#
Less!than!25!percent! 25!percent!to!50!percent! Over!50!percent! Not!sure! Prefer!not!to!answer!
#39.#How#useful#are#your#standardized#recipes?##
Not!useful! Somewhat!useful! Very!useful! Not!sure! Prefer!not!to!answer!
!# #
Directors#only#
All#respondents#
All#respondents#
All#respondents#
All#respondents#

TENA Survey Final Report – Appendix A 45
40.#Is#lack#of#equipment#a#barrier#to#scratch#cooking#in#your#kitchen(s)?## Not!a!barrier! Minor!barrier! Major!barrier! Other!–!Please!describe! Not!sure! Prefer!not!to!answer!
!41.#Does#lack#of#training#on#equipment#in#your#kitchen(s)#limit#what#you#can#prepare?##
Never! Rarely! Sometimes! Often! Not!sure! Prefer!not!to!answer!
42.#Has#lack#of#funding#impacted#your#program?# No! A!little! A!lot! Not!sure! Prefer!not!to!answer!
!43.#If#answered#“A#little”#or#“A#lot”#in#previous#question:#In#what#ways#has#lack#of#funding#impacted#your#program?#(Please'choose'all'that'apply.)!
Eliminating!or!not!offering!breakfast! Eliminating!or!not!offering!snacks! Reduction!in!staff! Fewer!choices!offered!at!meals! Less!or!no!scratch!cooking!is!done! Other!@@@!Please!describe! Not!sure! Prefer!not!to!answer!
!44.#How#helpful#would#you#find#the#following#resources?### # Not'
helpful'Somewhat'helpful'
Really'helpful'
Not'sure'
Prefer'not'to'answer'
a.# Revised#School&Nutrition&Programs&Guidance&Manual#available#online# ! ! ! ! !
b.# Child#Nutrition#Program#Guide#for#new#directors# ! ! ! ! !
c.# Child#nutrition#director#quick#guide#to#frequently#asked#questions# ! ! ! ! !
d.# Searchable#database#of#Management#Bulletins# ! ! ! ! !e.# RegionallyUbased#technical#support#system# ! ! ! ! !f.# Printed#training#materials# ! ! ! ! !g.# Online#directory#of#available#trainings# ! ! ! ! !h.# WebUbased#way#to#share#best#practices# ! ! ! ! !
All#respondents#
All#respondents#
All#respondents#
All#respondents#
All#respondents#
All#respondents#

TENA Survey Final Report – Appendix A 46
44#continued.#How#helpful#would#you#find#the#following#resources?##
i.# Standardized#recipes#aligned#with#new#meal#pattern# ! ! ! ! !
j.# Guide#to#seeking#outside#funding#sources# ! ! ! ! !k.# Guide#to#serving#plantUbased#meals# ! ! ! ! !
l.# Guide#to#After#School#Program#meals# ! ! ! ! !
m.# Other#resource#–#Please#describe# ! ! ! ! !#45.#How#helpful#would#you#find#the#following#resources#to#promote##nutrition#education#in#the#cafeteria#and#the#classroom?### # Not'
helpful'Somewhat'helpful'
Really'helpful'
Not'sure'
Prefer'not'to'answer'
a.# Garden#supplies## ! ! ! ! !b.# Nutrition#and#garden#story#books# ! ! ! ! !
c.# Funding#to#purchase#nutrition#education#curriculum# ! ! ! ! !
d.# Fruit#and#vegetable#cards#(published#by#CDE)# ! ! ! ! !
e.#Nutrition#education#visual#materials#(e.g.#stuffed#fruit#and#vegetable#characters,#test#tubes#with#fat#or#sugar)#
! ! ! ! !
f.# Funding#to#purchase#food#for#experiential#learning#in#both#cafeteria#and#classroom# ! ! ! ! !
g.# Classroom#cooking#supplies#(e.g.#cart,#equipment)# ! ! ! ! !h.# Cafeteria#promotional#materials# ! ! ! ! !
i.# My#Plate#materials# ! ! ! ! !
j.#Funding#for#substitute#pay#to#release#teacher#from#classroom#for#nutrition#education#training#or#curriculum#alignment#assignments#
! ! ! ! !
m.# Other#resource#–#Please#describe# ! ! ! ! !#These#next#few#questions#are#about#professional#development.#Professional#development#is#learning#new#things#in#order#to#obtain#certifications#or#credentials#and/or#move#up#the#career#ladder.###46.#How#interested#are#you#in#moving#up#the#child#nutrition#career#ladder?#
Not!interested! A!little!interested! Very!interested! Not!sure! Prefer!not!to!answer!
## #
All#respondents#
All#respondents#
All#respondents#

TENA Survey Final Report – Appendix A 47
47.#What#would#encourage#you#to#pursue#professional#development##opportunities#on#your#own#time?!Time!off!from!work!to!take!necessary!classes!
Tuition!paid!or!partially!paid! Online!classes! Evening!and/or!weekend!classes! Improved!opportunities!for!promotion! Enhanced!professional!image! Higher!pay! Other!@@@!Please!describe! Not!sure! Prefer!not!to!answer!
!48.#Have#you#heard#of#the#School#Nutrition#Association#(SNA)#certification#levels#(Level#1U3)?##
Yes! No! Prefer!not!to!answer#
#49.#Have#you#heard#of#the#School#Nutrition#Association#School#Nutrition#Specialist#(SNS)#credentialing#program?##
Yes! No! Prefer!not!to!answer#
#If#respondent#answers#“No”#or#“Prefer#not#to#answer”#to#47#and#48,#they#will#skip#to#51.##50.#Which#of#the#following#School#Nutrition#Association#(SNA)#certificates#or#credentials#do#you#hold?(Please'choose'all'that'apply.)#
School!Nutrition!Specialist!(SNS)!Credential! SNA!Level!1!Certification!! SNA!Level!2!Certification!! SNA!Level!3!Certification!! None! Not!sure! Prefer!not!to!answer!
#If#“None”#in#previous#question#51.#Are#any#of#the#following#barriers#to#SNA#certification#or#SNS#credentialing?##(Please'choose'all'that'apply.)!!Travel!distance!
Lack!of!relief!staff! Courses!are!held!at!inconvenient!times! Obtaining!college!credit!or!taking!college!classes! Lack!of!incentive!or!reward! Other!@@@!Please!describe! Not!sure! Prefer!not!to!answer!
!! !
All#respondents#
All#respondents#
All#respondents#
All#respondents#All#respondents#

TENA Survey Final Report – Appendix A 48
Now#we’d#like#to#learn#some#more#about#you.#!52.#How#many#years#have#you#been#in#your#current#position?#!
Less!than!1!year! 1!to!5!years! 6@10!years! 11@15!years! More!than!15!years! Not!sure! Prefer!not!to!answer!
#53.#Are#you#a#member#of#the#California#School#Nutrition#Association?#
Yes! No! Prefer!not!to!answer!
!54.#Do#you#hold#any#of#the#following#certifications,#registrations,#or#credentials?#(Please'choose'all'that'apply.)#
Registered!Dietitian!(RD)! Dietetic!Technician,!Registered!(DTR)! Certified!Dietary!Manager!(CDM)! Dietary!Services!Supervisor!(DSS)! Food!safety!certification!(e.g.!ServSafe,!National!Registry!of!Food!Safety!Professionals,!etc.)! Other!@@@!Please!describe! Not!sure! Prefer!not!to!answer!
#55.#When#do#you#plan#to#retire?#
Within!the!next!year! Between!one!and!five!years!from!now! Between!six!and!10!years!from!now! More!than!10!years!from!now! Not!sure! Prefer!not!to!answer!
#56.#What#is#your#gender?#
Female! Male! Prefer!not!to!answer#
#57.#What#is#the#highest#level#of#education#you#have#achieved?#
Less!than!a!high!school!diploma! High!school!diploma!or!GED!or!equivalent! Some!college!or!technical!school! Associate’s!or!technical!school!degree!or!certificate! Bachelor’s!degree!! Graduate!or!professional!degree!(e.g.!MA,!MBA,!PhD,!etc.)! Not!sure! Prefer!not!to!answer!
!!
All#respondents#
All#respondents#
All#respondents#
All#respondents#
All#respondents#
All#respondents#

TENA Survey Final Report – Appendix A 49
58.#How#old#are#you?# 18@29!years! 30@39!years! 40@49!years! 50@59!years! 60@69!years! 70!years!or!older! Prefer!not!to!answer!
#59.#What#is#your#racial/ethnic#background?#(Please'choose'all'that'apply.)#
African!American! Latino!or!Hispanic! Asian!or!Pacific!Islander! Native!American!or!Alaska!Native! White!or!Caucasian! Other!–!Please!describe! Not!sure! Prefer!not!to!answer!
#
All#respondents#
All#respondents#
All#respondents#
All#respondents#

TENA Survey Final Report – Appendix B 50
B. Communications Initial Contact Letter
October [__], 2011 Dear National School Lunch Program Administrators and Personnel: We are writing to ask for your participation in the Training and Education Needs Assessment (TENA) Survey that the Nutrition Services Division of the California Department of Education is conducting in partnership with the University of California, Davis. We are asking school nutrition program directors, managers, supervisors, staff, and nutrition specialists and residential child care institution staff to let us know your training, resource, and professional development needs. The responses from you, your staff, and colleagues are very important and will help in determining how we can best meet the training needs of school nutrition programs in the state. To make sure we hear from the variety of workers in child nutrition, it is very important you have staff and managers from all levels of your school nutrition program complete the questionnaire. Enclosed is an information flyer you can distribute to staff to encourage them to participate in this important survey. We hope you and your staff are able to complete the questionnaire on the Internet so that we can summarize results quickly and accurately. Doing that is easy; just enter this Web page address in your Internet browser: [http://surveyurl]. We realize that some of you who would like to complete the questionnaire may not have Internet access. To receive questionnaires in the mail, please contact Anna Jones by phone at 916-322-3435 or by e-mail at [email protected] and let us know how many you will need. Participation in this survey is entirely voluntary and all responses will remain confidential. No personally information will be associated with responses in any reports of this data. We appreciate your time and consideration in completing and distributing the flyer and the survey. Please complete the survey by [DATE], 2011. If you have any questions regarding this subject, please contact Anna Jones, Graduate Student Assistant, Nutrition Services Division, by phone at 916-322-3435 or by e-mail at [email protected]. Sincerely, Carol Chase, M.S., R.D. Sheri Zidenberg-Cherr, Ph.D. Nutrition Education Administrator Nutrition Science Specialist Nutrition Services Division Department of Nutrition California Department of Education University of California, Davis CC:mp Enclosures

TENA Survey Final Report – Appendix B 51
First Email (Week 2) Subject: 2011 Training and Education Needs Assessment Survey Dear National School Lunch Program Administrators and Personnel: On October [__], we mailed a letter asking you and your staff to participate in the Training and Education Needs Assessment (TENA) Survey. The California Department of Education is partnering with the University of California, Davis to conduct this survey to determine training, resource, technical assistance, and professional development needs of school nutrition personnel and the best ways to meet these needs. For the survey to be successful, it is critical we hear from not only the Child Nutrition Directors but also your staff at all levels, including managers, supervisors, nutrition specialists, as well as line staff. Please distribute the attached flyer to your staff and encourage them to complete the survey. It will take between 20 and 30 minutes to complete using the Internet and needs to be completed by [DATE], 2011. Here is how you participate in this survey: If you have Internet access, click on the Web page address below or copy and paste the address into your Internet browser!""
#http://surveyurl] If you do not have access to the Internet, you may ask for a hard copy questionnaire from Anna Jones. She is available by phone at 916-322-3435 or by e-mail at [email protected]. Please let her know how many hard copies you will need. We appreciate your time and consideration in completing and distributing the survey. If you have any questions regarding this subject, please contact Anna Jones, Graduate Student Assistant, Nutrition Services Division, by phone at 916-322-3435 or by e-mail at [email protected]. Sincerely, Carol Chase, M.S., R.D. Sheri Zidenberg-Cherr, Ph.D. Nutrition Education Administrator Nutrition Science Specialist Nutrition Services Division Department of Nutrition California Department of Education University of California, Davis CC:mp"

TENA Survey Final Report – Appendix B 52
First reminder email (Week 3) Dear National School Lunch Program Administrators and Personnel: We are following up with a reminder to complete the Training and Education Needs Assessment (TENA) Survey. The TENA survey is an important step in the Nutrition Services Division’s effort to determine the best ways of providing training, professional development, resources, and technical assistance to school nutrition personnel. We requested that you and your staff complete the survey. If you and your program staff have already completed the survey, please accept our sincere thanks. If you and your staff have not yet completed the questionnaire, please do so by [DATE], 2011. To complete the survey, click on the Web page address below or copy and paste the address into your Internet browser.
!"http://surveyurl ] Your participation is important to the survey’s success. If you have any questions regarding this subject, or would like to request hard copies of the survey, please contact Anna Jones, Graduate Student Assistant, Nutrition Services Division, by phone at 916-322-3435 or by e-mail at [email protected]. Sincerely, Carol Chase, M.S., R.D. Sheri Zidenberg-Cherr, Ph.D. Nutrition Education Administrator Nutrition Science Specialist Nutrition Services Division Department of Nutrition California Department of Education University of California, Davis CC:mp

TENA Survey Final Report – Appendix B 53
Final Reminder (Week 4)
Dear National School Lunch Program Administrators and Personnel: We recently e-mailed a link to an Internet questionnaire for the Training and Education Needs Assessment Survey that the Nutrition Services Division of the California Department of Education is conducting in partnership with UC Davis. If you and your program staff have already completed the questionnaire, please accept our sincere thanks. If you and your staff have not yet completed the questionnaire, please do so by [DATE]. We know your time is valuable; however, it is important we hear from you and your staff so that we can better meet your training needs. To complete the questionnaire, click on the web page address below, or copy and paste it into your Internet browser.
!http://surveyurl] Please share this Web address with the appropriate staff in your program. We realize that some of those who would like to complete the questionnaire may not have Internet access. To receive hard copies of the questionnaires via mail, please contact Anna Jones by phone at 916-322-3435 or by e-mail at [email protected]. Thank you in advance for your help. If you have any questions regarding this subject, please contact Anna Jones, Graduate Student Assistant, Nutrition Services Division, by phone at 916-322-3435 or by e-mail at [email protected]. Sincerely, Carol Chase, M.S., R.D. Sheri Zidenberg-Cherr, Ph.D. Nutrition Education Administrator Nutrition Science Specialist Nutrition Services Division Department of Nutrition California Department of Education University of California, Davis CC:mp

TENA Survey Final Report – Appendix B 54
Information Flyer
CDE Wants to Know What You Need!
Help the California Department of Education and UC Davis learn what kinds of training, professional development, resources and technical assistance
you need to do your job better!
Please help us by filling out a survey. The survey will take 20 to 30 minutes to complete.
Your answers will remain confidential.
Here is how you participate in this survey: If you have Internet access, just type the following web address into your browser. http://surveyurl If you do not have access to the Internet, contact Anna Jones at 916-322-3435 or [email protected] to request a paper copy of the questionnaire. Just complete it and mail it back to the address given.
If you have any questions, please contact: Anna Jones at 916-322-3435 or [email protected], or Dr. Zidenberg-Cherr at [email protected]? ? ?
.
TENA Survey Final Report – Appendix B 55
Some Frequently Asked Questions about the Training and Education Needs Assessment Survey
Q: What is the survey about? What kind of questions will I be asked? A: The survey is for personnel of programs participating in the National School Lunch Program about their needs when it comes to training, resources, professional development, and technical assistance. For example, we will ask you about what kind of trainings you would like and how you would like those trainings to be presented. You will need to provide the name of the school district and county in which you work, and your job type in order to participate. You will not need to provide your name or other identifying information. Q: Why should I take part in the survey? Do I have to do this? A: Your answers and opinions are very important to us so that we can plan trainings to meet your needs. To ensure the success of the survey, we want input from as many school nutrition personnel as possible, representing different levels of the staff. However, your participation is voluntary and you may refuse to answer any questions or quit the survey at any time.! Q: What are the costs to taking part in the survey? A: There are no costs to you other than the time and effort it takes to complete the questionnaire. Q: Will my answers be kept confidential? A. Yes. We will keep your answers confidential, and results from the survey will only be reported in aggregate. Raw data will only be seen by research staff. Q: How long will it take to answer the questions? A: It will take between 20 and 30 minutes. Q: How will the survey results be used? What will be done with my information? A: Findings will help the California Department of Education make better decisions about how to plan and conduct trainings for school nutrition personnel around the state. What we learn will also be published in a scientific journal so that other organizations can learn about what types of training and resources are needed by school nutrition programs. Q: Who is sponsoring the survey? A: The survey is sponsored by the Nutrition Services Division in the California Department of Education and the Department of Nutrition in the University of California, Davis. The survey has been reviewed by the Institutional Review Board at UC Davis, the office that examines all research with human participants. Q: Who can I contact if I have any questions? A: If you have questions about this survey, please contact Anna Jones at [email protected] or 916-322-3435 or Dr. Sheri Zidenberg-Cherr at [email protected].

TENA Survey Final Report – Appendix C 56
C. Responses to each question In what county is your school district or agency?
County n Percent Alameda 20 2 Alpine 1 0.1 Amador 2 0.2 Butte 11 1.1 Calaveras 7 0.7 Colusa 4 0.4 Contra Costa 26 2.6 Del Norte 1 0.1 El Dorado 12 1.2 Fresno 33 3.3 Glenn 14 1.4 Humboldt 31 3.1 Imperial 11 1.1 Inyo 5 0.5 Kern 43 4.3 Kings 21 2.1 Lake 4 0.4 Lassen 2 0.2 Los Angeles 136 13.6 Madera 12 1.2 Marin 8 0.8 Mariposa 1 0.1 Mendocino 6 0.6 Merced 19 1.9 Modoc 3 0.3 Mono 2 0.2 Monterey 14 1.4 Napa 7 0.7 Nevada 9 0.9 Orange 30 3
County n Percent Placer 9 0.9 Plumas 1 0.1 Riverside 59 5.9 Sacramento 33 3.3 San Benito 5 0.5 San Bernardino 35 3.5 San Diego 66 6.6 San Francisco 7 0.7 San Joaquin 13 1.3 San Luis Obispo 3 0.3 San Mateo 20 2 Santa Barbara 12 1.2 Santa Clara 34 3.4 Santa Cruz 6 0.6 Shasta 23 2.3 Sierra 1 0.1 Siskiyou 16 1.6 Solano 8 0.8 Sonoma 21 2.1 Stanislaus 22 2.2 Sutter 13 1.3 Tehama 20 2 Trinity 6 0.6 Tulare 37 3.7 Tuolumne 7 0.7 Ventura 9 0.9 Yolo 8 0.8 Yuba 7 0.7 No response 3 0.3

TENA Survey Final Report – Appendix C 57
What type of site do you work at? Type n Percent
School site 461 46.2 Central production site 65 6.5 District level 316 31.7 RCCI 83 8.3 Other 70 7.0 Not sure 2 .2 What grade levels are students at your site/district? Grade Level n Percent No students 11 1.1 PreK 405 41 Kindergarten 688 69.6 1st 697 70.5 2nd 698 70.6 3rd 699 70.7 4th 698 70.6 5th 697 70.5 6th 711 72 7th 691 69.9 8th 714 72.3 9th 458 46.4 10th 459 46.5 11th 455 46.1 12th 470 47.6 What type of food production does your site/district use?
Type n Percent Scratch 392 44.4 On-site 693 78.6 Central production 260 29.5 Satellite/Receiving School 265 30.0 Cook Chill 80 9.1

TENA Survey Final Report – Appendix C 58
What is your job title?
Title n Percent
Central Kitchen Staff 18 1.8
School Site Staff 59 5.9
Director 435 43.6
Nutrition Specialist 11 1.1
Regional Manager 20 2.0
Regional Supervisor 13 1.3
Central Kitchen Manager 46 4.6
Central Kitchen Area Lead or Supervisor 18 1.8
Site Lead or Supervisor 172 17.3
Delivery Driver 3 .3
Business manager or official 46 4.6
Administrator, accountant, clerk, secretary, etc. 94 9.5
Principle, superintendent, RCCI director 28 2.8
Consultant 5 .5
Misc. 29 2.9 What is the total number of staff employed in your district’s child nutrition operation? (Directors only)
Number of staff n Percent Less than 5 97 23.0 6-10 58 13.8 11-25 78 18.5 26-50 66 15.7 51-100 60 14.3 101-250 41 9.7 More than 250 16 3.8 Not sure 5 1.2 Prefer not to answer 0 0

TENA Survey Final Report – Appendix C 59
How many students are enrolled in your district? (Directors only) Number n Percent Under 2,500 198 47.3 2,500-9.999 108 25.8 10,000-39,999 91 21.7
40,000 or more 13 3.1
Not sure 9 2.1 Prefer not to answer 2 n/a
Does your district provide snacks or meals to an After School Program? (Directors only) Response n Percent Yes 198 67.1 No 108 31.0 Not sure 91 1.9 Prefer not to answer 2 n/a
Do you obtain funding from your program from outside sources? (Directors and nutrition specialists)
Response n Percent
Yes 113 26.6
No 265 62.4
Not sure 47 11.1
Prefer not to answer 8 n/a
Does your program participate in SHAPE? (Directors and nutrition specialists)
Response n Percent
Yes 117 21.2
No 326 59.1
Not sure 109 19.7
Prefer not to answer 6 n/a

TENA Survey Final Report – Appendix C 60
Based on your observations, are any of the following barriers to meal participation?
Barrier Major barrier n (%)
Minor barrier n (%)
Not a barrier n (%)
Not sure
n
Prefer not to
answer n
Student preferences 113 (12.2)
508 (54.7)
308 (33.2) 27 10
Students have poor image of school meals 111 (12)
450 (48.5)
367 (39.5) 33 6
Lack of parent/family support 115 (12.8)
327 (36.5)
455 (50.7) 53 16
Lunch period is too short 168 (18)
254 (27.2)
512 (54.8) 24 9
Food quality, taste, and/or visual appeal 62 (6.6)
319 (33.9)
559 (59.5) 18 8
Inadequate facilities for serving meals 93 (9.8)
221 (23.2)
638 (67) 7 8
Inadequate dining facilities for students 105 (11.1)
204 (21.5)
640 (67.4) 10 8
Inadequate facilities for meal preparation 110 (11.7)
181 (19.2)
652 (69.1) 11 11
Stigma associated with free- and reduced-price meals
54 (6)
222 (24.6)
627 (69.4) 52 12
Lack of administrative support 68 (7.3)
215 (23.2)
645 (69.5) 28 11
Competition from nearby meal vendors 78 (8.5)
167 (18.1)
678 (73.5) 32 10

TENA Survey Final Report – Appendix C 61
Do you feel you need training in any of the following areas?
Topic Really Need (%)
Some-what Need (%)
Already well-
trained (%)
Not needed for my job (%)
Not sure (n)
Prefer not to
answer (n)
A la carte options 6.6 29 33 31.4 31 16 Access to free drinkable water 5.3 22.4 64 8.4 17 4 Adjusting standardized recipes for quantities needed 5.6 28.1 41.9 24.5 12 9
After School Program snacks and meals 7.8 26.4 44.4 21.4 21 9
Basic nutrition principles 6.9 38.9 42.1 12.1 12 5 Breakfast implementation or expansion 7.7 31.1 49.5 11.7 17 5
Budgeting 8.8 35.5 41.3 14.4 5 1 Child nutrition 8.3 42.9 36.9 11.9 14 6 Childhood obesity 12.2 44.8 28.8 14.1 23 9 Communicating effectively with workers 17 37 42.8 2.9 1 3
Communicating with parent organizations 10.4 29.9 39.6 20.2 20 11
Competitive foods and beverage sales 8.6 37 29.6 24.8 21 2
Controlling portion sizes 3.1 23.8 54.2 18.9 10 8 Cooking/food preparation 4.3 25.8 49.1 20.8 6 11 Coordinating the school meal programs with classroom study themes
17.1 38.5 13.7 30.6 46 11
Cost control 10.8 35.2 41.7 12.3 5 1 Culinary skills 9.2 35.1 31.1 24.7 9 12 Current nutrition issues 14.3 42.3 31.5 11.8 19 7 Customer service 4.1 25.4 55.2 15.3 14 12 Developing a strong wellness policy 13.9 41.3 30.9 13.8 28 13 Developing employee work schedules 7 28.4 53.7 10.9 5 4
Disaster plan development and implementation 20.2 49.6 22 8.1 15 5
Eligibility/Meal applications/Direct certification 6.6 28.2 49 16.2 7 4
Employee wellness 13.3 40.3 31.5 14.9 25 7 Equipment procurement 12.6 36.7 27.2 23.5 43 5 Equity in school lunch pricing 9.8 35.5 33.3 21.3 17 8 Evaluating new food products 8.4 38 33 20.6 18 14 Evaluating on-the-job performance of workers 11.8 39.2 42.7 6.3 4 4
Extending wellness efforts to after school programs 12.5 36.7 18.5 32.3 50 18
Farm-to-School programs 10.4 44.1 14.6 30.5 70 16 Fiscal management 11.9 35.9 32.6 19.6 15 4 Food allergies or intolerances in children 13.6 48 26.7 11.7 22 5

TENA Survey Final Report – Appendix C 62
Topic Really Need (%)
Some-what Need (%)
Already well-
trained (%)
Not needed for my job (%)
Not sure (n)
Prefer not to
answer (n)
Food safety 2.6 21.8 66.7 9 4 8 Food specifications/CN labels 8 37 40.9 14.1 15 3 Forecasting food production needs 5.9 26.9 46 21.1 20 10 Grant writing 34.5 28.4 26.2 11 21 4 Hazard Analysis Critical Control Point (HACCP) plan 4.7 32.3 52.6 10.3 29 9
HHFKA Implementing food-based approach in menu planning 20.7 37.8 30.9 22.9 30 10
HHFKA Increasing dark green and orange vegetables in school menus 16 30.1 28.3 20.2 21 8
HHFKA Increasing dry beans and peas in school menus 16.9 34.7 27.9 21.4 22 9
HHFKA Increasing whole grains in school menus 15.4 35.3 36.3 20.5 15 8
HHFKA Meeting calorie limits, reducing saturated fat, and eliminating trans fat in school menus
13 30.1 24.4 23.6 17 8
HHFKA Menu planning to meet the new meal patterns 18.2 33.9 17.3 20.6 22 9
HHFKA Offer vs. Serve crediting to meet the new meal pattern requirements
23.7 38.3 28.3 18.9 28 8
HHFKA Planning cost-effective menus that meet the new requirements
18.7 34.1 18.4 23.1 22 8
HHFKA Providing meals in After School Programs 12.6 26.3 24.1 37.1 49 21
HHFKA Reducing sodium (salt) in meals while maintaining flavor 21.4 34.3 22.9 21.3 18 9
Identifying the relationship between school wellness policy and school meals
15 40.5 29.6 15 22 7
Identifying the role of the school meal program in coordinated school health
16.4 39.1 26.5 17.9 28 8
Implementation of salad bars 8.9 20.3 45.1 25.7 29 13 Incorporating cultural foods into school meals 8.7 38.8 28.4 24.1 19 9
Indirect costs 15.8 36.6 26.3 21.2 24 7 Leadership 12.2 42 41.8 3.7 2 3 Making presentations to the school board 13.5 27.2 23.6 35.8 23 15
Managing stressful situations at work 9.3 47.3 39.9 3.5 2 3
Marketing healthy meal choices 16.3 34.3 24.7 24.7 23 12 Marketing school meal programs to parents and students 15.5 34 20.8 29.6 21 13
Meal crediting 7.1 25.4 42.1 25.4 116 14

TENA Survey Final Report – Appendix C 63
Topic Really Need (%)
Some-what Need (%)
Already well-
trained (%)
Not needed for my job (%)
Not sure (n)
Prefer not to
answer (n)
Menu planning options 9 34.7 36 20.4 9 13 Menu production records 8.2 29.9 55.9 6.1 5 1 Offering food or meal choices 5.4 29.3 46.9 18.5 19 11 Planning for just-in-time food preparation 6.5 28.7 40.2 24.6 70 12
Planning for use of regional produce 8.3 35.3 29 27.4 51 13 Planning for use of seasonal produce 7.3 33.3 34.6 27.4 34 10
Planning reimbursable meals that appeal to children 7.1 34.8 36.5 21.6 10 8
Policy development 21 34.7 32.6 11.7 22 5 Preparing food for students with special dietary needs 14.5 35.7 29.7 20.1 12 9
Preparing plant-based meals 10.3 37.7 21.3 30.8 79 15 Procurement of food and supplies 7.5 36.1 39.4 17 31 5 Procurement of regional produce 9.1 42.2 28.4 20.3 38 5 Procurement of seasonal produce 8.9 40.1 31.6 19.4 35 5 Promoting a healthy school environment 15 39.5 29 16.5 19 8
Public relations strategies 15.4 33.7 18.3 32.6 31 12 Revenue from non-program food 10.7 35.6 27.4 26.3 41 8 Scratch cooking (including speed scratch or quick scratch) 8.4 31.5 30.5 29.7 39 11
Seamless Summer Feeding option 5.5 27 35.6 31.9 21 9 Site monitoring 4.7 28.7 57.8 8.7 7 1 Special dietary needs 12.7 48.2 24.4 14.7 19 7 Staff productivity analysis 16.6 43.9 25.5 13.9 17 3 Standardizing recipes 11.1 29.3 36.1 23.5 17 12 Teaching nutrition to students 12.3 43.4 18.7 25.6 27 7 Teaching strategies for adult learners 9.2 40.1 30.3 20.4 24 8
Team building 13 45 37.7 4.4 1 3 Training employees 9.7 42.2 43.9 4.2 3 3 Training specific to Residential Child Care Institutions (RCCIs) 6.9 13.6 11.9 67.9 52 25
Transport records 5.2 25.7 44.9 24.2 18 4 Type 2 diabetes 17.4 47.5 20.4 14.8 26 7 Use of USDA foods (commodities) 6.4 24.9 47.4 21.3 18 10 Using USDA Foods (commodities) to cost-effectively enhance school menus
7.6 36.4 42.2 13.8 2 1
Vegetarianism 10.4 46.1 26.2 17.3 36 9 Verification of meal applications 6.2 26.2 50.3 17.3 5 4 Waste management 8.4 42 39.7 9.9 21 4 Work simplification 12 44 38.8 5.2 11 6 Working effectively with after school 4.3 24.9 37.6 33.2 22 15

TENA Survey Final Report – Appendix C 64
Topic Really Need (%)
Some-what Need (%)
Already well-
trained (%)
Not needed for my job (%)
Not sure (n)
Prefer not to
answer (n)
program staff Working effectively with approved USDA processors 3.9 26.7 32.9 34.9 32 13
Working effectively with school administrators and teachers 9 36 43.5 11.5 14 8
Working effectively with vendors 7.4 32.9 49.1 20.3 11 10 Working with the press 6 26.2 19.9 39.7 37 14 Writing bids for procurement 18.3 33.2 32.8 15.6 39 8 Writing specifications for fresh fruits and vegetables 16 42.9 20.3 20.9 34 5
Do you feel most of your staff need training in the following areas?
Topic Really
needed (%)
Some-what
needed (%)
Already Well-
Trained (%)
Not Needed
(%) Not sure
(n)
Prefer not to
answer (n)
A la carte options 9.5 39.2 19.8 31.5 14 5
Adjusting standardized recipes for quantities needed 16.2 40.1 24.7 19 3 2
Basic nutrition principles 22.5 48.6 22.3 6.5 6 4 Child nutrition 24 48.6 20.5 6.9 6 4 Childhood obesity 25.4 46.8 15.3 12.6 8 4 Communicating with parent organizations 16.1 34.2 20.5 29.2 4 5
Controlling portion sizes 15.5 42.2 35.7 6.5 3 1 Cooking/food preparation 16.5 43 33.1 7.4 4 2 Coordinating the school meal programs with classroom study themes
13 27.9 7 52.1 15 4
Culinary skills 23.4 45.2 20.8 10.7 7 1 Current nutrition issues 25.4 51.4 16.8 6.5 8 4 Customer service 18.9 41.9 26.5 12.7 6 6 Developing a strong wellness policy 12.7 25.7 16.1 45.5 9 7
Employee wellness 19.9 42.3 17.7 20.1 11 6 Evaluating new food products 11.8 44.4 21.2 22.6 3 1 Extending wellness efforts to after school programs 11.9 25 10.8 52.3 11 9
Farm-to-School programs 12.6 29.4 9.9 48 21 8 Food allergies or intolerances in children 27.6 47.2 17.7 7.5 6 4
Food safety 11.8 42.9 42.7 2.6 2 1

TENA Survey Final Report – Appendix C 65
Topic Really
needed (%)
Some-what
needed (%)
Already Well-
Trained (%)
Not Needed
(%)
Not sure (n)
Prefer not to
answer (n)
Forecasting food production needs 19.4 38.4 26.9 15.4 6 3
Hazard Analysis Critical Control Point (HACCP) plan 16.4 48.3 31.7 3.6 4 1
HHFKA Implementing food-based approach in menu planning 24.4 31.1 17.5 27 12 3
HHFKA Increasing dark green and orange vegetables in school menus 26.3 32.3 17.6 23.8 8 3
HHFKA Increasing dry beans and peas in school menus 24.1 34.1 16.4 25.4 11 3
HHFKA Increasing whole grains in school menus 23.3 29.3 22.4 25 7 3
HHFKA Meeting calorie limits, reducing saturated fat, and eliminating trans fat in school menus
23.3 29.8 13.5 33.4 8 3
HHFKA Menu planning to meet the new meal patterns 29.4 31.3 10.7 28.5 9 3
HHFKA Offer vs. Serve crediting to meet the new meal pattern requirements
28.8 33 17.8 20.4 9 3
HHFKA Planning cost-effective menus that meet the new requirements
22.7 27 10.7 39.6 8 3
HHFKA Providing meals in After School Programs 18.1 24.7 17.2 40.1 15 9
HHFKA Reducing sodium (salt) in meals while maintaining flavor 25.1 35.1 14.1 25.7 8 3
Identifying the relationship between school wellness policy and school meals
18.2 39.2 13.7 28.8 7 6
Identifying the role of the school meal program in coordinated school health
17.1 38.1 12.7 32.1 9 6
Implementation of salad bars 14.4 27.1 36.4 22.2 15 6 Incorporating cultural foods into school meals 15.1 41.2 17.2 26.5 8 3
Making presentations to the school board 8.9 16.6 10.9 63.6 10 7
Marketing healthy meal choices 19.6 33 15.4 32.1 8 5
Marketing school meal programs to parents and students 20.4 28.5 14.3 36.8 5 7
Meal crediting 12.3 37.6 24.2 25.9 34 5 Menu planning options 15.7 39.4 20.1 24.9 5 1 Offering food or meal choices 12.1 43.5 30.4 13.9 7 1 Planning for just-in-time food preparation 20.3 41.9 23.3 14.6 27 4

TENA Survey Final Report – Appendix C 66
Topic Really
needed (%)
Some-what
needed (%)
Already Well-
Trained (%)
Not Needed
(%)
Not sure (n)
Prefer not to
answer (n)
Planning for use of regional produce 12.4 35.7 22.4 29.5 23 3
Planning for use of seasonal produce 13 35.7 23.5 27.7 15 3
Planning reimbursable meals that appeal to children 11.8 37.6 22 28.6 3 1
Preparing food for students with special dietary needs 27.4 40.7 20.5 11.4 9 3
Preparing plant-based meals 15.3 41 18.1 25.5 27 4 Promoting a healthy school environment 19.4 44.4 17.2 19 7 4
Public relations strategies 15.8 24.4 10 49.8 13 5
Scratch cooking (including speed scratch or quick scratch) 21.4 37.4 22.1 19.1 15 3
Special dietary needs 27.8 48.2 15.7 8.4 6 4 Standardizing recipes 18.9 37.8 21.5 21.9 4 2 Teaching nutrition to students 15 32.5 8.4 44.2 7 4 Type 2 diabetes 29 46.6 12 12.4 8 5 Use of USDA foods (commodities) 8.4 35.1 33.3 23.2 4 3 Vegetarianism 22.9 48.7 17.5 10.9 15 6 Working effectively with after school program staff 9.9 33.6 21.5 35.1 6 6
Working effectively with approved USDA processors 5.9 18.1 15.9 60.1 8 6
Working effectively with school administrators and teachers 19.3 42.8 23.2 14.7 8 4
Working effectively with vendors 7.4 29.8 22.5 40.3 7 4 Working with the press 10.4 18.9 10.9 59.8 11 7 What is the maximum distance you’d be willing to travel for in-person training? Distance n Percent Less than 10 miles 79 10.0 10-30 miles 203 25.8 31-60 miles 226 28.7 61-100 miles 141 17.9 Over 100 miles 73 9.3 Not sure 65 8.3 Prefer not to answer 10 n/a

TENA Survey Final Report – Appendix C 67
How often would you be willing to travel this distance to attend in-person training? Frequency n Percent Weekly 14 1.8 Twice a month 51 6.5 Monthly 161 20.5 Three to four times a year 240 30.6
Twice a year 152 19.4 Yearly 95 12.1 Other 10 1.3 Not sure 62 7.9 Prefer not to answer 12 n/a Which one of the following do you consider the best training method?/What are all the types of training you would be willing to participate in?
Training Method Best Training Method (n)
Best Training Method (%)
Willing to Participate (n)
Willing to Participate (%)
In-person 450 57.3 664 86.0 Internet-based 204 26 589 76.3 Conference-based 41 5.2 425 55.1 Self-study workbooks 20 2.5 295 38.2 Video/DVD instruction 17 2.2 339 43.9 Computer-based not requiring internet 6 0.8 277 35.9
Other 13 1.7 5 0.6 Not sure 35 4.5 18 2.3 What do you think is the ideal length for in-person training? Length n Percent One to three hours 407 51.8 All day 258 32.9 Multiple-day 62 7.9 Other 21 2.7 Not sure 37 4.7 Prefer not to answer 10 n/a

TENA Survey Final Report – Appendix C 68
What do you think is the ideal length for internet-based training? Length n Percent Less than 30 minutes 79 10.1 30 min to one hour 376 48.1 More than an hour, less than two 272 34.8
More than two hours 15 1.9 Other 1 .1 Not sure 39 5.0 Prefer not to answer 12 n/a
What do you think is the best time of year for in-person training?
Time of Year n Percent
During the school year 410 52.3
During the summer 263 33.5
Other 14 1.8
Not sure 97 12.4
Prefer not to answer 11 n/a
What days of the week are best for in-person training? Day n Percent Mon 192 29.6 Tues 360 55.6 Wed 398 61.4 Thurs 358 55.2 Fri 220 34 Sat 74 11.4 Sun 18 2.8 Do any of the following prevent you from getting the training you want or need?
Response n Percent
Expense 415 63.1%
Travel distance 339 51.5%
Lack of relief staff 326 49.5% Courses are held at inconvenient times 312 47.4%

TENA Survey Final Report – Appendix C 69
Does the type of location ever cause you to not want to attend?
Response n Percent
Never 602 79.4
Sometimes 137 18.1
Often 19 2.5
Prefer not to answer 36 n/a
What types of training locations cause you to not want to attend?
Location type n Percent
College or university campus 49 25.3
Hotel meeting rooms 49 25.3
School classrooms 24 12.4 County Office of Education meeting rooms 14 7.3
School district meeting rooms 13 6.7
Does your program use USDA foods?
Response n Percent
Never 45 5.7
Rarely 7 0.9
Sometimes 89 11.4
Frequently 559 71.4
Not sure 83 10.6
Prefer not to answer 9 n/a
What percent of your USDA foods do you send to approved processors?
Percent sent to approved processors
n Percent
Less than 25% 99 31.2
25-50% 90 13.9
More than 50% 164 25.3
Other 108 0.8
Not sure 187 28.9
Prefer not to answer 12 n/a

TENA Survey Final Report – Appendix C 70
How useful are your standardized recipes?
Response n Percent
Not useful 25 3.4
Somewhat useful 206 27.8
Very useful 363 49.0
Not sure 147 19.8
Prefer not to answer 36 n/a
Is lack of equipment a barrier to scratch cooking in your kitchen(s)?
Response n Percent
Not a barrier 289 38.5
Minor barrier 185 24.7
Major barrier 146 19.5
Other 47 6.3
Not sure 83 11.1
Prefer not to answer 30 n/a
Does lack of training on equipment limit what you can prepare?
Response n Percent
Never 339 45.6
Rarely 169 22.7
Sometimes 119 16.0
Often 26 3.5
Not sure 90 12.1
Prefer not to answer 36 n/a
Has lack of funding impacted your program?
Response n Percent
Yes 473 62.1
No 178 23.4
Not sure 111 14.6
Prefer not to answer 22 n/a
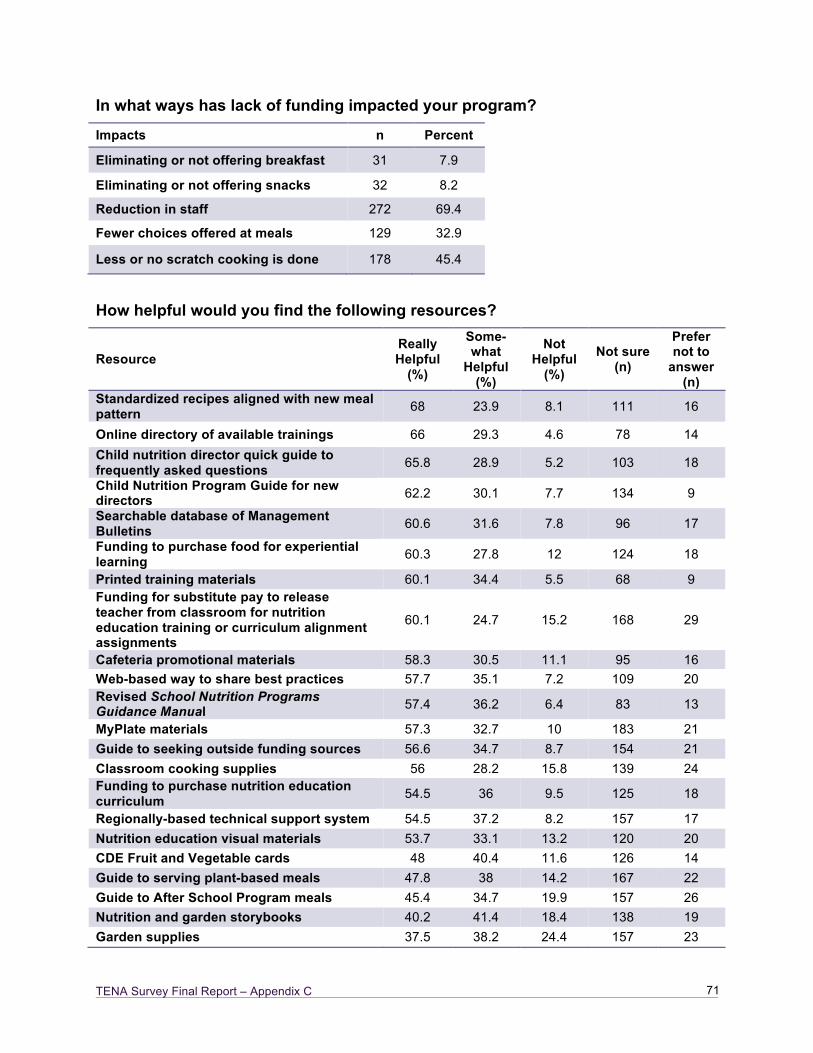
TENA Survey Final Report – Appendix C 71
In what ways has lack of funding impacted your program?
Impacts n Percent
Eliminating or not offering breakfast 31 7.9
Eliminating or not offering snacks 32 8.2
Reduction in staff 272 69.4
Fewer choices offered at meals 129 32.9
Less or no scratch cooking is done 178 45.4
How helpful would you find the following resources?
Resource Really Helpful
(%)
Some-what
Helpful (%)
Not Helpful
(%)
Not sure (n)
Prefer not to
answer (n)
Standardized recipes aligned with new meal pattern 68 23.9 8.1 111 16
Online directory of available trainings 66 29.3 4.6 78 14 Child nutrition director quick guide to frequently asked questions 65.8 28.9 5.2 103 18
Child Nutrition Program Guide for new directors 62.2 30.1 7.7 134 9
Searchable database of Management Bulletins 60.6 31.6 7.8 96 17
Funding to purchase food for experiential learning 60.3 27.8 12 124 18
Printed training materials 60.1 34.4 5.5 68 9 Funding for substitute pay to release teacher from classroom for nutrition education training or curriculum alignment assignments
60.1 24.7 15.2 168 29
Cafeteria promotional materials 58.3 30.5 11.1 95 16 Web-based way to share best practices 57.7 35.1 7.2 109 20 Revised School Nutrition Programs Guidance Manual 57.4 36.2 6.4 83 13
MyPlate materials 57.3 32.7 10 183 21 Guide to seeking outside funding sources 56.6 34.7 8.7 154 21 Classroom cooking supplies 56 28.2 15.8 139 24 Funding to purchase nutrition education curriculum 54.5 36 9.5 125 18
Regionally-based technical support system 54.5 37.2 8.2 157 17 Nutrition education visual materials 53.7 33.1 13.2 120 20 CDE Fruit and Vegetable cards 48 40.4 11.6 126 14 Guide to serving plant-based meals 47.8 38 14.2 167 22 Guide to After School Program meals 45.4 34.7 19.9 157 26 Nutrition and garden storybooks 40.2 41.4 18.4 138 19 Garden supplies 37.5 38.2 24.4 157 23

TENA Survey Final Report – Appendix C 72
How interested are you in moving up the child nutrition career ladder?
Interest Level n Percent
Not interested 220 30.1 A little interested 170 23.3 Very interested 279 38.2 Not sure 61 8.4 Prefer not to answer 45 n/a
What would encourage you to pursue professional development opportunities on your own time? Factor n Percent Time off to take necessary classes 233 40.6 Tuition fully or partially paid 377 65.7 Online classes 355 61.8 Evening or weekend classes 189 32.9 Improved promotional opportunities 222 38.7
Enhanced professional image 161 28 Higher pay 323 56.3 Have you heard of the SNA Certification levels? / Have you heard of the SNA credential?
Response SNA certification
levels n (%)
SNS credentialing program?
[n(%)] No 510 (63.4) 474 (68.0) Yes 240 (36.6) 274 (32.0) Prefer not to answer 25 (3.2) 24 (3.2)
Which of the following certifications or credentials do you hold? (Asked of those who answered yes to “Have you heard of the SNA Certification levels?” and/or Have you heard of the SNA credential?”) Credential or Certificate n Percent SNS credential 21 7.6 SNA Level 1 12 4.3 SNA Level 2 4 1.4 SNA Level 3 17 6.2 None 228 82.6

TENA Survey Final Report – Appendix C 73
Are any of the following barriers to SNA certification or SNA credentialing? Barrier n Percent Expense 81 64.3 Travel distance 50 39.7 Lack of relief staff 46 36.5 Courses held at inconvenient times 34 27.0 Obtaining college credit or taking college classes 16 12.7
Lack of incentive or reward 39 31.0 How many years have you been in your current position? Time n Percent Less than 1 year 63 8.2 Between 1 and 5 years 259 33.5 Between 6 and 10 years 184 23.8 Between 11 and 15 years 104 13.5 More than 15 years 162 21.0 Prefer not to answer 4 n/a
Are you a member of CSNA? Response n Percent Yes 261 36.0 No 465 64.0 Prefer not to answer 50 n/a Do you hold any of the following certifications, registrations, or credentials?
Certification n Percent
Registered Dietitian 28 4.0 Dietetic Technician, Registered 1 0.1
Certified Dietary Manager 8 1.1 Dietary Services Supervisor 11 1.6
Food Safety Certified 485 68.5
None 215 30.4
When do you plan to retire? Time n Percent Within the next year 24 3.1 Between 1 and 5 years 151 19.5 Between 6 and 10 years 165 21.3 Between 11 and 15 years 327 42.1 Not sure 87 11.2 Prefer not to answer 22 2.8

TENA Survey Final Report – Appendix C 74
What is your gender? Gender n Percent Female 663 85.4 Male 99 12.8 Prefer not to answer 14 1.8
What is the highest level of education you have achieved? Education n Percent Less than high school 6 0.8 High diploma or equivalent 128 16.5 Some college 242 31.2 Associate’s degree or equivalent 121 15.6
Bachelor’s degree 167 21.5 Advanced degree 81 10.4 Other 7 0.9 Not sure 1 0.1 Prefer not to answer 23 3.0
How old are you? Age (years) n Percent 18-29 31 4.0 30-39 95 12.2 40-49 189 24.4 50-59 343 44.2 60-69 82 10.6 70+ 6 0.8 Prefer not to answer 30 3.9
What is your racial/ethnic background? Racial or Ethnic Background n Percent
African American 43 5.6 Latino or Hispanic 124 16.2 Asian or Pacific Islander 36 4.7 Native American or Alaska Native 12 1.6
White or Caucasian 523 68.2 Other 10 1.3 Not sure 2 0.3 Prefer not to answer 60 7.8

TENA Survey Final Report – Appendix D 75
D. Training and Education Needs Assessment (TENA) Committee Members Fred Adam Superintendent Placer Hills Union School District Colfax Elementary School District Small School District Association Ann Aguilar Child Nutriion Director Yucaipa-Calimesa Joint Unified School District Medium School District Tammy Anderson-Wise Director, Program Services Dairy Council of California Linda Baker Director Child Nutrition Gridley Unified School District Small School District Dena Boortz Director of Child Nutrition Services Yosemite Unified School District Small School District Phyllis Bramson Director, Nutrition Services Division California Department of Education (Retired in August 2012) Marilyn Briggs Co-Director, UC Davis Center for Nutrition in Schools Department of Nutrition, University of California, Davis SNE CSNA Past President UCD Cal-Pro-NET coordinator Laura Chinnock Nutrition Services Manager Los Angeles Unified School District Very Large School District
Kathleen Corrigan Director Food and Nutrition Services Mount Diablo Unified School District Medium School District David Ginsburg Director, Food Stamp Nutrition Education Program University of California, Davis UCD-Food Stamp Nutrition Education Program Anne Gaffney Nutrition Specialist Elk Grove Unified School District SHAPE Advisory, Very Large School District Susan Giles Food Service Coordinator Central Union Elementary School District Small School District Wanda Grant Director, Nutrition Services Palm Springs Unified School District Nutrition Network--Local, Large School District Katherine Hawksworth Health Educator California Department of Public Health Project Lean & Network for a Healthy California Margan Holloway Director of Student Nutrition Services Tamalpais Union High School District Medium School District, CSNA President-Elect

TENA Survey Final Report – Appendix D 76
Pamela Jones Assistant Superintendent and Director of Education Services Inyo County Superintendent of Schools California County Superintendents Educational Services Association Pamela Lambert Director, Nutrition Services Escondido Union High School District California Association of School Business Officials, Large School District Markell Lewis Nutrition Policy Advocate California Food Policy Advocates Robert Lewis Director, Nutrition Services El Monte City School District Large School District Dominic Machi Director, Child Nutrition Services San Ramon Valley Unified School District Commodity Advisory Committee, Very Large School District Colin Miller Vice President of Policy California Charter Schools Association Denise Ohm Food Service Director Enterprise Elementary School District CSNA President, Medium School District
Cathleen Olsen Director of Food Service Winters Joint Unified School District Small School District Shené Onye Executive Director California Healthy Kids Resource Center (CHKRC) CHKRC/California After School Resource Center Charles Peck Food Service Supervisor Butte County Juvenile Hall RCCI Eric Premack Founding Director Charter Schools Development Center Jason Roberts Chief Operations Officer REAL Journies Academies Charter Charter Schools Cindy Schneider Education Program Consultant, After School Programs Office California Department of Education After School Programs Office Linda Sweeney Coordinator, Cal-Pro-NET Center Department of Nutrition, Food Science & Packaging, San Jose State University (SJSU) CSNA Professional Development Chair SJSU Cal-Pro-NET

TENA Survey Final Report – Appendix E 77
E. References 1. California Department of Education. (Mar. 21, 2011). Lunch and Breakfast. 2009-
2010 School Nutrition Program County Profile Report. Retrieved from http://www.cde.ca.gov/ds/sh/sn/documents/coproschool0910.xls.
2. IOM (Institute of Medicine). 2010. School Meals: Building Blocks for Healthy Children. Washington, DC: The National Academies Press.
3. Briggs M, Mueller CG, Fleischhacker S. Position of the American Dietetic Association, School Nutrition Association, and Society for Nutrition Education: comprehensive school nutrition services. J Am Diet Assoc. Nov 2010;110(11):1738-1749.
4. Healthy, Hunger-Free Kids Act of 2010, S. 3307, 111th Con., 2nd Sess. (2010) 5. “Nutrition Standards in the National School Lunch and School Breakfast
Programs; 7 CFR Parts 210 and 220 [FNS–2007–0038] RIN 0584–AD59; Final Rule,” 77 Federal Register 17 (26 January 2012), pp. 4088-4167.