trans-pacific chemical transport of mercury: sensitivity analysis on asian emission contribution to...
TRANSCRIPT

Trans-Pacific Chemical Transport of Mercury: Sensitivity Analysis on Asian
Emission Contribution to Mercury Deposition in North America Using CMAQ-Hg
C.-J. Lin*1, P. Pongprueksa1, T. Vanjani1, T. C. Ho1, H. Chu1, C. Jang2, T. Braverman2, D. G. Streets3, and J. S. Fu4
1 College of Engineering, Lamar University, Beaumont, TX2 USEPA OAQPS, Research Triangle Park, NC
3 ANL Decision & Information Sciences Division, Argonne, IL4 Dept. Civil & Environmental Engineering, Univ. of Tennessee, Knoxville, TN
5th Annual CMAS ConferenceResearch Triangle Park, NC
October 17, 2006

• Mercury is a global pollutant• Elemental mercury has long atmospheric
lifetime - long range transport likely• Recent concerns of “mercury export”
from Asia (Jaffe et al., 2005)• Trans-Pacific transport of criterion
pollutants has been identified (Jang et al., 2003; 2004)
Why Inter-continental Transport of Mercury?
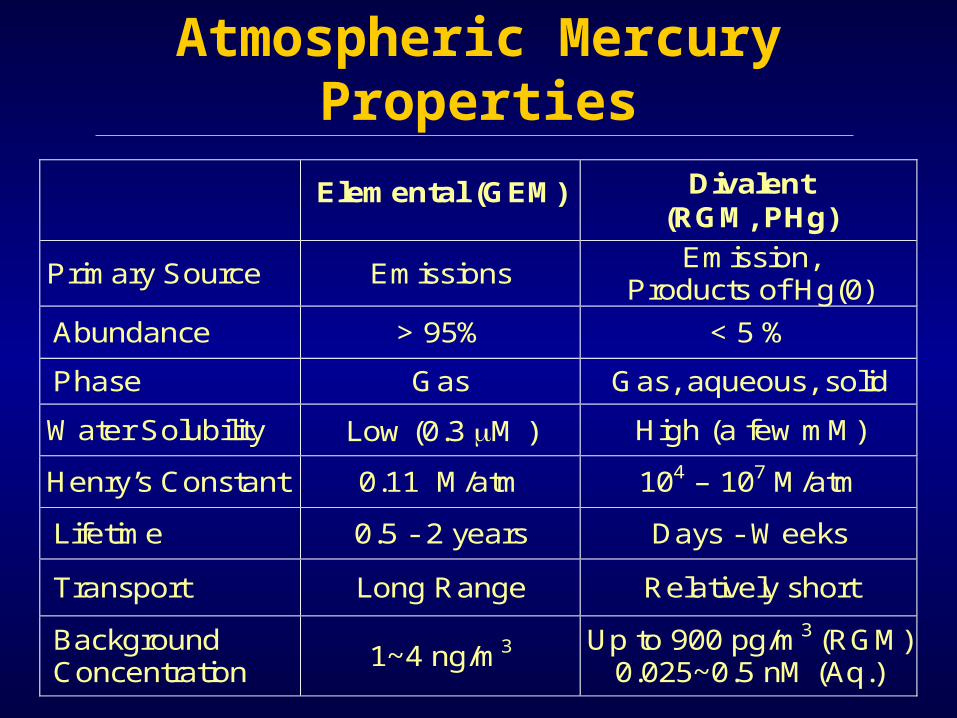
Atmospheric Mercury Properties
Elemental (GEM) Divalent (RGM, PHg)
Primary Source Emissions Emission,
Products of Hg(0)
Abundance > 95% < 5 %
Phase Gas Gas, aqueous, solid
Water Solubility Low (0.3 M ) High (a few mM)
Henry’s Constant 0.11 M/atm 104 – 107 M/atm
Lifetime 0.5 - 2 years Days - Weeks
Transport Long Range Relatively short
Background Concentration
1~4 ng/m3 Up to 900 pg/m3 (RGM)
0.025~0.5 nM (Aq.)

Objectives
• Investigate trans-Pacific transport of gaseous elemental mercury (GEM) to North America
• Assess mercury deposition in North America caused by the long-range transport of GEM
• Study the source contribution of mercury deposition in North America

Simulation Approaches
• Meteorology – ICAP meteorological fields (USEPA) for Year 2001
• Emission Inventory – ICAP criterion pollutant EI with re-projected global mercury EI
• Model – Research version of CMAQ_Hg by USEPA (R. Bullock). No treatment of GEM deposition and 50/50 speciation of RGM/PHg as oxidation products (before v4.5.1)
• IC/BC – regridded from Harvard data (Jacobs & Fu)
• Annual sensitivity simulations performed
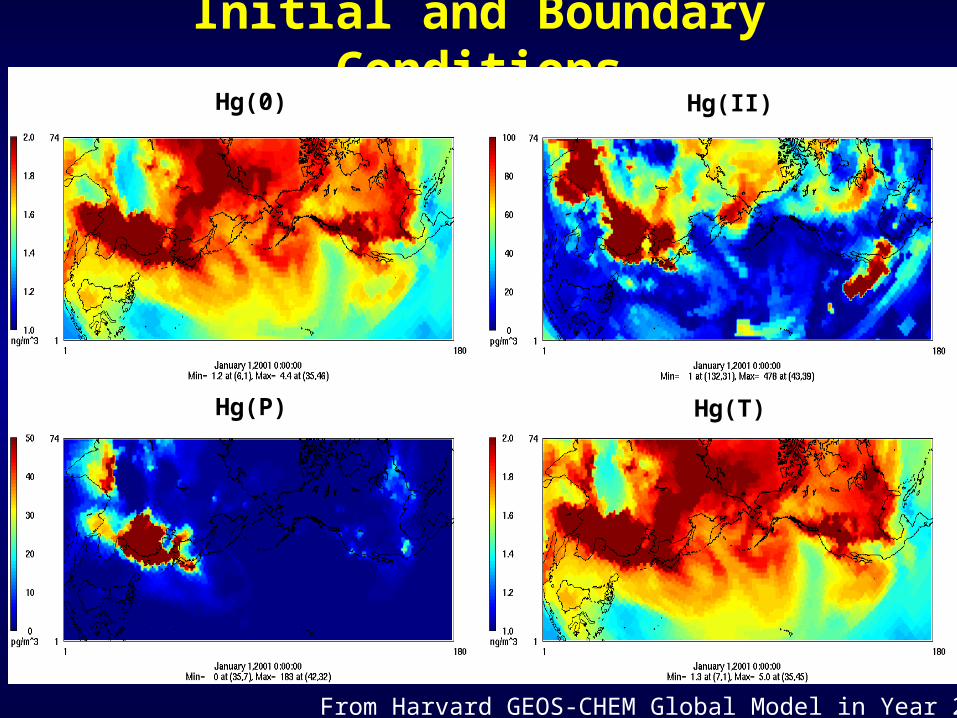
Initial and Boundary ConditionsHg(0) Hg(II)
Hg(P) Hg(T)
From Harvard GEOS-CHEM Global Model in Year 2001
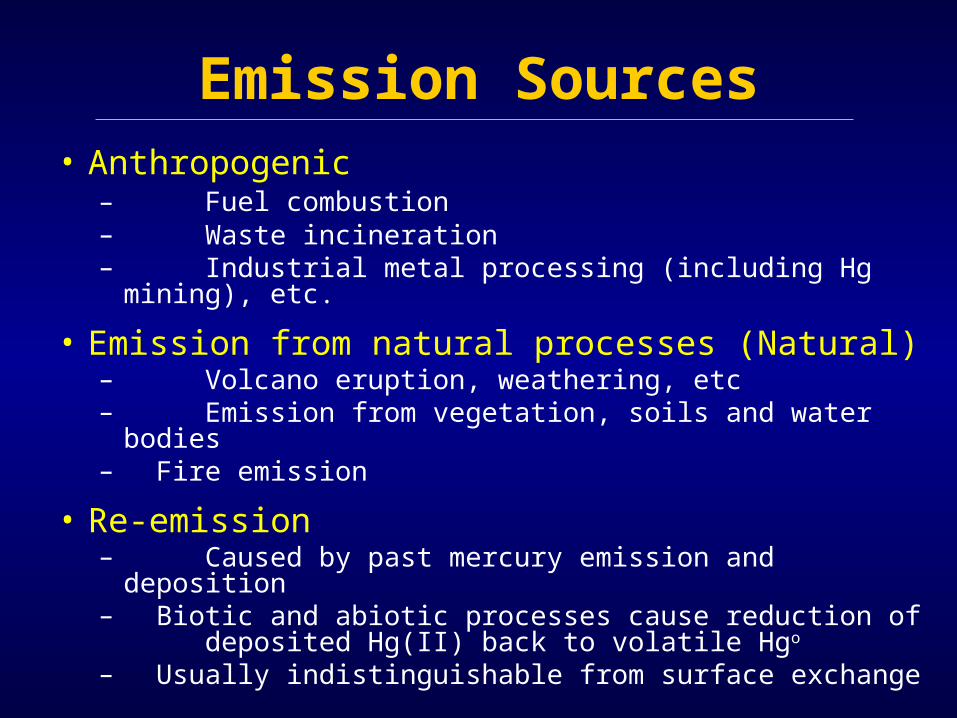
Emission Sources• Anthropogenic
– Fuel combustion– Waste incineration– Industrial metal processing (including Hg mining),
etc.
• Emission from natural processes (Natural)– Volcano eruption, weathering, etc– Emission from vegetation, soils and water bodies– Fire emission
• Re-emission– Caused by past mercury emission and deposition – Biotic and abiotic processes cause reduction of
deposited Hg(II) back to volatile Hgo
– Usually indistinguishable from surface exchange

Emission Preparation for ICAP Simulations
• Anthropogenic sources– Regridded from global Hg emission inventory
(Pacyna et al., 2003; 2006)
– Emission in China revised according to Streets et al. (2005)
• Natural sources / Re-emission– Regridded from AER global natural/re-emission
(Seigneur et al., 2004)
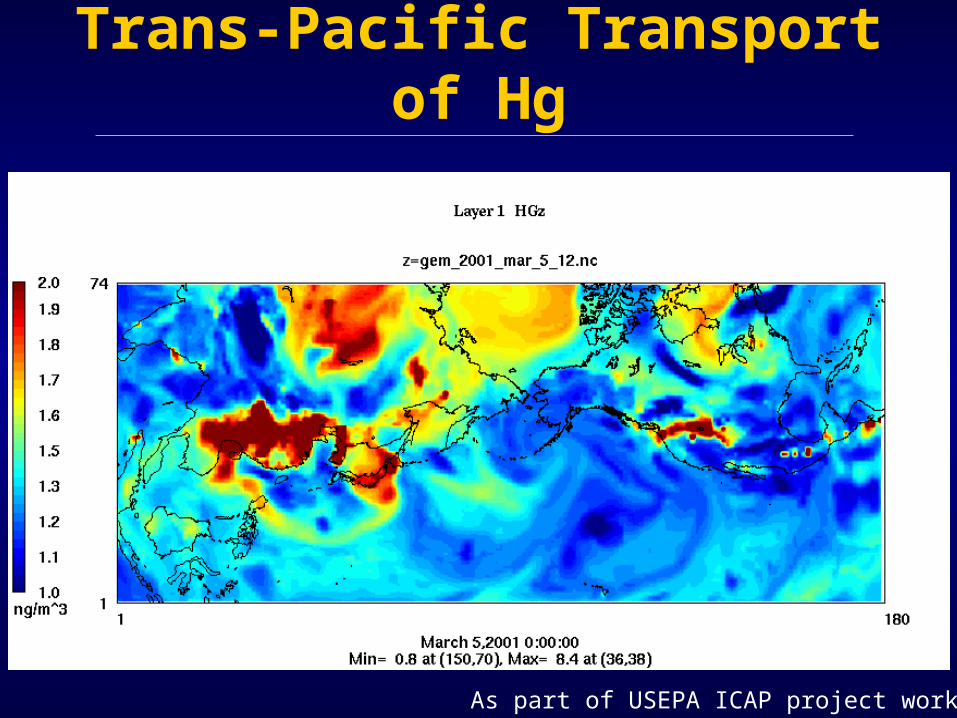
Trans-Pacific Transport of Hg
As part of USEPA ICAP project work

Annual Average ConcentrationHg(0) Hg(II)
Hg(P) Hg(T)

Total Annual Dry DepositionHg(0) Hg(II)
Hg(P) Hg(T)

Total Annual Wet DepositionHg(0) Hg(II)
Hg(P) Hg(T)

Total Annual DepositionHg(0) Hg(II)
Hg(P) Hg(T)
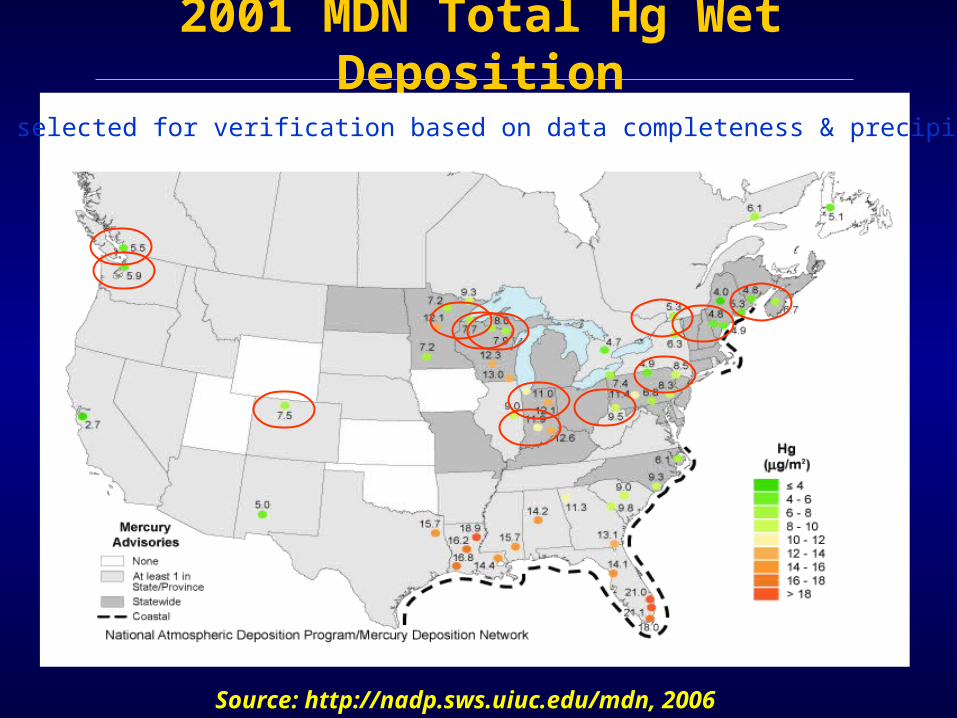
2001 MDN Total Hg Wet Deposition
Source: http://nadp.sws.uiuc.edu/mdn, 2006
13 sites selected for verification based on data completeness & precipitation.

Model vs. MDN Wet Deposition
R2 = 0.6735
0
4
8
12
16
20
24
0 4 8 12 16 20 24
MDN(µg m-2 yr-1)
CM
AQ
_Hg
(µ
g m
-2 y
r-1)

Source Contribution for Total Mercury [Hg(T)] Wet Deposition Flux
0
5
10
15
20
25
MDN Monitoring Stations
µg
m-2
yr-
1
Asia Nat. 0.082 0.029 0.135 0.110 0.044 0.040 0.094 0.085 0.074 0.082 0.106 0.108 0.124
Asia Ant. 0.137 0.052 0.255 0.217 0.077 0.073 0.177 0.155 0.129 0.139 0.193 0.178 0.188
U.S. Nat. 0.147 0.071 0.492 0.427 0.166 0.131 0.345 0.302 0.261 0.145 0.310 0.321 0.279
U.S. Ant. 0.149 0.027 1.152 1.045 0.515 0.148 2.505 1.351 0.450 0.190 0.180 0.267 0.319
IC & BC 10.589 4.422 19.310 17.839 6.619 5.509 11.930 12.560 9.687 10.246 13.339 13.374 14.285
BC06 CO97 IN20 IN28 ME02 NS01 PA37 PA72 PQ04 WA18 WI08 WI09 WI36
Modeled Annual Wet DepositionModeled Annual Wet Deposition

Source Contribution to Wet Deposition
Source Contribution for Total Mercury [Hg(T)] Wet Deposition Flux
50%
60%
70%
80%
90%
100%
MDN Monitoring Stations
Asia Nat. 0.74 0.63 0.63 0.56 0.59 0.68 0.62 0.59 0.70 0.76 0.75 0.76 0.82
Asia Ant. 1.23 1.13 1.19 1.11 1.04 1.24 1.18 1.07 1.22 1.29 1.37 1.25 1.24
U.S. Nat. 1.32 1.54 2.31 2.17 2.24 2.22 2.29 2.09 2.46 1.34 2.19 2.25 1.84
U.S. Ant. 1.34 0.59 5.40 5.32 6.94 2.51 16.64 9.35 4.24 1.76 1.27 1.87 2.10
IC & BC 95.36 96.11 90.47 90.84 89.19 93.36 79.26 86.90 91.38 94.85 94.42 93.87 94.01
BC06 CO97 IN20 IN28 ME02 NS01 PA37 PA72 PQ04 WA18 WI08 WI09 WI36

Source Contribution for Total Mercury [Hg(T)] Total Deposition Flux
0
10
20
30
40
50
60
MDN Monitoring Stations
µg
m-2
yr-
1
Asia Nat. 0.156 0.169 0.198 0.193 0.055 0.050 0.180 0.158 0.129 0.172 0.164 0.162 0.188
Asia Ant. 0.283 0.380 0.373 0.375 0.096 0.090 0.341 0.288 0.233 0.316 0.301 0.275 0.307
U.S. Nat. 0.298 0.487 0.726 0.741 0.217 0.183 0.631 0.561 0.457 0.305 0.511 0.513 0.499
U.S. Ant. 0.531 0.314 4.729 5.414 2.187 0.445 19.042 8.309 1.377 0.515 0.741 0.924 1.280
IC & BC 23.103 29.569 34.353 37.750 13.448 10.996 35.900 35.028 29.324 24.137 28.522 27.794 30.774
BC06 CO97 IN20 IN28 ME02 NS01 PA37 PA72 PQ04 WA18 WI08 WI09 WI36
Total Annual (Dry + Wet) DepositionTotal Annual (Dry + Wet) Deposition

Source Contribution for Total Mercury [Hg(T)] Total Deposition Flux
50%
60%
70%
80%
90%
100%
MDN Monitoring Stations
Asia Nat. 0.64 0.55 0.49 0.43 0.34 0.43 0.32 0.36 0.41 0.68 0.54 0.55 0.57
Asia Ant. 1.16 1.23 0.92 0.84 0.60 0.77 0.61 0.65 0.74 1.24 1.00 0.93 0.93
U.S. Nat. 1.22 1.58 1.80 1.67 1.36 1.56 1.12 1.27 1.45 1.20 1.69 1.73 1.51
U.S. Ant. 2.18 1.02 11.71 12.17 13.67 3.78 33.95 18.74 4.37 2.02 2.45 3.11 3.87
IC & BC 94.80 95.63 85.08 84.88 84.03 93.47 64.00 78.99 93.03 94.86 94.32 93.68 93.12
BC06 CO97 IN20 IN28 ME02 NS01 PA37 PA72 PQ04 WA18 WI08 WI09 WI36
Sources Contribution to Total DepositionSources Contribution to Total Deposition
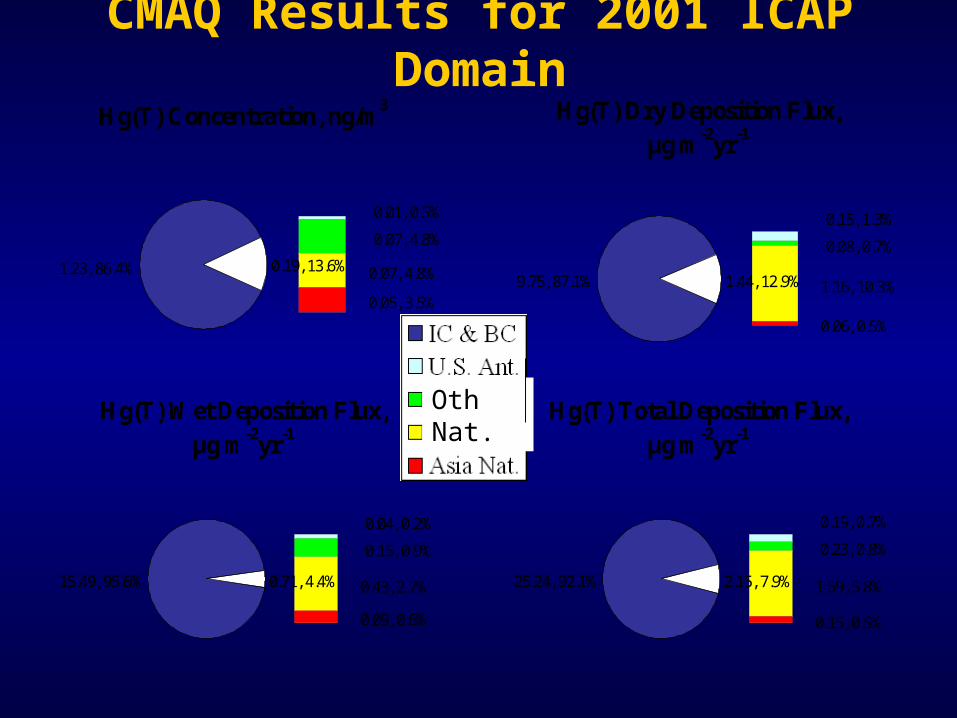
CMAQ Results for 2001 ICAP Domain
Hg(T) Total Deposition Flux,
µg m-2yr-1
0.19, 0.7%
0.23, 0.8%
1.59, 5.8%
0.15, 0.5%
2.15, 7.9%25.24, 92.1%
Hg(T) Wet Deposition Flux,
µg m-2yr-1
15.49, 95.6%
0.04, 0.2%
0.15, 0.9%
0.43, 2.7%
0.09, 0.6%
0.71, 4.4%
Hg(T) Dry Deposition Flux,
µg m-2yr-1
9.75, 87.1%
0.15, 1.3%
0.08, 0.7%
1.16, 10.3%
0.06, 0.5%
1.44, 12.9%
Hg(T) Concentration, ng/m3
1.23, 86.4%
0.01, 0.5%
0.07, 4.8%
0.07, 4.8%
0.05, 3.5%
0.19, 13.6%
Oth Nat.

• Trans-Pacific transport events of Hg identified in 2001 (Mar.-Apr. & Oct.-Nov.), contributing 0.1-0.2 ng/m3
GEM in west coast regions.• Chemistry forcing and/or out-of-boundary transport
(IC/BCs) dominate Hg deposition in North America.• Although the direct forcing of Asian Hg emissions on
the US deposition is small, their contribution to global background cannot be neglected.
• Local emission can contribute significantly to both dry and wet depositions even with the coarse ICAP domain grids.
• Anthropogenic Hg emission from North America has negligible impact on total Hg deposition in the ICAP domain. Asian anthropogenic emission contribute much greatly to the concentration and deposition.
Conclusions

Acknowledgements
• USEPA – OAQPS (RTI subcontract No. 3-93U-9606).
• Texas Commission on Environmental Quality (TCEQ work order No. 64582-06-15).
• Steve Lindberg, University of Nevada at Reno.• Russ Bullock, USEPA.• Jocelyn Mellberg, TCEQ.• Xinbin Feng, Chinese Academy of Sciences.• Christian Seigneur, AER