transactional business analytics for oracle intelligence ...before putting everything together on...
TRANSCRIPT

OracleCreating HCM CloudAnalytics for OracleTransactional BusinessIntelligence Enterprise
Release 10

Oracle® Creating HCM Cloud Analytics for Oracle Transactional Business Intelligence Enterprise
Part Number E61673-02
Copyright © 2011-2016, Oracle and/or its affiliates. All rights reserved.
Author: Megan Wallace
This software and related documentation are provided under a license agreement containing restrictions on use and disclosure and are protected byintellectual property laws. Except as expressly permitted in your license agreement or allowed by law, you may not use, copy, reproduce, translate, broadcast,modify, license, transmit, distribute, exhibit, perform, publish, or display any part, in any form, or by any means. Reverse engineering, disassembly, ordecompilation of this software, unless required by law for interoperability, is prohibited.
The information contained herein is subject to change without notice and is not warranted to be error-free. If you find any errors, please report them tous in writing.
If this is software or related documentation that is delivered to the U.S. Government or anyone licensing it on behalf of the U.S. Government, the followingnotice is applicable:
U.S. GOVERNMENT END USERS: Oracle programs, including any operating system, integrated software, any programs installed on the hardware, and/or documentation, delivered to U.S. Government end users are "commercial computer software" pursuant to the applicable Federal Acquisition Regulationand agency-specific supplemental regulations. As such, use, duplication, disclosure, modification, and adaptation of the programs, including any operatingsystem, integrated software, any programs installed on the hardware, and/or documentation, shall be subject to license terms and license restrictionsapplicable to the programs. No other rights are granted to the U.S. Government.
This software or hardware is developed for general use in a variety of information management applications. It is not developed or intended for use inany inherently dangerous applications, including applications that may create a risk of personal injury. If you use this software or hardware in dangerousapplications, then you shall be responsible to take all appropriate fail-safe, backup, redundancy, and other measures to ensure its safe use. OracleCorporation and its affiliates disclaim any liability for any damages caused by use of this software or hardware in dangerous applications.
Oracle and Java are registered trademarks of Oracle Corporation and/or its affiliates. Other names may be trademarks of their respective owners.
Intel and Intel Xeon are trademarks or registered trademarks of Intel Corporation. All SPARC trademarks are used under license and are trademarks orregistered trademarks of SPARC International, Inc. AMD, Opteron, the AMD logo, and the AMD Opteron logo are trademarks or registered trademarks ofAdvanced Micro Devices. UNIX is a registered trademark of The Open Group.
This software or hardware and documentation may provide access to or information on content, products and services from third parties. Oracle Corporationand its affiliates are not responsible for and expressly disclaim all warranties of any kind with respect to third-party content, products, and services. OracleCorporation and its affiliates will not be responsible for any loss, costs, or damages incurred due to your access to or use of third-party content, products,or services.
For information about Oracle's commitment to accessibility, visit the Oracle Accessibility Program website at http://www.oracle.com/pls/topic/lookup?ctx=acc&id=docacc
Oracle customers have access to electronic support through My Oracle Support. For information, visit http://www.oracle.com/pls/topic/lookup?ctx=acc&id=info or visit http://www.oracle.com/pls/topic/lookup?ctx=acc&id=trs if you are hearing impaired.

OracleCreating HCM Cloud Analytics for Oracle TransactionalBusiness Intelligence Enterprise
Contents
Preface i
1 Overview 1About This Guide ...................................................................................................................................................... 1
Related Documents and Training .............................................................................................................................. 1
Customizing Oracle Transactional Business Intelligence Enterprise for HCM Cloud: Overview .................................... 1
Process for Creating Custom Dashboards: Overview ................................................................................................ 2
2 Design Plan 3Planning Your Dashboard: Overview ......................................................................................................................... 3
Dashboard Pages and Navigation: Explained ............................................................................................................ 3
Designing Perspective Pages: Points to Consider ..................................................................................................... 6
General Patterns for Linking to Detail Pages: Explained ............................................................................................ 8
Designing Detail Pages: Points to Consider ............................................................................................................ 10
3 Dashboard Components 15Creating Analyses and Other Dashboard Components: Overview ........................................................................... 15
Using Color in Analyses: Points to Consider ........................................................................................................... 17
Creating Charts: Procedure .................................................................................................................................... 18
Creating Tables: Procedure .................................................................................................................................... 19
Using Shared Filters in a Custom Dashboard or Analysis: Worked Example ............................................................ 21
Creating Shared Filters: Worked Example ............................................................................................................... 23
Creating a Performance Tile: Worked Example ....................................................................................................... 24
Creating a Micro Sparkline: Worked Example ......................................................................................................... 25
Creating a Treemap: Worked Example ................................................................................................................... 27
Creating a View Selector: Worked Example ............................................................................................................ 28
Copying and Editing an ETL Refresh Date Banner: Worked Example ...................................................................... 30
Creating an Action Link to Drill Into an Organizational Dashboard: Worked Example ............................................... 31
Creating Dashboard Prompts: Procedure ............................................................................................................... 32
Setting the Dashboard Prompts: Worked Example ................................................................................................. 33
OracleCreating HCM Cloud Analytics for Oracle TransactionalBusiness Intelligence Enterprise
4 Dashboard Creation 35Creating Dashboards and Pages: Overview ............................................................................................................ 35
Creating Dashboards and Setting Properties: Procedure ........................................................................................ 35
Copying the HR Executive Dashboard: Worked Example ........................................................................................ 36
Creating Perspective Pages: Procedure .................................................................................................................. 37
Creating Standard Detail Pages and Show Data Pages: Procedure ........................................................................ 39
Creating Inspector Pages: Procedure ..................................................................................................................... 42
Adding Links to Detail Pages: Procedure ................................................................................................................ 45
OracleCreating HCM Cloud Analytics for Oracle TransactionalBusiness Intelligence Enterprise
Preface
i
PrefaceThis Preface introduces information sources available to help you use Oracle Applications.
Oracle Applications HelpUse the help icon to access Oracle Applications Help in the application.
Note If you don't see any help icons on your page, click the Show Help button in the global area. Not all pages havehelp icons.
You can also access Oracle Applications Help at https://fusionhelp.oracle.com/.
Oracle Applications GuidesTo find other guides for Oracle Applications, go to:
• Oracle Applications Help, and select Documentation Library from the Navigator menu.
• Oracle Help Center at http://docs.oracle.com/
Other Information Sources
My Oracle SupportOracle customers have access to electronic support through My Oracle Support. For information, visit http://www.oracle.com/pls/topic/lookup?ctx=acc&id=info or visit http://www.oracle.com/pls/topic/lookup?ctx=acc&id=trs if youare hearing impaired.
• http://www.oracle.com/pls/topic/lookup?ctx=acc&id=info
• http://www.oracle.com/pls/topic/lookup?ctx=acc&id=trs (if you are hearing impaired).
Oracle Enterprise Repository for Oracle Fusion ApplicationsOracle Enterprise Repository for Oracle Fusion Applications (http://fusionappsoer.oracle.com) provides details on assets (suchas services, integration tables, and composites) to help you manage the lifecycle of your software.
Documentation AccessibilityFor information about Oracle's commitment to accessibility, visit the Oracle Accessibility Program website at http://www.oracle.com/pls/topic/lookup?ctx=acc&id=docacc.

OracleCreating HCM Cloud Analytics for Oracle TransactionalBusiness Intelligence Enterprise
Preface
ii
Comments and SuggestionsPlease give us feedback about Oracle Applications Help and guides!
• Send e-mail to: [email protected].
• Click your user name in the global area of Oracle Applications Help, and select Send Feedback to Oracle.

OracleCreating HCM Cloud Analytics for Oracle TransactionalBusiness Intelligence Enterprise
Chapter 1Overview
1
1 Overview
About This GuideThis guide provides details about designing custom dashboards using design concepts and standards that are specific toOracle Transactional Business Intelligence Enterprise for HCM Cloud. This guide provides details about the standards forOTBI Enterprise dashboards and analyses, and provides instructions on:
• Developing a design plan for a custom dashboard.
• Creating dashboard components like those found on the HR Executive Dashboard.
• Building a custom HCM dashboard using design specifications for Oracle Transactional Business IntelligenceEnterprise.
The audience for this guide is report content authors, and this guide assumes that you are already familiar with the OracleBusiness Intelligence Answers tool, which is used to create dashboards, analyses, and other dashboard components.
Related Documents and TrainingFor more information about Oracle Transactional Business Intelligence Enterprise for HCM Cloud, review these additionalsources:
• Oracle Transactional Business Intelligence Enterprise Using HCM Cloud Analytics
• Oracle Transactional Business Intelligence Enterprise Implementing Your Deployment
• Oracle Transactional Business Intelligence Enterprise Administering Your Deployment
• Oracle Transactional Business Intelligence Enterprise Known Issues
Customizing Oracle Transactional BusinessIntelligence Enterprise for HCM Cloud: OverviewOracle Transactional Business Intelligence Enterprise for HCM Cloud includes predefined analyses and the delivered HRExecutive Dashboard, which enable you to:
• Gain complete workforce visibility and predict future needs.
• Maximize employee contribution with high performing recruitment, talent development, and compensation practices.
• Deliver insights to ensure workforce meets corporate strategic goals and activities are cross - functionally aligned.

OracleCreating HCM Cloud Analytics for Oracle TransactionalBusiness Intelligence Enterprise
Chapter 1Overview
2
You can customize Oracle Transactional Business Intelligence Enterprise for HCM Cloud by:
• Creating custom dashboard components such as analyses, prompts, and so on.
• Creating a custom dashboard and adding custom components to it.
• Copying the HR Executive Dashboard and making changes that suit your business needs.
Oracle recommends using a specific style to create dashboards and components for Oracle Transactional BusinessIntelligence Enterprise. Use this guide to help you create customizations that meet your business needs and that meetOracle's recommended standards.
Process for Creating Custom Dashboards: OverviewPredefined dashboards give users a wealth of information, but you can still create custom dashboards for them to use. Yourcustom dashboard may contain multiple pages, and each page can have a collection of analyses and other components.
ImportantSave your dashboard and every custom item it contains in the catalog, under Shared Folders - Custom.
Process OverviewTo create a custom dashboard:
1. Design a plan for your dashboard, including what each page contains and how users navigate between pages.
2. Create analyses, prompts, and any other custom item that you save separately in the catalog.
3. Create your dashboard, and add what you created in step 2 to the dashboard pages.
Though this guide takes you through this process, of course you might want to just customize a few aspects or componentsof predefined dashboards. You can still use the information in this guide to help you with that.
ImportantDon't customize predefined content directly. Make a copy, save the copy in the Custom folder, and edit only thecopy.

OracleCreating HCM Cloud Analytics for Oracle TransactionalBusiness Intelligence Enterprise
Chapter 2Design Plan
3
2 Design Plan
Planning Your Dashboard: OverviewBefore you start creating your dashboards and what goes on the dashboard pages, you must plan everything out. If not, youmight spend a lot of extra time reworking, especially if you have many pages.
Process OverviewTo plan your dashboard:
1. Decide whom the dashboard is for, what information the users need, and what they need to achieve.
2. Based on that, determine the types of dashboard pages to build, what each page contains, and how users navigatebetween pages, all the while keeping in mind key design goals.
3. Plan out the specific details of every page in your dashboard, so that you know what components to create firstbefore putting everything together on dashboard pages.
Key Design GoalsPredefined dashboards follow certain design principles. Your custom dashboard should look and behave like predefineddashboards, so that you follow these principles and also give users a consistent experience. The information in the rest of thisguide helps you create custom content that's in line with these design goals:
• Build something that works equally well on mobile devices.
• Show the most important information first, at the top of the page.
• Always make it clear to users where they are in the dashboard and how to navigate to other pages for theinformation they want.
• Create analyses that convey the key information your users need, using the most appropriate visualization.
Dashboard Pages and Navigation: ExplainedPredefined dashboards have four types of pages: overview, perspective, detail, and sample content. But, when you createyour own custom dashboard, you usually plan for only perspective and detail pages. You might not find overview pagesnecessary, and the predefined sample content pages are there only to help you with customization.
Overview PageThe overview page is the landing page for a dashboard, and it orients users regarding what the dashboard is about.
• On the left side of the page are common business analysis questions that the target users might have. These linkstake them to specific analyses.
• On the right are analyses that give essential, overview information about the various business objects that thedashboard covers.
Users can find all of the overview page content on other pages too.

OracleCreating HCM Cloud Analytics for Oracle TransactionalBusiness Intelligence Enterprise
Chapter 2Design Plan
4
Perspective PagesMost of the tabs on the dashboard are perspective pages.
• Perspectives provide an intuitive, top level of organization for your dashboard.• Each perspective page maps to a specific business point of view, and the analyses on the page support that view.• A perspective should be immediately familiar to your users as something relevant to their work.
For your own dashboard, decide on a limited number of perspectives and what each perspective covers. Consider havingthe first, leftmost perspective page provide summary information for your dashboard and navigation to other, more specificperspective pages.
Detail PagesFor your dashboard, determine what detail pages you need for each perspective. Detail pages:
• Give an in-depth view of a particular content area that your users care about.• Provide content similar to perspective pages, but with richer and more granular information.• Reduce the complexity of perspective pages so that users can easily digest the summary information on perspective
pages.• Help you avoid performance issues that can occur if you put too much on your perspective pages.
Consider creating these special types of detail pages, if needed:
• Show data pages: Provide all the same information as a specific analysis from a perspective page, but in a tablethat users can export. Users open these pages using Show data links on perspective pages.
• Inspector pages: Provide essential summary information about a specific business object, for example a person,which can be relevant to many perspectives. Choose only the most important, fundamental business objects in yourdashboard to inspect.
All other, regular detail pages are referred to as standard detail pages.
NavigationAs part of planning your perspective and detail pages, determine the navigation within your dashboard.
• Decide on the order of tabs across the top of the dashboard. Users can open the overview page (if any) and allperspective pages using these tabs.
• Determine how users access detail pages, and how they return from those pages.
◦ Users typically go from perspective pages to specific detail pages for more information.
◦ The overview page can also link to detail pages.
◦ After users open a standard detail page or show data page, they generally go right back to the relevantperspective page.
◦ Since an inspector page can be relevant to multiple perspectives, you can have multiple perspective pages thatlink to the same inspector page.
◦ You can also link from standard detail pages and show data pages to inspector pages.
◦ Inspector pages should open in a new window. Users just close the window when they're done, and return towhere they opened the inspector page from.

OracleCreating HCM Cloud Analytics for Oracle TransactionalBusiness Intelligence Enterprise
Chapter 2Design Plan
5
The following diagram shows an example of pages in a dashboard and how users navigate between them. Thisexample includes the special types of detail pages, as well as standard detail pages.

OracleCreating HCM Cloud Analytics for Oracle TransactionalBusiness Intelligence Enterprise
Chapter 2Design Plan
6
Designing Perspective Pages: Points to ConsiderAfter you have a general plan for the perspective pages you want in your dashboard, you design the details of the pagesbefore building them in the application. Aside from planning out the layout and content of the page, as illustrated in thefollowing diagram, also keep in mind that users can view the page on mobile devices.
Page LayoutYour perspective page should have two columns:
• A narrow one on the left side, containing prompts• The main body of the page on the right, containing analyses and links to detail pages

OracleCreating HCM Cloud Analytics for Oracle TransactionalBusiness Intelligence Enterprise
Chapter 2Design Plan
7
Main Page ContentFor the right column, plan out these page components from top to bottom:
• Title: A page title that summarizes the perspective you're capturing, but in as few words as possible.
NoteThe page title doesn't have to match the tab label. Keep the tab label even shorter.
• Description: A brief sentence or two to describe what the page is all about.
• Performance Tiles:A row of performance tiles to orient users with essential, aggregated KPIs.
Tip
◦ Don't have more than six tiles in the row, and you might consider having two rows if needed.
◦ You can plan for a sparkline to appear for each tile.
• Primary Analysis: A single analysis that shows the most crucial information for this perspective.
• Additional Sections: One or more sections with other analyses that support the perspective.
◦ Put the more important sections higher up on the page.
◦ A section can have multiple analyses. If so, you can put them side by side, or have a single primary analysisfirst, followed by other analyses.
◦ Don't put so many sizable views or analyses side by side in the same section that content is cramped andusers need to scroll horizontally.
NoteYou can find some recommended sizes for analyses in the next chapter.
Each analysis, including the primary one, should display a short title and description. It's recommended that each descriptionhas a sentence that starts with a verb, and optionally a second sentence that summarizes how the user can interact with theanalysis.
NoteAs you design your main page content, consider some general patterns to follow for providing access to detailpages.
PromptsAfter you plan out the analyses to include on the page, determine what prompts to put in the left column. Each prompt affectsall the analyses on the page.
• Use the same prompts for every perspective page in your dashboard, as much as possible.

OracleCreating HCM Cloud Analytics for Oracle TransactionalBusiness Intelligence Enterprise
Chapter 2Design Plan
8
• Put what you think are the more helpful or frequently used prompts at the top.
• Don't include too many prompts, for example more than ten.
Mobile DevicesOn mobile devices such as tablets, users see only the main page content (the right column), without the prompts on the left. Ifyou design your page as described above, you ensure that:
• The content is optimized for vertical scrolling only.
• The most important content (the performance tiles and primary analysis) is available on the screen without scrolling.
TipIf possible, make a small portion of the additional sections also visible without scrolling, as illustrated in thefollowing diagram. This way, users can easily tell that there's more on the page.
General Patterns for Linking to Detail Pages:ExplainedIn most cases, users navigate to detail pages from perspective pages. For your own dashboard, consider general patternsused to provide links from perspective to detail pages. You can link to inspector pages not only from perspective pages, butalso other types of pages, for example standard detail pages.
OracleCreating HCM Cloud Analytics for Oracle TransactionalBusiness Intelligence Enterprise
Chapter 2Design Plan
9
More Information SectionOn your perspective page, you have at least one section displaying one or more analyses. If you have detail pages related tothe analyses in a specific section, then you can put another section right below. This second section is a collapsible regionthat contains one or more links to detail pages.
• The section title is the same as the title for the first section, but with More added to the front.
• Phrase each link as a question that the information from the detail page would answer.
Show Data LinkOn a perspective page, you present an analysis, for example, only in a chart view. You might decide that users need to havedetailed data from that analysis in a table format, especially for export. So, you plan for a show data page.
• In your design for the parent perspective page, plan for a section to display the chart.
• At the bottom of that section, put a Show data link to open the show data page.
Inspector Page NavigationFor one or more key business objects in your dashboard, you might plan for inspector pages to help users get more insight.You link to inspector pages from within the chart or table in an analysis.
For example, you have a table with a column displaying person names, and you want an inspector page for persons. So youplan for each cell in that column to be a link to the inspector page, so that when users click on Jane Smith, for example, theyopen an inspector page with information only about Jane Smith.

OracleCreating HCM Cloud Analytics for Oracle TransactionalBusiness Intelligence Enterprise
Chapter 2Design Plan
10
Designing Detail Pages: Points to ConsiderAfter you have a general plan for the detail pages you want, determine the specifics of each page before building them in theapplication. Aside from planning out the layout and content of the page, as illustrated in the following diagram, also keep inmind additional or different considerations for show data and inspector pages.
Page LayoutThe layout for detail pages is the same as perspective pages, with prompts in the left column and the main page content inthe right.
Page ContentPlan out your page, from top to bottom:
• Parent Page Title: The same title as the parent perspective page, immediately followed by a link that takes youback to the parent page.
• Detail Page Title: The title of the detail page. Consider using the name of the analysis or section on the perspectivepage that is associated with this detail page.
• Sections: Typically, a section with one analysis, but you might need multiple analyses in the same section, or evenmultiple sections.

OracleCreating HCM Cloud Analytics for Oracle TransactionalBusiness Intelligence Enterprise
Chapter 2Design Plan
11
ImportantIf you have more than one section, put the most important one first so that users don't need to scroll tosee it on mobile devices.
PromptsThe prompts for a detail page should be exactly the same as the ones on its parent perspective page.
Show Data PagesIf you're building a show data page, then generally follow the same layout and content considerations above, except that you:
• Don't have a detail page title.
• Plan for just one section to house the table showing the data, and not have any other analyses or views.
• Put an Export link below the table.
This diagram shows the layout and content of a show data page.
OracleCreating HCM Cloud Analytics for Oracle TransactionalBusiness Intelligence Enterprise
Chapter 2Design Plan
12
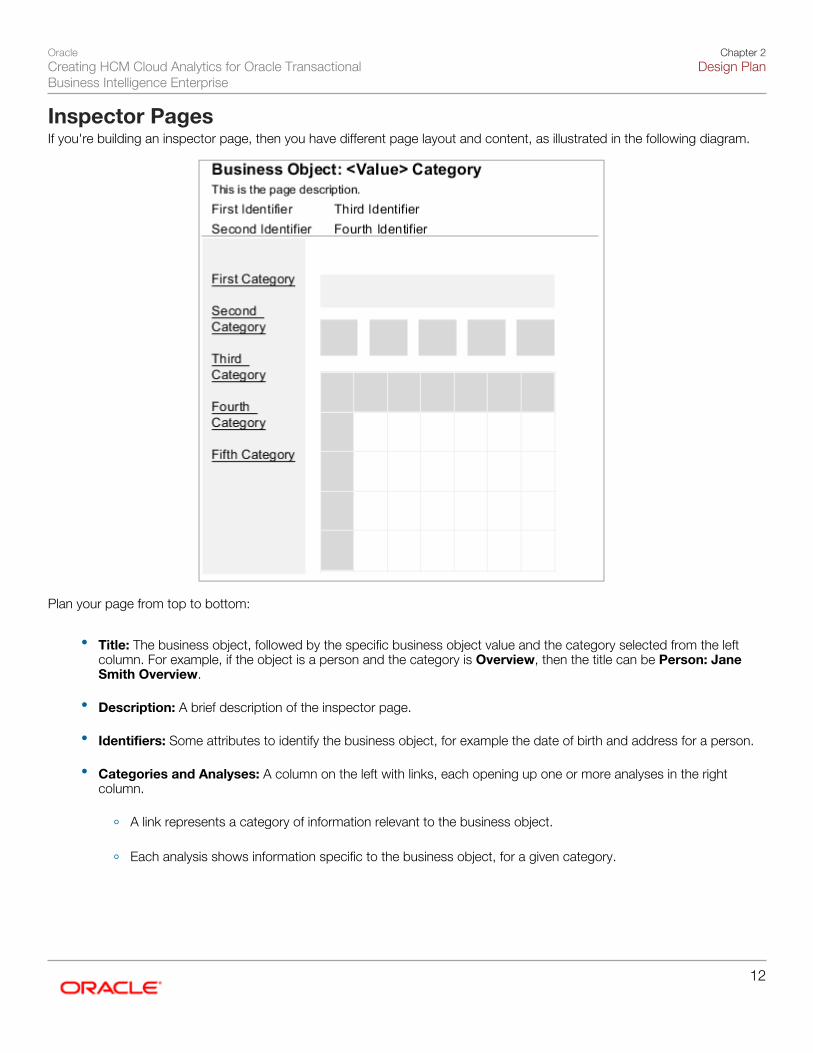
Inspector PagesIf you're building an inspector page, then you have different page layout and content, as illustrated in the following diagram.
Plan your page from top to bottom:
• Title: The business object, followed by the specific business object value and the category selected from the leftcolumn. For example, if the object is a person and the category is Overview, then the title can be Person: JaneSmith Overview.
• Description: A brief description of the inspector page.
• Identifiers: Some attributes to identify the business object, for example the date of birth and address for a person.
• Categories and Analyses: A column on the left with links, each opening up one or more analyses in the rightcolumn.
◦ A link represents a category of information relevant to the business object.
◦ Each analysis shows information specific to the business object, for a given category.

OracleCreating HCM Cloud Analytics for Oracle TransactionalBusiness Intelligence Enterprise
Chapter 2Design Plan
13
Note
◦ As always, put the more important analyses at the top of the page.
◦ If you have just one category for your business object, then you don't even need categories. Justpresent your analyses below the title and identifiers.

OracleCreating HCM Cloud Analytics for Oracle TransactionalBusiness Intelligence Enterprise
Chapter 2Design Plan
14

OracleCreating HCM Cloud Analytics for Oracle TransactionalBusiness Intelligence Enterprise
Chapter 3Dashboard Components
15
3 Dashboard Components
Creating Analyses and Other DashboardComponents: OverviewBefore you create your perspective and detail pages, you create analyses, prompts, and any other dashboard componentthat must be saved separately in the business intelligence catalog. You later add these components to your dashboardpages.
General ConsiderationsWhen you create your dashboard components:
• Keep in mind that the components don't have their final look until you add them to a dashboard page.
• Leave settings in their default state unless specified otherwise.
• Keep titles for analyses as short as possible.
NoteYou might not even need to display a title, for example for tables used in detail pages.
Dashboard ComponentsThe following table lists some of the dashboard components that you can create and includes an example of the componenton the HR Executive Dashboard.
NoteNot all components of the HR Executive Dashboard are included in this table. The components that are morecommon, such as tables and graphs are not included.
Dashboard Component Description Example on HR ExecutiveDashboard
Performance tile
Displays a single aggregatemeasure value in a manner that isboth visually simple and prominent,yet it immediately reveals summarymetrics to the user that will likely bepresented in more detail within adashboard view.Performance tiles:
• Focus the user's attention onsimple, need-to-know facts
Headcount tile on the WorkforceHealth Summary page

OracleCreating HCM Cloud Analytics for Oracle TransactionalBusiness Intelligence Enterprise
Chapter 3Dashboard Components
16
Dashboard Component Description Example on HR ExecutiveDashboard
directly and prominently onthe tile.
• Communicate status throughsimple formatting by usingcolor, labels, and limitedstyles, or through conditionalformatting of the backgroundcolor or measure valueto make the tile visuallyprominent. For example, ifrevenue is not tracking totarget, the revenue value mayappear in red.
• Respond to prompts,filters, and user roles andpermissions by making themrelevant to the user and theircontext.
• Support a single, aggregateor calculated value.
Treemap
Displays a space-constrained,two-dimensional visualization forhierarchical structures with multiplelevels.Treemaps:
• Are limited by a predefinedarea and display two levels ofdata.
• Contain rectangular tiles. Thesize of the tile is based ona measure, and the color ofthe tile is based on a secondmeasure.
• Are similar to a scatter plotgraphs in that the map areais constrained, and the graphallows you to visualize largequantities of data and quicklyidentify trends and anomalieswithin that data.
Headcount treemap on theWorkforce Health Summary page
View selector
Adds a view selector in the results.A view selector is a drop-downlist from which users can select a
View list for the WorkforceDemographics analysis on theDemographics page that enables

OracleCreating HCM Cloud Analytics for Oracle TransactionalBusiness Intelligence Enterprise
Chapter 3Dashboard Components
17
Dashboard Component Description Example on HR ExecutiveDashboard
specific view of the results fromamong the saved views.
you to view by Gender, Age,Ethnicity, and Country
Narrative
Displays the results as one or moreparagraphs of text. You can typein a sentence with placeholdersfor each column in the results,and specify how rows should beseparated.
Refresh date banner
Dashboard prompts
A type of filter that applies to allitems in a dashboard. Dashboardprompts are created outside ofa specific dashboard and arestored in the catalog as objects,which can then be added to anydashboard or dashboard pagethat contains the columns that arespecified in the prompt. Dashboardprompts enable you to specify thedata values that determine thecontent of all of the analyses andscorecard objects contained on thedashboard.
Drop-down lists that appear onthe left-side of all of the dashboardpages except the Overview andSample Content pages. Examplesinclude; Time, Country, Manager,and Job Family.
Microchart, sparkline type
A text-sized graphic (of similar sizeto a piece of nearby text) that isideal for showing trend information. A microchart does not have axesor legends. Like larger graphs, amicrochart's measure values arerendered as relatively sized bars (orlines, or area). Each measure nameis displayed in its column header.Further details of the measureappear as tooltip text when youhover the mouse over a data cell.
Graphs that appear directly belowthe performance tiles on all pagesexcept the Overview and SampleContent pages
Using Color in Analyses: Points to ConsiderColor is usually used in analyses for a purpose, to convey meaning.
Considerations for ColorWhen you create your analyses (and even before), keep in mind the following points.
• Use default colors for charts and tables, unless specified otherwise.

OracleCreating HCM Cloud Analytics for Oracle TransactionalBusiness Intelligence Enterprise
Chapter 3Dashboard Components
18
• To be consistent with predefined analyses, use the following colors to convey severity:
◦ High: #C13E43
◦ Medium: #ED6647
◦ Low: #555555
• If a default color is something that already has a special meaning in your analyses, for example to convey severity,then override the default with a neutral color such as:
◦ #E371B2
◦ #47BDEF
◦ #009B7C
◦ #FAD55C
• You might have multiple views or analyses with a graphical element, such as a bar or line, that represents the samevalue or category. Use the same color for this element in all the affected views or analyses, to make it easier for usersto see relationships across multiple charts.
Creating Charts: ProcedureOn dashboard pages, especially perspective pages, information is mostly conveyed using charts. That means you createanalyses with views such as Graph, Treemap, or Funnel.
Creating Charts for Dashboard PagesFollow these steps:
1. Click the New menu, and select Analysis under Analysis and Interactive Reporting.
2. Select a subject area.
3. In the Subject Areas pane on the Criteria tab, double-click the columns to include, or drag them to the SelectedColumns pane.
4. Open the Results tab.
5. Click the Edit View icon for the Title view, and enter a short analysis title.
6. In the Views pane, click the New View icon and select Static Text under Other Views.
7. Enter the short description for your analysis, and click Done.
8. With static text selected in the Views pane, click the Add View icon.
9. For the Compound Layout, drag the static text container and drop it below the title.
10. Click the Remove View from Compound Layout icon for the Table view.
11. Click the New View icon, and select the type of chart you want.
12. Click the icon that opens the view properties.

OracleCreating HCM Cloud Analytics for Oracle TransactionalBusiness Intelligence Enterprise
Chapter 3Dashboard Components
19
13. Enter a size that doesn't make users scroll horizontally to see the whole chart.
◦ Common sizes to use include:
• Width: 850 and Height: 350
• Width: 850 and Height: 330
◦ For larger graphs, such as treemaps, the largest you should go is 850 for width, 375 for height.
◦ For shorter graphs, such as timelines, you can use 850 for width, 250 for height.
14. Select Top for the Legend field, if available.
15. Click OK.
16. Make other changes for your chart as needed, and click Done.
17. In the Views pane, select the view for your chart, and click the Add View icon.
18. Add more views for your analysis as needed.
19. Save your analysis under Shared Folders - Custom.
TipTake a look at the structure in the catalog for predefined analytics, and consider using a similar structurewithin the Custom folder.
Creating Tables: ProcedureFor your dashboard, you use tables mostly for detail pages, especially show data pages. For tables, you create analyses withthe Table or Pivot Table view. A special type of table you create would be for the identifiers that you put in the page header ofinspector pages.
Creating General Tables for Dashboard PagesFollow these steps:
1. Click the New menu, and select Analysis under Analysis and Interactive Reporting.
2. Select a subject area.
3. In the Subject Areas pane on the Criteria tab, double-click the columns to include, or drag them to the SelectedColumns pane.
4. Open the Results tab.
5. If you want to display a title, click the Edit View icon for the Title view, and enter your text. If not, click the RemoveView from Compound Layout icon.
6. If you want to display a short description below the title:
a. In the Views pane, click the New View icon and select Static Text under Other Views.
b. Enter the short description for your analysis, and click Done.

OracleCreating HCM Cloud Analytics for Oracle TransactionalBusiness Intelligence Enterprise
Chapter 3Dashboard Components
20
c. With static text selected in the Views pane, click the Add View icon.
d. For the Compound Layout, drag the static text container and drop it below the title.
7. Click the View Properties icon for the Table view.
8. For the Data Viewing option, select Fixed headers with scrolling content.
9. Enter the maximum table size:
◦ For show data pages, use 1010 for width and 500 for height.
◦ For other pages, use 850 for width and 330 for height.
10. Click OK.
11. Click the Edit View icon for the Table view to make other changes for your table as needed, and click Done.
NoteFor show data pages, you add the Export link later, as part of creating the show data page.
12. Save your analysis under Shared Folders - Custom.
TipTake a look at the structure in the catalog for predefined analytics, and consider using a similar structurewithin the Custom folder.
Creating Tables for Identifiers in Inspector PagesFollow these steps:
1. Click the New menu, and select Analysis under Analysis and Interactive Reporting.
2. Select a subject area.
3. In the Subject Areas pane on the Criteria tab, double-click the columns to include, or drag them to the SelectedColumns pane. Include the columns that represent each identifier, as well as one other similar column (whichdoesn't appear to users).
4. Open the Results tab.
5. For the Title view, click the Remove View from Compound Layout icon.
6. For the Table view, click the Edit icon.
7. In the Layout section, move each identifier under Sections in the order you want them to appear as a column ofidentifiers. Leave the one additional column under the Columns and Measures section.
8. Click the Section Properties icon.
9. Select the Display Heading check box, and click OK.
10. For each identifier under Sections other than the first, click the More Options icon, and select Place Value inNew Row.
11. In the Columns and Measures section, click the Column and Measure Properties icon.
12. Select Off for Column Labels, and click OK.
OracleCreating HCM Cloud Analytics for Oracle TransactionalBusiness Intelligence Enterprise
Chapter 3Dashboard Components
21
13. For the single column in the Columns and Measures section, click the More Options icon, and select FormatValues.
14. Expand the Custom CSS Style Options (HTML Only) section.15. Select the Use Custom CSS Style check box, and enter display:none;.16. Click OK, then Done.17. Create more table views as needed, one for each column of identifiers you want on your inspector page.18. Save your analysis in an appropriate folder under Shared Folders - Custom.
Using Shared Filters in a Custom Dashboard orAnalysis: Worked ExampleThis example describes available shared filters and illustrates how to use a shared filter that is similar to those on the HRExecutive Dashboard.
Under Catalog, shared filters can be found by expanding Shared Folders folder, then expanding theHuman CapitalManagement folder, then expanding the Subject Area Contents folder and then expanding the Human Resources -Workforce Deployment folder.
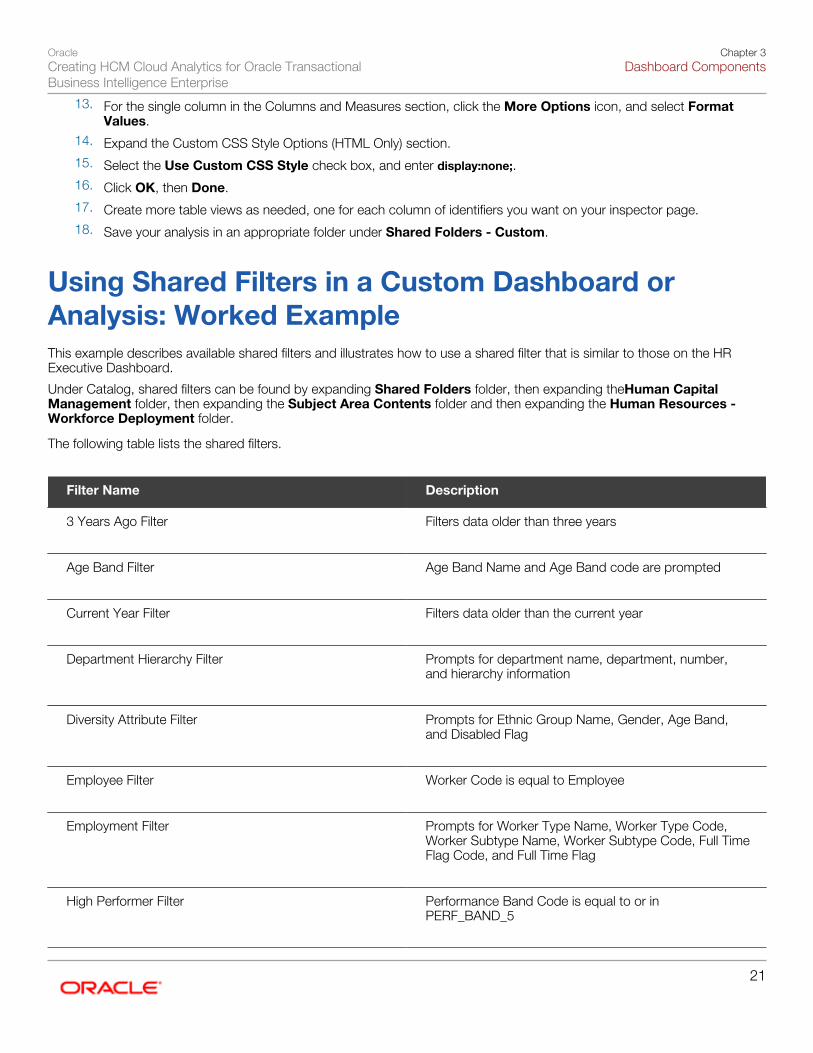
The following table lists the shared filters.
Filter Name Description
3 Years Ago Filter
Filters data older than three years
Age Band Filter
Age Band Name and Age Band code are prompted
Current Year Filter
Filters data older than the current year
Department Hierarchy Filter
Prompts for department name, department, number,and hierarchy information
Diversity Attribute Filter
Prompts for Ethnic Group Name, Gender, Age Band,and Disabled Flag
Employee Filter
Worker Code is equal to Employee
Employment Filter
Prompts for Worker Type Name, Worker Type Code,Worker Subtype Name, Worker Subtype Code, Full TimeFlag Code, and Full Time Flag
High Performer Filter
Performance Band Code is equal to or inPERF_BAND_5

OracleCreating HCM Cloud Analytics for Oracle TransactionalBusiness Intelligence Enterprise
Chapter 3Dashboard Components
22
Filter Name Description
Hire Filter
Event Group Code is equal to or in HIRE
Job Attribute Filter
Prompts for a list of job attributes
Location Filter
Prompts for Location Country Name, Location SourceState Code, Location City, Location Name, and LocationNumber
Org & Location Prompt
Prompts for Department Name and Location Name
Person Filter
Prompts for Person Number, Assignment Number, andPerson Display Name
Supervisor Filter
Prompts for Supervisor Name and Supervisor EmployeeNumber
Supervisor Hierarchy Filter
Prompts for Top Level Supervisor Name, Level 1Supervisor Name through Level 16 Supervisor Names,Supervisor Display Name and Supervisor Number.
Termination Filter
Event Group Name is equal to/ is in Termination
Termination Flag Filter
Termination Flag Code is equal to/is in Y
Trailing Twelve Months
Month is greater than @{CAL_ MONTH_ YEAR_AGO}and Month is less than or equal to @{CURRENT_MONTH}
Voluntary Filter
Event Sub Group Code is equal to /is inTERM~VOLUNTARY; TERM_ VOLUNTARY
Year Quarter Month Filter
Prompts for Year, Quarter, Month, Year Name, QuarterName, and Month Name
Using Shared Filters
1. Access the Home page for Oracle Business Intelligence Enterprise Edition.
2. Click Catalog to open the Oracle Business Intelligence Catalog.

OracleCreating HCM Cloud Analytics for Oracle TransactionalBusiness Intelligence Enterprise
Chapter 3Dashboard Components
23
3. Click New.
4. Under Analysis and Interactive Reporting, select Analysis.
5. Select the Human Resources - Workforce Deployment subject area.
All subject areas for Oracle Transactional Business Intelligence Enterprise are preceded with Human Resources.
6. Expand the Facts - Human Resources - Workforce Deployment folder.
7. Expand the Workforce Deployment Facts folder.
8. Double-click Headcount to move it to the Selected Columns region.
9. Under Catalog expand the Shared Folders folder.
10. Expand the Human Capital Management folder.
11. Expand the Subject Area Contents folder.
12. Expand the Human Resources - Workforce Deployment folder.
13. Scroll down to see the available filters and select one from the list.
14. Click Add More Options and click OK to apply the filter.
Creating Shared Filters: Worked ExampleThis example illustrates how to create a shared filter that is similar to those on the HR Executive Dashboard. Use this exampleto help you create custom shared filters.
Under Catalog, shared filters can be found by expanding the Shared Folders folder, then expanding theHuman CapitalManagement folder, and then expanding the Subject Area Contents folder.
Creating Shared Filters
1. Access the Home page.
2. Under Create, click Analysis.
3. Select the Human Resources - Workforce Deployment subject area.
All subject areas for Oracle Transactional Business Intelligence Enterprise are preceded with Human Resources.
4. Expand the Facts - Human Resources - Workforce Deployment folder.
5. Expand the Workforce Deployment Facts folder.
6. Double-click Headcount to use it in the filter.
7. Select an Operator such as is equal to and enter a Value such as 200.
8. Click Save Filter and navigate to /Shared Folders/Human Capital Management/ Subject Area Contents/HumanResources - Workforce Deployment.

OracleCreating HCM Cloud Analytics for Oracle TransactionalBusiness Intelligence Enterprise
Chapter 3Dashboard Components
24
9. Enter a Name for your filter and enter a Description.
10. Click OK.
Creating a Performance Tile: Worked ExampleThis example illustrates how to create a performance tile that is similar to the one showing headcount on the WorkforceHealth Summary page on the HR Executive Dashboard. Use this example to help you create a custom performance tile.
To create a performance tile:
1. Specify the criteria.
2. Add the performance tile view to the results.
Specifying the Criteria
1. Access the Home page.
2. Under Create, click Analysis.
3. Select the Human Resources - Workforce Deployment subject area.
All subject areas for Oracle Transactional Business Intelligence Enterprise are preceded with Human Resources.
4. Expand the Facts - Human Resources - Workforce Deployment folder.
5. Expand the Workforce Deployment Facts folder.
6. Double-click Headcount to move it to the Selected Columns region.
Adding the Performance Tile View to the Results
1. Click the Results tab.
2. In the bottom left corner, click New View and select Performance Tile.
3. Click the Performance Tile Properties icon.
4. For the Tile Size, select Custom.
5. Enter 140 for Width.
6. Enter 80 for Height.
7. Select the Utilize Available Spaceoption.
8. Leave Compress Value selected.
9. Click Edit Conditional Formatting.

OracleCreating HCM Cloud Analytics for Oracle TransactionalBusiness Intelligence Enterprise
Chapter 3Dashboard Components
25
The next few steps show how to format the headcount value to appear in a specific color under certain conditions.For example, the number should appear red when headcount exceeds the target set by your organization. Followthese recommendations when assigning colors to the numbers in your performance tile so that colors have thesame meaning across all analyses that you create:
◦ Exceeds target: #68C182
◦ No condition: #000000
◦ Danger of not meeting target: #FFB54D
◦ Below target: #C13E43
10. In the Conditional Formatting dialog box, click Add Condition and select Headcount.
11. In the New Condition dialog box, select an operator, such as Is Greater Than.
12. In the Value field, enter a target number, such as 5,000 for headcount and click OK.
13. In the Edit Format dialog box, click the drop down list in the Background Color field.
14. In the Color Selector dialog box, enter the hex code for the color that represents the condition corresponding to theoperator and target that you entered in steps 11 and 12. For example, if your target for headcount is 5,000, youwant the number to appear in red when it exceeds the target.
15. Click OK.
16. In the Edit Format dialog box, click OK.
17. In the Conditional Formatting dialog box, click OK.
18. In the Performance Tile Properties dialog box, click OK.
19. Click OK.
20. Click Save.
21. To add the small graph that appears below the Headcount performance tile, create a micro sparkline.
Creating a Micro Sparkline: Worked ExampleThis example illustrates how to create a micro sparkline that is similar to the one at the top of the Headcount page on the HRExecutive Dashboard. Use this example to help you create a custom micro sparkline.
To create a micro sparkline:
• Specify the criteria.
• Apply the filter.
• Add the sparkline.

OracleCreating HCM Cloud Analytics for Oracle TransactionalBusiness Intelligence Enterprise
Chapter 3Dashboard Components
26
Specifying the Criteria
1. Access the Home page for Oracle Business Intelligence Enterprise Edition.
2. Under Create, click Analysis.
3. Select the Human Resources - Workforce Deployment subject area.
All subject areas for Oracle Transactional Business Intelligence Enterprise are preceded with Human Resources.
4. Expand the Facts - Human Resources - Workforce Deployment folder.
5. Expand the Time folder.
6. Expand the Gregorian Calendar folder.
7. Double-click Month Name to move it to the Selected Columns region.
8. Expand the Workforce Deployment Facts folder.
9. Double-click Headcount to move it to the Selected Columns region.
Applying the Filter
1. To apply a shared filter, in the bottom left corner in Catalog, expand the Shared Folders folder.
2. Expand the Human Capital Management folder.
3. Expand the Subject Area Contents folder.
4. Expand the Human Resources - Workforce Deployment folder.
5. Expand the Role Dashboards folder.
6. Double-click Last 12 Months filter and click OK.
Creating a Micro Sparkline
1. Click the Results tab.
2. In the bottom left corner, in Views select the Title and click Remove View from Analysis.
3. Select Table and click Remove View from Analysis.
This step removes the table from the results.
4. Near the center of the screen, under Compound Layout, click New View select Graph and Line Graph.
5. In the graph, click Edit Graph Properties and enter 100 for Canvas Width.
OracleCreating HCM Cloud Analytics for Oracle TransactionalBusiness Intelligence Enterprise
Chapter 3Dashboard Components
27
6. Enter 50 for Canvas Height.
7. For Legend select None.
8. Click the Style tab and in Plot Area, click the Specify button to deselect Gridlines.
9. Click the Titles and Labels tab and click the Title check box to remove the graph title.
10. Click the Vertical Axis check box to remove the title on the vertical axis.
11. Click the Horizontal Axis check box to remove the title on the horizontal axis.
12. Click the icon next to Vertical Axis Labels and select Hide in the Axis Labels field, then click OK.
13. Under Labels, click the icon next to Horizontal Axis Labels and select Hide in the Axis Labels then click OK.
14. Click OK.
15. Click Done.
Creating a Treemap: Worked ExampleThis example illustrates how to create a tree map that is similar to one showing headcount on the Workforce HealthySummary page on the HR Executive Dashboard. Use this example to help you create a custom treemap.
To create a treemap:
1. Set up the criteria.
2. Add the treemap to the results.
Setting up the Criteria
1. Access the Home page for Oracle Business Intelligence Enterprise Edition.
2. Under Create, click Analysis.
3. Select the Human Resources - Workforce Deployment subject area.
All subject areas for Oracle Transactional Business Intelligence Enterprise are preceded with Human Resources.
4. Expand the Facts - Human Resources - Workforce Deployment folder.
5. Expand the Workforce Deployment Facts folder.
6. Double-click Headcount to move it to the Selected Columns region.
7. Double-click Active Headcount to move it to the Selected Columns Region.
8. Expand the Hierarchies folder.
9. Expand the Department Hierarchy folder.
OracleCreating HCM Cloud Analytics for Oracle TransactionalBusiness Intelligence Enterprise
Chapter 3Dashboard Components
28
10. Double-click Department Hierarchy 13 to move it to the Selected Columns Region.
Adding the Treemap to the Results
1. Click the Results tab.
2. In the bottom left corner, click New View and select Treemap.
3. Drag Department Hierarchy 13 Name into the Group By boxes.
4. For Size By , select Headcount.
5. For Color By, select Active Headcount.
6. For Style, select Percentile Binning.
7. For Bins, select Quartile (4).
8. Use the default color values.
9. Click Done.
Creating a View Selector: Worked ExampleThis example illustrates how to create a view selector that is similar to those on the HR Executive Dashboard. Use thisexample to help you create a custom view selctor.
To create a view selector:
1. Set up the criteria.
2. Add the view selector.
3. Create views for the view selector.
4. Add the view selector to the layout.
Setting Up the Criteria
1. Access the Home page for Oracle Business Intelligence Enterprise Edition.
2. Under Create, click Analysis.
3. Select the Human Resources - Workforce Deployment subject area.
All subject areas for Oracle Transactional Business Intelligence Enterprise are preceded with Human Resources.
4. Expand the Facts - Human Resources - Workforce Deployment folder.

OracleCreating HCM Cloud Analytics for Oracle TransactionalBusiness Intelligence Enterprise
Chapter 3Dashboard Components
29
5. Expand the Workforce Deployment Facts folder.
6. Double-click Headcount to move it to the Selected Columns region.
7. Expand the Hierarchies folder.
8. Expand the Department Hierarchies folder.
9. Double-click Department Hierarchy Name 12 to move it to the Selected Columns region.
10. Expand the Worker Dimensions folder.
11. Expand the Location folder.
12. Double-click Location Country Name to move it to the Selected Columns region.
13. Expand the Employment folder.
14. Double-click Worker Type Name to move it to the Selected Columns region.
15. Double-click Salary Basis Name to move it to the Selected Columns region.
16. Double-click Employee Category Name to move it to the Selected Columns region.
Adding a View Selector
1. Click the Results tab.
2. In the bottom left corner, click New View and select Other Views and View Selector.
3. For the Caption enter View By.
4. Click Done.
Creating Views for the View Selector
1. In the bottom left corner, click New View , select Graph, and select a graph type such as Bar and Horizontal.
2. In the center of the page above the graph click Rename View and enter Headcount then click OK.
3. To clean up the appearance, in the Layout section under Measures, drag Worker Type Name to Excluded.
4. Under Graph Prompts drag Headcount to Measures.
5. Click Done.
6. To add a second graph, in the bottom left corner, click New View , select Graph, and select a graph type such asBar and Horizontal.
7. Above the graph click Rename View and enter Worker Type Name then click OK.
8. To clean up the appearance, in the Layout section under Measures, drag Headcount to Excluded.
9. Under Graph Prompts drag Worker Type Name to Measures.

OracleCreating HCM Cloud Analytics for Oracle TransactionalBusiness Intelligence Enterprise
Chapter 3Dashboard Components
30
10. Click Done.
Add the View Selector to the Layout
1. Under Views select Table and click Remove View from Analysis.
This step is optional. You perform this step to remove the table from the final results.
2. Select View Selector and drag it to the Compound Layout under the Title component until you see a blue bar andrelease.
3. Click Edit View to edit the View Selector. While holding down the Control key, select Headcount and WorkerType Name and click the right arrow > to move them to Views Included.
4. Click Done.
Copying and Editing an ETL Refresh Date Banner:Worked ExampleThis example illustrates how to create an ETL refresh date banner that is similar to those on the HR Executive Dashboard.The ETL refresh date banner shows the date that the data was last refreshed. You can copy the existing banner and add it toyour custom dashboard.
To create an ETL Refresh Date Banner:
1. Open the HR Executive Dashboard, select the ETL refresh date banner, and save a copy to the folder where yourdashboard objects are located.
2. Place the saved banner into your dashboard.
3. View the banner properties and edit the banner text.
Copying the ETL Refresh Date Banner
1. Access the Home page.
2. Click Catalog to open the catalog.
3. Click Dashboards and select the HR Executive Dashboard.
4. From the Overview page, click Page Options.
5. Click Edit Dashboard.
6. Scroll down and select the Banner Compound View at the bottom of the page.
7. Click Properties and click Edit Analysis.

OracleCreating HCM Cloud Analytics for Oracle TransactionalBusiness Intelligence Enterprise
Chapter 3Dashboard Components
31
8. Click Save As in the upper right corner and navigate to the folder where your dashboard is located.
9. Click OK.
Placing the Banner into a Dashboard
1. Open your dashboard.
You can click Dashboards and select it from the list.
2. Click Page Options and select Edit Dashboard.
If needed, from Dashboard Objects, drag a Section to the layout to contain the banner.
3. From Catalog, expand Shared Folders and navigate to where you saved the banner.
4. Drag the Banner into the Section.
5. Select the Section and choose Format Section.
6. Expand Custom CSS Style Options (HTML Only) and make sure Use Custom CSS Class app_status is checkedor enter app_status in the field if needed.
7. Click OK.
8. Click Save.
Viewing the Banner Properties
1. Select the Banner, click Properties and click Edit Analysis.
2. Click the Narrative object and click Edit View.
3. Click the Criteria tab.
4. For each of the fields in the Selected Columns, click the drop-down next to the field name and select EditFormula to view the formula used for that field.
Edit these formulas with caution. You can change the text that displays in the banner.
5. Click OK.
6. If you made any changes, click Save Analysis.
Creating an Action Link to Drill Into an OrganizationalDashboard: Worked ExampleThis example illustrates how to create an action link that is similar to those on the HR Executive Dashboard.

OracleCreating HCM Cloud Analytics for Oracle TransactionalBusiness Intelligence Enterprise
Chapter 3Dashboard Components
32
To create an action link:
1. Open the dashboard you want to use.
2. Identify the analysis that you want to add an action to.
3. Identify the destination where you want the action to go to.
4. Add the action link.
Creating an Action Link
1. Access the Home page for Oracle Business Intelligence Enterprise Edition.
2. Click Catalog to open the Oracle Business Intelligence Catalog.
3. Open the dashboard you want to use.
You can click Dashboards and select it from the list, or you can click Open and select it from the list.
4. Click Page Options and select Edit Dashboard.
5. Select the analysis you want to add an action to, click Properties, and select Edit Analysis.
6. Click the Criteria tab.
7. Select the column (dimension or metric, or both), then click Column Properties.
8. Click the Interaction tab and select Action Links, then click the Add Action Link button above the table.
9. Click Create a New Action and select Navigate to BI Content.
10. Navigate to the folder that contains the content you want to link to and select that object.
11. In the Create New Action dialog box, click OK.
12. In the New Action Link dialog box, click OK.
13. In the Column Properties dialog box, click OK.
14. Click Save.
Creating Dashboard Prompts: ProcedureIn most cases, you use the same prompts in the left column of every perspective and detail pages in your dashboard. Thatmeans you create only one prompts object in the catalog, and reuse it for every page. For exceptions, you create additionalprompts and use them only in select pages.
Creating Prompts for Dashboard PagesFollow these steps:
1. Click the New menu, and select Dashboard Prompt under Analysis and Interactive Reporting.

OracleCreating HCM Cloud Analytics for Oracle TransactionalBusiness Intelligence Enterprise
Chapter 3Dashboard Components
33
2. Select a subject area.
3. In the Definition section, click the New icon and select Column Prompt.
4. Select a column and click OK.
5. Specify settings for the prompt, and click OK.
6. Repeat steps 3 through 5 for each prompt you want.
7. In the Display section, click the Edit icon.
8. Delete the value in the Title field.
9. For the Prompt Display field, select Place label above prompt.
10. Select the Set width of all prompts to check box, and leave the value at 120 pixels.
11. Deselect the Show Apply button check box.
NoteYou can reselect this option later, if leaving out the Apply button causes performance issues.
12. Click OK.
13. Make other changes for your prompts, as needed.
14. Save your prompts under Shared Folders - Custom.
TipTake a look at the structure in the catalog for predefined analytics, and consider using a similar structurewithin the Custom folder.
Setting the Dashboard Prompts: Worked ExampleThis example illustrates how to set up the dashboard prompts that you use when viewing the HR Executive Dashboard. Youcan set the prompts on any of the pages other than the Overview Page. You can save the prompts for global use or for yourown use.
The prompt values that you set are then applied to all of the other pages in the HR Executive Dashboard, including theOverview page.
Setting the Dashboard Prompts
1. From the HR Executive Dashboard click one of the tabs such as Workforce Health Summary.

OracleCreating HCM Cloud Analytics for Oracle TransactionalBusiness Intelligence Enterprise
Chapter 3Dashboard Components
34
2. In the left column, select the criteria you want to use such as Time, Country, Manager, and so on. For example,set Time to 2013/01.
3. In the upper right corner click Page Options and select Save Current Customization.
4. Enter a name for the customization such as Year 2013.
5. To save the customization for your own use, click Me. To save it for global use, click Others and click SetPermissions.
6. Click Search for users, roles, or groups to browse available roles or groups or you can search for specific rolesor groups.
7. Click Add Roles/Groups and use Name to enter part of the name of a role or group then click Search.
8. Click a single result to select it and click > to move it to Selected Rows/Groups.
Or, click >> to select all of the accounts.
9. Click OK.
10. Click Make this my default for this page to set this as a default.
11. Click OK.

OracleCreating HCM Cloud Analytics for Oracle TransactionalBusiness Intelligence Enterprise
Chapter 4Dashboard Creation
35
4 Dashboard Creation
Creating Dashboards and Pages: OverviewAfter you create analyses, prompts, and any other custom components you need for your dashboard pages, you're ready tobuild your dashboard.
General ConsiderationsWhen you create your dashboard and all the pages:
• Leave settings in their default state unless specified otherwise.
• Avoid using custom HTML code and scripts.
• Use styles and colors as described in this chapter so that your pages look consistent with predefined dashboards.
Process OverviewTo build your dashboard in the application:
1. Create a dashboard, which starts out blank, and set its properties. Or, you can copy a predefined dashboard andcustomize it.
2. Create perspective pages within your dashboard.
3. Create detail pages within your dashboard.
NoteYou create a separate dashboard for each inspector page.
4. Back in the main body of perspective pages, where analyses are displayed, create links that go to detail pages.
Creating Dashboards and Setting Properties:ProcedureLike analyses and prompts, a dashboard is an individual item that you create and then save in the catalog. As part of creatingyour dashboard, you need to set the style in the dashboard properties, which affects how every page in the dashboard looks.
Creating Your DashboardFollow these steps:
1. Click the New menu, and select Dashboard under Analysis and Interactive Reporting.

OracleCreating HCM Cloud Analytics for Oracle TransactionalBusiness Intelligence Enterprise
Chapter 4Dashboard Creation
36
2. Enter the dashboard name to appear under the Dashboards menu.
3. Keep the default location of the dashboard in the catalog, within Shared Folders - Custom - Dashboard.
4. Choose to add content now, and click OK.
5. In the dashboard edit mode, click the Tools icon, and select Dashboard Properties.
6. Select BIAppsCloud as the style.
7. Select page 1 in the Dashboard Pages table, and click the Rename icon.
8. Enter the name of the first perspective page you want to build, and click OK. Users see this name in the row of tabson the dashboard.
9. Deselect the Show Add To Briefing Book check box.
10. Click OK, and save your dashboard.
Copying the HR Executive Dashboard: WorkedExampleTo create a custom dashboard for Oracle Transactional Business Intelligence Enterprise, you can either create a newdashboard following the guidelines and procedures in this guide, or you can copy the HR Executive Dashboard and makechanges to the copy.
Creating a Copy of the HR Executive Dashboard
1. Access the Home page for Oracle Business Intelligence Enterprise Edition.
2. Click Catalog to open the Business Intelligence Catalog.
3. Expand Shared Folders.
4. Expand Human Capital Management.
5. Expand Dashboards.
6. Click Dashboards and select the HR Executive Dashboard.
7. At the top of the page, click the Edit icon.
The Edit icon resembles a pencil.
8. In the upper-right corner of the page, click Save Dashboard As and navigate to the folder where you want tocreate your new dashboard such as /Shared Folders/Custom Dashboards.
9. Edit the Name HR Executive Dashboard to change it to a customized name.
10. Enter a Description such as Customized HR Dashboard.

OracleCreating HCM Cloud Analytics for Oracle TransactionalBusiness Intelligence Enterprise
Chapter 4Dashboard Creation
37
11. Click OK.
12. To customize a page, click Page Options and select Edit Dashboard.
13. To customize an element on the page, click Properties and select an item to edit, for example, select EditAnalysis.
Creating Perspective Pages: ProcedureBy default, a new dashboard comes with one blank page that you can use for your first perspective page. You can add moreperspective pages, each as a tab in the dashboard. For each page, you determine the layout using columns and sections,add analyses and other content, and set properties for components within the page.
Adding and Reordering Perspective PagesTo add perspective pages, with your dashboard in edit mode:
1. Click the Add Dashboard Page icon.
2. Enter the name you want users to see in the row of tabs on the dashboard, and click OK.
3. Repeat steps 1 and 2 to add more pages.
4. Click the Tools icon, and select Dashboard Properties.
5. In the Dashboard Pages table, deselect the Show Add To Briefing Book check box for each page.
6. To reorder pages, select the page you want to move and use the icons to the right of the table.
7. Click OK.
Adding PromptsTo put prompts on your perspective page:
1. From the Dashboard Objects pane, drag a column into the main area on the right.
2. Hover over the column, click the Properties icon, and select Column Properties.
3. Click the icon after the Background Color field to open the color selector.
4. Enter #F7F9FA, and click OK.
5. From the Dashboard Objects pane, drag a section into the column.
6. Hover over the section, click the Properties icon, and deselect Collapsible.
7. In the Catalog pane, open Shared Folders and find your prompt.
8. Select the prompt and drag it into the section.

OracleCreating HCM Cloud Analytics for Oracle TransactionalBusiness Intelligence Enterprise
Chapter 4Dashboard Creation
38
9. Save your work.
Creating the Page HeaderTo add the page title and description:
1. Put another column to the right of the prompts column.
2. Open the properties for the right column.
3. Expand the Additional Formatting Options section.
4. In the Indent (Left Padding) field, enter 10, and click OK.
5. Put a section into the column.
6. Open the section properties, and deselect Collapsible.
7. Open the section properties again and select Format Section.
8. Expand the Custom CSS Style Options (HTML Only) section.
9. Select the Use Custom CSS Class check box, and enter otbi_title in the field.
10. Click OK.
11. From the Dashboard Objects pane, drag a text into the section.
12. Hover over the text, and click the Properties icon.
13. Enter the page title, and click OK.
14. Put another section below the one for the title. This second section is for the page description.
15. Repeat steps 6 through 13, except:
◦ Enter otbi_subtitle for the custom CSS class.
◦ Enter the description instead of the page title.
16. Save your work.
Adding Performance TilesTo put the row of performance tiles on your perspective page:
1. Put another section below the page description.
2. Open the section properties, and deselect Collapsible.
3. In the Catalog pane, find each performance tile and drag it into the section.
4. If you also have sparklines for each tile, then put another section right below the one for the tiles.

OracleCreating HCM Cloud Analytics for Oracle TransactionalBusiness Intelligence Enterprise
Chapter 4Dashboard Creation
39
5. Repeat steps 2 and 3, except you're placing the corresponding sparkline from the catalog under each performancetile.
6. Save your work.
Adding AnalysesTo put the primary and additional analyses on your perspective page:
1. Put another section below the performance tiles or sparklines.
2. Open the section properties, and deselect Collapsible.
3. In the Catalog pane, find the analysis and drag it into the section.
4. If the default view is not what you want to show, hover over the analysis, click the Properties icon, and select theview you want under Show View.
5. Put more sections at the bottom, if needed, and repeat steps 2 through 4.
NoteIf any of the additional sections contain multiple analyses, then make sure to put them in the samesection.
6. Save your work.
Creating Standard Detail Pages and Show DataPages: ProcedureYou create standard detail pages and show data pages as part of your dashboard, but hide them so that they don't appearto the user as tabs in the dashboard. You then create links between the perspective and detail pages.
NoteFor show data pages, there's an extra procedure for adding an Export link.
Adding Detail PagesTo add detail pages, with your dashboard in edit mode:
1. Click the Add Dashboard Page icon.
2. Enter a brief name for the page, and click OK.
3. Repeat steps 1 and 2 to add more pages.
4. Click the Tools icon, and select Dashboard Properties.

OracleCreating HCM Cloud Analytics for Oracle TransactionalBusiness Intelligence Enterprise
Chapter 4Dashboard Creation
40
5. In the Dashboard Pages table, deselect the Show Add To Briefing Book check box for each page.
6. Select the Hide Page check box for each detail page.
7. Click OK.
Adding PromptsTo put prompts on your detail page:
1. From the Dashboard Objects pane, drag a column into the main area on the right.
2. Hover over the column, click the Properties icon, and select Column Properties.
3. Click the icon after the Background Color field to open the color selector.
4. Enter #F7F9FA, and click OK.
5. From the Dashboard Objects pane, drag a section into the column.
6. Hover over the section, click the Properties icon, and deselect Collapsible.
7. In the Catalog pane, open Shared Folders and find the same prompts used in the parent perspective page.
8. Select the prompt and drag it into the section.
9. Save your work.
Creating the Page HeaderTo add the parent perspective page title, the detail page title, and a link back to the perspective page:
1. Put another column to the right of the prompts column.
2. Open the properties for the right column.
3. Expand the Additional Formatting Options section.
4. In the Indent (Left Padding) field, enter 10, and click OK.
5. Put a section into the column.
6. Open the section properties, and deselect Collapsible.
7. Open the section properties again and select Format Section.
8. In the Cell section, select Bottom for the vertical alignment.
9. Expand the Custom CSS Style Options (HTML Only) section.
10. Select the Use Custom CSS Class check box, and enter otbi_title in the field.
11. Click OK.

OracleCreating HCM Cloud Analytics for Oracle TransactionalBusiness Intelligence Enterprise
Chapter 4Dashboard Creation
41
12. From the Dashboard Objects pane, drag a text into the section.
13. Hover over the text, and click the Properties icon.
14. Enter the same title as the parent perspective page, and click OK.
15. From the Dashboard Objects pane, drag an action link and drop it to the right of the title text.
16. Hover over the action link, and click the Properties icon.
17. For the link text, enter Go to followed by the parent perspective page name, the one that displays on the tab.
18. Click the New Action icon after the Action field, and select Navigate to BI Content.
19. Find and select the parent perspective page in the catalog, and click OK until you close all dialog boxes.
20. Put another section below the one for the parent page title. This second section is for the detail page title.
NoteIf you're creating a show data page, you don't need this section for a detail page title. You can just skipto step 22 and save your work.
21. Repeat steps 6 through 14, except:
◦ Skip step 8.
◦ Enter otbi_subpage for the custom CSS class.
◦ Enter the detail page title instead of the perspective page title. This should be the same as what you entered instep 9 when you created the dashboard for your detail page.
22. Save your work.
Adding AnalysesTo put analyses on your detail page:
1. Put another section under the page header.
2. Open the section properties, and deselect Collapsible.
3. In the Catalog pane, find the analysis and drag it into the section.
4. If the default view is not what you want to show, hover over the analysis, click the Properties icon, and select theview you want under Show View.
NoteIf you want to show the title view, set this first view to the title view, and then create another section rightbelow for another view of the same analysis.

OracleCreating HCM Cloud Analytics for Oracle TransactionalBusiness Intelligence Enterprise
Chapter 4Dashboard Creation
42
5. If you're not creating a show data page, then put more sections at the bottom, if needed, and repeat steps 2through 4.
NoteIf any section contains multiple analyses, then make sure to put them in the same section.
6. Save your work.
Adding Export LinkTo add an Export link below the table for a show data page:
1. Click the Tools icon and select Page Report Links.
2. Select the Customize option.
3. Select the Export check box.
4. Click OK.
5. Save your work.
Creating Inspector Pages: ProcedureYou create an inspector page as a separate dashboard with multiple hidden tabs, or dashboard pages. Each page representsa category of information describing that business object. For example, if your inspector page has three categories, thenyou create a dashboard with three dashboard pages. You then create links from data values on perspective pages to thecorresponding inspector page (usually, the dashboard page for the first category).
NoteAfter you preform the prerequisites and create the dashboard for your inspector page, follow the rest of the stepsfor each page in the dashboard.
PrerequisitesBefore you create your inspector page:
• Create a prompt with just one column, the one that you want to use for the link to open the inspector page. Forexample, if you want users to click on a person name to open an inspector page about that person, then use theperson name column. This prompt is used as part of creating the dashboard for your inspector page, so that thepage displays information for the right business object.
• Create an analysis to be used to show the business object value in the page title, for example the specific personname.
a. Add just one column, the same as the one for the prompt.

OracleCreating HCM Cloud Analytics for Oracle TransactionalBusiness Intelligence Enterprise
Chapter 4Dashboard Creation
43
b. Add a filter for the column, selecting is prompted for the Operator field.
c. In the Results tab, remove all views and add a Narrative view (found under Other Views).
d. Edit the view and enter @1 in the Narrative field.
• Create an analysis with table views that display the identifiers for your inspector page.
Creating the Dashboard for Your Inspector PageFollow these steps:
1. Click the New menu, and select Dashboard under Analysis and Interactive Reporting.
2. Enter a dashboard name, for example the business object that your inspector page is for.
3. Change the location of the dashboard in the catalog, from Shared Folders - Custom - Dashboard to anotherfolder under Custom, not Dashboard. This way the dashboard doesn't appear in the Dashboards menu.
4. Choose to add content now, and click OK.
5. Click the Add Dashboard Page icon.
6. Enter the name of the second category in the inspector page, and click OK
7. Repeat steps 5 and 6 to add more pages, one for each of the remaining categories.
8. Click the Tools icon, and select Dashboard Properties.
9. Select BIAppsCloud as the style.
10. Click the Edit icon after Filters and Variables.
11. Click the Embed new hidden dashboard prompt icon, find and select the prompt you created, and click OK untilyou're back in the Dashboard Properties dialog box.
12. Select page 1 in the Dashboard Pages table, and click the Rename icon.
13. Enter the name of the first category in the inspector page, and click OK.
14. For each row, select the Hide Page check box, and deselect the Show Add To Briefing Book check box.
15. Click OK, and save your dashboard.
Creating the Page HeaderTo add the page title, description, and identifiers:
1. From the Dashboard Objects pane, drag a column into the main area on the right.

OracleCreating HCM Cloud Analytics for Oracle TransactionalBusiness Intelligence Enterprise
Chapter 4Dashboard Creation
44
2. Hover over the column, click the Properties icon, and select Column Properties.
3. In the Border section, select the bottom border in the diagram.
4. Select Single for the Border Style field.
5. Enter #EEEEEE as the border color, and click OK until you close all dialog boxes.
6. Follow steps 5 through 14 for creating page headers in standard detail pages, except:
◦ Enter Top for the vertical alignment.
◦ For the text, enter the business object followed by a colon, for example Person:.
7. From the Catalog pane, find the analysis you created for the page title, and drop it to the right of the text object.
8. Put another text to the right of the analysis, with the name of the category.
9. Put another section below the first.
10. For the section properties, deselect Collapsible and enter otbi_subtitle for the custom CSS class.
11. Put a text in this section and enter the page description.
12. Put a section below the one for the page description.
13. For the section properties, deselect Collapsible and enter otbi_menu for the custom CSS class.
14. From the Catalog pane, find the analysis with the table views you created for the identifiers, and drop it in thissection.
15. Save your work.
Creating the Menu of CategoriesTo add a list of category links that appears on the left of your inspector page:
1. Put a column under the one for the page header.
2. Open the column properties
3. In the Border section, select the right border in the diagram.
4. Select Single for the Border Style field.
5. Enter #EEEEEE as the border color, and click OK.
6. In the Additional Formatting Options section, enter a width that accommodates the links without the nameswrapping too much, and click OK.
7. Put a section in this column.

OracleCreating HCM Cloud Analytics for Oracle TransactionalBusiness Intelligence Enterprise
Chapter 4Dashboard Creation
45
8. For the section properties:
◦ Deselect Collapsible.
◦ Select Left for the horizontal alignment.
◦ Enter otbi_menu for the custom CSS class
9. From the Dashboard Objects pane, drag an action link into the section.
10. Open the action link properties.
11. Enter the category name in the Link Text field.
12. Click the New Action icon after the Action field, and select Navigate to BI Content.
13. Find and select the dashboard page for this category in the catalog, and click OK until you close all dialog boxes.
14. Repeat steps 9 through 13 for other categories on your inspector page.
15. Save your work.
Adding AnalysesTo put analyses for the category on the dashboard page:
1. Put another column to the right of the one for the menu of categories.
2. Open the column properties
3. In the Additional Formatting Options section, enter 10 in the Indent (Left Padding) field, and click OK.
4. Put a section in this column.
5. For the section properties:
◦ Deselect Collapsible.
◦ Select Left for the horizontal alignment.
6. Add one or more analyses to the section.
7. Add additional sections and analyses as needed.
8. Save your work.
Adding Links to Detail Pages: ProcedureAfter you create your detail pages, you can add links to them from other pages. These steps follow the general patterns forlinking to detail pages: more information section, show data links, and inspector page navigation.

OracleCreating HCM Cloud Analytics for Oracle TransactionalBusiness Intelligence Enterprise
Chapter 4Dashboard Creation
46
More Information SectionsTo create a section containing links to detail pages for more information:
1. Open your perspective page in the edit mode.
2. From the Dashboard Objects pane, drag a section and drop it right below the section that you want to providemore information for.
3. Hover over the section, click the Properties icon, and select Show Section Title.
4. Open the section properties again, and select Rename.
5. Enter More followed by the name of the analysis or section that the detail pages support.
6. Open the section properties again, and select Format Section.
7. In the Cell section, select Left for the horizontal alignment.
8. Expand the Additional Formatting Options section.
9. Enter 15 in the Indent (Left Padding) field.
10. Expand the Custom CSS Style Options (HTML Only) section.
11. Select the Use Custom CSS Class check box, and enter otbi_simplelink in the field.
12. Click OK.
13. From the Dashboard Objects pane, drag an action link into the section.
14. Hover over the action link, and click the Properties icon.
15. For the link text, enter a question that summarizes what the detail page answers.
16. Click the New Action icon after the Action field, and select Navigate to BI Content.
17. Find and select the detail page in the catalog (under your dashboard), and click OK until you close all dialog boxes.
18. Repeat steps 13 through 17 for additional links, making sure to put all the links in the same section.
19. Save your work.
Show Data LinksTo add a link that opens a show data page:
1. Open your perspective page in the edit mode.
2. From the Dashboard Objects pane, drag an action link and drop it right below the corresponding analysis, in thesame section.

OracleCreating HCM Cloud Analytics for Oracle TransactionalBusiness Intelligence Enterprise
Chapter 4Dashboard Creation
47
3. Hover over the action link, and click the Properties icon.
4. For the link text, enter Show data.
5. Click the New Action icon after the Action field, and select Navigate to BI Content.
6. Find and select the show data page in the catalog, and click OK until you close all dialog boxes.
7. Save your work.
Inspector Page NavigationTo add a link that opens an inspector page:
1. Open in edit mode the page where you want to add the link.
2. Hover over the analysis that you want to link from, click the Properties icon, and select Edit Analysis.
3. Open the Criteria tab.
4. Click the icon after the column that you want to link from, and select Column Properties.
ImportantThis must be the same column that you used for the prompt for the inspector pages.
5. Open the Interaction tab.
6. In the Value section, select Action Links for the Primary Interaction field.
7. Click the Add Action Link icon.
8. Click the New Action icon after the Action field, and select Navigate to BI Content.
9. Find and select the inspector page (for the first category) in the catalog, and click OK.
10. In the Create New Action dialog box, click the Options button.
11. Select the Open In New Window check box, and click OK until you close all dialog boxes.
12. Save your work.

OracleCreating HCM Cloud Analytics for Oracle TransactionalBusiness Intelligence Enterprise
Chapter 4Dashboard Creation
48

OracleCreating HCM Cloud Analytics for Oracle TransactionalBusiness Intelligence Enterprise
Glossary
49
Glossary
analysis
A selection of data displayed in one or more views, such as a table or chart, to provide answers to business questions.
analytics
Business intelligence objects such as analyses and dashboards that provide meaningful data to help with decision making.
business intelligence catalog
The repository where all business intelligence objects, including analytics, reports, briefing books, and agents, are stored. Thecatalog contains separate folders for personal, shared, and custom objects.
dashboard
A collection of analyses and other content, presented on one or more pages to help users achieve specific business goals.Each page is a separate tab within the dashboard.
detail page
A dashboard page with one or more analyses, providing more information to support a perspective or overview page.
inspector page
A detail page that has analyses only for a specific business object, for example a person.
KPI
Abbreviation for key performance indicator. KPIs are quantifiable metrics that can reflect how well operational, tactical, orstrategic objectives are being met.
performance tile
A single, summary measure value displayed prominently with, in some cases, a trend line.
perspective page
A dashboard page that has a collection of analyses to support a specific business point of view.
prompt
A parameter that you set when you use analytics, limiting the data in the analysis or in all analyses on the dashboard ordashboard page (tab).

OracleCreating HCM Cloud Analytics for Oracle TransactionalBusiness Intelligence Enterprise
Glossary
50
show data page
A detail page that has only one analysis, showing data in a table view.
sparkline
A small, condensed line graph that shows the shape of a given metric's variation over time, in context of other relevant dataon the dashboard page.
subject area
A set of columns, or pieces of data, related to a specific business object or area.
view
A specific way to present the results of an analysis, for example as a table or graph. Other types of views, such as the titleview, show other components of the analysis.