transglobal vehicular solutions
TRANSCRIPT

Transglobal Vehicular Solutions
Project Final Report
MASE 319: Introduction to Naval Architecture
December 9, 2015
Lauryn Emmitte: Management
William Foy: Structures
Zachary Gonzales: Hydrodynamics
Micah Thoms: Hydrostatics
Christopher Williams: Drawings

2
Abstract (Written by Zachary Gonzales)
This report covers the comprehensive concept design of a reliable, efficient, and
environmentally friendly Panamax Ro-Ro ship optimized for transatlantic voyages. The client
(Rotto Nordic Lines) specified minimum cargo capacities and provided vessel dimensions that
were not to be exceeded in order to traverse a variety of ports, terminals, and routes. The design
was an iterative process and loosely involved five main subjects for analysis: Hull form, vessel
structure, hydrostatics, hydrodynamics, and finally vessel powering.
Rotto Nordic Lines’ fleet is aging and this design solution provides a viable replacement
for their current vessels. The main challenge was finding vessel dimensions that would
accommodate the cargo capacity requirements but did not exceed the maximum dimensions.
The result is TVS Caitlyn, a Panamax Ro-Ro vessel that meets all of the client’s
specifications. The table below presents the end solution and shows that the tasks associated with
conceptual vessel design were completed successfully.
Length PP 180 [m]
Length OA 185 [m]
Breadth 28 [m]
Draft 7 [m]
Air Draft 37 [m]
Displacement 29,442 [tonnes]
𝐺𝑀 at full load capacity 2.168 [m]
Service Speed 21 [kn]
Propulsion 2 MAN B&W 6S60ME slow speed diesel engines
Fuel Bunker fuel while underway, diesel when in port
Number of Decks 7 watertight + weather deck = 8
TEU Capacity 1080 [TEU]
Automobile Capacity 1702 [vehicles]
Internal On/Offloading MacGregor watertight hydraulic lift ramps
External On/Offloading TTS Marine wire operated lift ramp systems
Manning 12

3
Table of Contents
1. Introduction_______________________________________________________________4
2. General Solution to the Design________________________________________________4
2.1. Parent Ship: The Corona Seaways__________________________________________4
2.2. Design Solutions________________________________________________________5
2.3. Concept Solution________________________________________________________6
3. Preliminary Designs________________________________________________________10
3.1. Hull Lines ____________________________________________________________10
3.2. Table of Offsets________________________________________________________12
4. Hydrostatics______________________________________________________________12
4.1. Variable Definition_____________________________________________________12
4.2. Underwater Volume____________________________________________________14
4.3. Curves of Form _______________________________________________________15
4.4. Calculating Keel to Center of Gravity______________________________________17
4.5. Light Ship, Ballast, Half- and Full-Load Conditions___________________________19
4.6. Damage Stability_______________________________________________________21
5. Arrangements_____________________________________________________________24
5.1. Cargo Stowage________________________________________________________24
5.2. General Arrangement___________________________________________________25
5.3. Manning and Accommodation____________________________________________26
6. Structural Hull Design______________________________________________________27
6.1. Shell Plating__________________________________________________________27
6.2. Deck Plating__________________________________________________________28
6.3. Keel_________________________________________________________________28
6.4. Longitudinal Stiffeners__________________________________________________28
6.5. Transverse Frames_____________________________________________________29
6.6. Bulkheads____________________________________________________________30
7. Final CAD Drawings_______________________________________________________30
7.1. Mid-ship Section Drawing with Scantling___________________________________30
7.2. GeniE Drawing and HydroD Analysis______________________________________31
8. Voyage Specific Analysis____________________________________________________35
8.1. Ship Resistance Analysis_________________________________________________35
8.2. Ship Powering and Propulsion System______________________________________37
9. Conclusion_______________________________________________________________37
10. References _______________________________________________________________39
11. Appendix_________________________________________________________________40
4
1. Introduction (Written by William Foy)
To produce a quality design, all design parameters as well as ABS specifications were met
throughout each phase of the solution. To complete a project of such magnitude, TVS assembled
a team of its finest engineers: Lauryn Emmitte, William Foy, Zachary Gonzales, Micah Thoms,
and Christopher Williams.
Following the successful solution of the client’s design specifications, a breakdown of TVS
Caitlyn’s capabilities are subsequently given:
TVS Caitlyn is capable of housing 1808 automobiles and 1189 TEUs at maximum capacity,
though to maintain the design draft of 7 meters, it must only carry 1702 automobiles and 1080
TEUs. Exceeding these values is possible, as the vessel is watertight up to 12 meters, but the
ship must comply with preordained values. The vessel possesses four decks with the ability to
store TEUs as well as heavy machinery, and seven total watertight decks capable of housing
automobiles.
All decks are equipped with hydraulic locking ramps, which promote ease of access between
decks, as well as retractable bulkheads, which allow for maximum loading capacity, in addition
to greatly increased stability of the vessel as a whole.
Caitlyn is fully capable of transporting said cargo from the port of Gothenburg to Galveston
in eleven days as specified by the client, with seven hours to spare. She accomplishes this task
by following the shortest, safest route between the two ports.
She was produced by and registered in the United States of America, and classed by the
American Bureau of Shipping as a Group 1 Roll-on-Roll-off vessel.
2. General Solution to the Design
2.1. Parent Ship: The Corona Seaways (Written by Lauryn Emmitte)
The beginning stages of this project required preliminary research of roll on roll off vessels.
After the investigation of several ships, the DFDS Corona Seaways was chosen as the parent
ship. It was selected due to the fact that it was similar to the given maximum parameters and has
the capability of transiting through the Panama Canal. Although the final design was based off of
multiple vessels, TVS decided to make its design dimensions primarily similar to the Corona
Seaways. Table 1 shows the specification comparison between DFD’s Corona Seaways and
Transglobal Vehicular Solutions’ Caitlyn.

5
Table 1: Specification Comparison
Details Corona
Seaways Caitlyn
LOA (meters) 187 185
Beam (meters) 26.5 28
Draft (meters) 6.8 7
Speed (knots) 20 21
L/B Ratio 7.1 6.6
Δ (ton) 33,697.40 32,260
Decks 4 8
Passengers 12 12
Further explanation on how TVS came to the details such as final displacement and number
of decks can be seen in the following paragraphs.
2.2 Design Solutions (Written by Lauryn Emmitte)
Upon being given the task of building a Ro-Ro, a strategy of how to do this had to be
implemented. A breakdown of this process can be seen in Figure 1. It is a general overview of
the plan to tackle the design procedure.
Figure 1: Design Strategy
Dimensions Constraint (Panamax)
Size
Parent Ships
Hull Lines
Table of Offsets
Hydrostatic Stability Analysis
Curves of Form
Damage Stability
General Arrangement
Decks
Cargo Holds
Superstructure
Structural Hull Design
Midship Section
GeniE and Hydro D
Drawings
Hydrodynamic Analysis
Speed
Distance, Time Constraints
Ship Resistance
Ship Powering
Propulsion
Engine Specifications
6
Knowing that the vessel has to transit through the Panamal Canal was one of the first
considerations in the design process. This put constraints on the size of the ship. After
establishing a the length, breadth, and design draft, which was based off of the parent ship, the
hull lines could be constructed. By drawing these, the table of offsets could also be extracted.
From there, hydrostatic analysis, stability, arrangements, and structural details were completed.
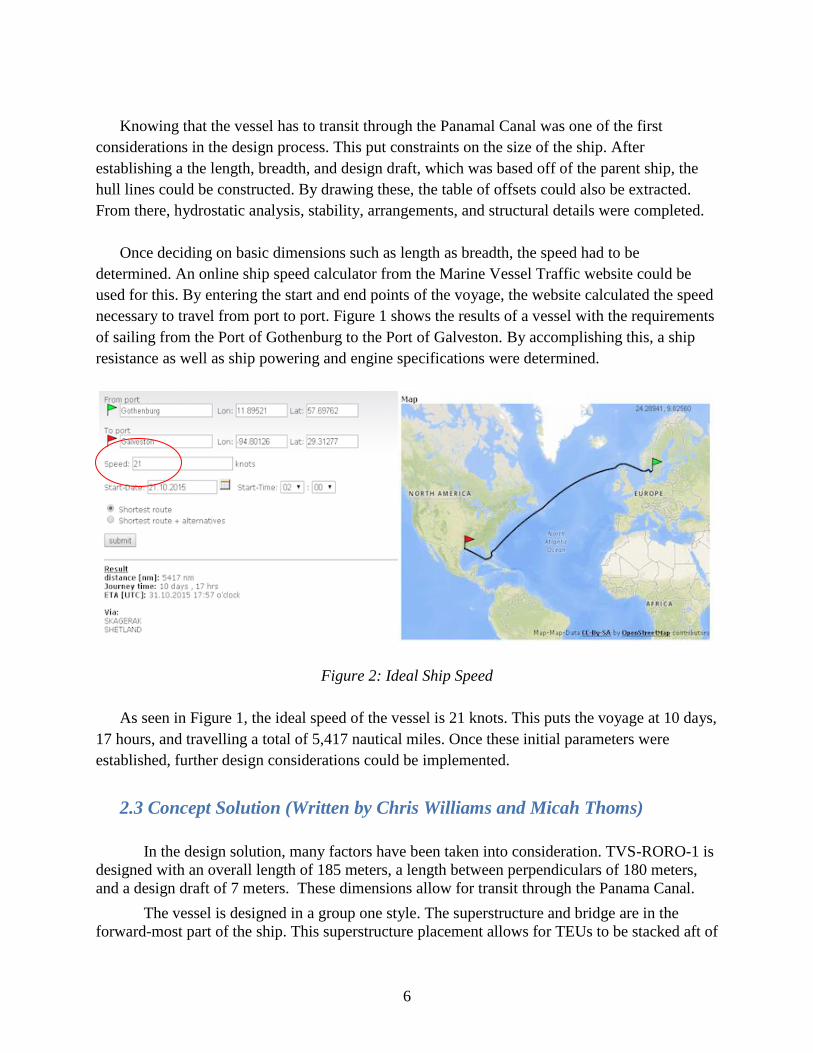
Once deciding on basic dimensions such as length as breadth, the speed had to be
determined. An online ship speed calculator from the Marine Vessel Traffic website could be
used for this. By entering the start and end points of the voyage, the website calculated the speed
necessary to travel from port to port. Figure 1 shows the results of a vessel with the requirements
of sailing from the Port of Gothenburg to the Port of Galveston. By accomplishing this, a ship
resistance as well as ship powering and engine specifications were determined.
Figure 2: Ideal Ship Speed
As seen in Figure 1, the ideal speed of the vessel is 21 knots. This puts the voyage at 10 days,
17 hours, and travelling a total of 5,417 nautical miles. Once these initial parameters were
established, further design considerations could be implemented.
2.3 Concept Solution (Written by Chris Williams and Micah Thoms)
In the design solution, many factors have been taken into consideration. TVS-RORO-1 is
designed with an overall length of 185 meters, a length between perpendiculars of 180 meters,
and a design draft of 7 meters. These dimensions allow for transit through the Panama Canal.
The vessel is designed in a group one style. The superstructure and bridge are in the
forward-most part of the ship. This superstructure placement allows for TEUs to be stacked aft of

7
the superstructure at the maximum allowed height. With this placement, the crew has full
visibility without impedance from the cargo. Additionally, this superstructure placement allows
the crew to feel the full effect of the sea state. The crew can change heading and course to
preserve the stability of the vessel and cargo therein. Bridge wings can extend to 2 meters on
either side. Bridge wings allow the crew to observe aft, and to pull in and out of port more
readily without the use of tugs or external sources. There are 5,000 cubic meters of livable space
in the superstructure. This space can accommodate meeting rooms, a galley, gym space, state
rooms, and other crew accommodations.
The cargo offloading and on loading operations will make use of interior ramps, fixed
ramps, one external-aft-heavy-load-ramp, and one light-load-amidships-ramp. The primary ramp
systems on the interior of the vessel make use of chain driven or hydraulic ramps in the car
decks. As shown in Figure 1, there are two ramp systems on port side, and two ramp systems on
starboard side. During offloading and on loading, the ramps are lowered eight degrees to create a
continuous flow of traffic from the lowest car deck to the TEU weather deck. When a car deck is
full, the ramps for that specific deck are raised to allow additional cargo to be secured to them.
The truck deck contains a fixed ramp system due to the overhead height in that deck. The aft
ramp is affixed to the stern of the vessel. It folds about its axis to allow for stowage during
transit. The interior ramps in the aft portion of the vessel originate at the main aft ramp.
The TVS Caitlyn is designed to have four car decks, two car/TEU decks, a TEU/heavy
equipment deck, and additional TEUs on the weatherdeck. From these eight decks, seven will be
watertight in order to protect the cargo. The dimensions for spacing the vehicles and TEU
containers were based on the largest Volvo automobiles and construction equipment published
on Volvo’s website.
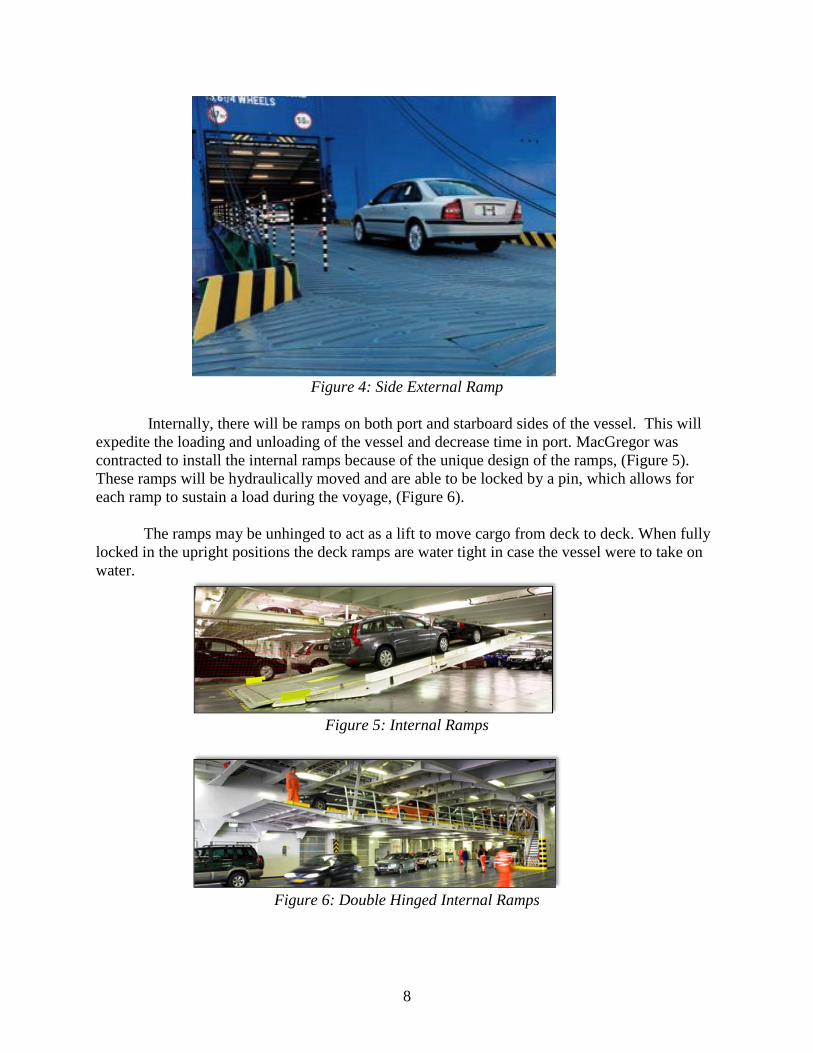
She has two external ramps for loading and unloading of the vessel. One is located in the
stern, (Figure 3), and will be capable to move large machinery. The other ramp is located
amidship (Figure 4), and will aid in the unloading of vehicles. TTS Marine ASA was contracted
to build the two external ramps for the TVS Caitlyn.
Figure 3: Aft External Ramp
8
Figure 4: Side External Ramp
Internally, there will be ramps on both port and starboard sides of the vessel. This will
expedite the loading and unloading of the vessel and decrease time in port. MacGregor was
contracted to install the internal ramps because of the unique design of the ramps, (Figure 5).
These ramps will be hydraulically moved and are able to be locked by a pin, which allows for
each ramp to sustain a load during the voyage, (Figure 6).
The ramps may be unhinged to act as a lift to move cargo from deck to deck. When fully
locked in the upright positions the deck ramps are water tight in case the vessel were to take on
water.
Figure 5: Internal Ramps
Figure 6: Double Hinged Internal Ramps

9
Finally, the bulkheads for the TVS Caitlyn will be fitted with a sliding link door system
designed by TTS Marine ASA, (Figure 7). This will allow for the unimpeded movement of cargo
during loading and unloading but when underway be sealed bulkheads to prevent the flooding of
multiple compartments. This will be advantageous in respect to damage stability because this
will greatly limit the amount of water taken on when damaged and allow the vessel to continue
sailing to a near port to be repaired.
Figure 7: Sliding Bulkhead Solution
TVS Caitlyn has a preliminarily designed engineering and auxiliary space in the bottom
deck of the ship. With a calculated deck to overhead height of 3.59 meters, all of the engineering
equipment, auxiliary power equipment, ventilation equipment, and tanks will be placed within.
These tanks are for fuel and ballast water to account for trim and list. Exhaust shafts will extend
from the engineering space, through the allotted space in the vehicle decks and dissipate at the
weather decks. Ventilation ducts will originate at the ventilation equipment and be distributed
throughout the vehicle decks to meet the air exchange requirements. Additionally, a bulbous bow
is incorporated into the design and will eventually house bow thrusters. Bow thrusters will allow
the vessel to berth without the use of tugboats or pier assistance. These concept solutions can be
seen in Figure 8 below.

10
Figure 8: General Solution to the Design
3. Preliminary Designs
3.1. Hull Lines (Written by Lauryn Emmitte)
The hull lines of Caitlyn were based off of the general shape of a Ro-Ro, particularly the
Corona Seaways, as well as creativity. The process began by drawing the Half Breadth Plan
because it was easier to visualize the ship by waterlines as opposed to stations. Then, the Body
Plan and the Sheer Plan could be constructed. After much drawing trial and error, TVS finally
came to a solution that resulted in an ideal ship shape. Figures 9, 10, and 11 are the plan views
that show this solution.
Figure 9: Half Breadth Plan

11
In the Half Breadth Plan, each water line can be seen in green. The blue represents each
station from the aft perpendicular to the fore perpendicular. The centerline is indicated in
magenta and the buttocks lines are purple.
Figure 10: Body Plan
The Body Plan of the vessel is given in Figure 10. The colors explained previously represent
each waterline, buttock line, station number, and buttock line respectively. This is the plan that
was primarily used to extract points for the construction of the table of offsets.
Figure 11: Sheer Plan
Finally, the Sheer Plan was drawn. Like the other two drawings, the colors that represent
each element were used consistently.

12
3.2. Table of Offsets (Written by Lauryn Emmitte)
The process of obtaining the table of offsets, as seen in Table 2, was completed by extracting
points from the Body Plan. By the use of AutoCAD, the distance from the keel to the respective
waterline could be drawn. Then, a perpendicular line was drawn until it reached the fore
perpendicular station. The point at which this line touches the station is the point that was
recorded. Then, the line is extended until it reaches station 9.75, 9.5, and so on, with those points
recorded respectively. This procedure was repeated for every water line at every station both fore
and aft. By completing this, a complete table of offsets was produced.
Table 2: Table of Offsets
As an example of point extraction, waterline 7 was drawn 7 meters up because TVS decided
to make the waterlines equivalent to the number of meters above the keel. The perpendicular
distance to the fore perpendicular was 0 because this waterline does not touch this station.
However, it does reach 9.75, 9.5, etc., as seen in Table 2.
4. Hydrostatics
4.1. Variable Definition (Written by Micah Thoms)
Because there are numerous variables associated with this project, a concise list of all
important values is given below.

13
Table 3: Variable Definitions for Hydrostatics
14
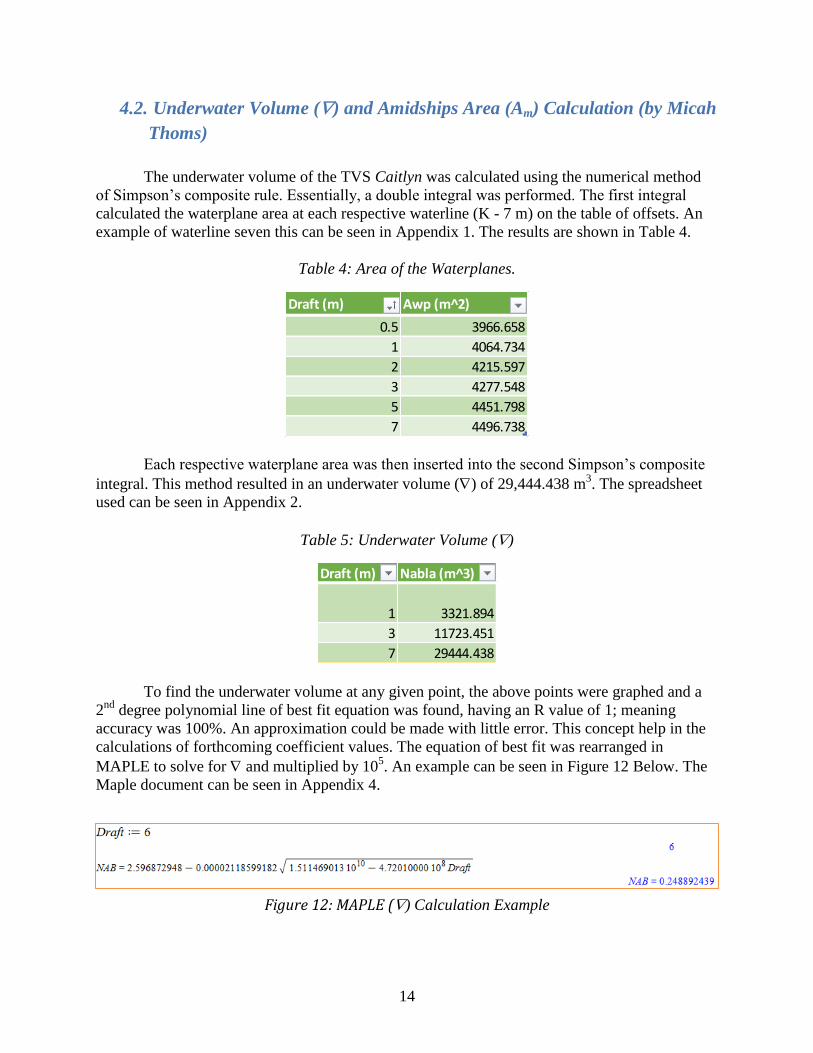
Figure 12: MAPLE () Calculation Example
4.2. Underwater Volume () and Amidships Area (Am) Calculation (by Micah
Thoms)
The underwater volume of the TVS Caitlyn was calculated using the numerical method
of Simpson’s composite rule. Essentially, a double integral was performed. The first integral
calculated the waterplane area at each respective waterline (K - 7 m) on the table of offsets. An
example of waterline seven this can be seen in Appendix 1. The results are shown in Table 4.
Table 4: Area of the Waterplanes.
Each respective waterplane area was then inserted into the second Simpson’s composite
integral. This method resulted in an underwater volume () of 29,444.438 m3. The spreadsheet
used can be seen in Appendix 2.
Table 5: Underwater Volume ()
To find the underwater volume at any given point, the above points were graphed and a
2nd
degree polynomial line of best fit equation was found, having an R value of 1; meaning
accuracy was 100%. An approximation could be made with little error. This concept help in the
calculations of forthcoming coefficient values. The equation of best fit was rearranged in
MAPLE to solve for and multiplied by 105. An example can be seen in Figure 12 Below. The
Maple document can be seen in Appendix 4.
Draft (m) Awp (m^2)
0.5 3966.658
1 4064.734
2 4215.597
3 4277.548
5 4451.798
7 4496.738
Draft (m) Nabla (m^3)
1 3321.894
3 11723.451
7 29444.438

15
The area of the amidships vertical plane (Am) was calculated in the same matter as the
waterplane areas with Simpson’s composite rule of integration. Only one integral set at each
waterline was needed, considering that was calculated with the waterplane areas. The results
are shown in Table 6 below and in Appendix 3.
Table 6: Area of the Amidships at Draft.
4.3. Curves of Form (by Micah Thoms)
The curves of form for TVS Caitlyn relates aspects of the ship’s hull to geometric shapes.
- The Block Coefficient is the ratio of to the cubic shape of the hull.
( /L*B*d)
- The Vertical Prismatic Coefficient is the ratio of to a cylinder created by the Awp
multiplied by draft.
(/d*Awp)
- The Area of the Waterplane Coefficient is the ratio of the Awp to the Rectangular
area created by the Breadth and the length of the waterplane.
(Awp/L*B)
- The Amidships Coefficient is the ratio of the Am to the vertical rectangular plane area
created by the breadth and draft.
(Am/d*B)
- The Prismatic Coefficient is the ratio of Block Coefficient to the Amidships
Coefficient. It also relates to a cylinder shape of the maximum area of the vessel to
the length.
(Cb/Cm)
Each of the above respective equations, combined with the Simpson and MAPLE values
discussed in the previous section, yielded the results for different drafts in Table 7 below. At
designed draft, the coefficient values are in the 0.83-0.98 range. This defines the vessel as
relatively block shaped. The result is not unusual for Ro-Ro vessels.
Draft (m) Am (m^2)
1 23.248
3 79.248
7 191.248

16
Figure 13: Curves of Form
Table 7: Block Coefficients
All of the results from Table 7 were plotted to create a Curves of Form graph. Figure 13
below displays the curves of form for TVS Caitlyn. Given a visual representation of the data, it is
easy to see how the coefficients increase as the draft increases. Essentially, the ship becomes
“boxier” as distance from the keel increases. This graph is also where the Simpson and MAPLE
results for were plotted on a secondary axis to find the line of best fit. These plots were
integral in finding the hydrostatic values.
Draft (m) Cb Cvp Cwp Cm Cp
1 0.66 0.82 0.81 0.83 0.79
3 0.78 0.91 0.85 0.94 0.82
7 0.83 0.94 0.89 0.98 0.86

17
4.4. Calculating Keel to Center of Gravity Distance (𝑲𝑮) (Written by Micah
Thoms)
To accurately approximate KG̅̅ ̅̅ , The centroids of the cargo, ballast, fuel, engines and ship
structure needed to be calculated.
To find the centroid of the cargo, each deck height, cargo type and the average weight of
cargo needed to be considered. For example, the average car is 1.7 tonne and the average TEU is
12-14 tonnes. The sum of the moments created by the cargo and deck height divided by the sum
of the weight of the cargo was used. Working with the cargo stowage arrangement, the ideal
loading was found and displayed in Table 8 below. The cargo weight is 17,237.187 tonne at
14.811 meters above the keel.
Table 8: Cargo Loading and Centroid Location
The total weight and centroid of the ship structure was found using Sesam GeniE. All of
the structural information was plugged into the program, along with all of the specific material
information. The resulting weight was 3,505 tonne at a centroid of 14.800 meters above the keel.
The total weight of two MAN B&W engines is 270 tonne at an estimated 3 meters above
the keel.
The total weight of the seawater ballast is calculated by taking the volume of the ballast
tanks and multiplying by the density of seawater to give tonne.
(𝐿𝑒𝑛𝑔𝑡ℎ ∗ 𝑊𝑖𝑑𝑡ℎ ∗ 𝐻𝑒𝑖𝑔ℎ𝑡)𝑡𝑎𝑛𝑘 ∗ 𝜌𝑠𝑒𝑎𝑤𝑎𝑡𝑒𝑟 = 𝑡𝑜𝑛𝑛𝑒 𝑜𝑓 𝐵𝑎𝑙𝑙𝑎𝑠𝑡 𝑆𝑒𝑤𝑎𝑡𝑒𝑟
(117 𝑚 ∗ 28 𝑚 ∗ 1.4 𝑚)𝑡𝑎𝑛𝑘 ∗ 1.025𝑡𝑜𝑛𝑛𝑒
𝑚3 = 4707 𝑡𝑜𝑛𝑛𝑒 at a centroid of 0.7 meter
The total weight of the loaded fuel tank (Diesel #2) is calculated by taking the volume of
the fuel tank and multiplying by the density of fuel to give tonne.
Deck
Number
Deck Height
(m)
Cars on
each deck
TEUs on
each deck
Weight
of cars
(tonne)
Weight of
TEUs
(tonne)
Sum of
Moments
(tonne-m)
Sum of
Forces
(tonne)
Centrod From
Keel (m)
Centroid (m)
Weather 27.5 0 391 0 4692 128842.320 17237.187 14.811
1 24.6 308 0 524.6472 0 12923.267
2 21.8 411 0 700.0974 0 15265.344
3 19.0 404 0 688.1736 0 13059.402
4 16.1 388 0 660.9192 0 10673.316
5 13.3 191 110 325.3494 1540 24849.252
6 10.5 0 213 0 2982 31292.512
Truck 3.6 0 366 0 5124 18395.160
TOTAL 1702 1080 255300.573
Finding Weight and Centroid of the Cargo

18
(𝐿𝑒𝑛𝑔𝑡ℎ ∗ 𝑊𝑖𝑑𝑡ℎ ∗ 𝐻𝑒𝑖𝑔ℎ𝑡)𝑡𝑎𝑛𝑘 ∗ 𝜌𝑓𝑢𝑒𝑙 = 𝑡𝑜𝑛𝑛𝑒 𝑜𝑓 𝑓𝑢𝑒𝑙
(58.5 𝑚 ∗ 25.5 𝑚 ∗ 3 𝑚)𝑡𝑎𝑛𝑘 ∗ 0.832𝑡𝑜𝑛𝑛𝑒
𝑚3= 3723.4 𝑡𝑜𝑛𝑛𝑒 at a centroid of 1.5
meter
Having all the weights and centroid locations allow for the Full Load KG̅̅ ̅̅ to be calculated.
Removing the Cargo weight and centroid allow the Ballast condition to be calculated. Removing
the seawater ballast and fuel allow the Light Ship condition to be calculated. This process is
demonstrated in Table 9. The results for KG̅̅ ̅̅ are given in Table 10.
Table 9: Total Weights and Moments
Table 10: Final KG Values
Finding Total Weights and Moments Weight
(tonne)
Centroid
From Keel (m)
Moment
(tonne-m)
17237.187 14.811 255300.573
3505.000 14.800 51874.000
4707.000 0.700 3294.900
3723.400 1.500 5585.100
270.000 3.000 810.000
Total
Weight
(Full Load)
Total
Moment
29442.587 316864.573
Total
Weight
(Ballast)
Total
Moment
12205.400 61564.000
Total
Weight
(Light Ship)
Total
Moment
3775.000 52684.000
- Full Load Ballast Lightship
Draft (m) 7.000 3.113 1.110
NABLA
(m^3) 29442.587 12205.400 3775.000
KG (m) 10.762 5.044 13.956
Final KG

19
4.5. Light Ship, Ballast, Half- and Full-Load Conditions (Written by Micah
Thoms and William Foy)
After compiling each KG̅̅ ̅̅ value for the three vessel loading conditions, hydrostatic analysis
was performed. The next value to calculate was the keel to center of buoyancy (KB̅̅ ̅̅ ). This
process involved using Equation 3-10b from the textbook.
KB̅̅ ̅̅ = 𝑑(𝐶𝑤𝑝
𝐶𝑤𝑝+𝐶𝑏)
In the curves of form, a line of best fit equation was calculated for Cwp and Cb. In
MAPLE the 2nd
order polynomial equation was rearranged to solve for Cwp and Cwp at any
given draft. This data was checked by ensuring the results matched up with the Simpson values
discussed in the Curves of Form section. Plugging in the now known coefficients into Equation
3-10b resulted in KB̅̅ ̅̅ values for the drafts found in the KG̅̅ ̅̅ section. Table 11 below shows this
data. KB̅̅ ̅̅ Longitudinal and KB̅̅ ̅̅ transverse are defined to be the same value.
Table 11: KB Results
BM̅̅ ̅̅ Transvers and Longitudinal values were calculated when the Awp for each draft was
calculated using Simpson’s composite rule. This was accomplished by taking the second moment
of area with respect to the X and Y axis. An example for waterplane seven can be seen in
Appendix 1. The values calculated are displayed in Table 12.
Nabla (m^3) Draft (m) Cwp Cb KB
29444.438 7.000 0.892 0.835 3.617
24889.244 6.000 0.883 0.823 3.106
20420.239 5.000 0.873 0.810 2.593
16033.189 4.000 0.862 0.795 2.080
11723.745 3.000 0.849 0.775 1.568
7487.926 2.000 0.832 0.743 1.057
3322.085 1.000 0.807 0.659 0.550
Results for KB

20
Table 12: BM Results
The hydrostatic values were all compiled and GM̅̅ ̅̅ was calculated using the GM̅̅ ̅̅ equation.
The same equation is used for transverse and longitudinal with only BM ̅̅ ̅̅ ̅ and GM̅̅ ̅̅ having a
differing value.
𝐺𝑀̅̅̅̅̅ = 𝐾𝐵̅̅ ̅̅ + 𝐵𝑀̅̅ ̅̅̅ − 𝐾𝐺̅̅ ̅̅
The results of the hydrodynamic analysis is displayed in Table 13 below.
Table 13: Final Hydrostatics
Nabla (m^3) Draft (m) BM BM (long)
29444.438 7.000 9.313 1389.008
24889.244 6.000
20420.239 5.000 13.181 2000.725
16033.189 4.000
11723.745 3.000 22.055 3381.480
7487.926 2.000 33.103 5147.281
3322.085 1.000 66.550 11045.298
Results for BM
Hyrdostatics- Full Load Ballast Light Ship
Draft (m) 7.000 3.111 1.110
Nabla (m^3) 29444.438 12207.000 3775.000
KB (m) 3.617 1.626 0.600
BM (m) 9.313 23.000 60.000
KG (m) 10.762 5.044 13.956
GM (m) 2.168 19.582 46.644
KB L (m) 3.617 1.626 0.600
BM L (m) 1389.008 3381.430 9958.600
KG L (m) 10.762 5.044 13.956
GM L (m) 1381.863 3378.012 9945.244
Radius of (m)
Gyration 7.809 7.731 7.694
Rolling
Period (s) 10.634 3.503 2.259
MCTC (ton-m/cm) 2199.360 2134.512 2077.814

21
With all positive GM̅̅ ̅̅ values, the vessel is stable under all loading conditions. The radius
of gyration was calculated using the equation:
𝑘 = √𝐼𝑇
𝐴𝑤𝑝
The rolling period of the vessel was calculated using the rolling period calculation.
𝑅𝑜𝑙𝑙𝑖𝑛𝑔 𝑝𝑒𝑟𝑖𝑜𝑑 =2𝜋 ∗ 𝑘
√GM̅̅ ̅̅ ∗ 𝑔
The rolling period is in the cruise ship rolling period range for Full load. It decreases for
Ballast condition, and at light ship the rolling period is rather swift due to the fact there is no
cargo, ballast, crew, liquids or loads of any kind. The Ship structure is the only factor. This could
be mitigated by changing some of the ship structure in later design iterations.
The Moment to Change Trim One Centimeter (MCTC) is given by the equation:
𝑀𝐶𝑇𝐶 =∇ ∗ GM̅̅ ̅̅
100 ∗ 𝐿𝑂𝐴
The results are shown in the above Table 13.
4.6. Damage Stability (Written by Zachary Gonzales)
A vessel is exposed to a hostile environment while at sea. The most serious concern is
ultimately the loss of reserve buoyancy, which may result in sinking of the ship. An important
contributive factor to this loss of buoyancy is the loss of stability through uncontrolled flooding,
which may or may not result in the vessel capsizing before sinking.
The method for calculating TVS Caitlyn’s stability in the damaged condition is called the
“Constant Buoyancy Method”. This method assumes that 𝐾𝐺 (center of gravity) of the vessel is
constant throughout each damaged condition, although the LCF (longitudinal center of flotation)
and other stability characteristics will vary with each. This assumption follows Archimedes’
principle in that the upward buoyant force exerted on a body immersed in a fluid is equal to the
weight of the fluid that the body displaces.
There were three different damaged conditions considered for the design. Flooding fore of
the collision bulkhead, slightly aft of amidships, and aft of the engine bulkhead. All damage
conditions were calculating assuming a water depth rising into the vessel of seven meters. The
seven-meter flooding height translates to flooding of the entire lower heavy equipment deck and
accounts for one meter of flood water above it. Although this deck is watertight, these conditions
assume the watertight properties are compromised. The seven-meter flooding was chosen
because a practical damaged condition was desired, furthermore, a damage condition that still

22
allowed passage through the Panama Canal was assumed to be ideal. It should be noted that each
flooded compartment was assumed to be symmetric with respect to the centerline, so that no list
moment was created.
Visual representations of the flooded areas on a barge (for simplicity) with TVS Caitlyn’s
LOA and breadth are provided below in Figure 14.
Figure 14: Damage Stability Drawing

23
In order to perform damage stability calculations using the Constant Buoyancy Method,
several parameters regarding each flooded condition were established. First, the volume of each
flooded compartment was calculated using Simpson’s 1st Rule of Approximation from the cross
sectional area of each bulkhead and considering the length of each compartment along the ship.
Also, the permeability coefficient μ for each condition was assumed to be 0.95, which is a typical
conservative assumption for cargo areas on a Ro-Ro vessel.
Listed below are some of the governing equations and their explanations for the Constant
Buoyancy Method of damaged stability.
Equation 1: Finds the angle of trim due to the moment created by the distance from the
LCF to the flooded compartment’s centroid. Where 𝜌 is the density of water, 𝜇 is the
permeability coefficient, 𝑣𝑐𝑜 is the volume of the flooded compartment, 𝑥𝑐 is the distance from
the LCF to the centroid of the flooded compartment, 𝑥𝑓 is the original LCF, ∆ is the ship’s
displacement, and 𝐺𝑀𝐿 is the longitudinal metacentric height for the vessel. Note that this angle
is calculated in radians. In order to correctly calculate the trim caused by the damaged
compartment, the angle must be converted to degrees. Trigonometry must then be employed to
calculate the new draft.
𝜃𝑟𝑎𝑑 = 𝜌(𝜇𝑣𝑐𝑜(𝑥𝑐 − 𝑥𝑓)/∆𝐺𝑀𝐿
Equation 2: Calculates the change in draft due to the added tonnage of the water taken
aboard. Where 𝐴𝑤𝑝 is the area of the waterplane that the flood water reaches, 𝜇𝑠 is the surface
permeability coefficient, and 𝑎 is the area of the flooded compartment. Also known as parallel
sinkage.
𝛿𝑑 = 𝜇𝑣𝑐𝑜/(𝐴𝑤𝑝 − 𝜇𝑠𝑎)
Equation 3: This equation states that the longitudinal metacentric height after damage is
nearly equal to the longitudinal metacentric radius after damage. This is useful because if 𝐵𝑀𝐿′
can be calculated, it can be used to substitute into Equation 1 for 𝐺𝑀𝐿 to find the trim angle after
damage.
𝐺𝑀𝐿′ ≈ 𝐵𝑀𝐿′
Equation 4: Finds the longitudinal metacentric radius after damage.
𝐵𝑀𝐿
′= 𝐼𝐿
′ /∇
Equation 5: In order to solve for the metacentric radius after damage mentioned above,
𝐼𝐿′ must be solved for using the equation below. Where 𝐼𝐿 is the original moment of inertia about
the ship’s centerline, 𝑥𝐹′ is the new location of the LCF after damage, and 𝑖𝐿is the moment of
inertia about the compartment’s longitudinal axis.
𝐼𝐿′ = 𝐼𝐿 + 𝐴𝑤𝑝(𝑥𝐹 − 𝑥𝐹
′ )2 − 𝜇(𝑖𝐿 + 𝑎(𝑥𝑎 − 𝑥𝐹′)2

24
Equation 6: Finally, the last equation will calculate the new draft of the bow and stern of
the vessel (depending on where the flooded compartment is compared to the LCF).
𝑑′ = 𝑑0 + 𝑑𝑝𝑎𝑟𝑎𝑙𝑙𝑒𝑙 𝑠𝑖𝑛𝑘𝑎𝑔𝑒 ± 𝑑𝑑𝑢𝑒 𝑡𝑜 𝑡𝑟𝑖𝑚
The results of the aforementioned calculations are given in Table 14 below.
Table 14: Flooding Conditions
Flooding Condition
Fore of the Collision
Bulkhead Aft of Amidships
Aft of the Engine
Bulkhead
Design Draft [m] 7 7 7
Volume of water
taken aboard [m3]
1481.76 4370 3920
Parallel Sinkage [m] 0.3285 1.13 0.996
Draft change due to
trim [deg] 0.003 0.0013 0.03
Damaged Stern Draft
[m] 7.32 8.13 8.026
Damaged Bow Draft
[m] 7.33 8.12 7.966
It should be noted that the draft to traverse the Panama Canal is never exceeded in these
damaged conditions, but the specified draft by Rotto Nordic Lines of 7.2 m is exceeded in the aft
of amidships and aft of the engine bulkhead flooding conditions. This is due to the fact that the
volume of water taken on is much larger with respect to the first flooding condition fore of the
collision bulkhead.
5. Arrangement s
5.1. Cargo Stowage (Written by Lauryn Emmitte)
ECG’s Operations Quality Manual for Commercial Vehicles has a chapter regarding cargo
spacing within Ro-Ro vessels. According to this document, Volvo approves of this manual for
vehicle handling. For this reason, Transglobal Vehicular Solutions decided to use this document
as a guide to storing cargo.
For starters, Volvo’s largest car dimensions were used in the storage analysis. This was
chosen because even if the owner decided to choose smaller Volvo cars to transport, it would be
guaranteed that they would fit. The longest vehicle is 4.84 meters and the widest is 1.89 meters.
Therefore, these were the dimensions chosen to represent a car on each deck.

25
The document states that each vehicle must have 10 centimeters between them, mirror to
mirror. There also must be 30 centimeters of space fore and aft between vehicles, and 30
centimeters between the bumper and the ship’s superstructure. Additionally, 15 centimeters of
space is required between the vehicle and the superstructure. Because the ship’s side structure
has a web frame that sticks out a total of 1 meter, there must be at least 1.15 meters of space
between the car and side structure. By placing the cars in AutoCAD, it can be seen that this
requirement is met by having a total of 1.225 meters of space. A schematic of this is given in
Figure 15.
Figure 15: Cargo Stowage
As seen in Figure 16, the cars are arranged as required. The TEUs are packed even tighter
together with a spacing of 25 centimeters between. They also meet the above requirements of
side structure spacing.
5.2. General Arrangement (Written by Lauryn Emmitte)
The ship was designed to have 8 cargo decks, including the weather deck. Knowing the
height of each, and therefore its distance above the keel, was essential to creating the shell of
each deck space. A separate table of offsets was extracted from the Body Plan in order to draw
them. Before vehicles were placed on the individual shells, the bulkheads had to be
implemented. They were positioned respective to their calculated location (as seen in Chapter 6)
and can be seen in orange. The general layout of the solution is given in Figure 16.

26
Figure 16: General Arrangement
Magenta represents the cars and blue represents TEUs in the figure above. The final car
count totaled to be 1,808. This includes 414 on Car Deck 1, 411 on Car Deck 2, 404 on Car Deck
3, 388 on Car Deck 4, and 191 on the TEU / Car Deck. The total number of TUEs came out to be
1,189. There are 500 on the weather deck that are double stacked, 110 single stacked on the TEU
/ Car deck, 213 single stacked on the TEU Deck, and 366 double stacked on the Heavy Cargo /
TEU Deck. This is the absolute maximum capacity that the ship can hold.
5.3. Manning and Accommodation (Written by Chris Williams)
The crew for the vessel was determined based upon the regulations given by SOLAS. The
regulations stated that for a vehicle carrier carrying over 12 passengers the vessel is to be
considered a passenger vessel. Any number of passengers exceeding this value requires the
Weather Deck
Car Deck 1
Car Deck 2
Car Deck 3
Car Deck 4
TEU / Car Deck
TEU Deck
Heavy Cargo /
TEU Deck

27
vessel to not carry cargo below the designed water line. This would affect the TVS Caitlyn
because the lower truck deck is designed to carry cargo below the water line. A team of 8 crew
members will provide a sufficient amount to man the vessel. This allows for several engineers as
well as crew to pilot the vessel plus 4 guests as stated in the requirements.
For the accommodations, the crew will have three levels, each 500 square meters, on the
super structure. The first level will consist of the galley, workout room and reading room where
the crew can work out, eat and take breaks. The second level will be where the bunks and two
lounge rooms will be. The lounges will consist of oversized chairs and large televisions to allow
the crew to relax and watch TV. The top level will be the bridge, state rooms for the captain, and
a large meeting room. The bridge will have bridge wings on either side to aid in navigation once
in port. The bridge is designed to control the vessel from the bow and stern ends giving a full
view of the vessel. The meeting room will be designed for teleconferences to allow the captain
and officers to talk with companies while the vessel is underway.
6. Structural Hull Design
The society chosen to class the vessel was the American Bureau of Shipping. It was
picked because the information was readily available. The ABS documents regarding roro
specifications were used in order to determine structural details of the ship. This was within the
Steel Vessels 2015 document. It was primarily Part 3: Hull Construction and Equipment as well
as Part 5C Specific Vessel Types (Chapters 7-12). The procedures for obtaining the required
structural elements can be seen below.
6.1. Shell Plating (Written by Christopher Williams)
- Side shell plating
o t= 𝑠𝑘√𝑞ℎ
254+ 2.5 𝑚𝑚
o s= 2.08L + 438 + 822.8 mm (where L is length of vessel)
o k =1 amid ship and 1.33 at ends
o q= 235/y (y is yield strength of steel = 250MPa)
o h= 0.1L (where L is length of the vessel)
o Thickness amidships = 16.01 mm amidships
o Thickness fore and aft = 20.47 mm
- Sheer strake
o b= 5L+800 mm
o b = 1725mm
- Bottom shell plating
o t = s(L+45.73)/(25L+6082) mm
o s= 2.08L + 438 + 822.8 mm
o L is length of the vessel
o Thickness = 17.73 mm
- Keel plate
o t = 1.5+ tbottom shell

28
o Thickness = 19.23 mm
- Shell plating at ends
o t = 0.0035(L+29)+ 0.009s mm
o L is the length of the vessel
o s= 2.08L + 438 + 822.8 mm
o Thickness = 14.9
- Immersed bow plating
o t= 0.05 (L+20)+ 0.009s mm
o Thickness = 17.66 mm
6.2. Deck Plating (Written by Christopher Williams)
- Strength Deck plating
o T= 0.01 (Sd)+ 0.9 mm
o Sd is spacing of stiffeners
o Thickness = 7.44mm
- Car decks
o t= kKn√𝑊
o k= 8.05 (given by ABS)
o K = 21.99 + 0.316(a/s)2 – 5.328(a/s) + 2.6(a/s) (b/s) – 0.895(b/s)5 –
7.624(b/s)]*102
a is the parallel wheel imprint dimension
b is the perpendicular wheel imprint dimension
s is the longitudinal deck spacing
o W is the weight of the vehicle
o Thickness is 4.2 mm
- Inner bottom plating
o t = 0.037L + 0.009s – c mm
o L is the length of the vessel
o s is the spacing of the supports
o c is 1.5 given by ABS
o Thickness = 12.8 mm
6.3. Keel (Written by Christopher Williams)
- Amidships
o t = 0.056L + 5.5 mm
o Thickness = 15.86 mm
- Fore and aft of the vessel
o t = .85* thickness amidships
o Thickness = 13.5 mm
6.4. Longitudinal Stiffeners (Written by Christopher Williams)
- SM= Mt/Fp cm2-m for amidships
o Mt is the total bending moment
o Fp is the nominal permissible bending stress

29
o SM = 1135 cm2 – m
- Minimum Section modulus for side girders
o SM= C1C2L2B (Cb+0.7) cm
2-m
o C1 = 10.75- (300−𝐿
100)1.5
o C2= 0.01 (given by ABS)
o B is breath of vessel
o Cb is the block coefficient of the vessel
o SM = 759 cm2-m
o Thickness is found by
t = 0.036L + 4.7 + c
L is the length of the vessel
C is given as 1.5 by ABS
Thickness = 12.86 mm
6.5. Transverse Frames (Written by Christopher Williams)
- Transverse frame below lowest deck
o SM = sl2 (h+(bh1/30))(7+45/l
3) cm
3
o s is frame spacing
o h is .4*l
o l is height from the bottom to the next deck
o b is the horizontal distance, in meters, from the outside of the frame to the row of
deck supports
o h1 = vertical distance, in meters, from the deck at the top of the web frame to the
bulkhead or freeboard deck plus the height of all cargo tween deck spaces.
o SM = 530 cm^3
Thickness of 7.86 mm
- Hold web frames amidships and aft o SM= 4.74*csl
2 (h+(bh1/45k) cm
3
o c= 1.5 (ABS)
o k= 1 when longitudinally framed
o SM of truck deck = 2,184 cm3
Thickness of 11.13 mm
o SM of car decks = 174.74 cm3
1Thickness of 6.7 mm
- Hold webs forward and aft
o To be same as web frames amidships
- Side stringers
o SM= 4.74*chsl2
o s is the sum of the half lengths in meters of the frame supported
o l is the span in meters between web frames or between web frame and bulkhead.
Where brackets are fitted.
o SM of 482.5 cm3
Thickness of 10 mm
30
6.6. Bulkheads (Written by Christopher Williams)
- Bulkheads
o t = sk√𝑞ℎ
𝐿+ 1.5 𝑚𝑚
o s is the frame spacing
o k = (3.075*√α) − 2.077)/(α + .272) o α is the long edge over the short edge of the vessel
o q = 235/ Ψ
o Ψ is the yield strength of steel
o Thickness is 14.2 mm
7. Final CAD Drawings
7.1. Mid-ship Section Drawing with Scantling (Written by Christopher
Williams)
The amidships section of the ship was designed by following the ABS classification rules
governing minimum thicknesses and section modulus of steel. The amidships shows the double
bottom, decks, side web, shell and the stiffeners for each section. Because the ABS standards
produce minimum values, the decks were designed thicker in order to help add weight to the
vessel and provide more strength. The deck stiffeners were also designed thicker than ABS
regulations to help add weight and strength to the vessel as well.
In designing the stiffeners, the longitudinal L-beams are welded to the bottom of the deck.
The transverse T-beams are welded to the deck as well but are cut to fit over each L-beam. The
hold web was designed to provide stiffness for the side shell of the ship. These stiffeners are
placed 2.5 meters apart and run transversely through the ship. The keel is welded to the top and
bottom of the double bottom and runs longitudinally through the whole vessel. The side girders
are also welded to the top and bottom of the double bottom and run longitudinally the whole
length of the vessel. A schematic of this can be seen in Figure 17.
Spaced throughout the length of each side girder are manholes. The manholes will allow for a
person to move through sections to make repairs if repairs were ever needed. In between the side
girders are T-beam stiffeners, which will provide more strength to the double bottom. Under the
keel is the keel plate, this is part of the shell plating and is placed longitudinally down the bottom
of the vessel to provide strength. In Table 15 are the members in the midship section and the
thicknesses of each member. The final member in the midship section is the ventilation system.
This system will move enough air to exchange the air inside the vessel 10 times every hour in
port. While underway, the ventilation system will be running at half power because it will only
need to be exchange the air 5 times every hour.

31
Table 15. Amidships section steel members and the respective thicknesses
Steel Member Thickness (mm)
Side Shell 7
Side Girder 13
Hold Web 13
T-Beam (Decks) 13
T-Beam (Double Bottom) 13
Outer Bottom 18
Inner Bottom 13
L-Beam 13
Keel 16
Keel Plate 19
Decks 7.4
Figure 17: Midship Section Drawing
7.2. GeniE Drawing and HydroD Analysis (Written by William Foy)
In order to determine accurate values for the vessel’s weight, stability, and various other
properties, certain modules of a program called Sesam were utilized; namely GeniE and HydroD.

32
GeniE’s main focus was the visualization and construction of the vessel itself, while HydroD
conducted dynamic analysis of the ship’s motion through water, applying wind and water loads
to measure the aforementioned variables. The use of both modules was a lengthy process,
requiring many iterations and numerous adjustments in order to obtain the desired results.
To facilitate the learning of these programs, a tutorial was provided by the instructor, which
proved invaluable in the design process. This guide began with an introduction to GeniE, and
concluded by explaining how to export the newly created ship into HydroD.
Like other design software, GeniE accepts a command called “polyline”, which allows for
the insertion of multiple points on a single line, greatly simplifying program input. Using the
table of offsets, three-dimensional lines were created and written into GeniE, forming the basis
for TVS Caitlyn’s Hull form, as shown in Figure 18.
Figure 18: TVS Caitlyn’s completed polylines
The X-value of the coordinate system represents the length along the ship longitudinally,
the Y-value corresponds to distance from centerline, and the Z-value relates to the height above
Keel. Using built-in GeniE commands, the vessel was given plates, decks, and bulkheads, as well
as both transverse and longitudinal stiffeners; a cross-section of which is given in Figure 19.

33
Figure 19: TVS Caitlyn’s completed Hull structure
Following the completion of TVS Caitlyn’s Hull structure, a “load-case” was
implemented in order to define the portion of the vessel that would remain underwater during
voyage. Because the design draft of the vessel is 7 meters, it follows that the load-case would be
defined at this height. The load-case is represented by an orange mesh around the structure,
located under the waterplane, which is denoted by a green cutting-plane. A view of the
completed vessel is shown in Figure 20 below.
Figure 20: The completed vessel, ready for export into HydroD

34
Upon finishing the vessel’s Hull-lines and structural elements in GeniE, the completed
vessel was ready for export into Sesam’s second module: HydroD. Following export, HydroD
required specific instructions in order to generate a report of the ship’s functionality; namely the
ship’s length, breadth, and design draft. Figure 21 below is a HydroD-rendered image of TVS
Caitlyn just before analysis.
Figure 21: TVS Caitlyn just before HydroD analysis
Immediately following analysis of the vessel, HydroD generated a comprehensive report
of the ship’s stability, mass, and various coefficients. These values proved indispensable in the
hydrostatic examination of the vessel, as many could be obtained in no other way. A table of
HydroD’s stability report is depicted in Table 16 below.
Table 16: HydroD’s stability report

35
8. Voyage Specific Analysis
8.1. Ship Resistance Analysis (Written by Lauryn Emmitte)
The method of obtaining ship resistance was performed by model testing. In this case, the
Corona Seaways was used as the model. The first step was obtaining the wetted surface area of
Caitlyn, which was done by utilizing Mumford’s Formula (S = 1.025*Lpp*[CB*B+1.7d]. Then,
by using the length scale ( = 0.989), the wetted surface of the model could also be determined.
Because the design speed of the model was known, it was pertinent to find the speed of the
prototype during this experiment. Froude’s number was the solution. By setting the Froude
number of the model and the prototype equal to each other, it was simple to find the speed of the
prototype because the other three variables were known. After obtaining a speed of 10.22 m/s for
Caitlyn, the existing numbers could be plugged back into the Froude number equation. Because
they both received the same value of 0.24, it can be determined that the ships undergo Froude
similarity.
Next, the Reynold’s numbers could be calculated. Here, the kinematic viscosity was based
off of an educated assumption. The locations of both ships had to be assumed in order to find the
temperature of the water, and therefore kinematic viscosity. It was assumed that the DFDS
Corona Seaways was in Antwerp and the TVS Caitlyn was in Gothenburg. Even though both
ships will not necessarily be going the high speeds in these locations, temperatures could be
recorded that would be similar to those used in other model testings. By using this method, it was
determined that the temperature of the model was 10 degrees Celsius and the prototype
temperature was 8.89 degrees Celsius. Seawater tables were then used in order to determine the
kinematic viscosity at any temperature. Obtaining these values was essential to finding the
Reynold’s number of both ships.
The following step required information from the Technical University of Denmark’s Project
no 2010-56, Prediction of Resistance and Propulsion Power of Ships. Appendix I has graphs of
Froude’s number versus residual resistance for bulky ships (with a prismatic coefficient greater
than 0.7). The first graph on page 48 was used because Caitlyn’s L/volume1/3
ratio was 6.0. By
lining up the calculated Froude number with the point of the ship’s prismatic coefficient (0.86), a
3.5 x 10⁻³
CR value was determined. This graph is given in Figure 22.

36
Figure 22: Froude Number vs. Residual Resistance
The CF of both ships was calculated by using the ITTC 1957 formula. Additionally, in ship
resistance model testing, CR of the model and CR of the prototype are the same. These two values
of the model were then added to find CTm. Similarly for CTp, a roughness allowance was added
into this calculation as well. From here, the total resistance and EHP of the vessels could be
calculated. The values for all of these results were tabulated in Table 17.

37
Table 17: Ship Resistance Calculations
8.2. Ship Powering and Propulsion System (Written by Christopher Williams)
By looking at the parent ship, the engines chosen were Man B&W 6S60ME engines. Upon
looking at the Man B&W website, using the same engines will be advantageous because of the
efficiency and the low emissions produced. This engine is a straight 6 cylinder, super long
stroke, 2 stroke engine. This power plant is efficient and only consumes 173 grams of fuel per
kilowatt in an hour. Looking at the amount of kilowatts required to power Caitlyn, the fuel
consumed in an eleven-hour journey would be around 1,100 cubic meters. At this rate, with a
4,475 cubic meter tank, the vessel will be able to run multiple transatlantic trips before refueling.
This will decrease the operation cost and increase profit. Along with being efficient, the engines
are also clean burning. By using multiple filters, including a urea filter, the engines produce a
NOx level below the maximum amount set by MARPOL and SOLAS. The other emissions
produced by the engines are also below the maximum amount allowed by MARPOL and SOLAS
regulations.
9. Conclusion (Written by Zachary Gonzales)
Upon completion of the concept design of a reliable, efficient, and environmentally
friendly Panamax Ro-Ro vessel optimized for transatlantic voyages, it was determined that the
solution was indeed possible. With maximum optimization, TVS Caitlyn will make the voyage
from the Port of Gothenburg, Sweden to the Port of Galveston, Texas in 10 days 17 hours
carrying 1,702 Volvo automobiles and 1,080 TEUs. She will displace 29,442 tonnes when fully
loaded, and will sail at 21 knots to meet schedule, all while flying the American flag. The
comprehensive concept design has proved to be a viable replacement for four of Rotto Nordic
Lines’ aging Ro-Ro vessels.
38
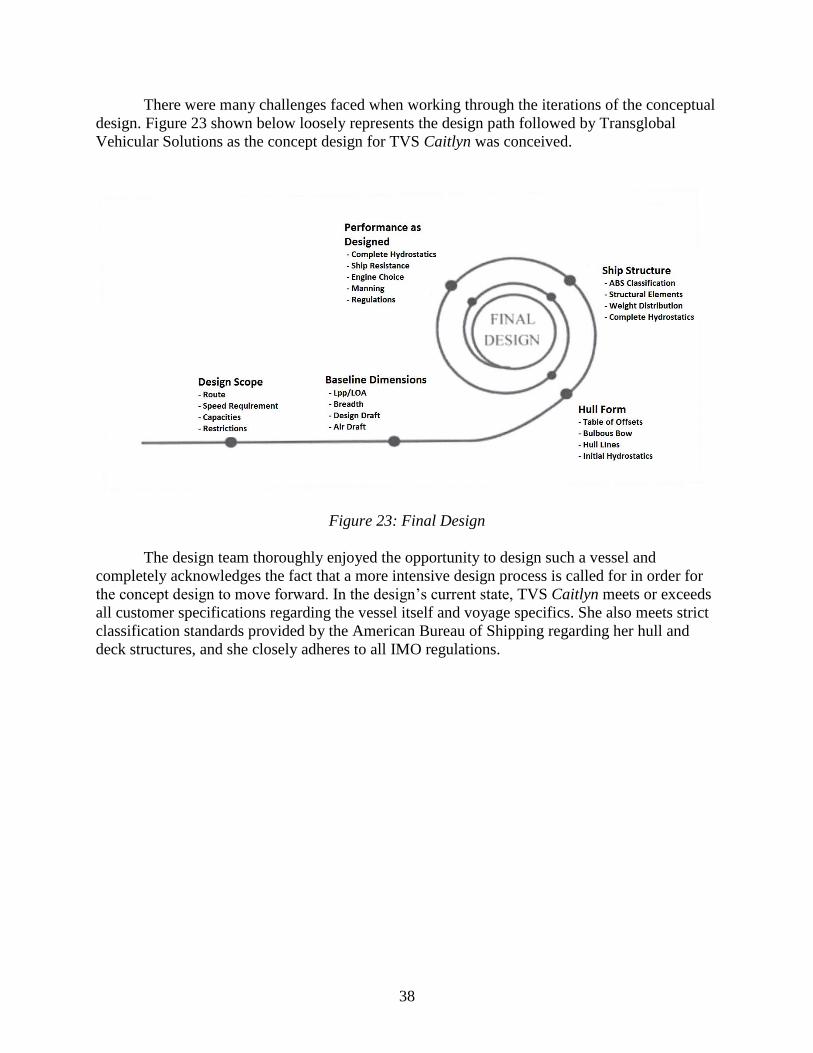
There were many challenges faced when working through the iterations of the conceptual
design. Figure 23 shown below loosely represents the design path followed by Transglobal
Vehicular Solutions as the concept design for TVS Caitlyn was conceived.
Figure 23: Final Design
The design team thoroughly enjoyed the opportunity to design such a vessel and
completely acknowledges the fact that a more intensive design process is called for in order for
the concept design to move forward. In the design’s current state, TVS Caitlyn meets or exceeds
all customer specifications regarding the vessel itself and voyage specifics. She also meets strict
classification standards provided by the American Bureau of Shipping regarding her hull and
deck structures, and she closely adheres to all IMO regulations.
39
10. References (All)
"Appendix II.-Density and Viscosity of Water." Sedimentation Engineering, n.d. Web. Nov.
2015.
"Corona Seaways." DFDS. N.p., 2015. Web. 18 Oct. 2015.
Gillmer, Thomas C., and Bruce Johnson. Introduction to Naval Architecture. Annapolis, MD:
Naval Institute, 1982. Print.
Kristensen, Hans Otto, and Marie Lutzen. "Prediction of Resistance and Propulsion Power of
Ships." N.p., n.d. Web. Dec. 2015.
Internal Access Ramps. MACGREGGOR, n.d. Web. 3 Dec. 2015.
<http://www.macgregor.com/en-global/macgregor/products/Ramps/Internal-access-
ramp/Pages/default.aspx>.
Ship Design Competition (2009): n. pag. Web. 4 Dec. 2015.
"Marine Engines Catalog." Docslide.us. N.p., n.d. Web. 3 Dec. 2015.
"Marine Vessel Traffic." SEA DISTANCE CALCULATOR. N.p., 2013. Web. 18 Oct. 2015.
<http://www.marinevesseltraffic.com/2013/07/distance-calculator.html>.
Martes, L. "Revision of IMO Model Course 3.17 Maritime English. Focus on Maritime English
to Auxiliary Personnel." TransNav TransNav, the International Journal on Marine Navigation
and Safety of Sea Transportation 9.3 (2015): 309-13. IMO and Ro-ro Safety. Jan. 1997. Web. 1
Dec. 2015.
Micklitz, Christopher Karl. "A Guide on Using DNV Sesam for Design and Analysis of Ships."
1st ser. 1.1 (2015): 1-55. TAMUG E-Campus. Texas A&M University, June 2015. Web. Oct.-
Nov. 2015.
"Operations Quality Manual for Commercial Vehicles." (2012): 1-30. ECG, Jan. 2012. Web.
Oct. 2015.
"Steel Vessels 2015." Part 3 Hull Construction and Equipment (2014): 1-331. American Bureau
of Shipping, 2014. Web.
"Steel Vessels 2015." Specific Vessel Types (Chapters 7-12) (2014): 907-1664. American Bureau
of Shipping, 2015. Web.
Internal Doors. N.p.: TTS Marine, n.d. Web. 3 Dec. 2015.
"Welcome to Volvo." Volvo Group. N.p., 2014. Web. 18 Oct. 2015.
"6S60ME-C Engine." Marine Engines & Systems. N.p., n.d. 2014. Web. 3 Dec. 2015

40
11. Appendix
Page intentionally left blank.