transient receptor potential vanilloid 1 (trpv1) in
TRANSCRIPT

Transient Receptor Potential Vanilloid 1 (TRPV1)
in Haematological Malignancies
Sofia Atif (Moh’dAli) Omari
B.Sc., M.Sc. (Medical Laboratory Sciences)
Jordan University of Science and Technology
A thesis submitted in fulfilment of the requirements for the
Degree of Doctor of Philosophy
School of Human Life Sciences
University of Tasmania
May 2014

i
Dedication
To my parents, husband Asal, son Awsam and my newborn Karam.
With all my love....

ii
Declaration of Originality
This thesis contains no material which has been accepted for a degree or diploma by
the University or any other institution, except by way of background information and
duly acknowledged in the thesis, and to the best of my knowledge and belief no
material previously published or written by another person except where due
acknowledgement is made in the text of the thesis, nor does the thesis contain any
material that infringes copyright.
Full Name Sofia Atif (Moh’dAli) Omari
Signed …………………………….
Date …………………………….
Authority of Access
This thesis is not to be made available for loan or copying for two years following
the date this statement was signed. Following that time the thesis may be made
available for loan and limited copying and communication in accordance with the
Copyright Act 1968.
Full Name Sofia Atif (Moh’dAli) Omari
Signed …………………………….
Date …………………………….
Statement of Ethical Conduct
The research associated with this thesis abides by the international and Australian
codes on human and animal experimentation, the guidelines by the Australian
Government's Office of the Gene Technology Regulator and the rulings of the
Safety, Ethics and Institutional Biosafety Committees of the University. This study
was approved by the Human Research Ethics Committee Network, Tasmania
(Approval No. H0011050).
Full Name Sofia Atif (Moh’dAli) Omari
Signed …………………………….
Date …………………………….

iii
Acknowledgments
I would like to express my sincere gratitude and appreciation to everyone who has
been involved in the work of this thesis, with special thanks to the following
Dr. Murray Adams and Prof. Dominic Geraghty, my supervisors, not only for being
the initiators and facilitators of this research, but also for their invaluable guidance,
flexibility, patience, support and ability to help me through the tough times. They
always kept focussing on the optimistic side and encouraged me to get through any
frustration. I can’t say enough to thank you both! You maintained the smile on my
face even when I wasn’t in the mood.
Assoc. Prof. Alhossain Khalafallah, my research advisor, for the support and help he
provided in recruiting patients, and for his enthusiasm and dedication to research,
and to the in-need. I would also like to thank the participants involved in this study
without whom, this research would not have been possible.
Dr. Dale Kunde for his technical support and troubleshooting, Dr. Anthony Cook for
his invaluable advice, Prof. Peter McIntyre for his gift of TRPV1-transfected
HEK293 cells and Dr. Rajaraman Eri for his support and RAW264.7 cells.
The Clifford Craig Medical Research Trust and University of Tasmania for generous
financial support, and Australian government for the Australian Postgraduate Award.
My colleagues; Yvette Shegog for her invaluable support and guidance during the
preliminary stage of flow cytometry method development, Emma Walker for her
collaboration in adherent cell culture and protein assay, staff in the School of Human
Life Sciences, especially Dr. Kiran Ahuja, and the technical staff, in particular
Merrilyn Johnson, for providing laboratory assistance.

iv
Many thanks to my postgraduate research colleagues, Dr. Safa Al-Maghrabi,
Katharine Herbert, Waheeda Basheer and all in the postgraduate room, for the nice
times we spent together and for your support.
Special thanks are given to Dr. Scott Ragg and his team at the Royal Hobart Hospital
for sharing their knowledge and advice with regard to flow cytometry, Launceston
General Hospital Pathology, and Holman Clinic for their helping hands and support.
My parents had to grudgingly learn to accept my separation from them and still gave
me nothing but support, day after day, my love and gratitude for them can hardly be
expressed in words. I would also like to thank my loved ones, my two sisters Dareen
and Noor, my three brothers Mohammad, Yahya and Islam, who have supported me
throughout the entire process, by keeping me harmonious and believing in me.
Next in the list is my beloved, wonderful 3 year old son Awsam, who I gave birth to
during my PhD candidature. Thank you sweetheart for your unconditional love and
support, and for dealing with my frustrations during this journey. And to my
newborn Karam, the most wonderful surprise in my life, who decided to come to life
early and before I submit this thesis. I love you baby, you are my little angel!
Finally, but most importantly, I would like to thank my soul-mate and husband Asal
for his patience and understanding in all those times I had to put this project first.
Without your presence in my life, encouragement and endless love and support, I
would never be where I am or achieve any of this. With you, the dream come true, I
will always be grateful.

v
Table of Contents
Dedication .......................................................................................................................................... i
Declaration of Originality.................................................................................................................. ii
Authority of Access ........................................................................................................................... ii
Statement of Ethical Conduct ............................................................................................................ ii
Acknowledgments ............................................................................................................................ iii
Table of Contents .............................................................................................................................. v
List of Figures ................................................................................................................................ viii
List of Tables ..................................................................................................................................... x
List of Abbreviations ........................................................................................................................ xi
Presentations at Conferences during PhD Candidature ................................................................... xv
Abstract ............................................................................................................................................. 1
1. Chapter 1: Literature Review ........................................................................... 5
1.1 Introduction .............................................................................................................................. 6
1.2 Overview of TRP Channels ..................................................................................................... 6
1.3 Transient Receptor Potential Vanilloid 1 (TRPV1) ............................................................... 11 1.3.1 Structure ....................................................................................................................... 11 1.3.2 Activation of TRPV1.................................................................................................... 12 1.3.3 Expression of TRPV1 ................................................................................................... 14
1.4 TRPV1 and Pain .................................................................................................................... 15 1.4.1 TRPV1 and nociceptive pain ........................................................................................ 16 1.4.2 Sensitisation and desensitisation of TRPV1 receptors ................................................. 16
1.5 TRPV1 and Disease ............................................................................................................... 20 1.5.1 Neuropathic Pain Syndromes ....................................................................................... 20 1.5.2 Neurogenic Inflammation ............................................................................................. 21 1.5.3 Systemic Diseases ........................................................................................................ 21 1.5.4 Vanilloid-induced Apoptosis and Cancer ..................................................................... 23
1.6 TRPV1 Expression and Function in Immune System Cells................................................... 25 1.6.1 Lymphocytes ................................................................................................................ 25 1.6.2 Macrophages ................................................................................................................ 27 1.6.3 Neutrophils ................................................................................................................... 29
1.7 The TRPV1: Role in Haematological Malignancies .............................................................. 29 1.7.1 Leukaemic cell lines ..................................................................................................... 31 1.7.2 Adult T-cell leukaemia ................................................................................................. 32 1.7.3 Multiple Myeloma ........................................................................................................ 33
1.8 Project Aims .......................................................................................................................... 34
1.9 Hypotheses ............................................................................................................................. 34
2. Chapter 2: Capsaicin-Induced Death of Human Haematological Malignant
Cell Lines is Independent of TRPV1 Activation ................................................... 36
2.1 Abstract .................................................................................................................................. 37
2.2 Introduction ............................................................................................................................ 38

vi
2.3 Materials and Methods ........................................................................................................... 40 2.3.1 Materials ....................................................................................................................... 40 2.3.2 Methods ........................................................................................................................ 40 2.3.3 Cryopreservation .......................................................................................................... 43 2.3.4 Cell metabolic activity assays ...................................................................................... 43
2.4 Results .................................................................................................................................... 45
2.5 Discussion .............................................................................................................................. 53
3. Chapter 3: Validation and Optimisation of a Western Blotting Method to
Detect TRPV1 Protein in Human Peripheral Blood Mononuclear Cells and
Malignant Haematological Cell Lines .................................................................... 59
3.1 Abstract .................................................................................................................................. 60
3.2 Introduction ............................................................................................................................ 61
3.3 Materials and Methods ........................................................................................................... 61 3.3.1 Materials ....................................................................................................................... 61 3.3.2 Cells .............................................................................................................................. 62 3.3.3 Antibodies .................................................................................................................... 62 3.3.4 Ethical Approval .......................................................................................................... 62 3.3.5 Cell Processing ............................................................................................................. 64 3.3.6 Protein Assay ................................................................................................................ 65 3.3.7 Blocking Solutions Optimisation ................................................................................. 65 3.3.8 Protein Quantity Optimisation ...................................................................................... 66 3.3.9 Western Blotting (Optimised Protocol) ........................................................................ 66
3.4 Results .................................................................................................................................... 69 3.4.1 Optimisation of the Western Blotting Protocol ............................................................ 69 3.4.2 Detection of TRPV1 in Human PBMCs using the Optimised Method ........................ 77
3.5 Discussion .............................................................................................................................. 78
4. Chapter 4: Development and Optimisation of a Flow Cytometric Method
for the Detection of TRPV1 Expression in Human Leukocytes .......................... 85
4.1 Abstract .................................................................................................................................. 86
4.2 Introduction ............................................................................................................................ 87
4.3 Materials and Methods ........................................................................................................... 88 4.3.1 Materials ....................................................................................................................... 88 4.3.2 Methods ........................................................................................................................ 89
4.4 Results .................................................................................................................................... 93 4.4.1 Flow Cytometry Optimisation setup ............................................................................ 93 4.4.2 Fixation and Permeabilisation Optimisation ................................................................ 94 4.4.3 Assessment of the Primary Antibodies ......................................................................... 95 4.4.4 Secondary Antibody Assessment ................................................................................. 98 4.4.5 Detection of TRPV1 in Human Normal Leukocytes using the Optimised Method ... 101
5.4 Discussion ............................................................................................................................ 102
5. Chapter 5: TRPV1 Expression in Human Haematological Malignancy Cell
Lines ........................................................................................................................ 109
5.1 Abstract ................................................................................................................................ 110

vii
5.2 Introduction .......................................................................................................................... 111
5.3 Materials and Methods ......................................................................................................... 112 5.3.1 Cells and Cell Culture ................................................................................................ 112 5.3.2 Western Blotting and Flow Cytometry Experiments .................................................. 113 5.3.3 Data Collection and Analysis ..................................................................................... 114
5.4 Results .................................................................................................................................. 114 5.4.1 TRPV1 Expression in Malignant Haematological Cell lines ..................................... 114 5.4.2 TRPV1 Expression in Other Cell lines: A Control Study .......................................... 117
5.5 Discussion ............................................................................................................................ 120
6. Chapter 6: TRPV1 Expression in Patients with Haematological
Malignancies ........................................................................................................... 127
6.1 Abstract ................................................................................................................................ 128
6.2 Introduction .......................................................................................................................... 129
6.3 Materials and Methods ......................................................................................................... 129
6.4 Results .................................................................................................................................. 130 6.4.1 General Characteristics of Patients and Controls ....................................................... 130 6.4.2 Detection of TRPV1 using Flow cytometry ............................................................... 131 6.4.3 TRPV1 Detection Using Western blotting ................................................................. 139
6.5 Discussion ............................................................................................................................ 141
7. Chapter 7: Conclusions and Future Studies ................................................ 148
Appendix I: Preliminary Flow Cytometry Optimisation Using BD
FACScalibur™ ....................................................................................................... 157
Appendix II: Patients and Control Subjects Consent Forms ............................ 166
Appendix III: Experiments Sheets and Protocols ............................................... 175
References ............................................................................................................... 185

viii
List of Figures
Figure 1-1: Topological model of TRPV1 ................................................................. 12
Figure 1-2: TRPV1 signal transduction ..................................................................... 18
Figure 1-3: TRPV1 status. ......................................................................................... 20
Figure 2-1: Differential response of THP-1, U266B1 and U937 cells to CAP.......... 45
Figure 2-2: Effect of CAP and the TRPV1 antagonist, SB452533, on the metabolic
activity (resazurin reduction) of THP-1, U266B1 and U937 cells ............................ 47
Figure 2-3: Effect of SB452533, AM251 and AM630 on CAP-induced change in
metabolic activity (resazurin reduction) in THP-1 cells ............................................ 50
Figure 2-4: Effect of SB452533, AM251 and AM630 on CAP-induced metabolic
activity (resazurin reduction) of U266B1 cells .......................................................... 51
Figure 2-5: Effect of SB452533, AM251 and AM630 on CAP-induced metabolic
activity (resazurin reduction) of U937 cells ............................................................... 52
Figure 3-1: TRPV1 detection attempt using the Biotin-Streptavidin detection system
in THP-1 cells ............................................................................................................ 70
Figure 3-2: ECL detection method with secondary antibody dilution study, 1:5000 vs.
1:10000 of Santa Cruz Biotechnology in THP-1 cells ............................................... 70
Figure 3-3: Protein quantity study (10, 20 and 30 µg) of THP-1 cell lysate to detect
TRPV1 with Santa Cruz anti-TRPV1 using the ECL method ................................... 71
Figure 3-4: TRPV1 detection using Alomone Labs anti-TRPV1 antibody ............... 72
Figure 3-5: Detecting TRPV1 using LifeSpan Biosciences antibody ........................ 73
Figure 3-6: Titration & blocking studies for LifeSpan Biosciences Anti-TRPV1.. .. 74
Figure 3-7: Secondary antibody (Santa Cruz Biotechnology) titration study. ........... 75
Figure 3-8: Secondary antibody (Cell Signalling Technology) dilution Study. ........ 76
Figure 3-9: TRPV1 detected in normal human PBMCs protein. ............................... 77
Figure 4-1: Example of optimised Attune® Cytometer settings using AbC™ beads.
.................................................................................................................................... 94
Figure 4-2: FSC and SSC electronic optimisation for fixed/ permeabilised cells using
the Attune® Flow Cytometer ..................................................................................... 94
Figure 4-3: Isotype control overlapping with TRPV1 signal in human leukocyte. ... 95
Figure 4-4: Santa Cruz Biotechnology anti-TRPV1 blocking optimisation using flow
cytometry.................................................................................................................... 96
Figure 4-5: Comparison between two isotype controls vs. Santa Cruz Biotechnology
anti-TRPV1 ................................................................................................................ 97
Figure 4-6: Alomone Labs anti-TRPV1 signal .......................................................... 97
Figure 4-7: Blocking step optimisation for anti-TRPV1 (LifeSpan Biosciences, USA)
signal .......................................................................................................................... 99
Figure 4-8: Dilution study of LifeSpan Biosciences anti-TRPV1 ............................. 99
Figure 4-9: Secondary antibody titration for FITC-goat anti rabbit (Santa Cruz
Biotechnology) using the Attune® Cytometer ........................................................ 100
Figure 4-10: TRPV1 detection in normal human WBCs using the optimised protocol.
.................................................................................................................................. 101

ix
Figure 5-1: TRPV1 expression was detected in THP-1 cells using Western blotting
and flow cytometry .................................................................................................. 115
Figure 5-2: TRPV1 expression was detected in U266B1 cells ................................ 115
Figure 5-3: TRPV1 expression was detected in U937 lymphoma cells .................. 116
Figure 5-4: Relative expression of TRPV1 in three haematological malignant cell
lines .......................................................................................................................... 116
Figure 5-5: TRPV1 expression in TRPV1-transfected HEK293 cells (tetracycline
(tet) on/off) by flow cytometry ................................................................................ 117
Figure 5-6: TRPV1 expression in TRPV1-transfected HEK293 cells (tetracycline off)
by Western blotting. ................................................................................................. 118
Figure 5-7: TRPV1 expression in untransfected HEK293 cells by Western blotting.
.................................................................................................................................. 118
Figure 5-8: TRPV1 expression in HEK293 cells was confirmed by flow cytometry.
.................................................................................................................................. 118
Figure 5-9: TRPV1 was detected in RAW264.7 cells. ............................................ 119
Figure 6-1: TRPV1 expression in patients with haematological malignancies. ...... 132
Figure 6-2: TRPV1 expression for all patients with haematological malignancies vs.
controls ..................................................................................................................... 133
Figure 6-3: TRPV1 expression in patients with B-NHL. ......................................... 133
Figure 6-4: TRPV1 expression in patients with MM ............................................... 137
Figure 6-5: TRPV1 expression in patients with other blood cancers....................... 138
Figure 6-6: TRPV1 MFI ratio between males and females ..................................... 138
Figure 6-7: TRPV1 expression in PBMCs protein samples of patients with
haematological malignancies using Western Blotting.. ........................................... 139

x
List of Tables
Table 1-1: Overview of TRP family subgroups ........................................................... 8
Table 1-2: Summary of studies investigating the role of TRPV1 in systemic diseases
and conditions ............................................................................................................ 22
Table 1-3: Some non-haematological cell lines that undergo vanilloid-induced cell
death ........................................................................................................................... 24
Table 1-4: Summary of TRPV1-expression and function in malignant haematological
cell lines ..................................................................................................................... 30
Table 2-1: Characteristics of the studied haematological malignant cell lines .......... 41
Table 2-2: EC50/IC50 for CAP-induced metabolic activity in THP-1, U266B1 and
U937 cells .................................................................................................................. 46
Table 3-1: Characteristics of the primary rabbit anti-TRPV1 and anti-GAPDH
antibodies ................................................................................................................... 63
Table 3-2: Characteristics of secondary antibodies used in Western blot ................. 64
Table 3-3: Western blotting protocols tested to detect TRPV1 in human malignant
cell lines and PBMCs ................................................................................................. 67
Table 3-4: Summary of some studies detecting TRPV1 by Western blot ................. 80
Table 4-1: Characteristics of the isotype controls used in the study .......................... 89
Table 4-2: Mean-MFI values for different normal leukocytes subpopulations ....... 102
Table 4-3: Some published studies on TRPV1 expression detected by flow cytometry
.................................................................................................................................. 103
Table 5-1: Comparison of TRPV1 Mean-MFI in THP-1, U266B1 and U937 cell lines
and normal leukocytes.............................................................................................. 116
Table 5-2: TRPV1 MFI in some cell lines compared to normal leukocytes from
healthy control .......................................................................................................... 119
Table 6-1: General characteristics of patients with haematological malignancies .. 131
Table 6-2: Characteristics of B-NHL patients compared to control subjects used for
analysis of TRPV1 expression by flow cytometry ................................................... 134
Table 6-3: Characteristics of MM patients compared to control group subjects used
for analysis of TRPV1 expression by flow cytometry ............................................. 135
Table 6-4: Other haematological malignant cancers patients compared to control
subjects used for analysis of TRPV1 expression by flow cytometry ....................... 136
Table 6-5: Patients with detected TRPV1 bands on Western Blotting ................... 140
Table 6-6: Features of some drugs used to treat haematological malignancies ....... 146

xi
List of Abbreviations
A-425619 1-isoquinolin-5-yl-3-(4-trifluoromethyl-benzyl)urea
A-778317 1-((R)-5-tert-butyl-indan-1-yl)-3-isoquinolin-5-yl-urea
AA Arachidonic acid
ACA N-(p-amylcinnamoyl)anthranilic acid
ADP Adenosine diphosphate
AEA N-arachidonoylethanolamine (anandamide)
ALL Acute lymphocytic leukaemia
AMG628 (R)-N-(4-(6-(4-(1-(4-fluorophenyl)ethyl)piperazin-1-
yl)pyrimidin-4-yloxy)benzo[d]thiazol-2-yl)acetamide
AML Acute Monocytic Leukaemia
AMP Adenosine monophosphate
AMPK AMP-activated protein kinase
AP-1 Activator protein-1
ATL Adult T-cell leukaemia
ATP Adenosine triphosphate
Bax Bcl-2–associated X protein
Bcl-2 B-cell lymphoma 2
Bcl-xL B-cell lymphoma-extra large
BCTC N-(4-tertiarybutylphenyl)-4-(3-chloropyridin-2-yl)
tetrahydropyrazine-1(2H)-carbox-amide.
BDNF Brain-derived neurotrophic factor
bFGF Basic fibroblast growth factor
BTP2 4-methy-4′-[3,5-bis(trifluoromethyl)-1H-pyrazol-1-yl]-
1,2,3-thiadiazole-5-carboxanilide
C- terminus Carboxy terminus
CaM Calmodulin
CaMKII Ca2+
-calmodulin-dependent kinase II
cAMP Cyclic adenosine monophosphate
CAP Capsaicin
CAZ Capsazepine
CD Cluster of Differentiation
CDK Cyclin-dependent kinase
CGRP Calcitonin gene-related peptide
CLL/SLL Chronic lymphocytic leukaemia/ small lymphocytic
lymphoma
CML Chronic myelogenous leukaemia
CMML Chronic Myelomonocytic Leukaemia
CNS Central Nervous System
COPD Chronic Obstructive pulmonary disease
CRP C- reactive protein
DAG Diacylglycerol
DC Dendritic cell
DMEM Dulbecco's Modified Eagle Medium
DMSO Dimethyl sulfoxide
DPTHF Diphenyltetrahydrofuran
DPBA Diphenylboronic anhydride
DRG Dorsal root ganglion
xii
ECL Enhanced Chemiluminescence
eIF2α Eukaryotic translation initiation factor 2, subunit 1 (α,
35kDa)
eIF2αK3 Eukaryotic translation initiation factor-2α kinase-3
EIPA Ethylisopropyl amiloride
ER Endoplasmic reticulum
ET Essential thrombocythaemia
ETC Electron transport chain
FBS Foetal Bovine Serum
FITC Fluorescein isothiocyanate
FSC Forward Scatter
GADD153 Growth arrest- and DNA damage-inducible transcript 3
GAPDH Glyceraldehyde 3-phosphate dehydrogenase
GARD Gastroesophegal reflux disease
GM-CSF Granulocyte-macrophage colony stimulating factor
GTPγS Guanosine gamma thiophosphate
HCL Hairy-Cell Leukaemia
HEK293 Human Embryonic Kidney cells
HEPES 4-(2-hydroxyethyl)-1-piperazineethanesulfonic acid
HL-60 Human myelocytic leukaemia
HRP Horseradish Peroxidase
ICDA Inhibitor of caspase activated DNase
IDN Identification number
IFN-γ Interferon-gamma
IL-1/ 2/ 6 Interleukin-1/ 2/ 6
ILD Interstitial lung disease
Ins(1,4,5)P3 Inositol 1,4,5-trisphosphate
IP3 Inositol triphosphate
JNJ17203212 4-(3-trifluoromethyl-pyridin-2-yl)-piperazine-1-
carboxylic acid (5-trifluoromethyl-pyridin-2-yl)-amide
JYL1421 N-(4-tert-butylbenzyl)-N′-[3-fluoro-4-
(methylsulfonylamino)benzyl]thiourea
KB-R7943 2-[2-[4-(4-nitrobenzyloxy)phenyl]ethyl]isothiourea
methanesulfonate
LGH Launceston General Hospital
LNCaP Androgen-dependent prostate cancer cells
MAPK Mitogen-activated protein (MAP) kinases
MFI Median Fluorescence intensity
ML-9 1-(5-chloronaphtalene-1-sulphonyl) homopiperazine
MM Multiple myeloma
MPD Myeloproliferative Disorder
MTT 3-(4,5-dimethylthia-zol-2-yl)-2,5-diphenyltetrazolium
bromide
M.W Molecular weight
N- terminus Amino- terminus
NADA N-arachidonoyldopamine
NADH Nicotinamide adenine dinucleotide
NFAT Nuclear factor of activated T-cells

xiii
NF-κB Nuclear factor kappa-light-chain-enhancer of activated B
cells
NFM Non-Fat Milk
NGF Nerve growth factor
NHBE Normal human bronchial epithelial
NHL Non-Hodgkin’s Lymphoma
OAG 1-oleoyl-2-acetyl-sn-glycerol
p21 WAF1/CIP1
Cyclin-dependent kinase inhibitor
PBMC Peripheral blood mononuclear cell
PBS Phosphate buffer saline
PBSA Phosphate buffer saline-sodium azide
PBST Phosphate buffer saline tween- 20
PC3 Androgen-independent prostate cancer cells
PHB2 Prohibitin
PI3K Phosphatidylinositol 3-kinase
PIP2 Phosphatydyl-inositol-4,5-bisphosphate
PKA Protein kinases A
PKC Protein kinases C
PLC Phospholipase C
PMA Phorbol 12-myristate 13-acetate
PMT Photo multiplier tube
PgE2 Prostaglandin E2
PP Peyer’s patch
PTCL-NOS Peripheral T-cell lymphoma/ not otherwise specified
PVDF Polyvinylidene difluoride
Q-PCR Quantitative real-time PCR
RCF Relative Centrifugal Force
RHC80267 1,6-di[O-(carbamoyl)cyclohexanone oxime]hexane
ROS Reactive oxygen species
RT-4 Human well-differentiated low-grade papillary
RT-PCR Reverse transcription polymerase chain reaction
RTX Resiniferatoxin
SB366791 N-(3-methoxyphenyl)-4-chlorocinnamide
SDS Sodium Dodecyl Sulphate
SSC Side Scatter
STAT Signal transducer and activator of transcription
TBMC 6-tert-butyl-m-cresol
THC Δ9-tetrahydrocannabinol
TNF-α tumour necrosis factor-alpha
TRAIL Tumour necrosis factor-related apoptosis-inducing
ligand
TRIM 1-(2-(trifluoromethyl)phenyl) imidazole
trkA Tyrosine kinase A
TRP Transient receptor potential
TRPV1 Transient receptor potential vanilloid type 1
URB597 3′-carbamoylbiphenyl-3-yl cyclohexylcarbamate.
UTAS University of Tasmania Va
Varitint-waddler phenotype

xiv
WS-12
2-isopropyl-5-methyl-cyclohexanecarboxylic acid (4-
methoxy-phenyl)-amide
2-APB 2-aminoethoxydiphenyl borate
4α-PDD 4α-phorbol 12,13-didecanoate
5-HT Serotonin
5(6)-EET 5’,6’-epoxyeicosatrienoic acid
5-(S)-HETE 5-(S)-hydroxyeicosatetraenoic acid
12-(S)-HPETE and 15-
(S)-HPETE
12- and 15-(S)-hydroperoxyeicosatetraenoic acids
20-HETE 20-hydroxyeicosatetraenoic acid
ΔΨm Mitochondrial membrane potential

xv
Presentations at Conferences during PhD Candidature
Conference Presentations
Omari, S and Adams, MJ and Khalafallah AA and Mohamed, M and Geraghty,
DP, TRPV1 expression in haematological malignancies, Annual Combined ASM
of APSA and ASCEPT, 1 - 4 December, Melbourne, Australia (2013) [Conference
Extract].
Omari, S and Geraghty, DP and Kunde, DA and Adams, MJ, Inhibition of Human
Haematological Malignant Cell Lines by Capsaicin is not TRPV1-Mediated,
Annual Combined ASM of the HSANZ/ANZBT/ASTH and the APSTH, 28 – 31
October, Melbourne, Australia (2012) [Conference Extract].
Omari, S and Kunde, DA and Adams MJ and Geraghty DP, Inhibition of human
haematological malignant cell line growth by capsaicin is not TRPV1-mediated,
Annual Combined ASM of APSA and ASCEPT, 2-5 December, Sydney, Australia
(2012) [Conference Extract].
Presentations related to but not directly arising from this thesis
Conference Presentation
Shegog, YM and Omari, S and Adams, MJ and Ragg, S and Eastley, B and
Geraghty, DP, Flow cytometric analysis of transient receptor potential vanilloid 1
(TRPV1) in human leukocyte populations, Proceedings of the ASCEPT, December
4- 9, Perth, Australia, pp. p77 (2011) [Conference Extract].

1
Abstract
Transient receptor potential vanilloid-1 (TRPV1) is a member of the TRP family of
channels that are responsible for nociceptive, thermal and mechanical sensations. It is
primarily associated with neuronal cells, but has been detected in different non-
neuronal cells, including leukocytes. Capsaicin (CAP), the active ingredient of hot
chilli peppers, is one of a number of related endogenous and plant-derived
compounds (broadly termed ‘vanilloid-like agents’) that have been shown to induce
apoptosis and inhibit cell proliferation in some cancer cells, through both TRPV1-
dependent and -independent mechanisms. The expression and function of TRPV1 in
haematological malignancies however, has not been extensively investigated.
Specific targeting by vanilloid-like agents toward TRPV1 on cancerous cells in
patients with haematological malignancies may represent a novel therapeutic
approach to treating these diseases.
This thesis investigated the expression and function of TRPV1 in haematological
malignancies, using both blood cancer cell lines and blood samples obtained from
patients with different blood cancers. The specific aims were to; 1) study the effect
of TRPV1 agonists and antagonists on the viability of THP-1, U266B1 and U937
haematological malignant cell lines, 2) validate and optimise Western blotting and
flow cytometry protocols to detect TRPV1 expression in leukocytes, 3) investigate
TRPV1 expression in THP-1, U266B1 and U937 cells, and 4) compare TRPV1
expression in leukocytes obtained from patients with blood cancers to normal
subjects.

2
The thesis begins with a comprehensive review and discussion on TRPV1 structure
and function, as well as its expression and role in health and disease. In particular,
there is a focus on the role of TRPV1 in cancer, including haematological
malignancies (Chapter 1).
In Chapter 2, the effect of CAP on the metabolic activity of three malignant
haematological cell lines, THP-1, U266B1 and U937, was investigated. Metabolic
activity assays were performed using the alamarBlue® method. CAP induced
cytotoxicity in all three cell lines in a concentration-dependent manner. A biphasic
effect on metabolic activity was observed on THP-1 cells [EC50, IC50 (95% CI) =
32.9 (19.9-54.3), 219 (144-246) µM]. U266B1 cells were more resistant to CAP-
induced death than THP-1 and U937 cells. TRPV1 and CB1 antagonists (SB452533
and AM251, respectively) suppressed the CAP-induced increase in THP-1 cell
metabolic activity (P<0.001). These experiments suggest that CAP inhibits the
metabolic activity of malignant haematological cells through a non-TRPV1-
dependent mechanism.
Chapters 3 and 4 represent the experimental work and trouble-shooting conducted to
develop, validate and optimise methods for the detection of TRPV1 expression in
human cells. Western blotting (Chapter 3) and flow cytometric (Chapter 4) methods
have been previously published, however few have documented the use of
appropriate controls for the detection of TRPV1, suggesting that data in the literature
may not necessarily be valid. A problem identified in the current study was the
correct application of negative controls, particularly to assess the specificity and
therefore suitability of the primary antibody used in these methods. These optimised

3
protocols were then used to investigate the expression of TRPV1 in human malignant
haematological cell lines (Chapter 5) and leukocytes obtained from patients with
blood cancers (Chapter 6).
Increased expression of TRPV1 protein was observed in THP-1, U266B1 and U937
cells compared to normal leukocytes. Furthermore, a TRPV1 dimer was detected in
U266B1 cells. Interestingly, TRPV1 was detected in non-haematological cell lines
that have previously been used as TRPV1-negative cells for Western blotting,
including untransfected- and TRPV1-transfected (without tetracycline to switch
TRPV1 transcription off) HEK293 and RAW264.7 cells. This latter finding
highlights the need for appropriate negative (and positive) controls in both flow
cytometric and Western blotting studies of TRPV1.
Expression of TRPV1 in leukocytes obtained from patients with a range of
haematological malignancies, including multiple myeloma (MM) and B-cell non-
Hodgkin’s Lymphoma (B-NHL), was then investigated (Chapter 6). TRPV1
expression was detected in all patients and controls using flow cytometry, but not
Western blotting. Using flow cytometry, a sub-group of patients (4/49=8.2%,
MM=2, B-NHL=2) demonstrated increased expression of TRPV1 relative to the
remainder of the cohort. TRPV1 was found to be similar to the control group for
91.8% of all patients. There were no significant differences in TRPV1 expression
(assessed using flow cytometry) between patients with MM and B-NHL, or between
de novo patients and those undergoing treatment. Using Western blotting, TRPV1
(~95kDa) was detected in one MM and four B-NHL patients, although interestingly,
a 240kDa band was also detected in both a B-NHL and a MM patient. In addition,

4
although C-reactive protein was elevated (≥5 mg/L) in 25% of all patients, it was not
associated with higher TRPV1 expression. These results indicate that TRPV1
expression in leukocytes is relatively increased in a small subset of patients with
blood cancers, and is not associated with inflammation. Furthermore, some patients
may have a unique isoform of TRPV1 that warrants further investigation.
In summary, this study has generated new data and knowledge on the role of TRPV1
in haematological cells, including those from patients with blood cancers. A number
of novel findings have been reported. Firstly, the inhibition of cell metabolic activity
by the TRPV1 agonist, CAP, was found to be independent of TRPV1 activation in
malignant haematological cell lines. Secondly, optimised Western blotting and flow
cytometric methods for the detection of TRPV1 expression were developed and
successfully validated. Thirdly, increased TRPV1 expression was demonstrated in
the THP-1, U266B1 and U937 malignant haematological cell lines. Finally,
increased TRPV1 expression was observed in some patients with MM and B-NHL,
but was not associated with inflammation. The results presented in this thesis can be
used as a basis for future studies of TRPV1 function in other human cells and
cancers.

5
1. Chapter 1: Literature Review

6
1.1 Introduction
Natural compounds have been used over decades for treating various diseases and for
relieving symptoms, although the mechanisms explaining their effects have largely
not been described. Capsaicin (CAP), the active ingredient of ‘hot chilli peppers’, has
been proposed as an anticancer agent. It has been shown to induce apoptosis and
inhibit cell proliferation in some cancer cells, including haematological malignancies
(Ito et al. 2004; Zhang et al. 2003a).
The CAP receptor, transient receptor potential vanilloid-1 (TRPV1), originally
described as an afferent neuron nociceptive receptor, is expressed in neuronal and
non-neuronal cells (Cortright and Szallasi 2004; Nagy et al. 2004). However, there
are few published studies of TRPV1 expression in haematological malignancies
(Bhutani et al. 2007; Gertsch et al. 2002). The focus of this thesis was to therefore
investigate the expression and role of TRPV1 in malignant haematological cell lines,
as well as in patients with blood cancers and compared to normal subjects.
1.2 Overview of TRP Channels
TRP channels and more specifically, TRPV1, are not only important in many sensory
systems, they are crucial components for the function of non-sensory neurons, such
as in epithelial, blood and smooth muscle cells (Minke 2006).
The TRP superfamily consists of a large number of non-selective cation channels
that are permeable to both monovalent and divalent cations. These channels are seen
as universal biological sensors that detect changes in the environment, including

7
intracellular and extracellular messengers, exogenous chemicals, temperature, and
mechanical stress (Table 1-1).
TRP channels are involved in multiple functions, including nociception, temperature,
mechanical sensations, renal Ca2+
/Mg2+
handling, lysosomal function, cardiovascular
regulation, control of cell growth and proliferation, perception of pungent
compounds (e.g., chilli, mustard, garlic), taste perception, smooth muscle tone and
blood pressure regulation (Christensen and Corey 2007; Clapham et al. 2003;
Ramsey et al. 2006). TRP channels consist of six transmembrane domains segments
(S1–S6) and a pore region between S5 and S6, with both the carboxy (C-) and amino
(N-) termini located intracellularly (Clapham et al. 2005; Minke 2006). Despite the
structural similarities between the TRPs and the voltage-gated K+ channels, these
group of channels are quite different (Clapham et al. 2005). At least 28 different TRP
subunit genes have been identified in mammals, comprising six subfamilies, namely
the classical or canonical TRPs, TRPV (vanilloid), TRPM (melastatin), TRPA
(ankyrin), TRPP (polycystin), and TRPML (mucolipin). Each subfamily comprises
several channel subtypes, which differ in their selectivity for Ca2+
, activation
mechanisms, and interacting proteins (see Table 1-1) (Clapham 2007; Holzer 2008;
Nilius 2007).
The group of thermo-TRP channels, such as TRPV1 and TRPM8 sense a wide
spectrum of temperatures from painful cold to painful heat (≥43°C, <22-26°C,
respectively) (Dhaka et al. 2006). Moreover, they are able to detect specific chemical
entities including unpleasant and/or painful toxins, whereby TRP channels subserve
chemaesthesis, defined as the chemical sensibility of the skin and mucus membranes

8
TRP PCa/PNa Agonists/ Activators Role Antagonists References
TRPC1
- Depletion of int. Ca2+
stores, PLC, DAG,
OAG, orexin-A, TRK-PLCγBDNF, bFGF,
thapsigargin,carbachol, Gq/11-coupled
receptors, membrane stretch, int. NO-
mediated cysteine S-nitrosylation
Vertebrate mechanosensitive Ca2+
permeable channel that is gated by
tension developed in the lipid bilayer
2APB, Gd3+
, La3+
, SKF96365, Ca2+
-
CaM, GsMTx-4
(Abramowitz and Birnbaumer
2009; Alexander et al. 2007;
Bollimuntha et al. 2006; Maroto et
al. 2005; Venkatachalam et al.
2003)
TRPC2
2.7
DAG, Ca2+
stores depletion, AA
Pheromone and odours sensing in
mice
Unknown (Abramowitz and Birnbaumer
2009; Gailly 2012; Zufall 2005)
TRPC3
1.6
DAG, OAG, orexin-A, IP3, Ca2+
store
depletion,
TRK-PLCγ, BDNF, PLC, Gq/11-coupled
receptors, Ins(1,4,5)P3, Ca2+
, PIP2
BDNF mediated neuronal
differentiation, vasomotor function,
resistance vessel, airway regulator,
antigen(Ag) stimulation lymphocytes
Gd3+
, La3+
, Ni2+
, 2-APB, SKF96365,
KB-R7943, BTP2
(Abramowitz and Birnbaumer
2009; Alexander et al. 2007; He et
al. 2005; Hofmann et al. 1999;
Kiyonaka et al. 2009; Numaga et al.
2010)
TRPC4
1.1 GTPγS, La3+
(at µM range), Gq/11-coupled
receptors, ext.H+, thapsigargin, F2v peptide
and calmidazolium by antagonism of Ca2+
-
CaM, NO-mediated cysteine S-nitrosylation,
Vasoregulation, lung microvascular
permeability, GABAergic input
lateral geniculate nucleus
Pyr3, BTP2, La3+
(high
concentrations), 2-APB, SKF96365
(Abramowitz and Birnbaumer
2009; Alexander et al. 2007; Jung
et al. 2011; Nilius et al. 2005)
TRPC5
9 GTPγS, Gq/11-coupled receptors, Ins(1,4,5)P3,
adenophostin A, thapsigargin, La3+
, Gd3+
, high
int.Ca2+
, lysophosphatidyl choline, ext.H+,
Riluzole, lead, genistein, rosiglitazone
Growth cone morphology, brain
development, innate fear
La3+
(high concentrations, enhanced
at low), 2-APB, SKF96365, KB-
R7943, BTP2, flufenamic acid,
chlorpromazine
(Abramowitz and Birnbaumer
2009; Alexander et al. 2007; Gross
et al. 2009; He et al. 2005; Majeed
et al. 2011; Riccio et al. 2009;
Richter et al. 2014; Semtner et al.
2007; Sukumar and Beech 2010;
Wong et al. 2010; Xu et al. 2005b)
TRPC6
5 DAG, AlF4-, Gq/11-coupled receptors,
membrane stretch, GTPγS, 20-HETE, OAG
(independent of PKC) and inhibition of DAG
lipase with RHC80267, flufenamate,
hyperforin
Vasomotor and cardiac function,
airway resistance, platelet
aggregation.
2-APB, BTP2, La3+
(IC50 = 6µM),
Gd3+
, amiloride, SKF96365, ACA,
KB-R7943, ML-9 (independent of
MLCK), ext.H+,GsMTx-4
(Abramowitz and Birnbaumer
2009; Alexander et al. 2007;
Clapham 2003; Nilius et al. 2005;
Xu et al. 2005b)
TRPC7
2 DAG, exocytosis, Ca2+
store depletion, Gq/11-
coupled receptors, OAG
Respiratory rhythm activity, conducts
mono- and divalent- cations with a
preference for divalents
La3+
, SKF96365, amiloride, 2-APB (Abramowitz and Birnbaumer
2009; Alexander et al. 2007; Ben-
Mabrouk and Tryba)
TRPV1
10 CAP, resiniferatoxin, olvanil, PKC,
depolarisation, heat (≥ 43C), low pH (≤ 5.9),
AEA, eicosanoids, 12, 15-(S)-HPETE, 5-(S)-
HETE, leukotriene B4, NADA, adenosine and
2-APB
Selective for Ca2+
and Mg2+
,
inflammation, pancreatitis, sensing
hot chilli, pain, noxious temperature,
bladder distension and more.
Ruthenium red, 5′-IRT, 6-iodo-
nordihydroCAP, BCTC, CAZ, A-
425619, A-778317, AMG517,
AMG628, SB-705498, JNJ17203212,
JYL1421, SB366791, SB452533
(Alexander et al. 2004; Caterina
and Julius 2001; Nathan et al. 2002;
Nilius et al. 2005; Voets et al.
2004a; Vriens et al. 2009)
Table 1-1: Overview of TRP family subgroups

9
TRPV2
1-3 Heat (>53°C, rodent), 2-APB (rodent), DPBA,
THC, probenecid, cannabidiol, growth factors
i.e. IGF-1
Sensing thermal pain, phagocytosis,
axon outgrowth regulation
Ruthenium, SKF96365, amiloride,
TRIM, La3+
(Caterina et al. 1999; Hu et al.
2004; Link et al. ; Shibasaki et al.)
TRPV3 2.6 Heat (> 23– 39°C), 2-APB, camphor, TBMC,
carvacrol, eugenol, thymol, menthol,
incensole acetate, DPBA
mechanosensor in vascular smooth
muscle cells
Ruthenium red (<1 mM), DPTHF
(Beech et al. 2004; Hu et al. 2004;
Moqrich et al. 2005; Smith et al.
2002)
TRPV4
6
Heat (> 24°- 32°C), 4α-PDD,
bisandrographolide A, anandamide, AA, 5(6)-
EET, cell swelling,
Osmosensing, warm sensing,
nociception, pressure sensing in DRG
Ruthenium red (voltage-dependent),
La3+
,Gd3+
(Clapham 2003; Harteneck and
Schultz 2007; Kanzaki et al. 1999;
Nilius et al. 2004; Vriens et al.
2004; Watanabe et al. 2002)
TRPV5
>100 Low [Ca2+
]i, hyperpolarization
Ca2+
reabsorption in the kidney
Ruthenium red, econazole,
miconazole, Pb2+
= Cu2+
= Gd3+
>
Cd2+
> Zn2+
> La3+
> Co2+
> Fe2+
, Mg2+
(Alexander et al. 2007; den Dekker
et al. ; Nilius and Voets 2005)
TRPV6 >100 Low [Ca2+
]i, hyperpolarization, 2-APB Ca2+
reabsorption in the intestine Ruthenium, Cd2+
, Mg2+
, La3+
(Alexander et al. 2007; den Dekker
et al. ; Nilius and Voets 2005)
TRPA1 0.8–1.4 Cooling (< 17°C), isothiocyanates, THC,
allicin, menthol, thymol, cinnamaldehyde
(100µM), carvacrol, formalin, 4-HNE,
methylparaben, URB597, cyclopentone,
prostaglandins, 1,4-dihydropyridines,
isoflurane, desflurane, propofol, etomidate,
Camphor (100µM)
Mechanically gated transduction
channel required for the auditory
response in mammals. Reception of
pungent painful stimuli (mustard oil,
wasabi, horse radish, garlic and
onions)
Camphor (1mM), cinnamaldehyde
(3mM), ruthenium red, gentamicin,
Gd3+
, amiloride, menthol (mouse),
HC-030031, blockers of the
mechanosensory channels
(Alexander et al. 2007; Alpizar et
al. 2013; Corey et al. 2004;
Macpherson et al. 2005; Sukharev
and Corey 2004)
TRPP2
1-5 Mechanical stress, int.Ca2+
, constitutive
activity suppressed by co-expression of
TRPP1
Signalling complex with TRPP1, cilia
movement, development of heart,
skeletal muscle and kidney, fertility.
La3+
, Gd3+
, amiloride (Delmas 2004; Delmas et al. 2004;
Giamarchi et al. 2006; Volk et al.
2003)
TRPP3
4 Int.Ca2+
, low constitutive activity,
depolarisation, cell swelling
Hair cell, Kidney, retinal
developments
Phenamil, benzamil, EIPA,
amiloride, La3+
, Gd3+
, flufenamate
(Delmas 2005; Shimizu et al. 2009)
TRPP5 1-5 Int.Ca2+
Cell proliferation and apoptosis,
Ca2+
homeostasis, spermatogenesis
Unknown (Chen et al. 2008; Guo et al. 2000;
Xiao et al. 2010)
TRPML1
~ 1
TRPML1Va
: constitutively active, ext. high H+
(equivalent to Intralysosomal high H+), Ca
2+
Role in late endosomes pathway that
is necessary for lysosome formation
and recycling
Amiloride, low pH (LaPlante et al. 2002; Piper and
Luzio 2004; Raychowdhury et al.
2004; Xu et al. 2007a)
TRPML2
-
TRPML2Va
: constitutively active, ext. high H+
(equivalent to intralysosomal high H+),
ADPR, oxidative stress
Mediating cation (Ca2+
/Fe2+
) efflux
from endosomes and lysosomes
Cu2+
, clotrimazole, flufenamic acid,
2APB, ACA
(Jia et al. 2011; Montell 2005;
Moreau et al. 2013; Xu et al. 2007a;
Zeng et al. 2012)
TRPML3
-
TRPML3va
: constitutively active.
TRPML3WT
: activated by Na+-free ext.
solution, depolarization
Hair cell, stereocilia maturation, and
int. vesicle transport
TRPML3va
& TRPML3WT
: Gd3+
,
ext.acidification (intralysosomal
acidification),TRPML3
(Di Palma et al. 2002; Grimm et al.
2007; Montell 2005; Xu et al.
2007a)

10
TRPM1
non-
selective
cation
Translocation, constitutively active
Tumour suppressor, sensor of cellular
redox status, oxidant stress sensor in
immune and glia cells, respiratory
bursts in neutrophils
La3+
,Gd3+
(Alexander et al. 2007; Duncan et
al. 2001; Hara et al. 2002)
TRPM2 0.5–1.6 Oxidative and nitrosative stress, NAD,
radicals, oxidative, int. ADPR, cADPR, int.
Ca2+
, AA, heat ~ 35°C
Regulates endothelial barrier
function, cell proliferation
Clotrimazole, miconazole, econazole,
flufenamic acid, ACA, 2-APB,
ADPR and cADPR blocked by AMP
and 8-bromo-cADPR
(Alexander et al. 2007; Clapham
2003; Fonfria et al. 2004; Hecquet
et al. ; Perraud et al. 2005)
TRPM3
1–2 Cell swelling, Ca2+
store depletion,
pregnenolone sulphate, nifedipine,
depolarisation, D- erythrosphingosine,
dihydrosphingosine, eicosanoids
Sphingolipid signalling, renal volume
regulation (osmosensor)
La3+
,Gd3+
, 2-APB, int.Mg2+
, ext.Na+
(TRPM3α2 only)
(Alexander et al. 2007; Grimm et
al. 2003; Grimm et al. 2005;
Harteneck and Schultz 2007)
TRPM4
- Int.Ca2+
, ATP, decavanadate, depolarization,
heat, PIP2, BTP2
Negative-feedback regulation of Ca2+
fluctuation, release of IL-2 from T-
cell. Impermeable to Ca2+
ATP4, ADP, AMP, AMP-PNP,
adenosine, int.spermine, flufenamic
acid, ext. clotrimazole, 9-phenanthrol
(Alexander et al. 2007; Launay et
al. 2004; Ullrich et al. 2005)
TRPM5 - Gq/11-coupled receptors, Ins(1,4,5)P3, int.Ca2+
,
membrane depolarization, heat, PIP2
Taste receptor of the tongue;
transduction of sweet, amino acid and
bitter stimuli, impermeable to Ca2+
Int. spermine, flufenamic acid, ext.
Protons
(Alexander et al. 2007; Ullrich et al.
2005; Zhang et al. 2003b)
TRPM6
- Reduction of Mg2+
, ext. H+, 2-APB High permeability for Mg
2+, influx
pathway for divalent cations
Ruthenium red, inward current by
monovalent cations blocked by Ca2+
and Mg2+
(Alexander et al. 2007; Voets et al.
2004b)
TRPM7
3 Reduction of Mg2+
, G-proteins, PKA, int.ATP,
PIP2, ext. H+
Mg2+
and Ca2+
entry & trace metal
ion uptake. Role in neuronal cell
death
Spermine (permeant blocker),
carvacrol, La3+
, Mg2+
, 2-APB
(Aarts et al. 2003; Alexander et al.
2007; Monteilh-Zoller et al. 2003;
Nadler et al. 2001)
TRPM8
1-3 menthol, depolarisation, Ca2+
, cooling (< 22–
26°C), PIP2; WS-12, menthol, icilin
Voltage-dependent channel, pain and
cold sensor
CAZ, BCTC, and thio-BCTC, low
pH, La3+
, clotrimazole, 2-APB, ACA,
NADA, anandamide, linoleic acid,
cannabinoids
(Alexander et al. 2007; Behrendt et
al. 2004; McKemy et al. 2002;
Peier et al. 2002; Reid 2005; Voets
et al. 2004a)
int.: intracellular; ext..: extracellular; WT: wild type; AA: Arachidonic acid; ACA: N-(p-amylcinnamoyl)anthranilic acid; ADP: Adenosine diphosphate; ADPR: Adenosine 5′-diphosphoribose; AMP: Adenosine
monophosphate; ATP: Adenosine triphosphate; BCTC: N-(4-tertiarybutylphenyl)-4-(3-chloropyridin-2-yl) tetrahydropyrazine-1(2H)-carbox-amide; BDNF: Brain-derived neurotrophic factor; bFGF: Basic fibroblast
growth factor; BTP2: 4-methy-4′-[3,5-bis(trifluoromethyl)-1H-pyrazol-1-yl]-1,2,3-thiadiazole-5-carboxanilide; cADPR: cyclic ADP Ribose; CaM: calmodulin; CAZ: capsazepine; DAG: Diacylglycerol; DPBA:
Diphenylboronic anhydride; DPTHF: Diphenyltetrahydrofuran; EIPA: Ethylisopropyl amiloride; GTPγS: Guanosine gamma thiophosphate; Ins(1,4,5)P3: Inositol 1,4,5-trisphosphate; IP3: Inositol trisphosphate;
NADA: N-arachidonoyl-dopamine; NO: nitric oxide; OAG: 1-oleoyl-2-acetyl-sn-glycerol; PIP2: Phosphatidylinositol 4,5-bisphosphate; 4α-PDD: 4α-phorbol 12,13-didecanoate; PKA: Protein kinases A; PLC:
Phospholipase C; TRIM: 1-(2-(trifluoromethyl)phenyl) imidazole; TBMC: 6-tert-butyl-m-cresol; THC: Δ9-tetrahydrocannabinol; 2-APB: 2-Aminoethoxydiphenyl borate; 4-HNE: 4-Hydroxynonenal; 5(6)-EET: 5’,6’-
epoxyeicosatrienoic acid; 5-(S)-HETE: 5-(S)-hydroxyeicosatetraenoic acid; 12, 15-(S)-HPETE: 12- and 15-(S)-hydroperoxyeicosatetraenoic acids; 20-HETE: 20-hydroxyeicosatetraenoic acid.
11
which is distinct from taste and smell (Bandell et al. 2007). TRP channels are opened
or closed by conformational changes in the channel protein (Bandell et al. 2007;
Dhaka et al. 2006). The ion selectivity differs markedly among the same family of
TRP channels, as most of the channels are non-selective cation channels, which is
particularly true for TRPV1 although with a preference for Ca2+
(Julius and Basbaum
2001).
1.3 Transient Receptor Potential Vanilloid 1 (TRPV1)
Interest in TRPV1 began when pharmacological aspects of CAP were first
recognised. CAP, which is derived from Capsicum spp., is responsible for the
sensation of ‘hot’ and ‘burning’ when exposed to chilli peppers. It acts specifically
on nociceptive afferent neurons (Jancso´ 1960). Researchers found that the
selectivity of CAP’s action on afferent neurons could only be explained by an action
on specific CAP receptors which led to the revelation of TRPV1 as a CAP-specific
receptor (Caterina et al. 1997; Nagy et al. 2004; Szolcsanyi et al. 1975).
1.3.1 Structure
TRPV1 is composed of six transmembrane domains with a pore-forming
hydrophobic span between the fifth and sixth transmembrane domains (Caterina et al.
1997). Four N- terminal extremities interact with the cytosol (Clapham 2003). Like
many other TRP channels, TRPV1 has a long N- terminus containing three ankyrin-
repeat domains and a C- terminus containing a TRP domain close to the sixth
transmembrane domain (Tominaga and Tominaga 2005). The binding site present on
the ankrin repeat domain of TRPV1 has been reported to bind triphosphate
nucleotides such as ATP and calmodulin (CaM) in the same site (Lishko et al. 2007;
Rosenbaum et al. 2004). By binding to the pointed binding site, these molecules
12
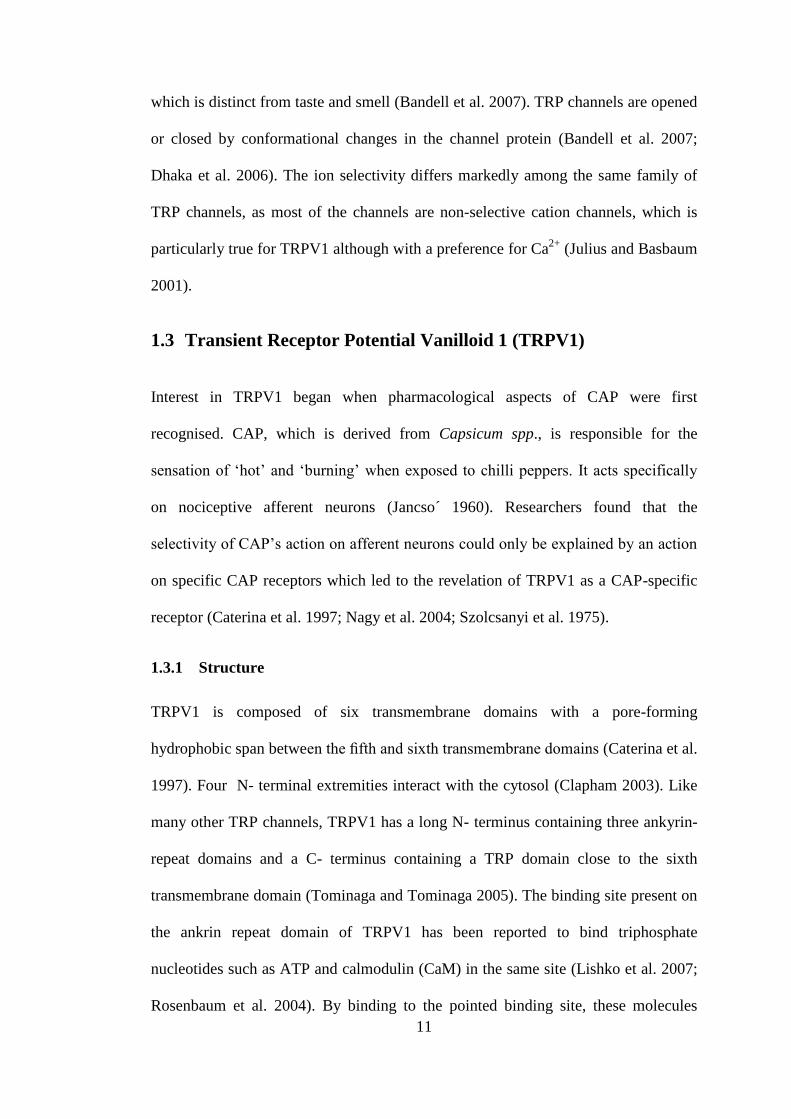
generate the different sensitivity and regulate the function of TRPV1 (Phelps et al.
2010). The intracellular domain of TRPV1 contains multiple binding sites for
phosphatydyl-inositol-4,5-bisphosphate (PIP2) on the N- and C-termini (Grycova et
al. 2012), and two other sites for a protein-kinase C and Ca2+
/CaM-dependent protein
kinase II (CAM-kinase II) which are important proteins for channel regulation ( see
Figure 1-1) (Ferrer-Montiel et al. 2004; Jeske et al. 2009).
1.3.2 Activation of TRPV1
The initial detection of noxious signals occurs predominantly at the peripheral
terminals of primary afferent neurons, called polymodal nociceptive neurons (Fields,
1987). TRPV1 has been shown to be the polymodal nociceptive receptor, that is also
allosterically modulated by many proalgesic agents (Holzer 2008).
The TRPV1 channel is activated by vanilloids, which are present in a variety of
plants that are normally ingested through the diet. As previously mentioned, they are
C-terminus N-terminus
Figure 1-1: Topological model of TRPV1. TRPV1 subunit exhibiting six
putative transmembrane domains, an intracellular N-and C-terminal domains,
amino acid residues specific for CAP and proton activation, as well as
residues important for phosphorylation by PKA, PKC and CaMKII. Kinases
are highlighted at both intra-cytoplasmic regions. The TRP-like, CAM- and
PIP2- binding domains are also depicted. Reproduced from Planells-Cases et
al (2005).

13
found in spicy foods, such as hot chilli pepper, and belong to the family of
Solanaceae, genus Capsicum, in which the molecules responsible for the ‘burning’
taste are CAP and other capsaicinoids (Monsereenusorn et al. 1982). In addition to
capsaicinoids, TRPV1 channels are activated by a variety of other plant-derived
vanilloids including, camphor and resiniferatoxin (RTX), and putative endogenous
vanilloids such as the endocannabinoid, anandamide, some lipoxygenase products of
arachidonic acid (AA) such as 12-(S)- and 15-(S)-hydroperoxyeicosatetraenoic acid
(12S- and 15S-HPETE), and N-arachidonoyldopamine (NADA) and its congener, N-
oleoyldopamine (Chu et al. 2003; Van Der Stelt and Di Marzo 2004; Xu et al.
2005a). Vanilloids bind to intracellular sites on the TRPV1 channel, and the amino
acids critical for CAP/RTX binding include Arg-91, Tyr-511, Ser-512, Ile 514, Val-
518 and residue 547 (Met in rat, Leu in human), which are part of transmembrane
segments 3 and 4 (Jordt and Julius 2002). CAP is a key activator of TRPV1 and acts
by lowering the heat threshold required to open the TRPV1 channel (Szallasi and
Blumberg 1999). Vanilloid-like agents may affect cellular function through two
mechanisms; 1) the interaction with the TRPV1 receptor, or 2) direct interaction with
the cell due to their ability to cross the plasma membrane bilayer because of their
lipophilicity (Ziglioli et al. 2009).
Other activators of the TRPV1 channel include many noxious stimuli including heat
(≥ 43°C) (Loyd et al. 2012), acidosis (pH≤ 5.9) (Kaszas et al. 2012), mechanosensing
(Inoue et al. 2009) and other chemaesthetic (irritant agents) including vanillotoxins
1-3 (tarantula), ginger and ethanol (Bandell et al. 2007; Dhaka et al. 2006; Loyd et al.
2012). The thermal sensitivity of TRPV1 is enhanced by some endogenous
modulators such as bradykinin, ATP, nerve growth factor (NGF) (Chuang et al.

14
2001) and PAR-2 agonists (Amadesi et al. 2004). NGF appears to act via
phospholipase C (PLC) to hydrolyse PIP2, leading to the inhibition of the channel
(Chuang et al. 2001). Sustained exposure to agonists increases the Ca2+
permeability
of TRPV1 and causes pore-dilation (10.1 A˚ initial to 12.3 A˚ after 3 min of
exposure) (Chung et al. 2008). Neurons that express TRPV1 are eventually
overloaded by Ca2+
, which in conjunction with other factors, can result in
mitochondrial swelling, long-lasting defunctionalisation or even degeneration of the
neurons (Szoke et al. 2002; Szolcsanyi et al. 1975). In addition, TRPV1 allows
protons to enter the cell in an acidic environment, which results in intracellular
acidification (Hellwig et al. 2004). Researchers have reported that TRPV1(-/-)
null
mice were defective in nociceptive, inflammatory and hypothermic responses to
vanilloid compounds, supporting the notion that TRPV1 contributes to acute thermal
nociception and hyperalgesia after tissue injury (Caterina et al. 2000).
1.3.3 Expression of TRPV1
Many studies have confirmed that the TRPV1 channel is expressed primarily on
sensory neurons originating from the CNS, including dorsal root and trigeminal
ganglia (Himi et al. 2012; Julius and Basbaum 2001; Schicho et al. 2004). Following
synthesis in the neuronal soma, TRPV1 is transported to both the central and
peripheral terminals of the primary afferent neurons (Guo et al. 1999). The fibres of
these neurons innervate all tissues of the body including skin, muscle, bone, internal
organs and vascular system. However, there are regional differences in the relative
proportion of sensory neurons that stain positive for TRPV1, e.g., TRPV1-
immunoreactive fibres are considerably more prevalent in visceral than in somatic
afferent neurones (Brierley et al. 2005; Robinson et al. 2004).

15
Once believed to be exclusively neuronal, many studies subsequently reported
TRPV1 expression in non-neuronal cells in all organs (Cortright and Szallasi 2004;
Fernandes et al. 2012), such as urothelium and urinary tract (Avelino and Cruz 2006;
Birder et al. 2001); human smooth muscle, keratinocytes (Jaggar et al. 2001);
myenteric ganglia, muscle layer, mucosa and epithelial cells of the gastrointestinal
tract (Geppetti and Trevisani 2004); mouse epidermis and keratinocytes (Bode et al.
2009); airway epithelial cells (Reilly et al. 2003), human umbilical vein endothelial
cells (Himi et al. 2012), leukocytes (Saunders et al. 2009; Saunders et al. 2007) and
microglia (Kim et al. 2006b). In addition, elevated TRPV1 expression was identified
in some malignancies including, prostatic cancer cell lines, e.g., PC3 and LNCaP
(Sánchez et al. 2006; Ziglioli et al. 2009), pancreas (Hartel et al. 2006; Mergler et al.
2012), colon (Domotor et al. 2005) and urinary bladder (Lazzeri et al. 2005). The
wide distribution of TRPV1 emphasises its role as a universal sensor of many
chemical stimuli.
1.4 TRPV1 and Pain
Pain is an unpleasant physical or emotional sensation associated with actual, or
potential, tissue damage or trauma. It can be classified depending on its origin as: 1)
nociceptive pain; the pain caused by stimulating the nociceptive receptors and
transmitted over intact neural pathways, 2) neuropathic pain; the pain caused by
damage to the nerve fibres leading to dysfunction of the sensory nerves to transmit
signals correctly to the brain. Pain can be either acute or chronic (Nilius et al. 2007).

16
1.4.1 TRPV1 and nociceptive pain
The body’s reaction to nociceptive stimuli, including thermal, mechanical and
chemical, is a natural process that minimises the physical harm to the body, and is
not considered as a diseased state (Nilius et al. 2007).
1.4.2 Sensitisation and desensitisation of TRPV1 receptors
There is compelling evidence that nociceptor sensitisation by inflammatory agents is
primarily due to TRPV1 channel activity. Sensitisation is an increased
responsiveness of neurons to their normal input or recruitment of a response to
normally sub-threshold inputs (Fisher 2009). TRPV1 sensitisation by proalgesic
agents may be due to either direct activation of the channel or to its potentiation.
Direct activation of TRPV1 by endogenous vanilloids and acidosis released by
injured tissue leads to increased TRPV1-mediated intracellular Ca2+
([Ca2+
]i) in both
heterologous expression systems and in primary sensory neurons (Caterina and Julius
2001; Chu et al. 2003; Huang et al. 2002; Planells-Cases et al. 2005; Tominaga et al.
1998). The efficacy and potency of each single mediator is low. However, in
inflammatory conditions, several modulators are simultaneously released and
therefore act in collaboration. Interestingly, most TRPV1 agonists act by reducing
the threshold for heat activation from 42°C to ~35°C, leading to TRPV1 activation at
body temperature, and thus hyperalgesia (Caterina and Julius 2001; Julius and
Basbaum 2001; Nagy et al. 2004). TRPV1 increases [Ca2+
]i that provokes the release
of inflammatory mediators at peripheral terminals, further increasing the irritability
of nociceptors. This feedback circuit enhances the hyperirritability of the injured
tissue (Messeguer et al. 2006).

17
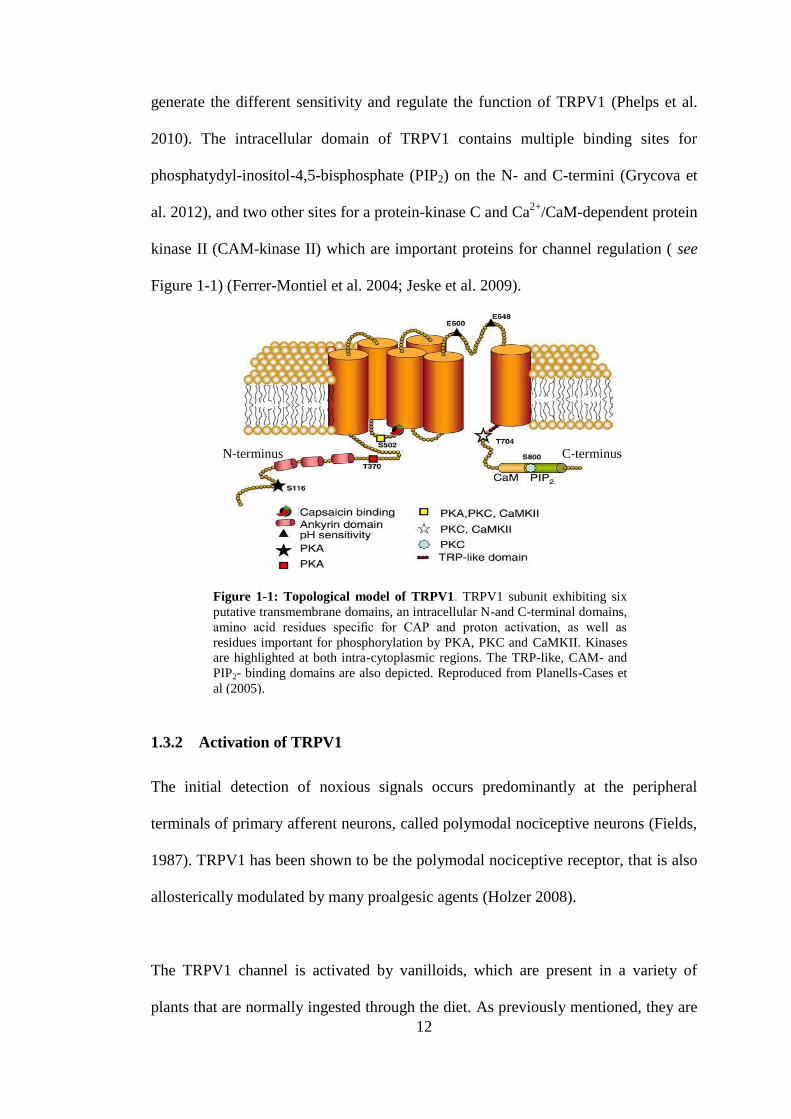
TRPV1 potentiation by proalgesic substances also involves the activation of
intracellular signalling pathways (Figure 1-2) (Planells-Cases et al. 2005). Two
major mechanisms have been found to be responsible for TRPV1 potentiation that
leads to nociceptor sensitisation, (1) chemical modification of the intracellular
domains of the channel, which is induced by protein kinases or phosphatases, and/or
by hydrolysis of phosphoinositides produces a higher TRPV1 activity, and (2) an
increase of TRPV1 receptor expression in peripheral terminals which enhances
nociceptor responses. Both mechanisms are believed to occur in parallel (Figure 1-2)
(Planells-Cases et al. 2005).
Sensitisation of the ion channel by phosphorylation of TRPV1 by PKA, PKC and
other kinases is of particular importance (Premkumar and Ahern 2000; Tominaga et
al. 2001). This is triggered by activation of receptors that respond to products of
inflammation such as prostaglandins, leukotrienes, bradykinin, ATP, serotonin, and
calcitonin-gene-related peptide (CGRP) (Nilius 2007) (Figure 1-2). Prostaglandins
and 8-bromo-cyclic AMP trigger TRPV1 sensitisation through a PKA-mediated
pathway (Bhave et al. 2002), whereas bradykinin and ATP sensitise TRPV1 by a
PKC-mediated pathway (Premkumar and Ahern 2000; Tominaga et al. 2001). In
addition, stimuli that activate PLC, such as bradykinin, NGF and anandamide, can
also sensitise TRPV1 through hydrolysis of PIP2, which normally inhibits the
channel (Chuang et al. 2001; Prescott and Julius 2003). It is well established that
activation of PLC sensitises TRPV1 channels to the three most studied activators:
CAP, H+ and heat (Rohacs et al. 2008). In contrast, several laboratories have shown
that NGF increases the number of TRPV1 channels in the plasma membrane of DRG
neurons and may contribute to pain associated with tissue repair in a
18
phosphatidylinositol 3-kinase (PI3K) dependent pathway (Nilius 2007; Stein et al.
2006; Zhang et al. 2005). Furthermore, the release of neuropeptides such as
substance P and CGRP from central and peripheral neurons also have a role in
TRPV1 activation (Planells-Cases et al. 2005). Another sensitisation mechanism is
TRPV1 pore dilation following prolonged exposure to agonists (Chung et al. 2008).
However, repeated or prolonged application of CAP evokes a transient current
leading to insensitivity of TRPV1 to subsequent noxious stimuli, the phenomenon of
desensitisation (Rohacs et al. 2008). TRPV1 desensitisation protects cells from
potential excitotoxicity that arises from excessive activation of the receptor that may
lead to Ca2+
overload (Bhave et al. 2002). Although phosphorylation causes
sensitisation, dephosphorylation promotes desensitisation of TRPV1, which is a
major mechanism of inhibitory regulation by protein phosphatases (Mohapatra and
Nau 2005).
Figure 1-2: TRPV1 signal transduction. A) TRPV1 is activated by noxious
heat (≥ 43 °C), low pH (≤ 5.9), eicosanoids, anandamide, and CAP. Ligands of
guanine nucleotide (G) binding GPCR that activate PLC leading to hydrolysis of
PIP2 disinhibit the TRPV1 channels. (B) TRPV1 sensitisation resulting in
neuropathic pain depends on channel phosphorylation by PKC or PKA and is
triggered by products of inflammation, including prostaglandin E2 (PgE2),
bradykinin, ATP, and serotonin (5-HT). Adapted from Benarroch (2008).

19
Desensitisation of TRPV1 to CAP is a Ca2+
-dependent process (Koplas et al. 1997;
Mohapatra and Nau 2003). The Ca2+
sensor CaM activates the protein phosphatase
calcineurin leading to TRPV1 desensitisation (Docherty et al. 1996). Calcineurin
greatly reduces CAP-induced desensitisation of sensory neurons (Jung et al. 2004). It
has been suggested that a rise in cytosolic Ca2+
levels caused by TRPV1 activation
results in the activation of Ca2+
/CaM-dependent protein phosphatases that mediate
channel desensitisation (Docherty et al. 1996). Furthermore, desensitisation of
TRPV1 to CAP involves a number of intracellular components including PKA, ATP
and CaM (Bhave et al. 2002; Lishko et al. 2007; Mohapatra and Nau 2003). It
appears that there is a dynamic balance between phosphorylation/dephosphorylation
of TRPV1 by CaMKII and calcineurin, respectively. This balance controls the
activation/desensitisation state of the channel by regulating ligand binding (Figure
1-3, A), as CaMKII recovers TRPV1 from the desensitised state (Docherty et al.
1996; Jung et al. 2004; Mohapatra and Nau 2005; Suh and Oh 2005). TRPV1 has
five phosphorylation sites for CaMKII, in which Ser 502 and Thr 704 are targeted for
phosphorylation (Jung et al. 2004).
Aside from calcineurin desensitisation of TRPV1, other mechanisms have been
proposed. Some studies suggested that the Ca2+
passing through TRPV1 activates
PLC and subsequently leads to PIP2 depletion resulting in desensitisation (Liu et al.
2005; Rohacs et al. 2008; Stein et al. 2006) (Figure 1-3, B). Therefore, PIP2 have a
dual function in sensitisation and desensitisation of TRPV1 (Lukacs et al. 2007).
Moreover, some researchers found that stimulation of PKA eliminates the
desensitisation of TRPV1 to repeated application of CAP. Whilst TRPV1 is highly

20
phosphorylated in the resting state, PKA can phosphorylate TRPV1 more obviously
in the desensitised state at Ser116 amino acid (Bhave et al. 2002).
1.5 TRPV1 and Disease
TRPV1 appears to be involved in either the pathogenesis or progress of many
diseases and conditions. Here, the role of TRPV1 in different diseases is reviewed.
1.5.1 Neuropathic Pain Syndromes
Neuropathic pain syndromes are a group of heterogeneous conditions caused by a
lesion or disease that affects the peripheral or CNS and are often clinically
characterised by spontaneous burning pain. In some patients, the nerve lesion
enhances molecular dysfunction that evokes pathological activity of nociceptive
neurons and thus, hypersensitivity of TRPV1 that causes pain (Baron 2006). The
hyperactivity in nociceptors induces secondary changes in processing neurons in the
CAP
Phosphate molecule
A
B
Desensitised Open Closed
Desensitised PLC Activation
TRPV1
Figure 1-3: TRPV1 status, A) Binding of the CAP leads to TRPV1
activation, but prolonged exposure causes desensitisation, adopted from
Suh, YG &Oh U (2005). B) Model of desensitisation of TRPV1. Calcium
entry through TRPV1 activates a calcium sensitive PLC isoform leading
to the depletion of PIP2 and inhibits TRPV1 activity. Adapted from
Rohacs T (2008).

21
spinal cord and brain, whereby input from normal mechanical stimuli is sensed as
pain.
1.5.2 Neurogenic Inflammation
Neurogenic inflammation is a process where inflammation is provoked by the
nervous system, leading to the release of inflammatory mediators (Meggs 1993). The
most common features of neurogenic inflammation are redness and warmth
(secondary to vasodilation), swelling (secondary to plasma extravasation), and
hypersensitivity (Richardson and Vasko 2002). It is triggered by overstimulation of
peripheral nociceptor terminals as a consequence of injury, or by non-neurogenic
inflammation (Proudfoot et al. 2006). Many studies have reported the role of TRPV1
in the neurogenic inflammatory process. Tissue damage induces inflammation, which
is characterised by hypersensitivity to noxious stimuli or even allodynia (pain due to
a stimulus which does not normally provoke pain) (Julius and Basbaum 2001). This
provokes the release of neurotransmitters such as substance P and CGRP, and in the
case of tissue injury, ATP and H+ from damaged cells. This in turn leads to
vasodilation, increased capillary permeability at the site of injury and ultimately
TRPV1 sensitisation (Nilius 2007).
1.5.3 Systemic Diseases
TRPV1 receptor was reported to be involved in a number of systemic diseases
(Nilius et al. 2007). Table 1-2 summarises the role of TRPV1 in some systemic
diseases. The role of TRPV1 as a potential therapeutic target has also been described.
Desensitisation of the receptor by CAP and RTX has been reported to work as a pain
relief (Kissin 2008; Knotkova et al. 2008). TRPV1 has a protective role as its role in

22
TRPV1 in Systemic Diseases TRPV1 role/effect References
Urinary tract:
Bladder cystitis Hyperalgesia and hyperreflexia, increase anandamides
concentration.
(Avelino and Cruz 2006; Dinis et al. 2004;
Nilius et al. 2007)
Painful bladder syndromes. Inactivation of bladder nociceptors i.e. treatment approach (Habler et al. 1990; Sengupta and Gebhart
1994)
Urinary incontinence due to bladder overactivity caused by
spinal cord lesions
Vanilloids suppresses involuntary bladder contractions leading
i.e. treatment approach
(de Groat 1997)
End-stage kidney disease Activation of the channel leads to PBMC death (Saunders et al. 2009)
Gastrointestinal tract:
Gastrointestinal inflammation Aids in the mechanism of intestinal inflammation (Massa et al. 2005; Sanger 2007)
Erosive esophagitis Increase TRPV1 expression (Matthews et al. 2004)
Functional dyspepsia CAP therapy (Allescher 2006; Rosch et al. 2006)
Inflammatory bowel disease
Regulates neurogenic inflammation and protect from colon
cancer.
(Vinuesa et al. 2012)
Cardiovascular system:
Salt-sensitive hypertension Prevention action through vasodilatory and natriuretic–diuretic
actions
(Inoue et al. 2006; Watanabe et al. 2009) Depressor effect on cardiac tissue
Myocardial ischemia
Changes in heart rate and contractility
Protect the heart through the release of substance P, CGRP and
other neurokines
Respiratory tract:
Cough and airway obstruction.
Acid- induced cough in guinea pigs.
Causes cough through endogenous inflammatory mediators such
as PgE2, bradykinin, and histamine
(Fox et al. 1996; Jia et al. 2002)
Chronic obstructive pulmonary disease, interstitial lung
disease, gastroesophegal reflux disease, upper airway cough
syndrome, bronchiectasis and airway infections.
CAP cough hypersensitivity (Higenbottam 2002; Lalloo et al. 1998; Niimi
et al. 2004; O'Connell et al. 1996; Plevkova et
al. 2006)
Guinea pig and rat ozone-induced airway inflammation and
hyperreactivity Reduction by CAP (Kaneko et al. 1994; Koto et al. 1995)
Airway response to formaldehyde, cigarette smoke in rats CAP decreased airway response to such substances. (Lundberg and Saria 1983; Lundblad and
Lundberg 1984; Morris et al. 1999)
Guinea pigs sulphur dioxide-provoked bronchoconstriction Reduction by CAP (Bannenberg et al. 1994; Lalloo et al. 1995)
Table 1-2: Summary of studies investigating the role of TRPV1 in systemic diseases and conditions
CAP: capsaicin; TRPV1: transient receptor potential vanilloid-1; CGRP: Calcitonin gene-related peptide; PgE2: Prostaglandin E2; PBMC: peripheral blood mononuclear cell.
23
protecting the heart in myocardial ischemia (Inoue et al. 2006), or is directly
involved in the inflammatory process (Table 1-2).
1.5.4 Vanilloid-induced Apoptosis and Cancer
Vanilloids, including CAP and their role in tumoral growth and cell transformation
have been of great interest over the past few years. It has been shown that vanilloids
play a role in cell death (apoptosis) as well as the inhibition of tumour proliferation
through TRPV1-dependent and -independent mechanisms (Ziglioli et al. 2009).
Several vanilloids have been reported to induce cell death in a variety of cell types
(Table 1-3). Apoptosis, defined as a programmed cell death, is an important function
in the cell as it controls cell proliferation (Khan et al. 2007). However, the apoptosis
pathway is often dysfunctional in tumour cells (Thompson 1995). The mechanisms
of apoptosis are potentially active in every cell, either tumoral or normal, though
some studies have demonstrated the ability of vanilloids to target apoptosis in tumour
cells rather than normal cells (Ito et al. 2004; Macho et al. 1999).
There is general agreement in the literature that prolonged contact time between
normal cells such as TRPV1-transfected HEK293 and CAP, does not induce pre-
apoptotic events such as vacuolisation or DNA damage (Caterina et al. 1997),
whereas a shorter periods of contact between tumoral cells and CAP results in pre-
apoptotic events. Following exposure of normal thymocytes (Amantini et al. 2004)
and neoplastic cells to low concentrations of CAP, TRPV1-dependent apoptosis
occurs. In contrast however, exposure to high concentrations induces cell-death
through TRPV1-independent pathways (Amantini et al. 2004; Macho et al. 1999).
Tumour cells are known to represent non-controlled cellular activity. In these cells,
the electron transport chain (ETC) is constitutionally activated. The interaction of

24
Cell type Vanilloid Mechanism of apoptosis and/or associated observation TRPV1-
mediated
References
Glioma cell lines: Ge227,
U87,G2258, U251
AEA Unknown Yes (Contassot et al. 2004b)
A172 CAP Down-regulation of Bcl-2 and activation of caspase-3, reduce ROS level,
upregulation of DR5
No (Gil and Kang 2008; Kim et al.
2010; Lee et al. 2000)
Rat C6 glioma cells AEA Influx of Ca2+
, activation of the ceramide pathway, TRPV1 involve with CB1&2 Partially (Jacobsson et al. 2001)
CAP Peroxynitrite – mediated apoptosis No (Qiao et al. 2005)
U373 (III) CAP Ca2+
influx and p38 MAPK activation Yes (Amantini et al. 2007)
Hepatic cells: Chang liver
cell (non-tumour)
AEA Lipid rafts interaction: p38/JNK , ceramide pathways, AP-1, caspase3 activity No (Giuliano et al. 2006)
HepG2 ( hepatoma) CAP Mediated by NADPH oxidase-mediated increase in ROS or by activation of the
PLC-dependent [Ca2+
]i release pathway
No (Huang et al. 2009; Kim et al.
2005; Lee et al. 2004; Reilly et
al. 2003)
Bronchiolar cells: BEAS-
2B, BEAS-2B (TRPV1+/+
),
NHBE, A549
CAP Unknown Yes (Reilly et al. 2005; Reilly et al.
2003; Thomas et al. 2007)
Nonivamide
RTX, AEA
Activation of ER-bound TRPV1 stimulates GADD153 expression via EIF2αK3/
EIF2α pathway
Neuroblastoma: CHP100
SHSY-5Y
AEA
CAP
Increase [Ca2+
]i , mitochondrial uncoupling, and cytochrome c release
Inhibited protein synthesis IC50=60mM, induced DNA strand breaks
Yes
Unknown
(Maccarrone et al. 2000)
(Richeux et al. 1999)
Squamous cell carcinoma:
COLO16, SRB-12
CAP, RTX Rapid induction of hydroperoxide generation, inhibition of mitochondrial
respiration
Unknown (Hail Jr and Lotan 2002)
Embryonic kidney cells:
TRPV1-HEK293
CAP
Increase in [Ca2+
]i , apoptosis mechanism unknown
Unknown
(Grant et al. 2002)
Cervical cancer: CC299,
caski, HeLa cells
KB cells
AEA
CAP
Cleavage of caspace-7
Disruption of mitochondrial potential and activation of caspase 9, 3 and poly-
(ADP-ribose) polymerase
Yes
Unknown
(Contassot et al. 2004a)
(Lin et al. 2013)
Spermatogenic stem: Gc-
5spg, Rat Gc-6spg
CAP Caspace-3 activation, DNA fragmentation Unknown (Mizrak et al. 2008)
Urothelial cell cancer: RT4 CAP Fas/CD95 clustering, caspase-3, -8 activation, BID cleavage Yes (Amantini et al. 2009)
Pancreatic cancer: BxPC-
3, AsPC-1
CAP Mediates ROS production which leads to the inhibition of mitochondrial complex-I
and III activity
Unknown (Pramanik KC 2011; Zhang et al.
2008)
Melanoma: A375 ( mouse),
A375-S2
B16-F10 (murine)
CAP Inhibition of NADH oxidase, high nitric oxide, down- regulate the ICDA
Down-regulation the Bcl-2 and caspase-3 activation
Unknown
(Gong et al. 2005; Jun et al.
2007; Kim 2012; Morre et al.
1996)
Table 1-3: Some non-haematological cell lines that undergo vanilloid-induced cell death
AEA: N-arachidonoylethanolamine (anandamide); AP-1: activator protein-1; CAP: capsaicin; Bcl-2: B-cell lymphoma 2; CB1&2: cannabinoid receptor 1&2; eIF2-α: eukaryotic initiation factor 2-α; eIF2αK3:
eukaryotic translation initiation factor-2α kinase-3; ER: endoplasmic reticulum; MAPK: Mitogen-activated protein kinases; NADH: Nicotinamide adenine dinucleotide; PLC: Phospholipase C; ROS: Reactive
oxygen species; RTX: resiniferatoxin; TRPV1+/+: TRPV1- overexpressed; RT4: Human well-differentiated low-grade papillary.

25
tumoral cells with CAP, which antagonises coenzyme Q, inhibits the run of the ETC
from complex I to complex II and produces more reactive oxygen species (ROS) in
tumour cells than in normal cells (Ziglioli et al. 2009).
1.6 TRPV1 Expression and Function in Immune System Cells
Few studies have investigated TRPV1 expression in immune cells. TRPV1 mRNA
has been detected in the peripheral blood mononuclear cells (PBMCs) of rats
(Schumacher et al. 2000), and humans using RT-PCR (Saunders et al. 2007). In the
next few pages, TRPV1 expression and role in the leukocytes have been extensively
reviewed.
1.6.1 Lymphocytes
TRP channels have been shown to play an important role in Ca2+
increase in
lymphocytes (Pedersen et al. 2005). A variety of TRP channels are known to be
expressed and functional in lymphocytes such as TRPM4 and TRPC7 (Launay et al.
2004; Lievremont et al. 2005; Mori et al. 2002). TRPV1 mRNA has been found to be
expressed in murine lymph nodes and DRG, but weakly in the spleen, using RT-PCR
(Inada et al. 2006). An increase in [Ca2+
]i is essential for lymphocyte activation,
proliferation and differentiation (Gallo et al. 2006). In B- and T-lymphocytes, the
reaction between antigen and receptor results in a dual phase Ca2+
response, a
transient [Ca2+
]i increase due to Ca2+
release from endoplasmic reticulum (ER) stores,
and a subsequent prolonged [Ca2+
]i increment through Ca2+
influx from the
extracellular environment across the plasma membrane. Both phases lead to
increased [Ca2+
]i and subsequently activation of many transcription factors such as
nuclear factor of activated T-cells (NFAT) and nuclear factor kappa-light-chain-
enhancer of activated B cells (NF-κB). These in turn lead to cell proliferation and the

26
production of various cytokines (Inada et al. 2006). In the transient [Ca2+
]i increase
phase, the IP3-receptor is activated by IP3 cleaved from PIP2, causing the release of
Ca2+
from the ER into the cytoplasm. In the subsequent phase, different ion channels
induce Ca2+
influx across the plasma membrane and maintain high [Ca2+
]i levels
(Inada et al. 2006).
NF-κB is a protein complex that controls the transcription of DNA. It involves
cellular response to stimuli such as stress, cytokines, free radicals, bacterial or viral
antigens, and inflammation (Gilmore 2006). In inactive lymphocytes, NF-κB dimers
are isolated in the cytoplasm in an inactive form by association with a suppressor
1κB subunit, mainly 1κ-Bα. Upon activation, multiple kinases lead to
phosphorylation of 1κ-Bα and proteosome-mediated degradation. Thus, active NF-
κB complex is released and translocated to the nucleus. In the nucleus, NF-κB
activates many genes that participate in inflammation, immune responses and cellular
proliferation regulation (Baldwin 1996). It also causes blockade of the nuclear
translocation of p65, leading to the inhibition of apoptosis (Han et al. 2002; Singh et
al. 1996). CAP has been reported to inhibit the release of the inflammatory cytokines
(Han et al. 2002; Sancho et al. 2002), and this effect is TRPV1-mediated (Chen et al.
2003). Two human transcription factors, NF-κB and activator protein 1 (AP-1),
which have been implied in many inflammatory diseases and apoptosis were
inhibited by CAP and RTX (Han et al. 2002; Portis et al. 2001; Sancho et al. 2002;
Singh et al. 1996).
Furthermore, substance P, an indirect TRPV1 activator which is produced by TRPV1
stimulation, has been demonstrated to involve in regulating the functions of

27
lymphocytes. Its gene expression and its receptor have been detected on human
lymphocytes (Lai et al. 1998). CAP has been shown to have immunomodulatory
effects through its ability to modulate lymphocyte proliferation and immunoglobulin
A, E and G production (Nilsson et al. 1991; Takano et al. 2007). In addition, CAP
inhibits T-helper cell cytokine production in cultured murine Peyer’s patch (PP)
cells, in vitro, whereas oral injection of capsicum extract and CAP enhances the
production of T-helper 1 cytokines such as IL-2 and interferon-gamma in response to
the mitogen, concanavalin A (Takano et al. 2007). Capsicum extracts and CAP had
an opposite effect on immune responses in vitro and ex vivo, indicating the presence
of an indirect effect in vivo. Furthermore, direct treatment of PP cells with 3 and 30
μM of CAP reduced cell viability (Takano et al. 2007). TRPV1 has been detected on
T-lymphocytes in PP and it mediates CAP-induced T-cell reduction which was partly
inhibited with capsazepine. A study found that CAP, if administered subcutaneously
to neonatal rats, it would cause a marked reduction in thymus weight and a lack of
thymocyte differentiation by triggering apoptosis (Santoni et al. 2000). This indicates
a negative effect of CAP on the thymus and lymphocytes which contributes to
apoptosis in these cells.
1.6.2 Macrophages
There have been few studies investigated the CAP effects on macrophages. The ROS
species generated by activated macrophages play a crucial role in the initiation of
inflammation and have harmful effects on neuroinflammatory diseases. Treating
macrophages with 10µM CAP suppresses superoxide anion, hydrogen peroxide and
nitrite radical production completely in vitro (Joe and Lokesh 1994). Furthermore,
CAP inhibited store-operated Ca2+
entry in rat peritoneal macrophages (Joe and
Lokesh 1994). In the CNS, ROS production was substantially inhibited upon TRPV1

28
suppression in microglia, the tissue macrophages function mainly in the CNS. In
addition, membrane depolarisation, the main characteristic of NADPH oxidase
activity in phagocytes, was reported to promote TRPV1 activity in microglia
(Schilling and Eder 2009a).
1.6.2.1 Dendritic cells
Dendritic cells (DCs) are a set of leukocytes widely distributed in all tissues,
especially in those that interface with the external environment. They are potent
antigen presenting cells, that have the ability to stimulate T-cells and differentiate B-
cells (Satthaporn and Eremin 2001).
The myeloid and lymphoid-derived subsets of DCs perform specific stimulatory
functions. They are produced in the bone marrow from haemopoietic stem cells and
circulate in the peripheral blood as immature precursors prior to migrating into
peripheral tissues. DCs differentiate within different tissues and become able to
capture and process antigens and present them to other cells of the immune system
(Satthaporn and Eremin 2001). Moreover, DCs can secrete cytokines, migrate to
lymph nodes after activation and activate lymphocytes (Shortman and Liu 2002).
The expression of TRPV1 in DCs is controversial, as TRPV1 protein has been
detected in human (Toth et al. 2009) and murine DCs (Basu and Srivastava 2005).
Basu and Srivastava (2005) detected TRPV1 in murine DCs using Western blot and
RT-PCR, and found that TRPV1 activation could lead to the activation and
maturation of the DCs. However, O’Connell and co-workers (2005) failed to detect
TRPV1 mRNA in murine DCs and criticised the lack of reported controls and
potential genomic contamination in Basu and Srivastava’s studies. Toth et al (2009)

29
have shown that human peripheral blood monocytes, immature and mature DCs
express functional TRPV1 using flow cytometry, Ca2+
-imaging and quantitative real-
time PCR (Q-PCR). In addition, TRPV1 expression dramatically increased during
cytokine-induced in vitro differentiation of monocytes to immature DCs. CAP has
been reported to suppress phagocytosis by a TRPV1-mediated pathway, and did not
induce apoptosis in immature DCs. In contrast to mouse DCs, CAP did not also
promote DC maturation in the absence of cytokines, in humans (Toth et al. 2009).
1.6.3 Neutrophils
Neutrophils play a central role in the inflammatory response and comprise an
essential part of the innate immune system (Wang et al. 2005). An increase in
cytosolic [Ca2+
]i is attributed to the neutrophils in response to chemoattractants
(Krause et al. 1990), and induces synthesis and release of prostaglandins (Krump et
al. 1995). CAP affects neutrophil function and increases [Ca2+
]i in rat neutrophils by
inducing extracellular Ca2+
influx and Ca2+
release from the internal Ca2+
pool (Wang
et al. 2005). TRPV1 mRNA has been detected in human and rat neutrophils and in
HL-60 (neutrophilic promyelocytic leukaemia) cell line using RT-PCR, however the
role of TRPV1 in these cells remains poorly understood (Heiner et al. 2003; Wang et
al. 2005).
1.7 The TRPV1: Role in Haematological Malignancies
A limited number of studies have investigated TRPV1 expression and function in
haematological malignancies. Furthermore, TRPV1 expression by malignant
haematological cell lines has not been extensively studied (see summary Table 1-4).

30
Haematological cancer cell line TRPV1
expression
Vanilloid
tested
Vanilloid effect TRPV1-
mediated? References
Acute myeloid leukaemia:
Kasumi-1
Unknown
CAP
Apoptosis
Unknown
(Ito et al. 2004)
THP-1 Expressed CAP Stimulation at low, lethal at high concentrations Yes (Kunde et al. 2010)
Acute lymphoid leukaemia:
CEM
Unknown
THC
Apoptosis
Unknown
(Powles et al. 2005)
HPB-ALL
Unknown
CAP
Apoptosis
Unknown
(Zhang et al. 2003a)
Jurkat T-cell line Expressed Arvanil,
CAP
Apoptosis
Immunomodulatory and anti-inflammatory,
apoptosis is preceded by a reduction of ΔΨm
and increase in ROS
No
Unknown
(Dou et al. 2011; Gertsch et
al. 2002; Macho et al. 1999;
Sancho et al. 2003; Zhang et
al. 2003a)
Human promyelocytic leukaemia:
HL-60
Unknown
CAP
>50mM induced Apoptosis, cytotoxicity
Unknown
(Tsou et al. 2006)
(Ito et al. 2004; Powles et al.
2005; Roy et al. 2002)
THC Apoptosis
UF-1, NB4 CAP Apoptosis
ATL cells:
HPB-ATL-T, HPB-CTL-I, HUT-102
Unknown
CAP
Apoptosis, down-regulates Tax and Bcl-2
expression, inhibits NF-κB
Unknown
(Zhang et al. 2003a)
Erythroblastic leukaemia: HEL-92 Unknown THC Apoptosis Unknown (Powles et al. 2005)
CML: KU812, K562 Unknown CAP Apoptosis Unknown (Ito et al. 2004; Roy et al.
2002)
MM cells: U266, MM.1S Unknown CAP > 5mM inhibited cell proliferation, Apoptosis,
inhibits STAT3, potentiates chemotherapy
Unknown (Bhutani et al. 2007)
Lymphoma: U937 Expressed AEA
CAP
Apoptosis
Apoptosis
Yes
Unknown
(Ito et al. 2004; Maccarrone et
al. 2000)
Table 1-4: Summary of TRPV1-expression and function in malignant haematological cell lines
CAP: capsaicin; STAT: Signal transducer and activator of transcription; THC: Δ9-tetrahydrocannabinol; AEA: Anandamide; ATL: adult T-cell leukaemia; CML: chronic myeloid leukaemia;
MM: multiple myeloma. ΔΨm: mitochondrial transmembrane potential.

31
1.7.1 Leukaemic cell lines
Few studies have investigated the expression and function of TRPV1 and its agonists
in malignant haematological cells. As TRPV1 has been reported to be expressed in
monocytes (Schilling and Eder 2009b), Ca2+
influx via TRPV1 was important for
strengthening the adhesion between THP-1 cells (acute monocytic leukaemia cell
line), and human umbilical vein epithelial cells. Mechanical stress caused by
monocyte adhesion might activate TRPV1 channels (Himi et al. 2012).
Some groups have studied the effect of CAP on leukaemic cell lines in vitro and in
vivo. Ito et al (2004) have reported that CAP suppressed the growth of leukemic cell
lines i.e. Kasumi-1, UF-1 and NB4, but not normal bone marrow mononuclear cells,
via induction of G0-G1 phase cell cycle arrest and apoptosis. This effect was
associated with increased ROS production, therefore CAP-induced cell death
signalling is thought to be mediated by a mitochondrial-dependent pathway (Table
1-4) (Ip et al. 2012; Ito et al. 2004).
The tumour suppressor protein p53 is an important protein that mediates cell death
(Ko and Prives 1996). CAP promotes the activation of p53 through phosphorylation,
since nullification of p53 expression significantly reduced CAP-induced cell cycle
arrest. CAP-sensitive leukaemic cells, such as NB4 and Kasumi-1, express wild-type
p53 (Ito et al. 2004). The activation p53 by CAP leads to the up-regulation of some
genes including the tumour suppression gene cyclin-dependent kinases (CDK)
inhibitor (p21 WAF1/CIP1
), and the pro-apoptotic Bcl-2–associated X (Bax) genes (Ito et
al. 2004; Lakin and Jackson 1999; Miyashita and Reed 1995). This leads to the
production of BAX protein which in turn, moves from the cytosol to the outer

32
mitochondrial membrane, causing the release of cytochrome c and caspases cascade
activation leading to apoptosis (Green and Reed 1998; Ito et al. 2004; Sarkaria et al.
1998). Whilst cell cycle activation involves many molecules including cyclins,
CDKs, and inhibitors, the upregulation of such molecules leads to cell cycle arrest.
This concept has been considered in anticancerous drug studies (Paschka et al. 1998).
1.7.2 Adult T-cell leukaemia
Adult T-cell leukaemia (ATL) is an aggressive form of human T-cell malignancy
caused by human T-cell leukaemia virus type-1 (Hinuma et al. 1981). There have
been few studies demonstrating the role of CAP in inhibiting ATL cells proliferation.
Direct injection of CAP into laboratory mice dramatically inhibited the growth of
tumours in these mice (Morre et al. 1996). Exposure of ATL cells to CAP provoked
G1 phase and decreased S phase, where cell division occurs, in a dose-dependant
manner. However, normal peripheral blood T-cells showed neither apoptosis nor
necrosis (Zhang et al. 2003a). NF-κB activation, an essential apoptosis inhibitor
(Portis et al. 2001) by Tax, which in turn a human T-cell leukaemia virus type-1
transactivator protein, plays a crucial role in the pathogenesis of ATL (Arima et al.
1999). As noted, CAP can inhibit the activation of NF-κB and DNA synthesis by
decreasing NF-κB binding activity of p65, resulting in the suppression of ATL
(Table 1-4). The growth-inhibitory potential of CAP on ATL cells was reported
t o b e mainly due to G1/cell cycle arrest and apoptosis (Zhang et al. 2003a). G1
cell cycle arrest has been demonstrated to be a common apoptosis mechanism of
many anticancerous drugs (Choi et al. 2001; Fukuoka et al. 2000).
In addition to the role of decreased NF-κB activity in CAP-induced apoptosis,
down-regulation of B-cell lymphoma-2 protein (Bcl-2) may also be responsible

33
for apoptosis. As in contrast to Bax, Bcl-2 and B-cell lymphoma-extra large (Bcl-
xL) are essential factors which act to protect the cell against apoptosis (Yang and
Korsmeyer 1996). Indeed, the Bcl-2/Bax ratio is considered to be an important
determinant of apoptosis (Reed et al. 1996). CAP has the ability to reduce the
expression of Bcl-2 as well as the Bcl-2/Bax ratio, leading to apoptosis in ATL cell
lines (Zhang et al. 2003a).
1.7.3 Multiple Myeloma
There have been few studies that have investigated the effect of CAP on multiple
myeloma (MM) cells. Signal transducer and activator of transcription (STAT) is a
well known family which regulates the expression of gene products (Darnell 2002).
Among the STATs, STAT3 is the member mostly related to tumorigenesis. It is
constitutively active in tumour cells and can be activated by growth factors, such as
interleukin-6 (IL-6), and oncogenic kinase such as Src. STAT3 regulates the
expression of genes that mediate proliferation (e.g., c-myc and cyclin D1), suppress
apoptosis (e.g., Bcl-xL) and encourage angiogenesis (Bhutani et al. 2007).
It has been found that CAP can cause apoptosis in MM cells through the inhibition of
IL-6-inducible STAT3 activation (Bhutani et al. 2007). STAT3 has been
demonstrated to be linked to a chemoresistance and radioresistance, therefore
inhibition of STAT3 activation may play a role in prevention and treatment of cancer
(Aggarwal et al. 2006).
Velcade (PS341) and thalidomide are common therapeutic agents for the treatment of
MM patients (Cavo 2006). Prolonged exposure to these compounds is associated
with toxicity and development of chemoresistance. Up-regulation of different anti-

34
apoptotic proteins such as Bcl-2, and Bcl-xL has a critical role in the mechanism of
the chemoresistance (Chauhan et al. 2007; Mitsiades et al. 2002). CAP was
demonstrated to enhance the apoptotic effect of velcade and thalidomide (Bhutani et
al. 2007). However, the role of TRPV1 in this effect has not been determined.
1.8 Project Aims
The overall aim of this project was to investigate the expression and role of TRPV1
in haematological malignancies. The specific aims were to:
1. Investigate the viability/activity of cells cultured from the haematological
malignancies, following the exposure to the TRPV1 agonist, CAP (Chapter 2);
2. Investigate the effect of TRPV1 and cannabinoid receptor antagonists on
malignant haematological cell lines (Chapter 2);
3. Optimise Western blotting and flow cytometry protocols to detect TRPV1
expression in human white blood cells (Chapter 3 and 4);
4. Investigate the expression of TRPV1 protein in PBMCs obtained from healthy
adult donors, malignant haematological cells and other cell lines (Chapter 5);
5. Assess whether TRPV1 expression is altered in patients with haematological
malignancies, compared to gender-matched healthy controls (Chapter 6).
1.9 Hypotheses
1. CAP induces a reduction in the viability of cells cultured from haematological
malignancies cell lines, and this effect is TRPV1-mediated.
2. TRPV1 receptor is expressed in normal leukocytes and it is overexpressed in
malignant haematological cell lines.

35
3. TRPV1 expression is increased in leukocytes obtained from patients with
haematological malignancies compared to healthy subjects.

36
2. Chapter 2: Capsaicin-Induced Death of Human Haematological
Malignant Cell Lines is Independent of TRPV1 Activation

37
2.1 Abstract
Capsaicin (CAP), the major active component of hot chilli peppers, has previously
been shown to have anticancer properties. The precise mechanism(s) by which CAP
acts on malignant cells however, have yet to be determined. The aims of this study
were to; 1) investigate the effect of CAP on the metabolic activity (viability) of
human malignant haematological cell lines, and 2) to determine if any effect was
mediated through its cellular receptor, transient receptor potential vanilloid-1
(TRPV1). THP-1 (acute monocytic leukaemia), U266B1 (myeloma) and U937
(histiocytic lymphoma) cell lines were exposed to increasing concentrations of CAP
(8-1000 µM). Cell metabolic activity was measured after 24hr in the presence and
absence of TRPV1, CB1 and CB2 antagonists (0.1-100 µM) using the alamarBlue®
method (resazurin reduction). CAP reduced metabolic activity in THP-1, U266B1
and U937 cells in a concentration-dependant manner. A biphasic effect was observed
in THP-1 cells (EC50/IC50 (95% CI) = 32.9(19.9-54.3)/ 219(144-246) µM). Blocking
TRPV1 using SB452533 and CB1 receptors using AM251 (100µM) suppressed the
CAP-induced increase in THP-1 metabolic activity (P<0.001). U266B1 cells were
more resistant to CAP than THP-1 and U937 cells. Metabolic activity was
significantly inhibited by CAP in U937 compared to U266B1 cells (IC50: 197 vs.
431µM, respectively, P<0.008). AM251 and SB452533 appeared to act as partial
agonists and displayed a synergistic effect with CAP in U937 cells. In conclusion,
THP-1, U266B1 and U937 cell lines responded differently to CAP. TRPV1, CB1 and
CB2 antagonists did not affect CAP-induced metabolic activity in U266B1 cells,
although TRPV1 or CB1 receptors appeared to mediate an increase in metabolic
activity in THP-1 cells. This data strongly suggests that CAP inhibits the metabolic
activity of malignant haematological cells through TRPV1-independent mechanisms.

38
2.2 Introduction
Vanilloids are naturally-occurring substances found in many spicy foods. CAP is the
major vanilloid present in hot chilli peppers (Capsicum spp.) (Monsereenusorn et al.
1982) and is responsible for the ‘burning’ sensation when consumed (Knotkova et al.
2008). The actions of CAP are mediated by the non-selective cation channel,
transient receptor potential vanilloid-1 (TRPV1) (Nagy et al. 2004).
TRPV1 belongs to the TRP superfamily, which consists of a number of non-selective
cation channels that are permeable to both monovalent and divalent cations
(Alexander et al. 2007). TRP channels are involved in many functions, including
nociception, temperature and mechanical sensation, renal Ca2+
/Mg2+
handling,
cardiovascular and respiratory regulation, and the control of cell growth and
proliferation (Christensen and Corey 2007; Ramsey et al. 2006).
The TRPV1 channel was originally believed to be expressed primarily on sensory
neurons originating from the central nervous system (CNS), including dorsal root
and trigeminal ganglion neurons (Julius and Basbaum 2001; Schicho et al. 2004).
However, TRPV1 message and/or protein has been detected in non-neuronal cells
such as the urothelium (Birder et al. 2001), smooth muscle and keratinocytes (Jaggar
et al. 2001), epithelial cells of the gastrointestinal (Geppetti and Trevisani 2004) and
respiratory tracts (Reilly et al. 2003), and leukocytes (Saunders et al. 2009; Saunders
et al. 2007).
CAP has been reported to have anticancer properties. It promotes apoptosis and
inhibits proliferation of a number of cancer cell lines, including glioma (Amantini et

39
al. 2007; Contassot et al. 2004a; Gil and Kang 2008), hepatoma (Huang et al. 2009;
Lee et al. 2004; Reilly et al. 2003), A549 lung adenocarcinoma (Thomas et al. 2007),
squamous cell carcinoma (Hail Jr and Lotan 2002), cervical cancer (Contassot et al.
2004a), urothelial and bladder cell cancer (Amantini et al. 2009; Chen et al. 2012a)
and pancreatic neuroendocrine tumour cells (Skrzypski et al. 2014). In addition,
CAP, in combination with other drugs such as cisplatin, induces apoptosis in
cisplatin-resistant gastric cancer cell lines (Huh et al. 2011). Several mechanisms of
action have been proposed for CAP-induced apoptosis of cancer cells, depending on
cell type and method used to assess the cell death (Amantini et al. 2009; Chen et al.
2012a; Morré et al. 1995). Furthermore, many studies have investigated the effect of
CAP on leukaemic cell lines in vitro and patient cells ex vivo. These have shown that
CAP causes apoptosis in a concentration- and time-dependant manner in Kasumi-1
(Contassot et al. 2004a), KU812 (Roy et al. 2002), U266 (Bhutani et al. 2007), U937
(Contassot et al. 2004b; Maccarrone et al. 2000), HPB-ALL and HPB-CTL-I (Zhang
et al. 2003a), HEL-92 (Powles et al. 2005), UF-1, NB4 (Contassot et al. 2004b;
Powles et al. 2005) and HL-60 cells (Tsou et al. 2006).
TRPV1 expression by, and CAP-induced apoptosis of, human peripheral blood
mononuclear cells (PBMCs) have been previously reported (Saunders et al. 2007).
However, the role of TRPV1 in malignant haematological cell lines has yet to be
extensively investigated. Therefore, the aims of this chapter were to determine; 1) the
effect of CAP on the metabolic activity (an indicator of cell viability) of THP-1,
U266B1 and U937 cells, and 2) whether any observed effects were TRPV1-
mediated.

40
2.3 Materials and Methods
2.3.1 Materials
Cells and solutions
The human acute monocytic leukaemia cell line, THP-1, was obtained from the
European Collection of Cell Cultures (UK). The human multiple myeloma cell line,
U266B1, and human histiocytic lymphoma cell line, U937, were purchased from the
American Type Culture Collection (Manassas, VA, USA). Table 2-1 summarises the
characteristics of the malignant haematological cell lines used in this study.
RPMI1640 was purchased from Life Technologies (Grand Island, USA) and ATCC
(VA, USA). Foetal bovine serum (FBS) was purchased from Life Technologies,
Grand Island, USA, and L-Glutamine-Penicillin-Streptomycin solution was
purchased from Sigma-aldrich, St. Louis, USA.
Reagents
The following reagents were purchased from Tocris Bioscience, Ellisville, USA: (E)-
Capsaicin (CAP), SB452533 (TRPV1 antagonist), AM251 (CB1 antagonist) and
AM630 (CB2 antagonist). Trypan Blue (0.4%) was purchased from Life
Technologies, Grand Island, USA.
2.3.2 Methods
THP-1 Cell Culture
THP-1 cells were cultured in RPMI1640 (Life Technologies, Grand Island, USA)
supplemented with 20% heat-inactivated FBS (Life Technologies, Grand Island,
USA), 2 mM glutamine, 100 U/mL Penicillin and 100 µg/mL Streptomycin, all

41
THP-1 U266B1 U937
Species Human Human Human
Original disease Acute monocytic leukaemia Multiple Myeloma Lymphoma
Tissue Peripheral blood B- lymphocyte; plasmacytoma;
myeloma
Histiocytic lymphoma
Age/ gender 1 year/ male 53 years/ male 37 years/ male
Cellular products Lysozymes, IL-1 Igs, monoclonal antibody and
IL-6
Lysozyme, beta-2 microglubulin
and TNF
Morphology Monocytes Lymphoblasts Monocytes
Growth property suspension suspension suspension
Passage 5-10 4-9 4-9
Concentration 5 x 10⁵ viable cell/ mL
Table 2-1: Characteristics of the studied haematological malignant cell lines
IL-1: interlukin-1; IL-6: interlukin-6; Igs: immunoglobulins; TNF: Tumor Necrosis Factor

42
prewarmed to 37°C prior to use. A frozen vial of THP-1 cells was thawed quickly in
the water bath at 37°C and transferred drop wise to 5 mL of warm complete media.
Cells were then centrifuged at 150 x g for 5 min. The supernatant was discarded and
the cell pellet resuspended at a density of 3-5 x 10⁵
cells/mL. A 100µL aliquot of cell
suspension was placed into an Eppendorf tube for cell counting. Twenty microlitres
of cell suspension was mixed with 20µL of Invitrogen Countess 0.4% Trypan Blue
and 10µL of the mix was loaded on a slide for cell counting using Countess®
automated cell counter (Life Technologies, Grand Island, USA). Cells were then
seeded at 2 x 10⁵/mL and transferred to a T25 culture flask and incubated in vertical
position at 37°C, 5% CO2 in a Heraeus HEREcell 150 incubator (Thermo Fisher
Scientific, Walham, USA) for 7 days and then repositioned horizontally for another 7
days. Once the culture was established, the FBS was reduced to 10%. To keep cells
in the exponential growth phase, cells were maintained between 3-8 x 10⁵ cells/mL.
Cell viability was maintained >90%, otherwise were discarded.
U266B1 and U937 Cell Culture
U266B1 and U937 cell lines were cultured in RPMI1640 (ATCC, VA, USA),
containing 2 mM L-glutamine, 10 mM HEPES, 1 mM sodium pyruvate, 4.5 g/L
glucose, 1.5 g/L sodium bicarbonate and supplemented with 15% and 10% FBS,
respectively. 100,000 IU/mL Penicillin and 100,000 µg/mL of Streptomycin were
used in primary cultures only, according to supplier’s instructions. Frozen vials of
U266B1 and U937 cells were thawed quickly in the water bath at 37°C (< 2 min) and
transferred drop wise to 9 mL of warm complete media, centrifuged at 150 x g for 5
min and resuspended slowly in 5 mL of fresh warm media. Cell counts were
performed as previously described. The cell suspensions were then transferred to T25

43
culture flasks and incubated in horizontal position at 37°C, in 5% CO2 in a Heraeus
HEREcell 150 incubator (Thermo Fisher Scientific, Walham, USA) for 3 days before
subculturing. Culture was maintained at 2 x 10⁵ cell/mL and was not allowed to
exceed 1 x 10⁶ cell/mL. Every subculture was considered as one passage.
2.3.3 Cryopreservation
For U937 and U266B1, 1-5 x 10⁶ cells were resuspended in 1 mL of complete media
containing 5% (v/v) dimethyl sulfoxide (DMSO). THP-1 cells, however, were
harvested at 1-3 x 10⁶ cells and resuspended in a cryopreservation vial containing 1
mL of RPMI1640 (Life Technologies, Grand Island, USA) supplemented with 20%
FBS, 2 mM glutamine, 100 U/mL Penicillin, 100 µg/mL Streptomycin and 10%
glycerol. Aliquots were stored at -80°C using a NalgeneTM
Mr. FrostyTM
Cryo 1°C
freezing container (Thermo Scientific, MA, USA) for 24 hr, which allows for a
freezing rate of 1°C/min before transferring to the nitrogen phase.
2.3.4 Cell metabolic activity assays
CAP and SB452533 were reconstituted in ethanol, whereas AM251 and AM630
were reconstituted in DMSO. Cell metabolic activity was measured using the
alamarBlue® method according to manufacturer’s instructions. Briefly, resazurin, the
active ingredient of alamarBlue® reagent, is taken into the cells and reduced to
resorufin, producing bright red fluorescence. The extent of reduction is related to cell
viability and metabolic activity (Nakayama et al. 1997).
Cells were exposed to either increasing concentrations of CAP alone or to 125µM of
CAP in the absence and presence of the TRPV1, CB1 or CB2 antagonists for 22 hr at
37°C in 5% CO2. The cells were then incubated with alamarBlue® reagent for
44
another 2 hr. Fluorescence was measured at 590 nm using an excitation wavelength
of 545 nm on a Tecan GENios plate reader (Zurich, Switzerland). The relative
fluorescence of treated cells was normalised to untreated cells (vehicle) and
metabolic activity expressed as a percentage of vehicle.
Effect of CAP on THP-1, U266B1 and U937 cell metabolic activity
Cells were harvested by centrifugation at 150 × g for 5 min then fresh media was
replaced by aspiration. Cells were seeded in 96 wells flat-bottom plates at a density
of 5 × 10⁵ cells/ 100 µL/ well and incubated at 37°C, 5% CO2 for 10 min. Increasing
concentrations of CAP (8-1000 µM) were then added to the cells. Cell metabolic
activity was then measured using the alamarBlue®
method as described earlier.
Effect of TRPV1, CB1 and CB2 antagonists on CAP-induced changes in cell
metabolic activity
In preliminary experiments, 50 µL of the TRPV1 antagonist, SB452533 (0.1, 1.0 and
10 µM) was added to THP-1, U266B1 and U937 cells and incubated at 37°C, 5%
CO2 for 30 min. Increasing concentrations of CAP (8-1000 µM) were then added to
the cells and assessed for viability using the alamarBlue®
method. Test cells were
compared to a vehicle containing cells treated with ethanol only.
In subsequent studies, cells were incubated with 0.1-100 µM SB452533, or the CB1
and CB2 antagonists, AM251 and AM630, independently, for 30 min, and then with
125µM CAP. The effect of each antagonist alone on metabolic activity was also
investigated and used as a control. Cell metabolic activity was then assessed using

45
the alamarBlue®
method. Metabolic activity was compared to vehicle (complete
media containing ethanol for SB452533 and DMSO for AM251 and AM630).
Data analysis
Data analysis was performed using GraphPad Prism (Graphpad Software Inc, V5.01,
CA, USA). Data is expressed as the mean ± SEM of n experiments. EC50/ IC50 for
CAP-induced changes in viability assays were obtained by fitting data using the
nonlinear regression curve fit (log [antagonist] vs. response-variable slope (four
parameters)) function and expressed as the mean and 95% confidence interval (95%
CI). A two-way ANOVA followed by Bonferroni post hoc test was performed to
determine the P-value. P<0.05 was considered statistically significant.
2.4 Results
-5.5 -5.0 -4.5 -4.0 -3.5 -3.00
25
50
75
100
125
150
THP-1
U266B1
U937
Log [CAP] (M)
% M
eta
bo
lic A
cti
vit
y
Figure 2-1: Differential response of THP-1, U266B1 and U937 cells to
CAP. Cells were treated with increasing CAP concentrations for 24 hr.
Metabolic activity was measured using the alamarBlue® method (resazurin
reduction) and readings were normalised to a pre-exposure metabolic
activity (expressed as a percentage). Each point represents the mean ±
SEM (n= 10).

46
CAP decreases THP-1, U266B1 and U937 cell metabolic activity. THP-1 cells
responded to CAP with an initial increase in metabolic activity by 29% with the
highest increase reached at 125µM of CAP, followed by a decline at a CAP
concentration greater than 125µM, indicative of reduced viability and cell death
(Figure 2-1). The metabolic activity concentration-response curve for THP-1 cells
was more bell-shaped. The stimulatory and inhibitory phases were analysed
separately to generate the respective EC50 and IC50 values (Table 2-2). U266B1 cells
preserved their activity (104%) under the effect of sub-lethal concentration of CAP
(8-125 µM) (Figure 2-1). However, at CAP concentrations greater than 125µM,
metabolic activity decreased, but required higher concentrations compared to THP-1
and U937 cells. Furthermore, U937 cell metabolic activity was inhibited by ~1-14%
when exposed to the sub-lethal concentrations (8-125 µM) of CAP (Figure 2-1)
before declining rapidly by 93% at the highest concentration of CAP (1000µM). The
IC50 in U937 cells was significantly lower than compared to IC50 of U266B1 cells
(Table 2-2).
SB452533 has no effect on CAP-induced metabolic activity in THP-1, U266B1 and
U937 cells. Pre-treatment of the three cell lines with SB452533 (0.1-10 µM) had
insignificant effect in the metabolic activity response curve of CAP (Figure 2-2).
Cell line *EC50 (95% CI) (µM)
**IC50 (95% CI) (µM)
THP-1 32.9 (19.9-54.3) 219 (144-246)
U266B1 N/A 431 (382-489)
U937 N/A 197 (139-278)
*EC50: the concentration of CAP that gives half-maximal increase in response; **IC50: the
concentration of CAP where the response is reduced by 50%. Results are expressed as mean (95%
confidence interval, CI), n=10; N/A: non-available.
Table 2-2: EC50/IC50 for CAP-induced metabolic activity in THP-1,
U266B1 and U937 cells

47
-6.0 -5.5 -5.0 -4.5 -4.0 -3.5 -3.00
25
50
75
100
125
150
CAP alone
CAP+10 M SB
CAP+1.0 M SB
CAP+0.1 M SB
THP-1%
Meta
bo
lic A
cti
vit
y
-6.0 -5.5 -5.0 -4.5 -4.0 -3.5 -3.00
25
50
75
100
125
150
CAP alone
CAP+10 M SB
CAP+1.0 M SB
CAP+0.1 M SB
U266B1
% M
eta
bo
lic A
cti
vit
y
-6.0 -5.5 -5.0 -4.5 -4.0 -3.5 -3.00
25
50
75
100
125
150
CAP alone
CAP+10 M SB
CAP+1.0 M SB
U937
CAP+0.1 M SB% M
eta
bo
lic A
cti
vit
y
Log [CAP] (M)
Figure 2-2: Effect of CAP and the TRPV1 antagonist, SB452533, on the metabolic activity (resazurin reduction) of THP-1,
U266B1 and U937 cells. Cells were incubated with increasing concentration of SB452533 for 30 min before exposure to CAP for 24
hr. For each cell line, the experiment was performed twice in triplicate for each CAP concentration (mean ± SEM, n= 6). Metabolic
activity (resazurin reduction) was expressed as percentage.

48
High concentrations of SB452533 and AM251 enhance the cytotoxic effect of CAP
on THP-1 cells. In the experiments with CAP alone (Figure 2-1) and CAP in the
presence of SB452533 (Figure 2-2 and Figure 2-3, A), an increase in THP-1 cell
metabolic activity (increase resazurin reduction) at 125µM CAP of ~29% was
observed. However, in subsequent experiments with AM251 and AM630, this
increase was not observed (Figure 2-3, B and C). SB452533, AM251 and AM630
(0.1-10 µM) alone had no effect on the metabolic activity of THP-1 cells. Pre-
treatment of THP-1 cells with lower concentrations of SB452533 (0.1, 1.0 and 10
µM) had a similar effect as CAP alone on the metabolic activity (P>0.05, Figure 2-3,
A). In contrast, the highest concentrations of SB452533, AM251 and AM630
(100µM) significantly decreased metabolic activity in the presence of CAP (125µM)
by ~20%, 65% and 55% respectively (P<0.001, compared to CAP alone, Figure 2-3).
However, AM630 (100µM) alone appeared to have an effect on reducing the
metabolic activity independently, with this effect considered non-specific. In
addition, pre-exposure of THP-1 cells to AM251 or AM630 (0.1-10 µM)
significantly increased the metabolic activity in the presence of CAP for up to 25%
(Figure 2-3: B vs. C, P<0.01 vs. P<0.05, respectively compared to CAP alone).
No significant effect of TRPV1 and CB antagonists on CAP-induced cytotoxicity
on U266B1 cells. Similar to THP-1 cells, 125µM CAP had little or no effect on the
metabolic activity of U266B1 cells (Figure 2-1). However, metabolic activity
increased by 125µM CAP in the subsequent experiments with antagonists (by
~20%). Pre-treatment of U266B1 cells with SB452533 (0.1-10 µM) increased CAP-
induced metabolic activity, but these results were not statistically significant
(P>0.05, compared to CAP alone). In addition, at the highest concentration of

49
SB452533 (100µM), metabolic activity was significantly decreased by 25%
compared to CAP alone, but as SB452533 alone at this high concentration appeared
to inhibit the metabolic activity, this effect was considered non-specific (Figure 2-4,
A). Paradoxically, AM251 (0.1-1.0 µM) increased the metabolic activity by ~25%
compared to CAP. However, AM251 alone appeared to increase the metabolic
activity independently, therefore this effect was also considered non-specific (Figure
2-4, B). Furthermore, pre-treatment of U266B1 cells with AM630 had an additive
effect to CAP-induced metabolic activity, however this effect was not statistically
significant compared to CAP alone (Figure 2-4, C).
TRPV1 and CB1 antagonists enhanced CAP-induced cytotoxicity on U937 cells.
Exposure of U937 cells to CAP alone decreased metabolic activity by 14% (Figure
2-5). All three antagonists alone (0.1-10 µM) had no effect on cell metabolic activity.
However, at the highest concentration (100µM) of each of the three antagonists alone
or with post-exposure to CAP, completely abolished the metabolic activity of U937
cells. Furthermore, pre-treatment of these cells with SB452533 (10µM) or AM251
(0.1-10 µM), significantly decreased the metabolic activity in the presence of CAP
(P<0.001, compared to CAP alone). However, when the cells were pre-treated with
SB452533 (0.1-1.0 µM) or AM630 (0.1-10 µM), then exposed to CAP, a similar
effect to CAP alone on the metabolic activity was observed (P>0.05) (Figure 2-5).

50
CA
P 0.1
1.0 10 10
00
20
40
60
80
100
120
140
CAP+SB452533
SB452533 alone
A: SB452533
*
#
CAP alone
% M
etab
oli
c A
ctiv
ity
CA
P 0.1
1.0 10 10
00
20
40
60
80
100
120
140
CAP+AM251AM251 alone
B: AM251
**
#
#
#
CAP alone
#
% M
etab
oli
c A
ctiv
ity
CA
P 0.
11.
0 10 100
0
20
40
60
80
100
120
140
CAP+AM630AM630 alone
C: AM630
*
* **
#
#
#
#
CAP alone
Antagonist concentration (M)
% M
etab
oli
c A
ctiv
ity
THP-1
Figure 2-3: Effect of SB452533, AM251 and AM630 on CAP-induced
change in metabolic activity (resazurin reduction) in THP-1 cells. Cells
were pre-treated with antagonists for 30 min prior to exposure to 125µM CAP
(black bars) for 24hr. The effects of the antagonists alone were also
determined (white bars). Dotted bars indicate the effect of CAP alone
(125µM). Bars represent the mean ± SEM (n=3). *denotes P<0.05 compared
with vehicle; # denotes P<0.05 compared with CAP alone. THP-1 cell
metabolic activity increased at 125µM CAP by ~29%. Lower concentrations
of SB452533 (0.1, 1.0 and 10 µM) had a similar effect as CAP alone on
metabolic activity. The highest concentrations of SB452533, AM251 and
AM630 (100µM) significantly decreased metabolic activity in the presence of
CAP (125µM) by ~20%, 65% and 55%, respectively. AM251 or AM630
(0.1-10 µM) significantly increased metabolic activity in the presence of CAP
for up to 25%.

51
CA
P 0.
11.
0 10 100
0
20
40
60
80
100
120
140
CAP+SB452533
SB452533 alone
A: SB452533 #
CAP alone
% M
eta
bo
lic A
cti
vit
y
CA
P 0.
11.
0 10 100
0
20
40
60
80
100
120
140
160
CAP+AM251
AM251 alone
B: AM251 #
#
CAP alone
% M
eta
bo
lic A
cti
vit
y
CA
P0.
11.
0 10 100
0
20
40
60
80
100
120
140
160
CAP+AM630
AM630 alone
C: AM630
CAP alone
Antagonist concentration ( M)
% M
eta
bo
lic A
cti
vit
y
U266B1
Figure 2-4: Effect of SB452533, AM251 and AM630 on CAP-induced
metabolic activity (resazurin reduction) of U266B1 cells. Cells were
pre-treated with antagonists for 30 min prior to exposure to 125µM CAP
(black bars) for 24hr. The effects of the antagonists alone were also
determined (white bars). Dotted bars indicate the effect of CAP alone
(125µM). Bars represent the mean ± SEM (n=3); # denotes P<0.05
compared with CAP alone. No significant effect of TRPV1 and CB
antagonists on CAP-induced cytotoxicity was observed.

52
CA
P0.
11.
0 10 100
0
20
40
60
80
100
120
CAP+SB452533
SB452533 alone
A: SB452533
*
*
#
#
CAP alone
% M
eta
bo
lic A
cti
vit
y
CA
P 0.
11.
0 10 100
0
20
40
60
80
100
120
CAP+AM251
AM251 alone
B: AM251
**
*
##
#
#
CAP alone
% M
eta
bo
lic A
cti
vit
y
CA
P0.
11.
0 10 100
0
20
40
60
80
100
120
CAP+AM630
Antagonist concentration ( M)
AM630 alone
C:AM630#
CAP alone
% M
eta
bo
lic A
cti
vit
y
U937
Figure 2-5: Effect of SB452533, AM251 and AM630 on CAP-
induced metabolic activity (resazurin reduction) of U937 cells. Cells were pre-treated with antagonists for 30 min prior to exposure
to 125µM CAP (black bars) for 24hr. The effects of the antagonists
alone were also determined (white bars). Dotted bars indicate the
effect of CAP alone (125 µM). Bars represent the mean ± SEM (n=3).
* denotes P<0.05 compared with vehicle; # denotes P<0.05 compared
with CAP alone. CAP alone decreased metabolic activity by 14%.
The three antagonists at 100µM alone or post-exposure to CAP,
completely abolished the metabolic activity. SB452533 (10µM) or
AM251 (0.1-10 µM) significantly decreased the metabolic activity in
the presence of CAP.

53
2.5 Discussion
CAP has previously been shown to induce apoptosis through a TRPV1-mediated
mechanism in some malignant cells including glioma (Amantini et al. 2007),
urothelial cell cancer (Amantini et al. 2009) and non-malignant cells such as
bronchiolar cells (Reilly et al. 2005). The effect of vanilloid-like agents, such as CAP
on different malignant haematological cell lines has been poorly studied. Therefore,
the aim of this chapter was to investigate the effect of CAP on the metabolic activity
(resazurin reduction) of malignant haematological cell lines THP-1, U266B1 and
U937 cells. The specified cell lines were selected because they cover the main
categories of haematological malignancies i.e., leukaemia (THP-1), myeloma
(U266B1) and lymphoma (U937). The role of the CAP receptor, TRPV1, and
cannabinoid CB1 and CB2 receptors, in CAP-induced effects was also investigated.
CAP inhibited metabolic activity, and induced cell death, in a concentration-
dependant manner in all three malignant haematological cell lines. This effect was
consistent with previous studies in myeloid leukaemia (Ito et al. 2004) and myeloma
cell lines (Bhutani et al. 2007). Furthermore, CAP was found to increase metabolic
activity (resazurin reduction) in THP-1 cells in a concentration-dependent manner
(up to 125µM). This effect was not antagonised by pre-exposure to low
concentrations of SB452533 (0.1-10 µM). In contrast, at the highest concentration of
SB452533 or AM251 (100µM), the effect of CAP appeared to be antagonised and
metabolic activity was significantly inhibited. The possible explanations for this
suppression are; 1) TRPV1 and CB1 receptors mediate the CAP-induced increase in
metabolic activity in THP-1 cells, and as high antagonist concentrations completely
block these receptors, cell death ensues; and/or 2) THP-1 cell death observed at the

54
high concentrations of antagonists used in these experiments combined with CAP,
might be a non-specific action. Moreover, low concentrations (0.1-10 µM) of
AM251 or AM630 appeared to act as agonists to further increase the CAP-induced
metabolic activity. As a result, these findings suggest that neither CB1 nor CB2
mediate the CAP-induced metabolic activity in THP-1 cells.
U266B1 cells were found to be more resistant to CAP than THP-1 and U937 cells.
This finding is consistent with the fact that U266B1 cells (myeloma) are resistant to
apoptosis and express high levels of the antiapoptotic protein, Bcl-xL (Preta and
Fadeel 2012). Also in this study an increase in CAP-induced metabolic activity (4-
20%) in U266B1 cells has been demonstrated (at 125µM), and found to be neither
TRPV1-, CB1-, nor CB2-mediated. A receptor-independent mechanism of
cannabinoid-induced cell-death has been previously demonstrated in cultured human
B lymphoblastoid cells (Chen and Buck 2000). The action of cannabinoids did not
correlate with their binding affinity to the CB1 and CB2 receptors (Chen and Buck
2000). Thus, TRPV1, CB1, as well as CB2 receptors, appear not be involved in
CAP-induced cell death in lymphoblastoid cells, including U266B1.
In addition, interleukin 6 (IL-6) which is the major survival factor for myeloma cells,
stimulates myeloma cell growth and promote resistance to therapy (Tricot 2002),
signals through STAT proteins, especially STAT3 (Akira et al. 1994). It has emerged
that CAP inhibits IL-6 leading to the inhibition of STAT3 and its gene products (i.e.,
cyclin D1, Bcl-2, Bcl-xL and VEGF), and the induction of caspase 3-dependent
apoptosis pathway (Bhutani et al. 2007).

55
In U937 cells, unlike THP-1 and U266B1 cells, CAP alone appeared to decrease the
cell metabolic activity by 14%. In addition, pre-treatment with 100µM SB452533,
AM251, or AM630, alone or with subsequent exposure to CAP, completely
abolished the metabolic activity of U937 cells. This may be due to the high
sensitivity of these cells to high concentrations of CAP and antagonists leading to
cell death. Another possible explanation is that all three receptors, TRPV1, CB1 and
CB2 might be constitutively active, as the CB1-selective AM251, and the CB2-
selective AM630 appear to behave as ‘inverse agonists’ (Pertwee 2006). Moreover,
Reilly et al. (2005) have reported data that highlight the existence of a TRPV1-
mediated process that ultimately leads to cell death in a TRPV1 over-expressing
bronchial epithelial cell line. In this mechanism, cell death may occur through the
activation of intracellular, ER-bound TRPV1, accessible by the potent TRPV1
antagonist, iodoresiniferatoxin, but not the less potent antagonist, capsazepine, to
promote cell death. Similar findings were reported by Johansen et al. (2006) in
BEAS-2B cells pre-treated with three TRPV1 antagonists, LJO-328, SC0030 and
capsazepine, which produced greater toxicity when treated with the TRPV1 agonist,
nonivamide, and have suggested that the binding of antagonists to the plasma
membrane increases TRPV1 translocation from the ER to the cell surface, resulting
in increased sensitisation of the cells, leading to increased cytotoxicity and Ca2+
flux
(Johansen et al. 2006). Whether SB452533 is able to access the cell interior and
block intracellular TRPV1 has yet to be investigated.
Synergistically with CAP, pre-treatment of the U937 cells with lower concentrations
of SB452533 (10µM) or AM251 (0.1-10 µM) further inhibited the metabolic activity
of these cells. CAP-induced inhibition in metabolic activity was not affected by the

56
pre-exposure to AM630 (0.1-10 µM) nor SB452533 (0.1-1.0 µM) in U937 cells.
Altogether, these findings indicate that CAP-induced inhibition in U937 cell
metabolic activity (resazurin reduction) was neither TRPV1- nor CB1- or CB2-
mediated. Other receptors and mechanisms should be investigated (Contassot et al.
2004b; Maccarrone et al. 2000).
The effect of TRPV1 antagonists alone on cell activity has been previously
documented. Capsazepine was shown to be a mitochondrial inhibitor and to sensitise
tumour cells to the death receptor, tumour necrosis factor-related apoptosis-inducing
ligand (TRAIL), which is able to activate apoptosis via non-TRPV1-mediated
mechanisms (Athanasiou et al. 2007; Sung et al. 2012). Iodoresiniferatoxin was
found to decrease Meth A cancer cell activity (Ghosh and Basu 2010). Similarly, a
cytotoxic effect of the CB1 antagonist, AM251, on leukocytes has also been reported
(Saunders et al. 2009).
The specific pathway by which CAP induces cell death in malignant haematological
cell lines is still unclear. Some previously reported studies have suggested some
receptor-dependent and -independent mechanisms. Anandamide, the endogenous
CB1 and CB2 agonist, interacts with membrane lipid rafts in a non-receptor pathway
(Sarker and Maruyama 2003). The membrane rafts in the plasma membrane of
mammalian cells are enriched with cholesterol and glycosphingolipids, and play an
important role in delivering a number of intracellular signals (Lajoie et al. 2009).
CAP is a highly lipophilic substance that has the ability to cross the plasma
membrane bilayer (Ziglioli et al. 2009), and may therefore interact directly and pass
through the cell membrane in malignant haematological cells. Moreover, other non-

57
receptor pathways involving cyclooxygenase and peroxisome proliferator-activated
receptors have also previously been reported (Pisanti and Bifulco 2009). Other
receptors which might have a role in vanilloid-mediated apoptosis is through death
receptors; CAP has been reported to induce apoptosis in glioma cells via DR5
upregulation and survivin downregulation, leading to TRAIL-induced apoptosis
(Kim et al. 2010). One study reported that low concentrations of CAP induced
TRPV1-dependant apoptosis in thymocytes, but at high concentration, cell necrosis
was observed (Amantini et al. 2004).
Furthermore, CAP, as a vanilloid, has the ability to increase intracellular Ca2+
([Ca2+
]i) through the activation of TRPV1 (Dedov et al. 2002; Ito et al. 2013).
Excessive Ca2+
influx triggered by vanilloid exposure can perturb Ca2+
homeostasis
and mitochondrial function to promote excitotoxicity in nociceptive neurons (Dedov
et al. 2001; Orrenius et al. 2011). An elevation in [Ca2+
]i induces apoptosis via the
activation of Ca2+
-dependent enzymes such as phospholipases, proteases and
endonucleases (Zhivotovsky and Orrenius 2011). However, increased [Ca2+
]i does
not seem to mediate CAP-induced apoptosis in some cells such as A172 human
glioblastoma and transformed cells (Lee et al. 2000; Macho et al. 1999). Thus,
whether increased [Ca2+
]i mediates CAP-induced cell death in haematological
malignant cell lines needs to be investigated.
A major limitation of the present studies are that the findings may not necessarily be
reproducible in other malignant in vitro cell lines or in blood cells obtained from
patients with similar haematological malignancies. Another limitation was the
inconsistent response in metabolic activity of the three cell lines at 125µM of CAP.

58
Furthermore, the high concentrations of vanilloid and antagonists used in the
experiments might have indirect and/or non-specific toxic effects, causing changes in
metabolic activity. Future studies are warranted to investigate the role of membrane
lipid rafts in apoptosis in these cells, as well as the combined effects of TRPV1, CB1
and CB2 receptor antagonists in the cell lines.
In conclusion, CAP promotes cell death in THP-1, U266B1 and U937 cell lines in a
concentration-dependent manner, which suggested the presence of TRPV1 in these
cells. In addition, CAP increased metabolic activity (resazurin reduction) in THP-1,
and this effect was inhibited by high concentration of the SB452533 or AM251.
Hence, TRPV1 and/or CB1 receptors may be involved in CAP-induced increase in
the metabolic activity in THP-1 cells. Furthermore, it was found that neither TRPV1
nor CB1 or CB2 were involved in the CAP-induced metabolic activity in U266B1
cells. In contrast, synergistically with CAP, pre-treatment of U937 cells with
SB452533 or AM251 had a further cytotoxic effect on cells. Thus, these findings
indicate that CAP-induced inhibition in U937 cell metabolic activity (resazurin
reduction) was neither TRPV1- nor CB1- or CB2- mediated. Altogether, this data
suggests that CAP inhibits the metabolic activity of malignant haematological cell
lines through a TRPV1-independent mechanism. Whether TRPV1 is (aberrantly)
expressed in blood cancer cell lines and/or in blood cells from patients with de novo
haematological malignancies, has yet to be determined, and will be investigated later
in this thesis.

59
3. Chapter 3: Validation and Optimisation of a Western Blotting
Method to Detect TRPV1 Protein in Human Peripheral Blood
Mononuclear Cells and Malignant Haematological Cell Lines

60
3.1 Abstract
Transient receptor potential vanilloid-1 (TRPV1) is a non-selective cation channel
activated by a variety of endogenous and exogenous stimuli. Methods previously
used for the detection of TRPV1 at UTAS were quantitative real-time RT-PCR and
immunocytochemistry (Saunders et al. 2007). The aim of this study was to develop
and optimise a Western blotting protocol for the detection of TRPV1 in human
leukocytes. Protein samples were extracted from peripheral blood obtained from
healthy donors. Following denaturation, samples were run in polyacrylamide gels
and transferred to a PVDF membrane. Four blocking solutions were assessed, as
were three rabbit anti-TRPV1 antibodies and two goat anti-rabbit-HRP antibodies as
part of method optimisation. A WesternDot™625 biotin-streptavidin kit and an
Enhanced chemiluminescence (ECL) method were also investigated to determine the
optimal detection system. The Western blotting protocol was optimised to detect
TRPV1 (~95kDa) by using a mixture of 3% BSA and 5% NFM as a blocking
solution, Lifespan Biosciences rabbit anti-TRPV1 (diluted 1:10000), and Cell
Signalling Technology goat anti-rabbit-HRP (diluted 1:5000) as a secondary
antibody. Anti-GAPDH (diluted 1:3000, Cell Signalling Technology) was used as an
internal control and THP-1 cells as a positive control. TRPV1 was then detected
using the ECL detection method. Considerable inconsistencies were encountered
with the staining properties of the different anti-TRPV1 antibodies assessed.
However, TRPV1 was detected with significantly better specificity using the
Lifespan Biosciences anti-TRPV1 antibody. In conclusion, a Western blotting
protocol to detect TRPV1 band in PBMCs was validated and optimised. This method
was applied in later chapters to investigate TRPV1 protein in malignant

61
haematological cell lines, as well as in leukocytes from healthy volunteers and
patients with blood cancers.
3.2 Introduction
Detection of TRPV1 by Western blotting has previously been attempted at UTAS
using the Biotin-Streptavidin method in THP-1 cells. However, the need for
improved reproducibility, with cleaner blots and reduced background, to detect
TRPV1 in haematological malignant cell lines and patient samples (see Chapters 5
and 6), warranted the re-development of the Western blotting protocol for human
cells using an ECL method.
Few papers have reported TRPV1 expression using Western blotting on human
PBMCs or on cells obtained from patients with haematological malignancies
(Amantini et al. 2007; Lee et al. 2009; Sun et al. 2013), although data has been
published using cells from other species (Amantini et al. 2009; Caprodossi et al.
2011; Huang et al. 2010; Zhang et al. 2007). Thus, the aim of this chapter was to
validate and optimise a Western blot protocol for the detection of TRPV1. This
method would be later applied to detect TRPV1 in normal human PBMCs,
haematological malignant cell lines and cells obtained from patients with
haematological malignancies (see chapter 5 and 6).
3.3 Materials and Methods
3.3.1 Materials
BD Vacutainer® CPT™ Tubes were purchased from BD Biosciences, San Jose,
USA. Mammalian cell lyses kit (MCL-1) was obtained from Sigma Aldrich, St.

62
Louis, USA. PageRuler™ Plus Prestained Protein (Fermentas, Thermo Scientific,
Burlington, Canada) and MagicMark™ XP (Life Technologies, Grand Island, USA)
were used as ladders. Bio-Rad DC Protein Assay kit, protease inhibitor cocktail,
mini-Protean® TGX™ Precast Gels (Any kDa gels), Laemmli sample buffer, running
buffer, blotting grade blocker non fat dry milk (NFM), and extra thick blot paper
were purchased from Bio-Rad Laboratories, CA, USA. Immobilon polyvinylidene
difluoride (PVDF) membranes, 0.2µm pore size, were obtained from Millipore, MA,
USA. Two detection systems were tested, Biotin-streptavidin (WesternDot™ 625 kit,
Life Technologies, Grand Island, USA), and the ECL kit (Immobilon™ Western,
Millipore, MA, USA) were used for Western blotting.
3.3.2 Cells
THP-1, U266B1 and U937 cell lines were cultured as previously described (see
section 2.3.1). PBMCs were obtained from blood drawn from healthy donors using
BD Vacutainer® CPT™ Tubes as described below (see section 3.3.5.1).
3.3.3 Antibodies
Three anti-TRPV1 primary antibodies, two anti-Glyceraldehyde 3-phosphate
dehydrogenase (GAPDH) antibodies (Table 3-1) and two secondary antibodies were
evaluated (Table 3-2). GAPDH was used as a loading control.
3.3.4 Ethical Approval
All patients and subjects had been consented before participating in this study. The
study was approved by the Human Research Ethics Committee Network, Tasmania
(H0011050).

63
Table 3-1: Characteristics of the primary rabbit anti-TRPV1 and anti-GAPDH antibodies
Protein Company Catalogue # Epitope Reactivity Purity Recommended
Dilution
TRPV1 Alomone
Labs
ACC-030 Polyclonal anti
C-terminus
(aa 824-838)
Human, rat,
mouse
Affinity purified on
immobilised antigen
1: 200
Santa Cruz
Biotechnology
sc-20813 Polyclonal anti
N-terminus
(aa 1-50)
Human Proprietary techniques 1: 100-1: 1000
LifeSpan Biosciences LS-C150735 Polyclonal anti
N-terminus
(1-50)
Rat, human,
monkey, mouse
Affinity purified
1: 1000
GAPDH Santa Cruz
Biotechnology
sc-25778 polyclonal
anti 1-335
Human Proprietary techniques 1: 100-1000
Cell signalling
Technology
14C10 Monoclonal
anti C-terminus
Human Affinity purified 1: 1000
aa: amino acids; GAPDH: Glyceraldehyde 3-phosphate dehydrogenase; N- / C-terminus: amino/ carboxy terminus; TRPV1: transient receptor potential vanilloid-1
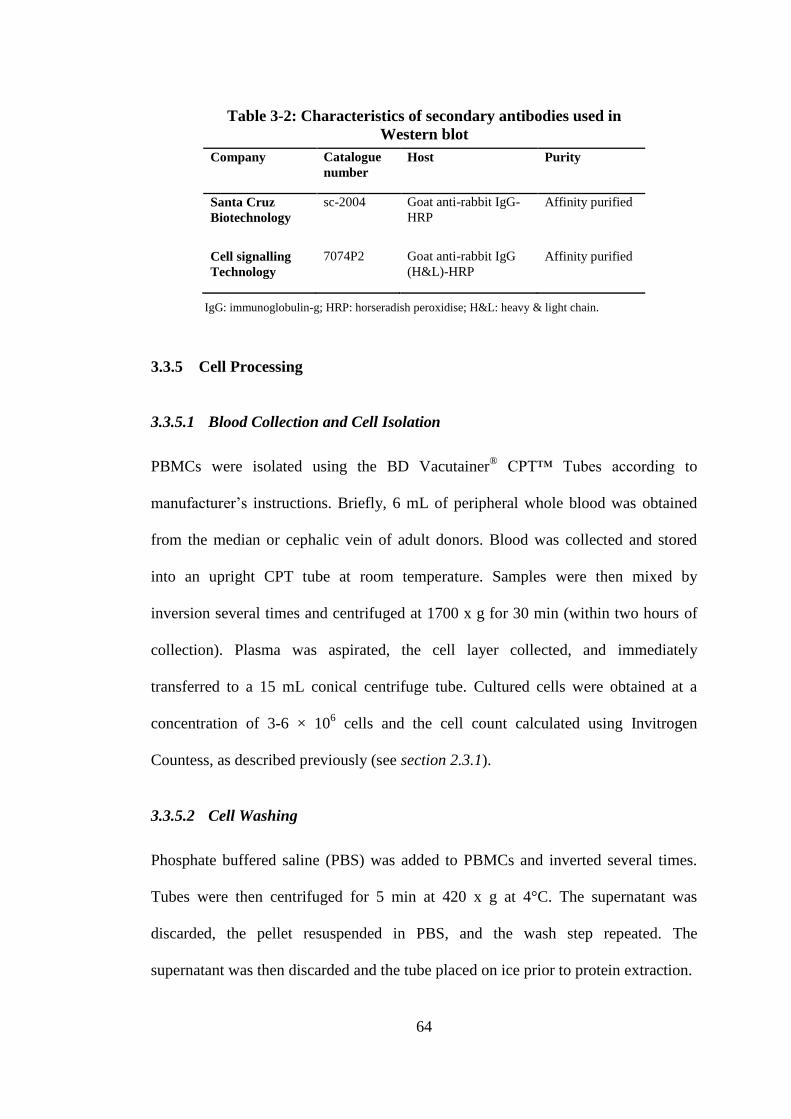
64
Company Catalogue
number
Host Purity
Santa Cruz
Biotechnology
sc-2004 Goat anti-rabbit IgG-
HRP
Affinity purified
Cell signalling
Technology
7074P2 Goat anti-rabbit IgG
(H&L)-HRP
Affinity purified
3.3.5 Cell Processing
3.3.5.1 Blood Collection and Cell Isolation
PBMCs were isolated using the BD Vacutainer® CPT™ Tubes according to
manufacturer’s instructions. Briefly, 6 mL of peripheral whole blood was obtained
from the median or cephalic vein of adult donors. Blood was collected and stored
into an upright CPT tube at room temperature. Samples were then mixed by
inversion several times and centrifuged at 1700 x g for 30 min (within two hours of
collection). Plasma was aspirated, the cell layer collected, and immediately
transferred to a 15 mL conical centrifuge tube. Cultured cells were obtained at a
concentration of 3-6 × 10⁶ cells and the cell count calculated using Invitrogen
Countess, as described previously (see section 2.3.1).
3.3.5.2 Cell Washing
Phosphate buffered saline (PBS) was added to PBMCs and inverted several times.
Tubes were then centrifuged for 5 min at 420 x g at 4°C. The supernatant was
discarded, the pellet resuspended in PBS, and the wash step repeated. The
supernatant was then discarded and the tube placed on ice prior to protein extraction.
IgG: immunoglobulin-g; HRP: horseradish peroxidise; H&L: heavy & light chain.
Table 3-2: Characteristics of secondary antibodies used in
Western blot

65
3.3.5.3 Protein Extraction
The cell pellet was lysed using the Sigma Mammalian Cell Lysis kit (MCL-1)
(Sigma Aldrich, St. Luis, USA) containing Tris-EDTA buffer, deoxycholic acid
sodium salt, Igepal CA 630, sodium dodecyl sulphate (SDS), sodium chloride (at
1:1:1:1:1 ratio), and 10 µL/mL of protease inhibitor cocktail. The cells were
homogenised by a 25 gauge needle for 15 seconds, then incubated on an orbital
mixer at 4°C for 15 min. The cell lysate was then centrifuged at 12000 × g for 10
min. The supernatant was transferred to a chilled 1.5 mL Eppendorf tube for storage
at -20°C, or assayed immediately for protein.
3.3.6 Protein Assay
Protein concentration obtained from the cell lysate was measured using the Bio-Rad
DC Protein Assay kit according to the manufacturer’s instructions. Twenty
microlitres of Reagent S (surfactant solution) were added for every 1 mL of Reagent
A (alkaline copper tartrate solution), to make the working Reagent A. Five dilutions
of protein standard (0.2 mg/mL - 1.54 mg/mL) were prepared to construct the
standard curve. A 500µL of the working Reagent A was added to 100µL of each
sample and standard. Four millilitres of reagent B (a dilute Folin reagent) were added
to each tube and incubated for 15 min at room temperature. Absorbance was
measured at 750 nm using a spectrophotometer (Biochrom Libra S12, Cambridge,
UK). Protein lysate was then aliquoted and stored at -20°C.
3.3.7 Blocking Solutions Optimisation
To block non-specific binding, and increase the specific reaction, 3% bovine serum
albumin (BSA) or 5% NFM, both dissolved in PBST (PBS + 0.05% Tween-20), a
mixture of both, as well as 2% goat serum with 5% NFM were assessed as blocking

66
solutions. Blocking solutions were tested as diluents as well for the primary and
secondary antibodies along with testing the PBST alone (Table 3-3).
3.3.8 Protein Quantity Optimisation
Different protein quantities (5-50 µg) were loaded to optimise the quantity of protein
suitable for each cell type and probed antibodies.
3.3.9 Western Blotting (Optimised Protocol)
SDS-PAGE gels in the form of Mini-Protean® TGX™ Precast Gels (Any kDa gels,
Bio-Rad Laboratories, CA, USA) were used in all Western blotting experiments.
Protein samples were prepared by diluting the protein lysate sample with Laemmli
sample buffer containing β-mercaptoethanol in a 1:1 ratio. Samples were then heated
for 5 min at 95°C and loaded onto the gels. Pre-stained and unstained ladders were
loaded onto the same gel well.
The protein samples were electrophoresed at 200 V for 45 min using a running buffer
containing 25 mM Tris, 192 mM glycine, 0.1% SDS, pH 8.3 (Bio-Rad Laboratories,
CA, USA) in the cold room at 4°C. PVDF membranes were submerged in 100%
methanol for 10 min on an orbital shaker to activate the membranes. Methanol was
then equalised with an equal volume of transferring buffer (25mM Tris, 0.2M
glycine and 5% methanol) for 10 min. The mixture was then discarded and the
membranes submerged only in the transferring buffer and re-incubated for 10 min on
the orbital shaker.
After running the protein samples, gels were removed, rinsed with molecular grade
distilled water and equilibrated in the transferring buffer for 15 min. Two pieces

67
Rabbit Anti-
TRPV1
Detection
Method
Condition Results Figure
Santa Cruz
Biotechnology
(anti-human
TRPV1)
Western
Dot™ 625 kit
(Biotin-
Streptavidin)
New lot kit. Protein quantity study (40, 30 and 20µg).
Secondary Ab alone control blot. Blocking, dilution: 3% BSA.
Non-specific binding in the secondary alone blot.
High background, dim bands with 20µg, decent with 30µg.
Clearer bands with dry membrane detection.
Figure 3-1
Blocking, 1°Ab and 2°Ab dilution: 2% goat serum+ 5% NFM. Neither signal nor ladder. -
ECL
Loading 30µg protein.
Blocking and 1°Ab dilution: 3% BSA. 2°Ab: in 5% NFM.
2°Ab alone blot. 2°Ab titration (1:5000 vs. 1:10000).
Negative 2°Ab alone control blot. Non-specific binding in
TRPV1 and GAPDH blots. Cleaner background. Better
TRPV1 signal with 1:5000 2°Ab.
Figure 3-2
Protein quantity study (30, 20, 10µg). 2°Ab 1:5000 diluted in
5% NFM. Blocking & 1°Ab: 3% BSA.
Non-specific bands. Strong bands are down the gel
comparing to the ladder.
Figure 3-3
Alomone Labs.
(anti-human
TRPV1)
ECL
Blocking and 1°Ab dilutions: 3% BSA. 2°Ab 1:5000 in 5%
NFM. GAPDH: cell signalling Tech., 1:1000.
Non-specific bands. TRPV1 bands: clear and in place
comparing to ladder. GAPDH: clear with low-background.
Figure 3-4,
A
Blocking, 1° and 2° Abs dilutions in 5% NFM in PBST. Low-background, no non-specific bands. TRPV1: weak.
GAPDH: sharp& specific.
Figure 3-4,
B
Blocking and antibodies dilutions: 5% NFM. Biotinylated
ladder was used to compare.
TRPV1 bands: weak. GAPDH: faint non-specific bands. Figure 3-4,
C
LifeSpan
Biosciences
(anti-rat/
human
TRPV1)
ECL
1°Ab titration study (1:1000- 10000)
Blocking in 5% NFM. Dilutions: PBST or 5% NFM.
TRPV1: ~4-5 bands with the highest dilution 1°Ab.
Diluting 1°Ab in PBST gave multi bands.
Figure 3-6
Anti-TRPV1 titre = 1:10000.
Blocking, 1°Ab and 2°Ab: 3% BSA or 5% NFM or 3% BSA+
5% NFM.
TRPV1 bands: single band was achieved at 5 µg of THP-1
protein with 1:10000 1°Ab, but 4 bands with more protein.
Figure 3-5
Secondary antibody titration study: 1:5000-10000.
Similar results using both dilutions. Titre: 10000. Figure 3-7
Test Cell signalling secondary antibody:1:5000-10000 Clear background and less non-specific bands. Titre: 5000. Figure 3-8
Table 3-3: Western blotting protocols tested to detect TRPV1 in human malignant cell lines and PBMCs
ECL: Enhanced Chemiluminescence; GAPDH: Glyceraldehyde 3-phosphate dehydrogenase; PBST: phosphate buffered saline-tween20; NFM: non-fat milk; 1°Ab: primary antibody; 2°Ab:
secondary antibody. BSA: bovine serum albumin; TRPV1: transient receptor potential vanilloid-1; M.W: molecular weight.

68
of extra thick blot papers and two foam pads for each gel were submerged in the
transferring buffer before assembling the transferring cascade in the following order;
foam pad, blot paper, gel, membrane, blot paper and finally a foam pad on the black
side of the cassette. To remove any air bubbles trapped between layers, gentle strokes
with a plastic roller were performed after adding each layer.
The cassette was then closed firmly and placed inside the transferring tank, black
side of the cassette to the black side of the central core. A frozen cooling unit was
then inserted on the rear of the cassettes to keep the transferring unit cool during the
process. The unit was filled with the transferring buffer, closed and run at 95 V for 1
hr at 4°C in the cold room. Once the protein transferral to the membrane was
completed and verified using the pre-stained ladder, the membranes were removed
and submerged in 100% methanol for 10 min to fix the transferred protein bands. To
remove methanol, membranes were resubmerged in water.
The membranes were then incubated in a blocking solution containing 3% BSA with
5% NFM, dissolved in the PBST for 1 hr, using a gentle motion on an orbital shaker
at room temperature. The membranes were then washed with PBST for 5 min using a
gentle motion on an orbital shaker. After discarding the washing solution, the blot
was then incubated with anti-TRPV1 (LifeSpan Biosciences, WA, USA) diluted
1:10000 in the blocking solution and incubated in the cold room, 4°C overnight (on a
very gentle motion) on an orbital shaker.
The following day, the blots were washed on a fast motioned orbital shaker with
PBST 4 times (2 times for 10 min each, and 2 times for 5 min each). The membranes

69
were then incubated with 1:5000 goat anti-rabbit IgG-HRP-conjugated (Cell
signalling Technology, MA, USA) diluted in the blocking solution for 1 hr, and
again washed as described earlier. The membranes were stained with the Immobilon
TM Western detection kit (Millipore, MA, USA) for 5 min and visualised using a
LAS-3000 Image reader (Fuji, Tokyo, Japan).
The membranes were then re-washed and re-blocked for 20 min and incubated with
anti-GAPDH (Cell signalling Technology, MA, USA), diluted for 1:3000 in the
blocking solution, for 2 hr. Subsequently, membranes were rewashed, stained and
visualised as described earlier.
3.4 Results
3.4.1 Optimisation of the Western Blotting Protocol
Protein samples were isolated from THP-1, U266B1, U937 cells and PBMCs from
healthy subjects. In initial experiments, high background and several non-specific
bands predominated. Therefore, alternative blocking solutions, antibodies and
detection methods were tested and documented. All protocols tested are summarised
in Table 3-3.
3.4.1.1 Detection System Method Selection
The WesternDot™ 625 biotin-streptavidin kit produced high background, with blots
not evenly uniformed and patchy (Figure 3-1) compared to the ECL detection
method, which produced cleaner blots and less background (Figure 3-2). When the
biotin-streptavidin system was used, non-specific binding caused by the secondary
antibody was greater compared to the ECL system (Figure 3-1 vs. Figure 3-2).

70
3.4.1.1 Anti-GAPDH Antibodies Optimisation
The anti-GAPDH (Cell Signalling Technology) antibody produced specific, discrete
bands compared to anti-GAPDH antibody obtained from Santa Cruz Biotechnology,
Figure 3-1: TRPV1 detection attempt using the Biotin-Streptavidin
detection system in THP-1 cells. All antibodies used were supplied by Santa
Cruz Biotechnology. Blocking step and the antibody incubation were
performed in 3% BSA. Different amounts (40, 30 and 20 µg) of THP-1 cell
lysate were investigated. Multiple non-specific (non-TRPV1) bands were
observed at secondary alone, TRPV1 and GAPDH blots (at ~70 & 20 kDa)
with no TRPV1 band (~95 kDa). High- background in all blots was observed.
Figure 3-2: ECL detection method with secondary antibody dilution study,
1:5000 vs. 1:10000 of Santa Cruz Biotechnology in THP-1 cells. Blocking
and primary antibody dilution performed in 3% BSA, secondary antibody in
5% NFM. A clean secondary alone control blot (tested at 1:5000) was noticed.
TRPV1 was detected at ~95 kDa, however many non-specific bands detected
in TRPV1 (~20, 55, 65, 80 and 200 kDa) and GAPDH blots (~65, 80, 90, and
300 kDa). Cleaner background was obtained using this method. A sharper band
was observed using 1:5000 secondary antibody.

71
with reduced non-specific bindings (Figure 3-3 and Figure 3-4). Therefore, the Cell
Signalling Technology anti-GAPDH was used in subsequent experiments.
3.4.1.2 Ladders
All protein bands were shown in kilodaltons (kDa). Loading the biotinylated ladder
(Cell Signalling Technology, MA, USA) as a molecular weight reference resulted in
non-specific bands (Figure 3-4, C). Therefore, it was demonstrated that unstained
MagicMark™XP (Life Technologies, Grand Island, USA), which produced better
visualisation with no cross-interaction with any antibody was used. It is not
biotinylated or composed of two components and ready to use without boiling.
TRPV1 molecular weight was detected ~95-100 kDa according to each anti-TRPV1
supplier’s sheet.
Figure 3-3: Protein quantity study (10, 20 and 30 µg) of THP-1
cell lysate to detect TRPV1 with Santa Cruz anti-TRPV1 using
the ECL method. Blocking step and primary antibody dilutions
were performed in 3% BSA and secondary antibody dilution in 5%
NFM. Very weak TRPV1 band at ~95 kDa with lots of stronger non-
specific bands (~55-75 kDa and 30 kDa) were observed for the
TRPV1 antibody and ~250, 55 and 70 kDa for the GAPDH control.

72
3.4.1.3 Anti-TRPV1 Antibodies Optimisation
Weak TRPV1 signal was detected using the Santa Cruz Biotechnology antibody
(Figure 3-1 to Figure 3-3). Increasing the amount of protein increased the non-
specific binding, with negligible improvement in TRPV1 signal (Figure 3-3).
Improved TRPV1 signal was observed using the Alomone Labs antibody. However,
many non-specific bands were also detected despite testing different blocking
Figure 3-4: TRPV1 detection using Alomone Labs anti-TRPV1
antibody. The blocking and the primary antibodies dilution were
performed in A: 3% BSA. B&C: 5% NFM. The secondary antibody was
diluted in 5% NFM. TRPV1 band was detected (~95 kDa) with other
extra bands ~60, 55, 30 kDa. A TRPV1 dimer was detectable in U266B1
cells. GAPDH showed a clean background with sharp strong bands. C:
Biotinylated ladder was used and showed faint non-specific bands.

73
reagents. NFM minimised the background and the non-specific binding significantly,
but also minimised the intensity of the TRPV1 band (Figure 3-4). Detection of
TRPV1 protein was optimised using the LifeSpan Biosciences primary antibody
(MA, USA) that produced minimal non-specific binding (Figure 3-5). Optimal
results were produced by diluting the primary and secondary antibodies in a blocking
solution containing a mixture of 3% BSA, 5% NFM in PBST (Figure 3-5, B). This
antibody was subsequently titred to determine optimal dilution, which ended up to be
set on 1:10000 (Figure 3-6).
Figure 3-5: Detecting TRPV1 using LifeSpan Biosciences antibody. A
blocking optimisation and protein quantity were also performed. The
blocking and the dilution of the primary and secondary antibodies were
performed in: A: 5% NFM, B: double blocking with 3% BSA+ 5% NFM
in PBST wash. TRPV1 band was strong at ~100 kDa. Three extra bands
with less intensity (~40, 47 and 52 kDa) were observed. C: 3% BSA with
so many non-specific bands.

74
3.4.1.1 Blocking Optimisation
Blocking with a mixture of 2% goat serum and 5% NFM blocked all specific and
non-specific bindings (data not shown). Five percent NFM (Figure 3-4) produced
less non-specific binding and cleaner backgrounds than PBST (Figure 3-6) or 3%
BSA (Figure 3-5, C). However, blocking with a mixture of 3% BSA and 5% NFM in
Figure 3-6: Titration & blocking studies for LifeSpan Biosciences Anti-
TRPV1. Three dilutions tested: 1:1000, 1:5000 and 1:10000 in different
blocking solutions. The blocking step was performed in 5% NFM. The
antibodies dilutions were performed in A: 5% NFM, B: PBST. The titre is
10000. Diluting the antibodies in 5% NFM produced less non-specific
binding and less background than PBST.

75
PBST produced less non-specific binding and cleaner blots using the LifeSpan
Biotechnologies anti-TRPV1 (Figure 3-5, B and Figure 3-7).
3.4.1.2 Secondary Antibody Optimisation
Two goat anti-rabbit HRP-conjugated secondary antibodies (Santa Cruz
Biotechnology, CA, USA and Cell signalling Technology, MA, USA) were assessed
(Figure 3-7 and Figure 3-8). Two dilutions were tested, 1:5000 and 1:10000. The
optimum dilution was 1:10000 for Santa Cruz antibody (Figure 3-7) and 1:5000 for
Figure 3-7: Secondary antibody (Santa Cruz Biotechnology)
titration study. Two dilutions tested A: 1: 5000 or B: 1:10000 with
1:20000 of anti-TRPV1. Similar results were obtained from both
blots; thus the titre is 1:10000.

76
the Cell Signalling antibody (Figure 3-8). The Cell Signalling Technology secondary
antibody produced less background and cleaner blots (Figure 3-8), and therefore was
used for patients’ samples experiments (Chapter 6). No secondary antibody cross-
reaction was observed when using secondary antibody alone as a control for both
antibodies, unless used with the Biotin-streptavidin detection system (Figure 3-1).
3.4.1.3 Protein Quantity Optimisation
TRPV1 was found to be detected in THP-1 and U266B1 cell lysate samples
containing protein as low 5µg (Figure 3-7). However, even using 50µg of normal
human PBMCs protein produced weak expression of TRPV1 (Figure 3-9).
Figure 3-8: Secondary antibody (Cell Signalling Technology) dilution
Study. Secondary Antibody was diluted at A: 1:5000 and B: 1:10000.
Blocking and antibody dilutions were performed in 3% BSA and 5% NFM.
Stronger bands were observed with 1:5000 dilution, with minimal non-specific
binding. The titre was thus set to 1:5000.

77
3.4.2 Detection of TRPV1 in Human PBMCs using the Optimised Method
When testing the optimised protocol on normal PBMCs, background was negligible,
the ladder was distinct and the blots were clear. TRPV1 was detectable in THP-1
protein and barely detectable in some normal PBMCs (Figure 3-9).
Figure 3-9: TRPV1 detected in normal human PBMCs protein. TRPV1 was
successfully detected, though faintly in normal PBMCs protein. Cell Signalling
Technology GAPDH was used. Blocking and antibody dilutions were performed in
3% BSA and 5% NFM. Approximately 30-50µg of protein was loaded. THP-1 protein
was used as a positive control. Santa Cruz Biotechnology secondary antibody was
used.

78
3.5 Discussion
The aim of this chapter was to validate and optimise a Western blotting method to
detect TRPV1 in leukocytes. The optimised method would later be used to detect
TRPV1 protein in human PBMCs and haematological malignant cell lines. TRPV1
detection (~95-100 kDa) using Western blotting with optimised blocking, antibody
titrations and ECL detection was achieved. Significant inconsistency was
encountered with the staining properties of the different anti-TRPV1 antibodies
assessed. These differences make the antibody specificity, available in the market,
questionable. Rabbit Santa Cruz Biotechnology and Alomone Labs anti-TRPV1
antibodies were evaluated (Table 3-1), which produced weak TRPV1 bands along
with lots of non-specific bindings of similar, or in many cases, stronger intensity.
However, with the Lifespan Biosciences anti-TRPV1 antibody, TRPV1 was detected
with significantly better specificity, although sometimes with some faint extra bands
of lower molecular weight. Western blotting conditions were subsequently optimised
including blocking, primary and secondary antibodies titres and diluent, respectively.
Furthermore, non-specific binding caused by excessive protein loading was avoided
by testing different protein quantities for each cell type (Tsang et al. 1989).
The Lifespan Biosciences antibody is affinity purified and used at a very low
concentration (1:10000). To the knowledge of the author, some other Lifespan
Biosciences antibodies have previously been used to detect other TRP channels, but
not TRPV1 (Ryskamp et al. 2011; Yee et al. 2012). The occurrence of some less
intensely stained extra bands of lower molecular weight might be caused by protein
degradation, isoforms of the receptor, or alternative splicing (Faussone-Pellegrini et
al. 2005). When using the rabbit Santa Cruz Biotechnology or Alomone Labs

79
antibodies, the TRPV1 band itself was of less intensity than the extra bands, and
multiple higher and lower molecular weight bands were obvious in the blots.
Another explanation might be due to the difference in the cell type tested compared
to this study, as cells were obtained from different origins. A summary table of the
previous studies using the antibodies employed in the present study and potential
(technical) issues with these previous studies are summarised in Table 3-4.
Some of these studies used cells from experimental animals and it has been found
that TRPV1 composition is not 100 percent identical between human and other
species, which might affect the reactivity of the anti-TRPV1 used and the occurrence
of non-specific binding (Correll et al. 2004; Gavva et al. 2004). Moreover, no
previous studies used human PBMCs or haematological malignant cells, which
makes the optimisation of Western blotting in this chapter both unique and essential
for the further work in this thesis (Chapters 5 and 6).
TRPV1 was previously detected in some cell lines using Western blotting. Of the
twelve studies that employed Santa Cruz Biotechnology (CA, USA) antibodies, the
affinity purified goat anti-TRPV1 antibodies were used in eleven. In ten studies
where TRPV1 bands were detected, the entire blots were not shown, therefore
whether non-specific binding was produced is unknown. These studies detected
TRPV1 in different animal and human cell lines, including human urothelial cancer
cell lines (Amantini et al. 2009; Caprodossi et al. 2011), rabbit corneal epithelial
(Zhang et al. 2007), human keratinocytes cell line HaCaT (Huang et al. 2010),
glioma cell lines NHA, U87, U373 and normal PBMCs (Amantini et al. 2007),

80
Cell Line Rabbit Anti-TRPV1 Issues Study
Human corneal fibroblasts Santa Cruz Biotechnology Whole blot not included
No negative control
Loading control and positive
control only
(Yang et al. 2013)
Human: TRPV1-transfected SH-
SY5Y, skin and brain
Mice: DRG, colon, trigeminal
ganglion
Alomone Labs
Whole blot not included.
Loading control only
(Chen et al. 2012b; Lee et al.
2009; Lilja et al. 2007a;
Shinoda et al. 2011; Sun et al.
2013; Wang et al. 2012)
Human bladder cancer T24 cell
line
Alomone Labs
Whole blot not included.
No negative control.
Loading control and positive
control only.
(Yang et al. 2010)
Mice colon
Alomone Labs TRPV1 band at 150kDa not
95kDa
Whole blot not included
Loading control only
(Wang et al. 2012)
Human focal cortical dysplasia
and tuberous sclerosis
Double stained with both Whole blot not included
Loading control only
(Shu et al. 2013)
Table 3-4: Summary of some studies detecting TRPV1 by Western blot

81
human and mouse mature dendritic cells (Basu and Srivastava 2005; Toth et al.
2009), rat thymocytes and cerebral cortex (Amantini et al. 2004), mouse embryonic
fibroblasts and CMS5 cells (Ghosh and Basu 2010), human corneal fibroblasts (Yang
et al. 2013) and microtubules (Goswami et al. 2006). Only one paper included the
entire blot which showed multiple extra bands of lower molecular weight than
TRPV1 in human stomach mucosa (Faussone-Pellegrini et al. 2005). Therefore, it is
possible that multiple bands have been also detected in the previous listed studies
using the goat anti-TRPV1 antibodies obtained from Santa Cruz Biotechnology (CA,
USA) and are present in the initial whole blots before cutting the desired specific
sections.
In this study, a Santa Cruz rabbit anti-TRPV1 antibody which was purified by a
proprietary rather than by affinity technique, did not detect TRPV1 using the
streptavidin-biotin detection system (Figure 3-1). However, it detected TRPV1 and
multiple extra bands using the ECL detection system (Figure 3-2). It was thought that
antibodies which were not affinity purified have less specificity to the targeted
protein (Couchman 2009). Yang (2013) used the Santa Cruz Biosciences rabbit
antibody without including the whole blot to show if non-specific or extra bands
were present. Thus it is difficult to compare the results. In this chapter, the affinity
purified anti-TRPV1 antibody produced better binding to and specificity for TRPV1
protein with less non-specific bands and cleaner blots.
Ten papers which used Alomone Labs anti-TRPV1 antibodies to detect TRPV1 were
reviewed (Chen et al. 2012b; Lee et al. 2009; Lilja et al. 2007a; Lilja et al. 2007b;
Ma et al. 2011; Shinoda et al. 2011; Shu et al. 2013; Sun et al. 2013; Wang et al.

82
2012; Yang et al. 2010). Two studies only included the entire blot (Lilja et al.
2007b; Ma et al. 2011), whereas, the other studies cut around the TRPV1 bands,
which makes it difficult to conclude if there was any non-specific binding in these
studies. Table 3-4 summarises the studies detected TRPV1 by Western Blot using the
same anti-TRPV1 used in this study. Shu et al. (2013) double stained human focal
cortical dysplasia and tuberous sclerosis with both the Alomone Lab antibody and
the rabbit Santa Cruz Biotechnology anti-TRPV1 without including the entire blot or
any control. Similar extra bands were reported by Lilja et al. (2007b) and a strong
extra band was detected at 65kDa (Shinoda et al. 2011), without specifying the
nature of the bands. Ma et al. (2011) included the entire blot using mice cells without
extra bands, though did not mention the specific blocking or diluent solution used.
Another study detected the TRPV1 band at 150kDa (Wang et al. 2012), whereas non-
glycosylated TRPV1 is supposed to be detected at ~95kDa, and glycosylated TRPV1
at ~113kDa (Vetter et al. 2006). Subsequently, for all of the above, it was difficult to
rely on this antibody for future experiments, though extra bands, whether specifically
or non-specifically bound, were also demonstrated with other anti-TRPV1 antibodies
at ~75kDa (Tian et al. 2006) and ~65kDa (Mandadi et al. 2006). However, the goal
was to find an anti-TRPV1 antibody with better specificity and less cross-reactivity
and non-specific binding.
The anti-GAPDH antibody obtained from Cell signalling Technology produced very
discrete specific bands with clear background, compared to the antibody obtained
from Santa Cruz Biotechnology. Similar results using the Cell Signalling Technology
anti-GAPDH antibody was published previously by Sun et al. (2013) with the same
neat, clean bands. This makes this antibody highly recommended for Western
83
blotting experiments. In contrast, the Santa Cruz Biotechnology anti-GAPDH
antibody was also tested by Ma et al. (2011) without including the whole blot to
check for possible non-specific binding. This hindered the comparison with the
GAPDH results described in this chapter.
Loading a biotinylated ladder as a molecular weight reference when using milk
powder as a blocking or diluting agent resulted in non-specific bands due to the
interaction between the milk’s endogenous biotin with avidin (Jeon et al. 2008). To
avoid this type of cross-reactivity, MagicMark™XP was used, which produced better
visualisation with no cross-interaction with any antibody.
Compared to previous work performed on TRPV1 in the UTAS laboratory, the
following were achieved; a) cleaner blots using the ECL method compared to the
Biotin-streptavidin method used previously, b) three anti-TRPV1 antibodies to detect
TRPV1 were compared and assessed for immunoreactivity, c) two anti-GAPDH
antibodies were compared and assessed for reactivity, d) an optimal blocking
solution was chosen after a series of optimisation experiments, and e) two secondary
antibodies were evaluated for optimal titre and reactivity.
Optimisation of the blocking step came in two stages; 1) blocking free sites on the
membrane, and 2) as a diluent for the primary and secondary antibodies, thus
minimising the cross-reaction between the untargeted protein and the antibodies
(Johnson et al. 1984). By the use of the double blocking mixture containing NFM
with BSA, only specific antibody reactions were clear.

84
In conclusion, a Western blotting protocol to detect TRPV1 was validated and
optimised. This method will be applied in later chapters to investigate TRPV1 in
haematological malignant cell lines and patients’ samples. For such variations in
binding specificity between anti-TRPV1 primary antibodies provided, a necessary
step to monitor any antibody-antigen reaction is to use positive and negative controls
(Sawicka M et al. 2013). In most papers reviewed above, only a few studies reported
positive or negative control to control the specificity of their primary antibody (Yang
et al. 2013; Yang et al. 2010; Zhang et al. 2007). Only affinity purified antibodies
should be used in Western blotting experiments, as antibodies purified by other
methods such as proprietary techniques showed less specificity and lots of non-
specific bindings through the blots. Besides, most studies did not include the entire
blot in their study, making it difficult to compare results or judge the reactivity of the
antibodies (Table 3-4). Data published using Western blotting should be more open
to the fact that many antibodies cause extra bands other than the targeted ones and
these bands should be acknowledged and investigated.

85
4. Chapter 4: Development and Optimisation of a Flow
Cytometric Method for the Detection of TRPV1 Expression in
Human Leukocytes

86
4.1 Abstract
Transient receptor potential vanilloid-1 (TRPV1) is a non-selective cation channel
that detects and integrates noxious and inflammatory signals. TRPV1
immunoreactivity has previously been demonstrated at UTAS using
immunocytochemistry (Saunders et al. 2009). The aim of this study was to develop
and validate a flow cytometric protocol to detect TRPV1 expression in human
leukocytes. Immunophenotyping, accompanied with indirect intracellular detection
of TRPV1, was performed on leukocytes obtained from healthy donors. Three
different rabbit anti-TRPV1 primary antibodies, various blocking protocols and two
isotype controls were assessed. Samples were investigated using the Attune®
Acoustic Focusing Cytometer (Life Technologies, Grand Island, USA), and TRPV1
signal was measured as the median fluorescence intensity (MFI) of each experiment.
Non-specific binding was blocked using a mixture of 10% group AB serum, 1%
Bovine Serum Albumin and 0.05% sodium azide. The Lifespan Biosciences primary
anti-TRPV1 antibody produced the most specific binding, using 0.5μg of antibody
per one million cells. Cells were stained with 1:25 goat anti-rabbit-FITC secondary
antibody. Two types of negative controls, an isotype and secondary antibody alone
(Santa Cruz Biotechnology, CA, USA), were used to distinguish positive from
negative signals. It is recommended that only affinity purified antibodies should be
considered in flow cytometry experiments to detect TRPV1, as antibodies purified by
other methods, such as proprietary techniques, showed less specificity and false
negative results. In conclusion, this study describes for the first time an optimised
flow cytometric method for the detection of TRPV1 in human leukocytes. This
method was applied to the detection of TRPV1 in human leukocytes, and was used in
Chapters 5 and 6 to detect TRPV1 in haematological malignancies.

87
4.2 Introduction
The focus of this chapter was to develop and optimise a method for the detection of
TRPV1 in human PBMCs using flow cytometry. The flow cytometry work was
performed in two stages. Preliminary experiments were conducted at the Pathology
Department, Launceston General Hospital (LGH) using a FACSCalibur™ flow
cytometer (Becton Dickenson, San Jose, USA). Later experiments were performed at
the School of Human Life Sciences, University of Tasmania using an Attune®
Acoustic Focusing Cytometer (Life Technology, Grand Island, USA). In this chapter
only the results obtained from the Attune® Cytometer are presented. FACSCalibur™
cytometer data are presented in Appendix I.
Although several studies have reported and discussed TRPV1 expression detected
using flow cytometry in blood cells from experimental animals (Amantini et al.
2004; Basu and Srivastava 2005; Caprodossi et al. 2011), only one flow-cytometric
study of TRPV1 in human blood cells has been published (Amantini et al. 2007).
This lack of studies reporting TRPV1 in human blood cells, and the use of
inappropriate controls for the flow cytometry experiments in most published animal
studies, specifically a lack of negative controls, meant that reliable detection of
TRPV1 in blood cells from patients with haematological malignancies would require
the development of an entirely new flow cytometric protocol.
As a result, the aim of this chapter was to develop and optimise a flow cytometry
protocol to validate TRPV1 detection in human leukocytes. This method would then
be used to investigate TRPV1 expression in human PBMCs, and later in human

88
haematological malignant cell lines (Chapter 5), and cells from patients with
haematological malignancies (Chapter 6).
4.3 Materials and Methods
4.3.1 Materials
Immunophenotyping
All fluorochrome-conjugated CD markers were purchased from Becton Dickenson
(San Jose, USA). Fluorochromes which were detected by blue and violet lasers,
including CD3-Brilliant Violet™ 421, CD14-V500, CD45-PerCP, CD19-PE, CD13-
Brilliant Violet™ 421, CD33-PE, CD7-PE, CD45-PE-Cy™5, CD20-Brilliant
Violet™ 421, CD38-Brilliant Violet™ 605.
Antibodies
An indirect detection method was used for measuring expression of TRPV1 in
leukocytes. Three TRPV1 primary antibodies (see Table 3-1), and two secondary
antibodies were tested [polyclonal IgG goat anti-rabbit-FITC (Santa Cruz
Biotechnology, CA, USA); polyclonal IgG goat anti-rabbit Alexa Flour® 488 (Life
Technologies, Grand Island, USA)]. Variations in staining properties with different
lot numbers may occur with polyclonal antibodies (Saper 2009), therefore same lot
number of each antibody was confirmed.
Controls
Two types of controls were used for method development; 1) isotype and (2)
secondary antibody (no primary antibody) controls. Leukocytes obtained from a
healthy subject were used as a control to blood cancers patients WBCs (see Chapter

89
6). Two isotype controls were assessed (Table 4-1) and used in the same
quantity/dilution as the primary anti-TRPV1 in all experiments.
Table 4-1: Characteristics of the isotype controls used in the study
Data were provided by the manufacturers’ data sheets. IgG: immunoglobulin-G.
4.3.2 Methods
4.3.2.1 Blood Collection
Peripheral whole blood was obtained from the median or cephalic vein of adult
donors into EDTA collection tubes (Becton Dickinson, San Jose, USA), ethical
approval H0011050. Full blood counts were performed using a Sysmex XS whole
blood analyser (Sysmex Corporation, Kobe, Japan).
4.3.2.2 Flow Cytometer Calibration and Electronic Optimisation
Calibration was set using Attune™ Performance Tracking Beads (Life Technology,
Grand Island, USA). Compensation and photomultiplier tube (PMT) voltages
optimisation step was performed to eliminate fluorescence spectral overlap. Forward
scatter (FSC) and side scatter (SSC) were adjusted for each experiment during the
live acquisition before events recording.
Company Catalogue
number
Host Purity
Santa Cruz
Biotechnology
sc-3888 Normal rabbit IgG Affinity purified
Cell signalling
Technology
2729
Normal rabbit IgG
Affinity purified

90
4.3.2.3 FSC and SSC Optimisation
FSC is considered to be an indirect measure of overall cell size, whereas SSC
represents a direct measure of the cell’s granularity and complexity (Romano et al.
2003). Unstained cells were processed along the stained cells throughout all
experiments and run before the stained cells to set the cell populations (lymphocytes,
monocytes and granulocytes) on the scale and adjust the FSC and SSC (linear)
values. FSC threshold was adjusted to minimise debris.
4.3.2.4 Gating Scheme
Lymphocyte and monocyte populations were gated using a conjugated-CD45 vs.
SSC plot. 1.0 x 10⁶ cells were stained with CD45-PerCP or CD45-PE-Cy™5 to
facilitate gating the main types of leukocytes (granulocytes, monocytes and
lymphocytes), and to gate out debris.
4.3.2.5 PMT Voltage Optimisation and Fluorescence Compensation
Fluorescence spillover is not uncommon in most multicolour experiments. Therefore,
fluorochrome compensation is a crucial step to override the fluorescence emission
spectral overlap (Shapiro and Leif 2003). The compensation was performed using
AbC™ Anti-Mouse Bead Kit (Life Technologies, Grand Island, USA), as per
manufacturer’s instructions. Briefly, ‘component A’ beads were stained with each
fluorochrome and incubated for 15 min at room temperature in the dark. The beads
were then washed with PBS for 5 min at 200 x g, and one drop of ‘component B’
(negative beads) were added to each tube, mixed and analysed. PMT voltages were
adjusted during the compensation setup using unstained beads in each of the single
stained samples to separate signal (positive) from noise (negative) (Maecker and
Trotter 2006). When starting data acquisition, the related detector voltages were

91
adjusted during the live setup phase of data acquisition. The PMT voltages were
adjusted to position the unstained negative cells within the first decade of the
histogram (Maecker and Trotter 2006). Compensation was automatically calculated
by the Attune® Acoustic Focusing software (Life Technologies, Grand Island, USA).
4.3.2.6 Optimisation of Flow Cytometry Protocol to Detect TRPV1
Method optimisation was conducted for fixation/ permeabilisation, blocking, and the
TRPV1 immuno-detection reaction (primary, isotype and secondary antibodies).
Fixation and Permeabilisation
Fixation and permeabilisation procedures were required to allow the TRPV1 primary
antibody to bind to its intracellular epitope. Two commercially available kits
CALTAG™ (Life Technologies, Grand Island, USA) and Cytofix/CytopermTM
(Becton Dickenson, San Jose, USA) were investigated to determine the staining
patterns of TRPV1. The fixation/permeabilisation protocols for both kits were
applied according to suppliers’ instructions, with slight modifications including
staining the CD markers for 10 min and centrifuging cells at 300 x g. Cells were
fixed, permeabilised and washed using a saponin-based wash reagent to ensure cells
permeabilised as the permeabilisation step is reversible.
Assessment of Blocking Reagents
The following general blocking reagents were tested: human AB serum (obtained
from a healthy AB blood group donor), 10% goat serum (Life Technologies, Grand
Island, USA), and FcR blocking reagent (Miltenyi Biotechnology, Cologne,
Germany). The blocking solution was modified in some instances and described in
the results.

92
Assessment of the Primary Antibodies
Three anti-TRPV1 primary antibodies were tested to separate signal from isotype
control. To optimise the primary antibody concentration, a titration study was
conducted for both TRPV1 antibody and the isotype control. Cells were incubated
with 0.5, 1 and 2 µg of primary antibody or isotype control (1:25), diluted in
saponin-based wash (Becton Dickenson, San Jose, USA) to determine the best
separation between signal and background.
Secondary Antibody Titration
Secondary antibody optimisation involved titration studies for both Alexa
Flour®488-conjugated (see Appendix I), and FITC-conjugated polyclonal goat anti-
rabbit secondary antibody. Dilution was performed in the saponin-based wash
(Becton Dickenson, San Jose, USA) to keep the cells permeabilised. Dilution ranged
between 1:25- 1:1000 to choose the optimal titre.
4.3.2.7 Data Acquisition and Analysis
Data acquisition and analysis were completed using the Attune® Acoustic Focusing
software (CA, USA). 10,000 events were acquired for each sample. Median
Fluorescence intensity (MFI) was expressed in arbitrary units on a logarithmic scale.
4.3.2.8 Detection of TRPV1 in Normal Human Leukocytes (Optimised Protocol)
One million cells were surface stained with each of CD3-Brilliant Violet™ 421,
CD14-V500, CD45-PerCP, CD19-PE, CD56-Qdot® 605 as per manufacturer’s
instructions, and incubated for 10 min in the dark at room temperature. Red blood
cells were then lysed by incubating cells in 2 mL FACS Lyse solution (BD

93
Biosciences, San Jose, USA) for 10 min in the dark at room temperature. Cells were
centrifuged at 350 x g for 5 min, then washed in 3 mL PBSA (PBS, 10% FBS, 0.1%
sodium azide) and re-centrifuged for a further 3 min. Cells were fixed and
permeabilised using Cytofix/CytopermTM
(Becton Dickenson, San Jose, USA)
according to manufacturer’s instructions by adding 250 µL/tube of BD
Cytofix/CytopermTM
solution then incubated for 20 min at 4°C. Cells were then
washed twice (1mL/tube/wash), centrifuged for 3 min at 350 x g and the supernatant
was discarded. Non-specific binding sites were then blocked using 50 µL of 10%
human AB blood serum, supplemented with 1% BSA, 0.05% sodium azide and made
up with the saponin-based wash, and incubated for 15 min at room temperature.
After blocking, cells were ready for intracellular staining by incubating the cells with
0.5 µg of Lifespan Biosciences (WA, USA) TRPV1 primary antibody or 0.5 µg of
isotype control (Santa Cruz Biotechnology, CA, USA) (1:25) for 45 min at 4°C.
Cells were then washed twice and stained with 50µL of FITC-conjugated anti-rabbit
secondary antibody (1:25) (Santa Cruz Biotechnology, CA, USA) for 20 min at 4°C,
and again washed twice. Finally, 2.5 mL of cold Ca2+
/ Mg2+
free PBS was added to
each tube prior to acquisition. Cells were run immediately after sample preparation.
4.4 Results
4.4.1 Flow Cytometry Optimisation setup
Compensation and PMT values were adjusted for all fluorochromes used. Spectral
overlap of the fluorochromes was corrected by the Attune® Acoustic software when
adjusting the PMT voltages (Figure 4-1). FSC and SSC were adjusted for each
sample and the three leukocytes populations were located on the linear scale (Figure
4-2).

94
4.4.2 Fixation and Permeabilisation Optimisation
There was no major difference in TRPV1 signal using either the CALTAG™ (Life
Technologies, Grand Island, USA) and Cytofix/CytopermTM
kits (Becton Dickenson,
San Jose, USA) (see Appendix I).
Channel
Figure 4-1: Example of optimised Attune® Cytometer settings using AbC™ beads. Each fluorochrome is detected in a different channel. PMT
values were adjusted for each channel; threshold is the value where debris
was excluded.
Figure 4-2: FSC and SSC electronic optimisation for fixed/
permeabilised cells using the Attune® Flow Cytometer. Optimisation of
the FSC and SSC leads to a clear distinction between the three main
leukocyte populations, lymphocytes, monocytes and granulocytes, and the
exclusion of the debris.

95
4.4.3 Assessment of the Primary Antibodies
Rabbit anti-human TRPV1 antibody #1 (Santa Cruz Biotechnology)
This antibody produced a similar or weaker signal than the isotype control (Figure
4-3). Several blocking solutions were therefore investigated for their potential to
minimise background staining. Blocking with 10% goat serum resulted in the best
separation between TRPV1 signal (positive) and secondary antibody alone (negative)
compared to human AB serum or Fc receptors reagents with Santa Cruz antibody
(Figure 4-4). There was no significant change in TRPV1 signal when using fresh or
frozen AB serum, or when incubating for 30 min or at 4oC. Complete loss of TRPV1
signal was observed at 37oC (data not shown).
The dilution study of the Santa Cruz Biotechnology anti-TRPV1 antibody was
performed on the FACSCaliburTM
Cytometer. The optimum TRPV1 quantity was
1µg of anti-TRPV1 antibody per one million cells (See Appendix I). There was no
Figure 4-3: Isotype control overlapping with TRPV1
signal in human leukocyte. Data demonstrates staining
pattern for isotype control compared with TRPV1 signal
and secondary antibody only (goat anti-rabbit-FITC) (all
antibodies were obtained from Santa Cruz biotechnology,
USA). No separation between isotype control and TRPV1
signal was demonstrated.

96
significant difference in TRPV1 signal when the primary antibody was incubated at
room temperature or 4°C (data not shown). There was no non-specific binding
caused by secondary antibody, but still no separation between TRPV1 and isotype
control signals (Figure 4-3). The isotype control obtained from Cell Signalling
Technology (MA, USA) produced a little improvement in the signal, still not
completely separated from the anti-TRPV1 signal (Figure 4-5).
Rabbit anti-human TRPV1 antibody # 2 (Alomone Labs)
A second primary antibody was tested in an attempt to separate TRPV1 and isotype
control signals. As with antibody #1, 1µg of anti-TRPV1 antibody per one million
cells was tested. Non-specific binding was blocked using 10% goat serum. No
Figure 4-4: Santa Cruz Biotechnology anti-
TRPV1 blocking optimisation using flow
cytometry. Results demonstrate better
staining pattern for C: 10% goat serum with
the best separation between signal and noise
compared to B: Fc-receptor blocking, and A:
human AB serum.

97
separation between isotype control and TRPV1 signal was observed with this
antibody (Figure 4-6).
Figure 4-5: Comparison between two isotype controls vs. Santa Cruz
Biotechnology anti-TRPV1. A: A slight shift to the left was observed with
the Cell Signalling Technology isotype control, but not sufficient to cause
separation from the TRPV1 signal. B: Santa Cruz biotechnology isotype vs.
Cell Signalling Technology isotype histograms overlapping with TRPV1
signal.
Figure 4-6: Alomone Labs anti-TRPV1 signal. Cells were blocked with 10%
goat serum for 15 min at room temperature, stained with 1µg/1 million cells anti-
TRPV1 and 1:25 secondary antibody. No separation between isotype control and
the primary antibody signals was achieved. The isotype control signal overlapped
with the TRPV1 signal.

98
Rabbit anti-human TRPV1 antibody # 3 (LifeSpan Biosciences)
Separation between TRPV1 signal, isotype control and secondary antibody control
was achieved using the LifeSpan Biosciences anti-TRPV1 primary antibody. To
optimise the separation, the same multiple blocking reagents were assessed,
including an AB serum mix (10% human AB serum + 0.1% BSA + 0.05% sodium
azide), goat serum mix (10% goat serum + 0.1% BSA + 0.05% sodium azide) and a
Fc receptor blocking reagent (Miltenyi Biotechnology, Cologne, Germany) mixed
with 10% AB serum. All were diluted in the saponin-based wash (Becton Dickenson,
San Jose, USA). A similar signal pattern when blocking with AB blood serum mix or
goat serum mix were demonstrated (Figure 4-7). However, there was less separation,
although stronger signal, using the FcR blocking reagent with 10% AB serum
(Figure 4-7). Therefore, the AB blood serum mix was chosen to be the blocking
reagent as due to its affordability. It was found that 0.5µg of anti-TRPV1 per one
million cells generated the optimal separation between TRPV1 signal and isotype
control (Figure 4-8).
4.4.4 Secondary Antibody Assessment
Titration studies were performed for Alexa Flour® 488-conjugated secondary
antibody using the FACSCaliburTM
(See Appendix I), and FITC-conjugated
polyclonal goat anti-rabbit secondary antibody (Figure 4-9). There was no difference
between both antibodies, therefore FITC-conjugated polyclonal goat anti-rabbit
secondary antibody was chosen for further experiments due to reduced costs.

99
Figure 4-7: Blocking step optimisation
for anti-TRPV1 (LifeSpan
Biosciences, USA) signal. Similar
separation patterns observed when
blocking with goat or AB serum mixes
between TRPV1 vs. isotype control.
Less separation though stronger signal
using FcR blocking with 10% AB
serum.
Figure 4-8: Dilution study of
LifeSpan Biosciences anti-TRPV1.
A: 0.5µg, B: 1µg, and C: 2µg. The
best separation between TRPV1 signal
and the isotype control was produced
using 0.5µg of antibody.

100
There was no difference in signal when incubating at room temperature or 4°C (data
not shown). There was no significant difference between background staining for
FITC-conjugated secondary antibody controls at dilutions ranging between 1:25 and
1:150. Titre was found to be 1:25 with the brighter TRPV1 signal and optimum
separation from the secondary antibody alone (Figure 4-9).
Figure 4-9: Secondary antibody titration for FITC-goat anti rabbit
(Santa Cruz Biotechnology) using the Attune® Cytometer. Red
histogram represents the secondary antibody alone (negative control),
whereas purple histogram represents the secondary antibody with the
addition of Santa Cruz primary antibody (positive signal). Dilution range
was tested between 1:25-1000. Decreased secondary antibody
concentration was accompanied with decreased positive signal. Brighter
signal with separation from the negative signal was demonstrated at 1:25
secondary antibody dilution.

101
4.4.5 Detection of TRPV1 in Human Normal Leukocytes using the Optimised
Method
When testing the optimised protocol on normal blood obtained from healthy donor, a
separation between TRPV1 signal, isotype control and secondary antibody control
was clearly achieved and reproduced. Typical results of the histograms (Figure 4-10),
and the mean of the MFI of leukocytes (Table 4-2) show that TRPV1 is expressed in
the following order: CD19-B-cells> CD14-monocytes> CD3-T-cells.
Figure 4-10: TRPV1 detection in
normal human WBCs using the
optimised protocol. TRPV1 was
successfully detected in human normal
A: Monocytes (CD14+), B:
Lymphocytes, including CD3 (T-cell)
and CD19 (B-cell) positive cells.

102
4.5 Discussion
The aim of this chapter was to validate and optimise a flow cytometry method to
detect TRPV1 in PBMCs. The optimised method would later be used to detect
TRPV1 in haematological malignant cell lines (Chapter 5) and patients samples
(Chapter 6). TRPV1 was successfully detected in human PBMCs using the Attune®
Acoustic Focusing Cytometer.
The data in this chapter casts doubt on other studies that have detected TRPV1 using
immunofluorescence techniques i.e., flow cytometry, which might impact on the
conclusions previously generated from these studies (Table 4-3). Most published
studies reported either few or inappropriate controls, especially the negative control.
Using a secondary antibody only, or normal serum as a control, as noted in some
studies, is insufficient to control the flow cytometry experiment and test the TRPV1
antibody specificity (Amantini et al. 2004; Amantini et al. 2007; Caprodossi et al.
2011; Zhang et al. 2007). Whether data generated using flow cytometry data is a true
positive, false positive, or false negative, is therefore questionable (Figure 4-3).
Primary antibodies sometimes bind ‘non-specifically’ to different types of antigens,
especially to Fc-receptors, which are expressed on a wide range of human cells, e.g.,
Cells n Mean-MFI (105)
CD14-Monocytes 5 1.12
CD19-B-cells 6 1.36
CD3-T-cells 5 0.96
Table 4-2: Mean-MFI values for different normal
leukocytes subpopulations
CD: cluster of differentiation; MFI: median fluorescence intensity; n=
number of conducted experiments.
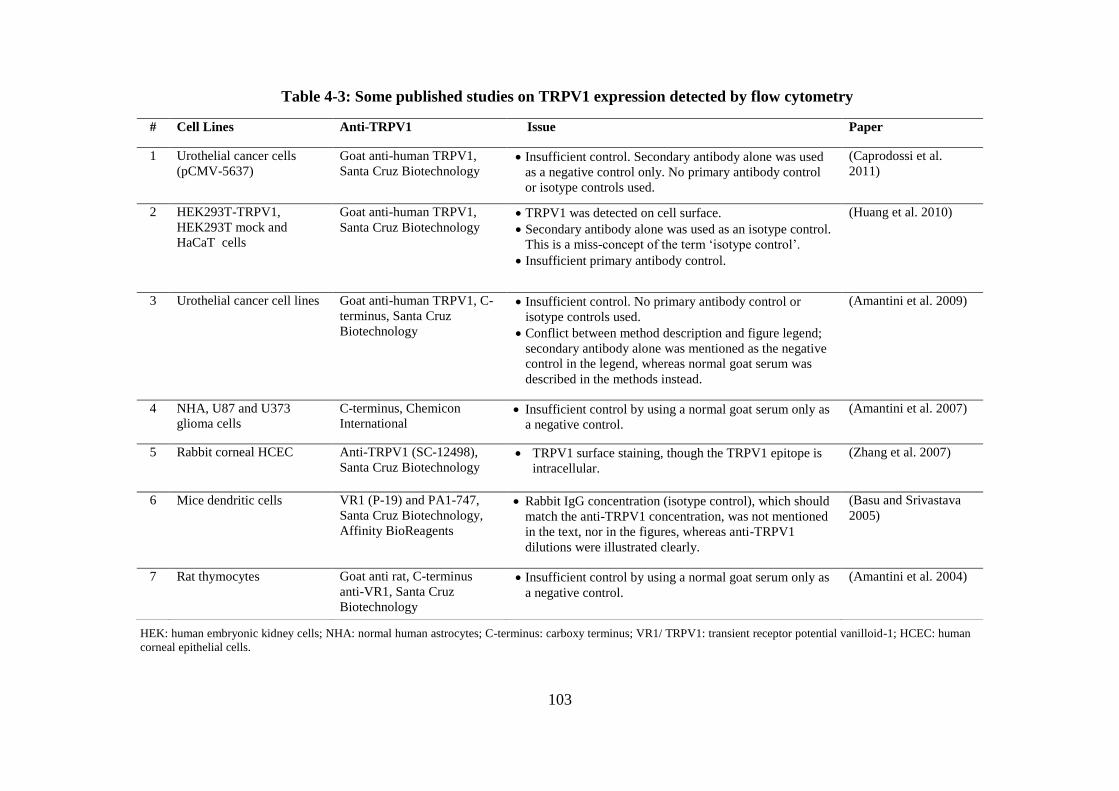
103
# Cell Lines Anti-TRPV1 Issue Paper
1 Urothelial cancer cells
(pCMV-5637)
Goat anti-human TRPV1,
Santa Cruz Biotechnology Insufficient control. Secondary antibody alone was used
as a negative control only. No primary antibody control
or isotype controls used.
(Caprodossi et al.
2011)
2 HEK293T-TRPV1,
HEK293T mock and
HaCaT cells
Goat anti-human TRPV1,
Santa Cruz Biotechnology TRPV1 was detected on cell surface.
Secondary antibody alone was used as an isotype control.
This is a miss-concept of the term ‘isotype control’.
Insufficient primary antibody control.
(Huang et al. 2010)
3 Urothelial cancer cell lines Goat anti-human TRPV1, C-
terminus, Santa Cruz
Biotechnology
Insufficient control. No primary antibody control or
isotype controls used.
Conflict between method description and figure legend;
secondary antibody alone was mentioned as the negative
control in the legend, whereas normal goat serum was
described in the methods instead.
(Amantini et al. 2009)
4 NHA, U87 and U373
glioma cells
C-terminus, Chemicon
International Insufficient control by using a normal goat serum only as
a negative control.
(Amantini et al. 2007)
5 Rabbit corneal HCEC Anti-TRPV1 (SC-12498),
Santa Cruz Biotechnology TRPV1 surface staining, though the TRPV1 epitope is
intracellular.
(Zhang et al. 2007)
6 Mice dendritic cells VR1 (P-19) and PA1-747,
Santa Cruz Biotechnology,
Affinity BioReagents
Rabbit IgG concentration (isotype control), which should
match the anti-TRPV1 concentration, was not mentioned
in the text, nor in the figures, whereas anti-TRPV1
dilutions were illustrated clearly.
(Basu and Srivastava
2005)
7 Rat thymocytes Goat anti rat, C-terminus
anti-VR1, Santa Cruz
Biotechnology
Insufficient control by using a normal goat serum only as
a negative control.
(Amantini et al. 2004)
Table 4-3: Some published studies on TRPV1 expression detected by flow cytometry
HEK: human embryonic kidney cells; NHA: normal human astrocytes; C-terminus: carboxy terminus; VR1/ TRPV1: transient receptor potential vanilloid-1; HCEC: human
corneal epithelial cells.

104
neutrophils, monocytes, macrophages, natural killer cells, B-cells and some T-cell
subsets (Capel et al. 1994; O'Gorman and Thomas 1999). The term ‘non-specific
binding’ is used to identify any antibody binding to an epitope other than the one that
the antibody is generated to bind (Hulspas et al. 2009). However, an epitope can be
present in different antigens from different species, therefore ‘cross-reactivity’
occurs in which the antibody binds to the antigen ‘specifically’, though un-preferably
(Hulspas et al. 2009; Kim et al. 2006a; Oliveira et al. 2001). Blocking Fc-receptors
and using the isotype control to rule out this sort of background is essential to
distinguish ‘false positive’ from true positive signal, especially when the targeted
antigen is expressed in low levels (Hulspas et al. 2009; O'Gorman and Thomas
1999).
An isotype control is an antibody of the same immunoglobulin type, subclass
(isotype) and species as the primary antibody, with either unknown specificity or
raised against an antigen that is known not to be expressed in the cells of interest
(Stewart et al. 1994). It should be produced by the same manufacturing process, and
be of the formulation, concentration, purification and conjugation as the primary
antibody (Lowdell 2001). An isotype control is used to determine if unwanted Fc-
receptor binding occurs (O'Gorman et al. 1993). Some studies misinterpret the term
‘isotype control’ by using the secondary antibody alone as an isotype control (Huang
et al. 2010). Another study used a fixed dilution of isotype control against multiple
dilutions of the primary antibody, without specifying the dilution used for the isotype
control (Basu and Srivastava 2005). The isotype control must be used as a substitute
for the primary antibody, not the secondary antibody, and be tested in the same
dilution as the primary antibody (Stewart et al. 1994). Furthermore, some studies

105
measured TRPV1 expression externally (surface staining). However, the TRPV1 C-
and N- termini are both intracellular (see Chapter 1), and the antibodies used in these
studies were designed to detect TRPV1 on one of these epitope sites (Huang et al.
2010; Zhang et al. 2007). Based on the lack of proper controls discussed previously,
the results obtained from these studies need to be re-evaluated.
In this chapter, separating the isotype control from the TRPV1 signal in normal
PBMCs was challenging. In order to resolve this problem, a series of experiments
were conducted. These involved adding a blocking step to block Fc-receptors,
evaluating different isotype controls, testing different primary antibodies to enhance
the TRPV1 positive signal by more specific antibody-antigen binding, thus
separating the TRPV1 from isotype and secondary antibody signals, and finally,
performing dilution studies for the primary and secondary antibodies to determine
optimum separation between the isotype control, TRPV1 and secondary antibody
histograms.
Titrating primary and secondary antibodies was essential to obtain the highest
positive signal with the lowest negative signal possible on the logarithmic scale
(Srivastava et al. 1992). In the present study, different primary antibodies warrant
variable staining properties and specificity and as a result produce different results.
In flow cytometry, the primary antibody that demonstrates the same staining pattern
as the isotype control arises difficulties in separating specific from non-specific
signals.

106
Santa Cruz Biotechnology and Alomone Labs anti-TRPV1 antibodies tested in this
study overlapped with the isotype control indicating non-specific staining and low
specificity. Similar non-specific binding was previously reported with
immunohistochemistry using the same antibodies when testing TRPV1-/-
mice
bladder tissue, resulting in false positive results (Everaerts et al. 2009). Similar to
results obtained by Western blot (Chapter 3), the LifeSpan Biosciences anti-TRPV1
antibody was found to produce more specific binding than the other two antibodies.
It has been suggested that antibodies which are not affinity purified have less
specificity to the targeted protein (Couchman 2009). The Santa Cruz Biotechnology
anti-TRPV1 antibody was purified using proprietary techniques, whereas the isotype
control from the same manufacturer was affinity purified. This difference in the
antibody purity might have an impact and caused the variation in the binding
specificity of the two antibodies, affecting the final result.
Although the Alomone Labs anti-TRPV1 antibody was affinity purified, according to
the manufacturer, its binding capacity was insufficient to separate the TRPV1 signal
from the isotype control, indicating other unknown factors causing the lack of
specificity for TRPV1 by some antibodies compared to others. To the best of our
knowledge, no studies have published TRPV1 expression by flow cytometry using
the LifeSpan Biosciences anti-TRPV1, which appeared to be a superior antibody.
In order to check the specificity of the primary antibody, knockdown/knockout cells
should be used as a negative control (Couchman 2009; Shim et al. 2007).
Unfortunately, its not always affordable/applicable to find positive and negative
subpopulations of the same cell type, which might be a limitation for these types of

107
studies (O'Gorman et al. 1993). This is more convenient for animal experiments than
for human studies. Another alternative is to find a human tissue or cell type that does
not express TRPV1. In an attempt to find a TRPV1-negative cell line to use as a
negative control, RAW264.7 cells, TRPV1-transfected (Tetracycline on/off system)
and un-transfected human embryonic kidney cells (HEK293) were investigated.
However, they were all found to express TRPV1 (see section 5.4.2). Thus, in this
chapter, two types of negative controls for flow cytometry experiments, i.e.
secondary antibody alone and isotype control, were employed.
TRPV1 was detected in normal human leukocytes using the flow cytometry
technique optimised in this chapter. The expression level varied between sub-
populations of PBMCs (CD19-B-cells> CD14-monocytes> CD3-T-cells). The
difference in TRPV1 expression has been previously reported in healthy PBMCs
donors using immunocytochemistry (Lai et al. 1998; Saunders et al. 2007). This
suggests a unique role for TRPV1 in each of the leukocyte subsets (Saunders et al.
2009).
In conclusion, a flow cytometric method to measure TRPV1 expression in human
PBMCs was optimised by evaluating a number of primary, secondary antibodies,
isotype controls, and blocking solutions. As described in Chapter 3, only affinity
purified antibodies should be considered in flow cytometry experiments to detect
TRPV1, as antibodies purified by other methods such as proprietary techniques
showed less specificity and false negative results, compared to the isotype control.
Two types of negative controls were used to distinguish positive from negative

108
results. This method was applied to detect TRPV1 on various cells and patients blood
samples in the remaining two results chapters of this thesis.

109
5. Chapter 5: TRPV1 Expression in Human Haematological
Malignancy Cell Lines

110
5.1 Abstract
TRPV1 is a non-selective cation channel activated by a variety of stimuli. Increased
expression of TRPV1 is associated with several cancers. The aim of this study was to
determine the level of TRPV1 expression in malignant haematological cell lines as
this has previously not been investigated. Three cell lines, THP-1, U266B1 and
U937, were investigated using flow cytometry (Attune® Acoustic Focusing
Cytometer, Life Technologies, Grand Island, USA) and Western blotting. Other cell
lines which had previously been used as a source of TRPV1 negative cells,
untransfected, hTRPV1-transfected HEK293 (tetracycline off) and RAW264.7, were
also reassessed for TRPV1 expression. Increased TRPV1 expression was shown in
the malignant haematological cell lines compared to normal peripheral blood
mononuclear cells (PBMCs) (Ratio of median fluorescence intensity (MFI) = (MFI
cell line) / (MFI normal PBMCs) as follows: THP-1= 2.5, U266B1= 2.3, U937= 1.5.
TRPV1 was also surprisingly detected in untransfected, hTRPV1-transfected
(tetracycline off) HEK293 and RAW264.7 cells. A TRPV1 monomer (~95kDa) was
found to be strongly expressed in both THP-1 and U266B1 cells, but weaker in U937
cells using Western blotting. A TRPV1 dimer was also detected in U266B1 cells,
which might be due to the presence of an unknown TRPV1 isoform, or as a
consequence of insufficient denaturation time during the Western blotting process.
These results strongly suggest that TRPV1 is not uniformly expressed in different
cell lines. In conclusion, increased expression of TRPV1 was detected in THP-1,
U266B1 and U937 malignant haematological cells, compared to PBMCs from
healthy subjects. Furthermore, it is strongly recommended that HEK293 and
RAW264.7 cells should not be used as negative controls for experiments involving
anti-TRPV1 as they appear to express TRPV1.

111
5.2 Introduction
There are few previously published studies that have investigated the effect of ion
channel antagonists on the functional properties of the malignant haematological cell
lines, THP-1, U266B1 and U937 (Himi et al. 2012; Maccarrone et al. 2000). The
types of channels expressed in these cells and their precise role remain to be
determined (Kim et al. 1996). The TRPV family, specifically TRPV1, with their
widespread expression in tissues and diverse functions, may be responsible for many
cellular functions (Fernandes et al. 2012; Gunthorpe et al. 2002). Therefore, an
alteration in TRPV1 expression may have potential in the treatment of various
cancers, as disease-related changes in TRPV1 levels have been described previously
in several cancers including cervical cancer and bladder carcinoma (Contassot et al.
2004a; Lazzeri et al. 2005) and reviewed by Gkika and Prevarskaya (2009).
Weak expression of TRPV1 in healthy human PBMCs was demonstrated in Chapters
3 and 4. In this chapter, the optimised flow cytometry and Western blotting protocols
were used to investigate TRPV1 expression in the malignant haematological cell
lines, THP-1, U266B1 and U937. Furthermore, three cell lines, previously reported
to be negative for TRPV1, RAW264.7, hTRPV1-transfected human embryonic
kidney (HEK293, tetracycline off), and untransfected HEK293 cells (Chen et al.
2003; Correll et al. 2004; Inoue et al. 2006; Sarker and Maruyama 2003), were also
investigated by flow cytometry and Western blotting for their suitability to be used as
a negative control for anti-TRPV1 primary antibody.

112
5.3 Materials and Methods
5.3.1 Cells and Cell Culture
Untransfected HEK293 cells were purchased from Sigma-Aldrich (St. Louis, USA).
THP-1, U266B1 and U937 cells were obtained and cultured as previously described
(see section 2.3.1). RAW264.7 mice macrophage cells were a kind gift from Dr.
Rajaraman Eri (University of Tasmania, Launceston, Australia). Human TRPV1-
transfected HEK293 cells were a kind gift from Prof. Peter McIntyre (RMIT
University, Melbourne, Australia), and were transfected according to the tetracycline
on/off system (Gossen and Bujard 1992; Rennel and Gerwins 2002).
5.3.1.1 TRPV1-transfected HEK293 Cell Culture
TRPV1-transfected HEK293 cells were cultured in complete media consisting of
Dulbecco's Modified Eagle Medium (DMEM) (Life Technologies, Grand Island,
USA) and supplemented with 10% tetracycline-free FBS (Clontech, CA, USA). In
addition, 5 µg/mL blasticidin and 100 µg/mL hygromycin (InvivoGen, CA, USA)
were added to select for tetracycline repressor protein and TRPV1 plasmid-
containing cells, respectively.
Frozen cells were thawed and cultured in the complete media as described in Section
2.3.2. Cell harvesting started with the removal of the old media from the flask and
washing of cells by pipetting 5 mL of Hank's Balanced Salt Solution (Life
Technologies, Grand Island, USA) onto the side of the flask, gently agitating to
wash, and the solution discarded. To detach the cells, 2 mL of Hank's Balanced Salt
Solution and 1 mL of TrypLE™ Express (Life Technologies, Grand Island, USA)
were added to the T-75 flask, incubated for 1 min at 37°C, and the cells detached by

113
hitting the flask against a hand with force. Seven millilitres of the complete media
were then added and gently aspirated, covering the base of the flask to dislodge
remaining cells. The cell suspension was transferred to a 15 mL tube, and centrifuged
at 250 x g for 5 min. The supernatant was then discarded and the pellet resuspended
in 10 mL of complete media and washed again. Finally, 5 mL of complete media was
added and the cells counted prior to each experiment.
Tetracycline Treatment
Cells were seeded into a six-well plate at a density of 3 x 10⁵ cells per well and
incubated for 48 hr. Tetracycline was added to a final concentration of 1 µg/mL and
incubated for 5 hr, or 24 hr for protein expression to occur. Cells were lysed, protein
collected, and then measured as described in section 3.3.5.3.
5.3.1.2 Untransfected HEK293 and RAW264.7 Cell Culture
Both types of cell were cultured in DMEM supplemented with 10% heat-inactivated
FBS (Life Technologies, Grand Island, USA). RAW264.7 cells were cultured in
CELLSTAR® hydrophobic cell culture flask (Greiner bio-one, Frickenhausen,
Germany), due to their weak adherence to the standard T-75 flask. Cells were
detached with 3 mL of TrypLE™ Express (Life Technologies, Grand Island, USA)
and continued as described in section 5.3.1.1.
5.3.2 Western Blotting and Flow Cytometry Experiments
The Western blotting (optimised in Chapter 3) and flow cytometry (optimised in
Chapter 4) protocols were applied to THP-1, U266B1, U937, RAW246.7 and
HEK293 (transfected and untransfected) cell lines. THP-1 cells were tested first, and
then used as a positive control for Western blotting experiments (Kunde et al. 2009).
114
5.3.3 Data Collection and Analysis
Median fluorescence intensity (MFI) was measured by flow cytometry using the
Attune® Acoustic Focusing software (Carlsbad, USA). A normal EDTA blood
sample containing the same number of leukocytes was run in parallel with each cell
line experiment as a control. Arbitrary MFI ratio was generated by dividing MFI
(cell line) by MFI (normal cells). The TRPV1 expression was designated as either;
increased (MFI ratio >1.2), decreased (<0.8) or similar (0.8-1.2), compared to normal
leukocytes.
5.4 Results
5.4.1 TRPV1 Expression in Malignant Haematological Cell lines
TRPV1 expression was successfully detected in malignant haematological cell lines
using flow cytometry; THP-1 (Figure 5-1), U266B1 (Figure 5-2) and U937 (Figure
5-3). Stronger expression of TRPV1 was observed for THP-1 and U266B1 cells
compared to U937, and confirmed by Western blotting. TRPV1 monomer was
detected in protein lysate, as low as 5 µg, in THP-1 and U266B1. In addition, a
TRPV1 dimer was also detected using 25 µg of U266B1 protein lysate. However,
TRPV1 was not detected in U937 cells using Western blotting. A combination of the
three malignant haematological cell lines histogram layouts showed that THP-1 cells
produced the strongest signal compared to U266B1 and U937 cells (Figure 5-4,
Table 5-1). Dithiothreitol, was also tested instead of β-mercaptoethanol as a reducing
agent during protein sample preparation, and did not improve the band quality (data
not shown).

115
Figure 5-1: TRPV1 expression was detected in THP-1 cells using Western
blotting and flow cytometry. A: TRPV1 band was detected in protein lysate from
THP-1 cells (5 µg & 15 µg). GAPDH was used as an internal control, B: TRPV1
in THP-1 cells vs. isotype control and secondary antibody alone.
.
Figure 5-2: TRPV1 expression was detected in U266B1 cells by A: Western
blotting, TRPV1 band was detected in protein lysate from U266B1 cells (5 µg).
A TRPV1 dimer was also weakly detected at ~200kDa in U266B1 cells protein.
Note: band visibility might be affected by printing resolution, B: Flow
cytometry, TRPV1 in U266B1 cells vs. isotype control and secondary antibody
alone.

116
Cell line n Mean-MFI (105)
(cell line)
Mean-MFI (105)
(normal leukocytes)
Ratio TRPV1 Expression
(Relative to normal
leukocytes)
THP-1 4 2.38 0.97 2.5 Increased
U266B1 1 1.75 0.76 2.3 Increased
U937 1 1.15 0.76 1.5 Increased
Figure 5-3: TRPV1 expression was
detected in U937 lymphoma cells by
flow cytometry but not Western
blotting. A: TRPV1 in U937 cells vs.
isotype control and secondary antibody
alone, B: No TRPV1 band was detected
in up to 30 µg of protein from U937 cells.
Figure 5-4: Relative expression of
TRPV1 in three haematological
malignant cell lines. THP-1, U266B1
and U937 TRPV1 flow cytometry
histograms vs. isotype controls and
secondary Ab alone. Order of TRPV1
signal strength: THP-1> U266B1> U937
cell (shift to the right).
Table 5-1: Comparison of TRPV1 Mean-MFI in THP-1, U266B1 and U937 cell
lines and normal leukocytes
MFI: Median Fluorescence Intensity; n= number of experiments.

117
5.4.2 TRPV1 Expression in Other Cell lines: A Control Study
5.4.2.1 HEK293 Cells Strongly Express TRPV1
Human TRPV1-transfected HEK293 cells produced similar positive expression of
TRPV1, with or without Tetracycline, with a slight increase in TRPV1 signal for
tetracycline off HEK293 cells (Figure 5-5). Results were confirmed by Western
blotting in which ‘tetracycline off’ transfected-HEK293 cells demonstrated strong
TRPV1 expression (Figure 5-6).
Furthermore, untransfected HEK293 cells were found to strongly express TRPV1
(Figure 5-7). Both transfected (Tetracycline off) and untransfected HEK293 cells
histograms were plotted by flow cytometer demonstrating same TRPV1 positive
pattern (Figure 5-8).
Figure 5-5: TRPV1 expression in TRPV1-
transfected HEK293 cells (tetracycline (tet)
on/off) by flow cytometry. A slight shift to the
right was observed in Tetracycline off HEK293
cells.

118
Figure 5-6: TRPV1 expression in TRPV1-transfected HEK293 cells
(tetracycline off) by Western blotting. Different quantities of protein
were tested. TRPV1 is strongly expressed in transfected HEK293 even
without the addition of tetracycline.
Figure 5-7: TRPV1 expression in untransfected HEK293 cells by
Western blotting. Different quantities of protein were tested for
confirmation. Results prove that TRPV1 is expressed strongly in
untransfected HEK293 cells.
Figure 5-8: TRPV1 expression in
HEK293 cells was confirmed by flow
cytometry. Transfected (tetracycline off)
and untransfected HEK293 cells
demonstrate similar signal fluorescence
intensity compared to THP-1 cells.
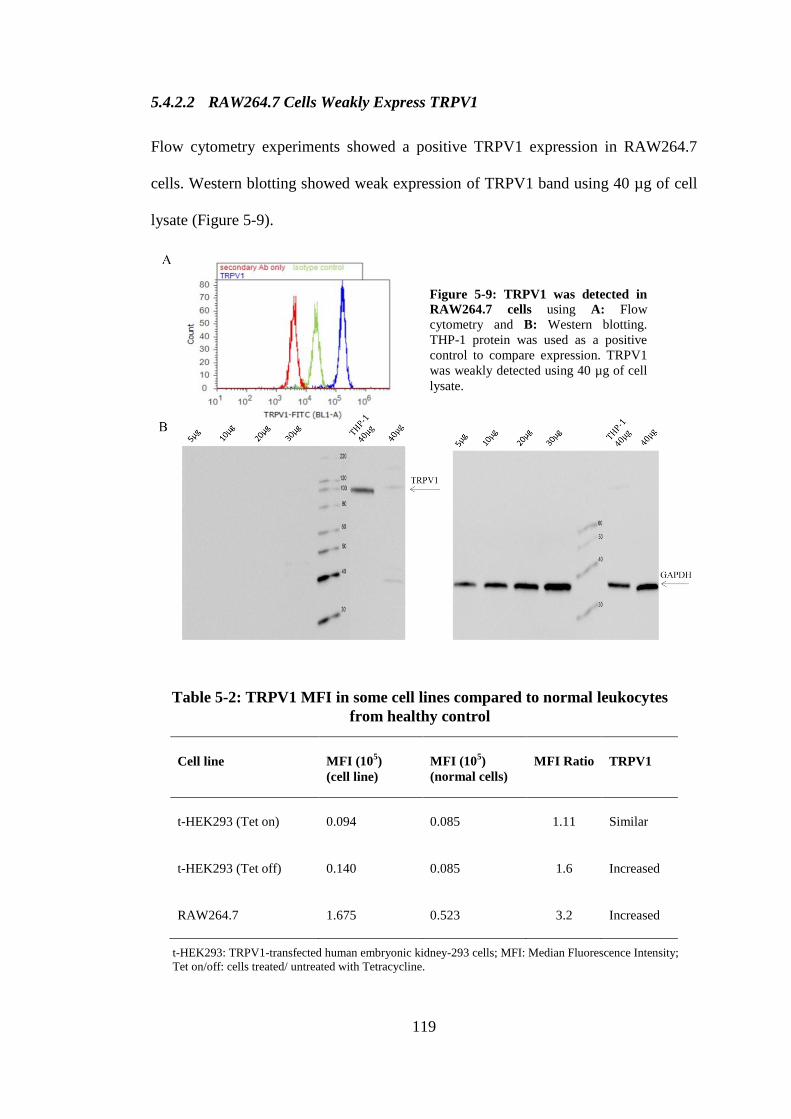
119
5.4.2.2 RAW264.7 Cells Weakly Express TRPV1
Flow cytometry experiments showed a positive TRPV1 expression in RAW264.7
cells. Western blotting showed weak expression of TRPV1 band using 40 µg of cell
lysate (Figure 5-9).
Cell line MFI (105)
(cell line)
MFI (105)
(normal cells)
MFI Ratio TRPV1
t-HEK293 (Tet on) 0.094 0.085 1.11 Similar
t-HEK293 (Tet off) 0.140 0.085 1.6 Increased
RAW264.7 1.675 0.523 3.2 Increased
Figure 5-9: TRPV1 was detected in
RAW264.7 cells using A: Flow
cytometry and B: Western blotting.
THP-1 protein was used as a positive
control to compare expression. TRPV1
was weakly detected using 40 µg of cell
lysate.
Table 5-2: TRPV1 MFI in some cell lines compared to normal leukocytes
from healthy control
t-HEK293: TRPV1-transfected human embryonic kidney-293 cells; MFI: Median Fluorescence Intensity;
Tet on/off: cells treated/ untreated with Tetracycline.

120
5.5 Discussion
In this chapter TRPV1 was successfully detected in the malignant haematological
cell lines, THP-1, U266B1 and U937, using Western blotting and flow cytometry
protocol. Other cell lines were also found to express TRPV1, including
untransfected, hTRPV1-transfected HEK293 (tetracycline off, which switches
TRPV1 transcription off) and RAW264.7 mice macrophages. Previous studies have
reported flow cytometric detection of TRPV1 in human astrocytes (Amantini et al.
2007), human urothelial cancer cells (Amantini et al. 2009), murine dendritic cells
(Basu and Srivastava 2005) and rat thymocytes (Amantini et al. 2004), but not
human leukocytes. To the knowledge of the author, this is the first study to
demonstrate flow cytometric analysis of TRPV1 expression in haematological
malignant cell lines.
There are few published papers that report the investigation of TRPV1 in leukocytes,
TRPV1 has been detected in rat blood neutrophils (Wang et al. 2005), microglia, the
brain-resident macrophage (Kim et al. 2006b; Raivich and Banati 2004) and human
blood leukocytes (Saunders et al. 2007; Spinsanti et al. 2008). TRPV1 protein was
detected in human (Toth et al. 2009) and mice dendritic cells (Basu and Srivastava
2005), though not in mice mRNA (O'Connell et al. 2005). Therefore, these reports
promoted the further investigation of TRPV1 expression in human white blood cells.
In this chapter, three malignant haematological cell lines were investigated. THP-1,
an acute monocytic leukaemia cell line, is most often used as a model for human
monocytes due to the resemblance in their physiological properties (Kim et al. 1996).

121
U937 is a histiocytic human lymphoma cell line (Okimura et al. 2007), whereas
U266B1 is a plasmacytoma (myeloma) of B-cell origin (Schwabe et al. 1994).
The activation of TRPV1 and its role in THP-1 and U937 cells using TRPV1
antagonists have been previously studied (Himi et al. 2012; Maccarrone et al. 2000;
Schilling and Eder 2009b). In the present study, TRPV1 was detected for the first
time using flow cytometry in addition to Western blotting in THP-1, U266B1 and
U937 cells. A TRPV1 monomer (~95kDa), which represents the non-glycosylated
form of the molecule (Vetter et al. 2006) was found to be strongly expressed in both
THP-1 and U266B1 cells using a small amount (5 µg) of protein from cell lysate.
Furthermore, a TRPV1 dimer (~200kDa) was also detected in U266B1 cells. TRPV1
expression in U937 cells was weaker compared to THP-1 and U266B1 cells using
Western blotting. These results strongly suggest that TRPV1 is not uniformly
expressed in different haematological malignant cell lines.
The TRPV1 dimer has previously been reported in synaptic junctional protein
fraction and root ganglia (Goswami et al. 2010; Prevarskaya et al. 2007). The role of
TRPV1, monomer and dimer, in haematological malignant cell lines has yet to be
investigated. This phenomenon might be due to the presence of an unknown TRPV1
larger isoform which requires a longer period for adequate denaturation (i.e., >5
min).
Whilst TRPV1 protein may be involved in a variety of normal physiological
processes (as discussed in Chapter 1), studies have demonstrated that TRPV1 mRNA
and/or protein expression is increased in a variety of inflammatory diseases (Akbar et

122
al. 2008; Contassot et al. 2004a; Geppetti and Trevisani 2004; Jia et al. 2005;
Sadofsky et al. 2012). This raises the possibility that expression of TRPV1 is up-
regulated in some haematological malignancies as a result of a systemic
inflammation.
IL-6, a pro-inflammatory cytokine secreted by the U266B1 myeloma cells, has a
crucial role in inflammation and the stimulation of the immune system (Gabay 2006;
Schwabe et al. 1994; Tanabe et al. 2011). It promotes myeloma cell growth and
consequently, resistance to therapy (Tricot 2002). There is an accumulating evidence
that IL-6 mediates the increase in TRPV1 expression, and conversely, activation of
TRPV1 leads to the release of IL-6 and IL-8 (Malagarie-Cazenave et al. 2011;
Sappington and Calkins 2008; Toth et al. 2009; Zhang et al. 2007). Similarly, IL-1 is
an inflammatory mediator which is also produced by THP-1 cells (Marchand et al.
2005; Yang et al. 2008). TRPV1 mRNA was reported to be produced in the presence
of IL-1α (Sadofsky et al. 2012), whereas IL-1β can act directly to sensitise TRPV1
and increase its susceptibility to noxious heat (Obreja et al. 2002). Furthermore,
tumour necrosis factor-alpha (TNF-α), a major mediator of inflammation, modulates
the activity of TRPV1 and is produced by U937 cells (Grivennikov and Karin 2011;
Jin and Gereau 2006; Moon et al. 2010). Whether TNF-α provokes overexpression of
TRPV1 is unknown. Ultimately, these reports collectively suggest that increased
expression of TRPV1 in U266B1 and THP-1 and U937 cells might be due to the
secretion of IL-6, IL-1 and TNF-α, respectively, from these cells which play a pivotal
role in inflammation and may activate the TRPV1 transcription mechanism. As a
result, inhibiting the production of the these inflammatory mediators (Anderson

123
2005; Gupta et al. 2001; Marchalant et al. 2009; Smith et al. 2001) may dampen the
expression and activation of TRPV1.
TRPV1 expression varies during carcinogenesis (Gkika and Prevarskaya 2009).
Overexpression of TRPV1 was reported in other cancers including glioma (Contassot
et al. 2004a) and human tongue epithelium cancer (Marincsák et al. 2009), whereas
lower expression was reported in urothelial cancer (Kalogris et al. 2010; Lazzeri et
al. 2005). CAP has been reported to induce TRPV1-dependent apoptosis in cancer
cells, such as prostate cancer (Ziglioli et al. 2009). Therefore, increasing TRPV1
expression in blood cancers would create a new therapeutic target to treat such
conditions.
The variations in ion channel expression in malignancies are either due to
transcriptional or translational factors, such as hormones, growth factors or
alternatively spliced isoforms (Reynolds and Kyprianou 2006). This causes changes
to the amount of Ca2+
entering the cell, leading to alterations in essential processes of
tumour growth, such as proliferation, apoptosis and migration (Gkika and
Prevarskaya 2009). Sustained high Ca2+
influx promotes the activation of proteases,
phospholipases and the loss of mitochondrial function (Lin et al. 2004; Orrenius et al.
2007; Skryma et al. 2000). For example, the decrease in TRPV1 expression in
aggressive tumours such as urothelium transitional cell carcinoma reduces the release
of Ca2+
, resulting in increased resistance to apoptosis (Gkika and Prevarskaya 2009;
Lazzeri et al. 2005).

124
TRPV1 expression levels may correlate with malignancy progression although
evidence suggests this may be either positively, as in prostate cancer (Sánchez et al.
2006), negatively as in bladder carcinoma (Lazzeri et al. 2005) and glioma (Amantini
et al. 2007), or with no change as in tongue squamous cell carcinoma (Marincsák et
al. 2009). Furthermore, a negative prognostic factor and a short patient survival rate
were described with TRPV1 downregulation in bladder (Kalogris et al. 2010), and
hepatocellular carcinoma (Miao et al. 2008). Moreover, a protective role of TRPV1
was exhibited in some malignancies, such as skin carcinoma (Bode et al. 2009) and
urothelial cancer (Caprodossi et al. 2011). The role of TRPV1 as a prognostic factor
in haematological malignancies has yet to be investigated. In this chapter, TRPV1
was found to be overexpressed in malignant blood cell lines compared to normal
cells. This may suggest a positive correlation between TRPV1 and blood cancer
progression. Whether the same effect is valid for patients, has yet to be investigated
(see Chapter 6).
The other major finding of this chapter was that TRPV1 expression was observed in
untransfected and human TRPV1-transfected HEK293 cells (tetracycline off) and
RAW264.7 cells. This is in direct contrast to other studies that reported TRPV1 to be
absent from these cells (Chen et al. 2003; Correll et al. 2004; Inoue et al. 2006; Ma et
al. 2011; Sarker and Maruyama 2003; Tsuji et al. 2010). Furthermore, expression of
TRPV1 was found to be variable in these cells, using flow cytometry and Western
blotting.
HEK293 cells are a broadly used epithelial cell line derived from human embryonic
kidney cells and is used for many years in different experimental models, due to its

125
easy growing and transfecting properties (Thomas and Smart 2005). HEK293 cells
are usually transfected with TRPV1 to study its functionality in human cells
(Mandadi et al. 2006; Mergler et al. 2012; Riera et al. 2007; Tian et al. 2006; Wen et
al. 2012; Xu et al. 2007b). TRPV1-transfected HEK293 cells, either tetracycline on
or off, were found to be strongly positive to TRPV1. Some extra bands of lower
molecular weight were also detected by Western blotting. These may be due to
protein degradation or potentially yet to be described TRPV1 isoforms (Faussone-
Pellegrini et al. 2005). To further investigate TRPV1 expression in HEK293 cells,
untransfected HEK293 cells, which have been previously reported to be negative for
TRPV1 (Correll et al. 2004), also demonstrated strong TRPV1 expression. The
reasons for discrepancies with earlier studies is unknown, but may be due to the
variation in the specificity of the anti-TRPV1 antibodies used to detect TRPV1, as
different primary antibodies were used in previous studies (e.g., Alomone Labs,
Jerusalem, Israel; Abcam, Cambridge, UK) compared to the antibody used in the
present study (Lifespan Biosciences, WA, USA). Moreover, it may be that TRPV1
expression detected by Western blotting is significantly and gradually increased with
accelerated growth rate and high confluence of the cell culture (Marincsák et al.
2009). Therefore, the time when the cells were harvested and used might impact the
TRPV1 detection levels. In this chapter, HEK293 and RAW264.7 cells were
harvested as recommended when they reached more than 80% confluence.
Untransfected HEK293 cells were used within 9 passages, TRPV1-transfected
HEK293 within 17 passages and RAW264.7 cells within 6 passages. Further tests,
including Na+ and/or Ca
2+ response to CAP in these cells warranted to prove
functional TRPV1 expression in HEK293 cells.

126
Previous Western blotting studies (20 µg of protein lysate) reported that RAW264.7
cells do not express TRPV1 (Chen et al. 2003; Ma et al. 2011). Interestingly, in the
current study, TRPV1 was not detected using 20 µg of protein lysate, however was
weakly expressed using 40 µg. These data confirm the ubiquitous distribution of
TRPV1, as there appear to be no cells that do not express TRPV1 (Cortright and
Szallasi 2004; Fernandes et al. 2012). Hence, negative controls are still a major
problem. Screening a wide range of potentially TRPV1-negative cells to be used as
negative controls is costly and time-consuming. Thus, TRPV1 knock down cells
should be considered for human studies.
In conclusion, increased expression of TRPV1 was detected in THP-1, U266B1 and
U937 malignant haematological cells, compared to normal PBMCs. Therefore, a
therapeutic approach should be considered to investigate the implications of such
increased expression on these cells and consequently in patients. Furthermore, some
cell lines which were reported as TRPV1-negative were found to express TRPV1. As
a consequence, HEK293 and RAW264.7 cells should not be used as negative
controls for anti-TRPV1 antibody experiments without further examination of
TRPV1 expression and function in these cells using other techniques such as PCR
and Ca2+
imaging.

127
6. Chapter 6: TRPV1 Expression in Patients with Haematological
Malignancies
128
6.1 Abstract
Increased expression of TRPV1 is associated with several cancers, including those of
the pancreas, tongue and glioma. The aim of this study was to investigate TRPV1
expression and its association with inflammation in patients with haematological
malignancies. TRPV1 expression was measured using flow cytometry (Attune®
Acoustic Focusing Cytometer, Life Technologies, Grand Island, USA) and Western
blotting in 49 patients with haematological malignancies. The patient population (age
31-85 yrs; M:F, 28:21) was divided into three groups: B-cell Non-Hodgkin’s
lymphoma (B-NHL, n=28), multiple myeloma (MM, n=12) and others (n=9),
comprising myeloproliferative disorder (MPD, n=4), peripheral T-cell lymphoma not
otherwise specified (PTCL-NOS, n=1), and other leukaemias (n=4). Blood and
protein samples from gender-matched healthy controls (n=21) were analysed in
parallel with patient samples. C-reactive protein (CRP) was used as a marker of
inflammation. TRPV1 was detected in all patients and healthy controls using flow
cytometry, but not Western blotting. Using flow cytometry, a sub-group of patients
(4/49=8.2%, MM=2, B-NHL=2) demonstrated increased expression of TRPV1
relative to the remainder of the cohort. TRPV1 was found to be similar to the control
group for 91.8% of all patients. There were no significant differences in TRPV1
expression between MM and B-NHL patients, or between de novo (untreated)
patients and those undergoing treatment. Using Western blotting, TRPV1 (~95kDa
band) was only detected in one MM and four B-NHL patients. A 240kDa band was
also detected in both a B-NHL and a MM patient. C-reactive protein was elevated
(≥5 mg/L) in 25% of patients, but was not associated with higher TRPV1 expression.
In conclusion, inflammation may increase TRPV1 expression in some diseases, but
does not appear to do so in the blood cancers.

129
6.2 Introduction
TRPV1 expression and activity have been extensively studied in various
malignancies over the last decade. Interestingly overexpression of TRPV1 has been
reported in some cancers, including glioma (Contassot et al. 2004a) and human
tongue epithelium cancer (Marincsák et al. 2009). Furthermore, increased expression
of TRPV1 has been demonstrated in THP-1, U266B1 and U937 malignant
haematological cell lines, compared to normal PBMCs (see Chapter 5). In this
chapter, samples were collected from patients with haematological malignancies (de
novo and under treatment), and investigated for TRPV1 expression using optimised
Western blotting and flow cytometry protocols.
Changes to the expression of TRPV1 can provide a better understanding on the
therapeutic and the physiological understanding of the TRPV1 and its relationship to
cancer mechanisms (Gunthorpe and Chizh 2009; Khairatkar-Joshi and Szallasi 2009;
Pal et al. 2009; Tsuji et al. 2010). It may become a target for the development of new
drugs to treat patients with blood cancers. Thus, the aim of this chapter was to
compare the TRPV1 expression between patients with different haematological
malignancies and normal subjects.
6.3 Materials and Methods
Blood collection (see sections 3.3.5.1 and 4.3.2.1), sample processing procedure
(sections 3.4.2 and 4.3.2.8), ethical approval (section 3.3.4), materials and methods
(sections 3.3 and 4.3) were all previously outlined in chapters 3 and 4.

130
Blood samples were collected at the Launceston General Hospital. Patients with
haematological malignancies were consented to participate in this study, with each
patient and control subject was given a unique identification number (IDN). For this
part of the study, sample processing commenced in the Haematology Laboratory at
UTAS within 2 hr following collection. Protein samples were isolated (Sections
3.3.5.3 and 3.3.6) and stored at -20°C to perform Western blotting (Section 3.3.9).
Samples used for flow cytometry were processed, run and data was collected in the
same day of blood collection (within 6-8 hr of collection). Controls were normal
subjects with no history of malignancies, age- and gender-matched with the patient
for each experiment. Control samples were run in parallel with patients’ samples.
For gating purposes using flow cytometry, approximately 3000 events were acquired
for the control and the patient samples in the desired gate, then MFI value was
obtained by the Attune® Acoustic Focusing software (Carlsbad, USA). Arbitrary
MFI ratio was calculated by dividing the MFI (patient) by MFI (control).
C-reactive protein (CRP) was used as an indicator of inflammation and was
performed at the Launceston General Hospital Pathology Department using a latex
particle enhanced turbidimetric immunoassay method (CRP Vario, Abbott
Laboratories, Irving, USA). The CRP normal range using this method is <5 mg/L.
6.4 Results
6.4.1 General Characteristics of Patients and Controls
Forty-nine samples from patients with haematological malignancies and 21 samples
from age- and gender-matched control subjects were obtained (Table 6-1). Two

131
control samples were excluded, one because of a clotted sample and the other due to
the subsequent diagnosis of haemochromatosis. Patients diagnosed with
myeloproliferative disorders (MPD) included (n=1 in each case) myelocytic
leukaemia (CML), chronic myelomonocytic leukaemia (CMML) and essential
thrombocythaemia (ET). CRP values were obtained for 44/49 patients, (range: 1-106
mg/L). CRP was elevated (≥5 mg/L) in 25% of the patients.
Characteristics
Age Years (range) 31- 85
Patient Gender Male
Female
28
21
Subjects De novo
Under treatment
Control
12
37
21
Diagnosis B-NHL
MM
Acute Monocytic Leukaemia
MPD
HCL
ALL
PTCL-NOS
28
12
2
4
1
1
1
6.4.2 Detection of TRPV1 using Flow cytometry
Based on the distribution of the MFI ratio for all patients (Figure 6-1), TRPV1
expression was arbitrarily considered to be increased when the MFI ratio was >2.
MM: multiple myeloma; B-NHL: B- Cell Non-Hodgkin’s lymphoma; MPD:
Myeloproliferative Disorder; HCL: Hairy-Cell Leukaemia; ALL: Acute
Lymphoblastic Leukaemia; PTCL-NOS: Peripheral T-cell lymphoma/ not
otherwise specified.
Table 6-1: General characteristics of patients with
haematological malignancies

132
Increased TRPV1 expression was detected in 4/49 patients. Of these, 2 had MM and
2 B-NHL. Of the 24 under treatment and four de novo B-NHL patients, TRPV1 was
found to be similar (n=25), and increased (n=2, under treatment patients) compared
to healthy controls (Table 6-2).
Furthermore, with the 9 under treatment and 3 de novo MM patients, TRPV1
expression was found to be similar (n=10), and increased (n=2, a de novo and an
under treatment patient) compared to controls (Table 6-3). TRPV1 in patients with
other haematological malignancies (n=9) were all similar to normal controls (Table
6-4). TRPV1 was found to be similar to the control group in 91.8% of patients. The
four patients with increased TRPV1-MFI ratios have the highest MFI values (mean±
SD; 308783± 145474), relative to other patients (mean± SD; 154178± 100242) and
accounted for 8.2% of the patients.
All
Patie
nts
De n
ovo
Under
-trea
tmen
t0
1
2
3
4
TRP
V1
Rat
io=
MFI
(al
l pat
ient
s)/ M
FI (
Con
trol
)
Figure 6-1: TRPV1 expression in patients with haematological
malignancies. TRPV1 is expressed relative to a control for each
patient. TRPV1 expression was considered increased when MFI ratio
>2.

133
0 10 20 30 40
Other (9)
MM (12)
B-NHL (28)
Treated (36)
De novo (13)
All cancers (49)
Control (20)
MFI (x105)
All
Con
trols
All
B-N
HL
Con
trol (
D)
B-N
HL (D
)
Con
trol (
T)
B-N
HL (T
)0
1
2
3
4
TR
PV
1 M
FI
(x 1
05 )
in B
-NH
L
All
B-N
HL
B-N
HL (D
)
B-N
HL (T
)
0
1
2
3
4
TR
PV
1 R
atio
MF
I (B
-NH
L)/
MF
I (C
ontr
ol)
Figure 6-2: TRPV1 expression for all patients with haematological
malignancies vs. controls. Boxes represent mean-MFI with the lines
representing the minimum and maximum values. The y-axis represents the
collected patients cases (number). There were no significant differences in
TRPV1 expression between MM and B-NHL patients, or between de novo
patients and those undergoing treatment.
Figure 6-3: TRPV1 expression in patients with B-NHL. TRPV1 is
expressed relative to a control for each patient. TRPV1 expression was
considered to be increased when MFI ratio >2. D: de novo, T: under
treatment patients

134
Patients Control Subjects TRPV1 Expression
Status IDN Age (Years) Gender MFI (105) CRP (mg/L) IDN MFI (10
5) MFI Ratio
De novo
P20 74 M 2.00 58 C10 1.76 1.14
P31 55 M 0.79 2 C14 1.23 0.64
P33 62 F 1.58 2 C12 1.69 0.93
P49 83 F 1.19 3 C21 1.44 0.83
Under-
treatment
P03 80 F 0.95 8 C02 0.89 1.07
P10 71 F 1.54 4 C07 1.32 1.17
P11 70 F 1.69 1 C07 1.20 1.41
P12 31 M 1.87 NA C09 1.30 1.44
P13 29 M 1.56 2 C09 1.29 1.21
P14 41 M 1.36 4 C09 1.21 1.13
P15 45 F 1.55 1 C09 1.17 1.33
P19 68 M 1.67 60 C09 1.22 1.37
P22 65 M 1.97 7 C10 1.71 1.15
P23 85 F 1.72 1 C11 1.43 1.20
P25 77 F 3.43 19 C11 1.39 2.47*
P27 70 M 1.35 3 C13 0.97 1.40
P29 77 M 1.81 15 C13 0.93 1.94
P30 56 M 2.10 4 C14 1.21 1.73
P32 65 F 1.26 3 C12 1.73 0.73
P34 80 F 1.54 4 C12 1.65 0.94
P36 79 M 2.16 1 C16 2.38 0.91
P37 79 F 2.73 3 C15 1.00 2.73*
P38 72 M 2.12 1 C17 2.38 0.89
P40 46 M 2.35 4 C17 2.28 1.03
P41 76 M 2.42 3 C16 2.14 1.13
P42 78 M 2.29 1 C16 2.13 1.08
P44 65 F 1.57 1 C19 2.04 0.77
P45 73 M 1.73 5 C18 1.37 1.26
IDN: patient/control identification number (P: patient, C: control); MFI: Median Fluorescence Intensity; CRP: C-reactive protein; NA: not available data; *:
increase in TRPV1; M: male, F: female.
Table 6-2: Characteristics of B-NHL patients compared to control subjects used for
analysis of TRPV1 expression by flow cytometry

135
Patients Control Subjects TRPV1 Expression
Status IDN Age
(Years)
Gender MFI (105) CRP
(mg/L)
IDN MFI (105) MFI Ratio
De novo
P09 82 M 1.13 4 C05 1.12 1.01
P21 73 M 1.16 3 C10 1.55 0.75
P35 72 F 3.57 5 C12 1.17 3.05*
Under-
treatment
P02 57 M 0.92 1 C01 1.04 0.88
P04 67 F 0.86 1 C03 0.68 1.27
P05 57 F 1.20 1 C06 1.31 0.92
P06 69 F 1.08 3 C06 1.33 0.81
P07 68 F 0.89 2 C06 1.31 0.68
P08 71 M 1.11 3 C04 1.28 0.86
P26 66 M 2.03 NA C10 1.68 1.20
P28 58 M 1.62 1 C14 1.24 1.31
P39 73 F 2.62 7 C15 1.00 2.62*
IDN: patient/control identification number (P: patient, C: control); MFI: Median Fluorescence Intensity; CRP: C-reactive protein; NA: non
available data; *: increase in TRPV1; M: male, F: female.
Table 6-3: Characteristics of MM patients compared to control group subjects
used for analysis of TRPV1 expression by flow cytometry

136
Patients Control Subjects TRPV1
Expression
Status IDN Disease Age
(Years)
Gender MFI (105) CRP
(mg/L)
IDN MFI (105) MFI Ratio
De novo
P16 MPD (CMML) 71 M 1.61 NA C09 1.45 1.12
P17 HCL 43 M 0.47 NA C09 1.05 0.45
P18 PTCL -NOS 63 M 1.63 106 C09 1.20 1.36
P47 ALL 68 M 2.81 63 C20 1.60 1.76
P48 AML (M4) 77 F 1.05 NA C21 0.68 1.54
Under-
treatment
P24 MPD 40 F 1.92 1 C11 1.57 1.22
P43 MPD (ET) 64 F 1.98 1 C19 2.02 0.98
P01 MPD (CML) 66 M 0.46 4 C03 0.38 1.21
P46 AML (M4) 43 M 1.33 3 C18 1.25 1.06
Table 6-4: Other haematological malignant cancers patients compared to control subjects used for
analysis of TRPV1 expression by flow cytometry
IDN: patient/control identification number (P: patient, C: control); MFI: Median Fluorescence Intensity; CRP: C-reactive protein; NA: non available data; M: male,
F: female; HCL: Hairy-Cell Leukaemia; PTCL-NOS: Peripheral T-cell lymphoma/ not otherwise specified; ALL: Acute Lymphocytic Leukaemia; AML (M4):
Acute Myelomonocytic Leukaemia; MPD: Myeloproliferative Disorder; CML: chronic Myelocytic Leukaemia; CMML: Chronic Myelomonocytic Leukaemia; ET:
Essential thrombocythaemia.

137
All
Con
trols
All
MM
MM
(D)
Con
trol (
D)
MM
(T)
Con
trol (
T)0
1
2
3
4
TR
PV
1 M
FI
(x 1
05 )
in M
M
All
MM
MM
(ND
)
MM
(UT)
0
1
2
3
4
TR
PV
1 R
atio
MF
I (M
M)/
MF
I (C
ontr
ol)
Figure 6-4: TRPV1 expression in patients with MM. TRPV1 is
expressed relative to a control for each patient. TRPV1 expression was
considered to be increased when MFI ratio >2. D: de novo, T: under-
treatment.

138
Contro
l (A
ll)
Oth
ers (
All)
Oth
ers (
D)
Oth
ers (
T)
Contro
l (D
)
Contro
l (T)
0
1
2
3
4
TR
PV
1 M
FI
(x 1
05 ) in
oth
er
hae
mat
olo
gic
al m
alig
nan
cies
All
Patie
nts
De no
vo
Und
er-tr
eatm
ent
0
1
2
3
4
TR
PV
1 R
atio
MF
I (o
ther
can
cers
)/
MF
I (C
ontr
ol)
Male
Female
0
1
2
3
4
TR
PV
1 M
FI
Rat
io
Figure 6-6: TRPV1 MFI ratio between males and females.
TRPV1 expression was considered increased when MFI ratio >2 or
similar ≤2.
Figure 6-5: TRPV1 expression in patients with other blood
cancers. TRPV1 is expressed relative to a control for each
patient. TRPV1 expression was considered to be increased
when MFI ratio >2. D: de novo, T: under-treatment.

139
6.4.3 TRPV1 Detection Using Western blotting
Western blotting data was not obtainable from three samples due to insufficient
isolation of protein (patients 10, 16 and 19). Forty micrograms of protein lysate was
loaded for all control and patient samples. TRPV1 monomer (~95kDa) was detected
in five patients (MM=1, B-NHL=4), whereas another TRPV1 specific band was
detected at ~240kDa in 1 MM and 1 B-NHL patient (Figure 6-7, Table 6-5). TRPV1
was not detected in the remaining patient or control samples.
Figure 6-7: TRPV1 expression in PBMCs protein samples of patients with
haematological malignancies using Western Blotting. Samples were tested
against normal control. Forty micrograms of protein were loaded into each
well. GAPDH was used as an internal control. THP-1 protein was used as a
positive control. TRPV1 monomer (~ 95kDa) was detected in five patients,
whereas another band at ~240 kDa was detected in two patients.

140
TRPV1 band detected at ~ 240kDa
IDN Disease Status Age Gender CRP (mg/L) Treatment
P08 MM Under treatment 71 M 3 Clexane, Zometa, IVIG
P33 B-NHL (CLL/SLL) De novo 62 F 2 -
TRPV1 monomer at ~ 95kDa
IDN Disease Status Age Gender CRP (mg/L) Treatment
P13 B-NHL (Diffuse Large B-Cell) Under treatment 29 M 2 Rituximab
P14 B-NHL (Intestinal) Under treatment 41 M 4 Vinblastine
P15 B-NHL (CLL/SLL) Under treatment
45 F 1 Rituximab
P33 B-NHL (CLL/SLL) De novo 62 F 2 -
P35 MM De novo 72 F 5 -
Table 6-5: Patients with detected TRPV1 bands on Western Blotting
IDN: patient/control identification number; CLL/SLL: Chronic lymphocytic leukaemia/small lymphocytic lymphoma, MM: Multiple myeloma.

141
6.5 Discussion
In this chapter, and for the first time, TRPV1 was detected in white blood cells
obtained from all controls, and from patients with haematological malignancies using
flow cytometry. However, only a small percentage of patients and no controls
demonstrated TRPV1 expression using Western blotting. TRPV1 expression was
found to be increased compared to controls in four out of the 49 patients as detected
by flow cytometry. Using Western blotting, TRPV1 was detected in six out of the 49
patients, but not in any of the controls. To the knowledge of the author, this is the
first study to demonstrate TRPV1 expression in leukocytes of patients with
haematological malignancies using both detection methods.
TRPV1 expression has been reported to be variable during carcinogenesis (Gkika
and Prevarskaya 2009). TRPV1 is overexpressed in glioma (Contassot et al. 2004a),
tongue epithelium cancer (Marincsák et al. 2009) and the haematological malignancy
cell lines (see Chapter 5), and ‘under’ expressed in urothelial cancer (Kalogris et al.
2010; Lazzeri et al. 2005). In this chapter, TRPV1 expression by PBMCs of the
majority (~92%) of patients with haematological malignancies was similar to
controls. There were no significant differences in TRPV1 expression between
patients from the same specific diagnosis group or compared to other blood cancers,
i.e. MM and B-NHL, de novo or under treatment, male or female. The variation in
TRPV1 expression in malignancies is either due to transcriptional or translational
factors, such as hormones, growth factors and alternative splicing isoforms
(Reynolds and Kyprianou 2006), or due to the presence of chronic inflammation,

142
dietary activation of TRPV1 by CAP, which may have a role in the up- or down-
regulation of TRPV1 expression (Akbar et al. 2008; Geppetti and Trevisani 2004).
In Western blotting, a TRPV1 monomer (~95kDa) was detected in four B-NHL and
one MM patients. Additionally, a TRPV1 band at ~240kDa was demonstrated in two
patients, a MM and a B-NHL patient. These TRPV1 bands have also been produced
in a de novo (~95 and 240kDa) and an under treatment (~95kDa) CLL/SLL patients
blots. The reason why TRPV1 was only detected in these cases using Western
blotting is unclear. However, these unexpected results may be due to the cell gating
process. MFI values were obtained from gating specific groups of cells depending on
the diagnosis of each patient i.e., lymphocytes for B-NHL. In contrast, protein
obtained from a mixture of PBMCs was used with Western blotting, rather than a
disease-specific cell type. Whilst flow cytometry is a more sensitive method to detect
protein than Western blot, it is considered that the low levels of TRPV1 expression in
the rest of the patients group and control subjects were beyond detection using
Western blotting. In addition, there is a possibility that the ~240kDa TRPV1 band
detected in two patients is an artefact or a TRPV1 isoform consisting of extra
polypeptides. Further investigation through cross-linking techniques or additional
sample processing procedures is warranted.
There was no significant difference in TRPV1 expression between females and
males. Other studies are in agreement with this finding, e.g., in end-stage kidney
disease patients (Saunders et al. 2009), and in healthy subjects (Spinsanti et al. 2008).
The four patients with increased TRPV1-MFI ratios and the three of six patients with
TRPV1 bands were females older than 70 years. The treatment, the CRP values and

143
the specific diagnosis of the patient, were all considered in speculating the results.
Two possible causes were believed to lead to these findings, 1) genetic variability in
some ethnicity i.e., TRPV1 polymorphisms. All patients and control subjects
recruited in this study were Caucasian, and it has been reported that TRPV1 Val585
Val allele was detected in European-American females which affects their pain
perception (Kim et al. 2004); 2) methodological, due to the shortage of patients
recruited in this study. Higher numbers of each patients group should be investigated
and further assessment should be undertaken.
In general, surgery, chemotherapy, and radiation are currently the available options
for cancer treatment. Local or systemic inflammation is provoked by all three, caused
mainly by tissue injury and cancer cell apoptosis. Surgery causes the activation of
infection- or stress-sensing pathways, whereas chemotherapy and radiotherapy lead
to cancer cell necrosis, a pro-inflammatory form of cell death (Vakkila and Lotze
2004). CRP is used as an indicator of inflammation (Sidoroff et al. 2010). TRPV1
plays a role in pain sensation and is associated with inflammation-induced thermal
hyperalgesia (Yu et al. 2008). Therefore, TRPV1 is increased in some inflammatory-
associated processes and diseases, such as irritable bowl syndrome, airway diseases
and end-stage kidney diseases (Akbar et al. 2008; Jia et al. 2005; Sadofsky et al.
2012; Saunders et al. 2009). In this chapter, high inflammatory status was not
associated with high TRPV1 levels in haematological malignancy patients. Hence,
inflammation may alter TRPV1 expression (increase) in some inflammatory-
associated diseases, but not in the blood cancers.

144
The MFI values of TRPV1 obtained from the leukocytes of each patient and control
using flow cytometry varied considerably. This variability might be due simply to
individual patient characteristics, differences in the proportions of T- and B-cells and
monocytes (which express different levels of TRPV1) between individuals. The
variation in TRPV1 expression is not uncommon and has been previously reported in
healthy PBMCs donors (Saunders et al. 2007).
In addition, as some blood cancers elicit an abnormal growth of one or more of the
white blood cell components, treatments of these disorders are designed to target
mainly the immune system (Cohen et al. 2006; Kwong 2010; Singhal and Mehta
2002). Most drugs used to treat blood cancers patients are immunomodulatory and
anti-inflammatory, e.g., thalidomide (Singhal and Mehta 2002), rituximab (Cohen et
al. 2006; Salvi et al. 2007), aspirin (Ikonomidis et al. 1999; Kopp and Ghosh 1994;
Yamamoto and Gaynor 2001) and dexamethazone (De Bosscher et al. 1997). The
anti-inflammatory effect is through the inhibition of cytokines, the crucial proteins
necessary to the inflammation process. Either thalidomide or lenalidomide was
commenced on MM patients included in this study. Both medications are classified
as immune-modulating drugs class (IMiDs) with anti-angiogenic activity that inhibits
the production of interleukin (IL)-6 and accordingly, activates T- cells to produce IL-
2 which alters the number and function of natural killer cells (Khalafallah et al.
2010). Furthermore, most of the B-NHL patients included in this study did receive
rituximab as part of their chemotherapy regimen. Rituximab is a humanised chimeric
monoclonal anti-CD20 which in turn, expressed primarily on the surface of B-cells.
This antibody is used in combination with chemotherapy for the treatment of B-NHL
patients, because of its ability to inhibit the B-cell production (Salvi et al. 2007).

145
Table 6-6 summarises some of the drugs which were administered to the patients
who participated in this study upon the time of sample collection. Thus, the alteration
in the proportions of the blood cell components may have an effect on the TRPV1
levels expressed in each patient compared to the control and subsequently lead to the
inhibition of TRPV1 as previously discussed in Chapter 5 (Chaulet et al. 2011; Choe
et al. 2010; Deng et al. 2003; Rafiee et al. 2010).
Although the increased expression of TRPV1 has been detected in haematological
malignant cell lines (Chapter 5), no alteration in the channel expression has been
demonstrated in patients with blood cancers compared to the normal control, in the
present study. These differences between TRPV1 expression in malignant cell lines
and cells from patients with malignancy might be due to years of passaging the cell
lines, which in turn may lead to changes in the expression characteristics of some
receptors (Marincsák et al. 2009). In addition, CAP-induced apoptosis in
haematological malignant cell lines was not TRPV1-mediated (see Chapter 2).
Therefore, whether the TRPV1 channel is functional in these cells warrants further
investigation. Finally, these findings indicate that TRPV1 expression might be
increased in association with inflammation in some diseases, but this is not the case
in blood cancers. Whilst flow cytometry is a sensitive way to detect protein, Western
blotting is relatively less sensitive. Therefore, false negative findings might actually
be low levels of TRPV1 expression that were beyond the sensitivity of detection. In
addition, the 240kDa band detected in some patients might be an artefact or
represents a true TRPV1 isoform, which warrants further investigation. Furthermore,
the PMBCs used in this study were obtained from patients/control blood, therefore
testing disease-appropriate cells, such as lymph node PBMCs from B-NHL, may lead

146
Drug Drug-induced
cytokines inhibition
Application References
Thalidomide/ Lenalidomide
TNF and IL-6 MM (Khalafallah et al. 2010; Singhal and
Mehta 2002; Singhal et al. 1999)
Rituximab Anti-CD20 and TNF-α B-NHL (Tamimoto et al. 2008).
Aspirin IL-1β, Plasma macrophage colony stimulating
factor, CRP and NF-κB
General anti-inflammatory (Ikonomidis et al. 1999; Kopp and Ghosh
1994; Yamamoto and Gaynor 2001).
Dexamethasone IL-6 and NF-κB Blood cancers (De Bosscher et al. 1997).
Table 6-6: Features of some drugs used to treat haematological malignancies
TNF: Tumor necrosis factor; MM: Multiple myeloma; CD20: Cluster of differentiation; IL-1: interlukin-1; NF-κB: nuclear factor kappa-light-chain-enhancer of activated B cells;
B-NHL: B-cell Non-Hodgkin’s lymphoma; CRP: C-reactive protein.

147
to different TRPV1 results and conclusions.
In conclusion, leukocytes from patients with haematological malignancies were
found to express TRPV1 at similar levels to normal subjects, except for four patients
with increased expression. TRPV1 level was not affected by the specific diagnoses,
gender or treatment status of the patients. The high inflammatory status did not seem
to have a direct effect in increasing the TRPV1 expression. This might be due to the
anti-inflammatory therapies that are used to treat patients with blood cancers.
Therefore, the specific function of the TRPV1 channel in human leukocytes may be
restricted to cation transportation and not associated with tumorigenesis (Samways
and Egan 2011). Finally, these findings indicate that in contrast to other conditions,
inflammation does not seem to increase TRPV1 expression in patients with blood
cancers.

148
7. Chapter 7: Conclusions and Future Studies

149
The primary reasons for undertaking the experiments described in this thesis were to
determine whether TRPV1 is expressed in human malignant haematological cells
and that TRPV1 plays a significant role in the function/dysfunction of these cells.
Based on differences in TRPV1 expression in some neoplastic compared to normal
tissues, it was also hypothesised that the expression of TRPV1 in leukocytes would
be increased in patients with haematological malignancies compared to healthy
controls. Targeting of vanilloid receptors might therefore represent a novel
therapeutic approach to treating haematological malignancies.
Three broad series of experiments were conducted; 1) pharmacological (Chapter 2),
where malignant cells were treated with the TRPV1 activator, CAP, and TRPV1,
CB1 and CB2 antagonists; 2) methodological optimisation (Chapters 3 and 4) of
flow cytometry and Western blotting protocols to detect TRPV1, and 3) clinical
haematology (Chapters 5 and 6), measurement of TRPV1 in haematological
malignant cells (cell lines and cells from patients) using optimised methods for flow
cytometry and Western blotting. In this chapter, the major outcomes from these
studies are highlighted and discussed.
The effect of CAP on the metabolic activity of the THP-1, U266B1 and U937
malignant haematological cells was investigated, as CAP has previously been shown
to induce apoptosis through TRPV1 in other cancer cells. Using the resazurin
reduction (alamarBlue®) method to measure cell metabolic activity, it was found that
the cell metabolic activity of THP-1, and for the first time U266B1 and U937 cells,
was inhibited in a concentration-dependent manner by CAP. These experiments were
then extended to investigate the mechanism of CAP-induced inhibition in metabolic

150
activity in these cells. It was demonstrated for the first time that TRPV1, CB1 and
CB2 receptors are not involved in CAP-induced changes in the metabolic activity of
U266B1 (myeloma) cells. Furthermore, TRPV1 and CB1 receptors appear to mediate
the concentration-dependent increase in metabolic activity (resazurin reduction) in
THP-1 cells produced by CAP, whereas TRPV1 (SB452533) and CB1 (AM251)
receptor antagonists appear to act synergistically with CAP to inhibit U937 cells
metabolic activity.
These cell line studies have raised the interesting question as to whether blood cancer
cells from patients might be susceptible to CAP-induced cell death, and indeed,
whether this would be TRPV1-mediated. Moreover, the role of membrane lipid rafts
and potentially other pathways and receptors, which might facilitate apoptosis in
cells from patients with blood cancer warrants further investigation. Finally, the
effect of CAP on BCL-2 gene and FAS mRNA levels, which modulate the apoptotic
process, should be investigated in malignant haematological cell lines.
Significant effort was devoted to developing reliable Western blotting and flow
cytometry methods to detect TRPV1. Exhaustive testing of blocking protocols,
primary and secondary antibodies, and permeabilisation techniques, resulted in
reproducibly clear Western blots and excellent separation of TRPV1 signal from
isotype and secondary antibody controls using flow cytometry. The use of the
negative control to avoid false positive results emerged as the key issue for reliable
Western blotting and flow cytometric detection of TRPV1. The negative control is a
pivotal tool to assess the specificity of primary and secondary antibodies, and the
non-specific binding caused by Fc-receptors. Cell lines that have been previously

151
reported to be devoid of TRPV1 and then used as negative controls were in fact
found to express TRPV1. Thus, untransfected and TRPV1-transfected (tetracycline
off, which switches TRPV1 transcription off) HEK293 and RAW264.7 cells, at least
in our hands, could not be used as controls. Many studies have used methods to
detect and report TRPV1 expression. However, the lack of appropriate controls,
particularly the negative control, raises doubts of the validity of data reported in
these studies, and the associated conclusions. The protocols developed in this thesis
are important because the appropriate negative controls were used to optimise the
TRPV1 detection methods. Isotype and secondary antibody controls were used as
negative controls in parallel with a positive control (THP-1 cells). In future studies,
one might consider using TRPV1 knockdown/ knockout cells as a negative control.
Finally, testing a number of antibodies, as performed in this study, is recommended
due to variability in binding capacity and specificity between different primary, and
to a lesser extent, secondary antibodies. An appropriate affinity-purified anti-TRPV1
antibody was found to be crucial for TRPV1 detection by Western blot and flow
cytometry. It is hoped that the current study will generate constructive discussions
regarding the use of appropriate controls when using flow cytometry and Western
blotting methods. Critically, consensus needs to be reached with regard to what
constitutes appropriate controls, which potentially impact the outcomes of research.
The optimised Western blot and flow cytometry protocols were then applied to detect
and quantitate TRPV1 in malignant haematological cell lines, as well as in
leukocytes from normal individuals and patients with blood cancers. In this study,
TRPV1 was detected for the first time in THP-1, U266B1 and U937 malignant
haematological cell lines, using flow cytometry in addition to Western blotting.
152
Significantly, TRPV1 expression was found to be increased in all three cell lines,
compared to leukocytes from healthy individuals (Chapter 5). U266B1 cells
expressed both the TRPV1 monomer (~95kDa) and an additional dimer (~200kDa).
The detection of a dimer might be due to the presence of an unknown TRPV1
isoform. U937 cells demonstrated increased TRPV1 expression by flow cytometry
compared to normal cells, but not by Western blotting, with significantly weaker
TRPV1 expression than THP-1 and U266B1 cells. These results strongly suggest that
TRPV1 is not uniformly expressed in different haematological malignant cell lines.
A possible explanation for the apparent increased expression of TRPV1 by malignant
haematological cell lines may be due to years of passaging the cells, which could
lead to changes in the expression of some receptors (Marincsák et al. 2009).
Moreover, whether the TRPV1 channel is functional when expression is increased in
these cells requires further investigation, as TRPV1 antagonists in the present study
had minimal effect on CAP-induced changes in cell activity (Chapter 2).
To the knowledge of the author, this is the first time TRPV1 has been investigated in
the leukocytes of patients diagnosed with a range of haematological malignancies,
including multiple myeloma (MM) and B-cell non-Hodgkin’s lymphoma (B-NHL),
using flow cytometry and Western blotting (Chapter 6). It emerged that TRPV1
expression was detected in all patients and controls using flow cytometry, but not
Western blotting. Increased expression of TRPV1 was detected using flow cytometry
in a sub-group of patients (4/49=8.2%, MM=2, B-NHL=2) compared to the
remainder of the group. Interestingly, most patients with haematological
malignancies recruited in this study (91.8%) were found to express TRPV1 at similar

153
levels to the normal controls. There were no significant differences in TRPV1
expression (assessed using flow cytometry) irrespective of gender, the
haematological malignancy diagnosed, or whether patients were de novo or under
treatment.
In contrast, using Western blotting, a TRPV1 monomer (~95kDa) was detected in
four B-NHL patients and one with MM. A TRPV1 band at ~240kDa was observed in
both a MM and a B-NHL patient, and in two patients with chronic lymphocytic
leukaemia/small lymphocytic lymphoma, including patients that were de novo (~95
and 240 kDa) and under treatment (~95kDa). The reason why Western blotting
detected TRPV1 only in these specific cases is unclear. Whilst flow cytometry is a
sensitive method to detect protein expression, Western blotting is relatively less
sensitive. Therefore, the low levels of TRPV1 detected in the remainder of the
patients and all control subjects, may be beyond the limit of detection using Western
blotting. In addition, there is a possibility that the ~240kDa TRPV1 band detected in
two patients is an artefact. Further sample processing procedures, such as increasing
the concentration of SDS/β-mercaptoethanol and performing cross-linking
techniques, should be considered to determine whether the oligomers causing the
higher molecular weight bands in U266B1 cells (dimer, ~200kDa) and the two
patients with blood cancers (~240kDa) are true TRPV1 bands (Milligan and
Koshland 1988). The leukocytes used in this study were obtained from
patient/control blood, whereas testing disease-appropriate cells, such as lymph node
cells from B-NHL patients, would provide additional information on TRPV1
expression at the ‘disease source’. Indeed, this may explain why the apparent

154
increase in TRPV1 expression in malignant haematological cell lines (THP-1,
U266B1 and U937), was not observed in the leukocytes of cancer patients.
As PBMCs from healthy adults and patients with haematological malignancies were
shown to express TRPV1, and as there is an apparent positive association between
inflammation and TRPV1 expression in some conditions (Akbar et al. 2008; Geppetti
and Trevisani 2004; Saunders et al. 2009), this relationship was explored. Elevated
C-reactive protein level (≥ 5 mg/L) was detected in 25% of patients, however it was
not associated with higher levels of TRPV1 expression. The lack of association may
be explained by anti-inflammatory therapies that are often used to treat these
patients. Thus, it may be that the specific function of the TRPV1 channel in human
leukocytes is restricted solely to cation transportation, without any involvement with
tumorigenesis (Samways and Egan 2011). These findings indicate that whilst
inflammation may increase TRPV1 expression in some conditions, this may not be
the case in blood cancers.
A major limitation of this study was that relatively few patients were recruited. This
was primarily due to; 1) the restricted time frame of that component of the study
(~six months), 2) the small number of patients that are diagnosed with blood cancers
in Tasmania each year (Stokes B 2013), and 3) the experimental conditions, as blood
samples should be processed within 2 hours of collection to preserve the viability of
leukocytes, as there were unsuccessful attempts to store the cells for later processing.
Nonetheless, the results presented in this thesis represent novel and important pilot
data on the expression of TRPV1 in haematological malignancies, not previously
reported. Increasing the overall number of patients, particularly the de novo patients,

155
would allow more robust statistical analysis to be performed. Similarly, it would be
interesting to investigate the expression of specific types of blood cancers, although
given the relative incidence of these diseases in general, may require multi-centre
recruitment. Finally, larger cohort studies may also allow the specific effects of
blood cancer drugs on TRPV1 expression to be studied.
In conclusion, this thesis has contributed new knowledge on the expression and
potential role of TRPV1 in haematological cells, including those from healthy
individuals and patients with blood cancers. A number of novel findings have been
reported. Firstly, CAP was found to inhibit the metabolic activity of THP-1, U266B1
and U937 malignant haematological cell lines, independent of TRPV1 activation.
TRPV1 and CB1, however, appear to mediate a CAP-induced increase in the
metabolic activity in THP-1 cells. Secondly, Western blotting and flow cytometry
protocols were developed and optimised for the detection of TRPV1 in human
leukocytes. Thirdly, cell lines that have previously been used in other studies as a
TRPV1 negative control, including untransfected and TRPV1-transfected
(tetracycline off) HEK293 and RAW264.7 cells, were reassessed using the optimised
Western blotting and flow cytometry protocols and found to express TRPV1. The
data presented in this thesis strongly suggests that these cells should not be used as
negative controls for investigations of TRPV1. Finally, increased TRPV1 expression
was observed only in some patients with MM and B-NHL, and was not associated
with inflammation. Altogether, this thesis provides a fundamental contribution to the
knowledge and understanding of TRPV1 measurement protocols, as well as the
expression of this important cation channel in malignant and non-malignant blood

156
cells. The results presented can be used as a basis for future studies of TRPV1
function in other human cells and cancers.

157
Appendix I: Preliminary Flow Cytometry Optimisation Using BD
FACScalibur™
The preliminary experiments stage of detecting TRPV1 using flow cytometry was
executed at the Launceston General Hospital (LGH) FACSCalibur™ flow cytometer
(Becton Dickenson Biosciences, San Jose, USA). Thirty one experiments were
conducted in the preliminary stage for method optimisation.
Immunophenotyping
All fluorochrome-conjugated CD markers are purchased from Becton Dickenson
(San Jose, USA) unless other wise stated. A combination of peridinin chlorophyll
protein (PerCP), fluorescein isothiocyanate (FITC), allophycocyanin (APC), and
phycoerythrin (PE) conjugated antibodies were selected. CD3-APC (T-cells), CD14-
APC (monocytes), CD19-PE (B-Cells) and CD56-PE (natural killer cells) were used
for leukocyte immunophenotyping (surface staining) using the FACSCalibur™.
Flow Cytometer Calibration
The FACSCalibur™ cytometer was set to lyse/wash method and the calibration was
performed using BD Calibrite™ beads (Becton Dickenson Biosciences, San Jose,
USA).
Electronic Optimisation
Four tubes each containing 1 x 10⁶ white blood cells, obtained from normal subject,
were stained with CD45-FITC, CD3-PE, CD45-PerCP, or CD45-APC, separately,
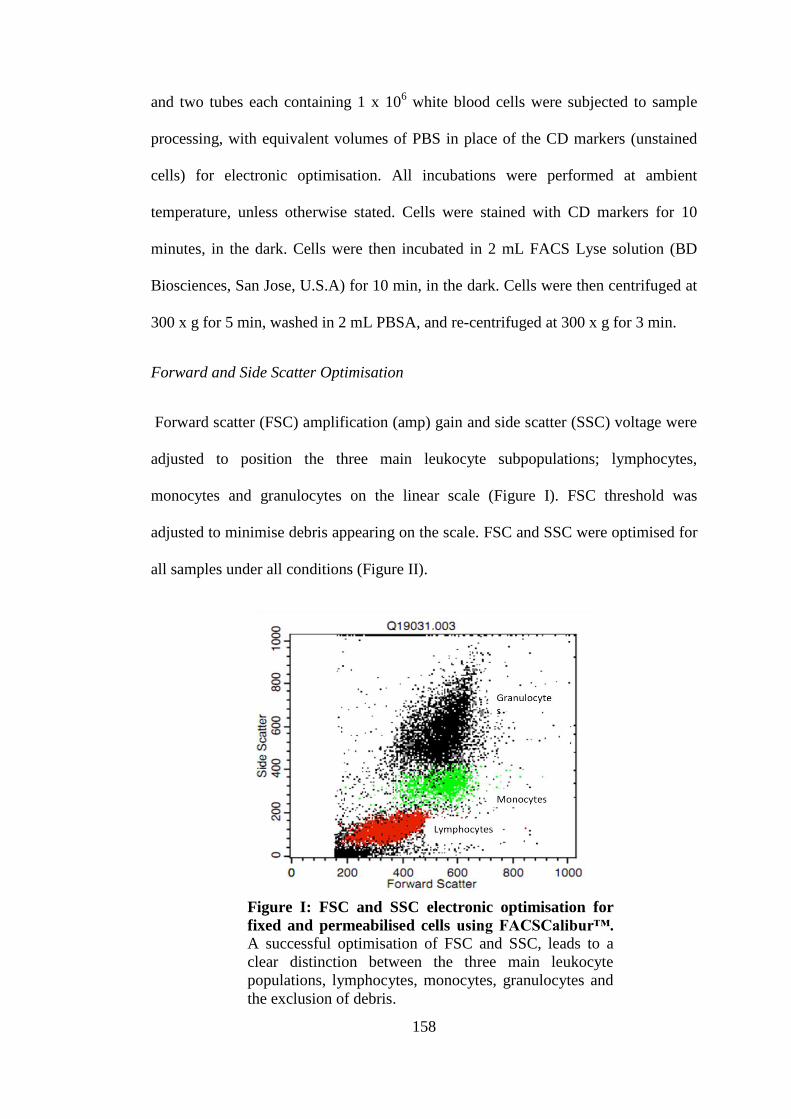
158
and two tubes each containing 1 x 10⁶ white blood cells were subjected to sample
processing, with equivalent volumes of PBS in place of the CD markers (unstained
cells) for electronic optimisation. All incubations were performed at ambient
temperature, unless otherwise stated. Cells were stained with CD markers for 10
minutes, in the dark. Cells were then incubated in 2 mL FACS Lyse solution (BD
Biosciences, San Jose, U.S.A) for 10 min, in the dark. Cells were then centrifuged at
300 x g for 5 min, washed in 2 mL PBSA, and re-centrifuged at 300 x g for 3 min.
Forward and Side Scatter Optimisation
Forward scatter (FSC) amplification (amp) gain and side scatter (SSC) voltage were
adjusted to position the three main leukocyte subpopulations; lymphocytes,
monocytes and granulocytes on the linear scale (Figure I). FSC threshold was
adjusted to minimise debris appearing on the scale. FSC and SSC were optimised for
all samples under all conditions (Figure II).
Figure I: FSC and SSC electronic optimisation for
fixed and permeabilised cells using FACSCalibur™. A successful optimisation of FSC and SSC, leads to a
clear distinction between the three main leukocyte
populations, lymphocytes, monocytes, granulocytes and
the exclusion of debris.
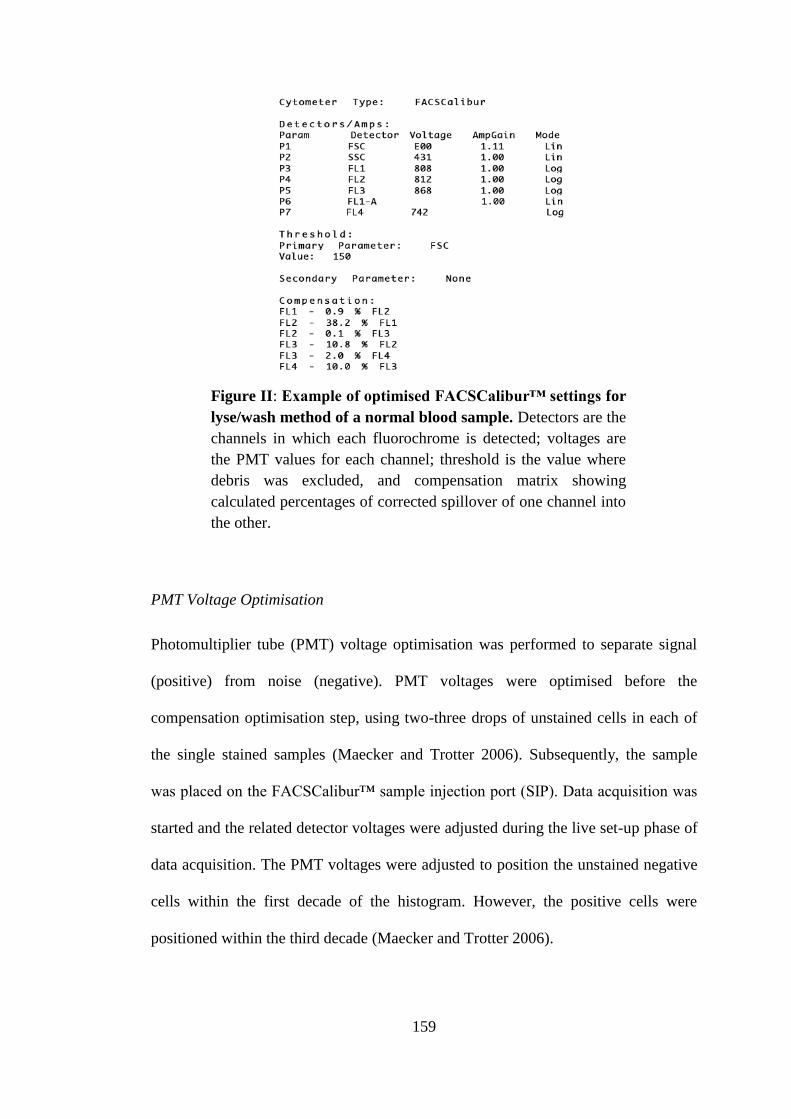
159
PMT Voltage Optimisation
Photomultiplier tube (PMT) voltage optimisation was performed to separate signal
(positive) from noise (negative). PMT voltages were optimised before the
compensation optimisation step, using two-three drops of unstained cells in each of
the single stained samples (Maecker and Trotter 2006). Subsequently, the sample
was placed on the FACSCalibur™ sample injection port (SIP). Data acquisition was
started and the related detector voltages were adjusted during the live set-up phase of
data acquisition. The PMT voltages were adjusted to position the unstained negative
cells within the first decade of the histogram. However, the positive cells were
positioned within the third decade (Maecker and Trotter 2006).
Figure II: Example of optimised FACSCalibur™ settings for
lyse/wash method of a normal blood sample. Detectors are the
channels in which each fluorochrome is detected; voltages are
the PMT values for each channel; threshold is the value where
debris was excluded, and compensation matrix showing
calculated percentages of corrected spillover of one channel into
the other.

160
Fluorescence Compensation
Compensation optimisation step was performed to eliminate fluorescence spectral
overlap. For the compensation, single tubes each containing 10µL of each CD45-
FITC, CD45-PerCP, CD3-PE and CD45-APC antibodies, separately, for electronic
optimisation (Maecker and Trotter 2006). Unstained cells (negative population) were
added to each of the single stained tubes. Compensation optimisation was performed
during the set-up phase of live data acquisition after setting up the PMT voltage
(Figure III). Cellular autofluorescence was also investigated, and the data showed
negative cell populations located within the first quadrant, indicating minimal
autofluorescence of the target cells under test conditions (Figure III, C-E).
Figure III: Example of compensation optimisation. (A) Data
demonstrate PerCP voltage before optimisation, (B) PerCP voltage after
electronic optimisation. CD45-PerCP negative population (A1 and B1)
positioned within first decade, and CD45-PerCP positive population
from second to third decade have increased with optimisation (A2 and
B2), (C) Example of over-compensation, (D) under-compensation, (E)
Properly compensated data.

161
Fixation and Permeabilisation
Fixation and permeabilisation procedures were required to allow the TRPV1 primary
antibody to bind to its intracellular epitope. Two commercially available kits
CALTAG™ (Life Technologies, Grand Island, USA) and Cytofix/CytopermTM
(Becton Dickenson, San Jose, USA) were investigated to determine the staining
patterns of TRPV1. The fixation/permeabilisation protocols for both kits were
applied according to suppliers’ instructions, with slight modifications including
staining the CD markers for 10 min and centrifuging cells at 300 x g. Cells were
fixed, permeabilised and washed using a saponin-based wash reagent to ensure cells
permeabilised as the permeabilisation step is reversal. There was no significant
difference in TRPV1 signal using either the CALTAG™ (Life Technologies, Grand
Island, USA) and Cytofix/CytopermTM
kits (Becton Dickenson, San Jose, USA)
(Figure IV).
Secondary Antibody Titration
Secondary antibody optimisation involved titration studies for both FITC- and Alexa
Flour®488-conjugated polyclonal goat anti-rabbit secondary antibodies (Figure V).
The variation between Alexa Fluor®488 background staining was observed at
Figure IV: Staining patterns for two fixation/permeabilisation
kits tested (A) CALTAG™ kit and (B) BD Cytofix/Cytoperm™
kit. Results demonstrate same efficiency of both kits.

162
dilutions ranging from 1:50 to 1:250 (Figure V, B). Therefore, optimal dilution for
goat anti-rabbit- Alexa Fluor®
488- conjugated secondary antibody was 1:50 and 1:25
for FITC-conjugated secondary antibodies. Alexa Fluor®488 as a fluorochrome looks
brighter than FITC, however separation between signal and noise was similar for
both.
Figure V: FITC- and Alexa Fluor®488- conjugated secondary antibody
dilution study using the FACSCalibur™. (A) Secondary antibody alone
titration for FITC, and (B) Alexa Fluor®488: an increase in TRPV1 signal
with decreasing the secondary antibody titre was noticed. The brightest
signal was obtained using 1:50 dilution. (C) Optimised working dilutions
with (green) and without (blue) the Santa Cruz anti-TRPV1 antibody for
FITC and (D) Alexa Flour®488. Both secondary antibodies demonstrated
similar staining patterns between secondary alone control (Blue) and
TRPV1 signal (Green).

163
Blocking Optimisation
The following general blocking reagents were tested: human AB serum (obtained
from healthy AB blood group donor), and FcR blocking reagent (Miltenyi
Biotechnology, Cologne, Germany). Better staining pattern was observed using Fc-
receptor blocking compared to the human AB serum (Figure VI).
Figure VI: Blocking optimisation using FACSCalibur™
cytometer on anti-TRPV1 antibody (Santa Cruz
Biotechnologies). Results demonstrate better staining pattern for
(B) Fc-receptor blocking compared to (A) human AB serum. (C) a
significant decrease in signal was observed when using a
combination of both.

164
Primary antibody dilution
A dilution study for Santa Cruz Biotechnology anti-TRPV1 antibody was performed
to optimise the TRPV1 signal, by incubating one million cells with 0.1 to 2 µg of the
primary antibody diluted 1:20 (Santa Cruz Biotechnologies, CA, USA). There was a
direct correlation between the amount of primary antibody added and the TRPV1
signal, with optimum TRPV1 antibody quantity of 1µg (Figure VII). Still, no
separation between isotype control and this anti-TRPV1 antibody; as similar or
weaker signal than the isotype control was detected (Figure VIII).
Figure VII: TRPV1 primary antibody optimisation (Santa
Cruz Biotechnologies, CA, USA). (A) Results demonstrate
increase in TRPV1 signal with increasing quantity of TRPV1
primary antibody, (B) TRPV1 signal comparing to noise.

165
Data Acquisition & Analysis
Data acquisition and analysis were completed using the FACSCalibur™ flow
cytometer and Cell QuestPro software (version 5.1) (Becton Dickenson Biosciences,
San Jose, USA). 10,000 events were acquired for each sample. Fluorescence
intensity is expressed in arbitrary units on a logarithmic scale. Final analysis was
performed using FlowJo (version 7/9, Oregon, U.S.A.).
Figure VIII: TRPV1 signal compared to isotype control in
human leukocyte subpopulations. Data demonstrate staining
pattern for isotype control (Santa Cruz biotechnology, USA)
compared with TRPV1 signal (Santa Cruz biotechnology, USA) and
secondary antibody only control (goat anti-rabbit-FITC, Santa Cruz
biotechnology, USA) for (A) Monocytes, (B) T cells, (C) B Cells
and (D) natural killer cells using FACSCalibur™.

166
Appendix II: Patients and Control Subjects Consent Forms
1. Patient consent form
School o f Human Life Sciences, University of Tasmania, Launceston TASMANIA
PATIENT INFORMATION AND
CONSENT TO PARTICIPATE IN A RESEARCH STUDY
Dear Patient
This consent form may contain words that you do not understand. Please ask the
study doctor or the study staff to explain any words or information that you do not
clearly understand.
INTRODUCTION AND PURPOSE
It has been shown in previous research studies that the transient receptor potential
vanilloid 1 (TRPV1, pronounced “TRiP-V-one”) is important in a number of
diseases. Evidence suggests that in some diseases the number of sensory nerves
increase and more TRPV1 is produced.
The purpose of the present study is to determine whether the expression of TRPV1 in
human white blood cells is altered in patients with haematological malignancies
(blood cancers), e.g., leukaemia, plasma cell myeloma (or, multiple myeloma),
lymphoma, compared to people who do not have a haematological malignancy. Data
will be compared with a comparable number of control participants (people without
haematological malignancy).

167
PROCEDURE
If you choose to participate in this study you will be required to attend the Pathology
Department at your local hospital/pathology laboratory or the School of Human Life
Sciences Clinical Laboratory for a blood test.
Samples:
You will be required to give 30 millilitres of blood, which will be taken at Pathology
Department at your local hospital/pathology laboratory or at the School of Human
Life Sciences Clinical Laboratory. Some patients maybe asked to provide a bone
marrow aspirate sample or lymph node biopsy if the blood cells of interest are not
detected in the blood sample. Collection of these specimens is performed using
standard procedures by A/Prof Alhossain Khalafallah (Consultant Haematologist). If
you have specific questions related to collection procedures please contact A/Prof
Khalafallah ([email protected] or 6348 7140) for further information.
RISKS AND DISCOMFORTS
Blood sampling is a low risk activity but participants should be aware that there are a
number of minor complications that can result from the procedure. In order for
subjects to give informed consent to blood sampling and/or collection of bone
marrow or lymph node material, they should read and understand the following:
Complications of blood sampling:
1. Syncope (fainting): This is not common in healthy volunteers, but can more
commonly occur if subjects are unwell or suffering from a viral infection such as a
cold or flu. Subjects who are extremely apprehensive about the procedure or the sight
of blood are also prone to fainting. If this does occur, the subject will be laid down
and adequate ventilation with fresh air is provided. A glass of cold water often helps
to alleviate the symptoms.
2. Nausea and Vomiting: Whilst a feeling of nausea is a relatively common response
(especially in first time subjects), vomiting is quite uncommon in adults as a
response to blood sampling. Subjects who are apprehensive may experience feelings
of nausea and are encouraged to return when they feel more confident with the
procedure, if that is suitable.
3. Bruising and Haematoma Formation: Bruising is the most common post-procedure
complication. The likelihood of bruising can be greatly diminished by applying
pressure to the puncture site for 5 minutes after the completion of the procedure and
maintaining a straight arm. Patients taking anticoagulants or any other medication
that hinders the body’s ability to form a clot (e.g., aspirin) should apply pressure for
an additional 5 minute period and then reassess whether any more pressure should be
applied. Haematoma formation (bleeding under the skin to form a raised swelling)
can also occasionally occur and can be minimised with prolonged application of
pressure to the site.

168
4. Convulsions: Usually only seen in patients who faint. These are usually minor in
nature and last less than a minute. The procedures for this are the same as for fainting
although, of course, care is taken to ensure that the patient does not hurt themselves.
5. Nerve Injury: Rare reports exist of patients who have experienced a partial loss of
arm movement following blood sampling. The incidence of this is less than 1 in
10,000 and as such it is considered extremely unlikely.
Complications of collecting bone marrow and lymph node material.
As with blood sampling, there is a small risk of minor complications with the
collection of bone marrow and lymph node material.
Bone marrow is collected from the pelvic hip bone using a needle and syringe. This
is performed under local anaesthesia. This procedure generally takes about one hour.
The chance of a serious complication in a healthy person is very low but some people
may experience nausea, bruising and/or local pain and discomfort. The two most
common complications that may occur from the procedure are bleeding and infection
at the puncture site. The bleeding at the puncture site is usually controlled with
external compression and gauze. Local infection at the puncture site is rare, but can
require oral antibiotics. The procedure is performed under sterile conditions to
prevent infections.
Lymph node material is collected using a fine needle biopsy. A fine needle biopsy
uses a thin, hollow needle to obtain fluid and tissue samples. This is performed under
local anaesthesia. This procedure takes between 30-60 min to complete. There are
generally few complications after a lymph node biopsy but some people may
experience nausea, bruising and/or local pain and discomfort. There is a small risk of
bleeding or infection. The bleeding at the puncture site is usually controlled with
external compression and gauze. Local infection at the puncture site is rare, but can
require oral antibiotics. The procedure is performed under sterile conditions to
prevent infections.
BENEFITS
We hope that studies such as this one will lead to the development of treatments that
have less severe side effects for people with blood cancers. However, there will be
no direct benefit to you as a result of the research performed with the material
obtained from your blood sample. If you have specific questions related to blood
cancers please contact A/Prof Alhossain Khalafallah ([email protected] or 6348
7140) for further information.
COST
Participation in this trial will not result in any costs for you and there is no payment
for participation in this study.

169
CONFIDENTIALITY
All data will be treated in the strictest of confidence. The information that will be
collected will only be used for the purpose of this project. Records identifying your
identity will not be made publicly available. If the results of the trial are published,
your identity will remain confidential. If reference to you is made, this will only be
done via code numbers.
PARTICIPATION
Your participation is voluntary and you may withdraw at any time without prejudice.
INCLUSION AND EXCLUSION
To enter this study as a control participant there must be no prior history of
haematological disease (blood cancer) and over the age of 18.
WITHDRAWAL
If you choose to withdraw at any stage, you may request that any, or all, of your data
collected for the purpose of this project be destroyed. The researchers will act in
accordance with your wishes.
RESULTS
The results of this study will be analysed and presented as group data only. A
summary of results will be available at the end of the study and these results will be
mailed to you on request.
CONTACTS
If you have a question about this study please contact the chief investigators;
•Dr Murray Adams ([email protected] or 6324 5483)
•A/Prof Dominic Geraghty ([email protected] or 6324 5488)
•A/Prof Alhossain Khalafallah ([email protected] or 6348 7140)
This study has been cleared by the Tasmanian Health and Medical Human Research
Ethics Committee in accordance with the National Health and Medical Research
Council’s guidelines.
If you have any concerns of an ethical nature or complaints about the manner in
which the project is conducted, you may contact the Executive Officer of the Human
Research Ethics Committee (Tasmania) Network. The Executive officer can direct
participants to the relevant Chair that reviewed the research. Executive Officer: Jen
Bruyn Schmidt (02 6226 7479).
Thankyou for your time,

170
INFORMED CONSENT FORM
If you decide to take part in this study, you will not receive results of these tests. We
do not offer you your personal results at this time as the study is entering a new field
of research and results will not be interpreted until the study is complete. (You will
be asked if you wish to receive a summary the results of this research once it has
been completed).
1. I, ___________________________________ have read the above information and
I agree to take part in the study investigating TRPV1in blood cells in patients with
haematological malignancy and normal controls.
2. I was given a copy of this signed and dated Informed Consent Form and the
corresponding Subject Information Sheet. I have received an explanation of the
nature, purpose, duration and foreseeable effects of the study and what I will be
expected to do. The possible risks and benefits of the study have been explained to
me. I was given time and opportunity to inquire about the trial and all my questions
were answered to my satisfaction.
3. I am aware that an Independent Ethics Committee (University of Tasmania) has
subjected this study for review and approval.
4. I am free to withdraw from the study at any time, without the need to justify my
decision.
5. I agree that the results of the study may be published or presented, however my
name and contact details will be kept confidential.
6. I understand that the research will be conducted in accordance with the
Declaration of Helsinki, NH&MRC Guidelines and applicable privacy laws.
7. I voluntarily consent to participate in this study.
___________________________ _______________
Subject’s Signature Date
Investigator Statement
I, _________________________________ have explained this study and the
implications of participating in it to this volunteer and I believe that the consent is
informed and that he/she understands the implications of participating in the study.
The subject consented to participate by his/her personally dated signature
_______________________________ ____________________
Investigator’s Signature Date
_______________________________ ____________________
Witness Date
171
2. Control subject consent form
School o f Human Life Sciences, University of Tasmania, Launceston TASMANIA
CONTROL PARTICIPANT INFORMATION AND
CONSENT TO PARTICIPATE IN A RESEARCH STUDY
This consent form may contain words that you do not understand. Please ask the
study doctor or the study staff to explain any words or information that you do not
clearly understand.
INTRODUCTION AND PURPOSE
It has been shown in previous research studies that the transient receptor potential
vanilloid 1 (TRPV1, pronounced “TRiP-V-one”) is important in a number of
diseases. Evidence suggests that in some diseases the number of sensory nerves
increase and more TRPV1 is produced.
The purpose of the present study is to determine whether the expression of TRPV1 in
human white blood cells is altered in patients with haematological malignancies
(blood cancers), e.g., leukaemia, multiple myeloma, lymphoma, compared to people
who do not have a haematological malignancy. You are being asked to act as a
control (i.e., no history of haematological malignancy).
PROCEDURE
If you choose to participate in this study you will be required to attend the Pathology
Department at your local hospital/pathology laboratory or the School of Human Life
Sciences Clinical Laboratory for a blood test.
Blood Samples:
You will be required to give 30 millilitres of blood, which will be taken at Pathology
Department at your local hospital/pathology laboratory or at the School of Human
Life Sciences Clinical Laboratory.

172
RISKS AND DISCOMFORTS
Blood sampling is a low risk activity but participants should be aware that there are a
number of minor complications that can result from the procedure. In order for
subjects to give informed consent to blood sampling they should read and understand
the following:
Complications of blood sampling:
1. Syncope (fainting): This is not common in healthy volunteers, but can more
commonly occur if subjects are unwell or suffering from a viral infection such as a
cold or flu. Subjects who are extremely apprehensive about the procedure or the sight
of blood are also prone to fainting. If this does occur, the subject will be laid down
and adequate ventilation with fresh air is provided. A glass of cold water often helps
to alleviate the symptoms.
2. Nausea and Vomiting: Whilst a feeling of nausea is a relatively common response
(especially in first time subjects), vomiting is quite uncommon in adults as a
response to blood sampling. Subjects who are apprehensive may experience feelings
of nausea and are encouraged to return when they feel more confident with the
procedure, if that is suitable.
3. Bruising and Haematoma Formation: Bruising is the most common post-procedure
complication. The likelihood of bruising can be greatly diminished by applying
pressure to the puncture site for 5 minutes after the completion of the procedure and
maintaining a straight arm. Individuals taking anticoagulants or any other medication
that hinders the body’s ability to form a clot (e.g., aspirin) should apply pressure for
an additional 5 minute period and then reassess whether any more pressure should be
applied. Haematoma formation (bleeding under the skin to form a raised swelling)
can also occasionally occur and can be minimised with prolonged application of
pressure to the site.
4. Convulsions: Usually only seen in individuals who faint. These are usually minor
in nature and last less than a minute. The procedures for this are the same as for
fainting although, of course, care is taken to ensure that the individual does not hurt
themselves.
5. Nerve Injury: Rare reports exist of individuals who have experienced a partial loss
of arm movement following blood sampling. The incidence of this is less than 1 in
10,000 and as such it is considered extremely unlikely.
BENEFITS
We hope that studies such as this one will lead to the development of treatments that
have less severe side effects for people with blood cancers. However, there will be
no direct benefit to you as a result of the research performed with the material
obtained from your blood sample.
COST
Participation in this trial will not result in any costs for you and there is no payment
for participation in this study.

173
CONFIDENTIALITY
All data will be treated in the strictest of confidence. The information that will be
collected will only be used for the purpose of thisproject. Records identifying your
identity will not be made publicly available. If the results of the trial are published,
your identity will remain confidential. If reference toyou is made, this will only be
done via code numbers.
PARTICIPATION
Your participation is voluntary and you may withdraw at any time without prejudice.
INCLUSION AND EXCLUSION
To enter this study as a control participant there must be no prior history of
haematological disease (blood cancer) and over the age of 18.
WITHDRAWAL
If you choose to withdraw at any stage, you may request that any, or all, of your data
collected for the purpose of this project be destroyed. The researchers will act in
accordance with your wishes.
RESULTS
The results of this study will be analysed and presented as group data only. A
summary of results will be available at the end of the study and these results will be
mailed to you on request.
CONTACTS
If you have a question about this study please contact the chief investigators;
•Dr Murray Adams ([email protected] or 6324 5483)
•A/Prof Dominic Geraghty ([email protected] or 6324 5488)
•A/Prof Alhossain Khalafallah ([email protected] or 6348 7140)
This study has been cleared by the Tasmanian Health and Medical Human Research
Ethics Committee in accordance with the National Health and Medical Research
Council’s guidelines.
If you have any concerns of an ethical nature or complaints about the manner in
which the project is conducted, you may contact the Executive Officer of the Human
Research Ethics Committee (Tasmania) Network. The Executive officer can direct
participants to the relevant Chair that reviewed the research. Executive Officer: Jen
Bruyn Schmidt (02 6226 7479).
Thankyou for your time,
INFORMED CONSENT FORM

174
If you decide to take part in this study, you will not receive results of these tests. We
do not offer you your personal results at this time as the study is entering a new field
of research and results will not be interpreted until the study is complete. (You will
be asked if you wish to receive a summary the results of this research once it has
been completed).
1. I, ___________________________________ have read the above information and
I agree to take part in the study investigating TRPV1in blood cells in patients with
haematological malignancy and normal controls.
2. I was given a copy of this signed and dated Informed Consent Form and the
corresponding Subject Information Sheet. I have received an explanation of the
nature, purpose, duration and foreseeable effects of the study and what I will be
expected to do. The possible risks and benefits of the study have been explained to
me. I was given time and opportunity to inquire about the trial and all my questions
were answered to my satisfaction.
3. I am aware that an Independent Ethics Committee (University of Tasmania) has
subjected this study for review and approval.
4. I am free to withdraw from the study at any time, without the need to justify my
decision.
5. I agree that the results of the study may be published or presented, however my
name and contact details will be kept confidential.
6. I understand that the research will be conducted in accordance with the
Declaration of Helsinki, NH&MRC Guidelines and applicable privacy laws.
7. I voluntarily consent to participate in this study.
______________________________ ________________
Subject’s Signature Date
Investigator Statement
I, _________________________________ have explained this study and the
implications of participating in it to this volunteer and I believe that the consent is
informed and that he/she understands the implications of participating in the study.
The subject consented to participate by his/her personally dated signature
_______________________________ ____________________
Investigator’s Signature Date
_______________________________ ____________________
Witness Date

175
Appendix III: Experiments Sheets and Protocols
1. Cell metabolic activity assay in the presence of CAP (Alamar Blue
method):
Alamar blue® reagent is used to assess cell metallic activity. Resazurin, the active
ingredient of alamarblue® reagent, is a non-toxic, cell permeable compound that is
blue and non-fluorescence. Upon entering the cells, resazurin is reduced to resorufin,
a red compound which is highly fluorescent. Viable cells will continuously convert
resazurin to resorufin, increasing the overall fluorescence and colour of the media
surrounding the cells.
Resazurin (blue, non fluorescence) Resorufin (red, fluorescence)
THP-1 cells metabolic activity in the presence of CAP:
1. Count the cell number using haemocytometer or Invitrogen Countess.
2. Calculate the total volume to get 5 x 10⁵ cells/ 100 µL/ well. Take the desired cell
suspension, centrifuge, resuspend in the calculated volume.
3. In a 98 wells microplate, add 100µL of cell suspension to each well and incubate.
4. Prepare serial dilution of CAP: 2000, 1000, 500, 250, 125, 63, 32 and 16 µM.
Each well will contain 100µL of CAP. A vehicle should be used as a negative control
Note: vehicle should contain the same amount of ethanol used to reconstitute CAP.
In our experiments, CAP contains 20µL of ethanol for every 980µL of CAP solution.
CAP Serial Dilution:
8 Eppendorf tubes, write the concentration on the lid. Start with 2000µM.
To prepare a vehicle: in a 15 ml centrifuge tube, add 5 ml complete media, and
for each 980µL of media, add 20µL absolute ethanol and mix.
Starting with 2000µM (2mM) concentration, CAP stock concentration is 100
mM. To calculate the required initial CAP volume, use the formula:
100mM x V = 2mM x 1000
Vi= 20 µL.

176
For Eppendorf #1 (2000 µM): add 980µL of complete media+ 20µL of CAP
(100 mM) (the mixture will be turbid).
To the rest of the tubes, add 500µL of vehicle. Then start serial dilution by
taking 500µL from tube #1 to #2, mix then take 500µL from #2 to #3....etc (
dilution factor= ½).
5. Bring the microplate from the incubator and add 100µL of each CAP
concentration to 3 wells. In the last 3 wells add vehicle only as follows
(incubation concentration is shown below), then incubate at 37°C, 5% CO2:
6. After 22hr of incubation, take 0.1 of the total volume of alamarblue® reagent in an
Eppendorf tube and add it to each well, then incubate for another 2hr.
7. After 2hr, the fluorescence reading will be performed using GENios, TECAN
reader at excitation wavelength of 540-570 nm and emission at 580-610 nm.
GENios, TECAN reading procedure:
1. Turn on the fluorescence plate reader (GENios, TECAN )
2. On the desktop, open XFluor4.xls excel data sheet.
3. Press Add Ins button; select XFluor4 Connect Edit Measurement
Parameters (optimal gain, fluorescence intensity, no temperature...).
177
4. Load your plate Start Measurements.
5. Save the readings.
6. Calculate the mean for each CAP concentration readings (3 wells each).
7. Calculate the mean for the vehicle readings.
8. x 100%.
9. By GraphPad Prism Program, create the diagram.
Tips:
1. Use reverse pipetting to avoid air bubbles in the microplate. Few bubbles are not
going to affect the result, as the fluorescence reader read the bottom of the well only.
2. Use wide end tips for cell suspension to avoid stressing the cells.
3. Alamarblue®
-treated cells plate could be incubated for 1-4 hr in cell culture
incubator. Discard after 4 hr.
4. The assay plate can be wrapped in foil, stored at 4°C, and read within 1-3 days
without affecting the fluorescence or absorbance value.
2. Cell metabolic activity of malignant haematological cell lines
malignancies exposed to CAP in the presence of TRPV1, CB1
and CB2 antagonists (SB452533, AM251 and AM630)
Total volume in each well= 250µL:
100µL cell suspension + 50µL antagonist/vehicle+ 100µL CAP.
CAP concentration used= 125 µM.
Solutions:
SB free vehicle: 30µL ethanol/ 1 ml complete media (500µL needed).
AMs free vehicle: 3µL DMSO/ 1 mL complete media (500µL needed).
CAP free solution: 3.13µL ethanol/ 1 ml complete media. To prepare 5 ml
of this solution: 15.7µL ethanol + 4984.4µL complete media.

178
CAP= 100mM. Prepared dilutions: 312.5µM to end up with 125µM CAP
concentration1.
CAP Volume= 2500 µL/ 15 wells.
CiVi=CfVf (i= initial, f= final)
100000µM * Vi= 312.5µM * 2500
Vi= 7.8 µL of stock CAP into 2492 µL of CAP free solution.
SB 452533= stock concentration 10 mM. Required concentration: 3.0 µM to end
up with 1.0 µM2.
SB 452533 experiment preparation:
1. SB diluent: 30µL alcohol3/ 1 ml complete media (used in the SB dilutions
only). Required volume= 3 ml (90µL alcohol+ 2910µL complete media).
2. CAP free solution: see below.
SB452533 dilution (1000 µL): added to all SB wells (including SB vehicle wells)
1 CAP= solute/t.volume= 100/ 250= 2.5x. We want incubation [CAP] =125 µM, so 125* 2.5= 312.5 µM.
2 We will add 50 µL antagonist+ 100 µL cells first, so 50/150= 1:3= 3 x. So, 3 * 100 µM= 300 µM,
30,..etc. 3 Because we add 30 µL of SB in 1 ml media to get 300 µM final concentration. Stock [SB]= 10mM.
100
µL 1/10
100 µL
1/10
100 µL
1/10
970µL
complete
media+
30µL SB
900µL
SB diluent 900µL
SB
diluent
900µL SB
diluent
Preparation concentration
300µM 30µM 3.0µM 0.3µM
Incubation
concentration 100µM 10µM 1.0µM 0.1µM
[Preparation]
100 µL cells+ vehicle

179
AM251 (CB1 antagonists) and AM630 (CB2 antagonist): stock concentration
100 mM. Required dilutions: 300, 30, 3.0 and 0.3µM to end up with 100, 10, 1.0
and 0.1 µM incubation concentrations.
AM251 and 630 dilutions:
CiVi=CfVf (i= initial, f= final)
100000 µM* Vi= 300µM * 1000
Vi= 3µL of stock AM251 or AM630 into 997µL complete media.
To start serial dilution:
Dilution= solute/ total volume
1/10= s/1000 S= 100 µL.
Vehicle: Both of AM251 and AM630 (AMs) have the same vehicle:
1. AM dilution solution: 3µL DMSO/ 1 ml complete media (for AMs dilution
only). Required vehicle volume= 6 ml (5991µL complete media + 9µL
DMSO).
2. CAP free solution: see below.
AM 251 and AM630 dilutions (1000 µL):
100µL
1/10
100µL
1/10
100µL
1/10
997µL
complete
media+
3.0 µL AM251
or AM630
900µL
AM
dilution
solution
900µL
AM
dilution
solution
900µL
AM
dilution
solution
Preparation
concentration 300µM 30µM 3.0µM 0.3µM
Incubation concentration
100µM 10µM 1.0µM 0.1µM

180
Experiment procedures:
1. In a 98 well microplate, add 100µL cell suspension + 50µL antagonist (all
rows except row A).
For row A:
1-3: add 50µL of complete media.
6-8: add 50µL of SB free vehicle.
10-12: add 50µL of AMs free vehicle.
2. Incubate 30 min at 5% CO2, 37°C.
3. After the incubation, add 100µL of CAP to (B, D and F) wells. Add CAP free
vehicle to the rest of wells mix well and incubate for 22hr.
4. Add 0.1 of the total volume of prewarmed Alamar blue reagent (25
µL/250 µL total volume) incubate for another 2 hr test at 540
excitation wavelength and 595 emission wavelengths.
1 2 3 4 5 6
7 8
9 10 11 12
A
B
C
D
E
F
G
H
V: vehicle. CAP: capsaicin
CAP only AMs free V SB free V
100
100
100
100
100
100
100
10
10
10
10
10
10
1.0
1.0
1.0
1.0
1.0
1.0
0.1
0.1
0.1
0.1
0.1
0.1
CAP+SB452533
(TRPV1 antagonist)
CAP+AM251 (CB1
antagonist)
CAP+AM630 (CB2
antagonist)
SB452533
alone
AM251
alone
AM630 alone
Vehicles
Control

181
2. Cell Cryopreservation Protocol
Freezing medium:
Cryopreservation freezing media composes of complete media + 5% (v/v) DMSO.
After calculating the required quantity of DMSO, aspire by syringe and filter using
syringe filter into a tube then add the media to the desired total volume. Use the
formula:
(v/v)% = [(volume of solute)/(volume of total solution)] x 100%
(Solution is not the solvent)
Cryopreservation Protocol:
1. Prepare a freezing medium consisting of a complete growth medium and 5%
DMSO. Store between 2-8°C until use.
2. Measure total number of cells and viability percentage using a haemocytometer,
cell counter and Trypan Blue exclusion, or the Countess® Automated Cell
Counter. Calculate the required freezing medium volume depending on the
viable cell density.
3. Collect cells by gentle centrifugation (10 min at 125 x g). Aseptically decant
supernatant without disturbing the cell pellet and resuspend them in the freezing
medium at a concentration of 1 x 10⁶ to 5 x 10
6 viable cells per 1 ml.
4. Label the appropriate number of vials, then add 1 to 1.8 ml of the cell suspension
to each vial (depending on the volume of the vial) and seal. As you aliquot the
cell suspension, frequently and gently mix the cells to maintain a homogeneous
cell suspension.
5. Allow cells to equilibrate in the freezing medium at room temperature for a
minimum of 15 min and no longer than 60 min, as metabolic activity may
decline by the DMSO.
6. Place the vials into a controlled-rate freeze chamber and place the chamber in a -
70°C (or colder) mechanical freezer for at least 24 hr. Alternatively, use a
programmable freezer unit set to cool the cryovials at -1°C per min until a
temperature below -70°C is achieved.
7. Quickly transfer the vials to a liquid nitrogen or -130°C freezer. Frozen material
will warm up at a rate of 10°C per min and cells will deteriorate rapidly if
warmed above -50°C.
8. Record the location and details of the freezer.
9. After 24 hr, remove one cryovials from the liquid nitrogen; restore the cells in
culture, and measure metabolic activity and sterility.
Notes:
1. Do not add undiluted DMSO to a cell suspension as dissolution of DMSO in
aqueous solutions releases heat (exothermic).

182
2. Freeze cultured cells at a high concentration and low passage number as
possible. Make sure the cells are at least 90% viable before freezing. Note
that the optimal freezing conditions depend on the type of the cell line in use.
3. Always use sterile cryovials for storing frozen cells. Cryovials containing the
frozen cells may be stored immersed in liquid nitrogen or in the gas phase
above the liquid nitrogen (see Safety Note below).
4. All solutions and equipment that come in contact with the cells must be
sterile. Always use proper sterile technique and work in a laminar flow hood.
Safety Note: Biohazardous materials must be stored in the gas phase above the
liquid nitrogen. Storing the sealed cryovials in the gas phase eliminates the risk of
explosion. If you are using liquid-phase storage, be aware of the explosion hazard
with both glass and plastic cryovials and always wear a face shield or goggles.
References: http://www.invitrogen.com/site/us/en/home/References/gibco-cell-
culture-basics/cell-culture-protocols/freezing-cells.html
www.atcc.org
3. Reagents used for Western blotting protocol :
Washing Solution: phosphate buffered saline-Tween20 (PBST) (1000mL):
0.5 mL of Tween 20+ 50 mL of PBS, then fill the water up to 1000 mL.
Blocking Solution: (3%BSA+5% NFM in PBST) (50 mL):
2.5g of NFM+ 1.5g of BSA in 50 mL of PBST.
Running Buffer: Biorad 10X Tris mix
Transfer Buffer (1 X): (25 mM Tris, 0.2 M glycine and 5% methanol)
100 mL 10 X Transfer solution+ 50 mL methanl+850 mL water.
Transfer Buffer (10X):
Tris: 25 mM, M.W: 121.14

183
Glycine: 0.2 M, M.W: 75.07 (Check the bottle). To prepare 1000mL of 10X of the
transferring buffer:
30.3 g Tris + 150.1 g Glysine + water to 1000mL.
4X Laemli Buffer:
0.5 M Tris-Cl (2.5 mL)
SDS (0.4g)
Glycerol: 2 mL
Bromophenol Blue: 20mg
B-merchaptoethanol: 400uL
Water: to 10 mL. If the solution become yellow, so the PH< 6.8, add drops of 1.5 M
Tris-HCL to return the colour to the blue.
Notes:
Solutions should be fresh and cold, especially the transferring buffer.
Blocking reagent should be sterile.
Adjust the pH using HCl to increase acidity of Tris (pH=10).
Rinse the wells with the running buffer using syringe and needle or pipette to
remove excess acrylamide.
When transferring overnight, set the ‘amplification to constant’ for even band
transferring.
More transferring time, bigger protein transferring will be successful.
If using HRP, don’t use sodium azide in any solution, because azide is an
inhibitor for the HRP enzyme.
When preparing the gel, ammonium persulfate (APS, oxidizing agent) should
be fresh, because it only lasts for few days after reconstitution.
4. Flow cytometry Protocol:
Step Details
Step 1 Label the tube according to the experiment design.
Step 2 Add the required volumes of the antibodies (according to package insert)
carefully to the bottom of the tube.
Step 3 Add 1 x 10⁶ cells to the each tube.
Step 4 Gently vortex to mix.
Incubate the tubes in the dark, RT, 10 min.
Step 5 Add 2 ml of the RBCs lysing solution to the whole blood tubes only,
vortex gently to mix. Incubate in the dark at room temperature for 5 min.

184
Note: This incubation must NOT exceed 10 minutes.
Step 6 Centrifuge for 5 min on high (300 -350g), then remove supernatant. Wash
with PBSA (3 ml/tube), centrifuge 3 min at 350g.
Step 8 Add 250µL/ tube of BD cytofix/cytoperm, 20 min at 4C.
Step9 Wash 2 x in saponin-based wash (1ml/tube/wash).
Step 10 Add 50µL of the blocking reagent. Incubate 15min, dark, RT.
Step 11 Centrifuge all Abs at 10,000 x g for 5 min, use ONLY the supernatant.
Step 12 Add primary Ab or isotype control, Mix gently. Incubate : 45 min, dark,
4° C.
Step 13 Wash 2x: add saponin-based wash (1ml/tube/wash), centrifuge for 3 min
at 350 g on high. Remove supernatant, resuspend cells
Step 14 Add 50 µL of secondary Ab, (1/25, diluted in the saponin-wash, mix
gently. Incubate 20 min, 4° C in the dark.
Step 15 Wash 2x: add saponin-based wash (1ml/tube/wash), centrifuge for 3 min
at 350 g on high. Remove supernatant, resuspend cells
Step 16 Before RUN, add 2.5 ml PBS (Ca2+
/ Mg2+
free).
Blocking preparation (500uL):
10% AB serum or goat serum:
10/100 * 500= 50uL.
0.05% sodium azide:
0.05/100* 5 ml= 0.0025 g= 2.5 mg.
0.1% BSA:
0.1/100 * 5 ml= 0.005 g= 5mg.
Then made up to 4.5 mL wash. Then add 50 µL of
serum to 450 µL (0.1%BSA+0.05% sodium azide
solution).
Channel Detected CD-fluorochrome
BL1 2o TRPV1-FITC
BL2 CD19-PE, CD7-PE, CD33-PE,
CD56-PE
BL3 CD45-PerCP, CD45-PE-Cys5
VL1 CD14-V450, CD3-BV421, CD13-
BV421, CD13-BV421, CD20-
BV421.
VL2 CD14-V500
VL3 CD38-BV605
Table 1: Attune cytometer channels and the associated
fluorochromes

185
References
Aarts, M et al. 2003, A key role for TRPM7 channels in anoxic neuronal death, Cell,
vol. 115, no. 7, pp. 863-877.
Abramowitz, J and Birnbaumer, L 2009, Physiology and pathophysiology of
canonical transient receptor potential channels, FASEB Journal, vol. 23, no.
2, pp. 297-328.
Aggarwal, BB et al. 2006, Targeting signal-transducer-and-activator-of-transcription-
3 for prevention and therapy of cancer: modern target but ancient solution,
Annals of the New York Academy of Sciences, vol. 1091, pp. 151-169.
Akbar, A et al. 2008, Increased capsaicin receptor TRPV1-expressing sensory fibres
in irritable bowel syndrome and their correlation with abdominal pain, Gut,
vol. 57, no. 7, pp. 923-929.
Akira, S et al. 1994, Molecular cloning of APRF, a novel IFN-stimulated gene factor
3 p91-related transcription factor involved in the gp130-mediated signaling
pathway, Cell, vol. 77, no. 1, pp. 63-71.
Alexander, SP, Mathie, A and Peters, JA 2004, Guide to receptors and channels, 1st
edition, British Journal of Pharmacology, vol. 141 Suppl 1, pp. S1-126.
Alexander, SPH, Mathie, A and Peters, JA 2007, Ion Channels, British journal of
pharmacology, vol. 150, no. S1, pp. S96-S121.
Allescher, HD 2006, Functional dyspepsia--a multicausal disease and its therapy,
Phytomedicine, vol. 13 Suppl 5, pp. 2-11.
Alpizar, Y et al. 2013, Bimodal effects of cinnamaldehyde and camphor on mouse
TRPA1, Pflügers Archiv - European Journal of Physiology, vol. 465, no. 6,
pp. 853-864.
Amadesi, S et al. 2004, Protease-activated receptor 2 sensitizes the capsaicin receptor
transient receptor potential vanilloid receptor 1 to induce hyperalgesia,
Journal of Neuroscience, vol. 24, no. 18, pp. 4300-4312.
Amantini, C et al. 2009, Triggering of transient receptor potential vanilloid type 1
(TRPV1) by capsaicin induces Fas/CD95-mediated apoptosis of urothelial
cancer cells in an ATM-dependent manner, Carcinogenesis, vol. 30, no. 8, p.
1320.
Amantini, C et al. 2004, Distinct thymocyte subsets express the vanilloid receptor
VR1 that mediates capsaicin-induced apoptotic cell death, Cell Death and
Differentiation, vol. 11, no. 12, pp. 1342-1356.
Amantini, C et al. 2007, Capsaicin-induced apoptosis of glioma cells is mediated by
TRPV1 vanilloid receptor and requires p38 MAPK activation, Journal of
neurochemistry, vol. 102, no. 3, pp. 977-990.
Anderson, KC 2005, Lenalidomide and thalidomide: mechanisms of action--
similarities and differences, Seminars in Hematology, vol. 42, no. 4 Suppl 4,
pp. S3-8.
Arima, N et al. 1999, NF-kappaB involvement in the activation of primary adult T-
cell leukemia cells and its clinical implications, Experimental Hematology,
vol. 27, no. 7, pp. 1168-1175.
Athanasiou, A et al. 2007, Vanilloid receptor agonists and antagonists are
mitochondrial inhibitors: how vanilloids cause non-vanilloid receptor
mediated cell death, Biochemical and Biophysical Research Communications,
vol. 354, no. 1, pp. 50-55.

186
Avelino, A and Cruz, F 2006, TRPV1 (vanilloid receptor) in the urinary tract:
expression, function and clinical applications, Naunyn Schmiedebergs
Archives of Pharmacology, vol. 373, no. 4, pp. 287-299.
Baldwin, AS, Jr. 1996, The NF-kappa B and I kappa B proteins: new discoveries and
insights, Annual Review of Immunology, vol. 14, pp. 649-683.
Bandell, M, Macpherson, LJ and Patapoutian, A 2007, From chills to chilis:
mechanisms for thermosensation and chemesthesis via thermoTRPs, Current
Opinion in Neurobiology, vol. 17, no. 4, pp. 490-497.
Bannenberg, G et al. 1994, Sulfur dioxide and sodium metabisulfite induce
bronchoconstriction in the isolated perfused and ventilated guinea pig lung
via stimulation of capsaicin-sensitive sensory nerves, Respiration, vol. 61, no.
3, pp. 130-137.
Baron, R 2006, Mechanisms of disease: neuropathic pain—a clinical perspective,
Nature, vol. 2, no. 2, p. 95.
Basu, S and Srivastava, P 2005, Immunological role of neuronal receptor vanilloid
receptor 1 expressed on dendritic cells, Proceedings of the National Academy
of Sciences of the United States of America, vol. 102, no. 14, pp. 5120-5125.
Beech, DJ, Muraki, K and Flemming, R 2004, Non-selective cationic channels of
smooth muscle and the mammalian homologues of Drosophila TRP, Journal
of Physiology, vol. 559, no. Pt 3, pp. 685-706.
Behrendt, HJ et al. 2004, Characterization of the mouse cold-menthol receptor
TRPM8 and vanilloid receptor type-1 VR1 using a fluorometric imaging
plate reader (FLIPR) assay, British Journal of Pharmacology, vol. 141, no. 4,
pp. 737-745.
Ben-Mabrouk, F and Tryba, AK 2010, Substance P modulation of TRPC3/ 7
channels improves respiratory rhythm regularity and ICAN-dependent
pacemaker activity, European Journal of Neuroscience, vol. 31, no. 7, pp.
1219-1232.
Benarroch, EE 2008, TRP channels: functions and involvement in neurologic
disease, Neurology, vol. 70, no. 8, pp. 648-652.
Bhave, G et al. 2002, cAMP-dependent protein kinase regulates desensitization of
the capsaicin receptor (VR1) by direct phosphorylation, Neuron, vol. 35, no.
4, pp. 721-731.
Bhutani, M et al. 2007, Capsaicin is a novel blocker of constitutive and interleukin-6-
inducible STAT3 activation, Clinical Cancer Research, vol. 13, no. 10, pp.
3024-3032.
Birder, LA et al. 2001, Vanilloid receptor expression suggests a sensory role for
urinary bladder epithelial cells, Proceedings of the National Academy of
Sciences of the United States of America, vol. 98, no. 23, pp. 13396-13401.
Bode, AM et al. 2009, Transient Receptor Potential Type Vanilloid 1 Suppresses
Skin Carcinogenesis, Cancer Research, vol. 69, no. 3, pp. 905-913.
Bollimuntha, S, Ebadi, M and Singh, BB 2006, TRPC1 protects human SH-SY5Y
cells against salsolinol-induced cytotoxicity by inhibiting apoptosis, Brain
Research, vol. 1099, no. 1, pp. 141-149.
Brierley, SM et al. 2005, Differential chemosensory function and receptor expression
of splanchnic and pelvic colonic afferents in mice, Journal of Physiology,
vol. 567, no. Pt 1, pp. 267-281.
Capel, PJ et al. 1994, Heterogeneity of human IgG Fc receptors, Immunomethods,
vol. 4, no. 1, pp. 25-34.

187
Caprodossi, S et al. 2011, Capsaicin promotes a more aggressive gene expression
phenotype and invasiveness in null-TRPV1 urothelial cancer cells,
Carcinogenesis, vol. 32, no. 5, pp. 686-694.
Caterina, MJ and Julius, D 2001, The vanilloid receptor: a molecular gateway to the
pain pathway, Annual Review of Neuroscience, vol. 24, pp. 487-517.
Caterina, MJ et al. 2000, Impaired nociception and pain sensation in mice lacking the
capsaicin receptor, Science, vol. 288, no. 5464, pp. 306-313.
Caterina, MJ et al. 1999, A capsaicin-receptor homologue with a high threshold for
noxious heat, Nature, vol. 398, no. 6726, pp. 436-441.
Caterina, MJ et al. 1997, The capsaicin receptor: a heat-activated ion channel in the
pain pathway, Nature, vol. 389, no. 6653, pp. 816-824.
Cavo, M 2006, Proteasome inhibitor bortezomib for the treatment of multiple
myeloma, Leukemia, vol. 20, no. 8, pp. 1341-1352.
Chauhan, D et al. 2007, A novel Bcl-2/Bcl-X(L)/Bcl-w inhibitor ABT-737 as therapy
in multiple myeloma, Oncogene, vol. 26, no. 16, pp. 2374-2380.
Chaulet, C et al. 2011, Design, synthesis and biological evaluation of new
thalidomide analogues as TNF-α and IL-6 production inhibitors, Bioorganic
& Medicinal Chemistry Letters, vol. 21, no. 3, pp. 1019-1022.
Chen, CW et al. 2003, Signal transduction for inhibition of inducible nitric oxide
synthase and cyclooxygenase‐2 induction by capsaicin and related analogs in
macrophages, British Journal of Pharmacology, vol. 140, no. 6, pp. 1077-
1087.
Chen, D et al. 2012a, Capsaicin induces cycle arrest by inhibiting cyclin-dependent-
kinase in bladder carcinoma cells, International Journal of Urology, vol. 19,
no. 7, p. 662-668.
Chen, W-H et al. 2012b, Attenuation of TRPV1 and TRPV4 Expression and
Function in Mouse Inflammatory Pain Models Using Electroacupuncture,
Evidence-Based Complementary and Alternative Medicine, vol. 2012, p. 12.
Chen, Y and Buck, J 2000, Cannabinoids protect cells from oxidative cell death: a
receptor-independent mechanism, Journal of Pharmacology and
Experimental Therapeutics, vol. 293, no. 3, pp. 807-812.
Chen, Y et al. 2008, Expression of Pkd2l2 in testis is implicated in spermatogenesis,
Biological and Pharmaceutical Bulletin, vol. 31, no. 8, pp. 1496-1500.
Choe, J-Y et al. 2010, Anti-fibrotic effect of thalidomide through inhibiting TGF-β-
induced ERK1/2 pathways in bleomycin-induced lung fibrosis in mice,
Inflammation Research, vol. 59, no. 3, pp. 177-188.
Choi, YH et al. 2001, Doenjang hexane fraction-induced G1 arrest is associated with
the inhibition of pRB phosphorylation and induction of Cdk inhibitor p21 in
human breast carcinoma MCF-7 cells, Oncology Reports, vol. 8, no. 5, pp.
1091-1096.
Christensen, AP and Corey, DP 2007, TRP channels in mechanosensation: direct or
indirect activation?, Nature Reviews Neuroscience, vol. 8, no. 7, pp. 510-521.
Chu, CJ et al. 2003, N-oleoyldopamine, a novel endogenous capsaicin-like lipid that
produces hyperalgesia, Journal of Biological Chemistry, vol. 278, no. 16, pp.
13633-13639.
Chuang, HH et al. 2001, Bradykinin and nerve growth factor release the capsaicin
receptor from PtdIns(4,5)P2-mediated inhibition, Nature, vol. 411, no. 6840,
pp. 957-962.

188
Chung, MK, Guler, AD and Caterina, MJ 2008, TRPV1 shows dynamic ionic
selectivity during agonist stimulation, Nature Neuroscience, vol. 11, no. 5,
pp. 555-564.
Clapham, DE 2003, TRP channels as cellular sensors, Nature, vol. 426, no. 6966, pp.
517-524.
Clapham, DE 2007, SnapShot: mammalian TRP channels, Cell, vol. 129, no. 1, p.
220.
Clapham, DE et al. 2005, International Union of Pharmacology. XLIX.
Nomenclature and structure-function relationships of transient receptor
potential channels, Pharmacological Reviews, vol. 57, no. 4, pp. 427-450.
Clapham, DE et al. 2003, International Union of Pharmacology. XLIII. Compendium
of voltage-gated ion channels: transient receptor potential channels,
Pharmacological Reviews, vol. 55, no. 4, pp. 591-596.
Cohen, SB et al. 2006, Rituximab for rheumatoid arthritis refractory to anti–tumor
necrosis factor therapy: Results of a multicenter, randomized, double‐blind,
placebo‐controlled, phase III trial evaluating primary efficacy and safety at
twenty‐four weeks, Arthritis & Rheumatism, vol. 54, no. 9, pp. 2793-2806.
Contassot, E et al. 2004a, Arachidonyl ethanolamide induces apoptosis of uterine
cervix cancer cells via aberrantly expressed vanilloid receptor-1, Gynecologic
oncology, vol. 93, no. 1, pp. 182-188.
Contassot, E et al. 2004b, Arachidonylethanolamide induces apoptosis of human
glioma cells through vanilloid receptor-1, Journal of Neuropathology and
Experimental Neurology, vol. 63, no. 9, pp. 956-963.
Corey, DP et al. 2004, TRPA1 is a candidate for the mechanosensitive transduction
channel of vertebrate hair cells, Nature, vol. 432, no. 7018, pp. 723-730.
Correll, CC et al. 2004, Cloning and pharmacological characterization of mouse
TRPV1, Neuroscience letters, vol. 370, no. 1, pp. 55-60.
Cortright, DN and Szallasi, A 2004, Biochemical pharmacology of the vanilloid
receptor TRPV1 - An update, European Journal of Biochemistry, vol. 271,
no. 10, pp. 1814-1819.
Couchman, JR 2009, Commercial antibodies: the good, bad, and really ugly, Journal
of Histochemistry and Cytochemistry, vol. 57, no. 1, pp. 7-8.
Darnell, JE, Jr. 2002, Transcription factors as targets for cancer therapy, Nature
Reviews Cancer, vol. 2, no. 10, pp. 740-749.
De Bosscher, K et al. 1997, Glucocorticoid-mediated repression of nuclear factor-
kappaB-dependent transcription involves direct interference with
transactivation, Proceedings of the National Academy of Sciences of the
United States of America, vol. 94, no. 25, pp. 13504-13509.
de Groat, WC 1997, A neurologic basis for the overactive bladder, Urology, vol. 50,
no. 6A Suppl, pp. 36-52; discussion 53-36.
Dedov, VN et al. 2001, Capsaicin-induced depolarisation of mitochondria in dorsal
root ganglion neurons is enhanced by vanilloid receptors, Neuroscience, vol.
103, no. 1, pp. 219-226.
Dedov, VN et al. 2002, Gingerols: a novel class of vanilloid receptor (VR1) agonists,
British journal of pharmacology, vol. 137, no. 6, pp. 793-798.
Delmas, P 2004, Polycystins: from mechanosensation to gene regulation, Cell, vol.
118, no. 2, pp. 145-148.
Delmas, P 2005, Polycystins: polymodal receptor/ion-channel cellular sensors,
Pflugers Archiv (European Journal of Physiology), vol. 451, no. 1, pp. 264-
276.

189
Delmas, P et al. 2004, Gating of the polycystin ion channel signaling complex in
neurons and kidney cells, FASEB Journal, vol. 18, no. 6, pp. 740-742.
den Dekker, E et al. 2003, The epithelial calcium channels, TRPV5 & TRPV6: from
identification towards regulation, Cell Calcium, vol. 33, no. 5-6, pp. 497-507.
Deng, L, Ding, W and Granstein, RD 2003, Thalidomide inhibits tumor necrosis
factor-alpha production and antigen presentation by Langerhans cells,
Journal of Investigative Dermatology, vol. 121, no. 5, pp. 1060-1065.
Dhaka, A, Viswanath, V and Patapoutian, A 2006, Trp ion channels and temperature
sensation, Annual Review of Neuroscience, vol. 29, pp. 135-161.
Di Palma, F et al. 2002, Mutations in Mcoln3 associated with deafness and
pigmentation defects in varitint-waddler (Va) mice, Proceedings of the
National Academy of Sciences of the United States of America, vol. 99, no.
23, pp. 14994-14999.
Dinis, P et al. 2004, Anandamide-Evoked Activation of Vanilloid Receptor 1
Contributes to the Development of Bladder Hyperreflexia and Nociceptive
Transmission to Spinal Dorsal Horn Neurons in Cystitis, The Journal of
Neuroscience, vol. 24, no. 50, pp. 11253-11263.
Docherty, RJ et al. 1996, Inhibition of calcineurin inhibits the desensitization of
capsaicin-evoked currents in cultured dorsal root ganglion neurones from
adult rats, Pflugers Archiv (European Journal of Physiology), vol. 431, no. 6,
pp. 828-837.
Domotor, A et al. 2005, Immunohistochemical distribution of vanilloid receptor,
calcitonin-gene related peptide and substance P in gastrointestinal mucosa of
patients with different gastrointestinal disorders, Inflammopharmacology, vol.
13, no. 1-3, pp. 161-177.
Dou, D et al. 2011, Tumor Cell Growth Inhibition Is Correlated With Levels of
Capsaicin Present in Hot Peppers, Nutrition and Cancer, vol. 63, no. 2, pp.
272-281.
Duncan, LM et al. 2001, Melastatin expression and prognosis in cutaneous malignant
melanoma, Journal of Clinical Oncology, vol. 19, no. 2, pp. 568-576.
Everaerts, W et al. 2009, Where is TRPV1 expressed in the bladder, do we see the
real channel?, Naunyn-Schmiedeberg's Archives of Pharmacology, vol. 379,
no. 4, pp. 421-425.
Faussone-Pellegrini, M-S et al. 2005, Distribution of the vanilloid (capsaicin)
receptor type 1 in the human stomach, Histochemistry and Cell Biology, vol.
124, no. 1, pp. 61-68.
Fernandes, E, Fernandes, M and Keeble, J 2012, The functions of TRPA1 and
TRPV1: moving away from sensory nerves, British Journal of
Pharmacology, vol. 166, no. 2, pp. 510-521.
Ferrer-Montiel, A et al. 2004, Molecular architecture of the vanilloid receptor.
Insights for drug design, European Journal of Biochemistry, vol. 271, no. 10,
pp. 1820-1826.
Fisher, JT 2009, The TRPV1 ion channel: implications for respiratory sensation and
dyspnea, Respiratory Physiology & Neurobiology, vol. 167, no. 1, pp. 45-52.
Fonfria, E et al. 2004, TRPM2 channel opening in response to oxidative stress is
dependent on activation of poly(ADP-ribose) polymerase, British Journal of
Pharmacology, vol. 143, no. 1, pp. 186-192.
Fox, AJ et al. 1996, Bradykinin–evoked sensitization of airway sensory nerves: A
mechanism for ACE–inhibitor cough, Nature Medicine, vol. 2, no. 7, pp. 814-
817.

190
Fukuoka, K et al. 2000, Mechanism of action of aragusterol a (YTA0040), a potent
anti-tumor marine steroid targeting the G(1) phase of the cell cycle,
International Journal of Cancer, vol. 88, no. 5, pp. 810-819.
Gabay, C 2006, Interleukin-6 and chronic inflammation, Arthritis Research and
Therapy, vol. 8 Suppl 2, p. S3.
Gailly, P 2012, TRP channels in normal and dystrophic skeletal muscle, Current
Opinion in Pharmacology, vol. 12, no. 3, pp. 326-334.
Gallo, EM, Cante-Barrett, K and Crabtree, GR 2006, Lymphocyte calcium signaling
from membrane to nucleus, Nature Immunology, vol. 7, no. 1, pp. 25-32.
Gavva, NR et al. 2004, Molecular determinants of vanilloid sensitivity in TRPV1,
Journal of Biological Chemistry, vol. 279, no. 19, pp. 20283-20295.
Geppetti, P and Trevisani, M 2004, Activation and sensitisation of the vanilloid
receptor: role in gastrointestinal inflammation and function, British Journal
of Pharmacology, vol. 141, no. 8, pp. 1313-1320.
Gertsch, J et al. 2002, Relative quantification of mRNA levels in Jurkat T cells with
RT-real time-PCR (RT-rt-PCR): new possibilities for the screening of anti-
inflammatory and cytotoxic compounds, Pharmaceutical Research, vol. 19,
no. 8, pp. 1236-1243.
Ghosh, AK and Basu, S 2010, Fas-associated factor 1 is a negative regulator in
capsaicin induced cancer cell apoptosis, Cancer letters, vol. 287, no. 2, pp.
142-149.
Giamarchi, A et al. 2006, The versatile nature of the calcium-permeable cation
channel TRPP2, EMBO Reports, vol. 7, no. 8, pp. 787-793.
Gil, YG and Kang, MK 2008, Capsaicin induces apoptosis and terminal
differentiation in human glioma A172 cells [Abstract only], Life Sciences,
vol. 82, no. 19-20, pp. 997-1003.
Gilmore, TD 2006, Introduction to NF-kappaB: players, pathways, perspectives,
Oncogene, vol. 25, no. 51, pp. 6680-6684.
Giuliano, M et al. 2006, Anandamide-induced apoptosis in Chang liver cells involves
ceramide and JNK/AP-1 pathway, International Journal of Molecular
Medicine, vol. 17, no. 5, pp. 811-819.
Gkika, D and Prevarskaya, N 2009, Molecular mechanisms of TRP regulation in
tumor growth and metastasis, Biochimica et Biophysica Acta (BBA)-
Molecular Cell Research, vol. 1793, no. 6, pp. 953-958.
Gong, XF, Wang, MW and Ikejima, T 2005, [Mechanisms of capsaicin-induced
apoptosis of human melanoma A375-S2 cells], Zhonghua Zhong Liu Za Zhi
(Chinese Journal of Oncology), vol. 27, no. 7, pp. 401-403.
Gossen, M and Bujard, H 1992, Tight control of gene expression in mammalian cells
by tetracycline-responsive promoters, Proceedings of the National Academy
of Sciences of the United States of America, vol. 89, no. 12, pp. 5547-5551.
Goswami, C et al. 2006, Rapid disassembly of dynamic microtubules upon activation
of the capsaicin receptor TRPV1, Journal of Neurochemistry, vol. 96, no. 1,
pp. 254-266.
Goswami, C et al. 2010, TRPV1 acts as a synaptic protein and regulates vesicle
recycling, Science Signalling, vol. 123, no. 12, p. 2045.
Grant, ER et al. 2002, Simultaneous intracellular calcium and sodium flux imaging in
human vanilloid receptor 1 (VR1)-transfected human embryonic kidney cells:
a method to resolve ionic dependence of VR1-mediated cell death, Journal of
Pharmacology and Experimental Therapeutics, vol. 300, no. 1, pp. 9-17.

191
Green, DR and Reed, JC 1998, Mitochondria and apoptosis, Science(Washington),
vol. 281, no. 5381, pp. 1309-1312.
Grimm, C et al. 2007, A helix-breaking mutation in TRPML3 leads to constitutive
activity underlying deafness in the varitint-waddler mouse, Proceedings of
the National Academy of Sciences of the United States of America, vol. 104,
no. 49, pp. 19583-19588.
Grimm, C et al. 2003, Molecular and Functional Characterization of the Melastatin-
related Cation Channel TRPM3, Journal of Biological Chemistry, vol. 278,
no. 24, pp. 21493-21501.
Grimm, C et al. 2005, Activation of the melastatin-related cation channel TRMP3 by
D-erythro-sphingosine, Molecular Pharmacology, vol. 67, no. 3, pp. 798-805.
Grivennikov, SI and Karin, M 2011, Inflammatory cytokines in cancer: tumour
necrosis factor and interleukin 6 take the stage, Annals of the Rheumatic
Diseases, vol. 70 Suppl 1, pp. i104-108.
Gross, SA et al. 2009, TRPC5 Is a Ca2+-activated Channel Functionally Coupled to
Ca2+-selective Ion Channels, Journal of Biological Chemistry, vol. 284, no.
49, pp. 34423-34432.
Grycova, L et al. 2012, Integrative Binding Sites within Intracellular Termini of
TRPV1 Receptor, PLoS One, vol. 7, no. 10, p. e48437.
Gunthorpe, MJ et al. 2002, The diversity in the vanilloid (TRPV) receptor family of
ion channels, Trends in Pharmacological Sciences, vol. 23, no. 4, pp. 183-
191.
Gunthorpe, MJ and Chizh, BA 2009, Clinical development of TRPV1 antagonists:
targeting a pivotal point in the pain pathway, Drug Discovery Today, vol. 14,
no. 1, pp. 56-67.
Guo, A et al. 1999, Immunocytochemical localization of the vanilloid receptor 1
(VR1): relationship to neuropeptides, the P2X3 purinoceptor and IB4 binding
sites, European Journal of Neuroscience, vol. 11, no. 3, pp. 946-958.
Guo, L et al. 2000, Identification and characterization of a novel polycystin family
member, polycystin-L2, in mouse and human: sequence, expression,
alternative splicing, and chromosomal localization, Genomics, vol. 64, no. 3,
pp. 241-251.
Gupta, D et al. 2001, Adherence of multiple myeloma cells to bone marrow stromal
cells upregulates vascular endothelial growth factor secretion: therapeutic
applications, Leukemia, vol. 15, no. 12, pp. 1950-1961.
Habler, HJ, Janig, W and Koltzenburg, M 1990, Activation of unmyelinated afferent
fibres by mechanical stimuli and inflammation of the urinary bladder in the
cat, Journal of Physiology, vol. 425, pp. 545-562.
Hail Jr, N and Lotan, R 2002, Examining the role of mitochondrial respiration in
vanilloid-induced apoptosis, JNCI Journal of the National Cancer Institute,
vol. 94, no. 17, p. 1281.
Han, S et al. 2002, Suppression of phorbol ester-induced NF- B activation by
capsaicin in cultured human promyelocytic leukemia cells, Archives of
Pharmacal Research, vol. 25, no. 4, pp. 475-479.
Hara, Y et al. 2002, LTRPC2 Ca2+-permeable channel activated by changes in redox
status confers susceptibility to cell death, Molecular Cell, vol. 9, no. 1, pp.
163-173.
Hartel, M et al. 2006, Vanilloids in pancreatic cancer: potential for chemotherapy
and pain management, Gut, vol. 55, no. 4, pp. 519-528.

192
Harteneck, C and Schultz, G 2007, TRPV4 and TRPM3 as Volume-Regulated
Cation Channels in WB Liedtke & S Heller (eds), TRP Ion Channel Function
in Sensory Transduction and Cellular Signaling Cascades., CRC Press.
He, LP et al. 2005, A functional link between store-operated and TRPC channels
revealed by the 3,5-bis(trifluoromethyl)pyrazole derivative, BTP2, Journal of
Biological Chemistry, vol. 280, no. 12, pp. 10997-11006.
Hecquet, CM, Ahmmed, GU and Malik, AB 2010, TRPM2 channel regulates
endothelial barrier function, Advances in Experimental Medicine and
Biology, vol. 661, pp. 155-167.
Heiner, I et al. 2003, Expression profile of the transient receptor potential (TRP)
family in neutrophil granulocytes: evidence for currents through long TRP
channel 2 induced by ADP-ribose and NAD, Biochemical Journal, vol. 371,
no. Pt 3, pp. 1045-1053.
Hellwig, N et al. 2004, TRPV1 acts as proton channel to induce acidification in
nociceptive neurons, Journal of Biological Chemistry, vol. 279, no. 33, pp.
34553-34561.
Higenbottam, T 2002, Chronic cough and the cough reflex in common lung diseases,
Pulmonary Pharmacology & Therapeutics, vol. 15, no. 3, pp. 241-247.
Himi, N et al. 2012, Calcium influx through the TRPV1 channel of endothelial cells
(ECs) correlates with a stronger adhesion between monocytes and ECs,
Advances in Medical Sciences, vol. 57, no. 2, pp. 224-229.
Hinuma, Y et al. 1981, Adult T-cell leukemia: antigen in an ATL cell line and
detection of antibodies to the antigen in human sera, Proceedings of the
National Academy of Sciences, vol. 78, no. 10, p. 6476.
Hofmann, T et al. 1999, Direct activation of human TRPC6 and TRPC3 channels by
diacylglycerol, Nature, vol. 397, no. 6716, pp. 259-263.
Holzer, P 2008, The pharmacological challenge to tame the transient receptor
potential vanilloid-1 (TRPV1) nocisensor, British Journal of Pharmacology,
vol. 155, no. 8, pp. 1145-1162.
Hu, HZ et al. 2004, 2-aminoethoxydiphenyl borate is a common activator of TRPV1,
TRPV2, and TRPV3, Journal of Biological Chemistry, vol. 279, no. 34, pp.
35741-35748.
Huang, J et al. 2010, Ginsenoside Rb1 and paeoniflorin inhibit transient receptor
potential vanilloid-1-activated IL-8 and PGE2 production in a human
keratinocyte cell line HaCaT, International Immunopharmacology, vol. 10,
no. 10, pp. 1279-1283.
Huang, SM et al. 2002, An endogenous capsaicin-like substance with high potency at
recombinant and native vanilloid VR1 receptors, Proceedings of the National
Academy of Sciences of the United States of America, vol. 99, no. 12, pp.
8400-8405.
Huang, SP et al. 2009, Capsaicin-induced apoptosis in human hepatoma HepG2
cells, Anticancer Research, vol. 29, no. 1, pp. 165-174.
Huh, H-C et al. 2011, Capsaicin Induces Apoptosis of Cisplatin-Resistant Stomach
Cancer Cells by Causing Degradation of Cisplatin-Inducible Aurora-A
Protein, Nutrition and Cancer, vol. 63, no. 7, pp. 1095-1103.
Hulspas, R et al. 2009, Considerations for the control of background fluorescence in
clinical flow cytometry, Cytometry Part B: Clinical Cytometry, vol. 76, no. 6,
pp. 355-364.

193
Ikonomidis, I et al. 1999, Increased Proinflammatory Cytokines in Patients With
Chronic Stable Angina and Their Reduction By Aspirin, Circulation, vol.
100, no. 8, pp. 793-798.
Inada, H, Iida, T and Tominaga, M 2006, Different expression patterns of TRP
genes in murine B and T lymphocytes, Biochemical and Biophysical
Research Communications, vol. 350, no. 3, pp. 762-767.
Inoue, R et al. 2006, Transient receptor potential channels in cardiovascular function
and disease, Circulation Research, vol. 99, no. 2, pp. 119-131.
Inoue, R, Jian, Z and Kawarabayashi, Y 2009, Mechanosensitive TRP channels in
cardiovascular pathophysiology, Pharmacology & Therapeutics, vol. 123, no.
3, pp. 371-385.
Ip, S-W et al. 2012, Capsaicin mediates apoptosis in human nasopharyngeal
carcinoma NPC-TW 039 cells through mitochondrial depolarization and
endoplasmic reticulum stress, Human & Experimental Toxicology, vol. 31,
no. 6, pp. 539-549.
Ito, K et al. 2004, Induction of apoptosis in leukemic cells by homovanillic acid
derivative, capsaicin, through oxidative stress: implication of phosphorylation
of p53 at Ser-15 residue by reactive oxygen species, Cancer Research, vol.
64, no. 3, pp. 1071-1078.
Ito, N et al. 2013, Capsaicin mimics mechanical load-induced intracellular signaling
events: Involvement of TRPV1-mediated calcium signaling in induction of
skeletal muscle hypertrophy, Channels, vol. 7, no. 3, pp. 221-224.
Jacobsson, SO, Wallin, T and Fowler, CJ 2001, Inhibition of rat C6 glioma cell
proliferation by endogenous and synthetic cannabinoids. Relative
involvement of cannabinoid and vanilloid receptors, Journal of
Pharmacology and Experimental Therapeutics, vol. 299, no. 3, pp. 951-959.
Jaggar, SI et al. 2001, The capsaicin analogue SDZ249-665 attenuates the hyper-
reflexia and referred hyperalgesia associated with inflammation of the rat
urinary bladder, Pain, vol. 89, no. 2-3, pp. 229-235.
Jancso´, N 1960, Role of the nerve terminals in the mechanism of inflammatory
reactions, Bull Millard Fillmore Hosp, vol. 7, pp. 53–77.
Jeon, M et al. 2008, Biotin-avidin mediated competitive enzyme-linked
immunosorbent assay to detect residues of tetracyclines in milk,
Microchemical Journal, vol. 88, no. 1, pp. 26-31.
Jeske, NA et al. 2009, A-kinase anchoring protein 150 controls protein kinase C-
mediated phosphorylation and sensitization of TRPV1, Pain, vol. 146, no. 3,
pp. 301-307.
Jia, J et al. 2011, Sex differences in neuroprotection provided by inhibition of
TRPM2 channels following experimental stroke, Journal of Cerebral Blood
Flow and Metabolism, vol. 31, no. 11, pp. 2160-2168.
Jia, Y, McLeod, RL and Hey, JA 2005, TRPV1 receptor: a target for the treatment
of pain, cough, airway disease and urinary incontinence, Drug News and
Perspectives, vol. 18, no. 3, pp. 165-171.
Jia, Y et al. 2002, Anandamide induces cough in conscious guinea-pigs through VR1
receptors, British Journal of Pharmacology, vol. 137, no. 6, pp. 831-836.
Jin, X and Gereau, RW 2006, Acute p38-mediated modulation of tetrodotoxin-
resistant sodium channels in mouse sensory neurons by tumor necrosis factor-
α, The Journal of neuroscience, vol. 26, no. 1, pp. 246-255.

194
Joe, B and Lokesh, BR 1994, Role of capsaicin, curcumin and dietary n-3 fatty acids
in lowering the generation of reactive oxygen species in rat peritoneal
macrophages, Biochimica et Biophysica Acta, vol. 1224, no. 2, pp. 255-263.
Johansen, ME, Reilly, CA and Yost, GS 2006, TRPV1 antagonists elevate cell
surface populations of receptor protein and exacerbate TRPV1-mediated
toxicities in human lung epithelial cells, Toxicological Sciences, vol. 89, no.
1, pp. 278-286.
Johnson, DA et al. 1984, Improved technique utilizing nonfat dry milk for analysis of
proteins and nucleic acids transferred to nitrocellulose, Gene Analysis
Techniques, vol. 1, no. 1, pp. 3-8.
Jordt, SE and Julius, D 2002, Molecular basis for species-specific sensitivity to "hot"
chili peppers, Cell, vol. 108, no. 3, pp. 421-430.
Julius, D and Basbaum, AI 2001, Molecular mechanisms of nociception, Nature, vol.
413, no. 6852, pp. 203-210.
Jun, HS et al. 2007, Capsaicin induced apoptosis of B16-F10 melanoma cells through
down-regulation of Bcl-2, Food and Chemical Toxicology, vol. 45, no. 5, pp.
708-715.
Jung, C et al. 2011, A gain-of-function SNP in TRPC4 cation channel protects
against myocardial infarction, Cardiovascular Research, vol. 91, no. 3, pp.
465-471.
Jung, J et al. 2004, Phosphorylation of vanilloid receptor 1 by Ca2+/calmodulin-
dependent kinase II regulates its vanilloid binding, Journal of Biological
Chemistry, vol. 279, no. 8, pp. 7048-7054.
Kalogris, C et al. 2010, Expression of transient receptor potential vanilloid-1
(TRPV1) in urothelial cancers of human bladder: relation to
clinicopathological and molecular parameters, Histopathology, vol. 57, no. 5,
pp. 744-752.
Kaneko, T et al. 1994, Capsaicin reduces ozone-induced airway inflammation in
guinea pigs, American Journal of Respiratory and Critical Care Medicine,
vol. 150, no. 3, p. 724.
Kanzaki, M et al. 1999, Translocation of a calcium-permeable cation channel
induced by insulin-like growth factor-I, Nature Cell Biology, vol. 1, no. 3, pp.
165-170.
Kaszas, K et al. 2012, Small molecule positive allosteric modulation of TRPV1
activation by vanilloids and acidic pH, Journal of Pharmacology and
Experimental Therapeutics, vol. 340, no. 1, pp. 152-160.
Khairatkar-Joshi, N and Szallasi, A 2009, TRPV1 antagonists: the challenges for
therapeutic targeting, Trends in Molecular Medicine, vol. 15, no. 1, pp. 14-
22.
Khalafallah, A et al. 2010, Effect of immunoglobulin therapy on the rate of
infections in multiple myeloma patients undergoing autologous stem cell
transplantation or treated with immunomodulatory agents, Mediterranean
Journal of Hematology and Infectious Diseases, vol. 2, no. 1, p. e2010005.
Khan, N, Afaq, F and Mukhtar, H 2007, Apoptosis by dietary factors: the suicide
solution for delaying cancer growth, Carcinogenesis, vol. 28, no. 2, p. 233.
Kim, H et al. 2004, Genetic influence on variability in human acute experimental
pain sensitivity associated with gender, ethnicity and psychological
temperament, Pain, vol. 109, no. 3, pp. 488-496.
Kim, J-A, Kang, Y and Lee, Y 2005, A phospholipase c-dependent intracellular
ca2+ release pathway mediates the capsaicin-induced apoptosis in HepG2

195
human hepatoma cells, Archives of Pharmacal Research, vol. 28, no. 1, pp.
73-80.
Kim, JY et al. 2010, Capsaicin sensitizes malignant glioma cells to TRAIL-mediated
apoptosis via DR5 upregulation and survivin downregulation,
Carcinogenesis, vol. 31, no. 3, pp. 367-375.
Kim, M-J, Kim, M-K and Kang, J-S 2006a, An epitope shared by cellular
cytokeratin and Orientia tsutsugamushi, Microbial Pathogenesis, vol. 41, no.
4–5, pp. 125-132.
Kim, MY 2012, Nitric oxide triggers apoptosis in A375 human melanoma cells
treated with capsaicin and resveratrol, Molecular Medicine Reports, vol. 5,
no. 2, pp. 585-591.
Kim, S, Silver, M and DeCoursey, T 1996, I. Ion Channels in Human THP-1
Monocytes, The Journal of membrane biology, vol. 152, no. 2, pp. 117-130.
Kim, SR et al. 2006b, Transient receptor potential vanilloid subtype 1 mediates
microglial cell death in vivo and in vitro via Ca2+-mediated mitochondrial
damage and cytochrome c release, Journal of Immunology, vol. 177, no. 7,
pp. 4322-4329.
Kissin, I 2008, Vanilloid-Induced Conduction Analgesia: Selective, Dose-
Dependent, Long-Lasting, with a Low Level of Potential Neurotoxicity,
Anesthesia & Analgesia, vol. 107, no. 1, p. 271.
Kiyonaka, S et al. 2009, Selective and direct inhibition of TRPC3 channels underlies
biological activities of a pyrazole compound, Proceedings of the National
Academy of Sciences of the United States of America, vol. 106, no. 13, pp.
5400-5405.
Knotkova, H, Pappagallo, M and Szallasi, A 2008, Capsaicin (TRPV1 Agonist)
therapy for pain relief: farewell or revival?, The Clinical journal of pain, vol.
24, no. 2, p. 142.
Ko, L and Prives, C 1996, p53: puzzle and paradigm, Genes and Development, vol.
10, no. 9, pp. 1054-1072.
Koplas, PA, Rosenberg, RL and Oxford, GS 1997, The role of calcium in the
desensitization of capsaicin responses in rat dorsal root ganglion neurons,
Journal of Neuroscience, vol. 17, no. 10, pp. 3525-3537.
Kopp, E and Ghosh, S 1994, Inhibition of NF-kappa B by sodium salicylate and
aspirin, Science, vol. 265, no. 5174, pp. 956-959.
Koto, H et al. 1995, An important role of tachykinins in ozone-induced airway
hyperresponsiveness, American Journal of Respiratory and Critical Care
Medicine, vol. 151, no. 6, p. 1763.
Krause, KH et al. 1990, The calcium signal and neutrophil activation, Clinical
Biochemistry, vol. 23, no. 2, pp. 159-166.
Krump, E et al. 1995, Leukotriene synthesis in calcium-depleted human neutrophils:
arachidonic acid release correlates with calcium influx, Biochemical Journal,
vol. 310 ( Pt 2), pp. 681-688.
Kunde, D, Yingchoncharoen, J and Geraghty, D 2009, 'Transient receptor potential
vanilloid 1 (TRPV1) IN the THP-1 monocytic cell line', paper presented to
ASCEPT, Sydney.
Kunde, DA et al. 2010, 'Transient receptor potential vanilloid 1 (TRPV1) in naive
and THP-1 monocytes: role in cytokine release'.
Kwong, Y-L 2010, Azathioprine: association with therapy-related myelodysplastic
syndrome and acute myeloid leukemia, The Journal of Rheumatology, vol.
37, no. 3, pp. 485-490.

196
Lai, JP, Douglas, SD and Ho, WZ 1998, Human lymphocytes express substance P
and its receptor, Journal of Neuroimmunology, vol. 86, no. 1, pp. 80-86.
Lajoie, P et al. 2009, Lattices, rafts, and scaffolds: domain regulation of receptor
signaling at the plasma membrane, The Journal of cell biology, vol. 185, no.
3, pp. 381-385.
Lakin, N and Jackson, S 1999, Regulation of p53 in response to DNA damage,
Oncogene, vol. 18, no. 53, p. 7644.
Lalloo, UG et al. 1995, Capsazepine inhibits cough induced by capsaicin and citric
acid but not by hypertonic saline in guinea pigs, Journal of Applied
Physiology, vol. 79, no. 4, p. 1082.
Lalloo, UG et al. 1998, Increased sensitivity of the cough reflex in progressive
systemic sclerosis patients with interstitial lung disease, European
Respiratory Journal, vol. 11, no. 3, p. 702.
LaPlante, JM et al. 2002, Identification and characterization of the single channel
function of human mucolipin-1 implicated in mucolipidosis type IV, a
disorder affecting the lysosomal pathway, FEBS Letters, vol. 532, no. 1-2, pp.
183-187.
Launay, P et al. 2004, TRPM4 regulates calcium oscillations after T cell activation,
Science, vol. 306, no. 5700, pp. 1374-1377.
Lazzeri, M et al. 2005, Transient receptor potential vanilloid type 1 (TRPV1)
expression changes from normal urothelium to transitional cell carcinoma of
human bladder, European Urology, vol. 48, no. 4, pp. 691-698.
Lee, YM, Kim, YK and Chung, JH 2009, Increased expression of TRPV1 channel in
intrinsically aged and photoaged human skin in vivo, Experimental
Dermatology, vol. 18, no. 5, pp. 431-436.
Lee, YS et al. 2004, Involvement of NADPH Oxidase-mediated Generation of
Reactive Oxygen Species in the Apototic Cell Death by Capsaicin in HepG2
Human Hepatoma Cells, Free Radical Research, vol. 38, no. 4, pp. 405-412.
Lee, YS, Nam, DH and Kim, J 2000, Induction of apoptosis by capsaicin in A172
human glioblastoma cells, Cancer Letters, vol. 161, no. 1, pp. 121-130.
Lievremont, JP et al. 2005, The role of canonical transient receptor potential 7 in B-
cell receptor-activated channels, Journal of Biological Chemistry, vol. 280,
no. 42, pp. 35346-35351.
Lilja, J, Laulund, F and Forsby, A 2007a, Insulin and insulin-like growth factor
type-I up-regulate the vanilloid receptor-1 (TRPV1) in stably TRPV1-
expressing SH-SY5Y neuroblastoma cells, Journal of Neuroscience
Research, vol. 85, no. 7, pp. 1413-1419.
Lilja, J, Lindegren, H and Forsby, A 2007b, Surfactant-Induced TRPV1 Activity- A
Novel Mechanism for Eye Irritation?, Toxicological Sciences, vol. 99, no. 1,
pp. 174-180.
Lin, CH et al. 2013, Capsaicin induces cell cycle arrest and apoptosis in human KB
cancer cells, BMC Complementary and Alternative Medicine, vol. 13, p. 46.
Lin, H, Juang, J-L and Wang, PS 2004, Involvement of Cdk5/p25 in digoxin-
triggered prostate cancer cell apoptosis, Journal of Biological Chemistry, vol.
279, no. 28, pp. 29302-29307.
Link, TM et al. 2010, TRPV2 has a pivotal role in macrophage particle binding and
phagocytosis, Nature Immunology, vol. 11, no. 3, pp. 232-239.
Lishko, PV et al. 2007, The ankyrin repeats of TRPV1 bind multiple ligands and
modulate channel sensitivity, Neuron, vol. 54, no. 6, pp. 905-918.

197
Liu, B, Zhang, C and Qin, F 2005, Functional recovery from desensitization of
vanilloid receptor TRPV1 requires resynthesis of phosphatidylinositol 4,5-
bisphosphate, Journal of Neuroscience, vol. 25, no. 19, pp. 4835-4843.
Lowdell, MW 2001, Data analysis in flow cytometry, in DA. McCarthy & M Macey
(eds), Cytometric Analysis of Cell Phenotype and Function., Cambridge
University Press Cambridge, UK, pp. 89-99.
Loyd, DR, Chen, PB and Hargreaves, KM 2012, Anti-hyperalgesic effects of anti-
serotonergic compounds on serotonin-and capsaicin-evoked thermal
hyperalgesia in the rat, Neuroscience, vol. 203, pp. 207-215.
Lukacs, V et al. 2007, Dual regulation of TRPV1 by phosphoinositides, Journal of
Neuroscience, vol. 27, no. 26, pp. 7070-7080.
Lundberg, JM and Saria, A 1983, Capsaicin-induced desensitization of airway
mucosa to cigarette smoke, mechanical and chemical irritants, Nature, vol.
302, pp. 251 - 253.
Lundblad, L and Lundberg, JM 1984, Capsaicin sensitive sensory neurons mediate
the response to nasal irritation induced by the vapour phase of cigarette
smoke, Toxicology, vol. 33, no. 1, pp. 1-7.
Ma, L et al. 2011, Activation of TRPV1 reduces vascular lipid accumulation and
attenuates atherosclerosis, Cardiovascular Research, vol. 92, no. 3, pp. 504-
513.
Maccarrone, M et al. 2000, Anandamide induces apoptosis in human cells via
vanilloid receptors. Evidence for a protective role of cannabinoid receptors,
Journal of Biological Chemistry, vol. 275, no. 41, pp. 31938-31945.
Macho, A et al. 1999, Selective induction of apoptosis by capsaicin in transformed
cells: the role of reactive oxygen species and calcium, Cell Death &
Differentiation, vol. 6, no. 2, pp. 155-165.
Macpherson, LJ et al. 2005, The pungency of garlic: activation of TRPA1 and
TRPV1 in response to allicin, Current Biology, vol. 15, no. 10, pp. 929-934.
Maecker, HT and Trotter, J 2006, Flow cytometry controls, instrument setup, and the
determination of positivity, Cytometry Part A, vol. 69, no. 9, pp. 1037-1042.
Majeed, Y et al. 2011, Rapid and Contrasting Effects of Rosiglitazone on Transient
Receptor Potential TRPM3 and TRPC5 Channels, Molecular Pharmacology,
vol. 79, no. 6, pp. 1023-1030.
Malagarie-Cazenave, S et al. 2011, The vanilloid capsaicin induces IL-6 secretion in
prostate PC-3 cancer cells, Cytokine, vol. 54, no. 3, pp. 330-337.
Mandadi, S et al. 2006, Increased sensitivity of desensitized TRPV1 by PMA occurs
through PKCepsilon-mediated phosphorylation at S800, Pain, vol. 123, no. 1-
2, pp. 106-116.
Marchalant, Y et al. 2009, Cannabinoids attenuate the effects of aging upon
neuroinflammation and neurogenesis, Neurobiology of Disease, vol. 34, no.
2, pp. 300-307.
Marchand, F, Perretti, M and McMahon, SB 2005, Role of the immune system in
chronic pain, Nature Reviews Neuroscience, vol. 6, no. 7, pp. 521-532.
Marincsák, R et al. 2009, Increased expression of TRPV1 in squamous cell
carcinoma of the human tongue, Oral Diseases, vol. 15, no. 5, pp. 328-335.
Maroto, R et al. 2005, TRPC1 forms the stretch-activated cation channel in
vertebrate cells, Nature Cell Biology, vol. 7, no. 2, pp. 179-185.
Massa, F, Storr, M and Lutz, B 2005, The endocannabinoid system in the
physiology and pathophysiology of the gastrointestinal tract, Journal of
Molecular Medicine, vol. 83, no. 12, pp. 944-954.

198
Matthews, PJ et al. 2004, Increased capsaicin receptor TRPV1 nerve fibres in the
inflamed human oesophagus, European Journal of Gastroenterology and
Hepatology, vol. 16, no. 9, pp. 897-902.
McKemy, DD, Neuhausser, WM and Julius, D 2002, Identification of a cold
receptor reveals a general role for TRP channels in thermosensation, Nature,
vol. 416, no. 6876, pp. 52-58.
Meggs, W 1993, Neurogenic inflammation and sensitivity to environmental
chemicals, Environmental Health Perspectives, vol. 101, no. 3, p. 234.
Mergler, S et al. 2012, Thermo-sensitive transient receptor potential vanilloid
channel-1 regulates intracellular calcium and triggers chromogranin A
secretion in pancreatic neuroendocrine BON-1 tumor cells, Cellular
Signalling, vol. 24, no. 1, pp. 233-246.
Messeguer, A, Planells-Cases, R and Ferrer-Montiel, A 2006, Physiology and
pharmacology of the vanilloid receptor, Current Neuropharmacology, vol. 4,
no. 1, p. 1.
Miao, X et al. 2008, High expression of vanilloid receptor-1 is associated with better
prognosis of patients with hepatocellular carcinoma, Cancer Genetics and
Cytogenetics, vol. 186, no. 1, pp. 25-32.
Milligan, DL and Koshland, DE 1988, Site-directed cross-linking. Establishing the
dimeric structure of the aspartate receptor of bacterial chemotaxis, Journal of
Biological Chemistry, vol. 263, no. 13, pp. 6268-6275.
Minke, B 2006, TRP channels and Ca2+ signaling, Cell Calcium, vol. 40, no. 3, pp.
261-275.
Mitsiades, N et al. 2002, Molecular sequelae of proteasome inhibition in human
multiple myeloma cells, Proceedings of the National Academy of Sciences of
the United States of America, vol. 99, no. 22, pp. 14374-14379.
Miyashita, T and Reed, J 1995, Tumor suppressor p53 is a direct transcriptional
activator of the human bax gene., Cell, vol. 80, no. 2, pp. 293-299.
Mizrak, SC et al. 2008, Spermatogonial stem cell sensitivity to capsaicin: an in vitro
study, Reproductive Biology and Endocrinology, vol. 6, p. 52.
Mohapatra, DP and Nau, C 2003, Desensitization of capsaicin-activated currents in
the vanilloid receptor TRPV1 is decreased by the cyclic AMP-dependent
protein kinase pathway, Journal of Biological Chemistry, vol. 278, no. 50, pp.
50080-50090.
Mohapatra, DP and Nau, C 2005, Regulation of Ca2+-dependent desensitization in
the vanilloid receptor TRPV1 by calcineurin and cAMP-dependent protein
kinase, Journal of Biological Chemistry, vol. 280, no. 14, pp. 13424-13432.
Monsereenusorn, Y, Kongsamut, S and Pezalla, PD 1982, Capsaicin--a literature
survey, Critical Reviews in Toxicology, vol. 10, no. 4, pp. 321-339.
Monteilh-Zoller, MK et al. 2003, TRPM7 provides an ion channel mechanism for
cellular entry of trace metal ions, Journal of General Physiology, vol. 121,
no. 1, pp. 49-60.
Montell, C 2005, The TRP superfamily of cation channels, Science Signaling, vol.
2005, no. 272, p. re3.
Moon, D-O et al. 2010, Rosmarinic acid sensitizes cell death through suppression of
TNF-α-induced NF-κB activation and ROS generation in human leukemia
U937 cells, Cancer Letters, vol. 288, no. 2, pp. 183-191.
Moqrich, A et al. 2005, Impaired thermosensation in mice lacking TRPV3, a heat
and camphor sensor in the skin, Science, vol. 307, no. 5714, pp. 1468-1472.

199
Moreau, C et al. 2013, Structure–Activity Relationship of Adenosine 5′-
diphosphoribose at the Transient Receptor Potential Melastatin 2 (TRPM2)
Channel: Rational Design of Antagonists, Journal of Medicinal Chemistry,
vol. 56, no. 24, pp. 10079-10102.
Mori, Y et al. 2002, Transient receptor potential 1 regulates capacitative Ca(2+) entry
and Ca(2+) release from endoplasmic reticulum in B lymphocytes, Journal of
Experimental Medicine, vol. 195, no. 6, pp. 673-681.
Morre, D et al. 1996, Capsaicin inhibits plasma membrane NADH oxidase and
growth of human and mouse melanoma lines, European Journal of Cancer,
vol. 32, no. 11, pp. 1995-2003.
Morré, DJ, Chueh, PJ and Morré, DM 1995, Capsaicin inhibits preferentially the
NADH oxidase and growth of transformed cells in culture, Proceedings of
the National Academy of Sciences, vol. 92, no. 6, p. 1831.
Morris, JB, Stanek, J and Gianutsos, G 1999, Sensory nerve-mediated immediate
nasal responses to inspired acrolein, Journal of Applied Physiology, vol. 87,
no. 5, p. 1877.
Nadler, MJ et al. 2001, LTRPC7 is a Mg.ATP-regulated divalent cation channel
required for cell viability, Nature, vol. 411, no. 6837, pp. 590-595.
Nagy, I et al. 2004, The role of the vanilloid (capsaicin) receptor (TRPV1) in
physiology and pathology, European Journal of Pharmacology, vol. 500, no.
1-3, pp. 351-369.
Nakayama, GR et al. 1997, Assessment of the Alamar Blue assay for cellular growth
and viability in vitro, Journal of Immunological Methods, vol. 204, no. 2, pp.
205-208.
Nathan, JD et al. 2002, Primary sensory neurons: a common final pathway for
inflammation in experimental pancreatitis in rats, American Journal of
Physiology. Gastrointestinal and Liver Physiology, vol. 283, no. 4, pp. G938-
946.
Niimi, A et al. 2004, Reduced pH and chloride levels in exhaled breath condensate of
patients with chronic cough, Thorax, vol. 59, no. 7, p. 608.
Nilius, B 2007, TRP channels in disease, Biochimica Et Biophysica Acta-Molecular
Basis of Disease, vol. 1772, no. 8, pp. 805-812.
Nilius, B et al. 2007, Transient receptor potential cation channels in disease,
Physiological Reviews, vol. 87, no. 1, pp. 165-217.
Nilius, B and Voets, T 2005, TRP channels: a TR(I)P through a world of
multifunctional cation channels, Pflugers Archiv (European Journal of
Physiology), vol. 451, no. 1, pp. 1-10.
Nilius, B, Voets, T and Peters, J 2005, TRP channels in disease, Science's STKE,
vol. 2005, no. 295, p. re8.
Nilius, B et al. 2004, TRPV4 calcium entry channel: a paradigm for gating diversity,
American Journal of Physiology. Cell Physiology, vol. 286, no. 2, pp. C195-
205.
Nilsson, G, Alving, K and Ahlstedt, S 1991, Effects on immune responses in rats
after neuromanipulation with capsaicin, International Journal of
Immunopharmacology, vol. 13, no. 1, pp. 21-26.
Numaga, T et al. 2010, Ca2+ influx and protein scaffolding via TRPC3 sustain
PKCbeta and ERK activation in B cells, Journal of Cell Science, vol. 123, no.
Pt 6, pp. 927-938.
O'Connell, F et al. 1996, Capsaicin cough sensitivity increases during upper
respiratory infection, Respiratory Medicine, vol. 90, no. 5, pp. 279-286.

200
O'Connell, PJ, Pingle, SC and Ahern, GP 2005, Dendritic cells do not transduce
inflammatory stimuli via the capsaicin receptor TRPV1, FEBS Letters, vol.
579, no. 23, pp. 5135-5139.
O'Gorman, MR et al. 1993, A rapid whole blood lysis technique for the diagnosis of
moderate or severe leukocyte adhesion deficiency (LAD), Annals of the New
York Academy of Sciences, vol. 677, pp. 427-430.
O'Gorman, MR and Thomas, J 1999, Isotype controls--time to let go?, Cytometry,
vol. 38, no. 2, pp. 78-80.
Obreja, O et al. 2002, IL-1β potentiates heat-activated currents in rat sensory
neurons: involvement of IL-1RI, tyrosine kinase, and protein kinase C, The
FASEB journal, vol. 16, no. 12, pp. 1497-1503.
Okimura, Y et al. 2007, Regulation of 5-aminolevulinic acid-dependent
protoporphyrin IX accumulations in human histiocytic lymphoma U937 cells,
Physiological Chemistry and Physics and Medical NMR, vol. 39, no. 1, pp.
69-82.
Oliveira, MF et al. 2001, A monoclonal antibody to Trypanosoma cruzi
trypomastigotes recognizes a myosin tail epitope, Parasitology Research, vol.
87, no. 12, pp. 1043-1049.
Orrenius, S, Gogvadze, V and Zhivotovsky, B 2007, Mitochondrial oxidative stress:
implications for cell death, Annual Review of Pharmacology and Toxicology,
vol. 47, pp. 143-183.
Orrenius, S, Nicotera, P and Zhivotovsky, B 2011, Cell Death Mechanisms and
Their Implications in Toxicology, Toxicological Sciences, vol. 119, no. 1, pp.
3-19.
Pal, M et al. 2009, Vanilloid receptor antagonists: emerging class of novel anti-
inflammatory agents for pain management, Current Pharmaceutical Design,
vol. 15, no. 9, pp. 1008-1026.
Paschka, AG, Butler, R and Young, CYF 1998, Induction of apoptosis in prostate
cancer cell lines by the green tea component, (-)-epigallocatechin-3-gallate,
Cancer Letters, vol. 130, no. 1-2, pp. 1-7.
Pedersen, S, Owsianik, G and Nilius, B 2005, TRP channels: an overview, Cell
Calcium, vol. 38, no. 3-4, pp. 233-252.
Peier, AM et al. 2002, A TRP Channel that Senses Cold Stimuli and Menthol, Cell,
vol. 108, no. 5, pp. 705-715.
Perraud, AL et al. 2005, Accumulation of free ADP-ribose from mitochondria
mediates oxidative stress-induced gating of TRPM2 cation channels, Journal
of Biological Chemistry, vol. 280, no. 7, pp. 6138-6148.
Pertwee, RG 2006, The pharmacology of cannabinoid receptors and their ligands: an
overview, International Journal of Obesity, vol. 30 Suppl 1, pp. S13-18.
Phelps, CB et al. 2010, Differential regulation of TRPV1, TRPV3, and TRPV4
sensitivity through a conserved binding site on the ankyrin repeat domain,
Journal of Biological Chemistry, vol. 285, no. 1, pp. 731-740.
Piper, RC and Luzio, JP 2004, CUPpling calcium to lysosomal biogenesis, Trends in
Cell Biology, vol. 14, no. 9, pp. 471-473.
Pisanti, S and Bifulco, M 2009, Endocannabinoid system modulation in cancer
biology and therapy, Pharmacological Research, vol. 60, no. 2, pp. 107-116.
Planells-Cases, R et al. 2005, Functional aspects and mechanisms of TRPV1
involvement in neurogenic inflammation that leads to thermal hyperalgesia,
Pflugers Archiv (European Journal of Physiology), vol. 451, no. 1, pp. 151-
159.

201
Plevkova, J et al. 2006, Testing of cough reflex sensitivity in children suffering from
allergic rhinitis and common cold, Journal of Physiology and Pharmacology,
vol. 57, p. 289.
Portis, T, Harding, JC and Ratner, L 2001, The contribution of NF-kappa B activity
to spontaneous proliferation and resistance to apoptosis in human T-cell
leukemia virus type 1 Tax-induced tumors, Blood, vol. 98, no. 4, pp. 1200-
1208.
Powles, T et al. 2005, Cannabis-induced cytotoxicity in leukemic cell lines: the role
of the cannabinoid receptors and the MAPK pathway, Blood, vol. 105, no. 3,
pp. 1214-1221.
Pramanik KC, BS, Srivastava SK 2011, Role of Mitochondrial Electron Transport
Chain Complexes in Capsaicin Mediated Oxidative Stress Leading to
Apoptosis in Pancreatic Cancer Cells., PLoS One, vol. 6, no. 5, p. e20151.
Premkumar, LS and Ahern, GP 2000, Induction of vanilloid receptor channel activity
by protein kinase C, Nature, vol. 408, no. 6815, pp. 985-990.
Prescott, ED and Julius, D 2003, A modular PIP2 binding site as a determinant of
capsaicin receptor sensitivity, Science, vol. 300, no. 5623, pp. 1284-1288.
Preta, G and Fadeel, B 2012, Scythe cleavage during Fas (APO-1)-and
staurosporine-mediated apoptosis, FEBS Letters, vol. 586, no. 6, pp. 747-752.
Prevarskaya, N, Zhang, L and Barritt, G 2007, TRP channels in cancer, Biochimica
et Biophysica Acta, vol. 1772, no. 8, pp. 937-946.
Proudfoot, C et al. 2006, Analgesia mediated by the TRPM8 cold receptor in chronic
neuropathic pain, Current Biology, vol. 16, no. 16, pp. 1591-1605.
Qiao, S et al. 2005, Involvement of peroxynitrite in capsaicin-induced apoptosis of
C6 glioma cells[ Abstract only], Neuroscience Research, vol. 51, no. 2, pp.
175-183.
Rafiee, P et al. 2010, Thalidomide inhibits inflammatory and angiogenic activation
of human intestinal microvascular endothelial cells (HIMEC), American
Journal of Physiology-Gastrointestinal and Liver Physiology, vol. 298, no. 2,
pp. G167-G176.
Raivich, G and Banati, R 2004, Brain microglia and blood-derived macrophages:
molecular profiles and functional roles in multiple sclerosis and animal
models of autoimmune demyelinating disease, Brain Research. Brain
Research Reviews, vol. 46, no. 3, pp. 261-281.
Ramsey, IS, Delling, M and Clapham, DE 2006, An introduction to TRP channels,
Annual Review of Physiology, vol. 68, pp. 619-647.
Raychowdhury, MK et al. 2004, Molecular pathophysiology of mucolipidosis type
IV: pH dysregulation of the mucolipin-1 cation channel, Human Molecular
Genetics, vol. 13, no. 6, pp. 617-627.
Reed, JC et al. 1996, Structure-function analysis of Bcl-2 family proteins. Regulators
of programmed cell death, Advances in Experimental Medicine and Biology,
vol. 406, pp. 99-112.
Reid, G 2005, ThermoTRP channels and cold sensing: what are they really up to?,
Pflugers Archiv (European Journal of Physiology), vol. 451, no. 1, pp. 250-
263.
Reilly, CA et al. 2005, Calcium-dependent and independent mechanisms of capsaicin
receptor (TRPV1)-mediated cytokine production and cell death in human
bronchial epithelial cells, Journal of Biochemical and Molecular Toxicology,
vol. 19, no. 4, pp. 266-275.

202
Reilly, CA et al. 2003, Capsaicinoids cause inflammation and epithelial cell death
through activation of vanilloid receptors, Toxicol Sciences, vol. 73, no. 1, pp.
170-181.
Rennel, E and Gerwins, P 2002, How to make tetracycline-regulated transgene
expression go on and off, Analytical Biochemistry, vol. 309, no. 1, pp. 79-84.
Reynolds, AR and Kyprianou, N 2006, Growth factor signalling in prostatic growth:
significance in tumour development and therapeutic targeting, British Journal
of Pharmacology, vol. 147, no. S2, pp. S144-S152.
Riccio, A et al. 2009, Essential role for TRPC5 in amygdala function and fear-related
behavior, Cell, vol. 137, no. 4, pp. 761-772.
Richardson, J and Vasko, M 2002, Cellular mechanisms of neurogenic inflammation,
Journal of Pharmacology and Experimental Therapeutics, vol. 302, no. 3, p.
839.
Richeux, F et al. 1999, Cytotoxicity and genotoxicity of capsaicin in human
neuroblastoma cells SHSY-5Y, Archives of Toxicology, vol. 73, no. 7, pp.
403-409.
Richter, JM, Schaefer, M and Hill, K 2014, Riluzole activates TRPC5 channels
independently of PLC activity, British Journal of Pharmacology, vol. 171,
no. 1, pp. 158-170.
Riera, CE et al. 2007, Artificial sweeteners and salts producing a metallic taste
sensation activate TRPV1 receptors, American Journal of Physiology-
Regulatory, Integrative and Comparative Physiology, vol. 293, no. 2, pp.
R626-R634.
Robinson, DR et al. 2004, Characterization of the primary spinal afferent innervation
of the mouse colon using retrograde labelling, Neurogastroenterology and
Motility, vol. 16, no. 1, pp. 113-124.
Rohacs, T, Thyagarajan, B and Lukacs, V 2008, Phospholipase C mediated
modulation of TRPV1 channels, Molecular Neurobiology, vol. 37, no. 2-3,
pp. 153-163.
Romano, AC et al. 2003, Different Cell Sizes in Human Limbal and Central Corneal
Basal Epithelia Measured by Confocal Microscopy and Flow Cytometry,
Investigative Ophthalmology and Visual Science, vol. 44, no. 12, pp. 5125-
5129.
Rosch, W et al. 2006, Phytotherapy for functional dyspepsia: a review of the clinical
evidence for the herbal preparation STW 5, Phytomedicine, vol. 13 Suppl 5,
pp. 114-121.
Rosenbaum, T et al. 2004, Ca2+/calmodulin modulates TRPV1 activation by
capsaicin, Journal of General Physiology, vol. 123, no. 1, pp. 53-62.
Roy, M et al. 2002, Induction of Apoptosis in Tumor Cells by Natural Phenolic
Compounds, Asian Pacific journal of cancer prevention, vol. 3, no. 1, pp. 61-
67.
Ryskamp, DA et al. 2011, The polymodal ion channel transient receptor potential
vanilloid 4 modulates calcium flux, spiking rate, and apoptosis of mouse
retinal ganglion cells, The Journal of neuroscience, vol. 31, no. 19, pp. 7089-
7101.
Sadofsky, LR et al. 2012, Inflammatory stimuli up-regulate transient receptor
potential vanilloid-1 expression in human bronchial fibroblasts, Experimental
Lung Research, vol. 38, no. 2, pp. 75-81.

203
Salvi, M et al. 2007, Treatment of Graves’ disease and associated ophthalmopathy
with the anti-CD20 monoclonal antibody rituximab: an open study, European
Journal of Endocrinology, vol. 156, no. 1, pp. 33-40.
Samways, DS and Egan, TM 2011, Calcium-dependent decrease in the single-
channel conductance of TRPV1, Pflügers Archiv-European Journal of
Physiology, vol. 462, no. 5, pp. 681-691.
Sánchez, A et al. 2006, Induction of apoptosis in prostate tumor PC-3 cells and
inhibition of xenograft prostate tumor growth by the vanilloid capsaicin,
Apoptosis, vol. 11, pp. 89-99.
Sancho, R et al. 2003, The CB1/VR1 agonist arvanil induces apoptosis through an
FADD/caspase-8-dependent pathway, British Journal of Pharmacology, vol.
140, no. 6, pp. 1035-1044.
Sancho, R et al. 2002, Immunosuppressive activity of capsaicinoids: Capsiate
derived from sweet peppers inhibits NF-kB activation and is a potent anti-
inflammatory compound in vivo, European Journal of Immunology, vol. 32,
pp. 1753-1763.
Sanger, GJ 2007, Endocannabinoids and the gastrointestinal tract: what are the key
questions?, British Journal of Pharmacology, vol. 152, no. 5, pp. 663-670.
Santoni, G et al. 2000, Impairment of rat thymocyte differentiation and functions by
neonatal capsaicin treatment is associated with induction of apoptosis,
Journal of Neuroimmunology, vol. 104, no. 1, pp. 37-46.
Saper, CB 2009, A guide to the perplexed on the specificity of antibodies, Journal of
Histochemistry and Cytochemistry, vol. 57, no. 1, pp. 1-5.
Sappington, RM and Calkins, DJ 2008, Contribution of TRPV1 to microglia-derived
IL-6 and NFκB translocation with elevated hydrostatic pressure, Investigative
Ophthalmology and Visual Science, vol. 49, no. 7, pp. 3004-3017.
Sarkaria, JN et al. 1998, Inhibition of phosphoinositide 3-kinase related kinases by
the radiosensitizing agent wortmannin, Cancer Research, vol. 58, no. 19, pp.
4375-4382.
Sarker, KP and Maruyama, I 2003, Anandamide induces cell death independently of
cannabinoid receptors or vanilloid receptor 1: possible involvement of lipid
rafts, Cellular and Molecular Life Sciences, vol. 60, no. 6, pp. 1200-1208.
Satthaporn, S and Eremin, O 2001, Dendritic cells (I): Biological functions, Journal
of the Royal College of Surgeons of Edinburgh, vol. 46, no. 1, pp. 9-19.
Saunders, CI, Fassett, RG and Geraghty, DP 2009, Up-regulation of TRPV1 in
mononuclear cells of end-stage kidney disease patients increases
susceptibility to N-arachidonoyl-dopamine (NADA)-induced cell death,
Biochimica et Biophysica Acta, vol. 1792, no. 10, pp. 1019-1026.
Saunders, CIM et al. 2007, Expression of transient receptor potential vanilloid 1
(TRPV1) and 2 (TRPV2) in human peripheral blood, Molecular Immunology,
vol. 44, no. 6, pp. 1429-1435.
Sawicka M et al. 2013, The Specificity and Patterns of Staining in Human Cells and
Tissues of p16INK4a Antibodies Demonstrate Variant Antigen Binding,
PLoS One, vol. 8, no. 1, p. e53313.
Schicho, R et al. 2004, Increased expression of TRPV1 receptor in dorsal root
ganglia by acid insult of the rat gastric mucosa, European Journal of
Neuroscience, vol. 19, no. 7, pp. 1811-1818.
Schilling, T and Eder, C 2009a, Importance of the non-selective cation channel
TRPV1 for microglial reactive oxygen species generation, Journal of
Neuroimmunology, vol. 216, no. 1-2, pp. 118-121.

204
Schilling, T and Eder, C 2009b, Non‐selective cation channel activity is required for
lysophosphatidylcholine‐induced monocyte migration, Journal of Cellular
Physiology, vol. 221, no. 2, pp. 325-334.
Schumacher, MA et al. 2000, Molecular cloning of an N-terminal splice variant of
the capsaicin receptor. Loss of N-terminal domain suggests functional
divergence among capsaicin receptor subtypes, Journal of Biological
Chemistry, vol. 275, no. 4, pp. 2756-2762.
Schwabe, M et al. 1994, Disruption by interferon-alpha of an autocrine interleukin-6
growth loop in IL-6-dependent U266 myeloma cells by homologous and
heterologous down-regulation of the IL-6 receptor alpha- and beta-chains,
Journal of Clinical Investigation, vol. 94, no. 6, pp. 2317-2325.
Semtner, M et al. 2007, Potentiation of TRPC5 by protons, Journal of Biological
Chemistry, vol. 282, no. 46, pp. 33868-33878.
Sengupta, JN and Gebhart, GF 1994, Mechanosensitive properties of pelvic nerve
afferent fibers innervating the urinary bladder of the rat, Journal of
Neurophysiology, vol. 72, no. 5, pp. 2420-2430.
Shapiro, HM and Leif, RC 2003, Practical flow cytometry, vol. 4, Wiley Online
Library.
Shibasaki, K et al. 2010, TRPV2 enhances axon outgrowth through its activation by
membrane stretch in developing sensory and motor neurons, Journal of
Neuroscience, vol. 30, no. 13, pp. 4601-4612.
Shim, W-S et al. 2007, TRPV1 mediates histamine-induced itching via the activation
of phospholipase A2 and 12-lipoxygenase, The Journal of neuroscience, vol.
27, no. 9, pp. 2331-2337.
Shimizu, T et al. 2009, Regulation of the murine TRPP3 channel by voltage, pH, and
changes in cell volume, Pflugers Archiv (European Journal of Physiology),
vol. 457, no. 4, pp. 795-807.
Shinoda, M et al. 2011, Nerve growth factor contribution via transient receptor
potential vanilloid 1 to ectopic orofacial pain, The Journal of neuroscience,
vol. 31, no. 19, pp. 7145-7155.
Shortman, K and Liu, YJ 2002, Mouse and human dendritic cell subtypes, Nature
Reviews Immunology, vol. 2, no. 3, pp. 151-161.
Shu, H-F et al. 2013, Expression of TRPV1 in cortical lesions from patients with
tuberous sclerosis complex and focal cortical dysplasia type IIb, Brain and
Development, vol. 35, no. 3, pp. 252-260.
Sidoroff, M et al. 2010, High-sensitivity C-reactive protein in paediatric
inflammatory bowel disease, World journal of gastroenterology: WJG, vol.
16, no. 23, p. 2901.
Singh, S, Natarajan, K and Aggarwal, B 1996, Capsaicin (8-methyl-N-vanillyl-6-
nonenamide) is a potent inhibitor of nuclear transcription factor-kappa B
activation by diverse agents, The Journal of Immunology, vol. 157, no. 10, p.
4412.
Singhal, S and Mehta, J 2002, Thalidomide in cancer, Biomedicine and
Pharmacotherapy, vol. 56, no. 1, pp. 4-12.
Singhal, S et al. 1999, Antitumor activity of thalidomide in refractory multiple
myeloma, New England Journal of Medicine, vol. 341, no. 21, pp. 1565-
1571.
Skryma, R et al. 2000, Store depletion and store‐operated Ca2+ current in human
prostate cancer LNCaP cells: involvement in apoptosis, The Journal of
physiology, vol. 527, no. 1, pp. 71-83.

205
Skrzypski, M et al. 2014, Capsaicin induces cytotoxicity in pancreatic
neuroendocrine tumor cells via mitochondrial action, Cellular Signalling, vol.
26, no. 1, pp. 41-48.
Smith, GD et al. 2002, TRPV3 is a temperature-sensitive vanilloid receptor-like
protein, Nature, vol. 418, no. 6894, pp. 186-190.
Smith, PC et al. 2001, Interleukin-6 and prostate cancer progression, Cytokine &
Growth Factor Reviews, vol. 12, no. 1, pp. 33-40.
Spinsanti, G et al. 2008, Quantitative Real-Time PCR detection of TRPV1–4 gene
expression in human leukocytes from healthy and hyposensitive subjects,
Molecular Pain, vol. 4, no. 1, p. 51.
Srivastava, P et al. 1992, Streptavidin-based quantitative staining of intracellular
antigens for flow cytometric analysis, Cytometry, vol. 13, no. 7, pp. 711-721.
Stein, AT et al. 2006, Phosphoinositide 3-kinase binds to TRPV1 and mediates NGF-
stimulated TRPV1 trafficking to the plasma membrane, Journal of General
Physiology, vol. 128, no. 5, pp. 509-522.
Stewart, CC et al. 1994, Chapter 3 Cell Preparation for the Identification of
Leukocytes, in Methods in Cell Biology, Academic Press, vol. Volume 41,
pp. 39-60.
Stokes B, AT, Otahal P, Venn A. 2013, Cancer in Tasmania: Incidence and
Mortality 2010, Menzies Research Institute Hobart, Tasmania.
Suh, YG and Oh, U 2005, Activation and activators of TRPV1 and their
pharmaceutical implication, Current Pharmaceutical Design, vol. 11, no. 21,
pp. 2687-2698.
Sukharev, S and Corey, DP 2004, Mechanosensitive Channels: Multiplicity of
Families and Gating Paradigms, Science's STKE, vol. 2004, no. 219, pp. re4-.
Sukumar, P and Beech, DJ 2010, Stimulation of TRPC5 cationic channels by low
micromolar concentrations of lead ions (Pb2+), Biochemical and Biophysical
Research Communications, vol. 393, no. 1, pp. 50-54.
Sun, F-J et al. 2013, Increased Expression of TRPV1 in the Cortex and Hippocampus
from Patients with Mesial Temporal Lobe Epilepsy, Journal of Molecular
Neuroscience, vol. 49, no. 1, pp. 182-193.
Sung, B et al. 2012, Capsazepine, a TRPV1 antagonist, sensitizes colorectal cancer
cells to apoptosis by TRAIL through ROS–JNK–CHOP-mediated
upregulation of death receptors, Free Radical Biology and Medicine, vol. 53,
no. 10, pp. 1977-1987.
Szallasi, A and Blumberg, PM 1999, Vanilloid (Capsaicin) Receptors and
Mechanisms, Pharmacological Reviews, vol. 51, no. 2, pp. 159-212.
Szoke, E, Seress, L and Szolcsanyi, J 2002, Neonatal capsaicin treatment results in
prolonged mitochondrial damage and delayed cell death of B cells in the rat
trigeminal ganglia, Neuroscience, vol. 113, no. 4, pp. 925-937.
Szolcsanyi, J, Jancso-Gabor, A and Joo, F 1975, Functional and fine structural
characteristics of the sensory neuron blocking effect of capsaicin, Naunyn-
Schmiedeberg's Archives of Pharmacology, vol. 287, no. 2, pp. 157-169.
Takano, F et al. 2007, Capsicum ethanol extracts and capsaicin enhance interleukin-2
and interferon-gamma production in cultured murine Peyer's patch cells ex
vivo, Life Sciences, vol. 80, no. 17, pp. 1553-1563.
Tamimoto, Y et al. 2008, A dose-escalation study of rituximab for treatment of
systemic lupus erythematosus and Evans' syndrome: immunological analysis
of B cells, T cells and cytokines, Rheumatology (Oxford), vol. 47, no. 6, pp.
821-827.

206
Tanabe, H et al. 2011, Identification of Dimethylmatairesinol as an Immunoglobulin
E-suppressing Component of the Leaves of Cinnamomum camphora, Journal
of Health Science, vol. 57, no. 2, pp. 184-187.
Thomas, KC et al. 2007, Transient receptor potential vanilloid 1 agonists cause
endoplasmic reticulum stress and cell death in human lung cells, Journal of
Pharmacology and Experimental Therapeutics, vol. 321, no. 3, pp. 830-838.
Thomas, P and Smart, TG 2005, HEK293 cell line: a vehicle for the expression of
recombinant proteins, Journal of Pharmacological and Toxicological
Methods, vol. 51, no. 3, pp. 187-200.
Thompson, C 1995, Apoptosis in the pathogenesis and treatment of disease, Science,
vol. 267, no. 5203, p. 1456.
Tian, W et al. 2006, Regulation of TRPV1 by a novel renally expressed rat TRPV1
splice variant, American Journal of Physiology-Renal Physiology, vol. 290,
no. 1, pp. F117-F126.
Tominaga, M et al. 1998, The cloned capsaicin receptor integrates multiple pain-
producing stimuli, Neuron, vol. 21, no. 3, pp. 531-543.
Tominaga, M and Tominaga, T 2005, Structure and function of TRPV1, Pflugers
Archiv (European Journal of Physiology), vol. 451, no. 1, pp. 143-150.
Tominaga, M, Wada, M and Masu, M 2001, Potentiation of capsaicin receptor
activity by metabotropic ATP receptors as a possible mechanism for ATP-
evoked pain and hyperalgesia, Proceedings of the National Academy of
Sciences of the United States of America, vol. 98, no. 12, pp. 6951-6956.
Toth, BI et al. 2009, Transient receptor potential vanilloid-1 signaling inhibits
differentiation and activation of human dendritic cells, FEBS Letters, vol.
583, no. 10, pp. 1619-1624.
Tricot, GJ 2002, New insights into role of microenvironment in multiple myeloma,
International Journal of Hematology, vol. 76, no. 1, pp. 334-336.
Tsang, VC, Brand, JA and Boyer, AE 1989, An enzyme-linked
immunoelectrotransfer blot assay and glycoprotein antigens for diagnosing
human cysticercosis (Taenia solium), Journal of Infectious Diseases, vol.
159, no. 1, pp. 50-59.
Tsou, M-F et al. 2006, Involvement of Bax, Bcl-2, Ca2+ and Caspase-3 in Capsaicin-
induced Apoptosis of Human Leukemia HL-60 Cells, Anticancer Research,
vol. 26, no. 3A, pp. 1965-1971.
Tsuji, F et al. 2010, Transient receptor potential vanilloid 1 agonists as candidates for
anti-inflammatory and immunomodulatory agents, European Journal of
Pharmacology, vol. 627, no. 1–3, pp. 332-339.
Ullrich, ND et al. 2005, Comparison of functional properties of the Ca2+-activated
cation channels TRPM4 and TRPM5 from mice, Cell Calcium, vol. 37, no. 3,
pp. 267-278.
Vakkila, J and Lotze, MT 2004, Inflammation and necrosis promote tumour growth,
Nature Reviews Immunology, vol. 4, no. 8, pp. 641-648.
Van Der Stelt, M and Di Marzo, V 2004, Endovanilloids. Putative endogenous
ligands of transient receptor potential vanilloid 1 channels, European Journal
of Biochemistry, vol. 271, no. 10, pp. 1827-1834.
Venkatachalam, K, Zheng, F and Gill, DL 2003, Regulation of canonical transient
receptor potential (TRPC) channel function by diacylglycerol and protein
kinase C, Journal of Biological Chemistry, vol. 278, no. 31, pp. 29031-29040.

207
Vetter, I et al. 2006, The mu opioid agonist morphine modulates potentiation of
capsaicin-evoked TRPV1 responses through a cyclic AMP-dependent protein
kinase A pathway, Molecular Pain, vol. 2, no. 22, pp. 1-16.
Vinuesa, AG et al. 2012, Vanilloid Receptor-1 Regulates Neurogenic Inflammation
in Colon and Protects Mice from Colon Cancer, Cancer Research, vol. 72,
no. 7, pp. 1705-1716.
Voets, T et al. 2004a, The principle of temperature-dependent gating in cold- and
heat-sensitive TRP channels, Nature, vol. 430, no. 7001, pp. 748-754.
Voets, T et al. 2004b, TRPM6 forms the Mg2+ influx channel involved in intestinal
and renal Mg2+ absorption, Journal of Biological Chemistry, vol. 279, no. 1,
pp. 19-25.
Volk, T et al. 2003, A polycystin-2-like large conductance cation channel in rat left
ventricular myocytes, Cardiovascular Research, vol. 58, no. 1, pp. 76-88.
Vriens, J, Appendino, G and Nilius, B 2009, Pharmacology of vanilloid transient
receptor potential cation channels, Molecular Pharmacology, vol. 75, no. 6,
pp. 1262-1279.
Vriens, J et al. 2004, Cell swelling, heat, and chemical agonists use distinct pathways
for the activation of the cation channel TRPV4, Proceedings of the National
Academy of Sciences of the United States of America, vol. 101, no. 1, pp.
396-401.
Wang, JP et al. 2005, Capsaicin stimulates the non-store-operated Ca2+ entry but
inhibits the store-operated Ca2+ entry in neutrophils, Toxicology and Applied
Pharmacology, vol. 209, no. 2, pp. 134-144.
Wang, S-J, Yang, H-Y and Xu, G-S 2012, Acupuncture Alleviates Colorectal
Hypersensitivity and Correlates with the Regulatory Mechanism of TrpV1
and p-ERK, Evidence-Based Complementary and Alternative Medicine, vol.
2012, p. 10.
Watanabe, H et al. 2002, Activation of TRPV4 channels (hVRL-2/mTRP12) by
phorbol derivatives, Journal of Biological Chemistry, vol. 277, no. 16, pp.
13569-13577.
Watanabe, H et al. 2009, The pathological role of transient receptor potential
channels in heart disease, Circulation Journal, vol. 73, no. 3, pp. 419-427.
Wen, H et al. 2012, 20-Hydroxyeicosatetraenoic acid (20-HETE) is a novel activator
of transient receptor potential vanilloid 1 (TRPV1) channel, Journal of
Biological Chemistry, vol. 287, no. 17, pp. 13868-13876.
Wong, C-O, Huang, Y and Yao, X 2010, Genistein potentiates activity of the cation
channel TRPC5 independently of tyrosine kinases, British Journal of
Pharmacology, vol. 159, no. 7, pp. 1486-1496.
Xiao, Y et al. 2010, Overexpression of Trpp5 contributes to cell proliferation and
apoptosis probably through involving calcium homeostasis, Molecular and
Cellular Biochemistry, vol. 339, no. 1-2, pp. 155-161.
Xu, H, Blair, NT and Clapham, DE 2005a, Camphor activates and strongly
desensitizes the transient receptor potential vanilloid subtype 1 channel in a
vanilloid-independent mechanism, The Journal of neuroscience, vol. 25, no.
39, pp. 8924-8937.
Xu, H et al. 2007a, Activating mutation in a mucolipin transient receptor potential
channel leads to melanocyte loss in varitint-waddler mice, Proceedings of the
National Academy of Sciences of the United States of America, vol. 104, no.
46, pp. 18321-18326.

208
Xu, H et al. 2007b, Functional effects of nonsynonymous polymorphisms in the
human TRPV1 gene, American Journal of Physiology-Renal Physiology, vol.
293, no. 6, pp. F1865-F1876.
Xu, SZ et al. 2005b, Block of TRPC5 channels by 2-aminoethoxydiphenyl borate: a
differential, extracellular and voltage-dependent effect, British Journal of
Pharmacology, vol. 145, no. 4, pp. 405-414.
Yamamoto, Y and Gaynor, RB 2001, Therapeutic potential of inhibition of the NF-
κB pathway in the treatment of inflammation and cancer, The Journal of
Clinical Investigation, vol. 107, no. 2, pp. 135-142.
Yang, E and Korsmeyer, SJ 1996, Molecular thanatopsis: a discourse on the BCL2
family and cell death, Blood, vol. 88, no. 2, pp. 386-401.
Yang, F-L et al. 2008, TLR-independent induction of human monocyte IL-1 by
phosphoglycolipids from thermophilic bacteria, Glycoconjugate Journal, vol.
25, no. 5, pp. 427-439.
Yang, Y et al. 2013, Functional TRPV1 expression in human corneal fibroblasts,
Experimental Eye Research, vol. 107, pp. 121-129.
Yang, Z-H et al. 2010, Capsaicin Mediates Cell Death in Bladder Cancer T24 Cells
Through Reactive Oxygen Species Production and Mitochondrial
Depolarization, Urology, vol. 75, no. 3, pp. 735-741.
Yee, NS et al. 2012, TRPM8 ion channel is aberrantly expressed and required for
preventing replicative senescence in pancreatic adenocarcinoma: potential
role of TRPM8 as a biomarker and target, Cancer Biology and Therapy, vol.
13, no. 8, pp. 592-599.
Yu, L et al. 2008, The role of TRPV1 in different subtypes of dorsal root ganglion
neurons in rat chronic inflammatory nociception induced by complete
Freund's adjuvant, Molecular Pain, vol. 4, no. 1, p. 61.
Zeng, B, Chen, G-L and Xu, S-Z 2012, Divalent copper is a potent extracellular
blocker for TRPM2 channel, Biochemical and Biophysical Research
Communications, vol. 424, no. 2, pp. 279-284.
Zhang, F et al. 2007, Transient receptor potential vanilloid 1 activation induces
inflammatory cytokine release in corneal epithelium through MAPK
signaling, Journal of Cellular Physiology, vol. 213, no. 3, pp. 730-739.
Zhang, J et al. 2003a, Capsaicin inhibits growth of adult T-cell leukemia cells,
Leukemia Research, vol. 27, no. 3, pp. 275-283.
Zhang, R et al. 2008, In vitro and in vivo induction of apoptosis by capsaicin in
pancreatic cancer cells is mediated through ROS generation and
mitochondrial death pathway, Apoptosis, vol. 13, no. 12, pp. 1465-1478.
Zhang, X, Huang, J and McNaughton, PA 2005, NGF rapidly increases membrane
expression of TRPV1 heat-gated ion channels, EMBO Journal, vol. 24, no.
24, pp. 4211-4223.
Zhang, Y et al. 2003b, Coding of sweet, bitter, and umami tastes: different receptor
cells sharing similar signaling pathways, Cell, vol. 112, no. 3, pp. 293-301.
Zhivotovsky, B and Orrenius, S 2011, Calcium and cell death mechanisms: A
perspective from the cell death community, Cell Calcium, vol. 50, no. 3, pp.
211-221.
Ziglioli, F et al. 2009, Vanilloid-mediated apoptosis in prostate cancer cells through a
TRPV-1 dependent and a TRPV-1-independent mechanism, Acta Biomedica,
vol. 80, no. 1, pp. 13-20.

209
Zufall, F 2005, The TRPC2 ion channel and pheromone sensing in the accessory
olfactory system, Naunyn-Schmiedeberg's Archives of Pharmacology, vol.
371, no. 4, pp. 245-250.