transients in wind power plants - ieee
TRANSCRIPT

8/20/2019 Transients in Wind Power Plants - IEEE
http://slidepdf.com/reader/full/transients-in-wind-power-plants-ieee 1/11
1628 IEEE TRANSACTIONS ON INDUSTRY APPLICATIONS, VOL. 48, NO. 5, SEPTEMBER/OCTOBER 2012
Transients in Wind PowerPlants—Part II: Case Studies
Babak Badrzadeh, Senior Member, IEEE , Martin Høgdahl Zamastil, Nand K. Singh, Member, IEEE ,Henrik Breder, Kailash Srivastava, and Muhamad Reza, Member, IEEE
Abstract—This is the second part of a two-paper series. The firstpaper presented the transient modeling methodology for variouscomponents of wind power plants (WPPs). This paper presentsa general methodology for transient analysis of WPPs and dis-cusses case studies which investigate some of the most importanthigh-frequency interactions between different components of theWPP. The focus has been on switching transients, and lightingtransients have been excluded. Transient case studies conductedon a typical WPP are presented which discuss the impact of fast system surges on the performance of the circuit breaker andimpact of fast surges caused by the circuit breaker on the adjacent
power components. These case studies investigate the opening andclosing of the collector grid vacuum circuit breaker for loaded andunloaded conditions. Simulation results provide a close match withthe field measurements conducted on a laboratory prototype of a typical WPP. Differences caused by modeling assumptions orinsufficient accuracy of measurement devices are highlighted. Tounderstand the most onerous overvoltages that can be experiencedin the test system, a couple of additional simulation case studiesare reported. These case studies discuss the interruption of inrushcurrent with an unloaded transformer and interruption of a smallinductive current following the transformer energization.
Index Terms—Circuit breaker bouncing, high-frequency inter-actions, modeling and simulation, power system transients, tem-porary overvoltages, transient overvoltages, wind power plants
(WPPs).
I. INTRODUCTION
THIS IS THE second part of a two-paper series dealing with
transient analysis of wind power plants (WPPs). To in-
vestigate electromagnetic transients (EMTs) in power systems,
EMT-type simulation tools are generally adopted. Custom-built
models of the main components of WPPs including the vacuum
and SF6 circuit breakers, wind turbine generator (WTG) trans-
Manuscript received June 20, 2011; revised November 4, 2011 and January23, 2012; accepted March 9, 2012. Date of publication July 17, 2012; date of
current version September 14, 2012. Paper 2011-PSEC-234.R2, presented atthe 2011 IEEE Industry Applications Society Annual Meeting, Orlando, FL,October 9–13, and approved for publication in the IEEE TRANSACTIONS ON
INDUSTRY A PPLICATIONS by the Power Systems Engineering Committee of the IEEE Industry Applications Society.
B. Badrzadeh is with the Australian Energy Market Operator, Melbourne,Vic. 3000, Australia (e-mail: [email protected]).
M. Høgdahl Zamastil is with Energinet.dk, 7000 Fredericia, Denmark (e-mail: [email protected]).
N. K. Singh is with ABB Grid Systems, Stone, ST15 0RS, U.K. (e-mail:[email protected]).
H. Breder, K. Srivastava, and M. Reza are with ABB Corporate Re-search, 72178 Västerås, Sweden (e-mail: [email protected]; [email protected]; [email protected]).
Color versions of one or more of the figures in this paper are available onlineat http://ieeexplore.ieee.org.
Digital Object Identifier 10.1109/TIA.2012.2209193
former, and the collector grid and tower cables were developed
in the first part of the paper. The validation of individual
component models was also discussed.
Having validated the models at a component level basis,
it would be essential to conduct a number of power system
transient studies using an integrated model compiled from
those individual component models. This allows a system-level
model validation when different components interact with each
other.
Several works have been published on transient analysis of WPPs. These include pure measurement-based approach [1],
pure simulation-based approach [2]–[4], or validation of simu-
lation results against measurements for certain components of
WPPs with other components being neglected or represented
with ideal models [5]–[7]. A system-level validation of the
simulation results against field measurements allows identi-
fying the high-frequency interaction phenomena between the
components including the voltage magnification due to high-
frequency resonances and makes it possible to appreciate the
differences between the measurements and simulation. The
physical phenomena that cannot be accounted for in the model
are identified, as well as the limitations of the measurement
devices.This paper discusses the validation of simulation results
obtained from a number of switching scenarios against corre-
sponding results obtained from field measurements. The inte-
grated model created in the PSCAD/EMTDC tool is consistent
with the setup of the ABB Corporate Research laboratory
described in [1]. This setup mimics the collector grid of a
typical WPP. These measurements will be used for a quantita-
tive validation of the results obtained from the simulation case
studies.
This paper is organized as follows. A general methodology
for the transient analysis of the WPP is discussed in Section II.
Section III discusses the power system used in the laboratoryprototype of a typical power plant. The simulation case studies
performed are presented in Section IV and compared with the
field measurements. These studies include opening and closing
the medium-voltage (MV) circuit breaker with unloaded and
loaded turbine transformers.
II. GENERAL M ETHODOLOGY FOR T RANSIENT
ANALYSIS OF W PP
For transient analysis of WPP, it is necessary to perform a
number of switching events including opening and closing of
various circuit breakers in the WPP. As an example, the location
0093-9994/$31.00 © 2012 IEEE

8/20/2019 Transients in Wind Power Plants - IEEE
http://slidepdf.com/reader/full/transients-in-wind-power-plants-ieee 2/11
BADRZADEH et al.: TRANSIENTS IN WIND POWER PLANTS II 1629
Fig. 1. Schematic representation of a full feeder of a typical WPP.
of various circuit breakers in a typical onshore power plant
is shown in Fig. 1 with all breakers in an open position. For
such a system, the opening events generally studied include the
following:
1) opening the point of common coupling (PCC) circuit
breaker with all other breakers closed;
2) opening the HV substation circuit breaker with all other
breakers closed;
3) opening the MV substation circuit breaker with all other
breakers closed;
4) opening feeder circuit breaker with all other breakers
closed;
5) opening the nearest WTG (WTG 1 in Fig. 1) circuit
breaker with all upstream circuit breakers closed and all
other WTG circuit breakers open;
6) opening the furthest WTG (WTG 4 in Fig. 1) circuit
breaker with all other breakers closed.
The closing events generally studied include the following:
1) closing the PCC breaker with all downstream breakers
open;
2) closing the HV substation circuit breaker with PCC cir-
cuit breaker closed and all downstream breakers open;
3) closing the MV substation circuit breaker with PCC and
HV substation circuit breakers closed and all downstream
breakers open;
4) closing the feeder circuit breaker with all upstream break-
ers closed and all downstream breakers open;
5) closing circuit breaker on the nearest circuit breaker with
all upstream circuit breakers closed and all downstreamcircuit breakers open;
6) closing circuit breaker on the furthest WTG with all other
circuit breakers closed.
To investigate the high-frequency impact of SF6 breaker,
studies are generally conducted with a reduced-order system
comprising only the SF6 breaker, the adjacent transformer, and
the connection to the grid via an overhead line or underground
cable. Both unloaded and loaded conditions are considered.
For SF6 circuit breakers, no field measurements were avail-
able, and it was not therefore possible to conduct a system-
level validation using the full integrated transient model of the
WPP. Another difficulty experienced when using the SF6 circuitbreaker model was the significantly low simulation time step
requirement, in the range of a few nanoseconds, which makes
it impracticable to carry out several simulation runs.
In addition to the aforementioned scenarios, individual and
back-to-back capacitor and shunt reactor switching, the possi-
bility of exciting a resonance frequency on the system, and the
risk of voltage magnification need to be studied.
These studies allow calculation of magnitude and rate of rise of overvoltages and confirm whether circuit breakers are
adequately rated to withstand the most onerous transient re-
covery voltages (TRVs). TRV analysis is very important when
switching shunt capacitor banks with a series reactor. The use
of reactor could cause a high-frequency restrike overvoltage
exceeding the TRV capability of the breaker [8].
Based on these studies, recommendations can be made on the
following:
1) the adequacy or otherwise of existing insulation system
and surge arrester ratings;
2) any potential operating restrictions or remedial measures.
The studies of the opening and closing of the WTG circuit
breakers need to be carried for full-load, no-load, and partial-
load conditions such that the impact of loading on the occur-
rence of restrikes and prestrikes is appreciated. For transient
overvoltage studies, wind turbines can be represented either as
constant loads (as shown in Fig. 1) or with constant mechan-
ical power, but their impact is very marginal as they behave
like an open circuit at high frequencies. For investigation of
temporary overvoltage, a more detailed representation of the
WTG may be necessary. High-frequency harmonic filters of
the stator-side and/or rotor-side converters have a significant
impact on limiting the magnitude of temporary and switching
overvoltages imposed on the WTG and need to be representedadequately. SVCs and STATCOMs can limit the magnitude of
temporary overvoltages caused by switching events and need to
be included in the integrated transient model of the WPP. The
grid is represented by the nearest overhead or cable followed by
a grid impedance and an ideal voltage source.
For all studies, the saturation characteristics of the turbine
and substation power transformers are included. This is be-
cause, when energizing a transformer, high inrush currents
can occur which contain relatively high level of low-order
harmonics. If one of these low-order harmonics coincides with
a grid resonance frequency, a voltage magnification will occur.
These overvoltages are generally temporary overvoltages witha frequency of a few hundred hertz. Transformer saturation
characteristics can also contribute to high transient overvoltages
during interruption of inrush current. These overvoltages can
have significantly higher frequency than the temporary over-
voltages. It has been reported that, when interrupting inrush cur-
rent using vacuum circuit breaker (VCB) overvoltages in excess
of 5 p.u. can be generated [10]. The magnitude of the overvolt-
age generally depends on the size of current being chopped,
various capacitances on the system, and damping elements
including the system resistive components and losses. Larger
capacitances and resistances tend to alleviate this problem.
Note that interruption of inrush current is not a common prac-
tice from the system protection standpoint. This is because itimplies that the transformer needs to be reopened only a few

8/20/2019 Transients in Wind Power Plants - IEEE
http://slidepdf.com/reader/full/transients-in-wind-power-plants-ieee 3/11
1630 IEEE TRANSACTIONS ON INDUSTRY APPLICATIONS, VOL. 48, NO. 5, SEPTEMBER/OCTOBER 2012
Fig. 2. Single-line diagram of the ABB wind cable laboratory.
cycles after the energization. The resulting transient overvolt-
age can, however, constitute one of the most onerous scenarios
and needs to be studied although it is not very likely to occur.
The methodology discussed earlier is valid for the transientanalysis of any given WPP. The system-level validation of thetransient performance of the WPP is discussed in Section IIIwith a very simple system used for validation purpose.
III. SYSTEM U NDER C ONSIDERATION
The high-frequency behavior of the collector grid of the WPPin response to opening and closing of the plant VCBs hasbeen analyzed using measurements discussed in [1]. The single-
line diagram of the test system is shown in Fig. 2. The shortcircuit ratio and impedance of the 1.7-MW external grid arenot known, and it is therefore represented as an infinite voltage
source. The VCB model parameters are those indicated in[10, Table III]. Note that, in the laboratory setup, the sea cableis treated as the turbine tower cable.
All simulations are conducted with a simulation time step
of 50 ns, and the typical duration of simulation runs is 80 ms.This produces sufficient data for the investigation of transientovervoltages.
IV. CAS E S TUDIES
The following PSCAD/EMTDC simulation case studies areconducted to investigate the transient performance of WPP dur-ing operation of the VCB associated with windmill switchgearin Fig. 2:
1) breaker closing with tower cable and WTG transformer atno-load conditions;
2) breaker opening with tower cable and WTG transformerat no-load conditions;
3) breaker closing with tower cable and WTG transformerwith an inductive load of approximately 1 Mvar;
4) breaker opening with tower cable and WTG transformerwith an inductive load of approximately 1 Mvar.
The case studies presented will investigate several aspects
of the transient behavior of the collector grid including the
following:
1) peak voltage;2) rate of rise of voltage;
Fig. 3. Example of measurement results demonstrating different time regimes
of a transient waveform [1].
3) frequency of oscillations at end of restrike or prestrike
period;
4) peak current in the breaker;
5) traveling time of the cables;
6) voltage-to-current relationship (surge impedance of the
cables).
For all cases, the breaker operating time has been adjusted
to match with the corresponding points on the voltage wave-
form as indicated in [1]. The measurement and simulation
studies will be compared from both qualitative and quantitative
standpoints.The qualitative comparison will consider if restrikes or pre-
strikes have occurred, determines whether the surge arrester
has operated, investigates the performance once the breaker has
assumed a fully open or fully closed status, and determines
whether the response is oscillatory or not. An example of the
qualitative assessment is shown in Fig. 3. This is an extreme
case studied in the laboratory to reproduce and test worst case
scenarios.
The quantitative comparison evaluates the voltage and cur-
rent wave shapes and the timing of appreciable phenomena by
recording dU , dU/dt, peak voltage, and frequency of oscilla-
tions. The peak voltage, dU (∆U ), and dU/dt are determinedfrom the time domain voltage waveform during restrike or
prestrike periods. The frequency of oscillations is determined
by calculating the number of peaks from the start of oscillatory
response (approximately from 9 ms for this particular example
as shown in Fig. 3).
Note that the behavior of circuit breaker is stochastic in
nature, and therefore, statistical variations will occur during
the measurements, whereas a simulation will always show the
same behavior if a simulation run is repeated. In an attempt
to identify these statistical variations, several measurements
were conducted as reported in [1]. These measurements were
expressed in terms of scatter diagrams as shown in Fig. 4. This
figure shows that dU varies from 5 to 43 kV for one specificmeasurement, while dU/dt varies between 10 and 85kV/µs.

8/20/2019 Transients in Wind Power Plants - IEEE
http://slidepdf.com/reader/full/transients-in-wind-power-plants-ieee 4/11
BADRZADEH et al.: TRANSIENTS IN WIND POWER PLANTS II 1631
Fig. 4. Scatter diagram of the dU and dU/dt recorded at TX1 terminals
obtained from a single measurement on a VCB opening on a transformer withinductive loading [1].
Fig. 5. Transformer TX1 high side terminal voltage when circuit breaker isclosing on an unloaded transformer.
Additional measurements have identified a dU/dt as high as
211kV/µs. This behavior will introduce differences between
the measurements and simulation results which need to be
appreciated when conducting a quantitative assessment.
A. Case 1: VCB Closing on an Unloaded Transformer
A comparison of the measurement and simulation results
for closing operation of the circuit breaker with an unloaded
transformer is shown in Fig. 5. For better visibility, a zoomed-
in version of the initial period of the transient is shown in
Fig. 6 which includes the three-phase breaker currents as well.
Fig. 5 shows that the oscillatory period matches well in terms
of the frequency of oscillations and system damping. In both
measurement and simulations, the oscillations disappear after
five periods. A difference is observed between the measurementand simulation case study at the period between 2 and 3 ms.
Fig. 6. Zoomed-in version of the three-phase voltages shown in Fig. 5 andcorresponding breaker currents.
In the measurement, the breaker voltage drops gradually until
a restrike occurs, but this is not observed in the simulation
study. This can be caused by the breaker contacts bouncing
(chattering) until the eventual fully closed status is established
[11], [12]. This behavior is more pronounced when closing the
circuit breaker on an inductive load. This will be elaborated on
while discussing case study 3.
The traces of the three-phase voltages and currents during
the initial prestrike period show good agreement between the
measurement and simulation as shown in Fig. 6. The initial
timing of the three-phase voltages do not exactly match. This
is because, in an actual breaker, all the three poles do not moveat exactly the same time nor do they have exactly the same
movement speed, but in the model, they are represented as such.
The current spikes resulting from the voltage breakdown across
the breaker have nearly the same magnitude in the simulation
and measurements. A more detailed comparison of one current
spike is presented later. The difference in operating time of the
three poles of the actual and simulated breakers causes current
spikes at slightly different times.
A zoomed-in version of the region when the first prestrike
occurs is shown in Fig. 7. This figure shows the breaker
voltage and the transformer voltage in phase 3 along with the
current in pole 3 of the breaker. The simulation is alignedaccording to the measured voltages. A time difference of
27 ns between the two successive voltage measurements [1]
has been included in the simulation, but the exact transfer
function of the current measurement device is not included as
this was not known. The simulated and measured voltages are
consistent indicating the correct rise time, the correct traveling
time in the cables between the breaker and transformer, and the
correct impedance split between the cables on either side of the
breaker (applying the traveling wave theory). The measured and
simulated breaker currents do not have exactly the same timing,
which is likely caused by the neglect of the transfer function
of current measurement devices. The graphs indicate that the
measured current builds up slightly later than the measuredbreaker voltage. In theory, they must build up at exactly the

8/20/2019 Transients in Wind Power Plants - IEEE
http://slidepdf.com/reader/full/transients-in-wind-power-plants-ieee 5/11
1632 IEEE TRANSACTIONS ON INDUSTRY APPLICATIONS, VOL. 48, NO. 5, SEPTEMBER/OCTOBER 2012
Fig. 7. Zoomed-in version of the phase 3 voltages (a) at TX1 and (b) at breaker and (c) current through pole 3 of breaker: (Blue) Measured and (red) simulated.
Fig. 8. Transformer TX1 high side terminal voltage when circuit breaker isopening on an unloaded transformer.
same time according to telegrapher’s equations for traveling
wave (the simulation results are consistent with the telegraph
equations). The peak currents differ by approximately 25 A or
10%, which is acceptable. The duration of current transient is
the same for measurement and simulation, which is 1µs.
B. Case 2: VCB Opening on an Unloaded Transformer
Simulation results demonstrating the behavior of circuit
breaker opening on an unloaded transformer are shown in
Figs. 8 and 9. The simulation and measurement provide a close
match in the oscillatory period after the restrike.
Unlike the measurements shown in Fig. 8, the simulated
transformer voltage does not indicate any voltage buildup
across the breaker, and no restrike is therefore observed. The
voltage buildup is caused by high-frequency interaction of the
transformer, cable, and circuit breaker. The main reason causing
a difference between the measured and simulated performances
is the potentially incorrect di/dt. The di/dt primarily dependson the steady-state value of the current which, for this partic-
Fig. 9. Zoomed-in version of the three-phase voltages shown in Fig. 8 andcorresponding breaker currents.
ular setup, is significantly smaller than the full-load current.
As the measurements were intended for a statistical analysis,
successive opening and closing of the VCB were required.
When the circuit breaker is opened at each time and the
transformer is de-energized, the residual dc current from theprevious energization decays slowly. However, it does not fully
dissipate before the next opening is commenced. Fig. 10 shows
a residual current of 1.5 A 3 min after energization of the
transformer discussed in [10]. The same trend is expected for
the transformer represented in the setup shown in Fig. 2. This dc
offset current increases the size of current being chopped upon
breaker interruption which, in turn, increases the occurrence
of restrike overvoltages. Due to insufficient accuracy of the
measurement devices, it was not possible to precisely determine
the no-load current present at the time of measurement. In
the simulation, the impact of dc offset current was therefore
neglected. The simulated case was initialized with a too low
current. A sufficiently high di/dt was not therefore created, andno restrike occurred.
8/20/2019 Transients in Wind Power Plants - IEEE
http://slidepdf.com/reader/full/transients-in-wind-power-plants-ieee 6/11
BADRZADEH et al.: TRANSIENTS IN WIND POWER PLANTS II 1633
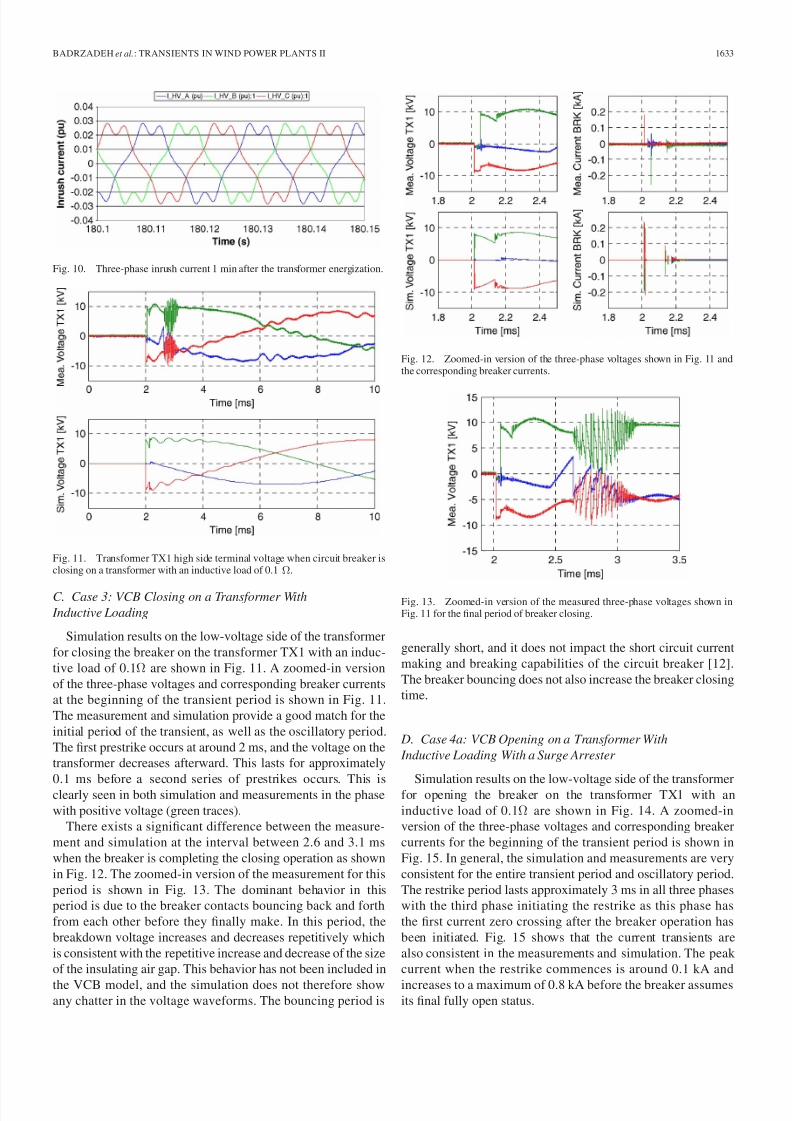
Fig. 10. Three-phase inrush current 1 min after the transformer energization.
Fig. 11. Transformer TX1 high side terminal voltage when circuit breaker isclosing on a transformer with an inductive load of 0.1 Ω.
C. Case 3: VCB Closing on a Transformer With
Inductive Loading
Simulation results on the low-voltage side of the transformer
for closing the breaker on the transformer TX1 with an induc-
tive load of 0.1Ω are shown in Fig. 11. A zoomed-in version
of the three-phase voltages and corresponding breaker currents
at the beginning of the transient period is shown in Fig. 11.
The measurement and simulation provide a good match for the
initial period of the transient, as well as the oscillatory period.
The first prestrike occurs at around 2 ms, and the voltage on the
transformer decreases afterward. This lasts for approximately
0.1 ms before a second series of prestrikes occurs. This isclearly seen in both simulation and measurements in the phase
with positive voltage (green traces).
There exists a significant difference between the measure-
ment and simulation at the interval between 2.6 and 3.1 ms
when the breaker is completing the closing operation as shown
in Fig. 12. The zoomed-in version of the measurement for this
period is shown in Fig. 13. The dominant behavior in this
period is due to the breaker contacts bouncing back and forth
from each other before they finally make. In this period, the
breakdown voltage increases and decreases repetitively which
is consistent with the repetitive increase and decrease of the size
of the insulating air gap. This behavior has not been included in
the VCB model, and the simulation does not therefore showany chatter in the voltage waveforms. The bouncing period is
Fig. 12. Zoomed-in version of the three-phase voltages shown in Fig. 11 andthe corresponding breaker currents.
Fig. 13. Zoomed-in version of the measured three-phase voltages shown inFig. 11 for the final period of breaker closing.
generally short, and it does not impact the short circuit current
making and breaking capabilities of the circuit breaker [12].
The breaker bouncing does not also increase the breaker closing
time.
D. Case 4a: VCB Opening on a Transformer With
Inductive Loading With a Surge Arrester
Simulation results on the low-voltage side of the transformerfor opening the breaker on the transformer TX1 with an
inductive load of 0.1Ω are shown in Fig. 14. A zoomed-in
version of the three-phase voltages and corresponding breaker
currents for the beginning of the transient period is shown in
Fig. 15. In general, the simulation and measurements are very
consistent for the entire transient period and oscillatory period.
The restrike period lasts approximately 3 ms in all three phases
with the third phase initiating the restrike as this phase has
the first current zero crossing after the breaker operation has
been initiated. Fig. 15 shows that the current transients are
also consistent in the measurements and simulation. The peak
current when the restrike commences is around 0.1 kA and
increases to a maximum of 0.8 kA before the breaker assumesits final fully open status.

8/20/2019 Transients in Wind Power Plants - IEEE
http://slidepdf.com/reader/full/transients-in-wind-power-plants-ieee 7/11
1634 IEEE TRANSACTIONS ON INDUSTRY APPLICATIONS, VOL. 48, NO. 5, SEPTEMBER/OCTOBER 2012
Fig. 14. Transformer TX1 high side terminal voltage when circuit breaker isopening on a transformer with an inductive load of 0.1 Ω.
Fig. 15. Zoomed-in version of the voltages shown in Fig. 14 and correspond-ing breaker currents.
Fig. 15 shows the overvoltage clamping behavior of thesurge arrester when the voltage approaches 20 kV. The restrikeperiod continues with the voltage being successfully clamped
by the surge arrester for the entire event. The circuit breakerbecomes fully open without experiencing any further sequencesof restrikes. Note that the surge arrester does not have any
impact on the rate of rise of voltage as expected.With regard to the oscillatory period, both measurements and
simulation produce similar results in terms of the frequency anddamping of the oscillations. The simulated line voltages do notoccur at exactly the same sequence of phases as those given
by the measurements. This causes the simulated restrike to end0.2 ms earlier than the measurement. This causes a phase shiftin the phase-to-ground voltages at the start of oscillations.
The initial voltage buildup in the second phase is shown
in Fig. 16. The measured voltage is larger than the simulatedvoltage by approximately 1 kV. This is most likely caused bythe stochastic behavior of the circuit breaker that cannot beaccurately accounted for in the simulation. The difference in the
measured and simulated voltages leads to a difference betweenthe measured and simulated currents as shown.
Fig. 16. Zoomed-in version of the second-phase voltage at TX1 and breakerand the current through the breaker phase 2 at the beginning of the transient,(blue) measured and (red) simulated.
Fig. 17. Zoomed-in version of the phase 2 voltage at TX1 and breaker and thecurrent through the breaker phase 2 at the end of transient, (blue) measured and(red) simulated.
Fig. 18. Transformer TX1 high side terminal voltage when breaker is openingon a transformer with an inductive load of 0.1 Ω but without a surge arrester.
Fig. 17 shows the measured and simulated voltages and cur-
rents on the second phase of the transformer and circuit breaker.
This figure shows that the voltage gradient obtained from the
measurement and simulation is practically the same. From the
measurements, it is evident that the trend is not fully cyclic
as the phases interact with each other. Comparing the results
with those without an inductive load shown in Figs. 8 and 9,
it is evident that, with an inductive load, the voltage buildup is
significantly faster. This faster voltage buildup is caused by the
introduction of the inductive load which increases the size of current being chopped and changes the circuit characteristics.

8/20/2019 Transients in Wind Power Plants - IEEE
http://slidepdf.com/reader/full/transients-in-wind-power-plants-ieee 8/11
BADRZADEH et al.: TRANSIENTS IN WIND POWER PLANTS II 1635
Fig. 19. Simplified test system used for the investigation of the interruption of transformer inrush current.
Fig. 20. Transformer TX1 inrush current and voltage when energized withoutthe rest of the test system.
E. Case 4b: VCB Opening on a Transformer With
Inductive Loading Without a Surge Arrester
Simulation results on the low-voltage side of the transformer
for opening the breaker on the transformer TX1 with an induc-
tive load of 0.1 Ω but without a surge arrester on transformer
terminals are shown in Fig. 18. Without a surge arrester, the
voltage increases to approximately 40 kV compared to 20 kV
when the surge arrester is activated.
F. Case 5: VCB Opening on an Unloaded Transformer
Shortly After Energization
The interruption of transformer inrush current is investigated
in this case study. For this case study, no measurements were
available; however, validated high-frequency models discussed
in case studies 1–4 allow accurate investigation of the scenario
using simulation studies. First, the turbine transformer and
associated surge arrester are energized against a voltage sourceusing the methodology explained in [10]. Eighty milliseconds
Fig. 21. Transformer TX1 inrush current when energized by the wind turbinebreaker against the system shown in Fig. 2.
thereafter, the three-pole VCB is opened, while, still, there is a
significant level of inrush current in the system. The schematic
diagram of this simplified test system is shown in Fig. 19.
The three-phase transformer inrush currents and voltages are
shown in Fig. 20. This figure shows that these overvoltages are
clamped by the transformer surge arrester within the acceptable
limit which would have otherwise caused insulation failure
of the transformer. As inrush current decays slowly, several
reignitions occur at each peak of the inrush current. This candeteriorate the insulation of VCB.
For the next case study, the wind turbine transformer is
energized against the rest of the system shown in Fig. 2, and
the VCB reopens 80 ms thereafter. Note that the VCB used
for the transformer energization is located after the 72-m sea
cable. The transformer inrush current is shown in Fig. 21. Such
an inrush current differs from a typical waveform in terms of
both the magnitude and rate of decay. To appreciate the reason
for this behavior, the transformer is energized again against the
test system shown in Fig. 2, but the sea cable was removed.
The transformer inrush current is shown in Fig. 22. Comparing
Figs. 21 and 22 indicates that the dominant capacitive behavior
of the sea cable has a significant role to play in mitigatingthe transformer inrush current. It is therefore concluded that

8/20/2019 Transients in Wind Power Plants - IEEE
http://slidepdf.com/reader/full/transients-in-wind-power-plants-ieee 9/11
1636 IEEE TRANSACTIONS ON INDUSTRY APPLICATIONS, VOL. 48, NO. 5, SEPTEMBER/OCTOBER 2012
Fig. 22. Transformer TX1 inrush current when energized by the wind turbinebreaker against the system shown in Fig. 2 and with removal of the sea cable.
Fig. 23. Transformer TX1 voltage and breaker current when energizing thewind turbine transformer against the system shown in Fig. 2 and with the useof 0.1-Mvar loading to represent the wind turbine.
interruption of inrush current on the test system shown in
Fig. 2 does not create any significant overvoltages as the inrush
current decays completely within a few milliseconds (Fig. 23).
This behavior can be explained as follows: The inrush current
is determined by the integral of the voltage across the trans-
former terminals with the maximum integral value occurring
at the zero voltage crossing. The introduction of the 72-m sea
cable alters the energization angle, i.e., the voltage angles at
the sending and receiving ends of the cable are different. The
change in the energization angle due to the introduction of the
cable can therefore result in a decrease in the peak inrush cur-
rent. The impact of the refraction of the voltage waveform alongthe cables has also been considered. It has been reported that,
in typical WPPs, waveforms generally have a refraction factor
of lower than unity [13] (a refraction factor of greater than one
implies a voltage amplification). With such a low refraction fac-
tor, the cable provides relatively high damping, and practically
no voltage magnification occurs. However, the refraction factor
is largely a high-frequency-related phenomenon, and it is not
likely to change the inrush current significantly. The impact
of series impedance of the cable on reducing the magnitude of
inrush current has also been considered. The 72-m cable under
consideration is relatively short, and the resulting voltage drop
across this cable is not deemed to be large compared to the rest
of the test system. The 72-m sea cable cannot therefore havea significant impact on the integral of the voltage. In general,
it is noted that another factor resulting in a low inrush current
shown in Figs. 21 and 22 is that the MV side is operated at
12 kV as opposed to the 20-kV nominal voltage.
G. Case 6: VCB Opening on Transformer With Small
Inductive Loading Shortly After Energization
Results obtained from case study 5 have demonstrated that
interruption of inrush current with an unloaded transformer
does not constitute the worst case scenario from the standpoint
of transient overvoltages and breaker reignitions. To understand
the most onerous overvoltages that can be experienced during
operation of the test system, numerous simulation case studies
were conducted. It was concluded that interruption of inrush
current on a transformer with a small inductive loading, e.g.,
0.1 Mvar or lower, will give rise to higher overvoltages and
larger number of reignitions compared to the results discussed
in case studies 4a and 5. For this case study, the transformer is
first energized with a loading of 0.1 Mvar, and the VCB opens
80 ms thereafter. The main reason for this behavior is that the
introduction of a small inductive load causes significantly high-
frequency overvoltages which exceed the breaker rate of rise of
recovery voltage and therefore causing successive reignitions
which last for a couple of milliseconds. The overvoltage is
maintained within the acceptable range by the transformer
surge arrester, and the breaker succeeds in current interruption.
The frequent occurrence of this phenomenon will, however,
have a negative impact on the breaker insulation.
V. SUMMARY
A summary of the first four case studies discussed earlieris presented in Table I. In the table, the system performance
during restrikes and prestrikes is assessed with the maximum
rate of change of voltage buildup and maximum rate of change
of voltage breakdown. A voltage buildup is the time when there
is no current through the breaker and the voltage is building
up across the breaker. A voltage breakdown occurs when the
voltage across the breaker exceeds the withstand voltage capa-
bility of the breaker. This results in a transient overvoltage due
to the interaction of the breaker, transformer, and cable. Table I
indicates that the measurements (M) and simulation (S) results
generally provide a close match except for the maximum rate of
change of voltage breakdown for case 3. The cells highlightedwith – indicate the values that cannot be derived from either
measurement or simulation studies.
VI. CONCLUSION
This paper has presented a system-level validation of an
integrated transient model of a typical WPP against the field
measurements carried out on a laboratory setup of the identical
WPP. Case studies investigated the transient overvoltages due
to interaction between different electrical apparatuses in WPP
collector grid during opening and closing of circuit breaker.
Good agreement was obtained between the simulation results
and field measurements which gives confidence in the use of these models for predesign studies and designing protective

8/20/2019 Transients in Wind Power Plants - IEEE
http://slidepdf.com/reader/full/transients-in-wind-power-plants-ieee 10/11
BADRZADEH et al.: TRANSIENTS IN WIND POWER PLANTS II 1637
TABLE ISUMMARY OF THE FOU R CAS E STUDIES PRESENTED AND COMPARISON W ITH CORRESPONDING MEASUREMENT RESULTS
measures for specific systems should they be found necessary
based on simulation studies. The discrepancies between the
simulation and measurements were highlighted as summarized
as follows for the four investigated cases.
1) Closing VCB on an unloaded transformer: The measured
current builds up slightly later than the measured voltage.
This indicates the lag characteristic of the current mea-
surement device which was not included in the simulation
model. Some minor restrikes were observed before the
breaker contacts are fully closed. In practice, this occurs
due to the breaker bouncing phenomena not represented
in the model.
2) Opening VCB on an unloaded transformer: The measured
voltage shows restrikes that cannot be observed in the
corresponding simulation case study. The difference is
likely caused by the presence of a residual dc current
created by sequential opening and closing of the breaker.
This residual dc current component increases the current
being chopped at the time of interruption. The simulatedcase was therefore initialized with a too low current not
causing any restrikes.
3) Closing VCB on a transformer with inductive loading:
The breaker bouncing is more pronounced compared to
the no-load case.
4) Opening VCB on a transformer with inductive loading:
The initial voltage buildup given in the measurement is
larger than the simulated voltage by approximately 1 kV,
but both measurement and simulation show the same rate
of rise of voltage.
In general, the following traits can be observed by investigat-
ing the waveforms of transient overvoltages.1) The magnitude of the current being chopped determines
if a voltage buildup will occur.
2) The magnitude of the current is a determining factor for
the gradient of voltage buildup; the larger the current, the
larger the rate of rise of voltage will be.
3) As the transient overvoltages are caused by the system
and breaker interaction, the impedance of the system
being interrupted has a significant impact on the rate of
rise of voltage. It was shown that the introduction of an
inductive load will make the voltage buildup faster which
results in a significant increase in the number of restrikes.
To understand the most onerous overvoltages that can beexperienced in the test system, a couple of case studies were
discussed. These case studies have demonstrated that interrup-
tion of inrush current with an unloaded transformer does not
result in the most onerous overvoltages, primarily due to the
very fast decay of inrush current in the circuit. Case studies
have indicated that interruption of a small inductive current
following the transformer energization will give rise to the most
onerous overvoltages.
REFERENCES
[1] M. Reza and H. Breder, V-110 cable system transient study, Vind-forsk, Stockholm, Sweden, Elforsk Rep. 09:05. [Online]. Available: www.vindenergi.org/Vindforskrapporter/09_05_rapport.pdf
[2] C. Han, D. E. Martin, and M. R. Lezama, “Transient Over-Voltage (TOV)and its suppression,” in Proc Int. Conf. SUPERGEN , Nanjing, China, Apr.6/7, 2009, pp. 1–7.
[3] L. Liljestrand, A. Sannino, H. Breder, and S. Thorburn, “Transients incollection grids of large offshore wind parks,” Wind Energy J., vol. 11,no. 1, pp. 45–61, Jan./Feb. 2008.
[4] L. Nian, “Transients in the collection grid of a novel wind farm topology,”M.S. thesis, Sch. Elect. Eng., Royal Inst. Technol., Stockholm, Sweden,2009.
[5] T. Abdulahovic, “Analysis of high-frequency electrical transients in off-shore wind parks,” Ph.D. dissertation, Dept. Elect. Eng., Chalmers Univ.Technol., Göteburg, Sweden, 2008.
[6] I. Arana, J. Holbøll, T. Sørensen, A. H. Nielsen, P. Sørensen, andO. Holmstrøm, “Comparison of measured transient overvoltages in thecollection grid of Nysted offshore wind farm with EMT simulations,” inProc Int. Conf. Power Syst. Transients, Kyoto, Japan, Jun. 2–6, 2009.
[7] I. Arana, D. Johnsen, and J. Holbøll, “Transient study for a fully compen-sated export cable in large offshorewind farms,” in Proc 9th Int. Workshop
Large-Scale Integr. Wind Power Power Syst./Transmiss. Netw. Offshore
Wind Power Plants, Quebec City, QC, Canada, Oct. 2010.[8] E. H. Camm, M. R. Behnke, O. Bolado, M. Bollen, M. Bradt, C. Brooks,
W. Dilling, M. edds, W. J. Hejdak, D. Houseman, S. Klein, F. Li,P. Maibach, T. Nicolai, J. Patino, S. V. Pasupulati, N. Samaan, S. Saylors,T. Siebert, T. Smith, M. Starke, and R. Walling, “Wind power plantcollector system design considerations: IEEE PES Wind Power Plant Col-
lector System Design Working Group,” in Proc IEEE PES Gen. Meeting,Calgary, AB, Canada, Jul. 2009, pp. 1–7.
[9] W. M. C. Van den Heuvel, J. E. Daadler, M. J. M. Boone, andL. A. H. Wilmes, “Interruption of a dry-type transformer in no-load bya vacuum circuit-breaker,” Eindhoven Inst. Technol., Eindhoven, TheNetherlands, 1983.
[10] B. Badrzadeh, M. Høgdahl, and E. Isabegovic, “Transients in wind powerplants—Part I: Modeling methodology and validation,” in Conf. Rec.
IEEE IAS Annu. Meeting, Orlando, FL, Oct. 2011, pp. 1–11.[11] S. N. Kharin, H. Nouri, and D. Amft, “Dynamics of arc phenomena at
closure of electrical contacts in vacuum circuit breakers,” IEEE Trans.
Plasma Sci., vol. 33, no. 5, pp. 1576–1581, Oct. 2005.[12] E. Dullni and Z. Sean-Feng, “Bouncing phenomena of vacuum cir-
cuit breakers,” in Proc 24th Int. Symp. Discharges Elect. Insul. Vac.,Braunschweig, Germany, Aug. 30–Sep. 2, 2010, pp. 463–466.
[13] M. Reza, K. Srivastava, T. Abdulahovic, A. Marinopoulos, and H. Breder,
“V-326 high frequency transients in large wind farms: advanced measure-ments and characterization,” Vindforsk, Stockholm, Sweden, Elforsk Rep.V-326, Jan. 2012.

8/20/2019 Transients in Wind Power Plants - IEEE
http://slidepdf.com/reader/full/transients-in-wind-power-plants-ieee 11/11
1638 IEEE TRANSACTIONS ON INDUSTRY APPLICATIONS, VOL. 48, NO. 5, SEPTEMBER/OCTOBER 2012
Babak Badrzadeh (S’03–M’07–SM’12) receivedthe B.Sc. and M.Sc. degrees in electrical power en-gineering from Iran University of Science and Tech-nology, Tehran, Iran, in 1999 and 2002, respectively,and the Ph.D. degree in electrical power engineeringfrom Robert Gordon University, Aberdeen, U.K.,in 2007.
After spending a short period as an Assistant
Professor at the Technical University of Denmark,Lyngby, Denmark, he joined the Transmission andDistribution Division, Mott MacDonald Group Ltd.,
Brighton and Glasgow, U.K., as a System Analysis and Network PlanningEngineer. From March 2010 to March 2012, he was with Plant Power Sys-tems, Vestas Technology R&D, Aarhus, Denmark, where he acted as a LeadEngineer in the area of advanced wind power plant simulation and analysis.Since May 2012, he has been with the Australian Energy Market Operator,Melbourne, Australia, initially as Manager Network Models, and subsequentlyas a Technical Specialist in System Capability. He has published severalarticles and presented tutorials at IEEE-organized conferences on differentareas of power systems and power electronics. He has prepared two two-parteducational courses for the IEEE eLearning Library on high-power variable-speed drives and HVDC transmission systems. His areas of interest includepower system electromechanical and electromagnetic transients, application of power electronics in power systems, WPPs, and modeling and simulation.
Dr. Badrzadeh was a Guest Editor for the Special Issue of the IEEE Industry
Applications Magazine on high-power variable-speed drives. He was an activemember of International Electrotechnical Commission Technical Committee 88of Working Group 27, and Danish A11 standard, both in the area of electricalsimulation models for wind power generation. Currently, he is an activemember of Cigre A2/C4.39 working group on electrical transient interactionbetween transformers and the power system.
Martin Høgdahl Zamastil was born in Denmark in 1971. He received the M.Sc. degree in electri-cal engineering from Aalborg University, Aalborg,Denmark, in 1996, and the Ph.D. degree fromAalborg University, Alborg, Denmark in 2003 forhis work in the field of high-frequency modeling of four-wire cables.
Until 1999, he worked in the telecom industry.
From 2002 to 2011, he was with Vestas TechnologyR&D, Aarhus, Denmark, as a Specialist in windpower plant modeling focusing on wind turbines
and balance of plant model development and validation. Since May 2011,he has been with the Danish Transmission System Operator—Energinet.dk,Fredericia, Denmark.
Nand K. Singh (M’05) received the M.Eng. de-gree in electronic and electrical engineering fromthe Belarusian National Technical University, Minsk,Belarus, in 1999, and the Ph.D. degree from theUniversity of Strathclyde, Glasgow, U.K., in 2007.
Until April 2009, he was with the Institute for En-ergy and Environment, University of Strathclyde, asa Postdoctoral Research Fellow. He was also a Power
System Analysis Engineer with the Transmission andDistribution Division, Mott MacDonald Group Ltd.,Glasgow, U.K., and a Lead Engineer with Vestas
Wind Systems. He is currently the U.K. Head of the Power System StudiesGroup, ABB Grid Systems, Stone, U.K.
Dr. Singh is a memberof theInstitutionof Engineering andTechnology, U.K.
Henrik Breder was born in Oslo, Norway, in 1947.He received the Tech. Lic. degree from UppsalaUniversity, Uppsala, Sweden, in 1984, after a pe-riod of part-time university studies while workingwith a combination of measurements and simula-tions of electrical transients, in laboratories and fieldinstallations.
Since 1970, he has been with ASEA/ABB Corpo-
rate Research, Vasteras, Sweden, as Senior ElectricalEngineer with magnetics and electrical machines.Major work apart from occasional troubleshoot-
ing has been conceptual development of active filters and circuit breakertechnology.
Kailash Srivastava was born in Fatehpur, India, onOctober 3, 1962. He received the B.S. degree inelectrical engineering from Madan Mohan MalaviyaEngineering College, Gorakhpur, India, in 1983, andthe M.Tech. and Ph.D. degrees in power systemsfrom the Indian Institute of Technology Kanpur,Kanpur, India, in 1986 and 1995, respectively.
Since 1997, he has been with ABB CorporateResearch, Vasteras, Sweden. His research interestsinclude power system dynamics, control, HVDC,optimization techniques, grid integration of renew-
ables, and modeling and simulation of power systems.
Muhamad Reza (M’03) received the B.Sc. degreein electrical engineering from Bandung Institute of Technology, Bandung, Indonesia, and the M.Sc. andPh.D. degrees in power systems and electrical engi-neering from Delft University of Technology, Delft,The Netherlands.
Since 2006, he has been with ABB Corporate Re-search, Vasteras, Sweden, where he has been work-ing as a Scientist and Project Leader on differentR&D projects within the areas of power technologies
and electrical systems and is currently the WindIndustry Sector Initiative Technology Team Leader.Dr. Reza is a reference group member of the Swedish Energy Agency
research program Vindforsk that focuses on development of wind energy, CigreA2/C4.39 focusing on interaction of wind transformers with cable systems, andan IEEE working group on wind collector design.