transit signal priority - northeastern university · 2015-03-18 · priority makes sense • one...
TRANSCRIPT

Transit Signal Priority: Help or Hype?
Peter G. Furth Northeastern University

Transit Signal Priority – Help or Hype?
• Zurich: nearly zero traffic delay and impeccable punctuality for trams
• Portland, San Diego: green wave for light rail station-to-station
• Yet, many US applications: < 2 s savings per intersection , or …
• No measurement at all
2

Transit Priority as a Societal Objective
3
• Transit use benefits society in terms of – Congestion – Air quality, climate impact, energy use – Vibrant communities
• Priority breaks the vicious cycle in which congestion drives people to switch from transit to car

Priority Makes Sense • One extreme ($$$$): build a metro • Other extreme: do nothing, buses become
swamped in congestion – Traffic delay can represent 30% of a bus route’s
operating cost – Feeds vicious cycle of ever-lower transit use
• In between: – Priority in space: bus lanes, etc. – Priority in time: signal priority
4

What Priority Means to a Transit Operation
• Reduced running time ($$, passenger benefit). Measures: – Delay per intersection – Average route running time
• Improved reliability ($$, passenger benefit). – Recovery time, cycle time based on 95-percentile
running time – Tri-Met Line 12: reduced needed cycle length from 104
min to 93 min (11%)
5

Operational Control: Schedule Adherence, Crowding
Schedule deviation along the route, without priority,
Eindhoven
With priority
6

Priority Makes Transit …
• More competitive – Bus has natural disadvantages due to stops and
walking / waiting – Priority compensates, especially if cars suffer
congestion • More socially acceptable (red carpet)
– my great aunt …
7

Levels of Priority in Modern Traffic Signal Controllers
• Highest level (preemption) reserved for emergency vehicles and railroad crossings
• Pre-programmed “priority” tactics include green extension and early green
• More intelligent tactics require custom programming, usually with central control & communication
8

Green Extension • Built-in logic in modern controllers • Large benefit to a few buses
– Therefore little disruption to traffic
• Extension increment is a parameter (10 s? 15 s?)
9
cumulat ive vehicles
red green time
v s
bus delay
11
cumulat ive vehicles
green time
1 s
X
bus delay
normal red
v 1
Without priority With green extension

“Priority Push” is not the same as Allowed Extension
svCRdelayE
−=
11
2][
2
cumulat ive vehicles
red green time
v s
bus delay
11
cumulat ive vehicles
green time
1 s
X
bus delay
normal red
v 1
−−−
−= )1(
211
2][
22
svC
XCRX
svCRdelayE
Priority push!
Without priority With green extension
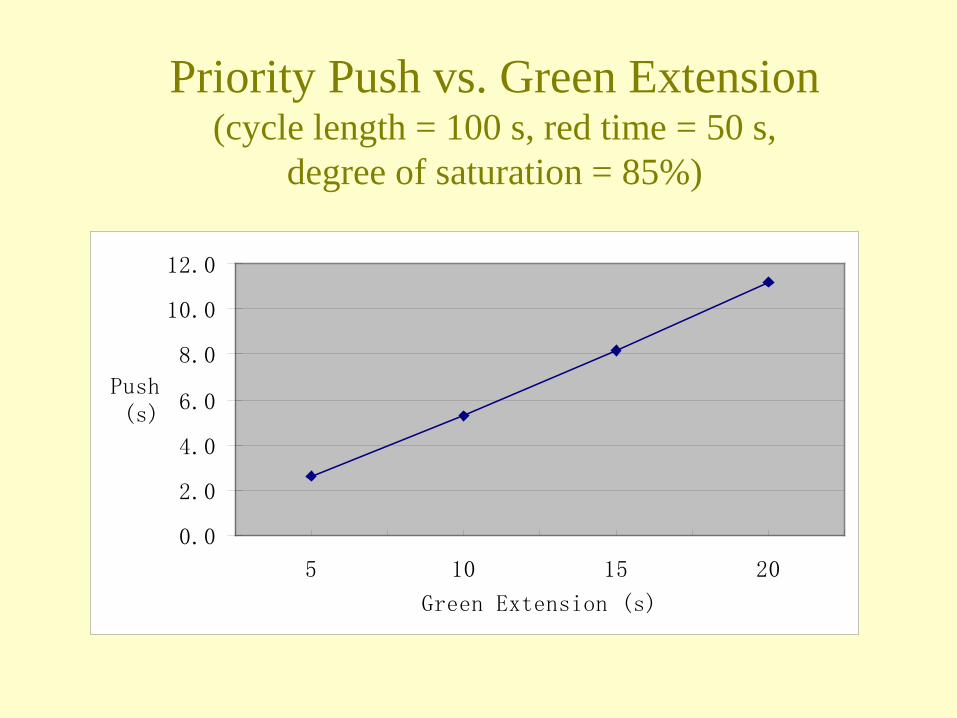
Priority Push vs. Green Extension (cycle length = 100 s, red time = 50 s,
degree of saturation = 85%)
0.0
2.0
4.0
6.0
8.0
10.0
12.0
5 10 15 20
Green Extension (s)
Push (s)
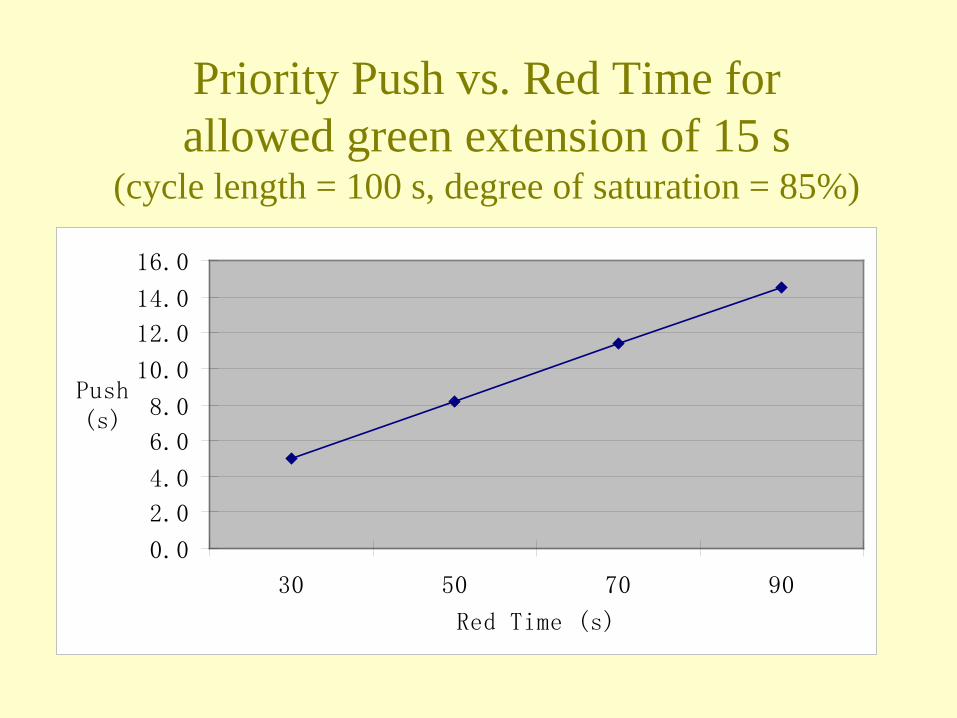
Priority Push vs. Red Time for allowed green extension of 15 s
(cycle length = 100 s, degree of saturation = 85%)
0.0
2.0
4.0
6.0
8.0
10.0
12.0
14.0
16.0
30 50 70 90
Red Time (s)
Push (s)
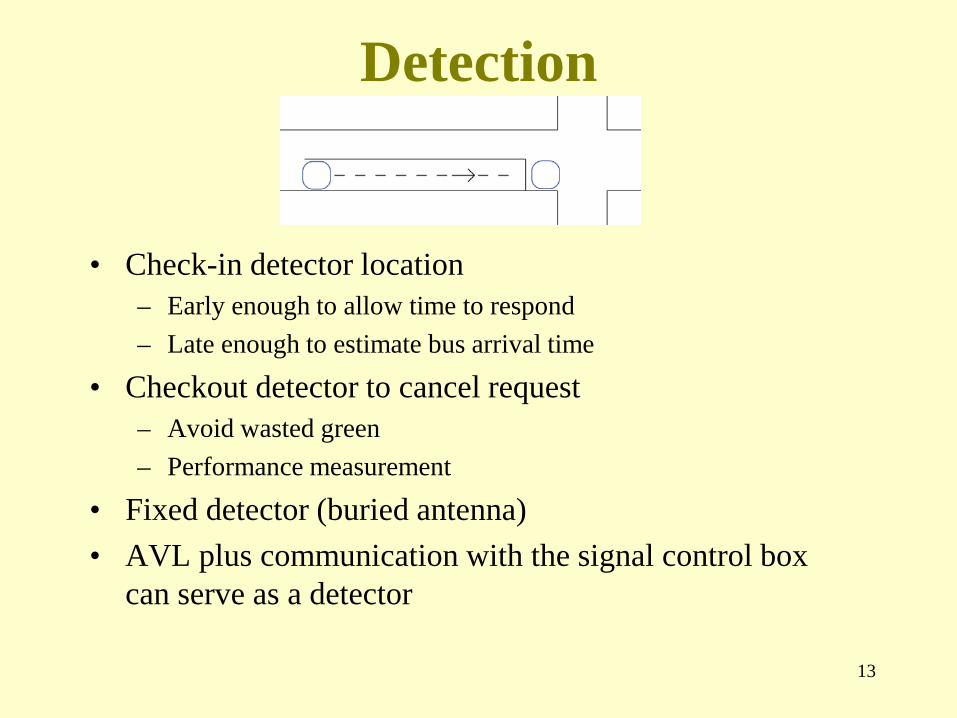
Detection
• Check-in detector location – Early enough to allow time to respond – Late enough to estimate bus arrival time
• Checkout detector to cancel request – Avoid wasted green – Performance measurement
• Fixed detector (buried antenna) • AVL plus communication with the signal control box
can serve as a detector
13
Sketch 1

Upstream Detector for Green Extension: travel time = maximum green extension
Simplicity: • Request = detection
14
Weaknesses: • assumes constant speed • no flexibility for updates,
time of day settings • may not be suitable for other
priority tactics

What if There’s a Near-Side Stop?
• Detector located just after stop • Disable optical signal until door closes
(Portland, OR) • Possible need for priority against a vehicle
queue blocking entry to the bus stop 15

Common Weaknesses in Signal Priority Implementation
1. “Cautious priority:” Inhibit priority … – for 5 minutes or 1 full cycle after priority interruption – if cross street occupancy exceeds threshold
2. Unnecessarily hurting traffic (leading to cautious priority) – Lack of checkout detector = wasted green – Lack of compensation creates large queuing impacts – Inflexibility in standard “coordination” logic
3. Apply easy, rather than intelligent, tactics 4. Lack of data collection and analysis
– Nobody ever gets it right the first time – Taking the objective seriously
16

Fully actuated (uncoordinated) signal control naturally
compensates • Fully actuated = hold green until the queue clears
(subject to min, max green) • Interrupted phases get longer green in the next
cycle, usually enough to clear the queue • Transit phase
– Priority green allows extra cars to be served – Reduces demand for green time in the next cycle
• System quickly recovers 17

Lack of compensation in coordinated systems
18
EBL EBT
WBT WBL
NBL NBT
SBT SBL
E-W Street N-S Street
1 2 3 4
7 6 8 5
WBL
EBT
NBL
SBT
EBL WBT
SBL
NBT
Suppose coordinated phase is 2 (EBT) • Green extension for 2 – no mechanism for compensation • Green extension for 4 – slight compensation
• Fixed cycle length • Fixed point = end of coordinated phase • Uncoordinated phases may run shorter than their allotted split, but not longer • Coordinated phase gets the slack time (starts early)
Returning to Coordination
In coordinated systems, recovery means • dissipating queues AND • Returning to the background cycle
– “Short way” = shorten phases following an extension
– “Long way” = lengthen phases, skip a cycle
19

Early Green
• What’s the truncation rule? – How much to shorten competing phases? Can they be skipped?
• Smaller benefit to large number of buses – More traffic impact; hard to implement when bus frequency is high
Truncate and possibly skip preceding phases
20

Early Green Issues • Exclusive lane for bus? (No queue, easier arrival time
prediction) • Mixed traffic: Eindhoven’s “electronic bulldozer” • Arrival time prediction
– How far upstream? (Bus stop and intersection spacing …) – Tracking queue length to know how long is needed to flush out the
queue (Zurich’s trap logic)
21

Early green (truncating competing phases) under coordination
22
E-W Street N-S Street
1 2 3 4
7 6 8 5
WBL
EBT
NBL
SBT
EBL WBT
SBL
NBT
Assume phase 2 is coordinated • Early green for 2 is possible, but without compensation to
shortened phases • Early green for 3 – not possible under standard logic

Eindhoven Experiment
23
Coordinated phase (ring road, no buses)
Buses every 10 min NB and SB

Existing Priority Scheme
24
E-W Street N-S Street
1 2 3 4
7 6 8 5
WBL
EBT
NBL
SBT
EBL WBT
SBL
NBT
• Green extension • Aggressive early green: reduce intervening phases to
minimum green • “Short way” minimum green to return to background cycle
• Coordinated phase is 6 • Buses are on 4 and 8
(every 10 minutes) • Priority only if bus is
more than 20 s late (about half the buses)

Intersection Experiment and Site Description One day each of
• priority to all buses (absolute)
• priority to late buses (conditional)
•no priority
Camera facing each approach
Film “trap” between entry & exit
Playback in lab
Entry Exit Exit
Exit Exit Entry
Entry
Entry

Experiment Eindhoven
Average Transit Delay [sec]
05
101520253035
Nort
hBo
und
Sout
hBo
und
Nort
hBo
und
Sout
hBo
und
AM PM
Dela
y Pu
blic
Tra
nspo
rt
No PriorityAbs PriorityCond priority
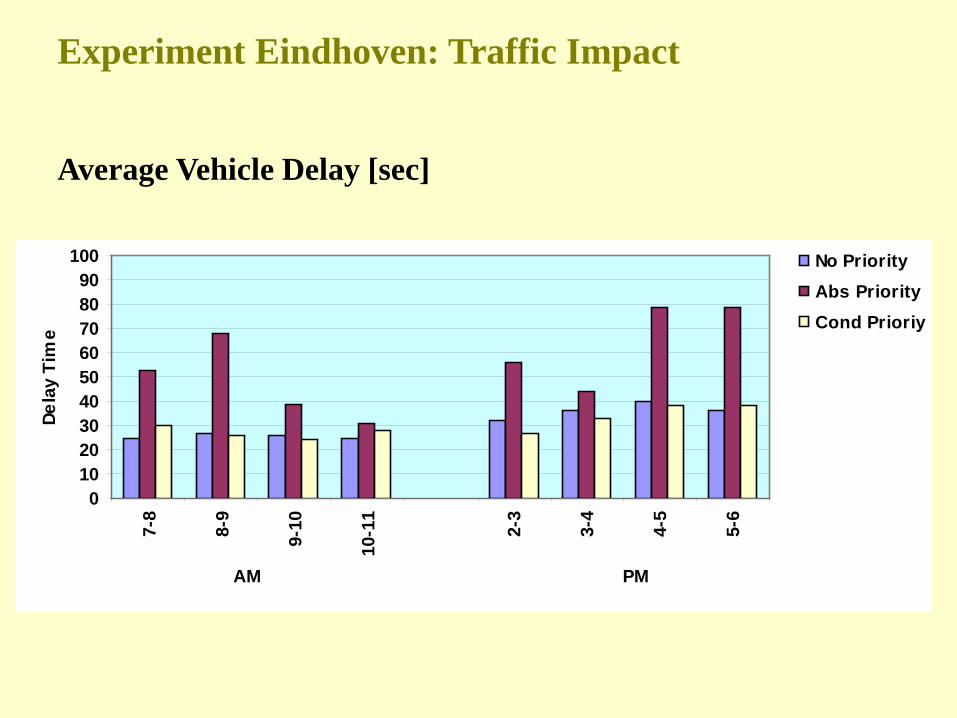
Experiment Eindhoven: Traffic Impact
Average Vehicle Delay [sec]
0102030405060708090
100
7-8
8-9
9-10
10-1
1
2-3
3-4
4-5
5-6
AM PM
Dela
y Ti
me
No PriorityAbs PriorityCond Prioriy

Experiment Eindhoven
Average Vehicle Delay per Approach [sec]
0
20
40
60
80
100
120
140
Wes
tBo
und
Nort
hBo
und
East
Boun
d
Sout
hBo
und
Wes
tBo
und
Nort
hBo
und
East
Boun
d
Sout
hBo
und
AM PM
Dela
y Ti
me
No PriorityAbs PriorityCond Priority

Experiment Eindhoven
Relative Capacity per Approach (no priority = 100%)
020406080
100120
Nort
h-bo
und
Sout
h-bo
und
East
- bo
und
Wes
t-
boun
d
Nort
h-bo
und
Sout
h-bo
und
East
- bo
und
Wes
t-
boun
d
AM PM
No PriorityAbs Priorityond Priority

Lessons from Eindhoven • Aggressive early green resulted in near-zero delay
for buses • Conditional priority needs finely-tuned schedule
– Schedule too tight – bus always late – absolute priority – Schedule too loose – bus always early – no priority
• Lack of compensation: OK for 6 interruptions per hour, but not 12
• Capacity loss due to – Early green truncations, but more from … – “short way” recovery to background cycle
30

Early Red
• Needs advanced detection (almost a full cycle) • Incompatible with typical coordination logic
– custom programming
Shorten bus street’s current green to get faster return to green in the next cycle
31

Flush-and-Return
• Green extension to clear queue from bus stop
• Force signal to red during stop – Minimizes bus’s impact
on road capacity • Return to green as
quickly as possible 32
Early green tactic for Near-Side Stops Tested using simulation on San Juan (PR) arterial

Phase Rotation
• Example: change leading bus phase to lagging – Lagging bus phase becomes leading – like early green – Leading bus phase becomes lagging – like green extension
(more effective) • Used extensively in Germany • Zurich’s pre-application safety campaign: random
phase sequencing for 6 months! 33

Phase Insertion
34
• Second realization on bus detection only • Greatly reduces red period for bus – big reduction in delay
• Zurich’s “insert and return”
Passive Priority Treatments that favor buses but don’t rely on bus
detections
• Favorable splits for bus phase • Favorable offsets (progression) for bus
– Hard to do over more than a few intersections due to uncertain dwell time
• Short cycles or double realizations (short red is the key)
35
36
Ruggles Bus Terminal Study
with Burak Cesme, PhD student at Northeastern Univ.
Using VISSIM simulation and VAP signal
control programming
37
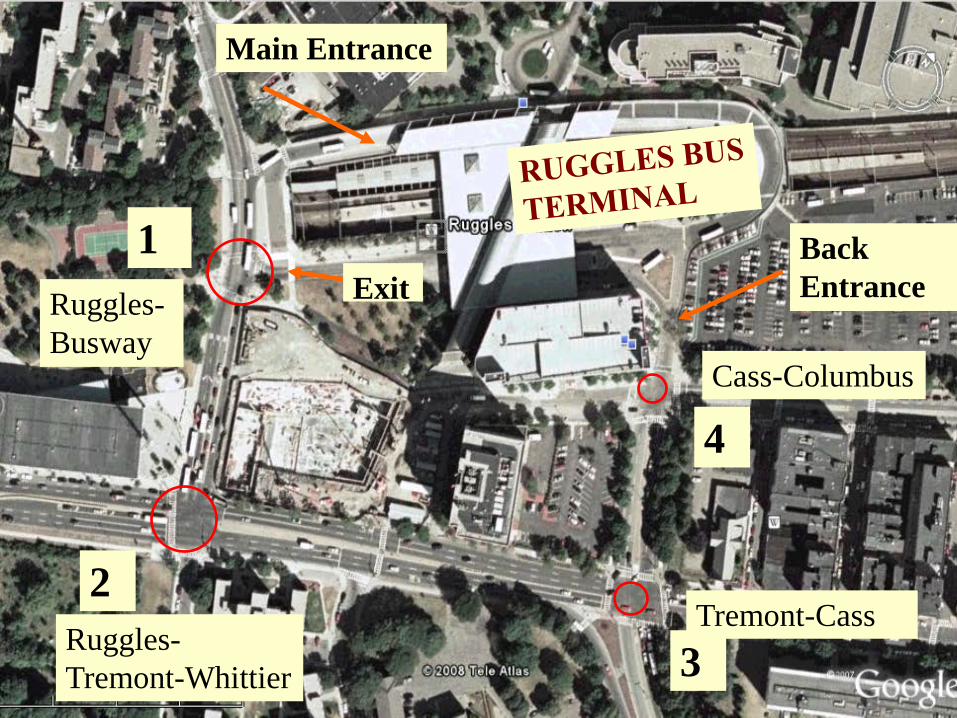
Back Entrance
1
2
3
4
Main Entrance
Exit Ruggles-Busway
Ruggles-Tremont-Whittier
Tremont-Cass
Cass-Columbus

38

39

1 Bus Delays with
Incremental Priority Treatments, by Route
40
2 3
4

41 41
Passive priority: more time to bus left turn. Note: 5 s increase in split consumes only 2.5 s!
Max Green = 16 seconds
Prop
ortio
n
p (max-out) = 84.6%
Avg bus delay = 98 s
p (max-out) = 51.2%
Avg bus delay = 67 s
Max Green = 21 seconds
0.000.100.200.300.400.500.600.700.800.90
8 9 10 11 12 13 14 15 16Green Time ( s )
Avg Green (EBL) = 15.3s
Prop
ortio
n
0.000.100.200.300.400.500.600.700.800.90
8 9 10 11 12 13 14 15 16 17 18 19 20 21Green Time ( s )
Prop
ortio
n
Avg Green (EBL) = 17.8s

42
Intelligent Green Extension: 10 s extension for “cost” of 0.5 s
0.00
0.10
0.20
0.30
0.40
0.50
0.60
8 9 10 11 12 13 14 15 16 17 18 19 20 21Green Time ( s )
No Priority
Prop
ortio
n
Avg Green (EBL) = 17.8s
Avg Green (WBT) = 30.3s
p (max-out) = 0.512
Avg Green (WBT) = 29.8s
p (max-out) = 0.247 p (extended) = 0.213
0.00
0.10
0.20
0.30
0.40
0.50
0.60
8 9 10 11 12 13 14 15 16 17 18 19 20 21 22 23 24 25 26 27 28 29 30 31
Green Time ( s )
Avg Green (EBL) = 18.1s Pr
opor
tion
With Green Extension
Extended Green
43
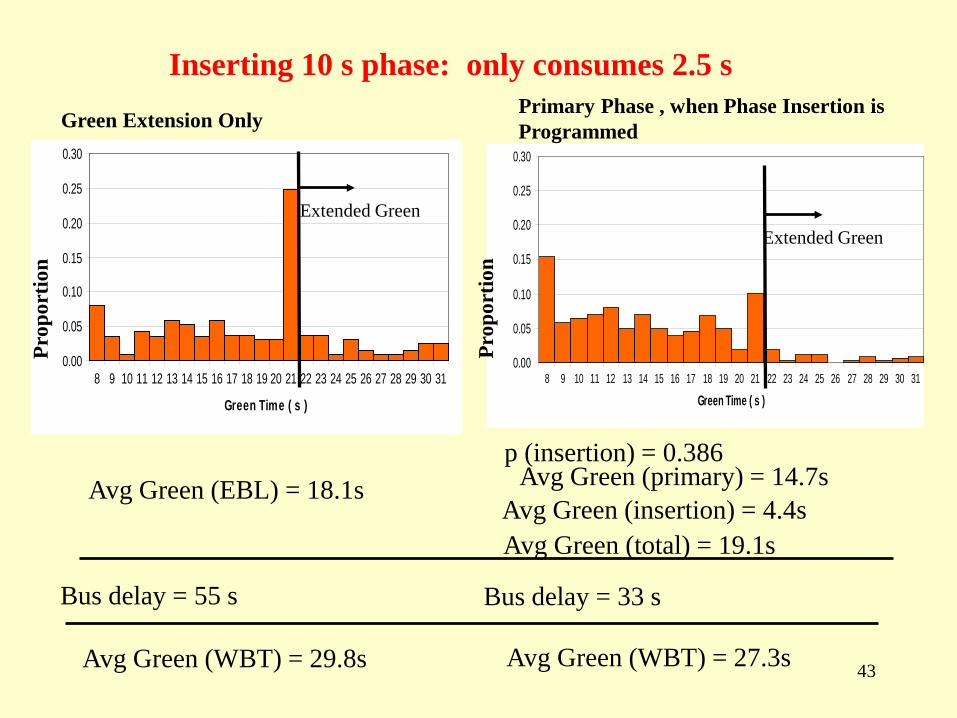
Inserting 10 s phase: only consumes 2.5 s
0.00
0.05
0.10
0.15
0.20
0.25
0.30
8 9 10 11 12 13 14 15 16 17 18 19 20 21 22 23 24 25 26 27 28 29 30 31
Green Time ( s )
Green Extension Only
Prop
ortio
n
Extended Green
Avg Green (EBL) = 18.1s
Avg Green (WBT) = 29.8s
Avg Green (insertion) = 4.4s
Avg Green (WBT) = 27.3s
p (insertion) = 0.386
0.00
0.05
0.10
0.15
0.20
0.25
0.30
8 9 10 11 12 13 14 15 16 17 18 19 20 21 22 23 24 25 26 27 28 29 30 31
Green Time ( s )
Extended Green
Primary Phase , when Phase Insertion is Programmed
Avg Green (primary) = 14.7s
Avg Green (total) = 19.1s
Prop
ortio
n
Bus delay = 55 s Bus delay = 33 s

Conditional Priority
• Less interference with traffic (Eindhoven) • Push-pull means of operational control (Einhoven) • What is “Late:” 15 s or 3 minutes? • Demands fine-tuned schedule • Headway-based priority for short-headway service
44
Priority to Late Buses

Priority Queue Management
• Detectors & logic for queue management – Stopped cars, not moving cars, hinder buses
45
(Zurich)
(Eindhoven)

Predictive Priority
• Detector 1 used to predict bus arrival at 4 (~2 minutes advance)
• Adjust cycle lengths so that bus will arrive on green • Last-minute priority as backup • Adaptive (learning) algorithm for predicting bus arrival
46
Remote, upstream detection: simulated on Huntington Ave, used in Salt Lake City

Dynamic Coordination (Zurich)
– Small zones (1-3 intersections) – No fixed clock – Shape green waves through the zone around
bus – Zone boundaries are segments that offer storage
buffer
47

Self-Organizing Coordination • Each signal’s start of green becomes a request to
downstream signal – Peer-to-peer communication between signals – upstream signal’s request has lower priority that bus
request • Result: spontaneous green wave • Inherently interruptible
48
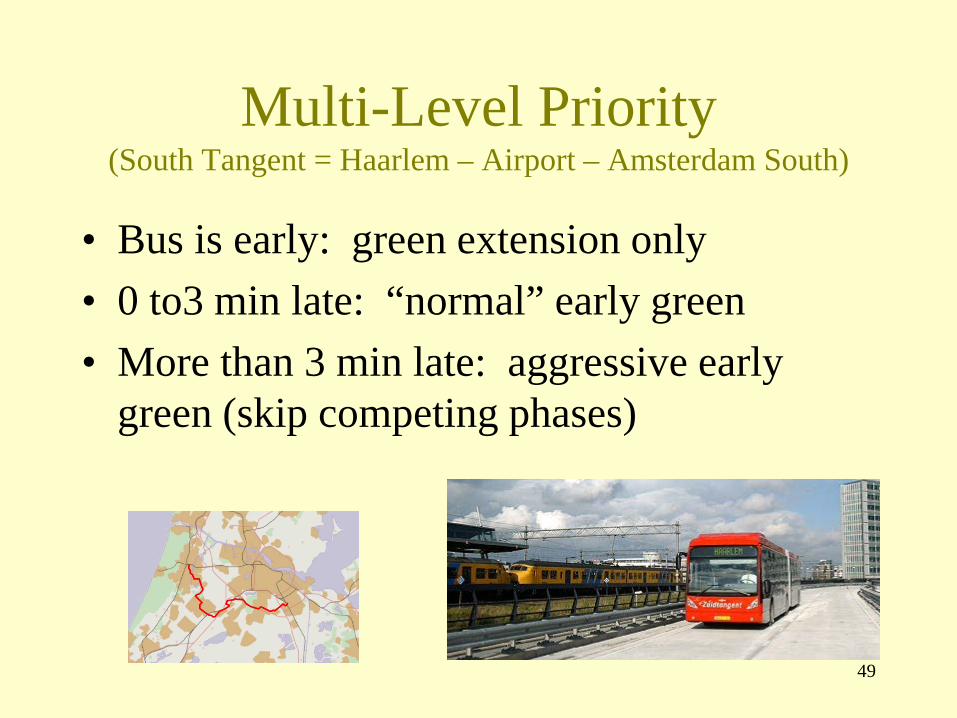
Multi-Level Priority (South Tangent = Haarlem – Airport – Amsterdam South)
• Bus is early: green extension only • 0 to3 min late: “normal” early green • More than 3 min late: aggressive early
green (skip competing phases)
49

Six Keys to Performance 1. Aim for near-zero delay 2. Multiple intelligent and aggressive tactics, with
compensation 3. Coordinate with scheduling (cond’l priority) 4. Alternatives to rigid coordination 5. Advanced prediction with gradual cycle
adjustments 6. Custom programming, performance
measurement, & continual improvement 50