(translation) - mcd-holdings.co.jp · 1 contents 1. operating results 2 (1) business strategy 2 (2)...
TRANSCRIPT
Financial Results Report for the December 2012 Term (Consolidated) February 7, 2013
McDonald’s Holdings Company (Japan), Ltd.
Company code number: 2702 (URL http://www.mcd-holdings.co.jp/) Shares traded: Osaka securities exchange, JASDAQ Executive position of legal representative: Eikoh Harada Chairman and CEO, President, Representative Director Please address all communications to: Row Imamura Vice President, Finance Division
Phone: (03) 6911-6000 Schedule of ordinary annual shareholders’ meeting: March 19, 2013 Schedule of dividends payment: March 21, 2013 Schedule of annual security report submission: March 21, 2013 Preparation of supplementary materials for quarterly financial results: Yes Information meeting for financial results to be held: Yes (for institutional investors)
1. Consolidated operating results (From January 1, 2012 to December 31, 2012)
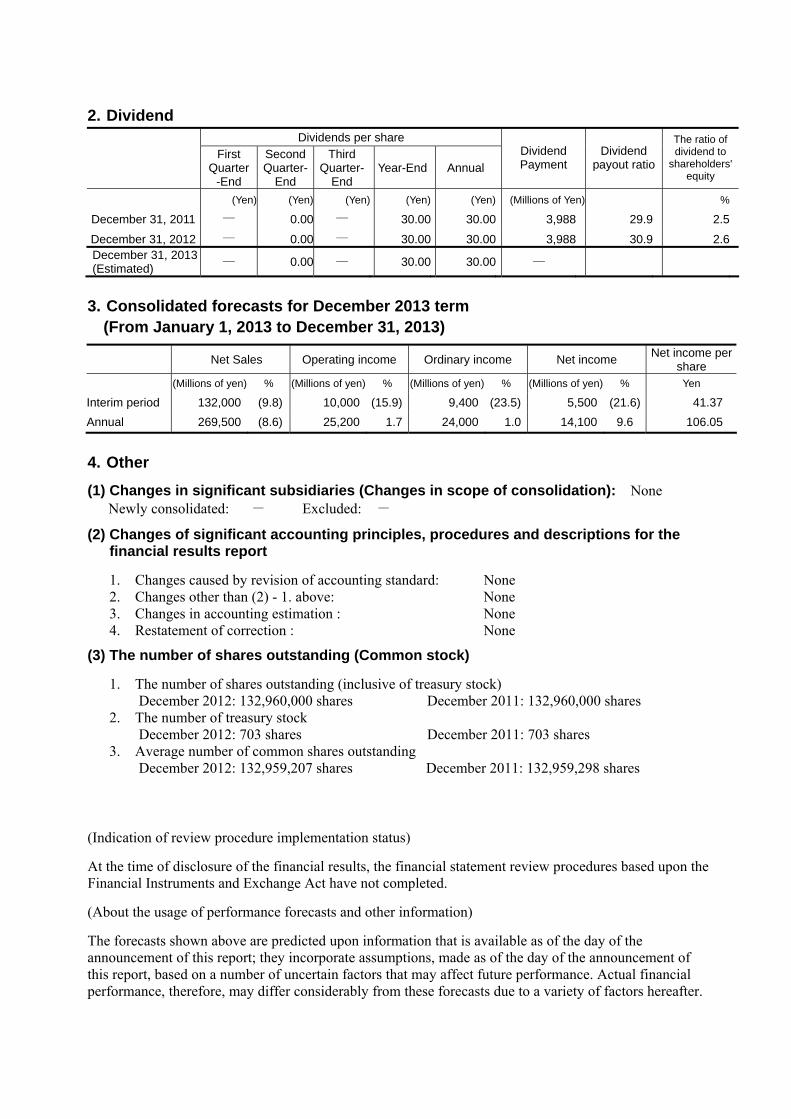
(1) Consolidated financial results (In millions of yen, with fractional amounts discarded)
(negative figures are shown in parenthesis)
Net sales Operating income Ordinary income (Millions of yen) % (Millions of yen) % (Millions of yen) %
December 31, 2012 294,710 (2.5) 24,780 (12.0) 23,770 (13.9)
December 31, 2011 302,339 (6.6) 28,182 0.2 27,612 1.7
Net income Net income per
share
Net income per share, fully
diluted
Return on shareholders'
equity
Ratio of ordinary
income to total assets
Ratio of operating
income to net sales
(Millions of yen) % (Yen) (Yen) % % %
December 31, 2012 12,870 (3.2) 96.8 - 7.7 10.6 8.4
December 31, 2011 13,298 69.1 100.02 - 8.5 13.1 9.3Note: Gains or losses on investments through equity method accounting: December 2012 term: - December 2011 term: -
(2) Consolidated financial position
Total assets Shareholders’ equity Equity ratio Shareholders' equity
per share (Millions of yen) (Millions of yen) % (Yen)
December 31, 2012 226,338 170,737 75.4 1,282.89December 31, 2011 222,029 161,787 72.8 1,215.64Note: Equity amount (consolidated): December 2012 term: 170,571 million yen December 2011 term: 161,631 million yen
(3) Consolidated cash flows statement
Net cash
(used in)/provided by operating activities
Net cash (used in)/provided by
investing activities
Net cash (used in)/provided by
financing activities
Cash and cash equivalents at end of
term (Millions of yen) (Millions of yen) (Millions of yen) (Millions of yen)
December 31, 2012 20,464 (5,488) (4,967) 72,148
December 31, 2011 41,152 (7,215) (4,757) 62,130
(Translation)
2. Dividend Dividends per share
First
Quarter -End
Second Quarter-
End
Third Quarter-
End Year-End Annual
Dividend Payment
Dividend payout ratio
The ratio of dividend to
shareholders' equity
(Yen) (Yen) (Yen) (Yen) (Yen) (Millions of Yen) %
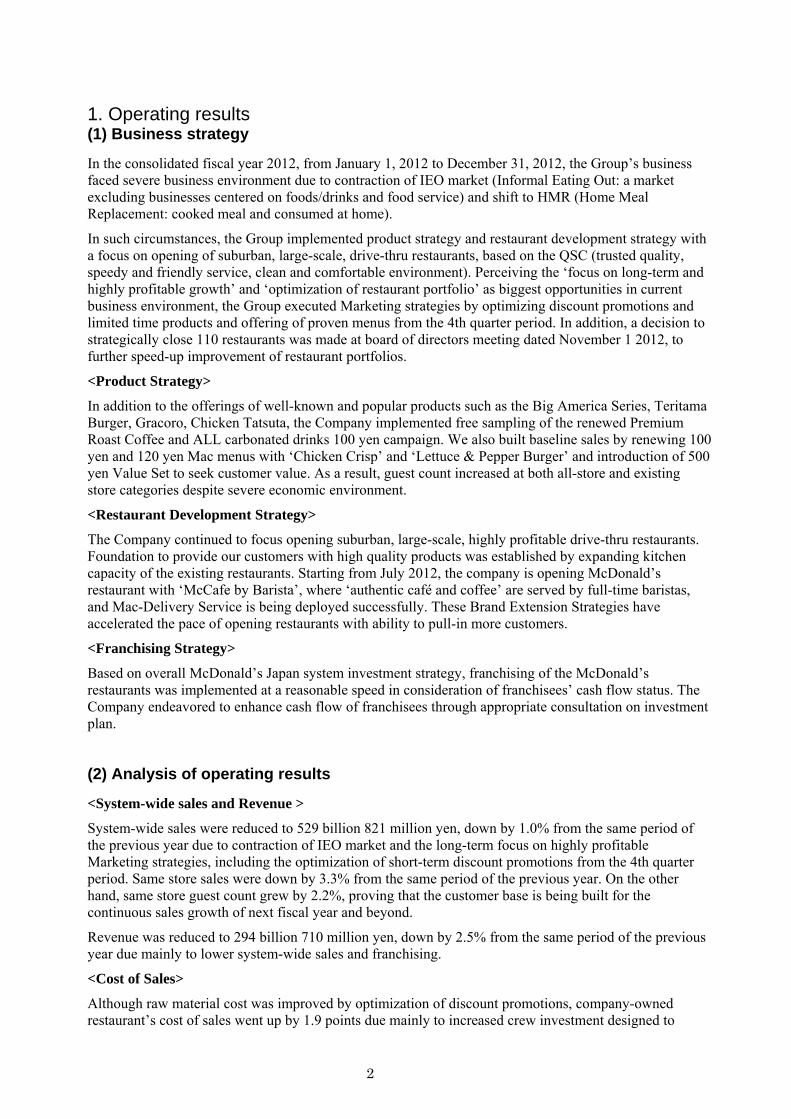
December 31, 2011 ― 0.00 ― 30.00 30.00 3,988 29.9 2.5
December 31, 2012 ― 0.00 ― 30.00 30.00 3,988 30.9 2.6December 31, 2013 (Estimated)
― 0.00 ― 30.00 30.00 ―
3. Consolidated forecasts for December 2013 term (From January 1, 2013 to December 31, 2013)
Net Sales Operating income Ordinary income Net income Net income per
share (Millions of yen) % (Millions of yen) % (Millions of yen) % (Millions of yen) % Yen
Interim period 132,000 (9.8) 10,000 (15.9) 9,400 (23.5) 5,500 (21.6) 41.37
Annual 269,500 (8.6) 25,200 1.7 24,000 1.0 14,100 9.6 106.05
4. Other
(1) Changes in significant subsidiaries (Changes in scope of consolidation): None Newly consolidated: - Excluded: -
(2) Changes of significant accounting principles, procedures and descriptions for the financial results report
1. Changes caused by revision of accounting standard: None 2. Changes other than (2) - 1. above: None 3. Changes in accounting estimation : None 4. Restatement of correction : None
(3) The number of shares outstanding (Common stock)
1. The number of shares outstanding (inclusive of treasury stock) December 2012: 132,960,000 shares December 2011: 132,960,000 shares
2. The number of treasury stock December 2012: 703 shares December 2011: 703 shares
3. Average number of common shares outstanding December 2012: 132,959,207 shares December 2011: 132,959,298 shares
(Indication of review procedure implementation status)
At the time of disclosure of the financial results, the financial statement review procedures based upon the Financial Instruments and Exchange Act have not completed.
(About the usage of performance forecasts and other information)
The forecasts shown above are predicted upon information that is available as of the day of the announcement of this report; they incorporate assumptions, made as of the day of the announcement of this report, based on a number of uncertain factors that may affect future performance. Actual financial performance, therefore, may differ considerably from these forecasts due to a variety of factors hereafter.

1
Contents 1. Operating results 2
(1) Business strategy 2
(2) Analysis of operating results 2
(3) Analysis of financial position 4
(4) Fundamental policy with regard to the distribution of profits and dividend for the current
and next fiscal year 5
(5) Operational and other risks 6
(6) Important matters for assumption of going concern 7
2. Management policy 8
(1) Fundamental management policy 8
(2) Performance indicators and targets 8
(3) Medium-term management strategy 8
(4) Company challenges 9
3. Consolidated financial statements 10
(1) Consolidated balance sheets 10
(2) Consolidated statement of income and consolidated statements of comprehensive income 12
(3) Consolidated statement of changes in net assets 14
(4) Consolidated statement of cash flows 16
(5) Notes for assumption of going concern 17
(6) Significant accounting policy 17
(7) Notes to consolidated financial statements 19
(Consolidated balance sheets - related) 19
(Consolidated statement of income - related) 19
(Consolidated statement of cash flows - related) 21
(Segment information etc.) 21
(Per share-related financial information) 22
(Important matters occurring subsequent to report period) 22
4. Other 23
(1) Changes in the board of directors 23
2
1. Operating results (1) Business strategy
In the consolidated fiscal year 2012, from January 1, 2012 to December 31, 2012, the Group’s business faced severe business environment due to contraction of IEO market (Informal Eating Out: a market excluding businesses centered on foods/drinks and food service) and shift to HMR (Home Meal Replacement: cooked meal and consumed at home).
In such circumstances, the Group implemented product strategy and restaurant development strategy with a focus on opening of suburban, large-scale, drive-thru restaurants, based on the QSC (trusted quality, speedy and friendly service, clean and comfortable environment). Perceiving the ‘focus on long-term and highly profitable growth’ and ‘optimization of restaurant portfolio’ as biggest opportunities in current business environment, the Group executed Marketing strategies by optimizing discount promotions and limited time products and offering of proven menus from the 4th quarter period. In addition, a decision to strategically close 110 restaurants was made at board of directors meeting dated November 1 2012, to further speed-up improvement of restaurant portfolios.
<Product Strategy>
In addition to the offerings of well-known and popular products such as the Big America Series, Teritama Burger, Gracoro, Chicken Tatsuta, the Company implemented free sampling of the renewed Premium Roast Coffee and ALL carbonated drinks 100 yen campaign. We also built baseline sales by renewing 100 yen and 120 yen Mac menus with ‘Chicken Crisp’ and ‘Lettuce & Pepper Burger’ and introduction of 500 yen Value Set to seek customer value. As a result, guest count increased at both all-store and existing store categories despite severe economic environment.
<Restaurant Development Strategy>
The Company continued to focus opening suburban, large-scale, highly profitable drive-thru restaurants. Foundation to provide our customers with high quality products was established by expanding kitchen capacity of the existing restaurants. Starting from July 2012, the company is opening McDonald’s restaurant with ‘McCafe by Barista’, where ‘authentic café and coffee’ are served by full-time baristas, and Mac-Delivery Service is being deployed successfully. These Brand Extension Strategies have accelerated the pace of opening restaurants with ability to pull-in more customers.
<Franchising Strategy>
Based on overall McDonald’s Japan system investment strategy, franchising of the McDonald’s restaurants was implemented at a reasonable speed in consideration of franchisees’ cash flow status. The Company endeavored to enhance cash flow of franchisees through appropriate consultation on investment plan.
(2) Analysis of operating results
<System-wide sales and Revenue >
System-wide sales were reduced to 529 billion 821 million yen, down by 1.0% from the same period of the previous year due to contraction of IEO market and the long-term focus on highly profitable Marketing strategies, including the optimization of short-term discount promotions from the 4th quarter period. Same store sales were down by 3.3% from the same period of the previous year. On the other hand, same store guest count grew by 2.2%, proving that the customer base is being built for the continuous sales growth of next fiscal year and beyond.
Revenue was reduced to 294 billion 710 million yen, down by 2.5% from the same period of the previous year due mainly to lower system-wide sales and franchising.
<Cost of Sales>
Although raw material cost was improved by optimization of discount promotions, company-owned restaurant’s cost of sales went up by 1.9 points due mainly to increased crew investment designed to
3
sustain high-level QSC in the midst of increasing guest counts, and increased utility costs. Franchise Revenue cost improved by 1.0 points due mainly to higher franchise income.
(Breakdown of Cost of Sales)
Millions of yen Year ended
December 31, 2011Year ended
December 31, 2012 Year-on-year change
Amount % Amount % Amount %
Company-owned restaurant’s cost of sales 191,930 84.6% 185,865 86.5% (6,064) 1.9%
(Breakdown) Raw Material 73,649 32.5% 68,121 31.7% (5,528) (0.8)%
Labor 64,945 28.6% 64,881 30.2% (64) 1.6%
Other 53,335 23.5% 52,863 24.6% (471) 1.1%
Franchise Revenue Cost 46,214 61.8% 48,166 60.9% 1,952 (1.0)%
Other Cost of Sales 564 93.1% 561 95.0% (3) 1.9%
Total Cost of Sales 238,709 79.0% 234,593 79.6% (4,115) 0.6%
<Selling, General and Administrative Expenses>
Although marketing investment had increased, other general and administrative expenses were reduced by 1billion701 million yen from the previous year, due mainly to the voluntary restraint of expenditures immediately after last year’s earthquake, as well as optimization of Human Resource Positioning and expense reduction with corporate effort.
(Breakdown of Selling, General and Administrative Expenses) Millions of yen
Year ended December 31, 2011
Year ended December 31, 2012
Year-on-year change
Amount % Amount % Amount %
Selling, General and Administrative Expenses 35,447 11.7% 35,336 12.0% (110) 0.3%
(Breakdown) Advertising and Selling 12,583 4.1% 14,175 4.8% 1,591 0.7%
G&A Expenses 22,863 7.6% 21,161 7.2% (1,701) (0.4)%
< Ordinary Income>
Ordinary income was 23 billion 770 million yen (3 billion 842 million yen decrease from the previous year) due to the above results. In addition, 834 million yen (a total of 1 billion 216 million yen, including the amount recorded in extraordinary loss) for the loss of the 110 restaurants strategic closure was recorded this year.
<Net Income>
Net income was 12 billion 870 million yen (427 million yen decrease from the same period of the previous year) due mainly to decrease in ordinary income by 3 billion 842 million yen from the same period of the previous year and decrease in extraordinary loss by 4 billion 263 million yen related to the application of Asset Retirement Obligation Accounting and the disaster loss and disaster loss provision of the reverse caused by earthquake.
Notes:
Same-store sales are total sales achieved in the fiscal year by McDonald’s restaurants that have been in business for 13 months or longer compared to total sales achieved by such restaurants in the previous year.
System-wide sales are sales of company-owned restaurants and franchised restaurants and are not equal to the total sales reported in the consolidated statement of income.
4
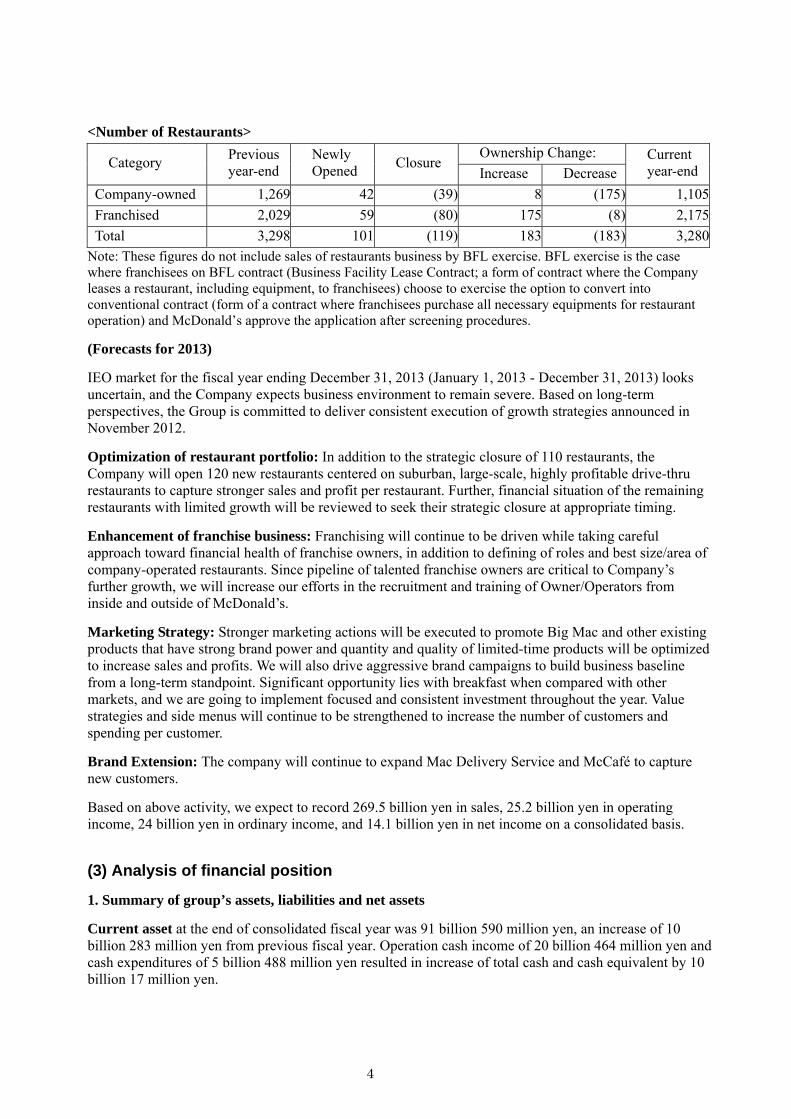
<Number of Restaurants>
Ownership Change: Category
Previous year-end
Newly Opened
Closure Increase Decrease
Current year-end
Company-owned 1,269 42 (39) 8 (175) 1,105
Franchised 2,029 59 (80) 175 (8) 2,175
Total 3,298 101 (119) 183 (183) 3,280
Note: These figures do not include sales of restaurants business by BFL exercise. BFL exercise is the case where franchisees on BFL contract (Business Facility Lease Contract; a form of contract where the Company leases a restaurant, including equipment, to franchisees) choose to exercise the option to convert into conventional contract (form of a contract where franchisees purchase all necessary equipments for restaurant operation) and McDonald’s approve the application after screening procedures.
(Forecasts for 2013)
IEO market for the fiscal year ending December 31, 2013 (January 1, 2013 - December 31, 2013) looks uncertain, and the Company expects business environment to remain severe. Based on long-term perspectives, the Group is committed to deliver consistent execution of growth strategies announced in November 2012.
Optimization of restaurant portfolio: In addition to the strategic closure of 110 restaurants, the Company will open 120 new restaurants centered on suburban, large-scale, highly profitable drive-thru restaurants to capture stronger sales and profit per restaurant. Further, financial situation of the remaining restaurants with limited growth will be reviewed to seek their strategic closure at appropriate timing.
Enhancement of franchise business: Franchising will continue to be driven while taking careful approach toward financial health of franchise owners, in addition to defining of roles and best size/area of company-operated restaurants. Since pipeline of talented franchise owners are critical to Company’s further growth, we will increase our efforts in the recruitment and training of Owner/Operators from inside and outside of McDonald’s.
Marketing Strategy: Stronger marketing actions will be executed to promote Big Mac and other existing products that have strong brand power and quantity and quality of limited-time products will be optimized to increase sales and profits. We will also drive aggressive brand campaigns to build business baseline from a long-term standpoint. Significant opportunity lies with breakfast when compared with other markets, and we are going to implement focused and consistent investment throughout the year. Value strategies and side menus will continue to be strengthened to increase the number of customers and spending per customer.
Brand Extension: The company will continue to expand Mac Delivery Service and McCafé to capture new customers.
Based on above activity, we expect to record 269.5 billion yen in sales, 25.2 billion yen in operating income, 24 billion yen in ordinary income, and 14.1 billion yen in net income on a consolidated basis.
(3) Analysis of financial position
1. Summary of group’s assets, liabilities and net assets
Current asset at the end of consolidated fiscal year was 91 billion 590 million yen, an increase of 10 billion 283 million yen from previous fiscal year. Operation cash income of 20 billion 464 million yen and cash expenditures of 5 billion 488 million yen resulted in increase of total cash and cash equivalent by 10 billion 17 million yen.
5
Noncurrent asset was 134 billion 747 million yen and decreased by 5 billion 974 million yen from previous fiscal year. Decrease in software depreciation of 3 billion 156 million yen and reduction of lease and guarantee deposit by 2 billion 692 million yen due to payback are main reasons for the above.
Current liabilities were 43 billion 946 million yen and decreased by 5 billion 117 million yen from previous fiscal year. Decrease in both accrued income tax by 2 billion 154 million yen and accrued bonuses by 1 billion 154 million yen is the main reason for the above.
Noncurrent liabilities were 11 billion 653 million yen and decreased by 475 million yen from previous fiscal year.
2. Cash Flow Summary
Cash flow in the following categories at the end of consolidated fiscal year is as follows. Cash and cash equivalent (‘funds’) at the end of consolidated fiscal year was 72 billion 148 million yen and increased by 10 billion 17 million yen from previous fiscal year.
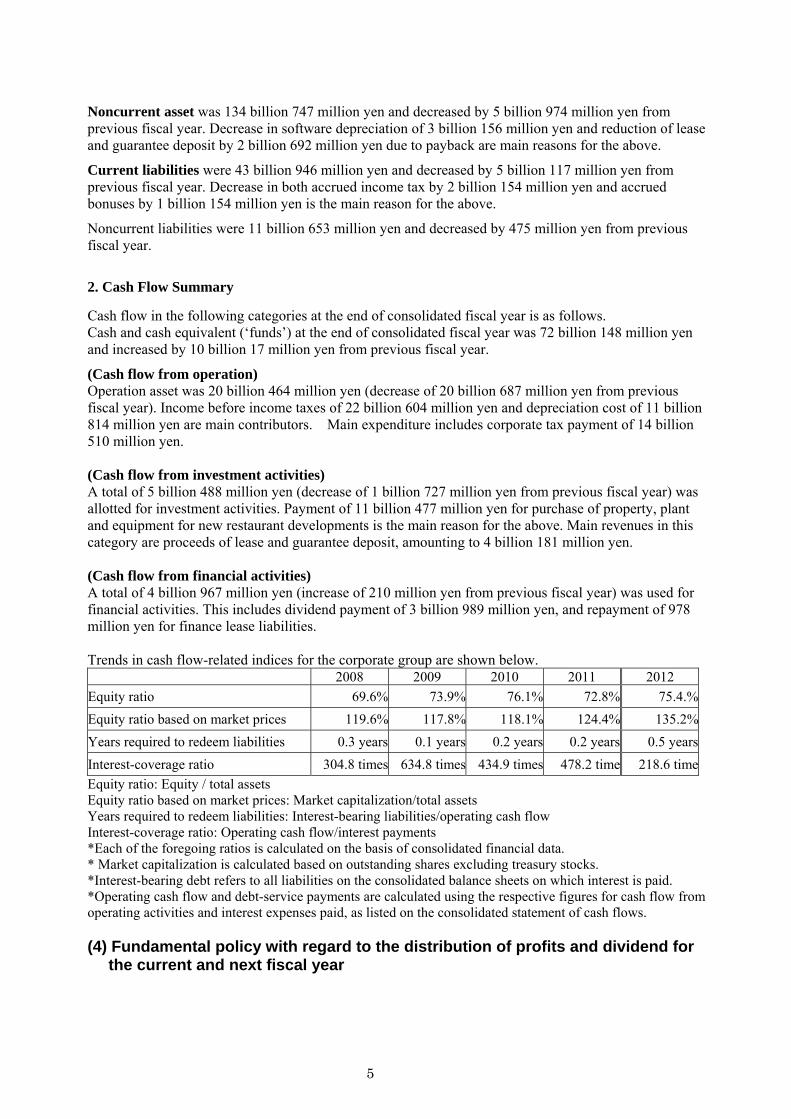
(Cash flow from operation) Operation asset was 20 billion 464 million yen (decrease of 20 billion 687 million yen from previous fiscal year). Income before income taxes of 22 billion 604 million yen and depreciation cost of 11 billion 814 million yen are main contributors. Main expenditure includes corporate tax payment of 14 billion 510 million yen. (Cash flow from investment activities) A total of 5 billion 488 million yen (decrease of 1 billion 727 million yen from previous fiscal year) was allotted for investment activities. Payment of 11 billion 477 million yen for purchase of property, plant and equipment for new restaurant developments is the main reason for the above. Main revenues in this category are proceeds of lease and guarantee deposit, amounting to 4 billion 181 million yen. (Cash flow from financial activities) A total of 4 billion 967 million yen (increase of 210 million yen from previous fiscal year) was used for financial activities. This includes dividend payment of 3 billion 989 million yen, and repayment of 978 million yen for finance lease liabilities. Trends in cash flow-related indices for the corporate group are shown below. 2008 2009 2010 2011 2012
Equity ratio 69.6% 73.9% 76.1% 72.8% 75.4.%
Equity ratio based on market prices 119.6% 117.8% 118.1% 124.4% 135.2%
Years required to redeem liabilities 0.3 years 0.1 years 0.2 years 0.2 years 0.5 years
Interest-coverage ratio 304.8 times 634.8 times 434.9 times 478.2 time 218.6 time
Equity ratio: Equity / total assets Equity ratio based on market prices: Market capitalization/total assets Years required to redeem liabilities: Interest-bearing liabilities/operating cash flow Interest-coverage ratio: Operating cash flow/interest payments *Each of the foregoing ratios is calculated on the basis of consolidated financial data. * Market capitalization is calculated based on outstanding shares excluding treasury stocks. *Interest-bearing debt refers to all liabilities on the consolidated balance sheets on which interest is paid. *Operating cash flow and debt-service payments are calculated using the respective figures for cash flow from operating activities and interest expenses paid, as listed on the consolidated statement of cash flows. (4) Fundamental policy with regard to the distribution of profits and dividend for
the current and next fiscal year
6
Taking into consideration the overall balance between business results, dividend payout ratios, and cash flows, the Company strives to return profits based on the continuous payment of a stable dividend, while maintaining financial indicators like capital ratio and return on equity at appropriate levels.
The Company’s basic policy is to make annual dividend once in the year end from retained earnings its decision making is made at annual shareholders’ meeting.
For the current and next fiscal year, the Company is planning to make a dividend of 30 yen per share (same amount as in last year) based on the above policy.
(5) Operational and other risks
The Company’s operating results and financial position are subject to the following risks.
References in this document relating to the remainder of this fiscal year are the estimates made on December 31, 2012.
(Restaurants’ reliance on rented property)
The Company’s headquarters, offices and more than 95% of its restaurants are leased properties. The lease term can be extended upon agreement between the Company and the lessor. Contracts may be terminated prematurely due to the lessor’s circumstances, making the closure of some restaurants unavoidable even where they are profitable.
The Company pays a deposit to the lessor of which the security deposit (shikikin) is returned in full at the end of the contract, and the security money (hoshoukin) [“cooperative construction deposit” (kensetsukyouryokukin)] is returned as separate sums over several years up to a maximum 20 years. The current balance of security deposit and security money is 52,118 million yen. There is a risk that the whole or part of this may become uncollectible due to bankruptcy or other problems of the lessor.
(Fluctuations in the price of ingredients)
The cost of the ingredients of McDonald’s Japan’s products, such as beef and potatoes, is subject to international commodity market conditions. Such fluctuations could affect the Group’s operating results.
(Currency risk)
Since most of the ingredients in food served at McDonald’s Japan are imported, foreign exchange rates affect their costs. McDonald’s Japan makes every effort to avoid currency risk by having favorable exchange contracts with import agencies. However, there is no guarantee that we will be able to execute the optimum deal at all times. We may see the cost of sales rise, should the yen fall sharply beyond the scope of the contracts' coverage. This could affect the Group’s operating results.
(Risks associated with weather and natural disasters)
In case an area heavily concentrated with our restaurants is struck by natural disasters (storm, earthquake), the affected restaurants may need to close temporarily or shorten its operation hours due to structural damage, impact to social infrastructure, logistics halt, or evacuation order. Further, possible long-term impact from natural disaster may discourage consumers to spend money, and this may cause serious impact to financial condition and performance of the group.
(Legal regulations)
McDonald’s Japan’s directly operated and franchise restaurants are licensed by the authorities to operate in restaurant, pastry production and dairy product sales businesses and must comply with the provisions of the food hygiene law. It is also bound by many kinds of conservation ordinances designed to protect the environment, such as the Containers and Packaging Recycling Law. Should these restrictions be strengthened, our costs would increase, which in turn could affect the Group’s operating results.
(Food safety control of the Company)
7
McDonald’s Japan recognizes the importance of food safety in the restaurant industry. In going beyond the statutory food hygiene requirements, it carries out periodic independent inspections based on the HACCP technique(Hazard Analysis Critical Control Point: see note below. The appointment of Food Hygiene Inspectors, extermination of insect pests, strict enforcement of hand washing and the cleanliness of uniforms for employees, periodic maintenance of restaurant equipment, development of food management manual, employees’ training, among others, enable us to provide safe products for our customers. We are planning to implement measures, which would, if any mishap should occur, provide prompt medical support and contain damage. We have also taken out indemnity insurance for such a possibility.
However, it is in the nature of the food and drink business that there is always the possibility of food poisoning or other health problems and these are the risk elements that could affect the Group’s operating results.
(Note) A hygiene management procedures developed by NASA to produce space food.
(General food safety crisis)
The company’s business may be affected by general hygiene problems such as BSE and avian influenza and other hygiene rumors in society. In such a case, the Group’s sales will decline and additional investment will be required for improving safety procedures and upgrading facilities as well as running safety campaigns.
(Competition)
McDonald’s Japan is competing not only with other burger-based fast food chains, but also with convenience stores and so-called “nakashoku” (takeaway) businesses. McDonald’s Japan defines itself as a player in the IEO (Informal Eating Out) market; that is the market comprising of restaurant businesses excluding pubs, bars and canteens. We analyze our business within the framework of this market. Any intensification of competition within the IEO market could affect the Group’s operating results.
(Personal data protection)
The company manages customers’ personal data in strict accordance with the Personal Data Protection Law. If there is any leak, it would cause great damage to our customers and would put our credibility at risk.
(6) Important matters for assumption of going concern
Not applicable.
8
2. Management policy
(1) Fundamental management policy
Since its foundation, McDonald’s Group has always lived up to its fundamental management policy of being our customer’s “favorite place and style to eat”, which stands on the concept of “QSC & V”. “QSC & V” represents 4 values provided to its customers, and the Company will continue to pursue the enhancement of corporate value and service to its stakeholders by providing the best “QSC & V” to our customers. Q = Quality (Products with the best taste and quality) S = Service (Speedy and pleasant service) C = Cleanliness (Clean and comfortable environment) V = Value (Maximum satisfaction of the customers)
(2) Performance indicators and targets
The Group recognizes sustainable profitability growth as the most critical business priority, and uses ROTA* and ordinary income ratio as major performance indicators. * ROTA(Return on Total Assets): Ordinary income ÷(Total asset -Cash & deposit)
(3) Medium-term management strategy
The Group will focus its management resources to the following 4 areas to ensure building of long-term and highly profitable business baseline and capture opportunities for further growth:
1. Stronger focus on marketing
Analysis on past sales structure identified two different types of merchandising; one that appropriately and continually enhance product and brand value with profit, and the other that brings only temporary sales and profit with no continuation. Following this consolidated fiscal year, we will continue to restrain actions that bring temporary sales and profit and shift our investment to priority actions of ‘Value’, ‘Menu’, ‘Breakfast’, and ‘Convenience’ to build ongoing and healthy sales (= business baseline) .
■Value
In addition to the 100yen Mac, we will drive ‘McLunch’ that contributes to weekdays lunch hour sales for the enhancement of customer value and overall value image.
■Menu
The Company will enhance investment on McDonald’s Global core menus, especially those that have significant opportunities such as Big Mac, French Fries, and Chicken McNuggets. Number of limited-time products will be optimized and balanced with guest count increase programs for higher sales and profits. Actions such as aggressive brand campaign and store-front promotions will be implemented to build business baseline.
■Breakfast
Breakfast with significant opportunity is targeted as strategic investment, and therefore the Company is going to execute focused and consistent investments throughout the year.
■Convenience
Marketing actions will be implemented to enhance drive-thru speed, a large opportunity in Convenience. The following Brand Extension will be enhanced as well.
9
2. Brand Extension
In addition to the ongoing business structure re-engineering actions, the Company is going to execute full-scale deployment of ‘McDelivery Service (‘MDS’)’ and ‘McCafé by Barista’ as part of McDonald’s Brand Extension. MDS is piloted at various stores from 2010 and delivering strong results; from 2013 we are going to expand this service especially in the metro areas, then deploy nationwide. McCafé by Barista pilot stores are also enjoying success, and we are planning for nationwide deployment especially at suburb drive-thru restaurants.
3. Optimization of restaurant portfolio
Our restaurant portfolio re-engineering efforts, including development of new restaurants centered on Gold Standard drive-thru (large-scale drive-thru), strategic closure, strategic relocation, are delivering steady and positive results. Increase in the McDonald’s restaurant visit share despite contraction of overall IEO market proves that our restaurant portfolio re-engineering has been successful. Based on this, the Company will further optimize restaurant portfolio through the following 3 guidelines:
■Stronger focus on opening of Gold Standard drive-thru restaurants
It is clear that Gold Standard drive-thru restaurant delivers higher sales and profit than other store type designs. Stronger focus on opening of this restaurant should significantly increase sales/profitability and create a solid baseline.
■Stronger focus on strategic closure
Total of 110 restaurants are listed for strategic closure in 2013, in addition to the general closing of restaurants. Still, a considerable number of restaurants are limited in sales and menus and/or with no future growth. The Company therefore will not stop with the 110 closures in 2013, but carefully consider shareholder’s value, market share, and relationship with land owners to facilitate ongoing, strategic restaurant relocation and closures.
■acquisition of high-quality properties
Opportunity exists in the ownership of high-quality real estate and building or building only (on leased land) for the enhancement of restaurant margins. Ownership of both real estate and building will improve margins by approximately 6% or 1% for building only. As you can see, opportunity of acquiring high-quality properties cannot be ignored.
4. Stronger focus on franchise business
The Company has been aggressively driving franchising to enhance management efficiency and maximize investments of entire restaurants, and we are going to accelerate our pace to reach the target of 70% franchised restaurants by 2013-end. Further, we will clarify roles of company-operated restaurants to determine the optimum ratio for stronger business baseline and facilitate franchising to meet that level.
(4) Company challenges
As a food company, securing of ‘food safety’ is a top priority for the Group, and we are focusing on precise operation of food management system in order to provide safe meal for our customers. Proactive engagement in social contribution activities is an important aspect for the Group, in addition to expanding its business. The Group is committed to deepen its involvement in this area to enhance our sustaining society.
10
3. Consolidated financial statements
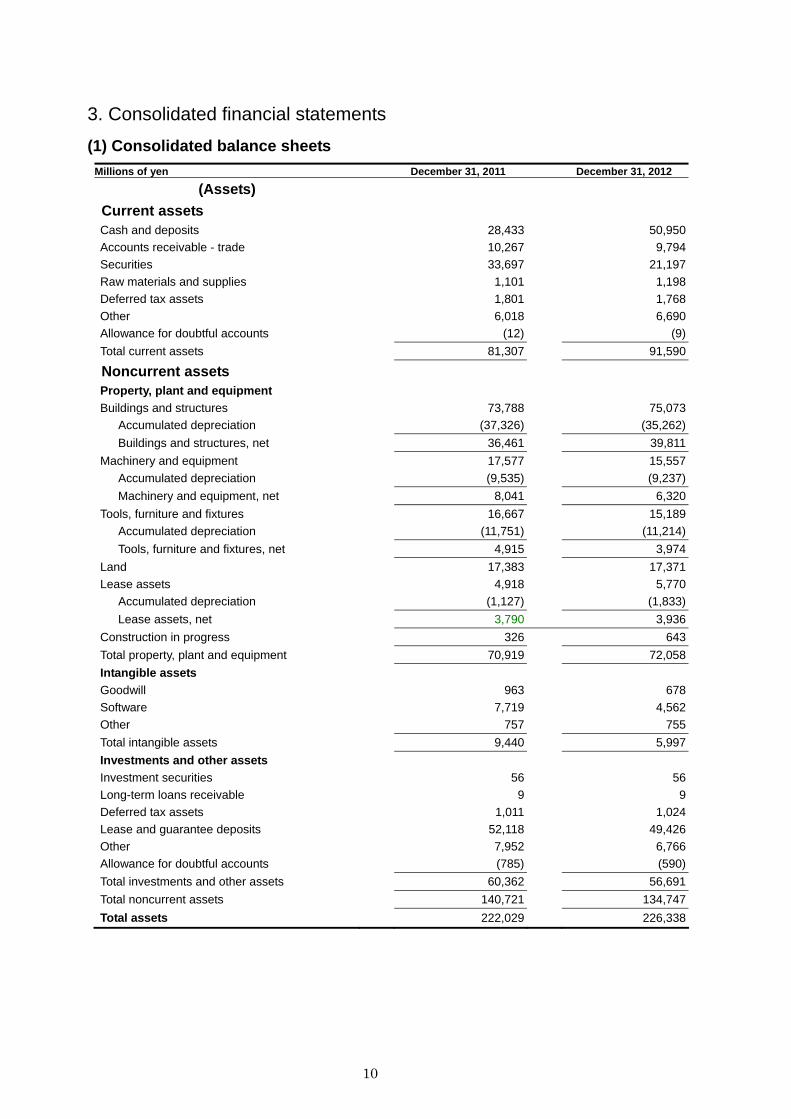
(1) Consolidated balance sheets
Millions of yen December 31, 2011 December 31, 2012
(Assets)
Current assets Cash and deposits 28,433 50,950
Accounts receivable - trade 10,267 9,794
Securities 33,697 21,197
Raw materials and supplies 1,101 1,198
Deferred tax assets 1,801 1,768
Other 6,018 6,690
Allowance for doubtful accounts (12) (9)
Total current assets 81,307 91,590
Noncurrent assets
Property, plant and equipment
Buildings and structures 73,788 75,073
Accumulated depreciation (37,326) (35,262)
Buildings and structures, net 36,461 39,811
Machinery and equipment 17,577 15,557
Accumulated depreciation (9,535) (9,237)
Machinery and equipment, net 8,041 6,320
Tools, furniture and fixtures 16,667 15,189
Accumulated depreciation (11,751) (11,214)
Tools, furniture and fixtures, net 4,915 3,974
Land 17,383 17,371
Lease assets 4,918 5,770
Accumulated depreciation (1,127) (1,833)
Lease assets, net 3,790 3,936
Construction in progress 326 643
Total property, plant and equipment 70,919 72,058
Intangible assets
Goodwill 963 678
Software 7,719 4,562
Other 757 755
Total intangible assets 9,440 5,997
Investments and other assets
Investment securities 56 56
Long-term loans receivable 9 9
Deferred tax assets 1,011 1,024
Lease and guarantee deposits 52,118 49,426
Other 7,952 6,766
Allowance for doubtful accounts (785) (590)
Total investments and other assets 60,362 56,691
Total noncurrent assets 140,721 134,747
Total assets 222,029 226,338
11
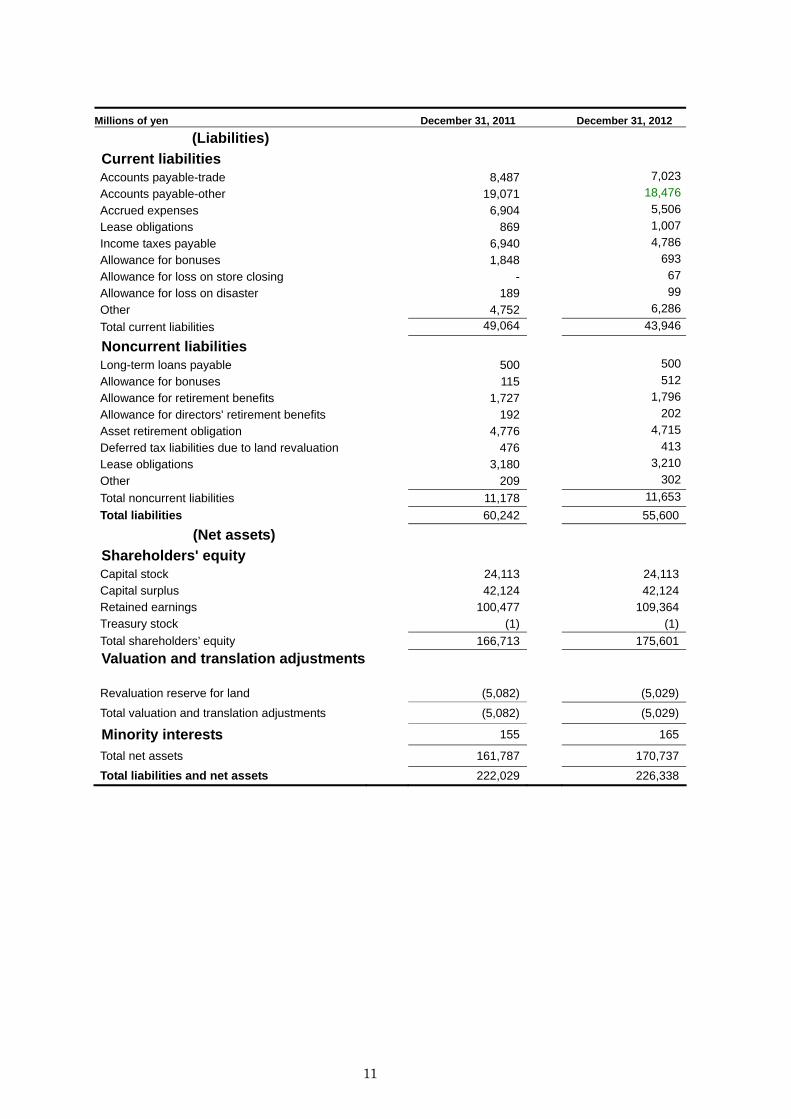
Millions of yen December 31, 2011 December 31, 2012
(Liabilities)
Current liabilities
Accounts payable-trade 8,487 7,023
Accounts payable-other 19,071 18,476
Accrued expenses 6,904 5,506
Lease obligations 869 1,007
Income taxes payable 6,940 4,786
Allowance for bonuses 1,848 693
Allowance for loss on store closing - 67
Allowance for loss on disaster 189 99
Other 4,752 6,286
Total current liabilities 49,064 43,946
Noncurrent liabilities
Long-term loans payable 500 500
Allowance for bonuses 115 512
Allowance for retirement benefits 1,727 1,796
Allowance for directors' retirement benefits 192 202
Asset retirement obligation 4,776 4,715
Deferred tax liabilities due to land revaluation 476 413
Lease obligations 3,180 3,210
Other 209 302
Total noncurrent liabilities 11,178 11,653
Total liabilities 60,242 55,600
(Net assets)
Shareholders' equity
Capital stock 24,113 24,113Capital surplus 42,124 42,124Retained earnings 100,477 109,364Treasury stock (1) (1)
Total shareholders’ equity 166,713 175,601
Valuation and translation adjustments
Revaluation reserve for land (5,082) (5,029)
Total valuation and translation adjustments (5,082) (5,029)
Minority interests 155 165
Total net assets 161,787 170,737
Total liabilities and net assets 222,029 226,338
12
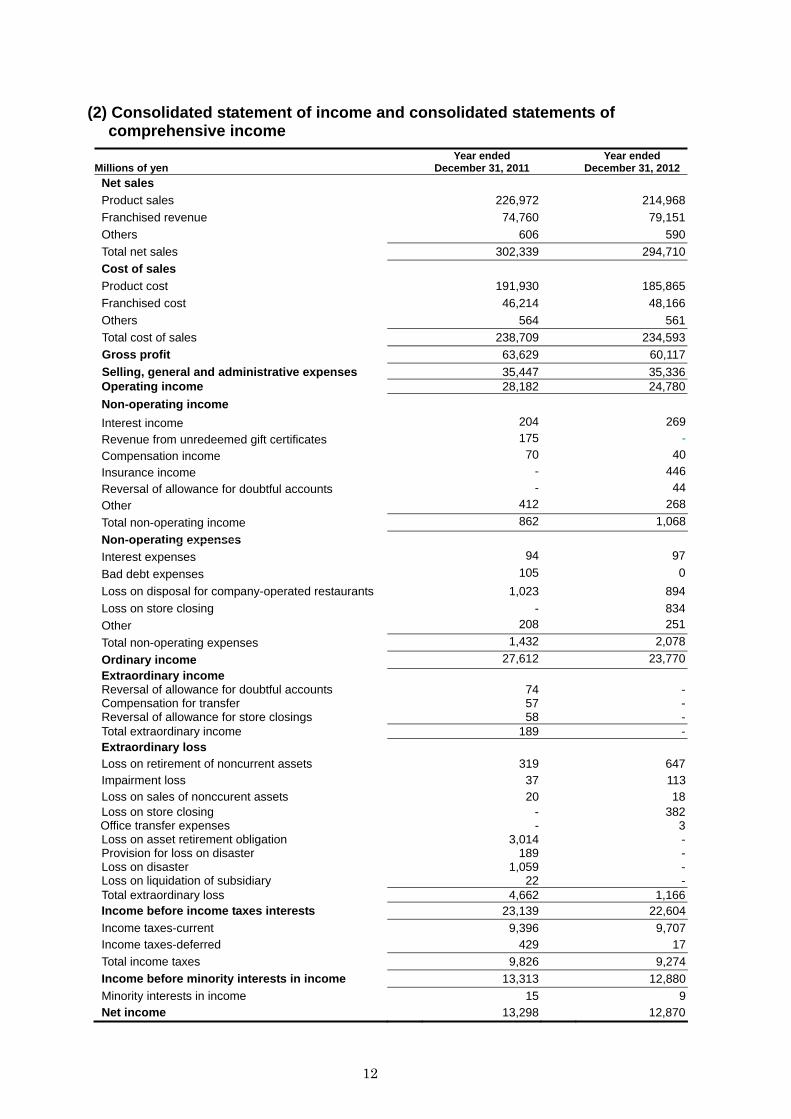
(2) Consolidated statement of income and consolidated statements of comprehensive income
Millions of yen Year ended
December 31, 2011 Year ended
December 31, 2012
Net sales
Product sales 226,972 214,968
Franchised revenue 74,760 79,151
Others 606 590
Total net sales 302,339 294,710
Cost of sales
Product cost 191,930 185,865
Franchised cost 46,214 48,166
Others 564 561
Total cost of sales 238,709 234,593
Gross profit 63,629 60,117
Selling, general and administrative expenses 35,447 35,336Operating income 28,182 24,780
Non-operating income
Interest income 204 269
Revenue from unredeemed gift certificates 175 -
Compensation income 70 40
Insurance income - 446
Reversal of allowance for doubtful accounts - 44
Other 412 268
Total non-operating income 862 1,068
Non-operating expenses
Interest expenses 94 97
Bad debt expenses 105 0
Loss on disposal for company-operated restaurants 1,023 894
Loss on store closing - 834
Other 208 251
Total non-operating expenses 1,432 2,078
Ordinary income 27,612 23,770
Extraordinary income Reversal of allowance for doubtful accounts 74 -Compensation for transfer 57 -Reversal of allowance for store closings 58 -Total extraordinary income 189 -Extraordinary loss Loss on retirement of noncurrent assets 319 647Impairment loss 37 113Loss on sales of nonccurent assets 20 18Loss on store closing - 382
Office transfer expenses - 3Loss on asset retirement obligation 3,014 -Provision for loss on disaster 189 -Loss on disaster 1,059 -Loss on liquidation of subsidiary 22 -Total extraordinary loss 4,662 1,166Income before income taxes interests 23,139 22,604
Income taxes-current 9,396 9,707Income taxes-deferred 429 17
Total income taxes 9,826 9,274
Income before minority interests in income 13,313 12,880
Minority interests in income 15 9Net income 13,298 12,870
13
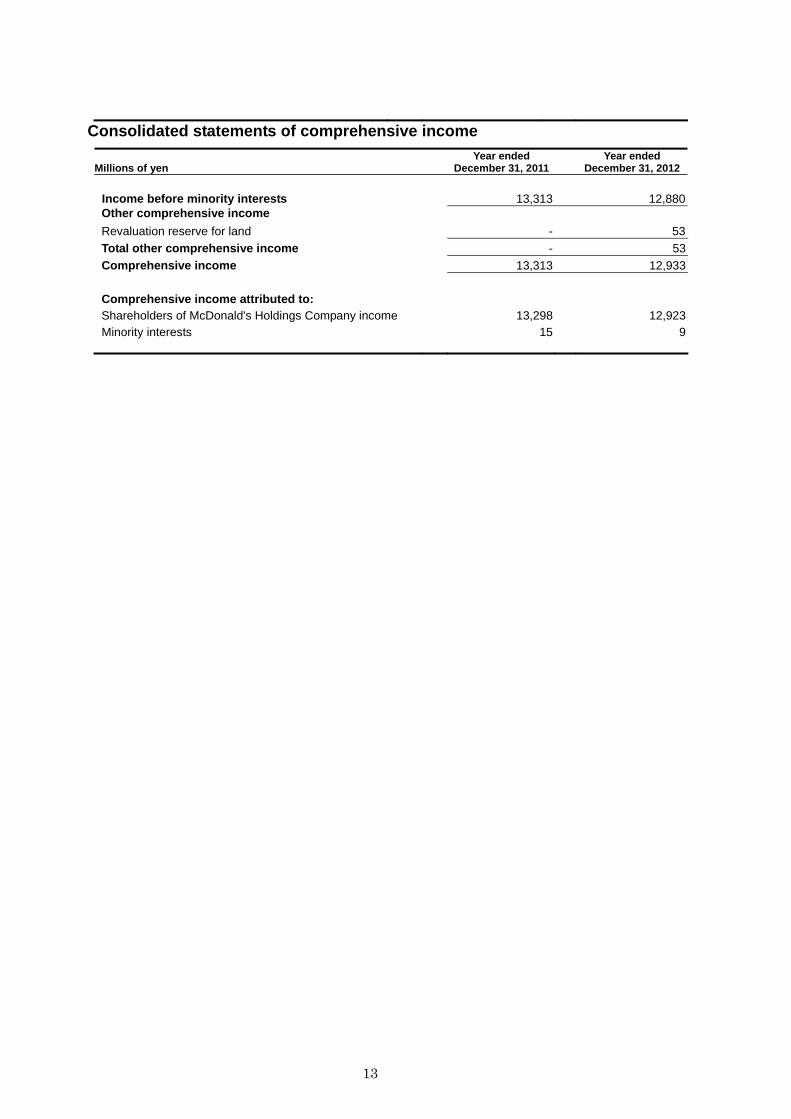
Consolidated statements of comprehensive income
Millions of yen Year ended
December 31, 2011 Year ended
December 31, 2012
Income before minority interests 13,313 12,880Other comprehensive income
Revaluation reserve for land - 53
Total other comprehensive income - 53
Comprehensive income 13,313 12,933
Comprehensive income attributed to: Shareholders of McDonald's Holdings Company income 13,298 12,923Minority interests 15 9
14
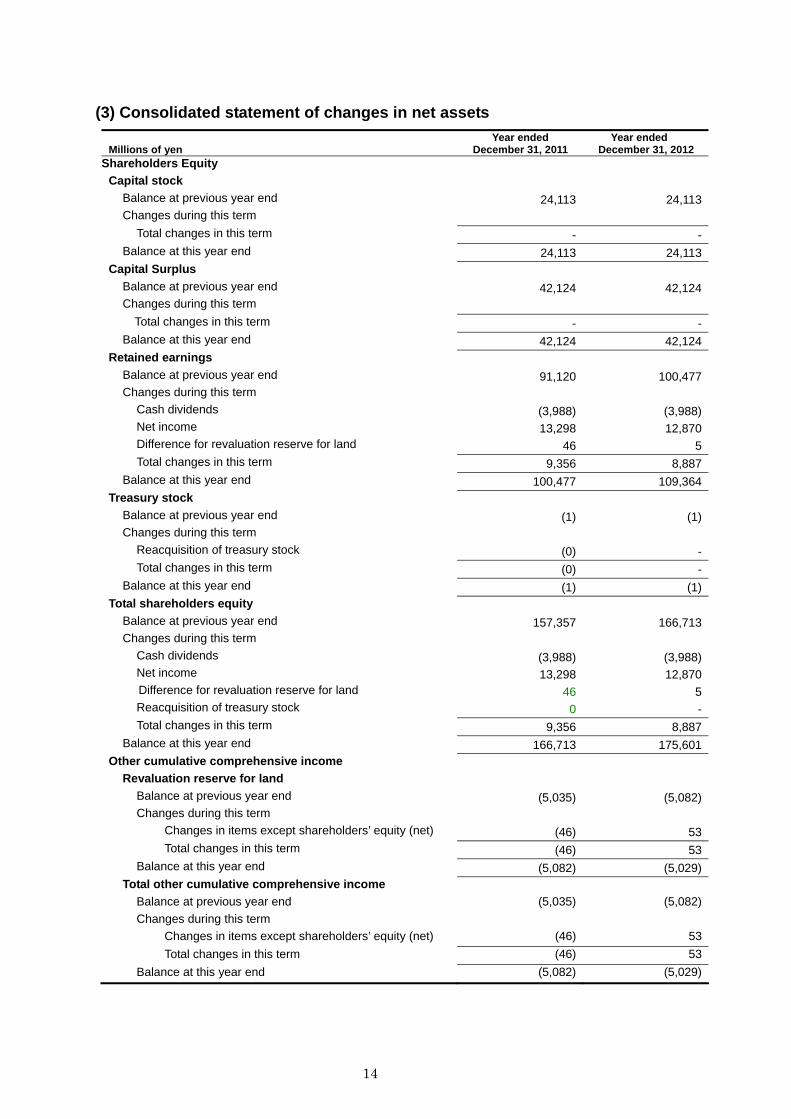
(3) Consolidated statement of changes in net assets
Millions of yen
Year ended December 31, 2011
Year ended December 31, 2012
Shareholders Equity Capital stock
Balance at previous year end 24,113 24,113Changes during this term
Total changes in this term - -Balance at this year end 24,113 24,113
Capital Surplus Balance at previous year end 42,124 42,124Changes during this term
Total changes in this term - -Balance at this year end 42,124 42,124
Retained earnings Balance at previous year end 91,120 100,477Changes during this term
Cash dividends (3,988) (3,988)Net income 13,298 12,870Difference for revaluation reserve for land 46 5Total changes in this term 9,356 8,887
Balance at this year end 100,477 109,364Treasury stock
Balance at previous year end (1) (1)Changes during this term
Reacquisition of treasury stock (0) -Total changes in this term (0) -
Balance at this year end (1) (1)Total shareholders equity
Balance at previous year end 157,357 166,713Changes during this term
Cash dividends (3,988) (3,988)Net income 13,298 12,870Difference for revaluation reserve for land 46 5Reacquisition of treasury stock 0 -Total changes in this term 9,356 8,887
Balance at this year end 166,713 175,601Other cumulative comprehensive income
Revaluation reserve for land Balance at previous year end (5,035) (5,082)Changes during this term
Changes in items except shareholders’ equity (net) (46) 53Total changes in this term (46) 53
Balance at this year end (5,082) (5,029)Total other cumulative comprehensive income
Balance at previous year end (5,035) (5,082)
Changes during this term
Changes in items except shareholders’ equity (net) (46) 53
Total changes in this term (46) 53
Balance at this year end (5,082) (5,029)
15
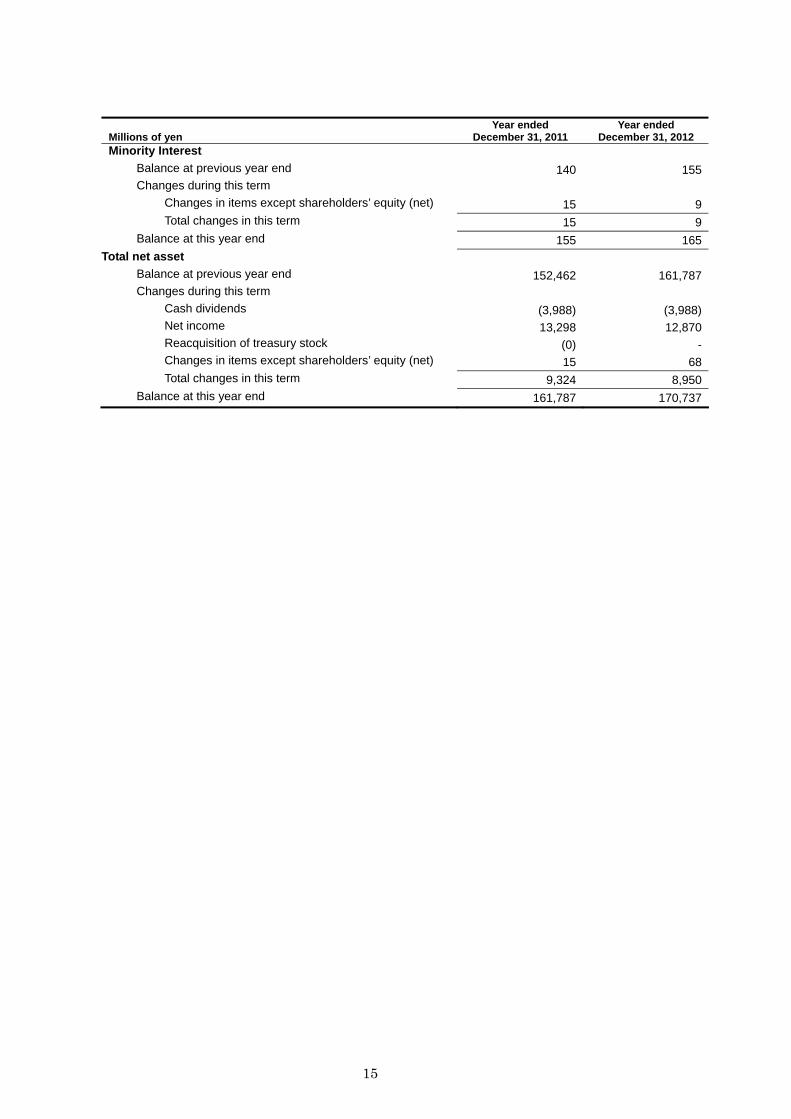
Millions of yen Year ended
December 31, 2011 Year ended
December 31, 2012 Minority Interest
Balance at previous year end 140 155Changes during this term
Changes in items except shareholders’ equity (net) 15 9Total changes in this term 15 9
Balance at this year end 155 165Total net asset
Balance at previous year end 152,462 161,787Changes during this term
Cash dividends (3,988) (3,988)Net income 13,298 12,870Reacquisition of treasury stock (0) -Changes in items except shareholders’ equity (net) 15 68Total changes in this term 9,324 8,950
Balance at this year end 161,787 170,737
16
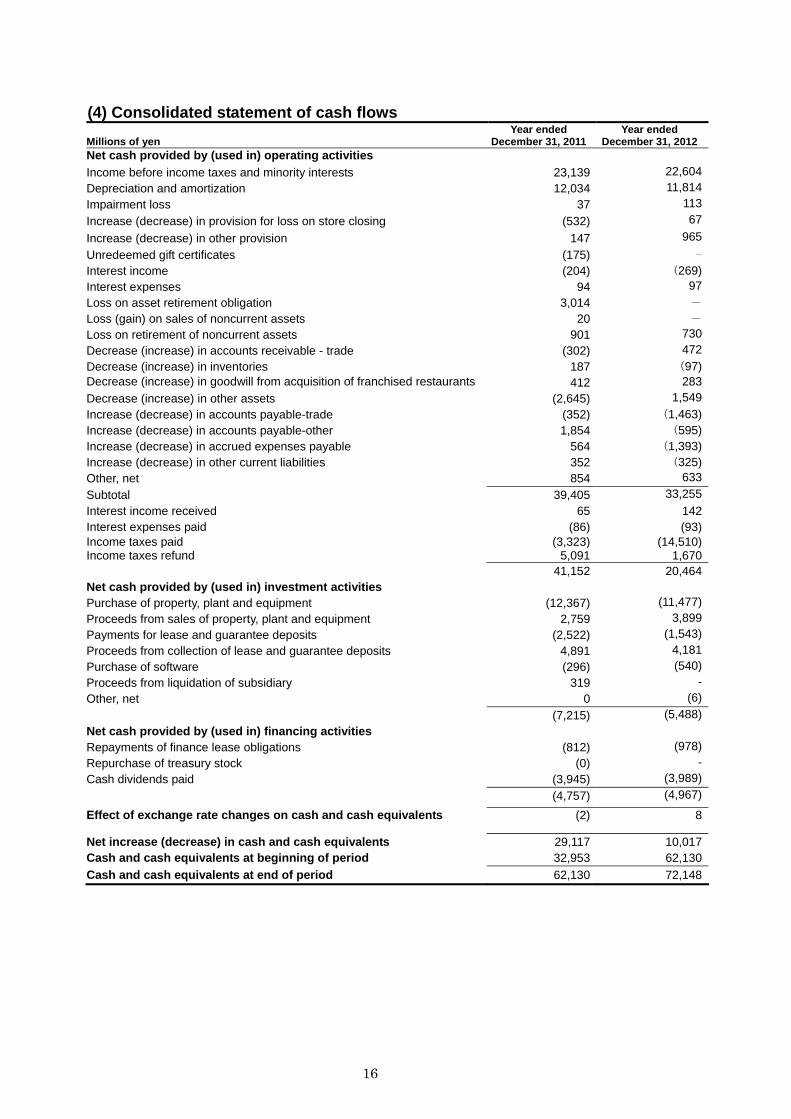
(4) Consolidated statement of cash flows
Millions of yen Year ended
December 31, 2011 Year ended
December 31, 2012Net cash provided by (used in) operating activities
Income before income taxes and minority interests 23,139 22,604
Depreciation and amortization 12,034 11,814
Impairment loss 37 113
Increase (decrease) in provision for loss on store closing (532) 67
Increase (decrease) in other provision 147 965
Unredeemed gift certificates (175) -
Interest income (204) (269)Interest expenses 94 97
Loss on asset retirement obligation 3,014 -
Loss (gain) on sales of noncurrent assets 20 -
Loss on retirement of noncurrent assets 901 730
Decrease (increase) in accounts receivable - trade (302) 472
Decrease (increase) in inventories 187 (97)Decrease (increase) in goodwill from acquisition of franchised restaurants 412 283
Decrease (increase) in other assets (2,645) 1,549
Increase (decrease) in accounts payable-trade (352) (1,463)Increase (decrease) in accounts payable-other 1,854 (595)Increase (decrease) in accrued expenses payable 564 (1,393)Increase (decrease) in other current liabilities 352 (325)Other, net 854 633
Subtotal 39,405 33,255
Interest income received 65 142Interest expenses paid (86) (93)Income taxes paid (3,323) (14,510)Income taxes refund 5,091 1,670 41,152 20,464Net cash provided by (used in) investment activities Purchase of property, plant and equipment (12,367) (11,477)
Proceeds from sales of property, plant and equipment 2,759 3,899
Payments for lease and guarantee deposits (2,522) (1,543)
Proceeds from collection of lease and guarantee deposits 4,891 4,181
Purchase of software (296) (540)
Proceeds from liquidation of subsidiary 319 -
Other, net 0 (6)
(7,215) (5,488)
Net cash provided by (used in) financing activities Repayments of finance lease obligations (812) (978)
Repurchase of treasury stock (0) -
Cash dividends paid (3,945) (3,989)
(4,757) (4,967)
Effect of exchange rate changes on cash and cash equivalents (2) 8
Net increase (decrease) in cash and cash equivalents 29,117 10,017Cash and cash equivalents at beginning of period 32,953 62,130
Cash and cash equivalents at end of period 62,130 72,148
17
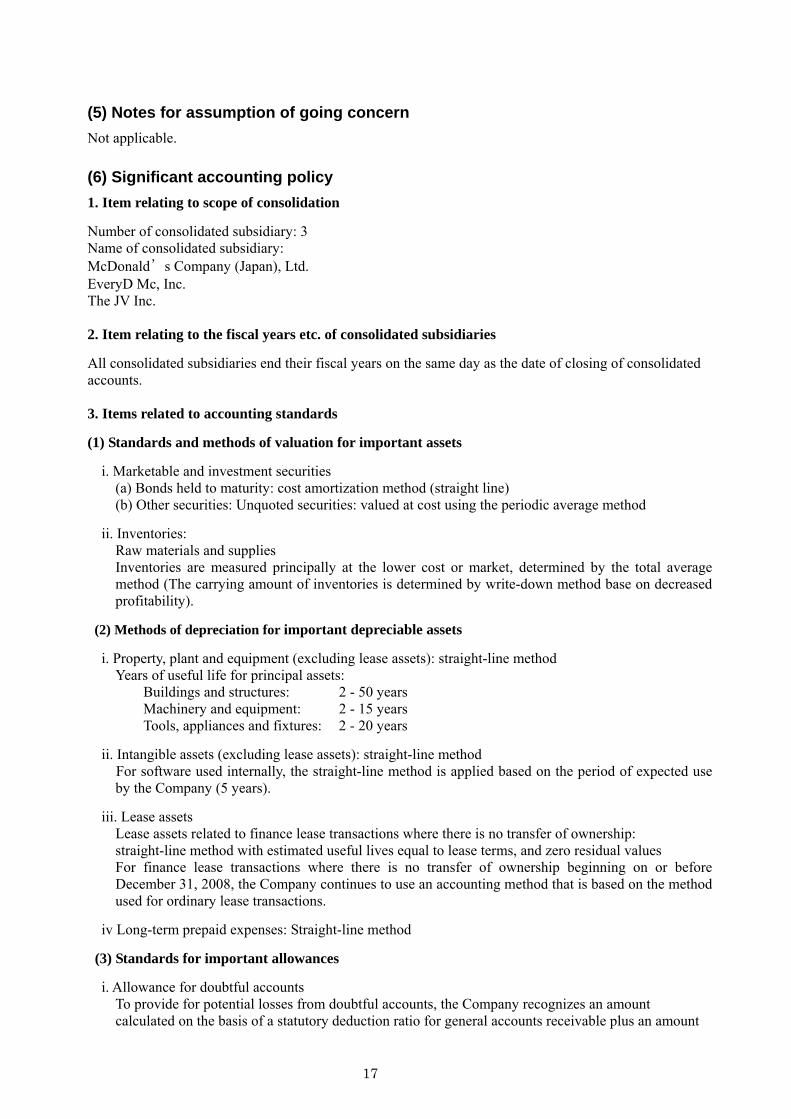
(5) Notes for assumption of going concern
Not applicable.
(6) Significant accounting policy
1. Item relating to scope of consolidation
Number of consolidated subsidiary: 3 Name of consolidated subsidiary: McDonald’s Company (Japan), Ltd. EveryD Mc, Inc. The JV Inc. 2. Item relating to the fiscal years etc. of consolidated subsidiaries
All consolidated subsidiaries end their fiscal years on the same day as the date of closing of consolidated accounts. 3. Items related to accounting standards
(1) Standards and methods of valuation for important assets
i. Marketable and investment securities (a) Bonds held to maturity: cost amortization method (straight line) (b) Other securities: Unquoted securities: valued at cost using the periodic average method
ii. Inventories: Raw materials and supplies Inventories are measured principally at the lower cost or market, determined by the total average method (The carrying amount of inventories is determined by write-down method base on decreased profitability).
(2) Methods of depreciation for important depreciable assets
i. Property, plant and equipment (excluding lease assets): straight-line method Years of useful life for principal assets:
Buildings and structures: 2 - 50 years Machinery and equipment: 2 - 15 years Tools, appliances and fixtures: 2 - 20 years
ii. Intangible assets (excluding lease assets): straight-line method For software used internally, the straight-line method is applied based on the period of expected use by the Company (5 years).
iii. Lease assets Lease assets related to finance lease transactions where there is no transfer of ownership: straight-line method with estimated useful lives equal to lease terms, and zero residual values For finance lease transactions where there is no transfer of ownership beginning on or before December 31, 2008, the Company continues to use an accounting method that is based on the method used for ordinary lease transactions.
iv Long-term prepaid expenses: Straight-line method
(3) Standards for important allowances
i. Allowance for doubtful accounts To provide for potential losses from doubtful accounts, the Company recognizes an amount calculated on the basis of a statutory deduction ratio for general accounts receivable plus an amount
18
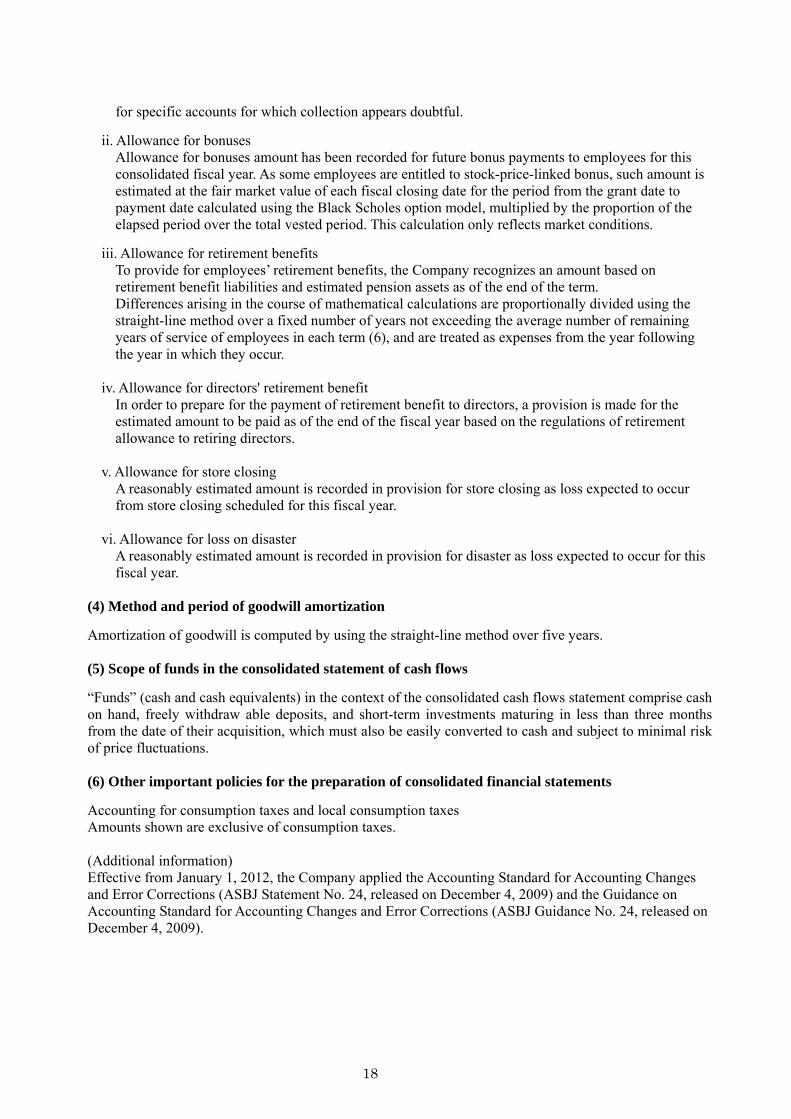
for specific accounts for which collection appears doubtful.
ii. Allowance for bonuses Allowance for bonuses amount has been recorded for future bonus payments to employees for this consolidated fiscal year. As some employees are entitled to stock-price-linked bonus, such amount is estimated at the fair market value of each fiscal closing date for the period from the grant date to payment date calculated using the Black Scholes option model, multiplied by the proportion of the elapsed period over the total vested period. This calculation only reflects market conditions.
iii. Allowance for retirement benefits To provide for employees’ retirement benefits, the Company recognizes an amount based on retirement benefit liabilities and estimated pension assets as of the end of the term. Differences arising in the course of mathematical calculations are proportionally divided using the straight-line method over a fixed number of years not exceeding the average number of remaining years of service of employees in each term (6), and are treated as expenses from the year following the year in which they occur.
iv. Allowance for directors' retirement benefit
In order to prepare for the payment of retirement benefit to directors, a provision is made for the estimated amount to be paid as of the end of the fiscal year based on the regulations of retirement allowance to retiring directors.
v. Allowance for store closing
A reasonably estimated amount is recorded in provision for store closing as loss expected to occur from store closing scheduled for this fiscal year.
vi. Allowance for loss on disaster
A reasonably estimated amount is recorded in provision for disaster as loss expected to occur for this fiscal year.
(4) Method and period of goodwill amortization
Amortization of goodwill is computed by using the straight-line method over five years. (5) Scope of funds in the consolidated statement of cash flows
“Funds” (cash and cash equivalents) in the context of the consolidated cash flows statement comprise cash on hand, freely withdraw able deposits, and short-term investments maturing in less than three months from the date of their acquisition, which must also be easily converted to cash and subject to minimal risk of price fluctuations. (6) Other important policies for the preparation of consolidated financial statements
Accounting for consumption taxes and local consumption taxes Amounts shown are exclusive of consumption taxes. (Additional information) Effective from January 1, 2012, the Company applied the Accounting Standard for Accounting Changes and Error Corrections (ASBJ Statement No. 24, released on December 4, 2009) and the Guidance on Accounting Standard for Accounting Changes and Error Corrections (ASBJ Guidance No. 24, released on December 4, 2009).
19
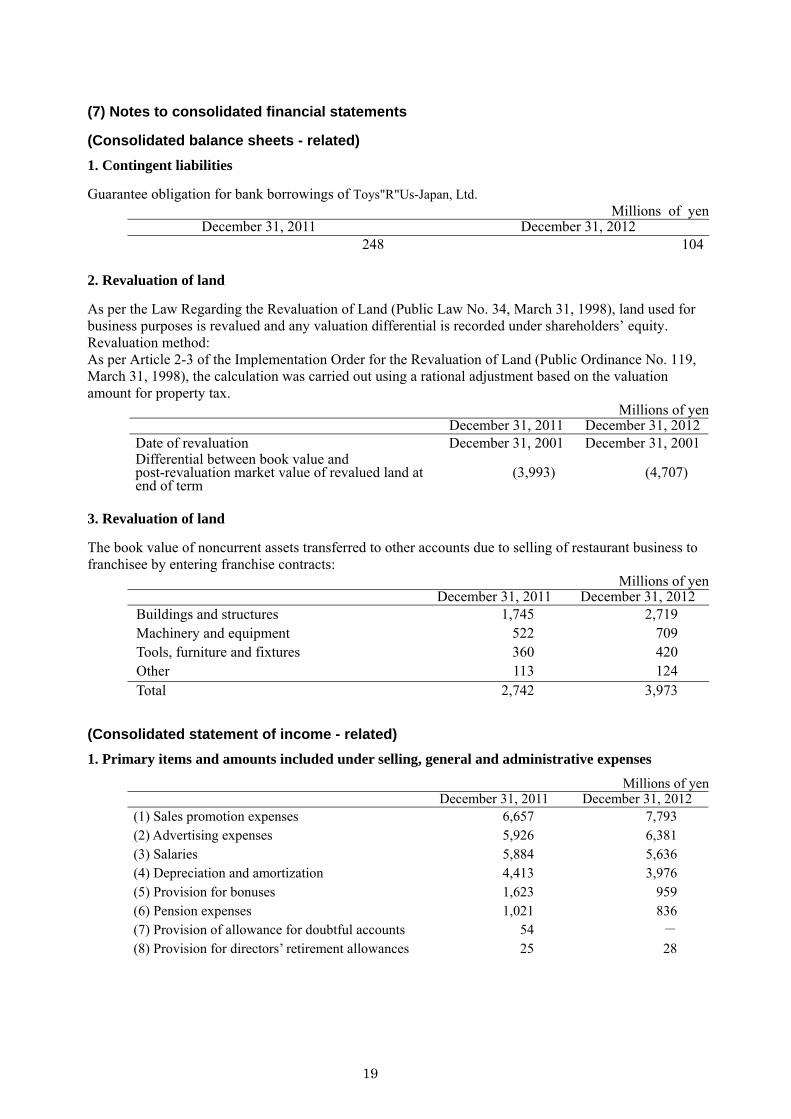
(7) Notes to consolidated financial statements
(Consolidated balance sheets - related)
1. Contingent liabilities
Guarantee obligation for bank borrowings of Toys"R"Us-Japan, Ltd. Millions of yen
December 31, 2011 December 31, 2012 248 104
2. Revaluation of land
As per the Law Regarding the Revaluation of Land (Public Law No. 34, March 31, 1998), land used for business purposes is revalued and any valuation differential is recorded under shareholders’ equity. Revaluation method: As per Article 2-3 of the Implementation Order for the Revaluation of Land (Public Ordinance No. 119, March 31, 1998), the calculation was carried out using a rational adjustment based on the valuation amount for property tax.
Millions of yen December 31, 2011 December 31, 2012
Date of revaluation December 31, 2001 December 31, 2001Differential between book value and post-revaluation market value of revalued land at end of term
(3,993) (4,707)
3. Revaluation of land
The book value of noncurrent assets transferred to other accounts due to selling of restaurant business to franchisee by entering franchise contracts:
Millions of yen December 31, 2011 December 31, 2012
Buildings and structures 1,745 2,719 Machinery and equipment 522 709 Tools, furniture and fixtures 360 420 Other 113 124 Total 2,742 3,973
(Consolidated statement of income - related)
1. Primary items and amounts included under selling, general and administrative expenses
Millions of yen December 31, 2011 December 31, 2012
(1) Sales promotion expenses 6,657 7,793 (2) Advertising expenses 5,926 6,381 (3) Salaries 5,884 5,636 (4) Depreciation and amortization 4,413 3,976 (5) Provision for bonuses 1,623 959 (6) Pension expenses 1,021 836 (7) Provision of allowance for doubtful accounts 54 - (8) Provision for directors’ retirement allowances 25 28
20
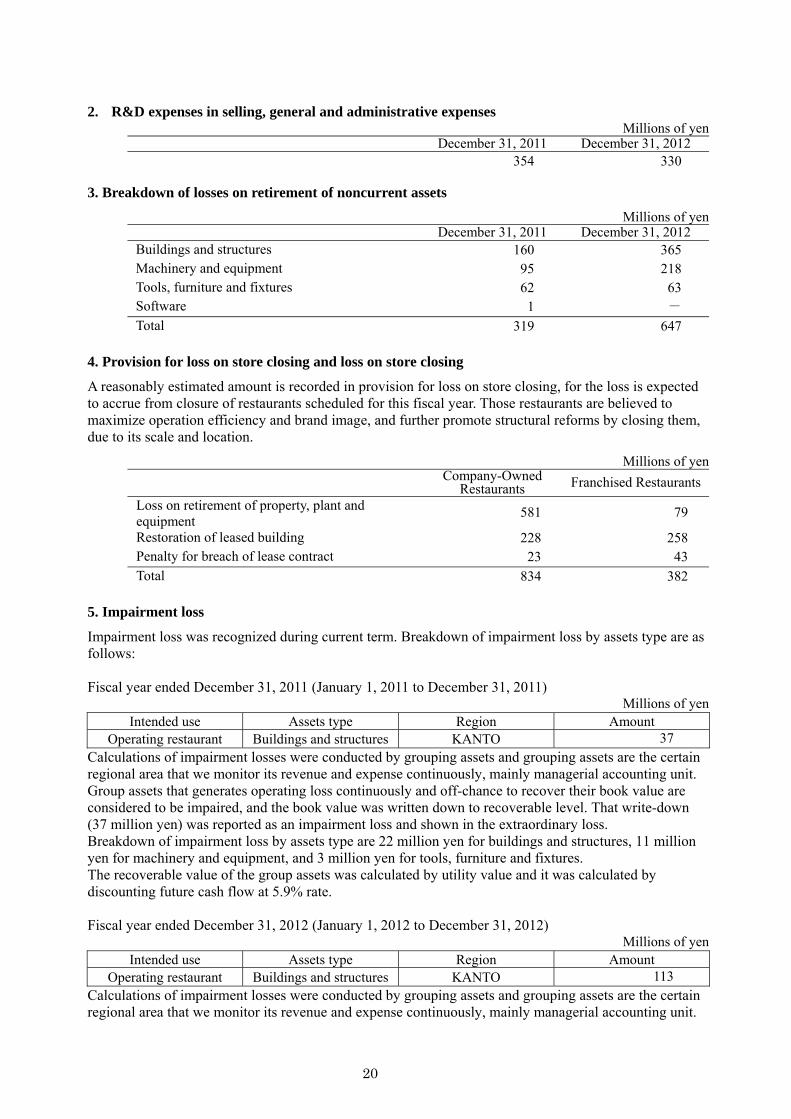
2. R&D expenses in selling, general and administrative expenses Millions of yen
December 31, 2011 December 31, 2012 354 330
3. Breakdown of losses on retirement of noncurrent assets
Millions of yen December 31, 2011 December 31, 2012
Buildings and structures 160 365 Machinery and equipment 95 218 Tools, furniture and fixtures 62 63 Software 1 - Total 319 647
4. Provision for loss on store closing and loss on store closing
A reasonably estimated amount is recorded in provision for loss on store closing, for the loss is expected to accrue from closure of restaurants scheduled for this fiscal year. Those restaurants are believed to maximize operation efficiency and brand image, and further promote structural reforms by closing them, due to its scale and location.
Millions of yen
Company-Owned Restaurants Franchised Restaurants
Loss on retirement of property, plant and equipment
581 79
Restoration of leased building 228 258 Penalty for breach of lease contract 23 43 Total 834 382
5. Impairment loss
Impairment loss was recognized during current term. Breakdown of impairment loss by assets type are as follows: Fiscal year ended December 31, 2011 (January 1, 2011 to December 31, 2011)
Millions of yen Intended use Assets type Region Amount
Operating restaurant Buildings and structures KANTO 37 Calculations of impairment losses were conducted by grouping assets and grouping assets are the certain regional area that we monitor its revenue and expense continuously, mainly managerial accounting unit. Group assets that generates operating loss continuously and off-chance to recover their book value are considered to be impaired, and the book value was written down to recoverable level. That write-down (37 million yen) was reported as an impairment loss and shown in the extraordinary loss. Breakdown of impairment loss by assets type are 22 million yen for buildings and structures, 11 million yen for machinery and equipment, and 3 million yen for tools, furniture and fixtures. The recoverable value of the group assets was calculated by utility value and it was calculated by discounting future cash flow at 5.9% rate. Fiscal year ended December 31, 2012 (January 1, 2012 to December 31, 2012)
Millions of yen Intended use Assets type Region Amount
Operating restaurant Buildings and structures KANTO 113 Calculations of impairment losses were conducted by grouping assets and grouping assets are the certain regional area that we monitor its revenue and expense continuously, mainly managerial accounting unit.
21
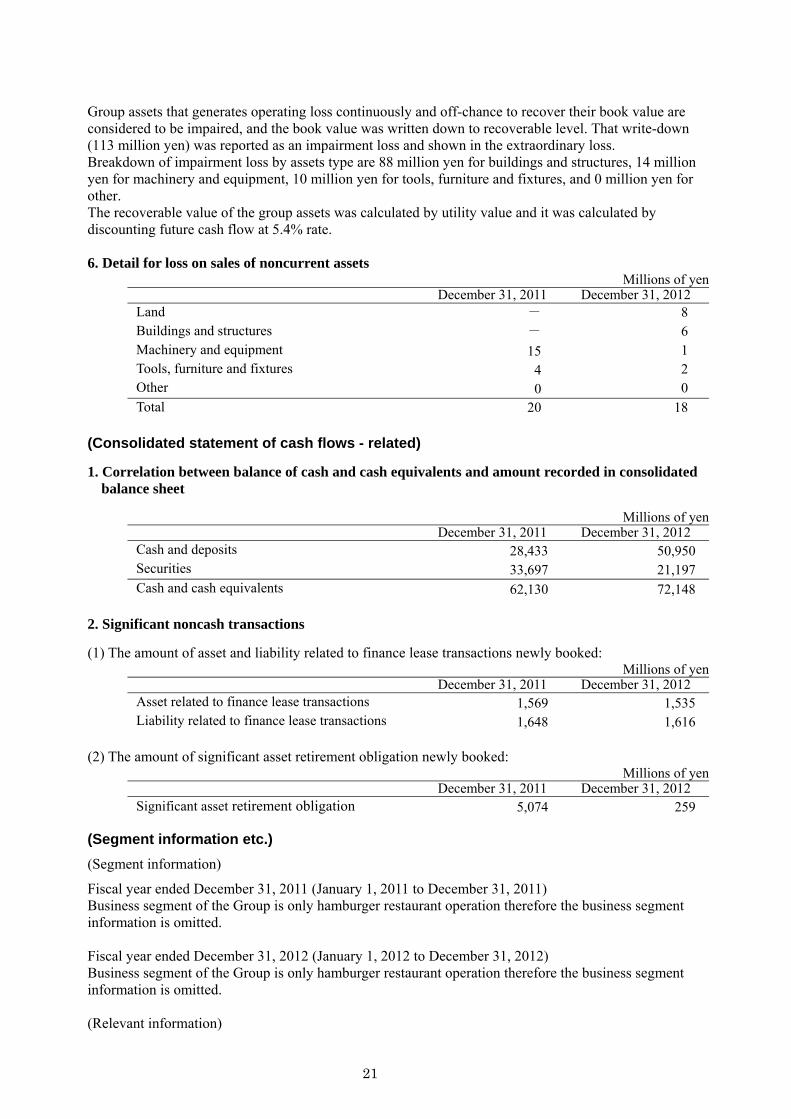
Group assets that generates operating loss continuously and off-chance to recover their book value are considered to be impaired, and the book value was written down to recoverable level. That write-down (113 million yen) was reported as an impairment loss and shown in the extraordinary loss. Breakdown of impairment loss by assets type are 88 million yen for buildings and structures, 14 million yen for machinery and equipment, 10 million yen for tools, furniture and fixtures, and 0 million yen for other. The recoverable value of the group assets was calculated by utility value and it was calculated by discounting future cash flow at 5.4% rate. 6. Detail for loss on sales of noncurrent assets
Millions of yen December 31, 2011 December 31, 2012
Land - 8 Buildings and structures - 6 Machinery and equipment 15 1 Tools, furniture and fixtures 4 2 Other 0 0 Total 20 18
(Consolidated statement of cash flows - related)
1. Correlation between balance of cash and cash equivalents and amount recorded in consolidated balance sheet
Millions of yen December 31, 2011 December 31, 2012
Cash and deposits 28,433 50,950 Securities 33,697 21,197 Cash and cash equivalents 62,130 72,148
2. Significant noncash transactions
(1) The amount of asset and liability related to finance lease transactions newly booked: Millions of yen
December 31, 2011 December 31, 2012 Asset related to finance lease transactions 1,569 1,535 Liability related to finance lease transactions 1,648 1,616
(2) The amount of significant asset retirement obligation newly booked:
Millions of yen December 31, 2011 December 31, 2012
Significant asset retirement obligation 5,074 259
(Segment information etc.)
(Segment information)
Fiscal year ended December 31, 2011 (January 1, 2011 to December 31, 2011) Business segment of the Group is only hamburger restaurant operation therefore the business segment information is omitted. Fiscal year ended December 31, 2012 (January 1, 2012 to December 31, 2012) Business segment of the Group is only hamburger restaurant operation therefore the business segment information is omitted. (Relevant information)
22
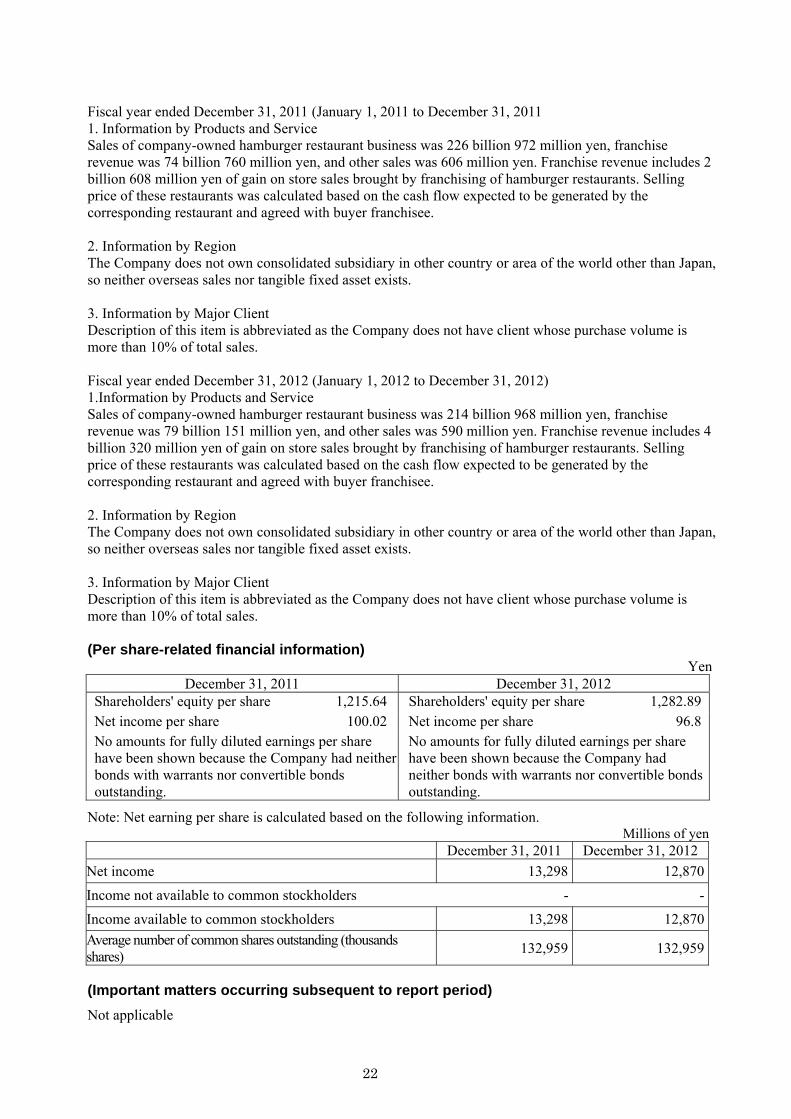
Fiscal year ended December 31, 2011 (January 1, 2011 to December 31, 2011 1. Information by Products and Service Sales of company-owned hamburger restaurant business was 226 billion 972 million yen, franchise revenue was 74 billion 760 million yen, and other sales was 606 million yen. Franchise revenue includes 2 billion 608 million yen of gain on store sales brought by franchising of hamburger restaurants. Selling price of these restaurants was calculated based on the cash flow expected to be generated by the corresponding restaurant and agreed with buyer franchisee. 2. Information by Region The Company does not own consolidated subsidiary in other country or area of the world other than Japan, so neither overseas sales nor tangible fixed asset exists. 3. Information by Major Client Description of this item is abbreviated as the Company does not have client whose purchase volume is more than 10% of total sales. Fiscal year ended December 31, 2012 (January 1, 2012 to December 31, 2012) 1.Information by Products and Service Sales of company-owned hamburger restaurant business was 214 billion 968 million yen, franchise revenue was 79 billion 151 million yen, and other sales was 590 million yen. Franchise revenue includes 4 billion 320 million yen of gain on store sales brought by franchising of hamburger restaurants. Selling price of these restaurants was calculated based on the cash flow expected to be generated by the corresponding restaurant and agreed with buyer franchisee. 2. Information by Region The Company does not own consolidated subsidiary in other country or area of the world other than Japan, so neither overseas sales nor tangible fixed asset exists. 3. Information by Major Client Description of this item is abbreviated as the Company does not have client whose purchase volume is more than 10% of total sales. (Per share-related financial information)
Yen December 31, 2011 December 31, 2012
Shareholders' equity per share 1,215.64 Shareholders' equity per share 1,282.89Net income per share 100.02 Net income per share 96.8No amounts for fully diluted earnings per share have been shown because the Company had neither bonds with warrants nor convertible bonds outstanding.
No amounts for fully diluted earnings per share have been shown because the Company had neither bonds with warrants nor convertible bonds outstanding.
Note: Net earning per share is calculated based on the following information. Millions of yen
December 31, 2011 December 31, 2012
Net income 13,298 12,870
Income not available to common stockholders - -
Income available to common stockholders 13,298 12,870
Average number of common shares outstanding (thousands shares)
132,959 132,959
(Important matters occurring subsequent to report period)
Not applicable
23
4. Other (1) Changes in the board of directors It will be disclosed when the information is fixed.