translation services and other meeting …svswa.org/wp-content/uploads/bd_2015_02_02_english.pdf ·...
TRANSCRIPT

Page 1 of 2 Board of Directors February 2, 2015 - Special
A G E N D A Special Meeting
BOARD OF DIRECTORS Monday, February 2, 2015, 8:30 a.m.
128 Sun Street, Suite 102, Salinas, CA 93901
CALL TO ORDER TRANSLATION SERVICES AND OTHER MEETING ANNOUNCEMENTS PLEDGE OF ALLEGIANCE ROLL CALL Board Directors Alternate Directors County: Fernando L. Armenta County: John Phillips County: Simon Salinas, Alternate Vice President Salinas: Joseph D. Gunter Salinas: Gloria De La Rosa Gonzales: Scott Funk Salinas: Jyl Lutes, Vice President Soledad: Christopher K. Bourke Salinas: Tony R. Barrera Greenfield: Raul C. Rodriguez Gonzales: Elizabeth Silva, President King City: Darlene Acosta Soledad: Richard J. Perez Greenfield: Avelina Torres King City: Robert S. Cullen PUBLIC COMMENT Receive public comment from audience on items which are not on the agenda. The public may comment on scheduled agenda items as the Board considers them. Speakers are limited to three minutes at the discretion of the Chair. CLOSED SESSION Receive public comment from audience before entering into closed session: 1. Pursuant to Government Code Section 54956.8 to confer with legal counsel and real property
negotiators General Manager/CAO Patrick Mathews, Diversion Manager Susan Warner, and Legal Counsel Tom Bruen, concerning the possible terms and conditions of acquisition, lease, exchange or sale of 1) Salinas Valley Solid Waste Authority Property, APNs 003-051-086 and 003-051-087, located at 135-139 Sun Street, Salinas, CA; and, 2) Waste Management, Inc. property located at 1120 Madison Lane, Salinas CA
RECONVENE 2. STRATEGIC PLANNING WORKSHOP • Review of Strengths and Accomplishments since the July 31, 2014 Retreat • Discuss Key Questions and Develop Six-month Objectives for 3-Year Goal B (2013-16):
Goal B. Complete Development of Salinas Valley Area Station/Materials Recovery Center a. Presentation by Global Organics Energy, Clean Fiber Recovery System
(autoclave and organics to electricity) • Review/Discuss Proposed Six-month Objectives for the following 3-Year Goals (2013-16):
Goal A. Develop a Three-year Finance Plan to Fund 75% Diversion Goal C. Develop a Use Plan for Jolon Road/Crazy Horse/Lewis Road Landfills Goal D. Increase Public Involvement/Engagement Goal E. Develop Johnson Canyon Landfill Operations Plan (Post Recology)
• Consider/Discuss Proposed Six-month Objectives for Proposed New 3-Year Goal (2013-16): Goal F. Promote and Maintain a High Performance, Efficient, and Flexible Workforce

Page 2 of 2 Board of Directors February 2, 2015 - Special
ADJOURNMENT This agenda was posted at the Administration Office of the Salinas Valley Solid Waste Authority, 128 Sun Street, Suite 101, Salinas, and on the Gonzales Council Chambers Bulletin Board, 117 Fourth Street, Gonzales, Friday, January 30, 2015. The Salinas Valley Solid Waste Authority Board will next meet in regular session on Thursday, February 19, 2015. Staff reports for the Authority Board meetings are available for review at: 4Salinas Valley Solid Waste Authority: 128 Sun Street, Ste. 101, Salinas, CA 93901, Phone 831-775-3000 4Web Site: www.salinasvalleyrecycles.org 4Public Library Branches in Gonzales, Prunedale and Soledad 4 City Halls of Salinas, Gonzales, Greenfield, King City & Soledad. In compliance with the Americans with Disabilities Act, if you need special assistance to participate in the meeting, please contact Elia Zavala, Clerk of the Board at 831-775-3000. Notification 48 hours prior to the meeting will enable the Authority to make reasonable arrangements to ensure accessibility to this meeting (28 CFR 35.102-35.104 ADA Title II). Spanish interpretation will be provided at the meeting. Se proporcionará interpretación a Español.

SALINAS VALLEY SOLID WASTE AUTHORITY
STRATEGIC PLANNING RETREAT
Monday February 2, 2015 —128 Sun Street, Suite 102, Salinas, CA
8: 00 Continental Breakfast
8: 30 Welcome, Purpose of the Retreat and Introduction of the Facilitator and RecorderLiz Silva, Board President
Public Comment, Closed Session, Reconvene, Report Out,
Role of the Facilitator, Recorder, Group and Public; Strategic Planning Elements; Agenda — Marilyn Snider, Facilitator — Snider and Associates
Introductions of the Group
Salinas Valley Solid Waste Authority: Mission/Purpose Statement
Vision Statement
Core Values /Guiding PrinciplesThree -Year Goals (2013 -2016)
What Are the Strengths and the Accomplishments of the SVSWA since the July 31, 2014 StrategicPlanning Retreat?
Select Six -Month Strategic Objectives Proposed by Staff for Four of the Five Three -Year Goals2013 -2016) ( how the goals will be addressed - by when, who will be accountable for what specific,
measurable results)
Goal B: COMPLETE DEVELOPMENT OF SALINAS VALLEY AREA STATION/ MATERIALS RECOVERY CENTER
Presentation by Global Organics Energy, Clean Fiber Recover System
autoclave and organics to electricity)
Discuss Key QuestionsBOARD: By Consensus, Identify Six -Month Strategic Objectives for the GoalBased on the Key Questions
Goal A: DEVELOP A THREE -YEAR FINANCE PLAN TO FUND 75% DIVERSION
Review/Discuss the Proposed Objectives
BOARD: By Consensus, Affirm or Revise ( including additions), if Needed, the ProposedObjectives
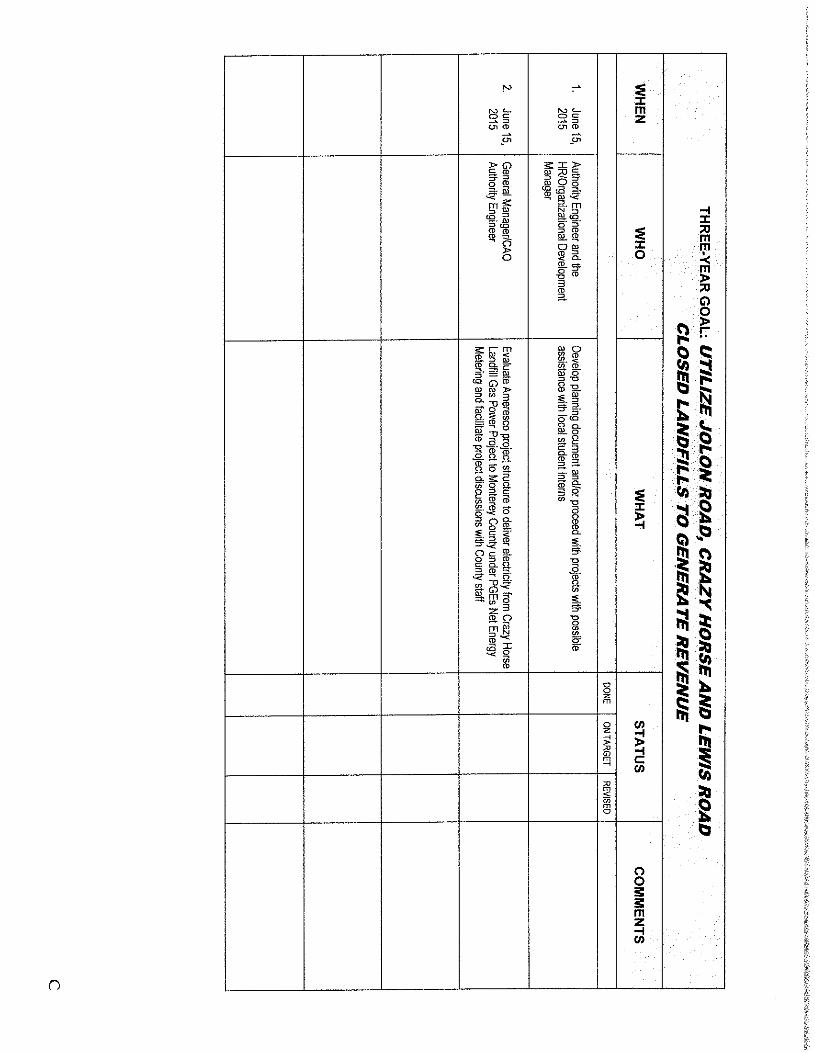
Goal C: DEVELOP A USE PLAN FOR JOLON ROAD /CRAZY HOURSE/LEWIS ROAD
LANDFILLS
Review/Discuss the Proposed Objectives
BOARD: By Consensus, Affirm or Revise ( including additions), if Needed, the ProposedObjectives
Goal D: INCREASE PUBLIC INVOLVEMENT/ENGAGEMENT
Review/Discuss the Proposed Objectives
BOARD: By Consensus, Affirm or Revise ( including additions), if Needed, the ProposedObjectives

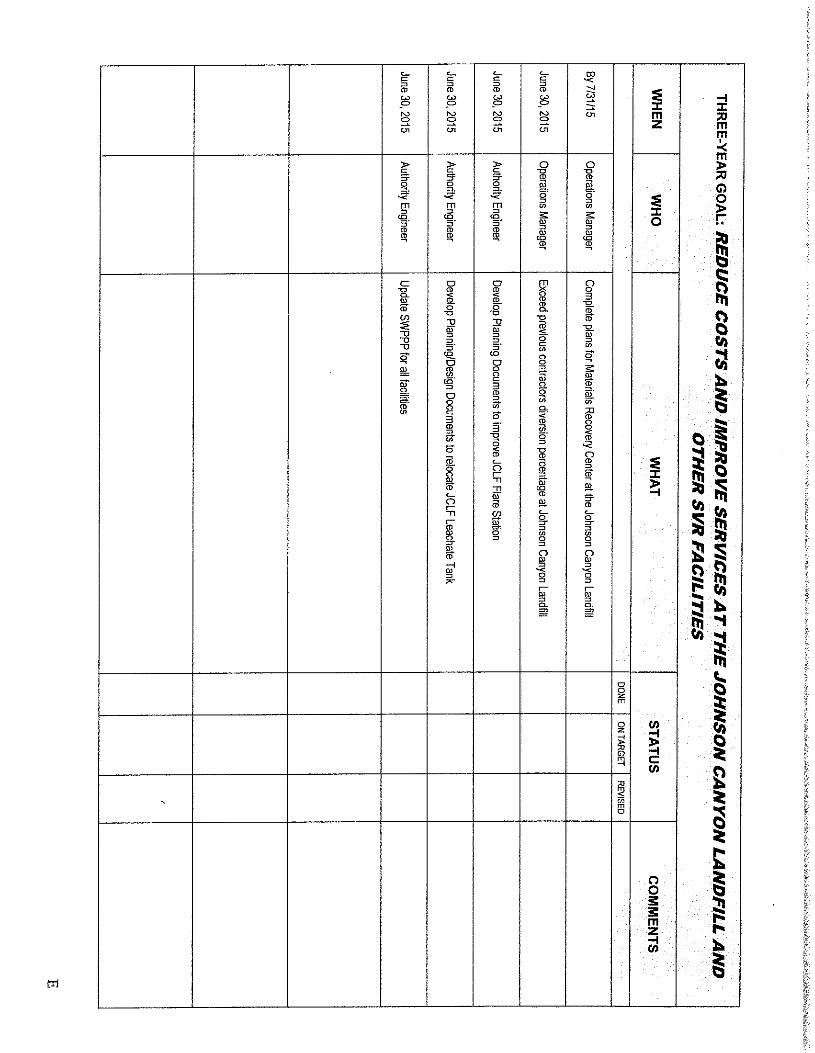
Goal E: DEVELOP JOHNSON CANYON LANDFILL OPERATIONS PLAN (POSTRECOLOGY
Review/Discuss the Proposed Objectives
BOARD: By Consensus, Affirm or Revise (including additions), if Needed theProposed Objectives
Proposed NEW Goal F: PROMOTE AND MAINTAIN A HIGH PERFORMANCE, EFFICIENT, AND FLEXIBLE WORKFORCE
Review/Discuss the Proposed Six -Month Strategic Objectives:
Board Reviews and Determines, by Consensus, Whether or Not to Add the SixthGoal and Strategic Objectives to the SVSWA Strategic Plan (2013 -16)
Next Steps /Follow -Up Process ( including setting a date in 6 months to update the strategic plan)
Summary of the Retreat
Closing Remarks
1: 30 Adjourn
Please come for informal conversation and continental breakfast at 8: 00. The meeting will beginpromptly at 8: 30 a. m. Lunch will be provided during the retreat. Please limit use of cell/smartphones, tablets and laptops to the breaks.
PLEASE BRING YOUR CALENDAR.

0
COT fn a 07-
m Q OpQ
O< m
o O O
I
y
OD, r: m 2 v m o a f
N Go N = - o. 0n Zf
Ecan, c
O
d O
O C"' n0 A;
N U d n
Oar a
wo
O
o
CP EF
SfD O d
O O c =
e
0
a oy O;
X x oz
0ca
a
yy
tiaX X i,lll
o
ry n Sapp
O- j3 A O O
U C o - IZF d N k(00O p N O C
B m cn oE;
p 0 G N N
coG , D
@10z
N
A
O Dc m
m
w
w 01
C4 .
N Cf
N C
L
N
D
r
Z
D
V/
C
D
r
r
m
N
O
r
0
r
D
m
D
c
S
O
C

Ul
p C G T O Op L
N C L
MM mp_m' msmd 6N - N- N * 0 y N
n a
N N O ID O N 0 9i N C m
p p
G 0 N 0N
s s
N N ( gyp d N No p
N
a a N NtU fD Z N
a
3 3 o .
d d c
o m o
y Od lC
N p
J Nm
M
3
CA
y
X
0
Ca yO
co
op+ mn:Pmomw mnn a m o o p < o m e
N s. ryryry ddNj 0
rya3p
A A n
Li g °c' a) 7f
p N
m tiJ
d N dd N ANN
O
O
m m L a nn ry 2
00.0 d dmEll mod 3
moo n 3 rn
yo r c iET- d 5 D
N
y
m
N
yX X
a' y
m
mo
OO Kp< m d D m> g,,
Hp Ned
gyp N ( D tD N d O = D 4l ? U
omoo a• r N8 oa S -
6 N• 0_ 3 A a O` x p. d
ON O Z

0
WnQ
ee
EF
Er
6
dam
x 2 \
2§
f

A
o o o o m
mm. ox ox ox oxmy ox
o a o a o m: =... a OO p
fD="^
nyD q n 0 m x G] o m..
p v,
a823 83 a
3 NOp
N O
C d z
Q d C 9 C3r
tit y_' y d N O n D y
2s gd dC ,
dm m
ET
N Q Oii1i.:.
N d
dN N O
0N
XO
m
m yo I
E3Rs. ma d. 2O
Xa
a0 dat
a 3 na f a INO d D
Oa > D t0 N
oin 1a
2 f] T Sr N

m
IN
m
madam
42 r §
2. k\ 2
Ei(!

E
A
Q
C / w
XN
N CZ
s =
O N
m
w 1)
N no
CwWC.
m
co
w
D
r
Z
a
C
a
r
r
m
N
O
r
0
Da
rn
a
c
x
O
M
mmrn
d aui z
0 0C)
DOr
mR m m
N
OaWiN
3 y == o= O
RL
03a 0
b
2
m
a00 w 9o r
n o
ox
n
V
a
o
y ti Pq
y
zy
y
mi C
y
mo
311o3 b
rZ ry y
A
Q
C / w
XN
N CZ
s =
O N
m
w 1)
N no
CwW
C.
m
co
w
D
r
Z
a
C
a
r
r
m
N
O
r
0
Da
rn
a
c
x
O
M

M
k
e; z 0m
0 0k;
OR
Oft N
m
0
zt
k
2
2f2
4dl
s
2 «:
f2
k B
k
U)
m
2
E
000 \
23» -

9
Ra
t k
y
k<
Ci
Cl)
mc© am
X
w<4
q0
ej
IS
In 4
A
O
a 2 .

a.
2
l
2
1
n
W\
lb
ok
bw
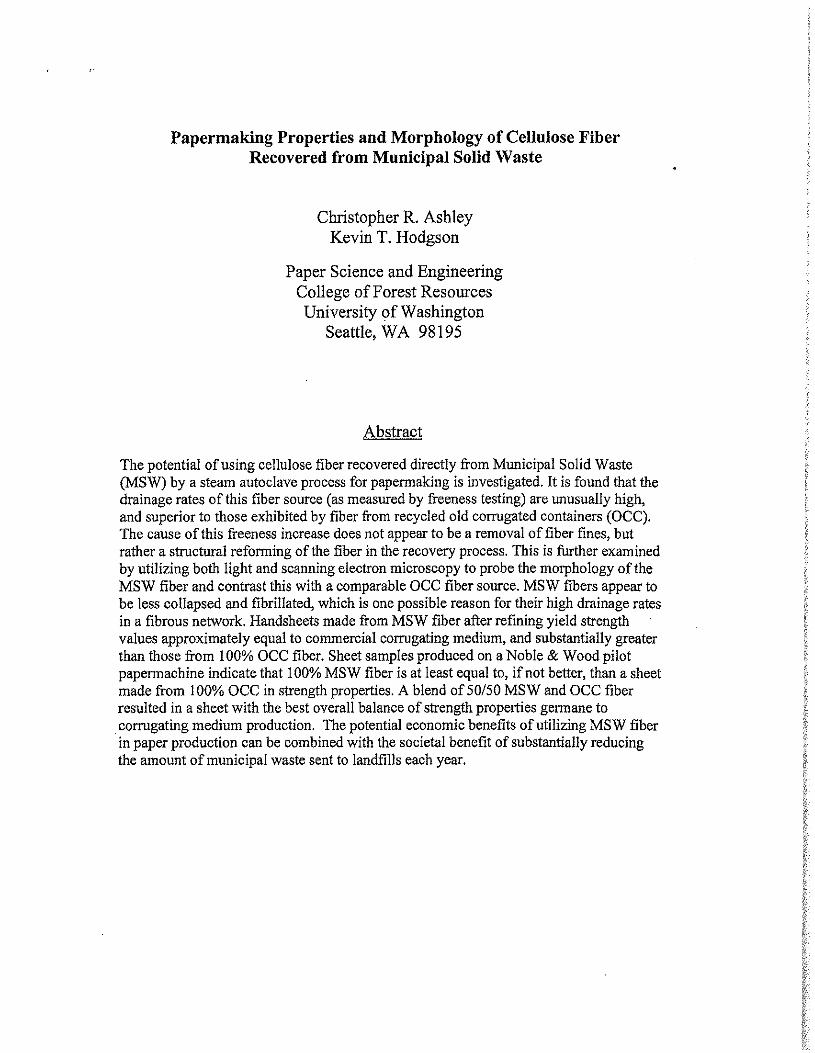
Papermaking Properties and Morphology of Cellulose FiberRecovered from Municipal Solid Waste
Christopher R. AshleyKevin T. Hodgson
Paper Science and EngineeringCollege of Forest Resources
University of WashingtonSeattle, WA 98195
Abstract
The potential of using cellulose fiber recovered directly from Municipal Solid WasteMSW) by a steam autoclave process for papermaking is investigated. It is found that the
drainage rates of this fiber source ( as measured by freeness testing) are unusually high, and superior to those exhibited by fiber from recycled old corrugated containers (OCC). The cause of this freeness increase does not appear to be a removal of fiber fines, but
rather a structural reforming of the fiber in the recovery process. This is further examinedby utilizing both light and scanning electron microscopy to probe the morphology of theMSW fiber and contrast this with a comparable OCC fiber source. MSW fibers appear to
be less collapsed and fibrillated, which is one possible reason for their high drainage rates
in a fibrous network. Handsheets made from MSW fiber after refining yield strengthvalues approximately equal to commercial corrugating medium, and substantially greaterthan those from 100% OCC fiber. Sheet samples produced on a Noble & Wood pilotpapermachine indicate that 100% MSW fiber is at least equal to, if not better, than a sheet
made from 100% OCC in strength properties. A blend of 50/ 50 MSW and OCC fiber
resulted in a sheet with the best overall balance of strength properties germane to
corrugating medium production. The potential economic benefits of utilizing MSW fiberin paper production can be combined with the societal benefit of substantially reducingthe amount of municipal waste sent to landfills each year.

Introduction
As of 1996, an estimated 70% of all municipal solid waste (MSW) generated in
the United States was sent to landfills, which amounts to approximately 209 million tonsofwaste per year ( 1). As a direct result of this situation, landfill space is continuallybeing depleted. Highly populated areas, such as metropolitan New York City and LosAngeles, regularly need to ship their waste to other parts ofthe US, and have gone so faras to ship MSW to other countries due to a lack of landfill space. As the populationcontinues to increase, so will the amount of generated waste. Simultaneously, the amount
of space available for landfilling continues to decrease. The growing enormity of thisproblem is all too obvious.
Despite the technological revolution in information transfer that has taken place inrecent times, the use ofpaper and paper - related products is still an enormous part of our
everyday lives. In areas where there is no separation of waste material, as much as 50% of the MSW sent to landfills is composed ofpaper products. If this fiber was insteadreclaimed and processed such that it had market value in the form of a raw material for
papermaking operations, this would present a huge opportunity for reduction in wastebound for landfills. One potential process for the recovery ofpapermaking - quality fiberfrom MSW is the " steam autoclave process" developed by Comprehensive Resources, Recovery, andReuse ( 2). This process is capable of reducing the mass of solid waste sentto landfills by approximately 2/ 3. In addition to recovery of papermaking fiber, the steamautoclave process also offers the potential to produce a " biogas" mixture ofmethane and
CO2 via anaerobic digestion of the waste liquor (3). Preliminary tests performed on cellulose fiber produced by this process ( by an
equipment manufacturer (4)) yielded results that showed striking differences in somephysical properties compared to other comparable forms of recycled fibers, such as oldcorrugated containers (OCC). For example, the water drainage rate of this fiber (as
measured by the Canadian Standard Freeness method) was found to be significantlyhigher than that of OCC. In an attempt to both corroborate and expand on these previousfindings, the present research was designed to explore the fiber characteristics ofMSW
fiber produced by the steam autoclaving process, to compare these characteristics to thoseof a typical recycled OCC sample, and to explore the MSW fiber' s physical properties
under papermaking conditions. Underlying this goal was the question ofwhy MSW fiberhad a consistently higher freeness value than a representative OCC sample.
In order to pursue this objective and to investigate the freeness question, acombination of techniques was employed to ascertain as much information about the
fiber as possible. These included pulp properties, handsheet testing, and pilotpapermachine runs. Various forms of microscopy were employed to specificallyinvestigate the morphological characteristics ofMSW fiber.
Methods and Materials
Canadian Standard Freeness ( CSF) was measured for unrefined samples ofboth
OCC and MSW following TAPPI standard methods ( 5). In order to determine the " fines" fraction of each sample, both OCC and MSW were passed through a Bauer -McNett fiber
classifier (screens of 26, 48, 100 and 200 mesh) following TAPPI standard procedures
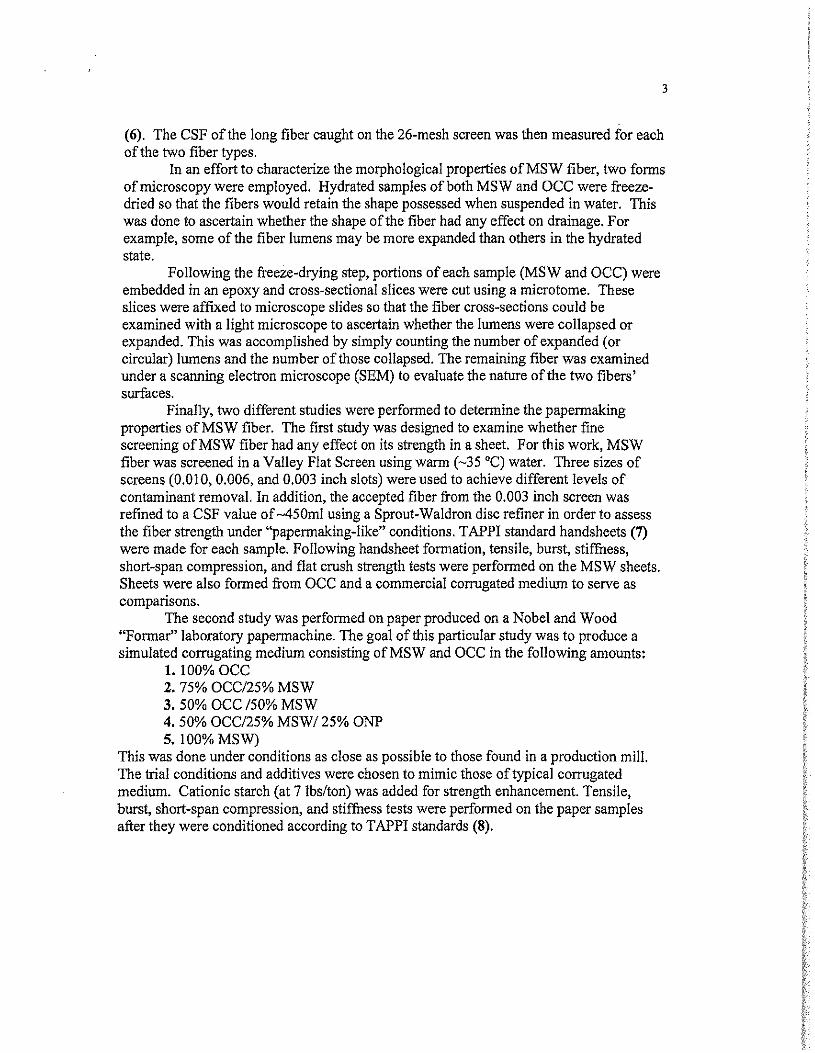
6). The CSF of the long fiber caught on the 26 -mesh screen was then measured for eachof the two fiber types.
In an effort to characterize the morphological properties of MSW fiber, two forms
of microscopy were employed. Hydrated samples of both MSW and OCC were freeze - dried so that the fibers would retain the shape possessed when suspended in water. This
was done to ascertain whether the shape of the fiber had any effect on drainage. Forexample, some of the fiber lumens may be more expanded than others in the hydratedstate.
Following the freeze - drying step, portions of each sample (MSW and OCC) wereembedded in an epoxy and cross- sectional slices were cut using a microtome. Theseslices were affixed to microscope slides so that the fiber cross - sections could be
examined with a light microscope to ascertain whether the lumens were collapsed or
expanded. This was accomplished by simply counting the number of expanded ( orcircular) lumens and the number of those collapsed. The remaining fiber was examinedunder a scanning electron microscope (SEM) to evaluate the nature of the two fibers' surfaces.
Finally, two different studies were performed to determine the papermakingproperties of MSW fiber. The first study was designed to examine whether finescreening of MSW fiber had any effect on its strength in a sheet. For this work, MSWfiber was screened in a Valley Flat Screen using warm ( -35 ° C) water. Three sizes ofscreens ( 0.010, 0.006, and 0.003 inch slots) were used to achieve different levels of
contaminant removal. In addition, the accepted fiber from the 0.003 inch screen was
refined to a CSF value of -450ml using a Sprout - Waldron disc refiner in order to assessthe fiber strength under " papermaking- like" conditions. TAPPI standard handsheets ( 7) were made for each sample. Following handsheet formation, tensile, burst, stiffness, short-span compression, and flat crush strength tests were performed on the MSW sheets. Sheets were also formed from OCC and a commercial corrugated medium to serve as
comparisons.
The second study was performed on paper produced on a Nobel and WoodFormar" laboratory papermachine. The goal of this particular study was to produce a
simulated corrugating medium consisting of MSW and OCC in the following amounts: 1. 100% OCC
2. 75% OCC /25% MSW
3. 50% OCC 150% MSW
4. 50% OCC /25% MSW/ 25% ONP
5. 100% MSW)
This was done under conditions as close as possible to those found in a production mill. The trial conditions and additives were chosen to mimic those of typical corrugated
medium. Cationic starch ( at 7 lbs /ton) was added for strength enhancement. Tensile,
burst, short -span compression, and stiffness tests were performed on the paper samples
after they were conditioned according to TAPPI standards ( 8).
Results and Discussion
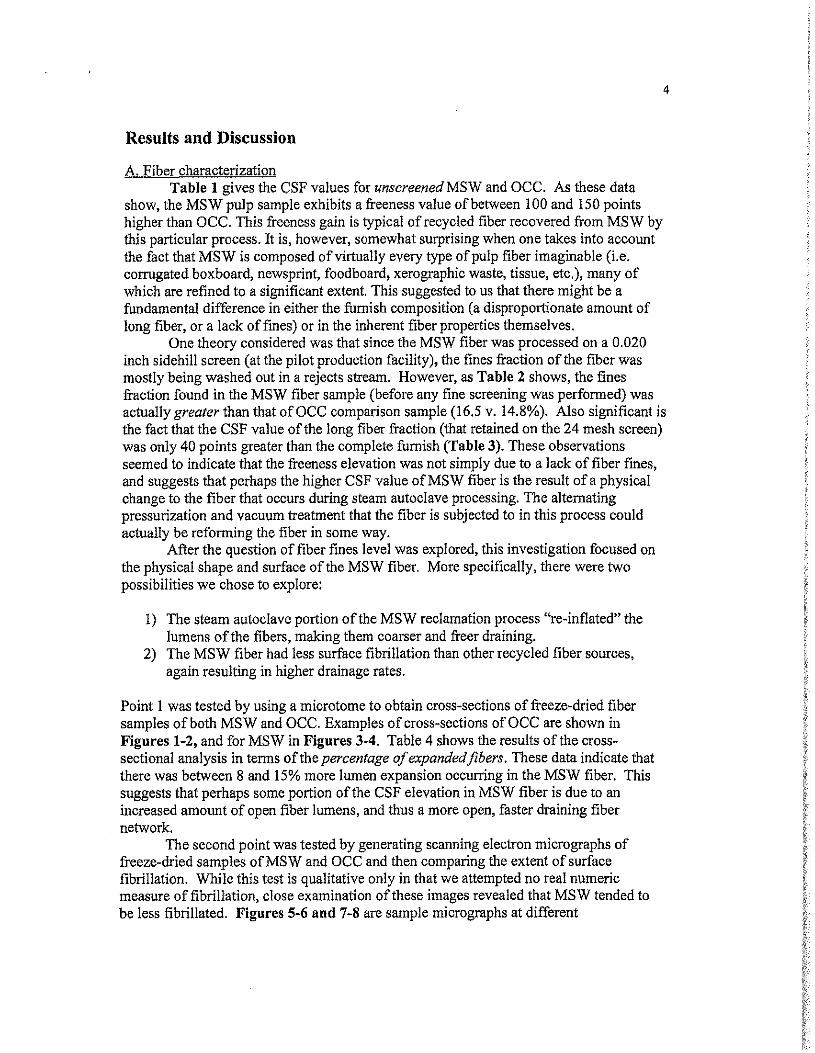
A. Fiber characterization
Table 1 gives the CSF values for unscreened MSW and OCC. As these data
show, the MSW pulp sample exhibits a freeness value of between 100 and 150 pointshigher than OCC. This freeness gain is typical of recycled fiber recovered from MSW bythis particular process. It is, however, somewhat surprising when one takes into accountthe fact that MSW is composed ofvirtually every type of pulp fiber imaginable ( i. e. corrugated boxboard, newsprint, foodboard, xerographic waste, tissue, etc.), many ofwhich are refined to a significant extent. This suggested to us that there might be a
fundamental difference in either the famish composition (a disproportionate amount of
long fiber, or a lack of fines) or in the inherent fiber properties themselves. One theory considered was that since the MSW fiber was processed on a 0.020
inch sidehill screen ( at the pilot production facility), the fines fraction of the fiber wasmostly being washed out in a rejects stream. However, as Table 2 shows, the finesfraction found in the MSW fiber sample (before any fine screening was performed) wasactually greater than that of OCC comparison sample ( 16. 5 v. 14. 8 %). Also significant is
the fact that the CSF value of the long fiber fraction (that retained on the 24 mesh screen) was only 40 points greater than the complete furnish (Table 3). These observationsseemed to indicate that the freeness elevation was not simply due to a lack of fiber fines, and suggests that perhaps the higher CSF value of MSW fiber is the result of a physical
change to the fiber that occurs during steam autoclave processing. The alternatingpressurization and vacuum treatment that the fiber is subjected to in this process could
actually be reforming the fiber in some way. After the question of fiber fines level was explored, this investigation focused on
the physical shape and surface of the MSW fiber. More specifically, there were twopossibilities we chose to explore:
1) The steam autoclave portion of the MSW reclamation process " re- inflated" the
lumens ofthe fibers, making them coarser and freer draining. 2) The MSW fiber had less surface fibrillation than other recycled fiber sources,
again resulting in higher drainage rates.
Point I was tested by using a microtome to obtain cross - sections of freeze -dried fibersamples of both MSW and OCC. Examples of cross - sections of OCC are shown inFigures 1 -2, and for MSW in Figures 34. Table 4 shows the results of the cross -
sectional analysis in terms of the percentage ofexpandedfibers. These data indicate thatthere was between 8 and 15% more lumen expansion occurring in the MSW fiber. Thissuggests that perhaps some portion of the CSF elevation in MSW fiber is due to an
increased amount of open fiber lumens, and thus a more open, faster draining fibernetwork.
The second point was tested by generating scanning electron micrographs offreeze -dried samples ofMSW and OCC and then comparing the extent of surfacefibrillation. While this test is qualitative only in that we attempted no real numericmeasure of fibrillation, close examination of these images revealed that MSW tended to
be less fibrillated. Figures 5 -6 and 7 -8 are sample micrographs at different

magnifications showing the relative fibrillation ofboth OCC and MSW samples, respectively. It is well known that fiber fibrillation caused by refining is a major cause ofthe reduction in drainage rate of the pulp ( i. e. freeness). While not dramatic, it doesappear that the extent of fiber fibrillation for MSW is somewhat less pronounced. This
may also account for some of the elevated CSF exhibited by MSW fiber.
B. Sheet properties
1. Handsheet testingSince an overall objective of this research was to determine whether or not MSW
fiber could be successfully substituted for OCC in the production of corrugating medium, it was relevant to measure the physical strength properties of sheets composed of various
levels of MSW. Table 5 shows the results of the strength study performed withhandsheets of corrugated medium, OCC and various forms of MSW fiber. Three different
forms of MSW fiber were used in making handsheets: 1) Screened: 0.010" slots
2) Fine screened: 0.006" slots
3) Ultra -fine screened; 0.003" slots + refiningBoth TAPPI standard ( 60 g/m2) and medium weight ( 140 g /m2) basis weight sheets wereevaluated. Physical strength tests germane to corrugating medium were performed onthese various handsheets.
As the data in Table 5 show, screening seemed to have no real effect on thestrength of the MSW sheets. When compared to the medium sample, screened but
unrefined MSW handsheets were weaker in all strength tests. However, after refining to475 ml, MSW sheets were within 20% of medium strength in tensile and burst, roughlyequal in fiat crush and short span compression, and significantly better in Gurleystiffness.
Compared to the OCC sample available to us, MSW sheets were stronger, even
without refining (refining improved these values even further). It is surprising that theMSW sheets were close in strength to a commercial medium sample, which would likelycontain starch and possibly other strength additives. Overall, handsheets made fromrefined 100% MSW fiber compared reasonably well in strength to either medium orOCC. This result was encouraging for consideration of a pilot papermachine trial whereMSW and OCC could be blended together. It seemed entirely possible that acceptablestrength properties could be obtained from a blend ofbetween 25 and 50% MSW fiber
with OCC.
2. Pilot papermachine trial
Strength data for paper made on the Noble & Wood laboratory papermachine areshown in Table 6, where CD designates the cross - machine direction and MD the machine
direction. For selected sheet furnish compositions, data are also shown in graphically inFigures 9 -11. Again, conditions were selected to mimic those of a 125 gsm sheet, the
most prevalent basis weight of corrugating medium grades. Wet end starch was added at7 lbs. /ton as a dry strength aid. Both OCC and MSW were refined slightly for this trial, tovalues of 570 and 600 ml, respectively. It should be noted that these strength values arenot representative of the actual strength that would be attained on a full sized,
commercial papermachine. This is primarily because the Noble and Wood papermachineused for this study does not have a true wet pressing section, thus limiting wet
compaction and sheet density. However, we can compare the data against a sheet madefrom OCC pulp under the identical conditions. While the actual sheet basis weight variedsomewhat from the target of 125 gsm, all of the strength tests except for tensile energyabsorption (TEA) are indices normalized for basis weight. In one trial, we incorporated
deinked old newsprint (ONP) at a 25% level along with MSW and OCC. Overall, a comparison for sheets of 100% OCC vs. 100% MSW reveals that the
MSW sheet is equal to OCC in burst strength, and somewhat better in tensile, TEA, andSSC ( Table 6 and Figures 9, 10). The sheet composed of 50% MSW and 50% OCC
appears to yield the most favorable strength properties overall. The data in Table 6 showthat this 50150 blend of fiber had greater test values in MD tensile and both CD/MD SSCindex than either source in its pure state. This 50150 OCC/MSW blend produced superior
strength properties than the other 3 blends listed in Table 6, and would be a reasonable
fiber mixture for a commercial corrugating medium mill to use. In addition to the encouraging strength properties shown by MSW fiber
incorporated into a simulated corrugating medium sheet, it should be noted that theseproperties were achieved without extensive refining. The MSW stock was refined to aCSF of — 600mi, and the OCC to — 570 ml. Typically, OCC is refined to a CSF level ofbetween 400 -500 ml for use in either medium or linerboard. This suggests that if the
strength values achieved in this study are acceptable, some energy savings in the form ofreduced refining would be realized by using MSW fiber. On the other hand, an increasein sheet strength could be produced by further refining ofMSW fiber without anexcessively detrimental effect on sheet drainage.
Conclusions
Cellulose fiber reclaimed from municipal solid waste by the steam autoclave processdeveloped by Comprehensive Resources appears to have unusually high freenessproperties, even though the heterogeneity offiber types present should be enormous. Thisfreeness increase does not appear to be simply the result of fines removal by fiberfractionation. Examination ofMSW fiber by both light and scanning electron microscopyindicates that fibers tend to be both less collapsed and fibrillated than a comparablesample ofrecycled OCC fiber. This results in a coarser fiber that produces a freer
draining network, which is evidenced by the higher freeness values measured. It isspeculated that the alternating pressure and vacuum treatment cycles of the steamautoclave could be reforming fiber into this state. Further work using laboratorysimulation of the autoclave vessel is planned to firmly establish the existence of thisapparently beneficial effect. Regardless of its origin, higher freeness values of recycledfiber used for either corrugating medium or linerboard production are certainly desirablefrom an economic and performance standpoint.
Handsheet and pilot papermachine experiments revealed that MSW fiber compares veryfavorably with either commercial corrugating medium or OCC in terms ofbasic strengthproperties germane to medium. A 50150 blend ofMSW and OCC used on a Noble and
Wood For-mar pilot papermachine produced a favorable combination of strength
properties, and superior to a sheet made from 100% OCC. The use of MSW fiber in paper
and board products where it adds value will facilitate the adoption ofprocesses such as

those developed by Comprehensive Resources which offer the potential of significantreductions in waste being sent to landfills.
Acknowledgements
The authors appreciate the assistance of Comprehensive Resources, Recovery, and Reuseand the Weyerhaeuser Technology Center in carrying out this study. In particular, wewould like to thank Joseph Anderson and David Bozzi of CR3, and Ron Zarges of WTC.
References
1. Environmental Protection Agency; www.epa. ova /msw; 1996.
2. Anderson, Joseph; Apparatus, System and Method For Treating Process MaterialSuch As Waste Material; United States Patent; # 5655718; 1997.
3. Glass, C. and D, Bozzi, `Biogas Production from Anaerobic Digestion ofProcessedMunicipal Solid Waste ", Proceedings 32 "d Mid - Atlantic Industrial and Hazard WasteConference, p. 422 -431. J. Kilduff, S. Komisar, and M. Nyman, ed. June 26 -28, 2000.
4. Canon, John; Thermo Black Clawson, Inc.; Personal report to Mr. Joseph Anderson; September 22, 1997.
5. TAPPI; T227 om -94; TAPPI Testing Methods; TAPPI Press; 1999,
6. TAPPI; T233 cm -95; TAPPI Testing Methods; TAPPI Press; 1999.
7. TAPPI; T205 sp -95; TAPPI Testing Methods; TAPPI Press; 1999,
8. TAPPI; T402 om -93, T403 om -97, T494 om -96; TAPPI Testing Methods; TAPPIPress; 1999.
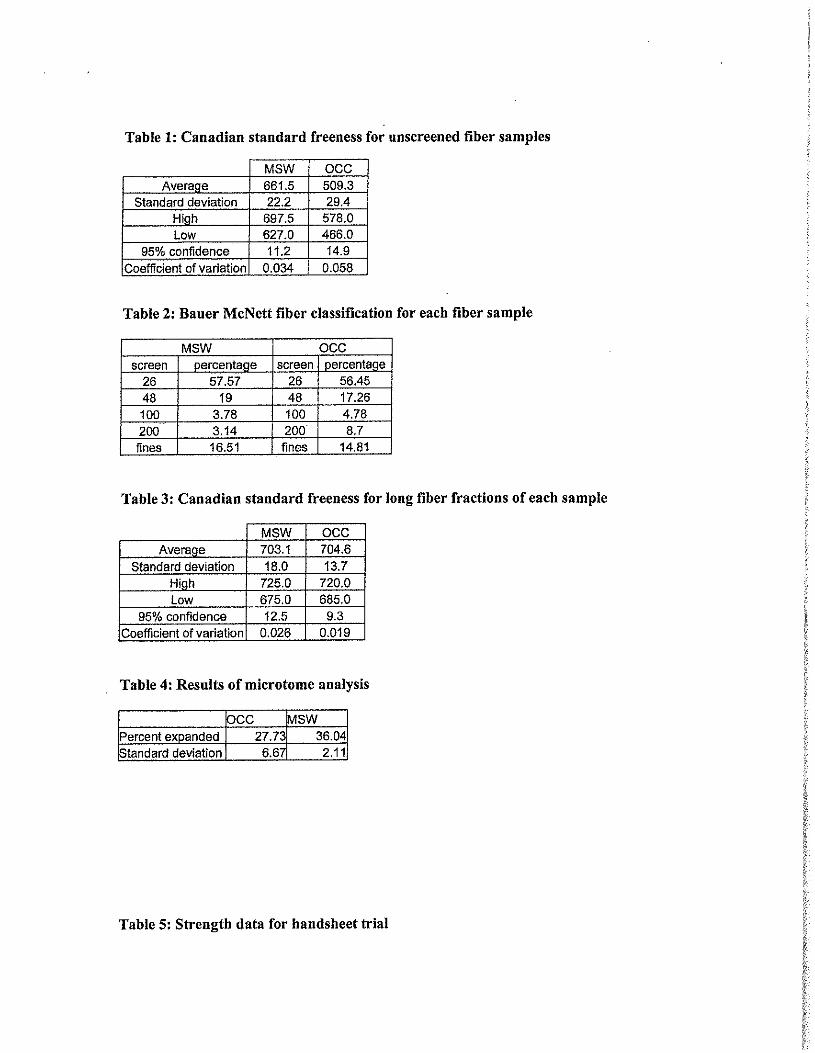
Table 1: Canadian standard freeness for unscreened fiber samples
Table 2: Bauer McNett fiber classification for each fiber sample
MSW
MSW OCC
Average 661. 5 509. 3
Standard deviation 22. 2 29.4
High 697.5 578. 0
Low 627.0 466.0
95% confidence 11. 2 14.9
Coefficient of variation 0.034 0. 058
Table 2: Bauer McNett fiber classification for each fiber sample
MSW OCC
screen percentage screen ercenta e
26 57. 57 26 56.45
48 19 48 17.26
100 3. 78 100 4.78
200 3. 14 200 8. 7
fines 16. 51 fines 14. 81
Table 3: Canadian standard freeness for long fiber fractions of each sample
Table 4: Results of microtome analysis
I
MSW OCC
Average 703. 1 704.6
Standard deviation 18.0 13. 7
High 725. 0 720. 0
Low 675. 0 665. 0
95% confidence 12.5 9. 3
Coefficient of variation 0.026 0.019
Table 4: Results of microtome analysis
I CC Msw
Percent expanded 1 27.73 36.04
tandard deviation 1 6. 671 2,11
Table 5: Strength data for handsheet trial

Basis
Weight Sample ID Tensile IndexNm/
Burst IndexkPa *m2!
Stiffness
Gurley m
Flat Crush
psi)
Short SpanCompression kN/ m)
CSF
ml
1. 2
g /m2)
Corrugated
medium 38. 92 2. 79 108.23 17.20 1. 26 500
SSC index
10 -cut 12. 89 1. 87 63. 27 15.67 0. 97 720
64. 80
6-cut 11. 94 1. 43 77.48 16. 80 1. 02 700
64. 20
3- cut + refined 31. 47 2.31 142.75 16.40 1. 31 475
66. 01 30. 00 27. 50 11. 04 16. 96
75% OCC / 25%
MSW + starch 117. 51 1. 56
2. 8 OCC 4.98 0.55 406.53 25. 67 0.96 500g/ m2)
10 -cue 15. 04 1. 05 690. 38 13.00 2.43 720
158. 45
6 -cut 20.01 1. 39 1727. 16 13.00 2.78 700
3- cut + refined 35. 27 2.34 100. 46 15.90 1. 04 450
Table 6: Strength data for papermachine trial
Figure 1: Micotomed fiber cross - section for OCC
Basis Burst CD MD CD MD CD MD
SAMPLE NAME: Weight Index Ten. Index Ten. Index TEA TEA SSC index BBC Index
100% OCC 148.96 1. 77 40.28 75.86 48.30 64. 80 8.77 14.50
100% MSW 130.01 1. 80 50.00 84.61 64. 20 86.80 9.97 16.88
75 % OCC / 25%
MSW 116. 66 1. 24 30.86 66. 01 30. 00 27. 50 11. 04 16. 96
75% OCC / 25%
MSW + starch 117. 51 1. 56 40.00 82. 55 40,90 36.60 8.58 13.96
MSW 119. 08 1. 78 46.19 104.13 52. 20 56. 60 11. 00 17.80
50 %OCC / 25% MSW125 %ONP 158. 45 1. 15 1 33,45 1 73, 84 1 32. 50 34. 60 7. 39 13.30
Figure 1: Micotomed fiber cross - section for OCC

Figure !__ fiber cross- section for « c
Figure 3: Microtomed fiber cross- section for m*
4,
4a, Z
Figure 3: Microtomed fiber cross- section for m*

Figure 4: Microtomed fiber cross - section for MSW
Figure 5: Electron- micrograph of OCC fiber

I
Z:
z

Figure 8: Electron - micrograph of MSW fiber
Figure 9: Comparison of the burst index values for the given fiber composition

100% OCC 100% WSW 50% OCC / 50% M9N
Fiber composition
Figure 10: Comparison of the short - span compression index values for the given fiber composition
120A0
to
m CD tensle index
i t t Zi • -
O CD TEA
m 80• 00 OMDTEA
m
x 60. 00
mvc40. 00
1 S
100% OCC 100% WSW 50% OCC / 50% M9N
Fiber composition
Figure 10: Comparison of the short - span compression index values for the given fiber composition
120A0
m CD tensle index
100,00 MDtensle index
O CD TEA
m 80• 00 OMDTEA
m
x 60. 00
mvc40. 00
9 t0
M
100% OCC 100% MSN 50% OCC/ 50% MSN
Fiber composition
Figure 11: Comparison of the tensile index and TEA values for the given fiber composition
Solution'. iuntain
The: race tr i other"
SALINAS VALLEY SOLID WASTE AUTHORITY
An Economic Impact Analysis Of CONSTRUCTING AND OPERATING AN AUTOCLAVE
THIS PROJECT IS SUPPORTED IN PART BY
THE CALIFORNIA ASSOCIATION FOR LOCAL ECONOMIC DEVELOPMENT
Vre
N'
Prepared by: Solution Mountain, Inc.
A CALED Technology PartnerDecember2011

Solution MountainThe Place to See Tether"
Table of Contents
General Project Description ......................................................................................... ............................... 3
Definitionsand Methods .............................................................................................. ............................... 3
ExecutiveSummary ..................................................................................................... ............................... 5
IndustrySectors ........................................................................................................... ............................... 6
Summary of Economic Impacts ................................................................................... ............................... 6
Ongoing Economic Impacts — 5 Years ........................................................................ ............................... 6
AboutSolution Mountain, Inc: .............. .......... ................. ...................................... ................................ 7
Economic Impact Report — CONSTRUCTING AND OPERATING AN AUTOCLAVE ........................ ............................... 8

Solution IMountainTns ?lac, to See Fa: i ,,r"
General Project Description
The following economic impact analysis has been prepared on behalf of Salinas Valley Solid WasteAuthority (SVSWA). The SVSWA Board has been investigating alternatives to landfill disposal of solidwaste. The goal, reaffirmed in August 2010, is to achieve 75% diversion from landfills.
This study seeks to understand the economic impacts for constructing a waste autoclave. A wasteautoclave is a form of solid waste treatment that utilizes heat, steam and pressure of an industrialautoclave in the processing of waste. Waste autoclaves process waste either in batches or incontinuous -flow processes. In batch processes, saturated steam is pumped into the autoclave at
temperatures around 160 °C. The pressure in the vessel is maintained at 5 bar gauge for a period of upto 45 minutes to allow the process to fully' cook' the waste. The autoclave process gives a very highpathogen and virus kill rate.
Modern autoclaves, also referred to as converters, can operate in the atmospheric pressure range to
achieve full sterilization of pathogenic waste. Super heating conditions and steam generation areachieved by variable pressure control, which cycles between ambient and negative pressure within thesterilization vessel. The advantage of this new approach is the elimination of complexities and dangers
associated with operating pressure vessels.
Definitions and Methods
The Economic Impact Analysis Report ( attached below) is based on data sets that are specific to
Monterey County market area. The typical analysis is either supported by data that is specific to the
project or one that is based on historical datasets that are related to the project' s market and industrysectors. This report uses historical datasets provided by IMPLAN2. The report represents a broaderview than simply the Project' s direct expenditures or employment. For example the analysis measures
the economic " footprint" as project dollars multiply inside and outside of the market area and itincludes calculations for both direct and indirect impacts.
The results of this report are not gathered from project- specific information but from datasets that arehistorically- representative of the economic impacts.
Reference Wikipedia. htto: / /en.wikipedia.or wiki /Waste autoclave
2 The data sets used in this report are provided by Minnesota IMPLAN Group, Inc ( MIG, Inc), the developers of the IMPLAN® economic impact modeling system. IMPLANO Is used to create complete, extremely detailed Social Accounting Matrices andmultiplier models of local economies, lmplan enables users to make in -depth examinations of state, multi- county, county orsub - county and metropolitan regional economies. lmplan is used by more than 1, 000 public and private institutions. MIG, Inc. has been developing complex localized databases and serving public and private organizations since 1993.

So I utioni MountainT e Place to Sew Farther"
The Project' s analysis includes six categories:
1. Gross Economic Output: The aggregated market value of goods and services produced bybusinesses and government enterprises in the economy. It is essentially equal to the revenuecollected by businesses ( including indirect taxes) within the County or impact area.
2. Gross County Product: The total of value added created by the production of goods andservices in the economy. It represents the sum of labor compensation, capital type income and
indirect business taxes. Gross County Product is best described as new money added to thecommunity as a result of the project.
3. Total Labor Income: The compensation to employees and self - employed proprietors includingboth wages and indirect payments such as retirement benefits, health insurance and othersimilar fringe benefits.
4. Total Employment: The number of jobs generated within the impact area including full -timeand part-time positions, salaried workers and sole proprietors.
5. Capital Income: The sum of income such as business profits, interest and rental income. Capital Income is best described as non -labor benefits.
6. Indirect Business Tax: Taxes and fees not based in the businesses' income. It may representsales taxes ( if any) levied by the state and county and also property taxes levied againstbusinesses as well as federal, state and local fees.

Solution imountainTie '. r:^ e to Sr•e vrIer•
tixecittive Summary
Gross Economic Output: The economic impact report (attached below) summarizes the benefits of
both the project' s direct investment and the resulting indirect impact. Initial estimates show theproject' s direct investment will be approximately $26.6 million. This number is derived frominformation provided by the SVSWA and also estimates that have been calculated by the analyst. SVSWA provided estimated construction costs and operation and the maintenance expenses for
selected equipment. The budget for operating the plant was calculated using payroll estimatesprovided by SVSWA and IMPLAN datasets. The direct impact number includes the costs associatedwith constructing, operating and maintaining the facility. The value of the direct investment has amultiplier effect as it changes hands. The analysis estimates a direct investment will produce an
additional $ 14.6 million in indirect impacts. The value of the direct and indirect impacts total $41. 2million.
Gross County Product: The gross county product seeks to measure the value -add to the localcommunity. The project' s gross economic impact is estimated at 41.2 million, with an estimated $22.6million of this amount benefiting the local economy. The balance of the impact will typically bedistributed in the surrounding counties, the state and nation.
Labor & Jobs: The analysis seeks to measure labor income and job impacts. The total labor income is
estimated at $ 16. 7 million. The analysis estimates that 360 jobs (full and part -time) will be benefited.
The jobs in this analysis represent both the directjobs as well as jobs that are indirectly impacted as aresult of the project. Approximately 67 jobs are anticipated to be permanently benefited.
Capital Income: Capital Income, including profits, interest and rental income generated from activitiesassociated with this project is estimated to exceed $4. 5 million.
Indirect Business Taxes: This analysis estimates the project will produce $ 1. 3 million in indirect
business taxes.

Solution lmountainTie P! acc to See Farther"
Industry Sectors
This analysis is a study of the industry sectors and geographic area associated with this project. Theresult is a representative analysis with outputs that are based on historical datasets but not necessarilyunique to this development. The following describes the industry categories that are associated withthe Project. The categories are based upon the North American Industry Classification System ( NAICS).
Construct — Autoclave Facilities
Machinery, repair, operation and maintenanceWaste management and remediation services
StimmaryofEeonomic Impacts
The Economic Impact Report (shown below) details the Projects economic impacts. In summary, it isestimated that the project activities will produce the following benefits:
41. 2 million in Gross Economic Output
22.6 million in Gross County Product. 16.7 million in Total Labor Income.
360 total jobs (full and part - time).
4.5 million in Capital income.
1. 3 million in Indirect Business Taxes and Fees.
Ongoing Economic Impacts — 5 Years
This project has the potential to provide both one -time and on -going economic impacts. When theone -time impacts of $33. 1 million are combined with five years of the annually reoccurring impacts
43.2 million) the total is more than $76.4 million.

Saiutionlmountain
The ra; z . 0 5, r,
About Solution Mountain, Inc:
Since 2003, the principals of Solution Mountain, Inc. have prepared hundreds of economic impact
reports for state agencies, cities, counties, economic development districts and private corporations.
Each report is based on IMPLAN datasets specific to the project' s location and unique industry sectors.
Solution Mountain, Inc. is a technology partner for the California Association for Local EconomicDevelopment (CALED). Robert Gilmore, the CEO, is the recipient of the Ford Foundation' s Award for
Innovations in American Government and the Council of State Government' s Award for Innovation.

Solution, Mountain
The Fsce to S,, Farther"
Economic Impact Report — CONSTRUCTING AND OPERATING AN AUTOCLAVE
Salinas Valley Solid Waste AuthorityGross Economic Output
The aggregated market value of goods and services produced by firms and government enterprisesin the County's economy. It is essentially equal to the revenue collected by businesses ( includingindirect taxes) within the County.
Construct — Autoclave Facilities One Time $ 21, 000,000 $ 11, 634, 270 $ 32,634, 270
Machinery, repair, operation and On Going $ 440,000 $ 81, 421 $ 521, 421
maintenance
Waste management and remediation On Going $ 5,200,000 $ 2, 930,624 $ 8, 130, 624
services
Totals: $ 26,640, 000 $ 14,646,316 $ 41, 286,316
Gross County Product
The total value added created by the production of goods and services in the local economy. It Isanalogous to the concept of Gross Domestic Product at the national level. It represents the sum oflabor compensation, capital type income (profits, interests and rents), and indirect business taxes
which are mainly sales taxes, but also include property taxes and government mandated fees).
implatt Ww" Frequamy initial Purchase Total impact
Construct — Autoclave Facilities One Time 21, 000,000 17, 990,034
Machinery, repair, operation and maintenance On Going 440,000 288, 046
Waste management and remediation services On Going 5, 200,000 4, 342,450
Totals: 26,640,000 22,620, 531

Solution imountain
ThePtac t F- v1,1,;-
Total Labor Income
The compensation to employees and self - employed proprietors including both wages and indirectpayments such as retirement benefits, health insurance and other similar fringe benefits.
implan Industry Fnecluenoy Initial Porchaso Thai impactOther new construction One Time $ 21, 000,000 $ 13, 915, 851
Commercial machinery repair and maintenance On Going $ 440,000 $ 187,654
Waste management and remediation services On Going $ 5, 200, 000 $ 2, 656, 921
Totals:' $ 26,640, 000 $ 16, 760,436
Total Employment
The number of jobs generated within the County, and includes: * full -time and part -time positionssalary workers * sole proprietors.
tmplanartdustiy
Implan Industry t ncy InItialipmhase Total
Other new construction One Time 21, 000, 000 293
Commercial machinery repair and maintenance On Going 440, 000 5
Waste management and remediation services On Going 5, 200,000 62'
Totals:
26, 640, 000
26, 640,000 360
Capital Income
The sum of all property type income (such as business profits, interest income and rental income) generated within the County.
tmplanartdustiy I retyuen y l u laas ToW Impact
Other new construction One Time 21, 000,000 3, 175, 669
Commercial machinery repair and maintenance On Going 440,000 76, 094
Waste management and remediation services On Going 5, 200,000 1, 297,371
Totals:' 26, 640, 000 4, 549, 135

Solution Mountatn
91a- P(at n t, ta.: F,,, vi- '
Indirect Business Tax
Are taxes and fees that are not based in the businesses' income, For the most part they representsales taxes levied by the State and the county, but also include property taxes levied againstbusinesses as well as fees imposed by federal, state and local governments,
Other new construction One Time 21, 000,000 898, 310
Commercial machinery repair and maintenance On Going 440,000 24, 294
Waste management and remediation services On Going 5, 200,000 388, 159
Totals: $ 26,640, 000 $ 1, 310, 763

trendspoftingl RECYCLED FIBER
ra r
CAs recovery rates approach theceiling, near - future global fibershortages could develop
KEN PATRICK
With paper recovery rates inNorth America creeping up near 70 per-
cent, Europe approaching 75 percent, andJapan nudging 80 percent, there is growingconcern that the global paper industry maysoon bump against the ceiling ofwhat can berecovered. With recovered fiber demand still
rising, periodic shortfalls could be loomingon the horizon. The U.S., one of the world's
largest exporters of recovered fiber with
nearly half of its annual recovered paperstream ( 40 percent -plus) currently beingexported, and some 70 percent of that going
to one country— China, is especially vulner- able to global fiber dynamics where demand
is growing faster than supply. The theoretical fiber recovery ceiling
differs by country and region, dependingon a series of conditions. In the U.S. there is
general consensus that the ceiling is, on theaverage, around 80 percent, though specific
grades can vary above or below that. Old cor- rugated container (OCC) recovery in the U.S., for example, has already exceeded 90 per- cent, according to some figures. In Japan, with its large urban populations, some see
the overall ceiling at 90 percent -plus, while
the European ceiling is generally believedto be around 85 percent. The limits to paper
recovery are related to quality and col- lection costs.
Concerns about a recovered fiber
shortage are amplified by the fact thatmore than halfof the world' s paper and
board is now being made with recycledfiber. In the U.S., that figure is near
45 percent. At the same time, the growth
rate of global paper recovery has slowed inrecent years as major fiber recovering coun- tries push up nearer their practical limits.
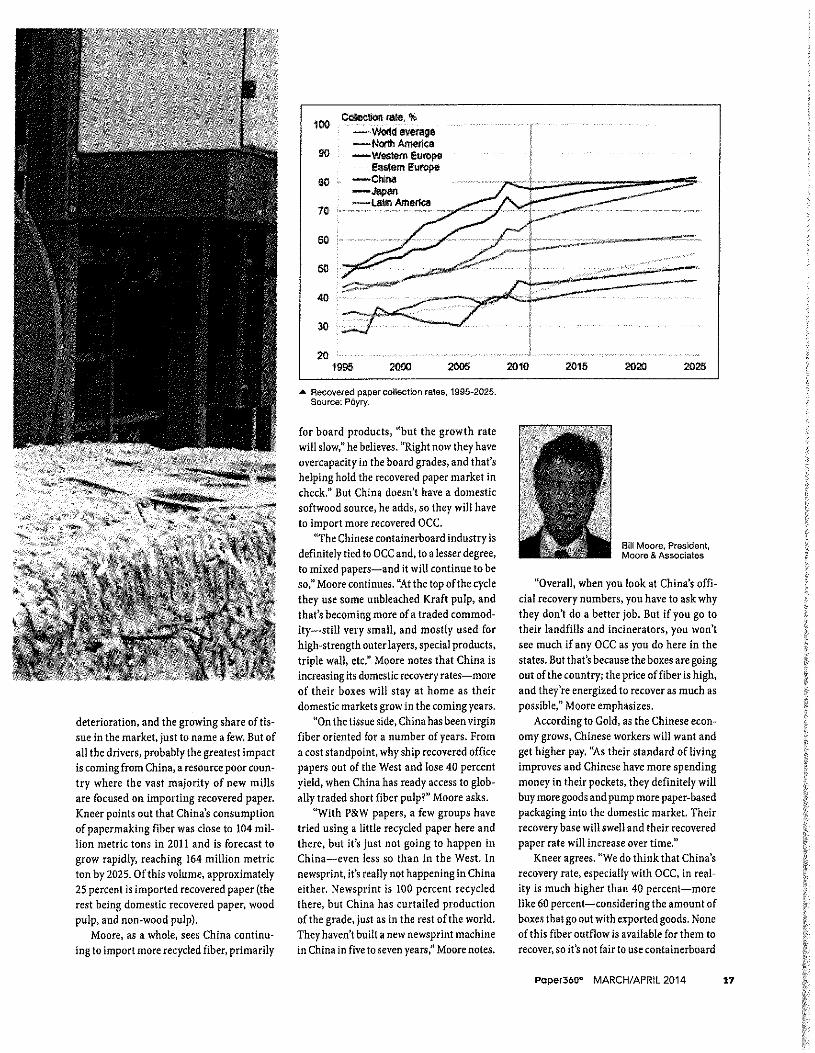
Currently, global paper recovery (accord- ing to Pbyry data) is at 223 million metrictons (collection rate of 56 percent), and by2025 is projected to rise only five or six morepercentage points to 308 million metric tons
61 -62 percent collection rate), reflecting aslowdown in the rate of recovery.
Although these figures all point to a ner-
vous tightening of recovered fiber supply inthe face of increasing demand, the situationis more complex than that. Especially com- plicating the situation is the series of stub- born, off - and -on economic slowdowns that
continue to plague many countries aroundthe world. Also a factor that has to be con-
sidered in the recycling " merry -go- round" is the fact that recycling does wear fiber out. The life span ofpulp fiber is typically about
14 Paper360° MARCH /APRIL2014 www.tappi.org

We haven' t run out offiber yet, but we've
never had these kinds
of recovery levels inthe past.
five recycles, then fines begin to increase
and quality ( drainage, strength, yield, etc.) declines.
To help unravel these complexitiesand get a clearer view of the recycled fiber
dilemma, Paper3600 recently met withthree experts in the recovered fiber arena:
Kathy Kneer, Principal, P6yry ManagementConsulting North America; Bill Moore, President, Moore & Associates; and JohnnyGold, Sr. VP, Recycled Fibers Division,
Newark Recovery and Recycling, part ofNewark Recycled Paperboard Solutions, and
also a member of the Recycled Paperboard
Technical Association (RPTA). Their views
and perspectives are included in the fol-
lowing discussion.
LINGERING ISSUES
t: All three experts agree that currently, at least, there are some recovered
fiber availability issues building. But what's adding some uncer- tainty is the spotty global reces-
s: sion that has dampened demand
and slowed growth in so many
4 regions, including Asia andLatin America," Kneer says.
Right now demand for recycled
r'. fiber is less and the pressure isn' tas great because manufacturing
3 has slowed, consumption is down, etc. But longer term, we think there
will be lingering issues with avail- ability and /or price. Eventually, do
mills in the U.S. just start substitutingvirgin again ?"
Gold emphasizes that "we haven' t run
out of fiber yet, but we've never had these
kinds of recovery levels in the past. Therecovery levels are higher, not necessarilybecause we are recovering that much morefiber, butbecause there is less paper out there
to recover. The recovery percentage has goneup but the amount of tonnage in some casesis actually less. There are certain gradesthat will always be there, such as packagingboards, but printing and writing papers areless and less, for obvious reasons.
I do get a little concerned about the
90 percent -plus recovery ofOCC in the U.S.," Gold continues. " In the future, if you need
more, you might have to mine the landfills
and /or go to non - traditional places. Already,
Poper360° MARCH /APRIL 2014 25

26
A More than half of the world' s paper and board is now being made with recycled fiber.
we' re beginning to see some of that. But idon' t really get all that nervous about itbecause, you know what, we always have
virgin. If recycled becomes more costlythan virgin in a grade sector like contain -
erboard, then producers obviouslywill swing
Kathy Kneer, Principal, Poyry ManagementConsulting NorthAmerica
to virgin, where we currently do have excesscapacity —and globally also. But I don't seethat happening, really.I think the real prob- lem we have is that the quality of recoveredfiber has gone down."
Moore points out that " the U.S. 40 per-
cent recovered fiber export rate has grown
dramatically considering that the countrywas exporting only around 10 percent some25 years ago. We're still using 60 percent ofwhat we recover here in our domestic mills."
THE CHINA FACTOR
There are numerous market drivers behind
the increased collection and use of recov-
ered fiber, but as Kneer explains, three in
particular stand out. First is the seeminglyinsatiable appetite for containerboard
in China, which has led to further capac-
ity expansions in that country. Second isthe continuing environmental push forrecycling, especially in the West, and theincreased emphasis on diverting waste fromlandfill in the public sector, which has helped
corral more recovered paper into the market.
Third is the pronounced and ongoing declineof the graphics paper industry, removingvery high tonnages from the global recyclingstream in recent years.
There are other drivers, of course, such
as legislation, cost of collection, pulp prices, paper demand, transportation, quality
Poper360° MARCH/ APRIL 2014 www.tappi. org
deterioration, and the growing share of tis- sue in the market, just to name a few. But of
all the drivers, probably the greatest impactis coming from China, a resource poor coun- try where the vast majority of new mills
are focused on importing recovered paper. Kneer points out that China's consumption
of papermaking fiber was close to 104 mil- lion metric tons in 2011 and is forecast to
grow rapidly, reaching 164 million metricton by 2025. Of this volume, approximately25 percent is imported recovered paper (the
rest being domestic recovered paper, woodpulp, and non -wood pulp).
Moore, as a whole, sees China continu-
ing to import more recycled fiber, primarily
100rale. %
W^Wottldaverage
North America90 Western Europa
Eastern Europe
00 China
tarn Amerca ,,•,"% 70 c....... . _... _.... ....
som
40
20
1895 2000 2005 2010 2015 2020 2025
Recovered paper collection rates, 1995 -2025.
Source: P6yry.
for board products, " but the growth rate
will slow," he believes. "Right now they haveovercapacity in the board grades, and that' shelping hold the recovered paper market incheck." But China doesn't have a domestic
softwood source, he adds, so they will haveto import more recovered OCC.
The Chinese containerboard industry is
definitely tied to OCC and, to a lesser degree, to mixed papers —and it will continue to be
so;' Moore continues. "At the top of the cyclethey use some unbleached Kraft pulp, and
that's becoming more of a traded commod- ity —still very small, and mostly used forhigh - strength outer layers, special products,
triple wall, etc." Moore notes that China is
increasing its domestic recovery rates —moreof their boxes will stay at home as theirdomestic markets grow in the coming years.
On the tissue side, China has been virgin
fiber oriented for a number of years. From
a cost standpoint, why ship recovered officepapers out of the West and lose 40 percent
yield, when China has ready access to glob- ally traded short fiber pulp ?" Moore asks.
With P & W papers, a few groups have
tried using a little recycled paper here andthere, but it' s just not going to happen inChina —even less so than in the West. In
newsprint, it' s really not happening in Chinaeither. Newsprint is 100 percent recycled
there, but China has curtailed production
of the grade, just as in the rest of the world.
They haven' t built a new newsprint machinein China in five to seven years," Moore notes.
8111 Moore, President,
Moore & Associates
Overall, when you look at China's offi-
cial recovery numbers, you have to ask whythey don' t do a better job. But if you go totheir landfills and incinerators, you won' t
see much if any OCC as you do here in thestates. But that's because the boxes are goingout of the country; the price of fiber is high, and they' re energized to recover as much aspossible," Moore emphasizes.
According to Gold, as the Chinese econ- omy grows, Chinese workers will want and
get higher pay. "As their standard of livingimproves and Chinese have more spendingmoney in their pockets, they definitely willbuy more goods and pump more paper -basedpackaging into the domestic market. Theirrecovery base will swell and their recoveredpaper rate will increase over time."
Kneer agrees. " We do think that China's
recovery rate, especially with OCC, in real- ity is much higher than 40 percent —morelike 60 percent — considering the amount ofboxes that go out with exported goods. None
of this fiber outflow is available for them to
recover, so it's not fair to use containerboard
Poper360" MARCH /APRIL 2014 37

28
trendspoftingi RECYCLED FIBERproduction as the base in determining recov- ery rates. Certainly, they have good recoveryrates in China because they see value in re- use. However, demand in China will continue
to grow and place more stress on the entire
global system."
In regard to the emergence of China' s
domestic markets, Gold sees the possible
development of a new, reverse crisis. "As
China begins to absorb more into its domes-
tic markets, and thus begins to recover more,
they will take less and less from us. As that
happens, we won' t have the paper mills here
to take it all. A surplus situation could build,
tending to drive prices down as well as over-
all recovery rates. In the future, the recycledfiber business in this country could sufferand decline as a result"
QUALITY IN A HAND BASKET
Kneer says that the movement toward sus -
tainability has increased in most regions, andcertainly has increased here in the U. S. " Aslandfill costs have gone up, municipalities
4 a p tin+. x Vd• xkf \ es 4 ` lw1 x̀n, iYl '' 1 m } Y xxV ' x t s +`` k. y'n of }: R 1 S t VU aSix . Ut' t'«
i x; ix ;,, r t w:' ad} x } x, xgrix : x ixrxci4> it 11J kc StV' 1'ix G. o- sy z} u 3 r 1 ! 1 , nt j 1 x i i7. 113 ilyx i„
1 } x
x 1 }} l5
energy
11 J i yii} }tut
pg
Imerys Total Talc Solution — a new and holistic approach
towards contaminant reduction in paper making systems. Placing MISTROW, talc where your system needs it themost. And making the free surface energy work for you.
i }' a IMERYSo-, tvww.imerystalccom
ivv"ifi. , 4
Johnny Gold, Sr. VP, Recycled FibersDivision, Newark
Recovery andRecycling, part ofNewark RecycledPaperboard Solutions
have looked to recycling, mainly imple- menting single stream systems, whichdoes increase contamination levels. This is
becoming a bit of an issue." Gold is especially emphatic about the
continuing decline of recovered paper qual- ity. "Some of the formats we' re recycling innow, such as single stream, are designed to
make collections easier, but they have defi- nitely undermined the quality. Fiber we getout ofmunicipalities todayjust doesn' t meet
the specifications of most mills, with its
high levels ofout - throws and contaminants.
By mixing up so many grades of paper andboard, we' re creating a sorting nightmare.
At Newark, we' ve seen the qualitycollapse first hand," Gold continues. " We
handle quite a bit of residential mixed paper
in our own corporate mills. Once, one of
our mills taking in 550 tons a day of resi- dential mixed paper was removing close to70 tons a day out of the trashing systemsas cans, glass, plastic, etc. We were pay-
ing for that 70 tons, and then paying to getrid of it. OCC isn' t bad, but all of the other
grades are terrible. There' s no doubt that the
quality of today's recycled paper— residen- tial mixed paper —has gone in the toilet,"
Gold concludes.
GOING FORWARD
Moore says that he prefers to look at the
North American fiber situation going for- ward from a grade -by -grade standpoint, and where I think we will be in terms of
balance in fiber, and where it' s all going tocome from. On the tissue side, I think we
have reached the global and U.S. maximum
recycled fiber level, and probably will beginto decline. There's a distinct reason for that —
we're making less P &W papers, and that' s thetraditional source ofrecycled fiber for tissue,
especially away- from -home grades. As the markets have shifted, use of
P & W papers in tissue has become progres-
sively uneconomical," says Moore. " In the
Roper360- MARCH/ APRIL 2014 www.tappi. org

not too distant future, the world's going tobe awash in short fiber virgin pulp, chasingP &W paper demand that' s just not going to bethere. So there' s going to be plenty of bleachedtropical hardwood pulp available for tissue."
On the P & W paper side, Moore says
the penetration has never been more than
10 -15 percent recycled fiber. "The economics
have never favored it. It' s really a specialtything. And I think, going forward, it willremain so, with very moderate recycled fiberrates. Recycled fiber use in P &W papers is
almost uneconomical, but it does occur."
On the newsprint and mechanical papers
both coated and uncoated) side," Moore
continues, " it also has become somewhat
uneconomical to use old newspapers ( ONP).
The cost advantage with these grades todayis clearly to TMP and the other mechanical
pulps. With newsprint, capacity shutdownshave been biased toward recycled because
ONP supply is diminished and also becausethe quality has diminished so much that ithas become uneconomical. What's left of
newsprint is being produced more and morewith virgin fiber. In North America, we have
retreated from a peak ofabout 45 percent recy- cled fiber content to around 35 percent today. And even though the fiber quality is poor, nobody complains because the market' s goodand there's not enough good ONP around.
The recycled boxboard grades are
100 percent recycled fiber content —and
they will continue to be," Moore pointsout. " Recovered fiber is still an economical
furnish to make shoe and cereal box paper-
board and many other unbleached, moderatequality products. That's going to continue. The high end pharmaceutical, cigarette, and
specialty packaging is going to be bleachedvirgin paperboard."
The global containerboard sector is a
massive user of recycled fiber. " Globally," according to Moore, " were probably at55 percent recycled fiber, and in the states
we' re around 40 percent -45 percent. And
that's been stable. We went way up over thepast 30 years and now are at a stability point. Like tissue, I believe we are going to see alittle bit of shift back to virgin fiber in the
states, particularly in the Southeast where
we have good Kraft pulping systems andgrow an abundance of well managed trees.
In the rest of the world, we will start to see
a slower market growth in OCC for contain -
erboard, just because pricing at the top half
of the cycle will become less competitive
with virgin."
Looking again at the ceiling in the U.S., Kneer says that going forward, " in urbanareas, collection rates could rise above
80 percent ( rough average for all grades)
because population density generally leadsto higher collection opportunities, at lower
cost. However, collection opportunities are
lower and are generally higher cost. Although collection rates can increase
above 80 percent forsome grades, other grades
can' t be effectively recovered," says Kneer. Tissue grades and some specialty grades,
such as cigarette paper, or even food wraps
that are contaminated by oil or grease, areexamples ofpapers not available to the collec-
tion stream. Overall, there's probably 20 per- cent that we will never be able to recover. It
depends on what you are using as abase." Q-
Ken Patrick is Editor ofTissue360° magazineand Senior Editor of Paper3600, Contact himat., kpatrick@tappi,org.
Poper360° MARCH /APRIL2014 29